Does Deforestation affect River Flows across the Mekong Basin… Richey Presentation.pdf · Does...
33
Does Deforestation affect River Flows across the Mekong Basin? Jeffrey Richey & Colleague University of Washington SEA-BASINS What Controls Water Flows across the Mekong Basin: (Geology), Climate, Landcover (Change), Engineering,
Transcript of Does Deforestation affect River Flows across the Mekong Basin… Richey Presentation.pdf · Does...
Does Deforestation affect River Flows across the Mekong Basin?
Jeffrey Richey & ColleagueUniversity of Washington
SEA-BASINS
What Controls Water Flows across the Mekong Basin: (Geology), Climate, Landcover (Change), Engineering,

Mine: Evaluate the “Issue” of Mekong Flows- Measured “truth”- Modeling as analytical tool- Details of discharge regime: 1979-2001- Climate influences- Engineering- Landcover change
My friend’s sub-plot: To remind us that the integrated approach used is “more” than “just” hydrology modeling, is imminently transportable to other regions, the sheer act of building such an analysis promotes interdisciplinary cooperation, and there are very useful stakeholder/policy applications..
We have 2 OBJECTIVES:

Mae Chaem Basin, NW Thailand(as proxy for feeder to Mekong)
% croplands 0 19.918.0 19.1
050
100150200250300350400450500550
5/94 10/94 5/95 11/95 5/96 11/96 5/97 11/97 5/98 11/98 5/99 11/99 5/00 11/00
Observed discharge, m3/s
Simulated discharge, m3/sPearson r = 0.70
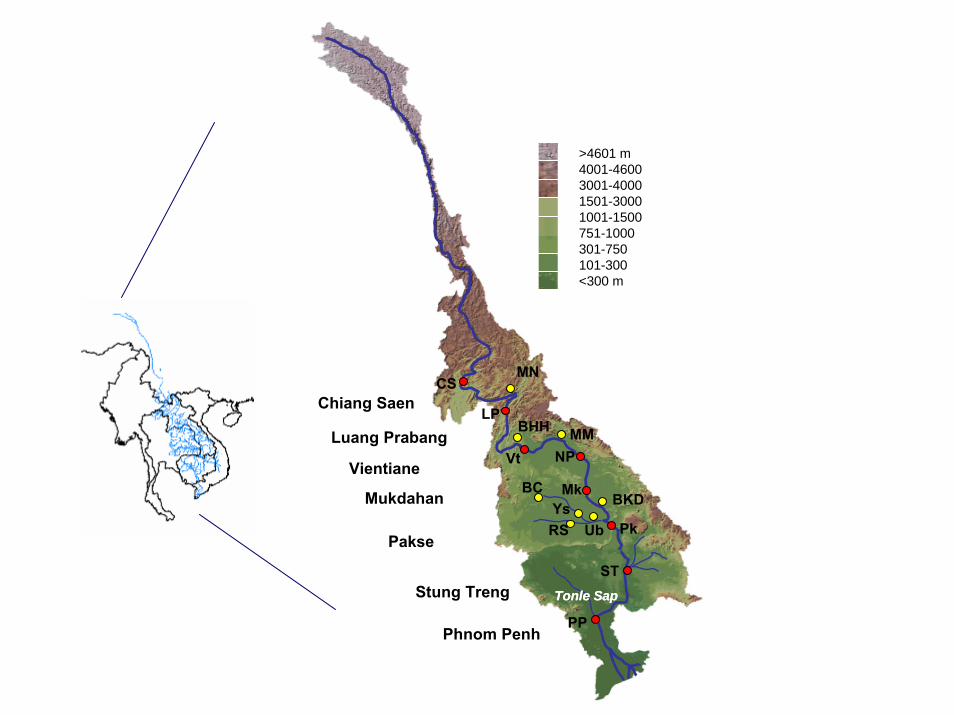
Yunnan
Tonle SapTonle Sap
LP
ST
Mk
Pk
Vt
PP
NP
CS
MM
BKD
BHH
MN
Ub
BCYsRS
Luang Prabang
Chiang Saen
Stung Treng
Mukdahan
Pakse
Vientiane
Phnom Penh
>4601 m4001-46003001-4000 1501-3000 1001-1500 751-1000 301-750 101-300<300 m
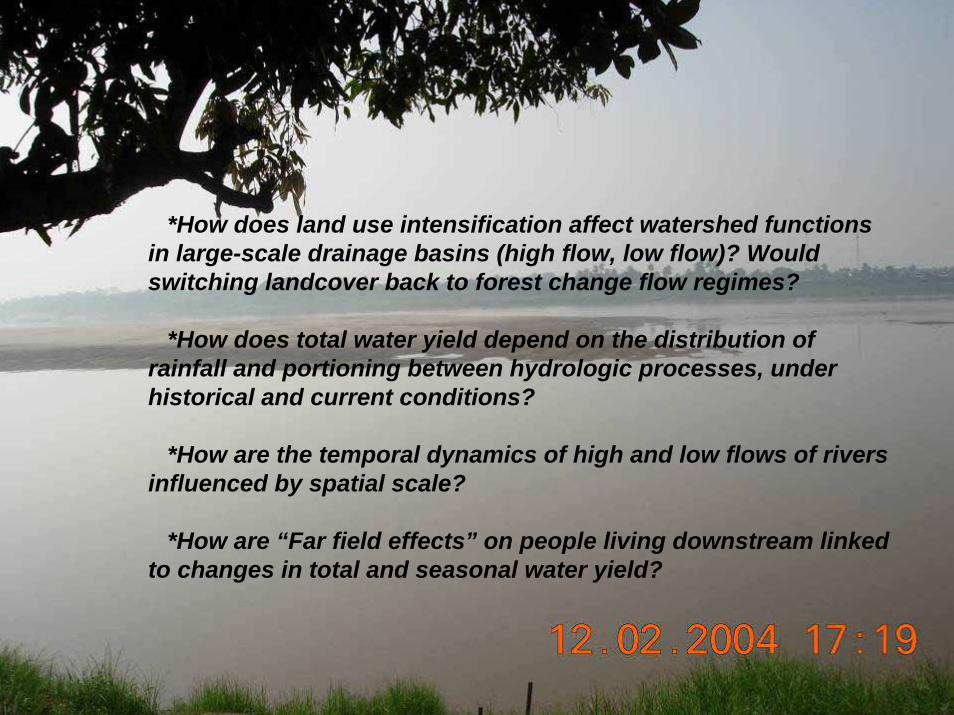
*How does land use intensification affect watershed functions in large-scale drainage basins (high flow, low flow)? Would switching landcover back to forest change flow regimes?
*How does total water yield depend on the distribution of rainfall and portioning between hydrologic processes, under historical and current conditions?
*How are the temporal dynamics of high and low flows of rivers influenced by spatial scale?
*How are “Far field effects” on people living downstream linked to changes in total and seasonal water yield?
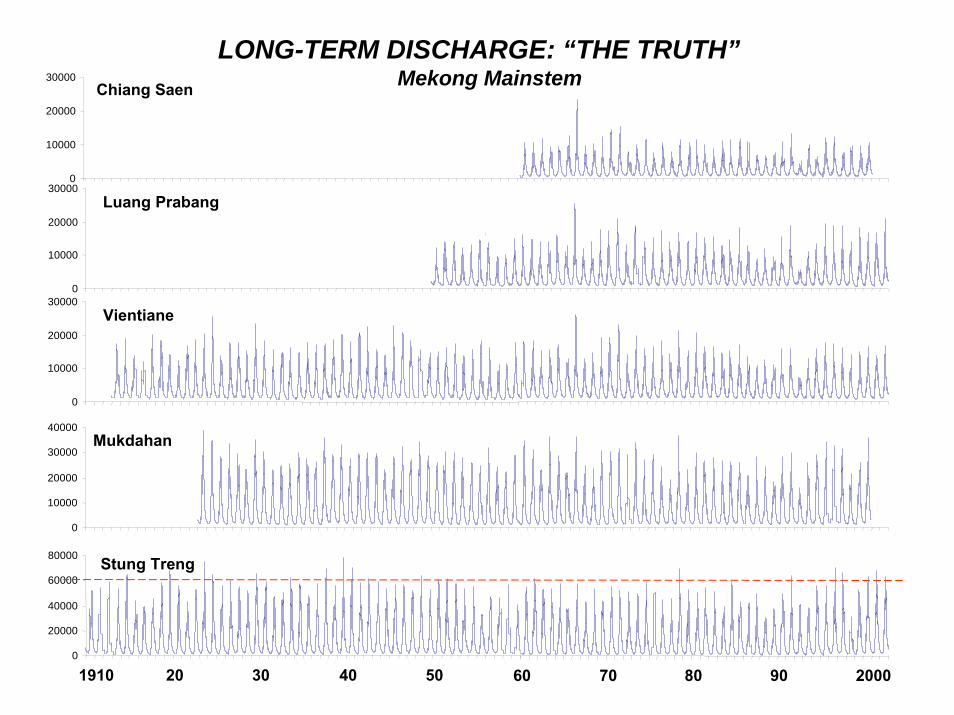
Chiang Saen
0
10000
20000
30000
Luang Prabang
0
10000
20000
30000
Vientiane
0
10000
20000
30000
LONG-TERM DISCHARGE: “THE TRUTH”Mekong Mainstem
Mukdahan
0
10000
20000
30000
40000
Stung Treng
0
20000
40000
60000
80000
1910 20 30 40 50 60 70 80 90 2000

LONG-TERM DISCHARGE: “THE TRUTH”Mun-Chi (NE Thailand)
Ubon
0
2000
4000
6000
8000
10 20 30 40 50 60 70 80 90 00
Yasothon
0
500
1000
1500
2000
Rasai Salai
0
1000
2000
3000
4000
Ban Chot
0
500
1000
1500
2000
10 20 30 40 50 60 70 80 90 00

To “deconvolve” the signal, we need suitable tools…..
MEKONGVIC (Variable Infiltration Capacity)
Meso/Macroscale Landscape/Hydrologic Model+ Reservors + Irrigation
(Daily, 1-10 km)
These geospatially-explicit process-based models are an exciting new tool, as representation of space and dynamics, from tectonics to a local rainstorm. This allows exploration, but the “answer”
Should be thought of as “intelligent interpolators of diffuse data”
is grounded in the assumptions…..
Today is “Version 3,”…. not a priori
advanced as (solid) basis for discussion of detailsthe definitive answer

“Virtual Scaled Basin”The Mekong (and elsewhere) @ 10km (or 10 m) ….
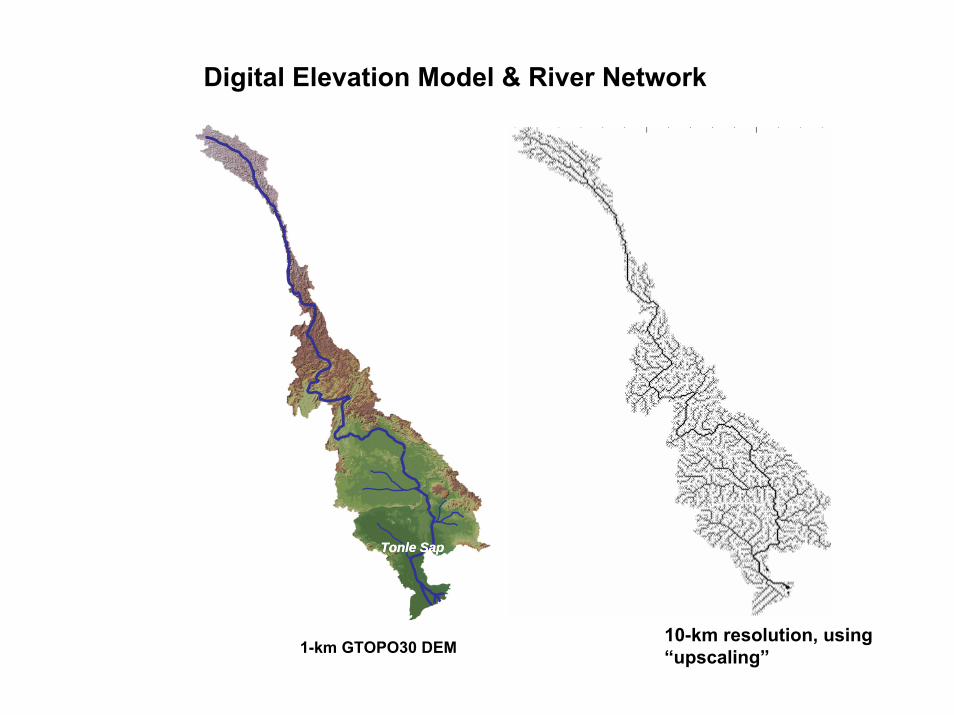
Digital Elevation Model & River Network
Tonle SapTonle Sap
10-km resolution, using “upscaling”1-km GTOPO30 DEM

SOILSFrom USDA texture classes to soil parameters saturated hydraulic conductivity (Ks), porosity (qs), field capacity (qc), wilting point (qw), and parameter n in the Brooks-Corey equation for unsaturated conductivity
Top layer (0-10 cm) Deeper layer (10-100 cm)

VEGETATION – GETTING IT RIGHT
OGE UMD
GLC/SE Asia GLC/Asia
MSU MODIS/ OGE RiceOGE UMD
GLC/SE Asia GLC/Asia
MSUMSU
MODIS/ OGE Rice

VEGETATION “CLASSES”….of interest to many, for multiple purposes…
Leaf Area Index, albedoVegetation height, displacement height, roughness length, and architectural resistanceMinimum stomatal resistance, RGL, and solar radiation attenuation
Wind height and wind attenuation
Maximum rooting depth, and distribution of root mass with depth
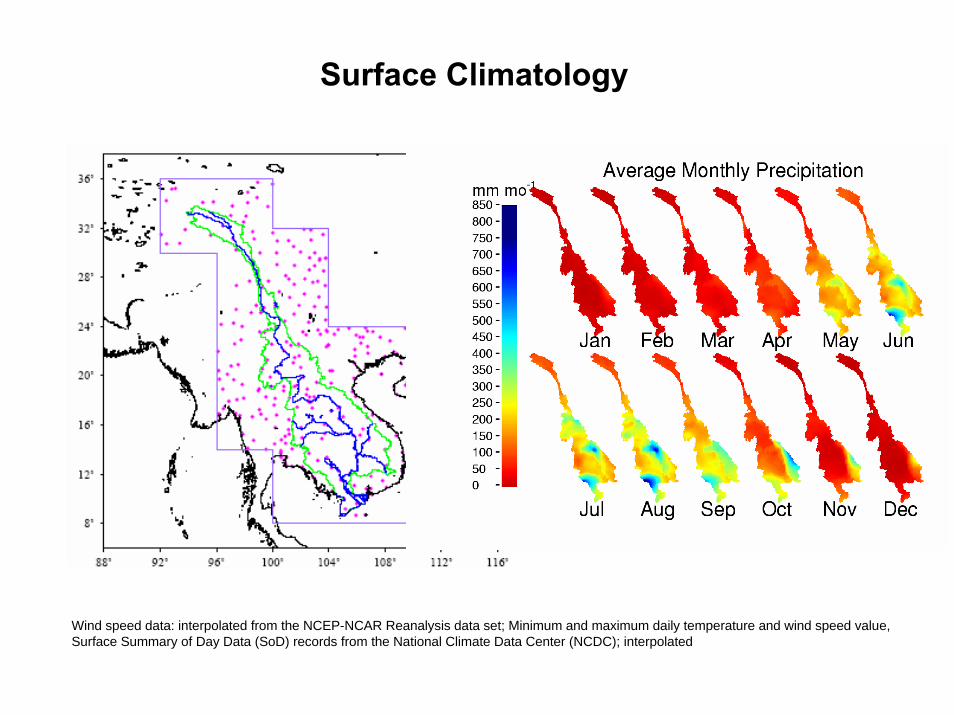
Surface Climatology
Wind speed data: interpolated from the NCEP-NCAR Reanalysis data set; Minimum and maximum daily temperature and wind speed value, Surface Summary of Day Data (SoD) records from the National Climate Data Center (NCDC); interpolated
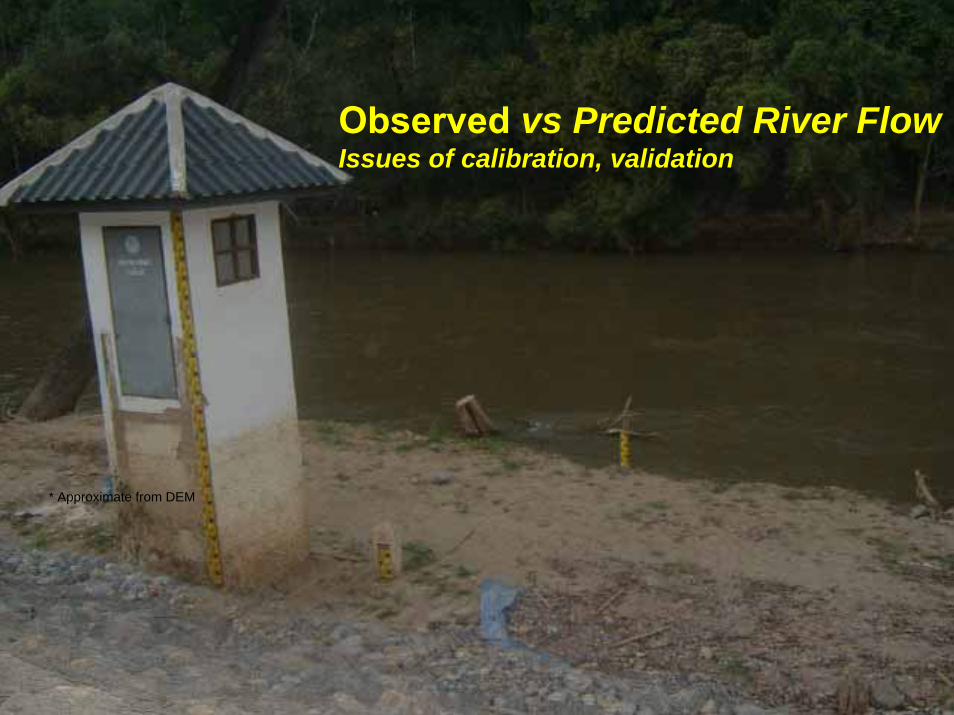
* Approximate from DEM
Observed vs Predicted River FlowIssues of calibration, validation

Chiang Saen
0
3000
6000
9000
12000
Luang Prabang
0
4000
8000
12000
16000
Vientiane
0
5000
10000
15000
20000
Pakse
0
10000
20000
30000
40000
0
Nakhon Phanom
0
7000
14000
21000
28000
Stung Treng
0
15000
30000
45000
60000
Phnom Penh
0
15000
30000
45000
60000
MEKONG DISCHARGE 1979 -2000 (m3/s; monthly)
Mukdahan
7000
14000
21000
28000
OBSERVED ( ) VIC-COMPUTED ( )

Inputs Tonle Sap
0
3000
6000
9000
12000
Ubon
0
2000
4000
6000
8000
Yasothon
0
600
1200
1800
2400
Rasi Salai
0
700
1400
2100
2800
Ban Chot
0
200
400
600
800 Muong Ngoy
0
700
1400
2100
2800
Ban Hin Heup
0
400
800
1200
1600
MEKONG TRIBS DISCHARGE 1979 -2000 (m3/s; monthly)OBSERVED ( ) VIC-COMPUTED( )

“Diagnostic” Landscape/Hydrology ProcessesAverage annual simulated runoff ratio

Average monthly soil moisture saturation in 1979-2000 in the calibrated simulation(farmers, flood prediction)

Functional Relations; e.g. Vientiane
Soil Moisture)
200
250
300
350
400
Discharge
0
4000
8000
12000
16000
Precipitation
0
10000
20000
30000
40000

Soil Moisture Antecedent: the 2000 Flood
Chiang Saen Ubon

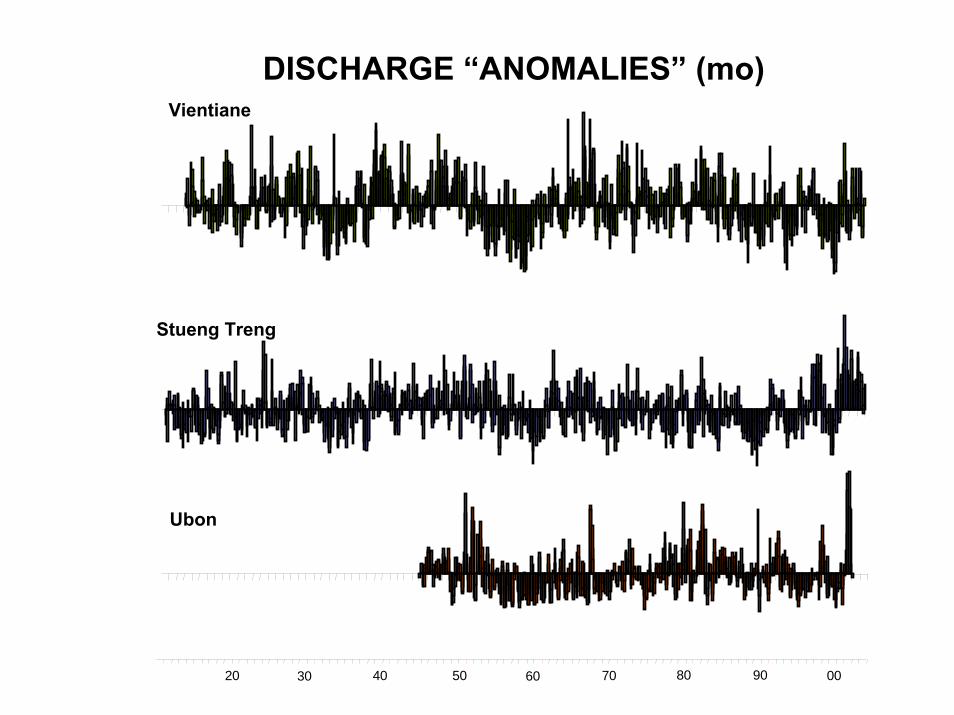
DISCHARGE “ANOMALIES” (mo)
20 30 40 50 60 70 9080 00
Stueng Treng
Ubon
Vientiane

REGIONAL CLIMATE PROXIES
Pacific Decadal Oscillation
Indian Ocean Sea Surface Temperature
Southern Oscillation Index
20 30 40 50 60 70 9080 00
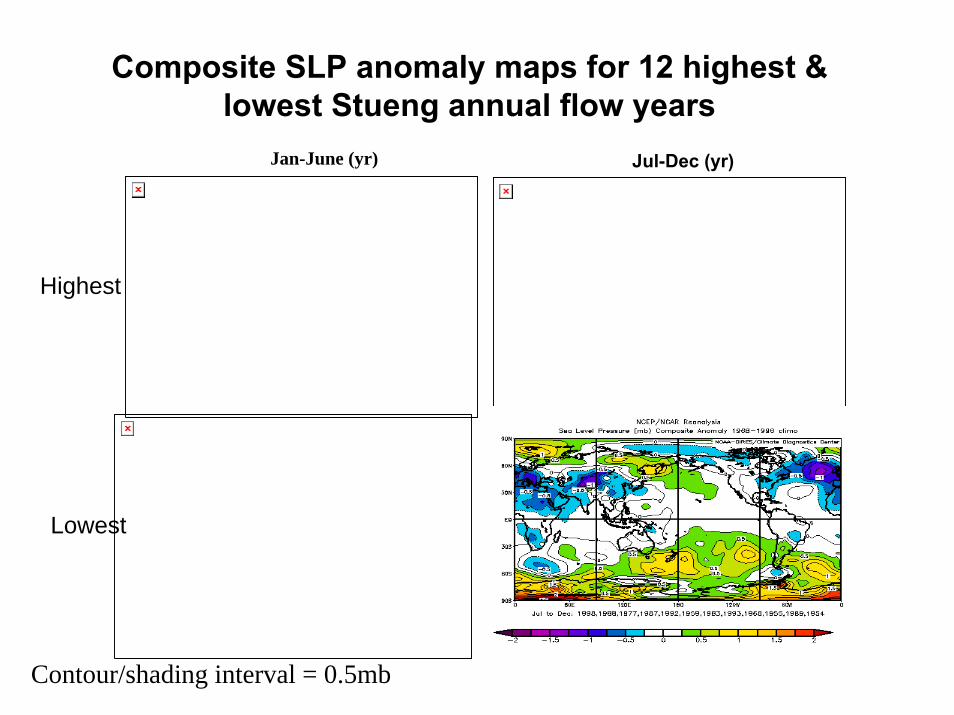
Composite SLP anomaly maps for 12 highest & lowest Stueng annual flow years
Jan-June (yr) Jul-Dec (yr)
Contour/shading interval = 0.5mb
Highest
Lowest


Ubol Ratana % (Σ=-14%) Nam Ngum(Σ=-15%)Input
0
40
80
120
160
0
100
200
300
400
500
Output
EFFECT OF DAMS ON FLOW
-2
400%
800%1200%
00%0%
1 2 3 4 5 6 7 8 9 10 11 12-100%
0%
200%
400%
1 2 3 4 5 6 7 8 9 10 11 12
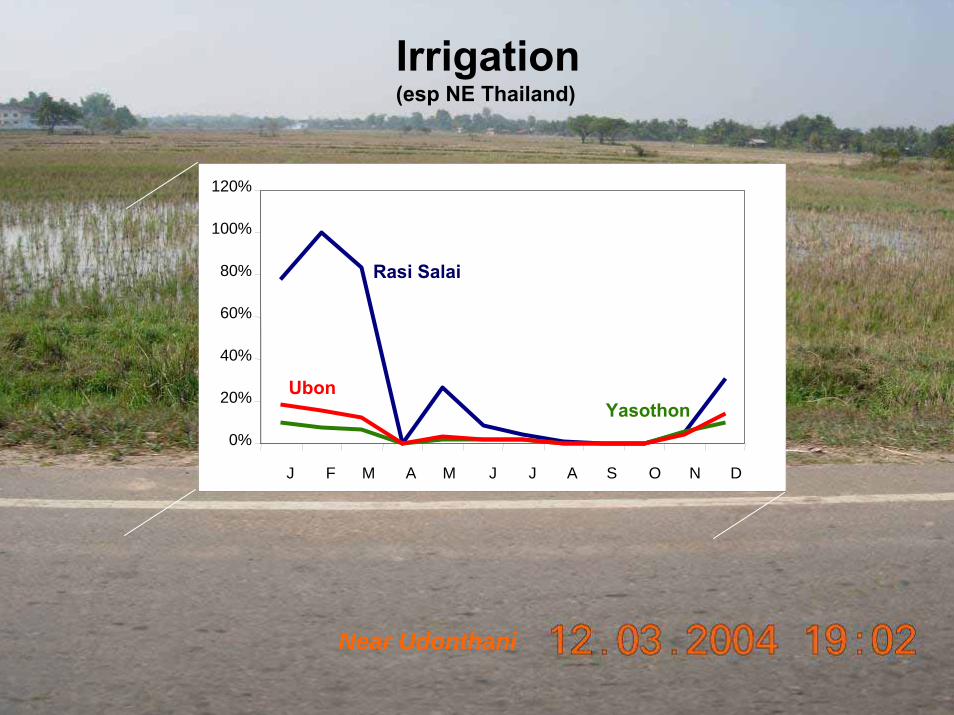
Irrigation (esp NE Thailand)
Near Udonthani
0%
20%
40%
60%
80%
100%
120%
J F M A M J J A S O N D
Rasi Salai
YasothonUbon
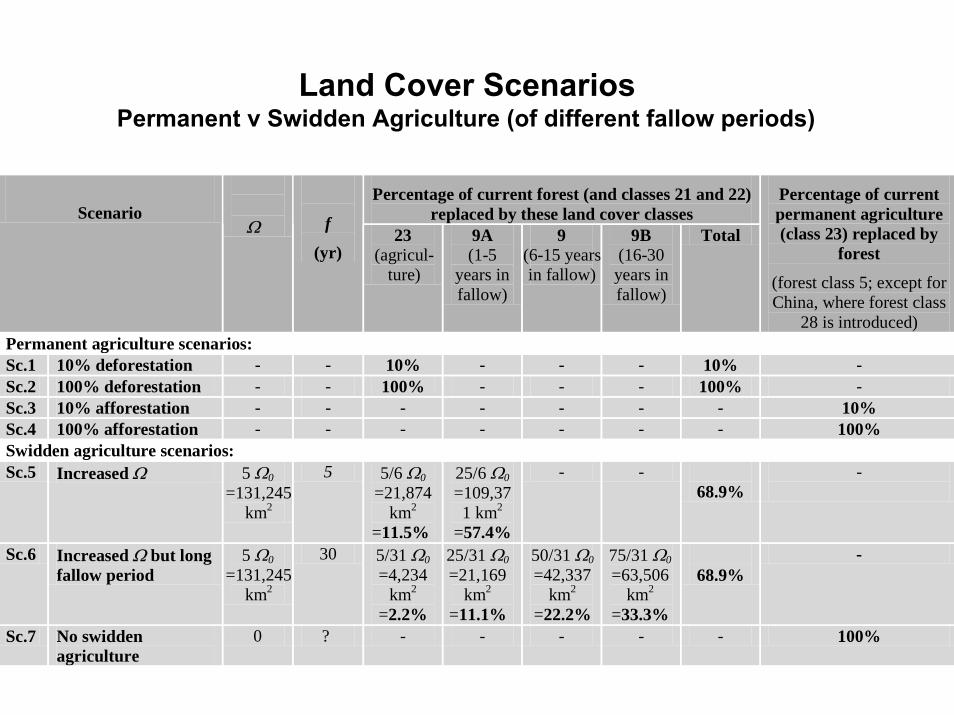
Land Cover ScenariosPermanent v Swidden Agriculture (of different fallow periods)
Percentage of current forest (and classes 21 and 22) replaced by these land cover classes Scenario
Ω
f
(yr) 23
(agricul-ture)
9A (1-5
years in fallow)
9 (6-15 yearsin fallow)
9B (16-30 years in fallow)
Total
Percentage of current permanent agriculture (class 23) replaced by
forest
(forest class 5; except for China, where forest class
28 is introduced) Permanent agriculture scenarios: Sc.1 10% deforestation - - 10% - - - 10% - Sc.2 100% deforestation - - 100% - - - 100% - Sc.3 10% afforestation - - - - - - - 10% Sc.4 100% afforestation - - - - - - - 100% Swidden agriculture scenarios: Sc.5 Increased Ω 5 Ω0
=131,245km2
5 5/6 Ω0 =21,874
km2
=11.5%
25/6 Ω0 =109,371 km2
=57.4%
- - 68.9%
-
Sc.6 Increased Ω but long fallow period
5 Ω0 =131,245
km2
30 5/31 Ω0 =4,234
km2
=2.2%
25/31 Ω0 =21,169
km2
=11.1%
50/31 Ω0 =42,337
km2
=22.2%
75/31 Ω0 =63,506
km2
=33.3%
68.9%
-
Sc.7 No swidden agriculture
0 ? - - - - - 100%
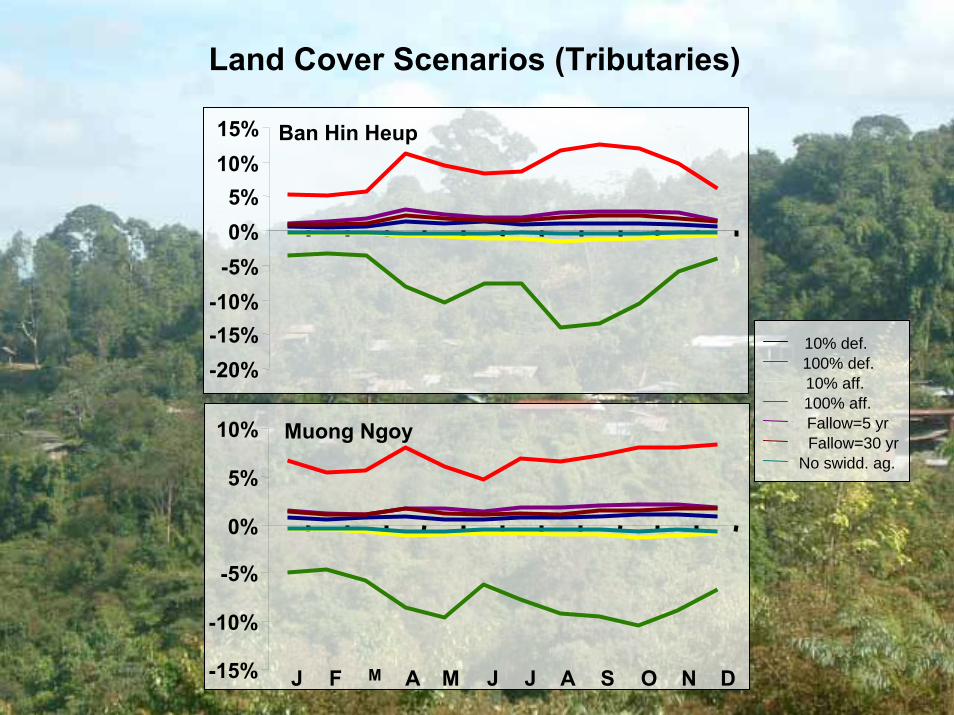
Ban Hin Heup
-20%-15%-10%-5%0%5%
10%15%
10% def.100% def.10% aff.100% aff.Fallow=5 yrFallow=30 yr
No swidd. ag.
Muong Ngoy
-15%
-10%
-5%
0%
5%
10%
J F M A M J J A S O N D
Land Cover Scenarios (Tributaries)

100% Deforestation
0%
5%
10%
15%
20%100% Deforestation
J F M A M J J A S O N D J F M A M J J A S O
0%
5%
10%
15%
20%
N D
100% Afforestation 100% Afforest-20%
-15%
-10%
-5%
0%
Chiang SaenLuang PrabangVientiane
Nakhon Phanom
MukdahanPakse
Stung Treng
Rasi SalaiYasothon
Ban Hin HeupMuong Ngoy `Ban Chot Ubon
Land Cover “100%”: MEKONG BASIN
-100%
-80%-60%
-40%-20%
0%
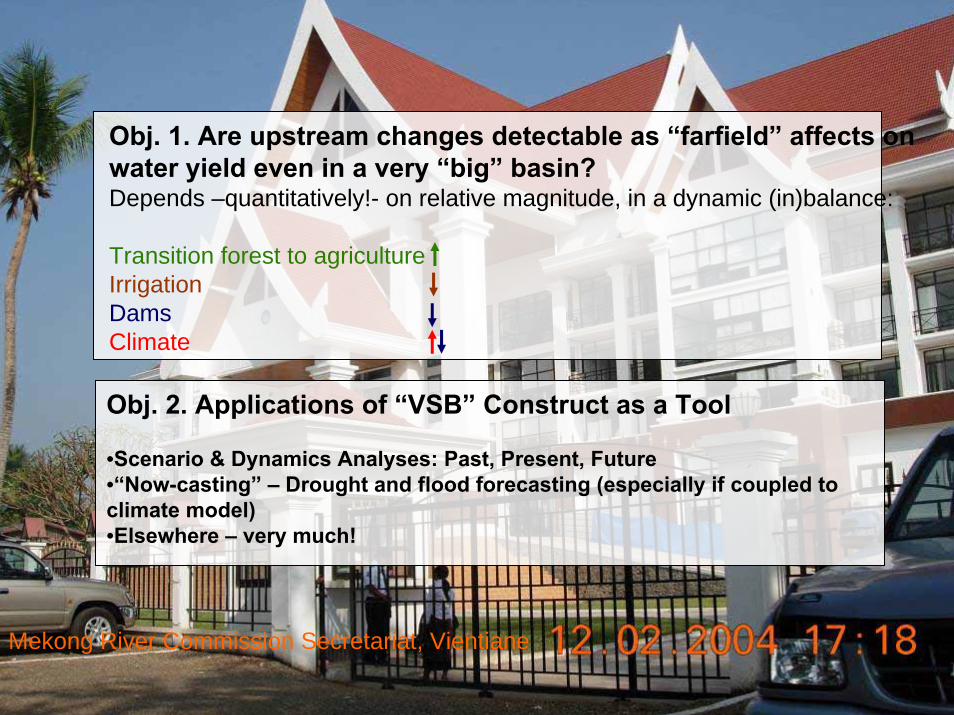
Mekong River Commission Secretariat, Vientiane
Obj. 1. Are upstream changes detectable as “farfield” affects on water yield even in a very “big” basin?Depends –quantitatively!- on relative magnitude, in a dynamic (in)balance:
Transition forest to agriculture IrrigationDamsClimate
Obj. 2. Applications of “VSB” Construct as a Tool
•Scenario & Dynamics Analyses: Past, Present, Future•“Now-casting” – Drought and flood forecasting (especially if coupled to climate model)•Elsewhere – very much!