On Rights and Realities: Building a System of Services for Young … · Combat HIV/AIDS, malaria,...
90
On Rights and Realities: Building a System of Services for Young Children Early Childhood Systems And Daycare Centers In Latin America and Europe San Jose, Costa Rica November, 2013 Sharon Lynn Kagan, Ed.D. Teachers College, Columbia University Child Study Center, Yale University
Transcript of On Rights and Realities: Building a System of Services for Young … · Combat HIV/AIDS, malaria,...

On Rights and Realities:
Building a System of Services for
Young Children
Early Childhood Systems And Daycare
Centers In Latin America and Europe
San Jose, Costa Rica
November, 2013
Sharon Lynn Kagan, Ed.D.
Teachers College, Columbia University
Child Study Center, Yale University

Presentation Overview
Part I: The Rights of Children
Part II: Children’s Realities
Part III: What We Know
Part IV: The Why’s and What’s of
Early Childhood Systems
Part V: Moving Forward: The System
2

Part I:
The Rights
of Children

International Frameworks: Where are the young children?
International Policy ECD
Convention on the Rights of the Child
(CRC)
Yes
Millennium Development Goals (MDG) Somewhat
Education For All (EFA) Yes
World Fit For Children (WFFC) Yes
CEDAW No
ILO: Child Labor No
Convention on the Rights of Persons with
Disabilities
No
4

Convention on the Rights of the Child
• Focuses on the rights of the child from a broad
developmental ecological perspective.
• Four Principles:
–Survival and development
–Non-discrimination
–A child’s best interest
–Participation – child’s opinion
5

CRC & ECD
• General Comment #7 (GC7) – is a guide to implementing child rights in early childhood.
– Drafted because reporting of rights of the youngest children was poor.
– Recognizes the rights of all young children as outlined in the Convention.
– Emphasizes early childhood as a vital period in acknowledging these rights.
– Explores policies, programs, capacity-building, and the responsibilities of parents and state parties for early childhood.
6

Millennium Development Goals
• Signed in September 2000, MDG has 8 goals
1. Eradicate extreme poverty and hunger.
2. Achieve universal primary education.
3. Promote gender equality and empower women.
4. Reduce child mortality.
5. Improve maternal health.
6. Combat HIV/AIDS, malaria, and other diseases.
7. Ensure environmental sustainability.
8. Develop a global partnership for development.
• Post-2015 MDGs extended to 2030 7

UNESCO: EFA
• First to really highlight ECE and that “learning begins at birth”
• Six goals (to be achieved by 2015): 1. Expansion and improvement of comprehensive early childhood care
and education
• Participation
• Quality and cost
2. All children will have access to a universal primary education.
3. Ensuring that the learning needs of all young people and adults are met through equitable access to appropriate learning and life skills programs
4. 50% improvement in levels of adult literacy
5. Gender equality in primary and secondary education
6. Improve the quality of education
8

A World Fit for Children
• U.N. (2002):
–Every child should have…a nurturing,
caring, and safe environment – to survive,
be physically healthy, mentally alert,
emotionally secure, socially competent, and
able to learn.
• POINT: U.N. focus on ECD is comparatively
recent and even more recent is the focus on
early childhood education 9

Part II:
Children’s Realities

Children’s Realities: Globally
• Rights don’t represent children’s realities.
• As of 2009, throughout the world: – Between 500 million and 1.5 billion children have been affected by
violence.
– 150 million children between the ages of 5 and 14 are engaged in child labor.
– 145 million children have lost one or both parents; 15 million have lost at least one parent to AIDS.
– 51 million children are unregistered at birth.
– 18 million children are living with the effects of displacement.
– 1.2 million children were trafficked each year, as of the year 2000.
– Huge disparities exist between wealthy and poor children, and urban and rural children
11 Source: UNICEF. (2009). State of the World’s Children. Retrieved from
http://www.unicef.org/rightsite/sowc/pdfs/SOWC_SpecEd_CRC_ExecutiveSummary_EN_091009.pdf

Children’s Realities: Latin America/Caribbean (LAC)
• As of 2011, – 9% of children between the ages of 5 and 14 are
engaged in child labor
– 9.5 million children have lost one or both parents
– 600,000 have lost at least one parent to AIDS
– 1.3 million children are unregistered at birth each year
12
Sources: The World Bank. (2011). Child labor in Latin America and the Caribbean [Data File]. Retrieved from
http://data.worldbank.org/indicator/
UNICEF. (2011, November). The right to an identity: Birth registration in Latin America and the Caribbean. Challenges Newsletter, 13, 1-12.
Retrieved from http://www.unicef.org/lac/challenges-13-ECLAC-UNICEF(1).pdf
UNICEF, Child Info. (2011). Orphan estimates [Data File]. Retrieved from http://www.childinfo.org/hiv_aids_orphanestimates.php

Children’s Realities: LAC
• Child Mortality: – As of 2012, the mortality rate for children under age 5 was 19 per every
1,000 live births and the infant mortality rate was 16 per every 1,000 live births
• Poverty: – 45% of children ages birth to 5 years are poor
• Low Birth Weight: – As of 2010, 10% of newborn children suffered from low weight at
birth, and 5% of these infants were still underweight at age 4
• Unregistered Births: – As of 2011, 10% of children under age 5 in LAC did not have a birth
certificate
13
Sources: UNICEF (2010). Pobreza infantil en America Latina y el Caribe. Retrieved from http://dds.cepal.org/infancia/guia-para-estimar-la-pobreza-
infantil/bibliografia/introduccion/CEPAL%20y%20UNICEF%20%282010%29%
UNICEF. (2011, November). The right to an identity: Birth registration in Latin America and the Caribbean. Challenges Newsletter, 13, 1-12. Retrieved
from http://www.unicef.org/lac/challenges-13-ECLAC-UNICEF(1).pdf
The World Bank. (2011). Mortality rate under-5 and infant mortality rate in Latin America and the Caribbean [Data File]. Retrieved from
http://data.worldbank.org/indicator/
Vegas, E., Santibanez, L., & World Bank. (2010). The promise of early childhood development in Latin America and the Caribbean. Washington, DC:
World Bank.

Children’s Realities:
Latin America/Caribbean • ECD investments in LAC range from less than 1% to
slightly over 12% of total educational expenditures
• LAC recently moving towards holistic approach to ECD implementation
• Coverage of ECD services across Latin America is low – Large regional disparities in poverty
– Indigenous groups have least access to social welfare programs
– Expanding coverage to larger population groups is main priority of most national ECD policies in LAC
• But most countries in LAC have only recently started to consider national policies related to ECD (2010)
14
Source: UNESCO (2010). Reaching the marginalized. In Education for all global monitoring report (132-213). Retrieved from
http://www.unesco.org/new/fileadmin/MULTIMEDIA/HQ/ED/GMR/pdf/gmr2010/gmr2010-ch3.pdf
Vegas, E., Santibanez, L., & World Bank. (2010). The promise of early childhood development in Latin America and the Caribbean.
Washington, DC: World Bank.

Part III:
What We Know

Considering What We Know
1. The early years matter a great deal. – The early years are the formative period of development.
• The human brain grows to 80% of adult size by age 3 and 90% by age 5.
– Young children grow faster and learn more in their early years than in any other period of life.
– Children need to be nurtured to develop their optimal potential.
• Without stimuli, children are subject to significant, and sometimes insurmountable, deficits.
16 Source: Shonkoff, J. P. & Phillips, D. A. (2000). From neurons to neighborhoods: The science of early childhood development. Washington, DC, US: National Academy Press.

Considering What We Know
2. High quality early childhood programs
produce results and save money. – Children derive health, nutritional, social and academic
benefits.
– The investments from high-quality early childhood
programs for low-income children return $4-11 for each
invested dollar.
– As adults, those who have had a high quality preschool
experience are less likely to be referred for social services,
less likely to be incarcerated, and less likely to be
dependent on public assistance.
17 Sources: Schweinhart, L. J., Montie, J., Xiang, Z., Barnett, W. S., Belfield, C. R., & Nores, M. (2005). Lifetime effects: The High/Scope Perry Preschool study through age 40.
(Monographs of the High/Scope Educational Research Foundation, 14). Ypsilanti, MI: High/Scope Press; National Institutes of Health. (2011, February). High-quality
preschool program produces long-term economic payoff. Retrieved from: http://www.nih.gov/news/health/feb2011/nichd-04.htm

Considering What We Know
3. We know how to produce HIGH
quality programs for children. – Three scientifically robust and well-known studies
of early childhood education have demonstrated
which variables matter:
• Class size
• Teacher qualifications
• Teacher-child ratios
• Curriculum
18

Considering What We Know
4. Despite the importance and our
know-how about high quality
programs, globally, they are very
sparse because we face 3 huge
challenges.
19

What We Know:
The Challenges
20
Inconsistencies in Quality
Inefficiencies in Administration
Inequities in Access

21
Inconsistencies in Quality
Inefficiencies in Administration
Inequities in Access
Challenge I: Inequities in Access
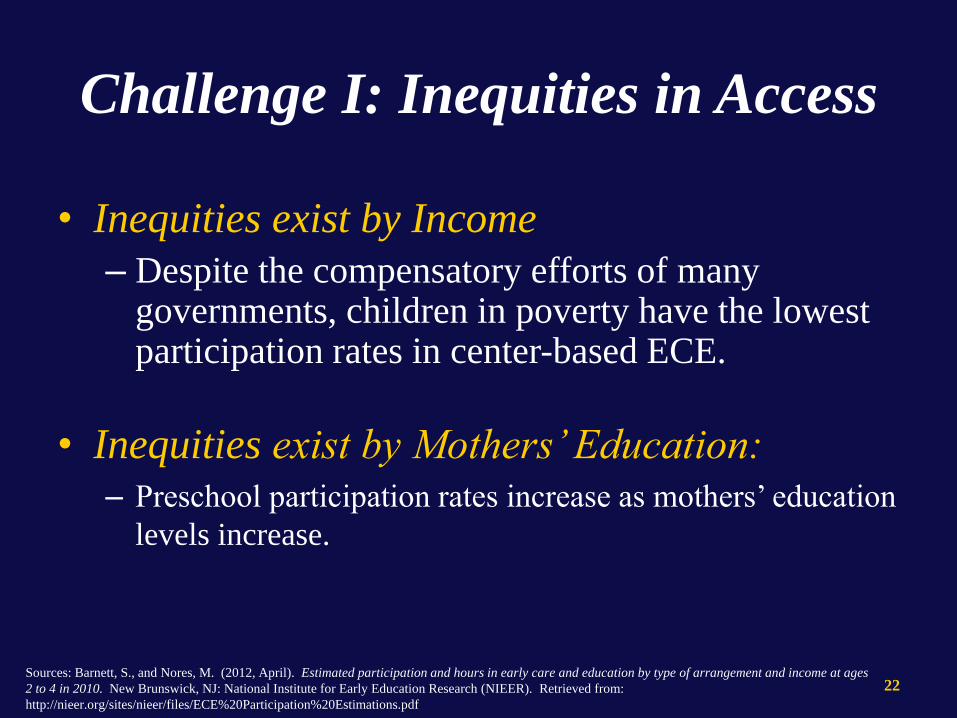
Challenge I: Inequities in Access
• Inequities exist by Income
– Despite the compensatory efforts of many governments, children in poverty have the lowest participation rates in center-based ECE.
• Inequities exist by Mothers’ Education:
– Preschool participation rates increase as mothers’ education
levels increase.
22 Sources: Barnett, S., and Nores, M. (2012, April). Estimated participation and hours in early care and education by type of arrangement and income at ages
2 to 4 in 2010. New Brunswick, NJ: National Institute for Early Education Research (NIEER). Retrieved from:
http://nieer.org/sites/nieer/files/ECE%20Participation%20Estimations.pdf

Challenge I: Inequities in Access
• Inequities exist by Geographic Locale: – Vast differences in most countries between urban and rural children
• Latin American children living in urban areas are 1.21 times more likely to attend preschool than children living in rural areas
• Indigenous groups have the least access to social welfare programs, including preprimary school
• Inequities exist by Income: – Out of 17 countries in Latin America, almost 1.7 million children
do not attend preschool prior to entry into primary education—half of these children belong to the poorest 20% of the population
– In Bolivia, Brazil, El Salvador, Nicaragua, Panama, and Paraguay, children in the first (lowest) income quintile are enrolled in early education programs at almost half the rate of children in the fifth (highest) income quintile
23
Sources: Vegas, E., Santibanez, L., & World Bank. (2010). The promise of early childhood development in Latin America and the Caribbean. Washington,
DC: World Bank.
UNICEF. (2006, August). The right to education: An unfinished task for Latin America and the Caribbean. Challenges Newsletter, 3, 1-12. Retrieved from
http://www.unicef.org/lac/Desafios_Nro3_eng.pdf

Enrollment Rates by Income Quintile (1st and 5th),
Children under 6-years-old
24

25
Inconsistencies in Quality
Inefficiencies in Administration
Inequities in Access
Challenge II: Quality Inconsistencies

Challenge II: Quality
Inconsistencies • We have invested in quantity over quality.
• Quality, though all important, is hard to achieve.
– Major quality studies that produced effects are hard to
replicate in and of themselves.
– Very challenging to scale up quality programs to serve
large number of children.
• There is an understanding of quality from a
pedagogical perspective (classroom/center), but there
is limited understanding of quality from a policy
perspective.
26

Challenge II: Quality
Inconsistencies
• Globally, program quality is a serious issue
because without quality programs, there is no
hope of achieving quality outcomes for
children.
– In 2011, in the US, only five states met all ten
quality standards benchmarks identified by
NIEER.
– Throughout this hemisphere, the situation is
troublesome.
27
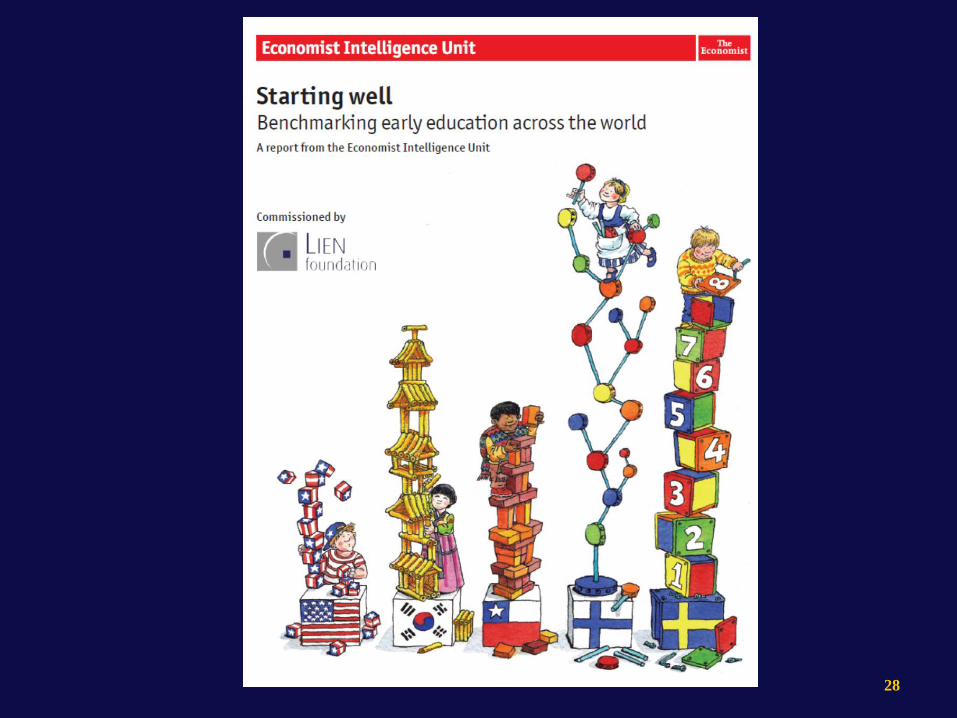
28

Starting Well Countries List: 45 Countries
29
Argentina Germany Mexico Sweden
Australia Ghana Netherlands Switzerland
Austria Greece New Zealand Taiwan
Belgium Hong Kong Norway Thailand
Brazil Hungary Philippines Turkey
Canada India Poland UAE
Chile Indonesia Portugal UK
China Ireland Russia USA
Czech Republic Israel Singapore Vietnam
Denmark Italy South Africa
Finland Japan South Korea
France Malaysia Spain

Overall Score Quality [45%]
20 Chile 63.6 29 Chile 53
32 Mexico 50.5 34 Mexico 41.5
34 Argentina 43.0 37 Argentina 30.9
40 Brazil 35.1 39 Brazil 28.9
Starting Well Rankings for LA

Challenge II: Quality Inconsistencies
Bachelor’s
Degree or
Higher
Associate
Degree
Some
college, but
no degree
High school
degree or
lower
Preschool teachers
(Includes Head Start) 32% 15% 33% 20%
Center-based child
care workers 11% 7% 34% 48%
Family-based child
care workers 14% 9% 29% 48%
• PROFESSIONAL CAPACITY VARIES
Sources: United States Government Accountability Office. (2012, February). Early child care and education: HSS and Education are taking steps to improve workforce data and enhance worker quality. Washington, DC: United States Government Accountability Office. Retrieved from: http://www.gao.gov/assets/590/588577.pdf
31

Challenge II: Quality Inconsistencies
Specialization
in Early
Childhood
Education
Post-
secondary
Education
High School
Education
Teachers 62.5% 75.0% 87.5%
Teacher Aides 30.4% 30.4% 60.9%
Caregivers 41.2% 41.2% 70.6%
• Data based on 32 programs that hire teachers, 23 programs that
hire teacher aides, and 17 programs that hire caregivers
Sources: Araujo, M.C., Lopez-Boo., F., Puana, J.M., & World Bank. (2013). Overview of early childhood development services in Latin America and the Caribbean 32

Challenge II: Quality
Inconsistencies • PROGRAM REGULATIONS VARY
– In some states, programs are exempt from licensure if they operate on a part-day schedule, thus excluding the majority of state programs.
– Enforcement visitations vary in frequency by state.
• Internationally, with devolution of authority to localities, even the Nordic countries report differences in quality of services by area.
Sources: Cost Quality and Outcomes Study Team. (1995). Cost, quality and child outcomes in child care centers, Executive summary (second ed.). Denver: Economics Department, University of Colorado.
National Resource Center for Health and Safety in Child Care and Early Education. (2006). Individual States' Child Care Licensure Regulations. Retrieved August 16, 2006, from http://nrc.uchsc.edu/STATES/states.htm
Ochshorn, S., Kagan, S. L., Carroll, J., Lowenstein, A. E., & Fuller, B. (2004). The effects of regulation on the quality of early care and education (Child Care and Early Education Research and Policy Series Report No. 3). Denver, CO: National Conference of State Legislatures.
33

Challenge II: Quality
Inconsistencies
• INVESTMENTS VARY –Revenue generation strategies are mixed and
vary from program to program and from year to year.
–The durability of public investments also vary.
–There is limited long-term fiscal planning.
34

Investment in ECD
35
0.3
0.2
0.4
0.1
0.4
0.2
0.1
0.5
0.02
0.3
0.2
0
0.1
0.2
0.3
0.4
0.5
0.6
Per
cen
tage
of
GD
P
Preprimary Education as % of GDP
Sources: Vegas, E., Santibanez, L., & World Bank. (2010). The promise of early childhood development in Latin America and the Caribbean.
Washington, DC: World Bank.
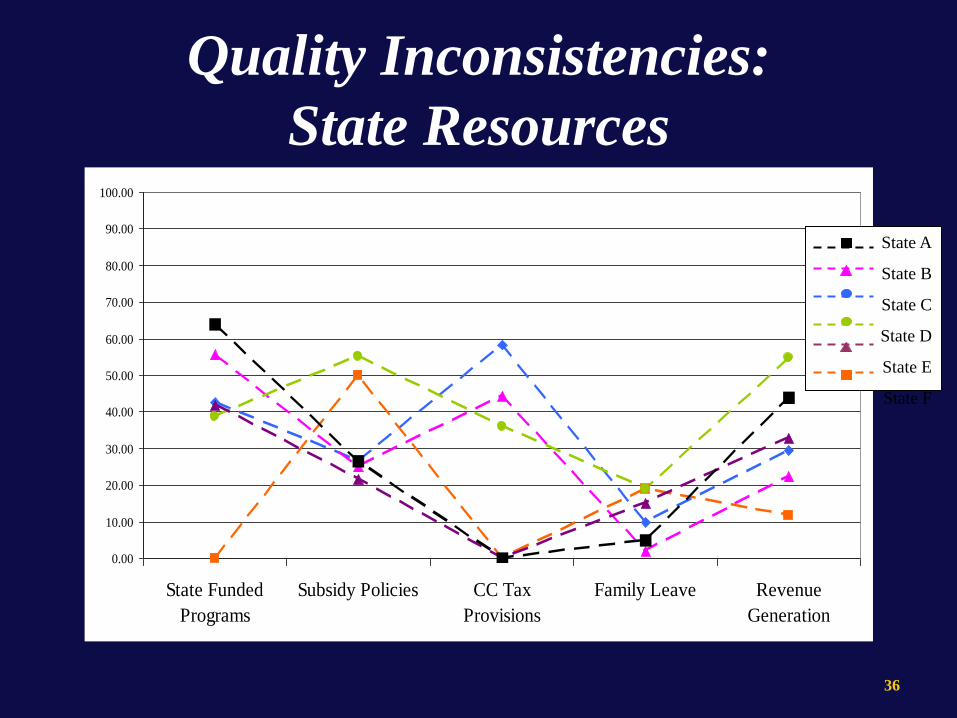
Quality Inconsistencies:
State Resources
0.00
10.00
20.00
30.00
40.00
50.00
60.00
70.00
80.00
90.00
100.00
State Funded
Programs
Subsidy Policies CC Tax
Provisions
Family Leave Revenue
Generation
36
State A
State B
State C
State D
State E
State F
Challenge II: Quality Inconsistencies
• Quality is not distributed equally: low SES and
minority children are more likely to experience:
– Larger class sizes;
– Less outreach to smooth the transition to school; and
– Teachers that have less training, lower compensation, less
training, and less stability.
• These differences are particularly harmful, given that
high-quality child care has the strongest impact on
the developmental outcomes of children from low-
income families.
Sources: Barnett, W.S., & Whitebook, M. (2011). Degrees in context: Asking the right questions about preparing skilled and effective teachers of young children. New
Brunswick, NJ: National Institute for Early Education Research; Lee, V. E., & Burkam, D. T. (2002). Inequality at the starting gate: Social background differences in
achievement as children begin school. Ann Arbor: University of Michigan; Votruba-Drzal, E., Levine Coley, R., & Chase-Lansdale, P. L. (2004). Child care and low-income
children's development: direct and moderated effects. Child Development, 75(1), 296-312
37

Inefficiencies in Administration
38
Inconsistencies in Quality
Inefficiencies in Administration
Inequities in Access

Inefficiencies in Administration:
Governance
• Because there are so many disparate funding
streams, no single entity governs early
childhood at the federal or state level.
• True in countries around the world with
Ministries of Education, Health, Welfare, and
Community Development ranking among those
that have programs serving young children.
• Governance responsibilities change with
differing political leadership. 39

Inefficiencies in Administration:
Accountability • Different child outcome standards/expectations for
different programs – Programs do not follow the same standards.
– Some programs are not required to meet any child standards
• Different data systems – Most elaborated tends to be in Departments of Education
– Other departments have unlinked data systems
– Typically, no unified child identifier so impossible to track children across programs when multiply enrolled or across the age span.
40

THE BOTTOM LINE
• Bottom Line 1:
– By focusing on funding different sets of programs, we
don’t see the one big picture.
• Most countries have a confusing array of agencies sponsoring many
different early childhood programs, with very limited coordination
• Early childhood organization changes frequently, unlike education
or health
• Bottom Line 2
– New thinking called systems thinking taking hold as a
means of addressing the three challenges.
41
Part IV:
The Why’s and What’s of Early
Childhood Systems
42

Why SYSTEMS?
• HISTORICAL REALITIES AND RATIONALE:
– Programs and services for young children are limited in number,
chaotic in approach, inconsistent in goals and outcomes, and
inequitable in service provision.
• PRACTICAL REALITIES AND RATIONALE:
– Quality, though all important, is hard to achieve.
• Major quality studies that produced effects are hard to replicate in
and of themselves.
• Very challenge to scale up quality programs to serve large number
of children.
• CONCEPTUAL REALITIES AND RATIONALE
– There is an understanding of quality from a pedagogical perspective
(classroom/center), but very limited understanding of quality from a
policy perspective.
43

What does an Early Childhood
System actually do? • An early childhood system:
‒ Promotes positive outcomes for children
‒ Promotes equitable access, high quality, and efficiency.
‒ Acknowledges that early childhood spans many
systems and departments all of which are important to
young children (e.g., health, education, welfare) and
need to be coordinated.
‒ Looks beyond “programs” and regards other supports
(financing, professional development/capacity
building) as fundamental.
44

Pre-
School
Health
Centers
Community
Centers
Home
Visiting
Child
Care
Source: Kagan, S. L., & Cohen, N. E. (1997). Not by chance: Creating an early care and education system. New Haven, CT: Yale University Bush
Center in Child Development and Social Policy. 45
Programs
Picturing an
Early Childhood System

Pre-
School
Health
Centers
Community
Centers
Home
Visiting
Infrastructure
Child
Care
Source: Kagan, S. L., & Cohen, N. E. (1997). Not by chance: Creating an early care and education system. New Haven, CT: Yale University Bush
Center in Child Development and Social Policy. 46
Programs
Picturing an
Early Childhood System

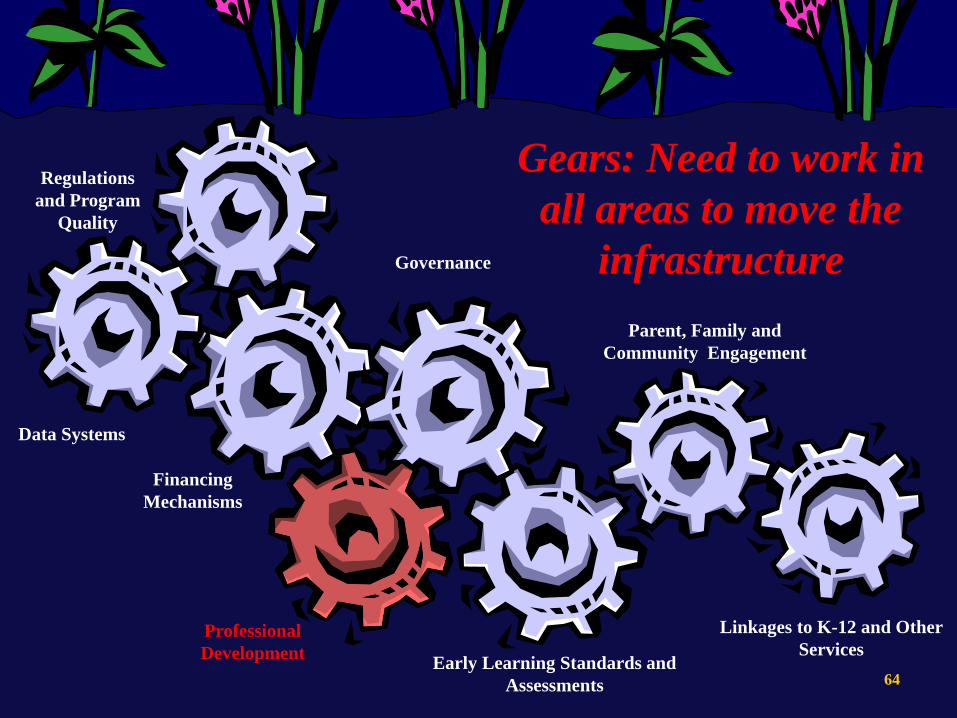
Gears: Need to work in
all areas to move the
infrastructure
Data Systems
Parent, Family and
Community Engagement
Early Learning Standards and
Assessments
Professional
Development
Linkages to K-12 and Other
Services
Financing
Mechanisms
Governance
Regulations
and Program
Quality
47

Systems Thinking
Programs Infrastructure SYSTEMS
48

Systems Thinking
8 1 0
49

50
Looking at Multiple Systems

Gears: Need to work in
all areas to move the
infrastructure
Data Systems
Parent, Family and
Community Engagement
Early Learning Standards and
Assessments
Professional
Development
Linkages to K-12 and Other
Services
Financing
Mechanisms
Governance
Regulations
and Program
Quality
51
Gear 1: Regulations and
Quality Programs
• What are quality programs?
– Provide rich and varied learning opportunities
– Are bathed in language
– Actively engage children
– Provide activities that address children’s individual
differences (strengths and weaknesses)
– Are characterized by inquiry, reflection, and curiosity
– Produce productive outcomes for children
52

Gear 1: Regulations and
Quality Programs • We know that regulations and teacher capacity
influence quality more than any other factors.
• We know that the more stringent the regulations, the
higher the quality of service, but regulations vary
widely.
• Major problems are:
‒ Large number of legal exemptions permitted
‒ Limited number of licensing specialists
‒ Poor enforcement strategies
• Regulations are a powerful but underutilized tool.
53
Gear 1: Regulations and
Quality Programs • Quality Rating and Improvement Systems (QRIS)
• Promising strategy for improving programs and for
integrating the ECE system
• Five key components
1. Quality standards;
2. A process for monitoring those standards;
3. A process for supporting quality improvement;
4. Provision of financial incentives; and
5. Dissemination of information to parents and the public
about program quality
54

Gears: Need to work in
all areas to move the
infrastructure
Data Systems
Parent, Family and
Community Engagement
Early Learning Standards and
Assessments
Professional
Development
Linkages to K-12 and Other
Services
Financing
Mechanisms
Governance
Regulations
and Program
Quality
55

Gear 2: Data Systems
• Data systems provide us with the information we need to make key decisions about children, programs, and policy. As such, they are essential to ECE improvement.
• Data systems are best developed in three parts: • Conceptual Part:
• Decide what you want to use the data for (e.g. screening, instructional assessment, accountability assessment, teacher quality)
• Practical Part: • Therefore, what data to collect, from and by whom, and with what
regularity
• Operational Part: • Set up the mechanisms to collect and report the data ACROSS
AGENCIES AND PROGRAMS
56

Gears: Need to work in
all areas to move the
infrastructure
Data Systems
Parent, Family and
Community Engagement
Early Learning Standards and
Assessments
Professional
Development
Linkages to K-12 and Other
Services
Financing
Mechanisms
Governance
Regulations
and Program
Quality
57
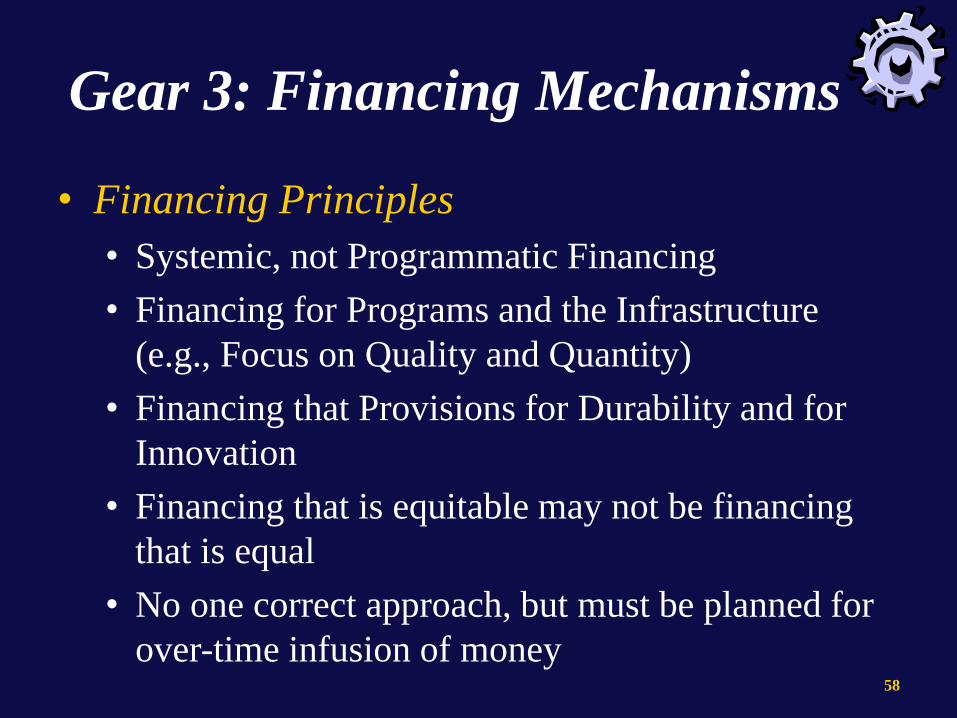
Gear 3: Financing Mechanisms
• Financing Principles
• Systemic, not Programmatic Financing
• Financing for Programs and the Infrastructure
(e.g., Focus on Quality and Quantity)
• Financing that Provisions for Durability and for
Innovation
• Financing that is equitable may not be financing
that is equal
• No one correct approach, but must be planned for
over-time infusion of money 58

Gear 3: Financing Mechanisms • For sustainability, must look at revenue generation schemes:
• Taxing Strategies
• Tax Strategies, Sin Taxes, Tax Credits, Lotteries, K-12 Funding
• Conditional Cash Transfers
• Performance Based Payments: incentivize behaviors with cash;
used by World Bank
• Social Impact Bonds
• Raises funds from the private sector
• Money aggregated by social impact bond issuing group who also
distributes funds to service providers
• Government pays the issuing agent if the services providers meet
their targets
• Bond issuing organization then repays the private investors, with a
return on their investment
• Sustainable Financing Model
• Reallocating funds to reduce future costs 59

Gears: Need to work in
all areas to move the
infrastructure
Data Systems
Parent, Family and
Community Engagement
Early Learning Standards and
Assessments
Professional
Development
Linkages to K-12 and Other
Services
Financing
Mechanisms
Governance
Regulations
and Program
Quality
60

Gear 4: Governance
• Any effective organization or effort has a clear
and transparent approach to governance
• Non-profit organization
• Fortune 500 company
• Democratic governments
• European Union
• All have different approaches to governance, so
there is no one governance structure that fits all
efforts, all states, or all early childhood systems
61

Gear 4: Governance
• Governance Systems are important because they:
• Provide visibility to the effort/entity
• Via their collective strength and via the personal strength of the members
• Provide the ability to coordinate across structures
• Provide the ability to exert influence and direction
• New governance theory suggests that governance structures can also blend the distance between for-profit and non-profit sectors
62

Gear 4: Governance
• As different as governance efforts can be, they all share the following three characteristics:
• Accountability
• For money and its allocation
• For rule making
• For results
• Authority
• For decision making
• For enforcing rules and decisions
• Durability
• Over time, place, and governmental administrations
63
Gears: Need to work in
all areas to move the
infrastructure
Data Systems
Parent, Family and
Community Engagement
Early Learning Standards and
Assessments
Professional
Development
Linkages to K-12 and Other
Services
Financing
Mechanisms
Governance
Regulations
and Program
Quality
64
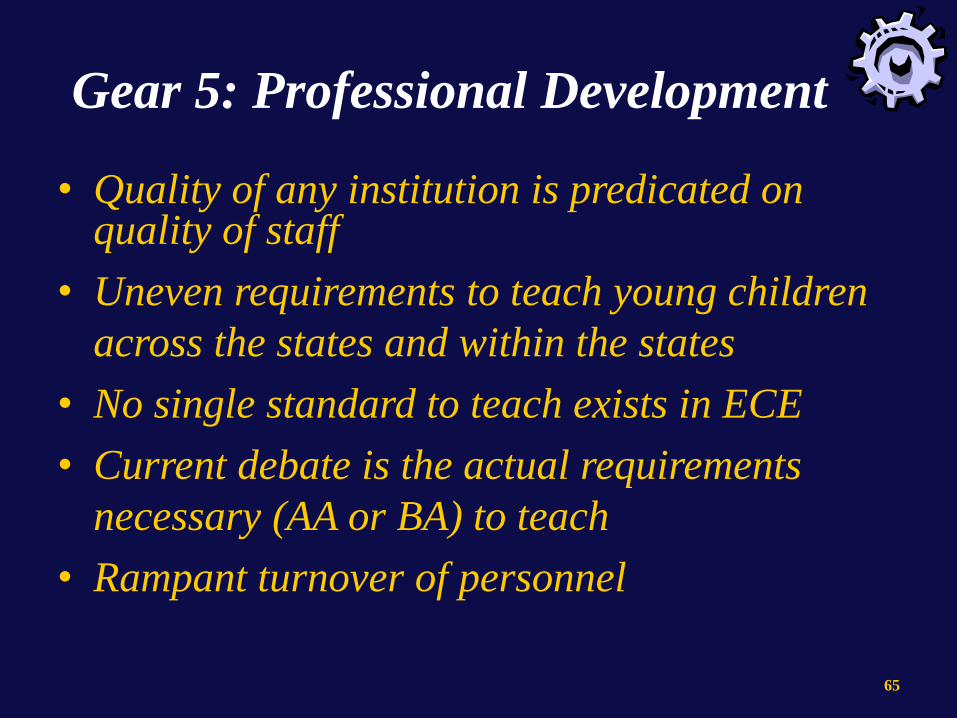
Gear 5: Professional Development
• Quality of any institution is predicated on quality of staff
• Uneven requirements to teach young children
across the states and within the states
• No single standard to teach exists in ECE
• Current debate is the actual requirements
necessary (AA or BA) to teach
• Rampant turnover of personnel
65

A typology of policies and practices:
1. Pre-service Requirements and Training
• Competency or Credit Based
2. In-service Efforts
• One-time Workshops
• Sequenced Trainings Over Time
3. Personalized Training
• Coaching
• Mentoring
• Peer Learning
Tier Two: In-Service
Tier Three: Personalized Training
Tier One: Pre-service
66
Gear 5: Professional Development

Gears: Need to work in
all areas to move the
infrastructure
Data Systems
Parent, Family and
Community Engagement
Early Learning Standards and
Assessments
Professional
Development
Linkages to K-12 and Other
Services
Financing
Mechanisms
Governance
Regulations
and Program
Quality
67

Different Types of Standards Related to School Readiness
68
I. II. III.
IV. V. VI.
Early Learning & Development Family Standards Teacher Standards
Standards
Program/School Access to Services Systemic Effectiveness
Standards Standards Standards
Gear 6: Standards and Assessment

69
Systemic Effectiveness
Standards
Program/School
Standards
Teacher
Standards
Family
Standards
Early Learning &
Development
Standards
Access to Services
Standards

Early Learning &
Development
Standards
Are the Heart of
Readiness
70
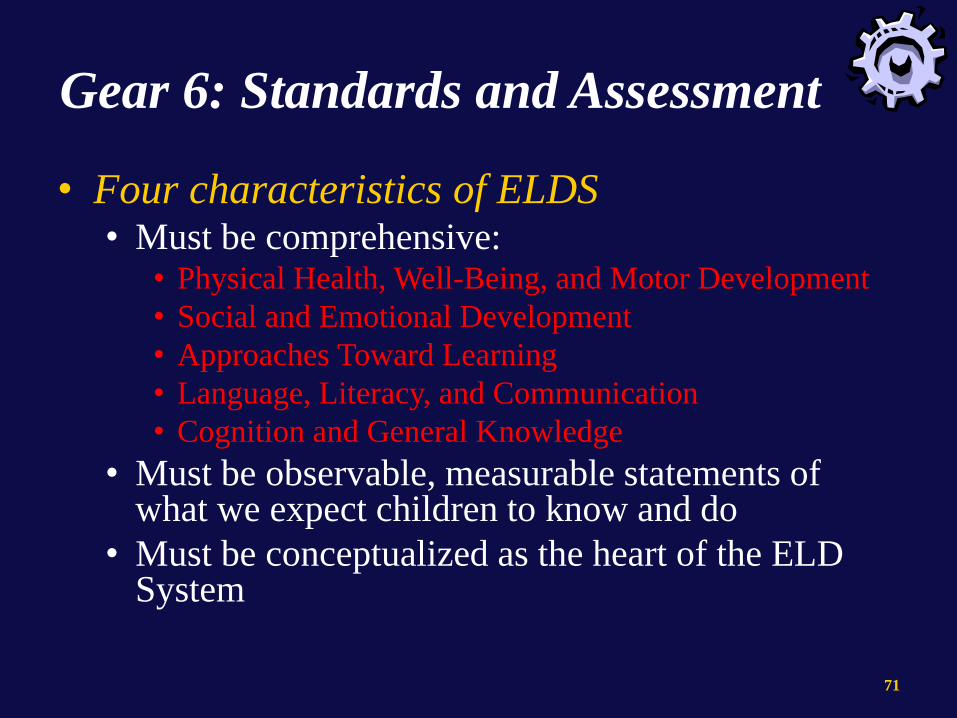
Gear 6: Standards and Assessment
• Four characteristics of ELDS • Must be comprehensive:
• Physical Health, Well-Being, and Motor Development
• Social and Emotional Development
• Approaches Toward Learning
• Language, Literacy, and Communication
• Cognition and General Knowledge
• Must be observable, measurable statements of what we expect children to know and do
• Must be conceptualized as the heart of the ELD System
71

Improve
Instruction
Improve Public
Knowledge of
Children’s
Development
Basis for
QRIS
Improve Parenting
Skills and Behaviors
Improve
Curriculum
Evaluate
Programs and
Monitor National
Progress
Improve Teacher
Preparation
Early Learning &
Development Standards
72
Gear 6: Standards and Assessment

Gears: Need to work in
all areas to move the
infrastructure
Data Systems
Parent, Family and
Community Engagement
Early Learning Standards and
Assessments
Professional
Development
Linkages to K-12 and Other
Services
Financing
Mechanisms
Governance
Regulations
and Program
Quality
73

Gear 7: Parent, Family and
Community Engagement
• Major commitment to family engagement in
• Programs
• Decisions
• Governance
• Helps keep programs responsive to parental needs
• Honors cultural and linguistic variation
• Could build an advocacy base for social change
• Problem is that families “outgrow” ECE and no broad constituency for public support – key benefit of universal preschool
74

Gears: Need to work in
all areas to move the
infrastructure
Data Systems
Parent, Family and
Community Engagement
Early Learning Standards and
Assessments
Professional
Development
Linkages to K-12 and Other
Services
Financing
Mechanisms
Governance
Regulations
and Program
Quality
75

Gear 8: Linkages to K-12 and
Other Services • For decades, research has indicated that it is critical for
preschools to be linked to schools, to promote continuity for children
• Transition activities have focused on:
– Preschool visiting days to kindergarten for children and parents
– Exchange of records from pre-K to K
– Joint training for pre-K and K teachers
– Visits by K teachers to pre-K
• Limited link in looking at how standards, curriculum, and assessments are aligned
Sources: Kagan, S. L., & Neuman, M. J. (1998). Three decades of transition research: What does it tell us? Elementary School Journal, 98(4), 365-380.; Love,
J., Logue, M. E., Trudeau, J., Thayer, K. (1992). Transitions to kindergarten in American schools: Final report of the National Transition Study. Portsmouth,
NH: US Department of Education. 76

Gear 8: Linkages to K-12 and
Other Services • Transitions can be described through three
different alignments:
77
2. Programmatic
Alignment
3.
Policy Alignment
1.
Pedagogical Alignment

Gear 8: Linkages to K-12 and
Other Services
• Alignment Type I: Pedagogical
– Alignment from the perspective of pedagogy and instruction (or aligning what goes on in the instructional interchange and setting)
• Standards and assessment
• Curriculum
• Joint professional development
• Parenting education curriculum
78

Gear 8: Linkages to K-12 and
Other Services
• Alignment Type II: Programmatic
– Alignment from the programmatic perspective goes beyond instruction, encompassing the entire program, including families and communities:
• Community schools initiatives
• Child friendly schools
• Parenting education/family support programs
• Ready schools efforts
• SPARK initiative
• School-based reform initiatives
79

Gear 8: Linkages to K-12 and
Other Services
• Alignment Type III: Policy
– Providing continuity in the policies that impact many programs and many ECD settings:
• Governance
• Establishing joint administrative/ministerial units
• Finance
• Equalizing fiscal investments between early education and K-12 education
• Equalizing compensation and benefits for staff working in pre and primary settings
• Professional Certification
• Requiring comparable certification for all who work with children, birth to age 8
• Equalizing access for preschool children 80

Part V:
Moving Forward:
The System

Moving Forward
I.
Quality and Quantity
II.
Systems, Not Programs
III.
All, Not Some, Ages
IV.
Move Strategically
V.
Plan and
Re-plan
82

Next Step I: Quality and Quantity
• Start thinking quantity and quality.
– Didn’t do this because we’re concerned about providing
equitable access, and it’s easier to garner public dollars, for
poor children.
• Focusing on quantity only is a misdirected
emphasis: Not one study shows any positive
impact, and some show negative impact, of low
quality or mediocre programs.
– Wasting resources and raising false expectations without a
quality emphasis.
83
Next Step II: Systems, Not Programs
• Start Thinking Programs and Infrastructure =
Systems
–Without funding the infrastructure, we are
undermining quality programs and quality
outcomes for all children.
–Without funding programs and
infrastructure, there can be no quality
–SYSTEMS produce QUALITY
84

Next Step III: All, Not Some, Ages
• Start thinking about children from birth to age
8 as a continuum.
– Neuroscience Research: 80% of our brains are formed by
age 3.
– Learning Theorists: Piaget, Montessori, Vygotsky
• Conceptualize services as a continuum for
children not at one age, but from birth to 8—a
system with optional and diverse services.
85
Next Step IV: Move Strategically
• Start focusing on governance and finance
– Imbue it with durability, accountability and authority
– Figure out which agency is responsible for what
• Focus on rewarded professional development
– Across all programs and personnel
• Get standards right
– Innovate and respect the child
86

Next Step V: Plan and Re-plan
• Develop a collaborative and operationally realistic plan for all children – Vision the ideal
– Vision for policy, practice, and research
– Start when children are very young
– Plan for the long-term
– Build in regular review of the plan.
87

88

The Summer Day
Adapted from Mary Oliver
Who made the world?
Who made the swan, and the black bear?
Who made the grasshopper?
The one who has flung herself out of the grass,
the one who is eating sugar out of my hand,
who is moving her jaws back and forth instead of up
and down—
who snaps her wings open, and floats away.
I don’t know how to fly, to be idle and blessed, to
be self-sufficient and contribute.
Tell me, what else should I do?
Tell me, what is it your plan to do
with your one wild and precious life?
89

Considering Why and What
• We and children are given one life on earth, and are .
compelled to use it wisely and well.
• We are obligated to care for those we love and those who are vulnerable.
• We know that caring for the young is not a choice; it is their right and our responsibility.
• Individually, we do think large and long-term for our own children (we dream big dreams for them): this conversation asks us to dream not for one child or one program, but for a systemic policy that yields those dreams for all young children.
90