LSHTM Research Onlineresearchonline.lshtm.ac.uk/4648276/1/Global Tuberculosis Targets_GREEN...
24
LSHTM Research Online Floyd, K; Glaziou, P; Houben, RMGJ; Sumner, T; White, RG; Raviglione, M; (2018) Global tuberculosis targets and milestones set for 2016-2035: definition and rationale. The interna- tional journal of tuberculosis and lung disease, 22 (7). pp. 723-730. ISSN 1027-3719 DOI: https://doi.org/10.5588/ijtld.17.0835 Downloaded from: http://researchonline.lshtm.ac.uk/4648276/ DOI: https://doi.org/10.5588/ijtld.17.0835 Usage Guidelines: Please refer to usage guidelines at https://researchonline.lshtm.ac.uk/policies.html or alternatively contact [email protected]. Available under license: http://creativecommons.org/licenses/by-nc-nd/2.5/ https://researchonline.lshtm.ac.uk
-
Upload
trinhxuyen -
Category
Documents
-
view
223 -
download
0
Transcript of LSHTM Research Onlineresearchonline.lshtm.ac.uk/4648276/1/Global Tuberculosis Targets_GREEN...
LSHTM Research Online
Floyd, K; Glaziou, P; Houben, RMGJ; Sumner, T; White, RG; Raviglione, M; (2018) Globaltuberculosis targets and milestones set for 2016-2035: definition and rationale. The interna-tional journal of tuberculosis and lung disease, 22 (7). pp. 723-730. ISSN 1027-3719 DOI:https://doi.org/10.5588/ijtld.17.0835
Downloaded from: http://researchonline.lshtm.ac.uk/4648276/
DOI: https://doi.org/10.5588/ijtld.17.0835
Usage Guidelines:
Please refer to usage guidelines at https://researchonline.lshtm.ac.uk/policies.html or alternativelycontact [email protected].
Available under license: http://creativecommons.org/licenses/by-nc-nd/2.5/
https://researchonline.lshtm.ac.uk

1
Global Tuberculosis Targets and Milestones set
for 2016‒2035: Definition and Rationale
Katherine Floyd, Philippe Glaziou, Rein Houben, Tom Sumner, Richard White,
Mario Raviglione
Affiliations
Katherine Floyd: Global Tuberculosis Programme, World Health Organization, Geneva,
Switzerland
Philippe Glaziou: Global Tuberculosis Programme, World Health Organization, Geneva,
Switzerland
Rein Houben: Department of Infectious Disease Epidemiology, London School of Hygiene and
Tropical Medicine, London, UK
Tom Sumner: Department of Infectious Disease Epidemiology, London School of Hygiene and
Tropical Medicine, London, UK
Richard White: Department of Infectious Disease Epidemiology, London School of Hygiene and
Tropical Medicine, London, UK
Mario Raviglione: Global Tuberculosis Programme, World Health Organization, Geneva,
Switzerland
Corresponding Author: Tom Sumner, London School of Hygiene and Tropical Medicine,
Keppel Street, London, UK. [email protected]
Running head: Defining the 2016-2035 global tuberculosis targets
Summary: 199 words
Main text: 2420
Figures: 7
Tables: 2
References: 28
2
Summary 1
2
Background 3
Global tuberculosis (TB) targets were set as part of WHO’s End TB Strategy (2016‒2035) and 4
the Sustainable Development Goals (2016–2030). 5
6
Objective 7
To define and explain the rationale for these targets. 8
9
Design 10
Scenarios for plausible reductions in TB deaths and cases were developed using empirical 11
evidence from best-performing countries and modelling of the scale-up of under-used 12
interventions and hypothetical TB vaccines. Results were discussed at consultations in 2012 and 13
2013. A final proposal was presented to the World Health Assembly in 2014 and unanimously 14
endorsed by all Member States. 15
16
Results 17
The 2030 targets are a 90% reduction in TB deaths and 80% reduction in TB incidence, 18
compared with 2015 levels. The 2035 targets are for reductions of 95% and 90%, respectively. A 19
third target - that no TB-affected households experience catastrophic costs due to the disease by 20
2020 - was also agreed. 21
22
Conclusion 23
The global TB targets and milestones are ambitious. Achieving them requires concerted action on 24
many fronts, but two things are fundamental: progress towards universal health coverage, so that 25
everyone with TB can access high-quality treatment; substantial investment in research and 26
development for new tools to prevent TB disease among the approximately 1.7 billion people 27
infected. 28
29
3
Introduction 30
31
At the turn of the 21st-century, the United Nations (UN) established 8 Millennium Development 32
Goals (MDGs) and associated targets for 2015. These were endorsed by all countries and became 33
the focus of national and international development efforts (www.un.org/millenniumgoals). 34
Within this framework, three targets for reductions in the burden of disease caused by 35
tuberculosis (TB) were set: incidence should be falling by 2015, and prevalence and mortality 36
rates should be halved by 2015 compared with 1990 levels. WHO’s Stop TB Strategy, 37
2006−2015, was designed to achieve these targets.1 WHO published its assessment of whether 38
the targets were achieved in its 2015 global TB report; incidence was estimated to have been 39
falling at an average of 1.5% per year since 2000, and prevalence and mortality rates were 40
assessed to have fallen by 47% and 42% respectively compared with 1990.2 41
42
Work on post-2015 UN goals and targets began in 2012 and 17 Sustainable Development Goals 43
(SDGs) for 2030 were agreed in September 2015.3 One of the SDGs is to “Ensure healthy lives 44
and promote well-being for all at all ages”, under which a target is to “End the epidemics of 45
AIDS, TB, malaria and neglected tropical diseases, and combat hepatitis, water-borne diseases 46
and other communicable diseases”. Within this context, WHO initiated the development of a 47
post-2015 global TB strategy and targets in 2012. 48
49
Following two years of consultations, the new strategy, now known as the End TB Strategy and 50
covering the period 2016–2035, was endorsed by the World Health Assembly in 2014.4, 5 The 51
overall goal is to “End the global TB epidemic”, and ambitious targets for reductions in TB 52
deaths and cases are set for 2030 (the SDG end date) and 2035. This paper defines and explains 53
the rationale for these targets and associated milestones set for 2020 and 2025. 54
4
Methods 55
56
Target setting was underpinned by seven principles (Table 1) consistent with those used in the 57
SDGs.6 58
59
The number of TB deaths and the TB incidence rate (new cases per 100 000 population) were 60
selected as the two most important indicators for which targets should be set. 61
62
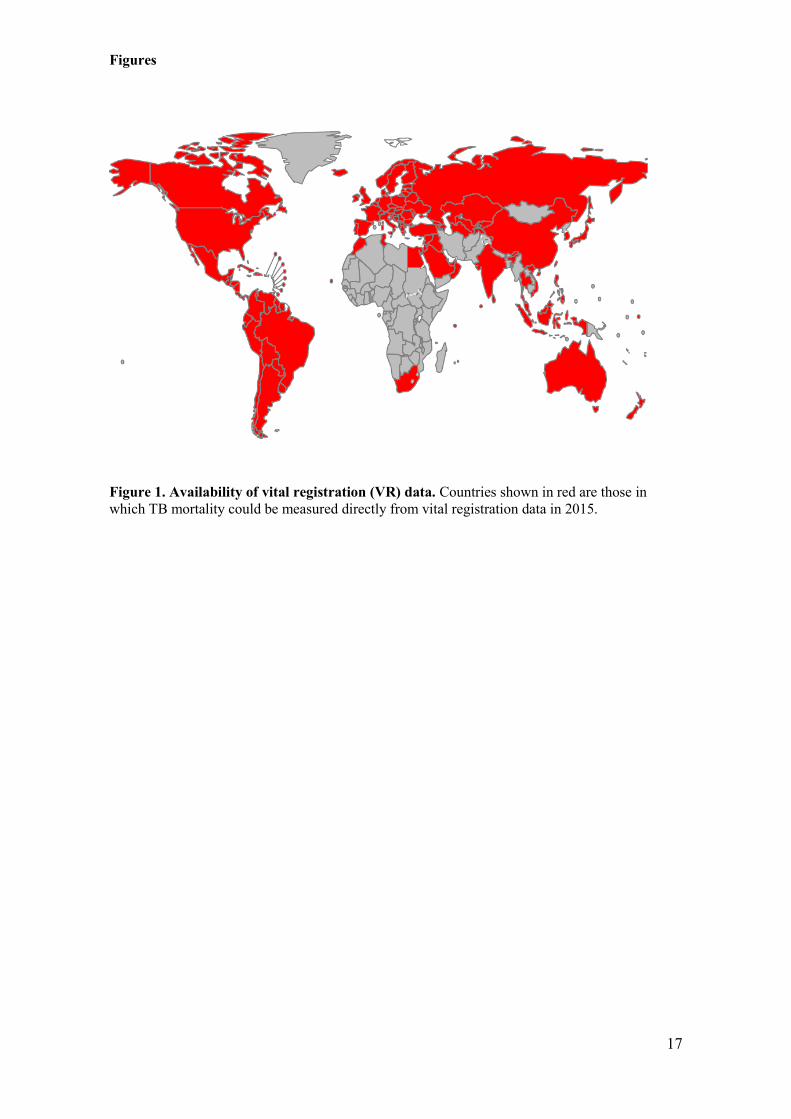
The number of TB deaths is directly measurable at country-level via national vital registration 63
systems in which causes of death are recorded using standard international coding systems; 128 64
countries had such systems in 2015 (Figure 1) and they could be introduced elsewhere. Targets 65
for reductions in TB deaths can be more ambitious than those for TB cases, since mortality can 66
fall faster than disease incidence if both incidence and the proportion of TB cases who die from 67
the disease (case fatality ratio, CFR) are falling. Reductions in TB deaths can also be linked to 68
equity: whatever the number of cases, all countries can aim to reach the same low CFR based on 69
universal health coverage (UHC) i.e. access for all to essential preventive and treatment health 70
care interventions, with financial protection.7, 8 71
72
TB incidence was selected as an indicator for measuring reductions in the number of cases of TB 73
disease. Although incidence was estimated with considerable uncertainty in most countries in the 74
MDG era,2 notifications of TB cases to national authorities provide a good proxy if there is 75
limited under-reporting of detected cases, limited under-diagnosis and limited misdiagnosis. 76
Under-reporting, under-diagnosis and misdiagnosis can be addressed by strengthening national 77
surveillance and health systems. The alternative indicator of TB prevalence was considered 78
unsuitable because it will not be measured directly in most countries after 2015. As TB disease 79
falls, the sample sizes required for national prevalence surveys become prohibitively expensive 80
and logistically challenging.9 81
82
5
To define plausible scenarios for the reductions in TB deaths and incidence that could be 83
achieved between 2015 and 2035, two periods were considered: 2015−2025 and 2026-2035. The 84
status of the pipelines for new TB diagnostics, drugs and vaccines suggested that no major 85
breakthroughs will occur during this first period.2 A new TB vaccine or equivalent treatment for 86
latent TB infection could become available in the second period. 87
88
Reductions in TB deaths are driven by two factors: the annual rate at which TB incidence falls; 89
and changes in the CFR. Illustrative scenarios for the reductions in TB deaths that could be 90
achieved by 2025 were constructed for different combinations of these variables, allowing for 91
projected growth in population.10 The assumed trajectories for changes in the incidence rate and 92
the CFR are shown in Figure 2. 93
94
A “plausibility zone” for targets was defined based on historic evidence about the speed at which 95
the TB incidence rate can fall and the lowest levels of the CFR observed in settings where the 96
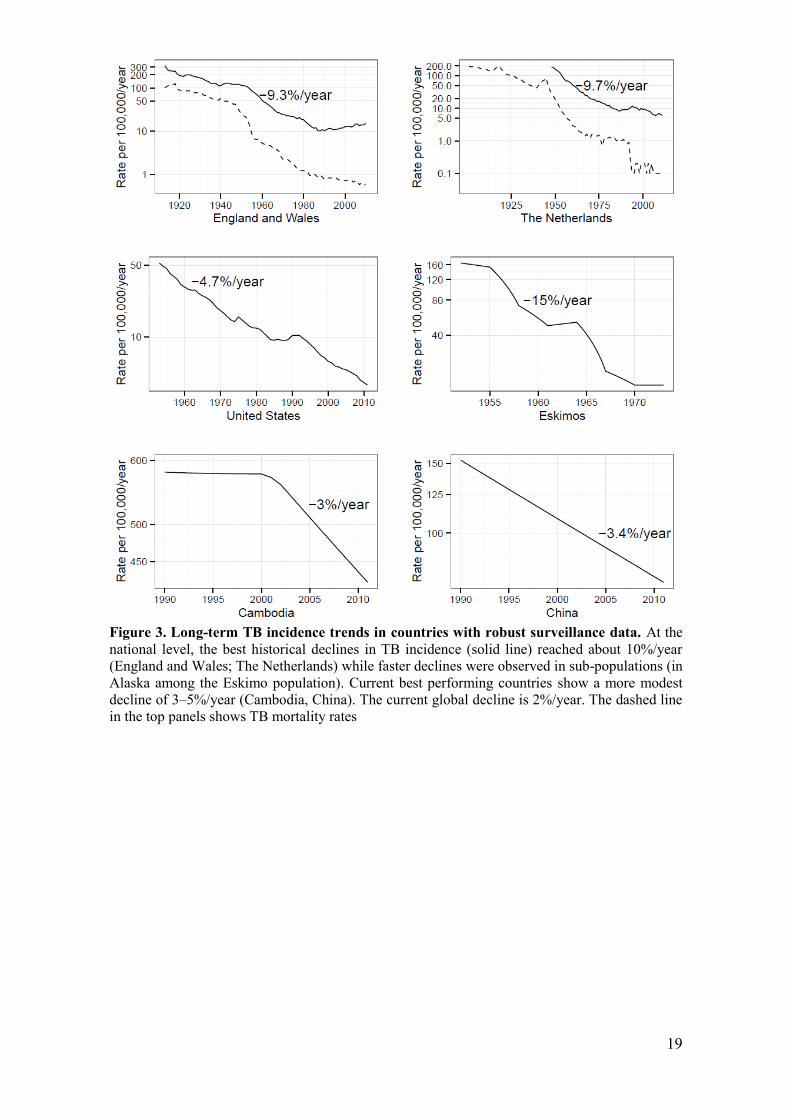
coverage and quality of TB treatment are high. The limit for the decline in incidence was set at 97
10% per year. This is the best-ever performance historically at national level, achieved between 98
the 1950s and 1970s in parts of Western Europe (Figure 3) in the context of rapid socio-economic 99
development, UHC and the introduction of chemotherapy.11 Faster declines have only been 100
documented in the 1950s and 1960s, in subpopulations with incidence rates ten times the 2015 101
global average.12,13 The global CFR limit was defined as 6.5%, the 2013–2014 average in high-102
income countries. 103
104
The “plausibility zone” reflected historic performance without allowing for the possibility of a 105
hypothetical scale-up of two interventions: mass screening for TB infection and disease followed 106
by treatment for disease and isoniazid preventive therapy (IPT) (hereafter MST). In the MDG era, 107
such mass campaigns were very limited but were considered to explore the potential reductions in 108
TB burden that could be achieved. The potential impact of MST was explored using a simple 109
dynamic transmission model similar in structure to other published models.14, 15 The negative 110

6
consequences of MST (number of false-positive individuals treated for infection or disease and 111
deaths associated with the side-effects of IPT) were also quantified (see appendix). 112
113
For 2026−2035, further modelling was undertaken to explore the impact of a technological 114
breakthrough. For practical purposes, the analysis focused on the potential impact of a new 115
vaccine with 60% efficacy, introduced in 2025, providing protection for at least 10 years and 116
achievement of 90% effective coverage by 2035 (see appendix). 117
118
Global consultations were held to inform the development of the End TB Strategy in 2012 and 119
2013, of which two were especially important. The first, in February 2013, considered the 120
analyses described above to reach consensus on targets/milestones for 2025.16 The second, in 121
June 2013, considered the recommendations of the February 2013 consultation, results of the 122
modelling work up to 2035 and associated target proposals for 2030 and 2035 that would 123
correspond to the goal of ending the global TB epidemic.17 124
125
No ethical approval was required for this work. 126

7
Results 127
128
The combinations of reductions in TB incidence and the CFR that would be required for 129
reductions in TB deaths ranging from 50% to 90% by 2025 (compared with 2015) are shown in 130
Figure 4. The “plausibility zone” for targets that could be reached by 2025 is shown in green. If 131
recent trends continued (bottom right corner) the number of TB deaths would fall by about 18% 132
between 2015 and 2025. In the most optimistic scenario in which incidence is falling at 10% per 133
year by 2025 and the CFR falls to 6.5% (red dot), a 75% reduction in the number of TB deaths 134
would be achieved. 135
136
The dynamic model suggested that with a background of a 2% annual decline in TB incidence 137
and a CFR of 16% combined with the MST intervention, the number of TB deaths could fall 22–138
65% by 2025 (Figure 5). With the most optimistic background scenario (CFR 6.5%; annual 139
incidence decline 10%/yr by 2025), the incremental impact of the MST intervention would be 140
lower and the total number of TB deaths could fall 77–90% by 2025 (Figure 6). MST may also 141
result in considerable undesirable effects and over-treatment, with 81‒93% of those provided 142
with TB treatment not having TB. 143
144
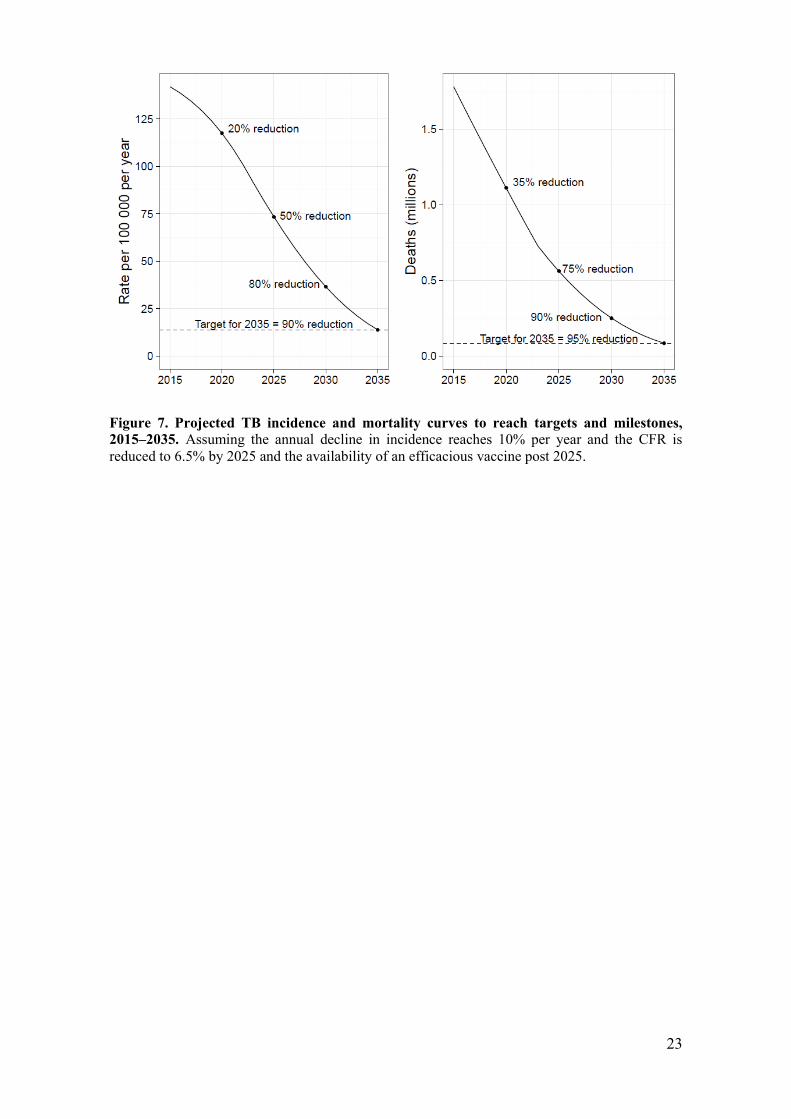
Median trajectories for declines in TB deaths and incidence that could be achieved by 2035, 145
assuming a technological breakthrough (i.e. vaccine) by 2025 building on a 75% reduction in TB 146
deaths between 2015 and 2025, are shown in Figure 7. An incidence rate of around 14 per 147
100,000 population (comparable to levels found in countries considered to have a low burden of 148
TB in recent years) and a reduction in TB deaths of around 95% could be achieved by 2035. 149
150
In February 2013, agreement was reached on two targets for 2025: a 75% reduction in TB deaths 151
and a 50% reduction in TB incidence, compared with 2015 levels. Such reductions, and in 152
particular the underlying requirement that the CFR should fall to 6.5% by 2025, implicitly require 153
that all people with TB are able to access diagnosis and treatment, i.e. UHC is in place. A third 154
high-level target linked to UHC was therefore proposed: by 2020, no TB-affected households 155

8
should suffer catastrophic costs as a result of TB. In June 2013, following extension of the 156
modelling work described above, the targets proposed for 2025 were rephrased as milestones, 157
and 2030 and 2035 targets corresponding to the end dates of the SDGs and End TB Strategy were 158
proposed (Table 2). The targets and milestones shown in Table 2 were endorsed by all 194 159
Member States at the 2014 World Health Assembly.4, 5 160

9
Discussion 161
162
The global TB targets and associated milestones set within WHO’s End TB Strategy call for a 90% 163
reduction in TB deaths by 2030 (compared with 2015) and a 95% reduction by 2035, with 164
corresponding reductions of 80% and 90% respectively in the TB incidence rate. By 2025, TB 165
deaths should be reduced by 75%, and by 2020 no TB patients and their households should face 166
catastrophic costs due to TB. 167
168
The targets are ambitious but within the limits of plausibility and are consistent with the SDG 169
targets for 2030 of ending the epidemics of major infectious diseases, including TB, and 170
achieving UHC. Comparable targets have also been set in the post-2015 strategies for HIV and 171
malaria: a 90% reduction in the malaria death rate by 2030 compared with 2015 and a 90% 172
reduction in AIDS deaths by 2030 compared with 2010. The TB targets are measurable and 173
promote equity, requiring that all people who develop TB have the same high chance of receiving 174
appropriate care and the same low chance of dying from the disease. They are also consensus-175
based, having earned unanimous endorsement by UN Member States at the 2014 World Health 176
Assembly and wide buy-in from funding agencies, technical partners and civil society. 177
178
The technical work that informed the target setting is grounded in empirical evidence about the 179
two key variables that can drive reductions in TB burden: the annual rate at which it is possible to 180
reduce TB incidence, and the proportion of cases that die from TB when there is universal access 181
to high-quality diagnosis and treatment. They were also based on up-to-date information about 182
the development pipelines for new TB diagnostics, drugs and vaccines, with post-2025 183
projections allowing for technological breakthroughs that could occur within a decade, and 184
greater use of currently under-used interventions. 185
186
To reach the targets, progress is required on many fronts5 but two things are fundamental. First, 187
UHC for essential health care services including detection and treatment of TB must be achieved 188
by 2025. The 2025 milestone of reducing TB deaths by 75% requires cutting the CFR to 6.5% 189
10
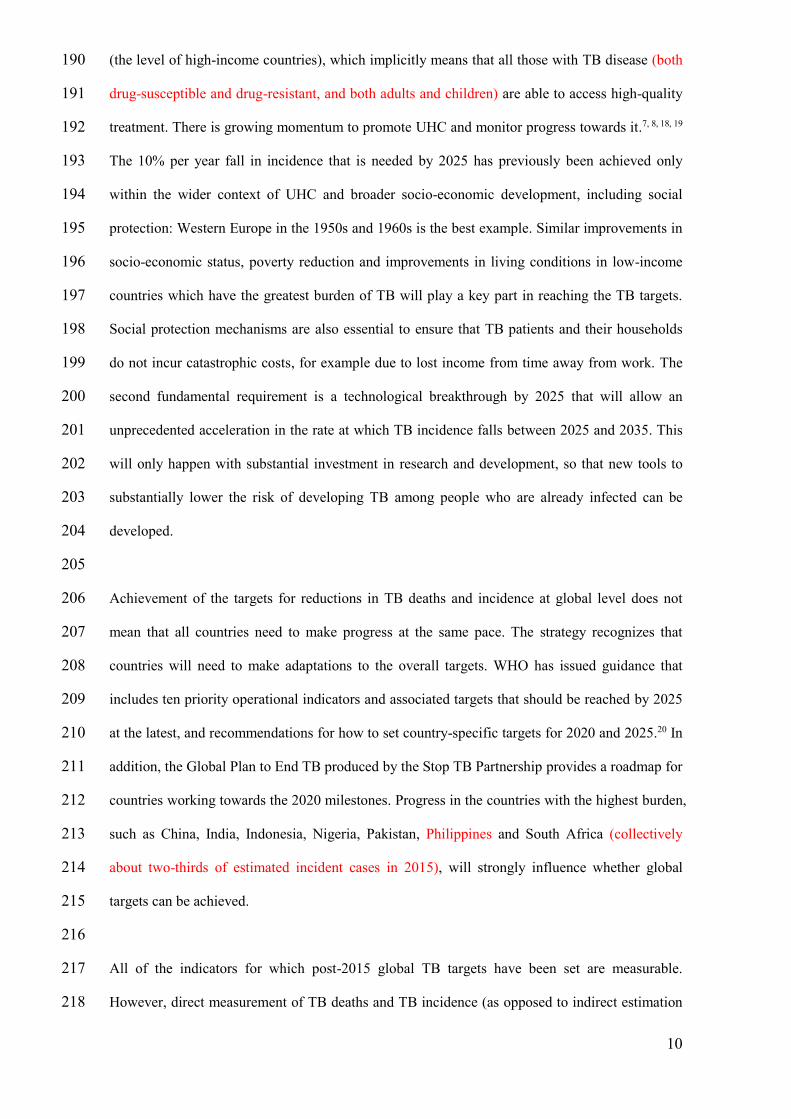
(the level of high-income countries), which implicitly means that all those with TB disease (both 190
drug-susceptible and drug-resistant, and both adults and children) are able to access high-quality 191
treatment. There is growing momentum to promote UHC and monitor progress towards it.7, 8, 18, 19 192
The 10% per year fall in incidence that is needed by 2025 has previously been achieved only 193
within the wider context of UHC and broader socio-economic development, including social 194
protection: Western Europe in the 1950s and 1960s is the best example. Similar improvements in 195
socio-economic status, poverty reduction and improvements in living conditions in low-income 196
countries which have the greatest burden of TB will play a key part in reaching the TB targets. 197
Social protection mechanisms are also essential to ensure that TB patients and their households 198
do not incur catastrophic costs, for example due to lost income from time away from work. The 199
second fundamental requirement is a technological breakthrough by 2025 that will allow an 200
unprecedented acceleration in the rate at which TB incidence falls between 2025 and 2035. This 201
will only happen with substantial investment in research and development, so that new tools to 202
substantially lower the risk of developing TB among people who are already infected can be 203
developed. 204
205
Achievement of the targets for reductions in TB deaths and incidence at global level does not 206
mean that all countries need to make progress at the same pace. The strategy recognizes that 207
countries will need to make adaptations to the overall targets. WHO has issued guidance that 208
includes ten priority operational indicators and associated targets that should be reached by 2025 209
at the latest, and recommendations for how to set country-specific targets for 2020 and 2025.20 In 210
addition, the Global Plan to End TB produced by the Stop TB Partnership provides a roadmap for 211
countries working towards the 2020 milestones. Progress in the countries with the highest burden, 212
such as China, India, Indonesia, Nigeria, Pakistan, Philippines and South Africa (collectively 213
about two-thirds of estimated incident cases in 2015), will strongly influence whether global 214
targets can be achieved. 215
216
All of the indicators for which post-2015 global TB targets have been set are measurable. 217
However, direct measurement of TB deaths and TB incidence (as opposed to indirect estimation 218

11
reliant on modelling and expert opinion) will require strengthening of routine information 219
systems in many countries. Guidance exists on how to assess the capacity of national notification 220
and vital registration systems to provide direct measurements of TB cases and deaths, 221
respectively, and to use results to close identified gaps.21 Guidance on the measurement of 222
catastrophic costs using special surveys has been developed.22 WHO and the World Bank plan to 223
issue an annual report on progress towards UHC from 2015 onwards.19 Strengthening health 224
information systems, in particular civil and vital registration systems, is already a prominent part 225
of the post-2015 health agenda.23 226
227
The 2035 targets set within the End TB Strategy define the end of the global TB epidemic. 228
Following endorsement by all UN Member States at the World Health Assembly, intensified 229
action at national and global levels to operationalize the strategy is imperative. 230
12
Author contributions 231
KF led the writing of the paper, and revised the text based on input from all other authors. PG led 232
the analytical work related to projections of reductions in TB cases and deaths between 2016 and 233
2025, with contributions from all other authors. RW, RH and TS led the modelling work required 234
to assess plausible reductions in TB cases and deaths between 2026 and 2035. TS wrote the 235
technical appendix. All authors agreed on the final version of the paper. All authors participated 236
in global and regional consultations at which post-2015 global TB targets were discussed. 237
238
Funding statement 239
There was no specific grant or source of funding for this work. No funder had any role in study 240
design, data collection and analysis, decision to publish or preparation of the manuscript. 241
242
Competing interests 243
None of the authors have any competing interests to declare in relation to this work. 244
13
References
1. Raviglione MC, Uplekar MW. WHO's new Stop TB Strategy. Lancet. 2006 Mar
18;367(9514):952-5. PubMed PMID: 16546550. Epub 2006/03/21.
2. World Health Organisation. Global Tuberculosis Report 2014. Geneva: World
Health Organisation, 2014.
3. United Nations. Sustainable Development Goals [17-April-2015]. Available
from: https://sustainabledevelopment.un.org/topics/sustainabledevelopmentgoals.
4. World Health Assembly. Post-2015 Global TB Strategy and Targets (A67/62).
Geneva: 2014.
5. Uplekar M, Weil D, Lonnroth K, Jaramillo E, Lienhardt C, Dias HM, et al.
WHO's new End TB Strategy. Lancet. 2015 May 2;385:1799-801. PubMed PMID:
25814376.
6. United Nations. Report of the secretary-general’s high-level panel of eminent
persons on the post-2015 development agenda - Available at
http://www.un.org/sg/management/beyond2015.shtml. 2013.
7. World Health Organisation, World Bank group. Monitoring progress towards
universal health coverage at country and global levels. Framework, measures and targets.
May 2014. 2014 WHO/HIS/HIA/14.1.
8. World Health Organisation. The World Health Report 2010. Health systems
financing: the path to universal coverage. Geneva: 2010.
9. World Health Organisation. Tuberculosis prevalence surveys: a handbook. 2nd
Edition ed. Geneva: WHO; 2011.
10. United Nations Population Division. World Population Prospects, the 2010
Revision. New York: United Nations, 2011.
11. Styblo K, Meijer J, Sutherland I. [The transmission of tubercle bacilli: its trend in
a human population]. Bull World Health Organ. 1969;41:137-78. PubMed PMID:
5309081. La transmission du bacille tuberculeux: son evolution au sein d'une collectivite
humaine.
12. Enarson DA, Grzybowski S. Incidence of active tuberculosis in the native
population of Canada. CMAJ : Canadian Medical Association journal = journal de
l'Association medicale canadienne. 1986 May 15;134:1149-52. PubMed PMID: 3697860.
13. Grzybowski S, Styblo K, Dorken E. Tuberculosis in Eskimos. Tubercle. 1976
Dec;57:S1-58. PubMed PMID: 797076.
14. Blower SM, McLean AR, Porco TC, Small PM, Hopewell PC, Sanchez MA, et al.
The intrinsic transmission dynamics of tuberculosis epidemics. Nat Med. 1995
Aug;1(8):815-21. PubMed PMID: 7585186. Epub 1995/08/01. eng.
15. Dye C, Garnett GP, Sleeman K, Williams BG. Prospects for worldwide
tuberculosis control under the WHO DOTS strategy. Directly observed short-course
therapy. Lancet. 1998 Dec 12;352(9144):1886-91. PubMed PMID: 9863786. Epub
1998/12/24. eng.
16. Raviglione MC, Ditiu L. Setting new targets in the fight against tuberculosis.
Nature medicine. 2013 Mar;19(3):263. PubMed PMID: 23467231. Epub 2013/03/08. eng.
17. World Health Organisation. Strategic and Technical Advisory Group for
Tuberculosis (STAG-TB). Report of the 13th meeting (11−12 June 2013, available at
http://www.who.int/tb/advisory_bodies/STAG_report2013.pdf?ua=1). Geneva: 2013.
18. Latko B, Temporao JG, Frenk J, Evans TG, Chen LC, Pablos-Mendez A, et al.
The growing movement for universal health coverage. Lancet. 2011 Jun 25;377:2161-3.
PubMed PMID: 21084114.
19. World Health Organisation, World Bank group. Tracking Universal Health
Coverage: first global monitoring report. (In preparation). 2015.
20. World Health Organisation. The End TB Strategy: The essentials of
implementation. Geneva: WHO, 2015 (In preparation).

14
21. World Health Organisation. Standards and benchmarks for tuberculosis
surveillance and vital registration systems. Checklist and user guide. Geneva: WHO,
2014 Contract No.: WHO/HTM/TB/2014.2.
22. World Health Organisation. Protocol for survey to estimate proportion of TB
patients experiencing catastrophic costs. Geneva: 2015 (in preparation).
23. Ma4Health. The Roadmap for Health Measurement and Accountability.
2015;2015.

15
Tables
Table 1: Principles to underpin post-2015 global TB targets
Measurability It must be possible to measure progress towards targets at country level and, in
turn, globally. Targets based on indicators that cannot be measured (or
measured very imprecisely) can become subject to debate and dispute, and it is
not possible to assess definitively whether they are achieved.
Ambition Targets should be ambitious and translate into tangible results (such as lives
saved), to energise and catalyse greater global and national efforts in TB
prevention, care and control.
Feasibility Targets should be achievable based on current and historical evidence, as well
as new developments such as technological breakthroughs that could be
achieved before the target date. The UN high-level panel cautioned against
goals and targets that are “insufficiently stretching – business as usual”.
Wide relevance Targets need to be relevant to many countries as well as globally.
Wide context Targets should be consistent with the wider development agenda.
Equity Targets should be set with consideration of equity, such that all individuals at
risk of experiencing active TB disease should have access to high-quality
health services.
Consensus Targets need to be capable of earning broad buy-in and support including from
the TB community (e.g. national TB programmes, technical partners, civil
society organizations, non-governmental organizations, financial partners,
nongovernmental organizations) and endorsement by Member States at the
World Health Assembly.
16
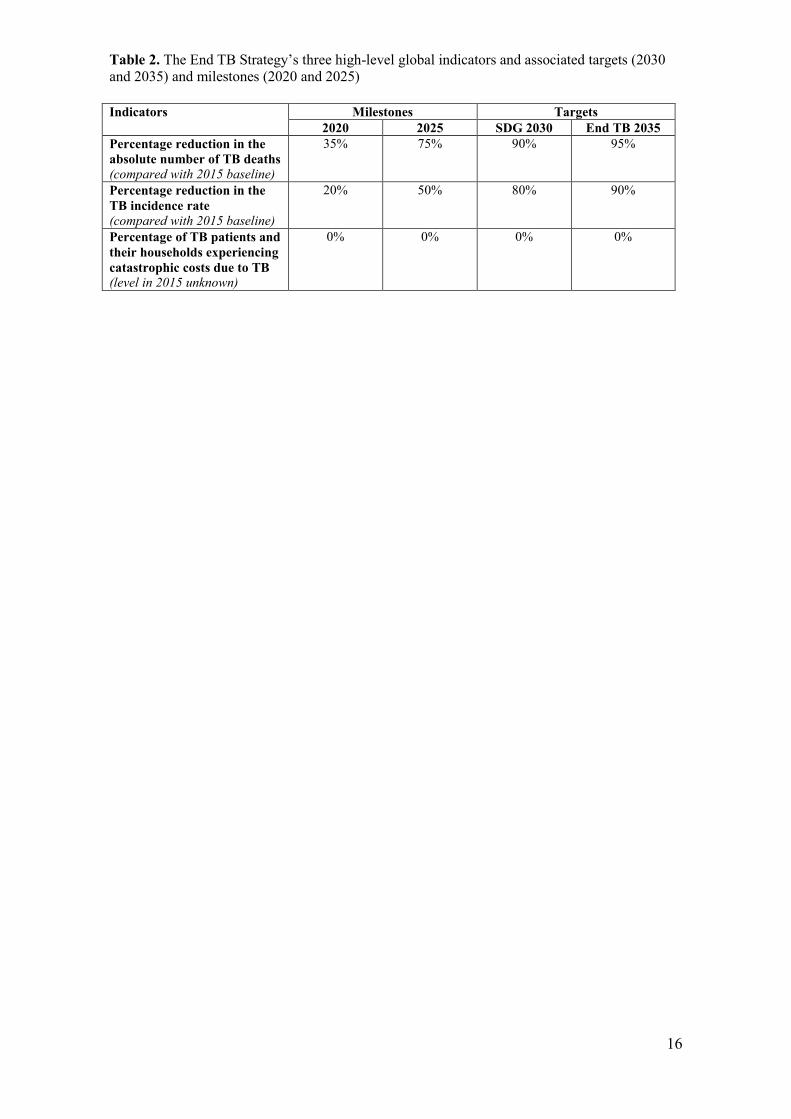
Table 2. The End TB Strategy’s three high-level global indicators and associated targets (2030
and 2035) and milestones (2020 and 2025)
Indicators Milestones Targets
2020 2025 SDG 2030 End TB 2035
Percentage reduction in the
absolute number of TB deaths
(compared with 2015 baseline)
35% 75% 90% 95%
Percentage reduction in the
TB incidence rate
(compared with 2015 baseline)
20%
50%
80%
90%
Percentage of TB patients and
their households experiencing
catastrophic costs due to TB
(level in 2015 unknown)
0% 0% 0% 0%
17
Figures
Figure 1. Availability of vital registration (VR) data. Countries shown in red are those in
which TB mortality could be measured directly from vital registration data in 2015.

18
Figure 2. Assumed change in the TB incidence rate (annual rate of decline) and the case
fatality ratio (CFR), 2015–2025. The trajectory assumes that the effect of progress towards
universal health coverage (and implementation of new diagnostics and drugs currently in the
pipeline) intensifies around 2020 and achieves the full potential by 2025. To achieve further
improvements, new tools such as a post-exposure vaccine would be required.
2
4
6
8
10
2015 2018 2020 2022 2025
Declin
e in incid
ence r
ate
per
year
(%)
8
10
12
14
16
2015 2018 2020 2022 2025
CF
R (
%)
19
Figure 3. Long-term TB incidence trends in countries with robust surveillance data. At the
national level, the best historical declines in TB incidence (solid line) reached about 10%/year
(England and Wales; The Netherlands) while faster declines were observed in sub-populations (in
Alaska among the Eskimo population). Current best performing countries show a more modest
decline of 3–5%/year (Cambodia, China). The current global decline is 2%/year. The dashed line
in the top panels shows TB mortality rates

20
Figure 4. Scenarios for reductions in TB deaths that could be achieved by 2025, and
associated “target zone”. Contours show combinations of annual percentage percentgae decline
in incidence in 2025 (y-axis) and case fataltiy ratio (CFR) in 2025 required to produce the
corresponding reductions in TB deaths. For example (dashed lines), a 90% reduction in the
number of tuberculosis deaths (to 130 000 by 2025) could be achieved if tuberculosis incidence
was falling at 30% per year by 2025 and the CFR was reduced to 7.5% by 2025. The green
rectangle illustrates the plausible zone based on previously observed declines and the average
CFR in high income countries. The red circle marks the most ambitious scenario within the
plausible zone.
90%
80%
70%
60%
50%

21
Figure 5. Trends and reductions in TB incidence and mortality as a result of a theoretical
expansion of screening and treatment for active TB disease and latent TB infection (MST) –
2% background decline scenario. Left panels show the trends in TB incidence (top) and
mortality (bottom) assuming the background decline in TB incidence remains at 2% and the CFR
at 16%. Black lines show the WHO estimated incidence, dashed lines show the median model
output and shaded areas 95% credible intervals (all values are relative to the 2015 estimated
incidence). Right panels show the percentage reduction in incidence (top) and mortality (bottom)
compared to 2015. Four different scenarios are considered: no MST (Baseline); 5% of population
screened per year, 10% completion of INH (High); 10% screened, 50% completion (Higher); 20%
screened, 90% completion (Highest).

22
Figure 6. Trends and reductions in TB incidence and mortality as a result of a theoretical
expansion of screening and treatment for active TB disease and latent TB infection (MST) –
10% background decline scenario. Left panels show trends and right panels percentage
reductions in incidence (top) and mortality (bottom) assuming the decline in incidence increases
to 10% and the CFR falls to 6.5% by 2025 (see figure 5 for additional details).
23
Figure 7. Projected TB incidence and mortality curves to reach targets and milestones,
2015–2035. Assuming the annual decline in incidence reaches 10% per year and the CFR is
reduced to 6.5% by 2025 and the availability of an efficacious vaccine post 2025.