Olivier Blanchard November 2017 - PIIE · Olivier Blanchard November 2017 Abstract Fifty years ago,...
37
WORKING PAPER 1750 Massachusetts Avenue, NW | Washington, DC 20036-1903 USA | 202.328.9000 Tel | 202.328.5432 Fax | www.piie.com 17-14 Should We Reject the Natural Rate Hypothesis? Olivier Blanchard November 2017 Abstract Fifty years ago, Milton Friedman articulated the natural rate hypothesis. It was composed of two sub-hypotheses: First, the natural rate of unemployment is independent of monetary policy. Second, there is no long-run tradeoff between the deviation of unemployment from the natural rate and inflation. Both propositions have been challenged. This paper reviews the arguments and the macro and micro evidence against each. It concludes that, in each case, the evidence is suggestive but not conclusive. Policymakers should keep the natural rate hypothesis as their null hypothesis but keep an open mind and put some weight on the alternatives. JEL Codes: E10, E2, E32 Keywords: Unemployment, Hysteresis, Inflation, Phillips Curve, Fluctuations Olivier Blanchard is the C. Fred Bergsten Senior Fellow at the Peterson Institute for International Economics and the Robert M. Solow Professor of Economics emeritus at MIT. He was economic counselor and director of the Research Department at the International Monetary Fund. Author’s Note: This paper was prepared for the Journal of Economic Perspectives. I thank the editors for their sugges- tions; Larry Summers for many discussions; David Autor, David Cho, Jordi Gali, Egor Gornostay, Alan Krueger, and Mathias Trabandt for data and help; Marios Angeletos, Larry Ball, Olivier Coibion, Nicola Gennaioli, and Robert Solow for comments; and Julien Acalin, Thomas Pellet, and Colombe Ladreit for excellent research assistance. An appendix with methodological details and further results is available at http://bit.ly/2zDggjY. © Peterson Institute for International Economics. All rights reserved. This publication has been subjected to a prepublication peer review intended to ensure analytical quality. The views expressed are those of the author. This publication is part of the overall program of the Peterson Institute for International Economics, as endorsed by its Board of Directors, but it does not neces- sarily reflect the views of individual members of the Board or of the Institute’s staff or management. The Peterson Institute for International Economics is a private nonpartisan, nonprofit institution for rigorous, intellectually open, and indepth study and discussion of international economic policy. Its purpose is to identify and analyze important issues to make globalization beneficial and sustainable for the people of the United States and the world, and then to develop and communicate practical new approaches for dealing with them. Its work is funded by a highly diverse group of philanthropic foundations, private corporations, and interested individuals, as well as income on its capital fund. About 35 percent of the Institute’s resources in its latest fiscal year were provided by contributors from outside the United States. A list of all financial supporters is posted at https://piie.com/sites/default/files/supporters.pdf.
Transcript of Olivier Blanchard November 2017 - PIIE · Olivier Blanchard November 2017 Abstract Fifty years ago,...
WORKING PAPER
1750 Massachusetts Avenue, NW | Washington, DC 20036-1903 USA | 202.328.9000 Tel | 202.328.5432 Fax | www.piie.com
17-14 Should We Reject the Natural Rate Hypothesis?Olivier BlanchardNovember 2017
Abstract
Fifty years ago, Milton Friedman articulated the natural rate hypothesis. It was composed of two sub-hypotheses: First, the natural rate of unemployment is independent of monetary policy. Second, there is no long-run tradeoff between the deviation of unemployment from the natural rate and inflation. Both propositions have been challenged. This paper reviews the arguments and the macro and micro evidence against each. It concludes that, in each case, the evidence is suggestive but not conclusive. Policymakers should keep the natural rate hypothesis as their null hypothesis but keep an open mind and put some weight on the alternatives.
JEL Codes: E10, E2, E32Keywords: Unemployment, Hysteresis, Inflation, Phillips Curve, Fluctuations
Olivier Blanchard is the C. Fred Bergsten Senior Fellow at the Peterson Institute for International Economics and the Robert M. Solow Professor of Economics emeritus at MIT. He was economic counselor and director of the Research Department at the International Monetary Fund.
Author’s Note: This paper was prepared for the Journal of Economic Perspectives. I thank the editors for their sugges-tions; Larry Summers for many discussions; David Autor, David Cho, Jordi Gali, Egor Gornostay, Alan Krueger, and Mathias Trabandt for data and help; Marios Angeletos, Larry Ball, Olivier Coibion, Nicola Gennaioli, and Robert Solow for comments; and Julien Acalin, Thomas Pellet, and Colombe Ladreit for excellent research assistance. An appendix with methodological details and further results is available at http://bit.ly/2zDggjY.
© Peterson Institute for International Economics. All rights reserved. This publication has been subjected to a prepublication peer review intended to ensure analytical quality.
The views expressed are those of the author. This publication is part of the overall program of the Peterson Institute for International Economics, as endorsed by its Board of Directors, but it does not neces-
sarily reflect the views of individual members of the Board or of the Institute’s staff or management. The Peterson Institute for International Economics is a private nonpartisan, nonprofit institution for rigorous,
intellectually open, and indepth study and discussion of international economic policy. Its purpose is to identify and analyze important issues to make globalization beneficial and sustainable for the people of the United States and the world, and then to develop and communicate practical new approaches for dealing with them. Its work is funded by a
highly diverse group of philanthropic foundations, private corporations, and interested individuals, as well as income on its capital fund. About 35 percent of the Institute’s resources in its latest fiscal year were provided by contributors from
outside the United States. A list of all financial supporters is posted at https://piie.com/sites/default/files/supporters.pdf.
2 OLIVIER BLANCHARD
1. Introduction
Fifty years ago, Milton Friedman (1968) delivered his Presidential address
“The Role of Monetary Policy at the December meetings of the American
Economic Association, and articulated what became known as the “natural
rate hypothesis.” It was a joint hypothesis, composed of two sub-hypotheses:
The first was that there was a natural rate of unemployment, indepen-
dent of monetary policy. To quote Friedman (p. 8): “The ‘natural rate of un-
employment [...] is the level that would be ground out by the Walrasian sys-
tem of general equilibrium equations, provided there is imbedded in them
the actual structural characteristics of the labor and commodity markets,
including market imperfections, stochastic variability in demands and sup-
plies, the cost of gathering information about job vacancies and labor avail-
abilities, the costs of mobility, and so on.”
The second was that monetary policy could not sustain unemployment
below the natural rate without leading to higher and higher inflation, a propo-
sition that became known as the “accelerationist hypothesis”. Again, to quote
Friedman (p. 11): “There is always a temporary trade-off between inflation
and unemployment; there is no permanent trade-off. The temporary trade-
off comes not from inflation per se, but from unanticipated inflation, which
generally means, from a rising rate of inflation. The widespread belief that
there is a permanent trade-off is a sophisticated version of the confusion be-
tween ”high” and ”rising” that we all recognize in simpler forms. A rising rate
of inflation may reduce unemployment, a high rate will not.”
For the sake of clarity, in the rest of the paper, I shall refer to the joint hy-
pothesis as the “natural rate hypothesis,” and the two separate sub-hypotheses
as the “independence hypothesis” and the “accelerationist hypothesis.” Note
that they are separate hypotheses. The implications will be different if either
one fails separately, or if both fail.
NATURAL RATE HYPOTHESIS 3
Notice also that, while Friedman referred to unemployment, he clearly
had in mind output more generally. The natural rate hypothesis can be re-
cast in terms of output: that is, potential output is independent of monetary
policy, and there cannot be sustained deviations of output above potential
without increasing inflation. Thus, in this paper, I shall look at the evidence
for both unemployment and for output.
Together, the two hypotheses have very strong implications. If inflation
is to remain stable, periods during which output exceeds potential output
must be offset by periods during which output is below potential; in other
words, booms must be fully offset by slumps. Monetary policy cannot do
more, and indeed should not try to do more, than smooth fluctuations around
the independent path of potential output.
While the natural rate hypothesis was controversial at the time, it quickly
became widely accepted, and has been the dominant paradigm in macroe-
conomics ever since. It is embodied in the thinking and the models used by
central banks, and it is the basis of the inflation targeting framework used by
most central banks today.
There were always grumblings about the extent to which this hypothesis
fully characterized the world, about whether potential output was really in-
dependent of monetary policy, and about whether there really was no long-
run trade-off between inflation and output. In the 1980s in particular, the
natural rate of unemployment in Europe appeared to increase following ev-
ery recession, and the idea that high actual unemployment might cause an
increase in the natural rate became more popular. Hysteresis, which refers
to the theory that changes in the natural rate of unemployment can be path-
dependent (an idea which could be traced at least to Phelps (1972)), Larry
Summers and I argued, could be the explanation for this increase (Blan-
chard and Summers (1986)). But after a while, as the so-called Great Moder-
4 OLIVIER BLANCHARD
99
100
101
102
103
104
105
106
2000Q1 2002Q1 2004Q1 2006Q1 2008Q1 2010Q1 2012Q1 2014Q1 2016Q1
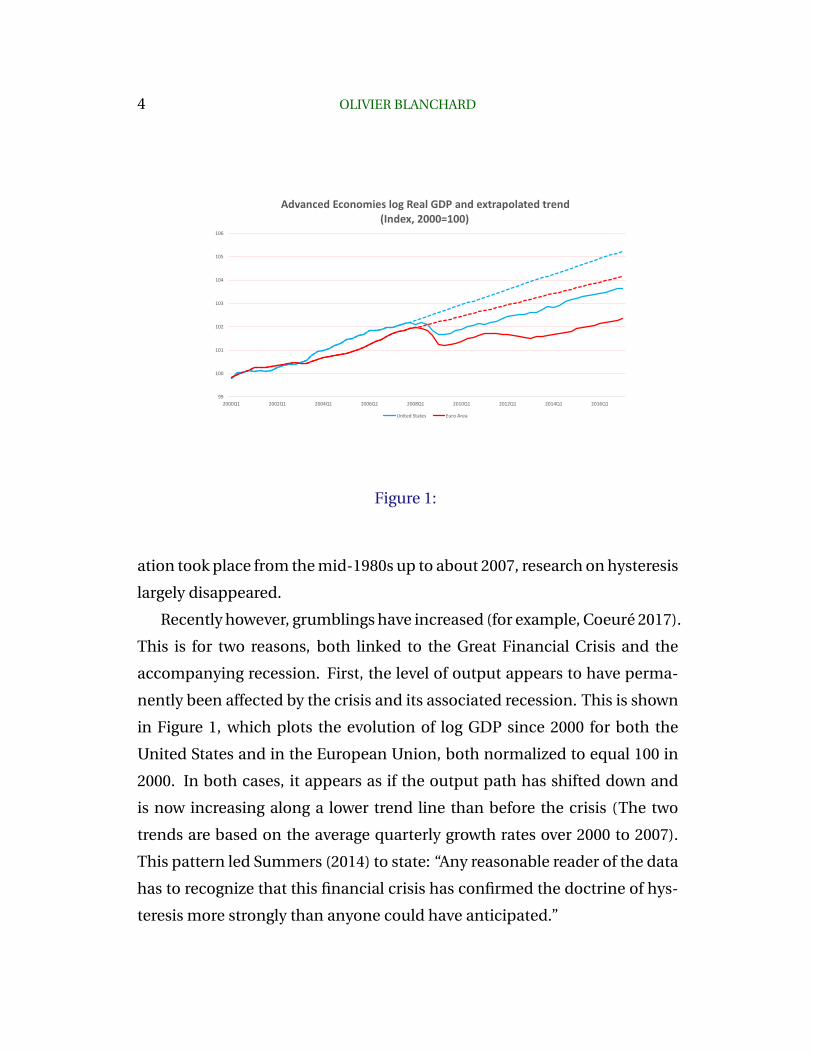
Advanced Economies log Real GDP and extrapolated trend (Index, 2000=100)
United States Euro Area
Figure 1:
ation took place from the mid-1980s up to about 2007, research on hysteresis
largely disappeared.
Recently however, grumblings have increased (for example, Coeure 2017).
This is for two reasons, both linked to the Great Financial Crisis and the
accompanying recession. First, the level of output appears to have perma-
nently been affected by the crisis and its associated recession. This is shown
in Figure 1, which plots the evolution of log GDP since 2000 for both the
United States and in the European Union, both normalized to equal 100 in
2000. In both cases, it appears as if the output path has shifted down and
is now increasing along a lower trend line than before the crisis (The two
trends are based on the average quarterly growth rates over 2000 to 2007).
This pattern led Summers (2014) to state: “Any reasonable reader of the data
has to recognize that this financial crisis has confirmed the doctrine of hys-
teresis more strongly than anyone could have anticipated.”
NATURAL RATE HYPOTHESIS 5
Second, in contrast to the accelerationist hypothesis, very high unem-
ployment did not lead to lower and lower inflation, but rather just to ongoing
low inflation. In both the United States and the European Union, except for
the large decline in inflation in 2009, there does not appear to be any rela-
tion between the unemployment rate and the change in inflation in the last
two decades. We appear to have returned instead to a relation between the
unemployment rate and the rate of inflation, rather than the rate of change
of inflation.
Neither fact is by itself a clear rejection of the natural rate hypothesis. It
could be that the decrease in output relative to trend reflects a decrease in
the underlying trend, or strong and persistent effects of the financial crisis
on the supply side of the economy, rather than adverse, hysteretic effects of
lower output perpetuating itself. If so, the outcome of the Great Financial
Crisis might carry no implication for the effects of monetary policy shocks.
Moreover, the Lucas critique of the Phillips curve has told us that expecta-
tions matter, and the lack of apparent relation between the unemployment
rate and changes in the rate of inflation does not imply that there is an ex-
ploitable trade-off. Yet, these facts, and the 50th anniversary of Friedman’s
(1968) AEA presidential address, suggest that it is a good time to review the
available evidence.
The paper assesses what we know and do not know. I begin by revisiting
the logic of the independence hypothesis and looking at the macroeconomic
and microeconomic evidence. I then turn to the evidence on the accelera-
tionist hypothesis. Finally, I consider potential policy implications and con-
cludes. To anticipate the answer to the question in the title: I see the macroe-
conomic and the microeconomic evidence as suggestive but not conclusive
evidence against the natural rate hypothesis. Policy makers should keep the
natural rate hypothesis as their null hypothesis, but also keep an open mind
and put some weight on the alternatives.
6 OLIVIER BLANCHARD
2. On the independence hypothesis: Persistence
versus permanence
The first step must be to recast the discussion. That discussion has largely
taken the form of a choice between what appear to be two sharply differ-
ent classes of models, “standard models” where monetary policy does not
affect potential output, and “hysteresis models”, where monetary policy has
permanent effects on potential output. The seeming dichotomy between
these models is misleading. Even in the most standard models, monetary
policy is likely to affect potential output for some time. And in most hystere-
sis models, the effects of monetary policy are likely to be persistent, but not
necessarily permanent. The issue is thus about the size and persistence of
the effects of monetary policy on potential output, not their existence nor
their permanence. Let me spell out these points more precisely.
The discussion must start with a definition of “potential output”. I define
potential output as the level of output which would obtain if, given actual
history, nominal rigidities were lifted from now on. I define the natural rate
of unemployment in the same way. Potential output is sometimes defined as
the level of output which would obtain if nominal rigidities had always been
absent, both in the past and in the future. Potential output, defined this way,
would be tautologically independent of monetary policy. But this is not a
useful definition as what matters is what output can be today, as opposed to
what it could have been in some hypothetical world.
Now take any “standard model” in which, because of nominal rigidities,
monetary policy does affect output for some time. Suppose that tighter mon-
etary policy triggers a recession and a decline in output. This decline in
output is likely to come with a decline in investment. Thus as output de-
clines, the capital stock is lower for some time, and by implication, so is po-
NATURAL RATE HYPOTHESIS 7
tential output. The same may be true of other factors of production. For
example, if matching frictions prevent employment to quickly return to its
pre-recession level, then both factors of production are quasi-fixed. Thus,
potential output, the output that would prevail if all nominal rigidities were
suddenly lifted, may be fairly close to actual output, and be affected for some
time by monetary policy.
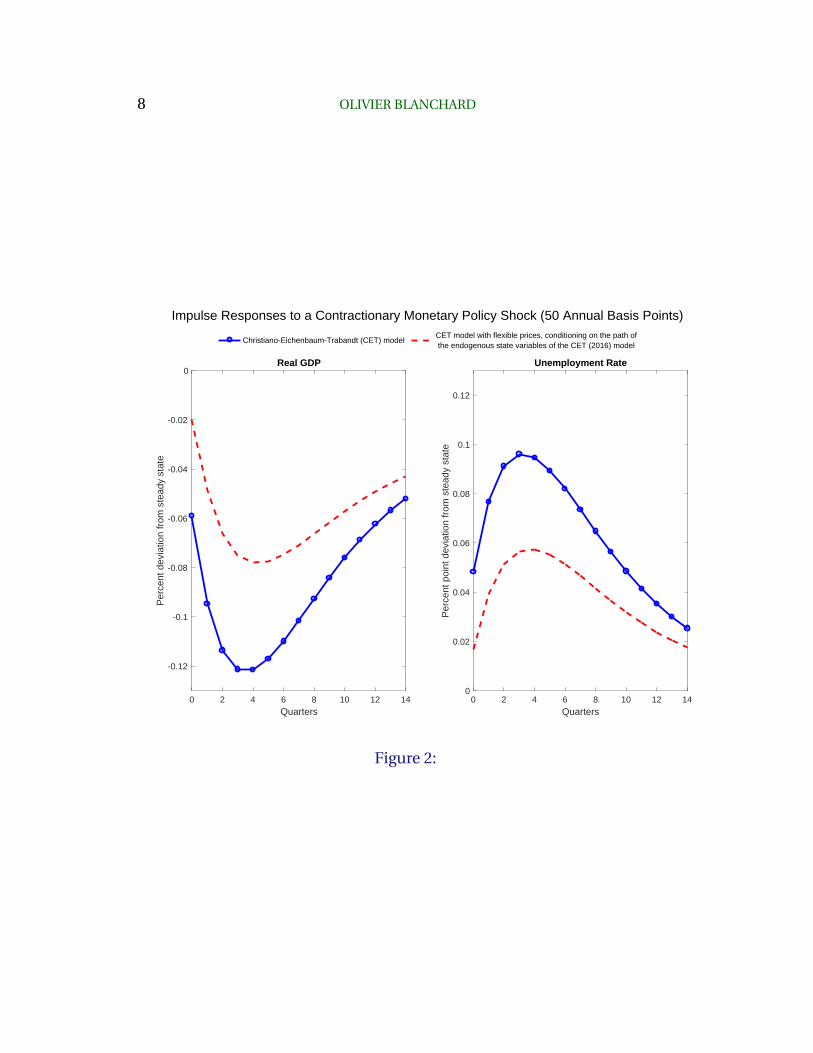
Figure 2 shows for example the behavior of actual and potential output,
as well as the behavior of the actual and the natural unemployment rate, in
a model by Christiano et al (2016) that allows, in addition to capital accu-
mulation, for matching frictions in the labor market, frictions which prevent
unemployment from quickly returning to its long run natural rate. After an
adverse monetary policy shock, potential output follows a path similar in
shape to that of actual output, but with an amplitude of about half. When
actual output reaches its trough of -0.12%, potential output also reaches its
trough, at about -0.07%. Fifteen quarters out, potential output is still -0.05%
lower than before the shock. In other words, even if all nominal rigidities
were removed at that point, output would still be -0.05% lower than absent
the monetary policy shock. A similar pattern holds for the natural and actual
unemployment rates.1
Now consider the channels which have been emphasized in “hysteresis
models”. Some of these channels may indeed imply a permanent effect of
monetary policy. For example, if a recession leads to lower research and de-
velopment for some time, and if total factor productivity depends in part on
the accumulation of past research and development efforts, then total fac-
tor productivity may indeed be permanently be lower than it would have
1The magnitudes are small, for two reasons: The monetary shock is small, and the ef-fects of monetary policy on actual output in the model are small as well. These aspectsare however not relevant to the point made in the text. I am thankful to Mathias Trabandtfor performing these simulations. The original paper does not show the path of potentialoutput or the path of the natural rate.
8 OLIVIER BLANCHARD
0 2 4 6 8 10 12 14Quarters
-0.12
-0.1
-0.08
-0.06
-0.04
-0.02
0
Per
cent
dev
iatio
n fr
om s
tead
y st
ate
Real GDP
Impulse Responses to a Contractionary Monetary Policy Shock (50 Annual Basis Points)
0 2 4 6 8 10 12 14Quarters
0
0.02
0.04
0.06
0.08
0.1
0.12
Per
cent
poi
nt d
evia
tion
from
ste
ady
stat
e
Unemployment Rate
Christiano-Eichenbaum-Trabandt (CET) modelCET model with flexible prices, conditioning on the path of the endogenous state variables of the CET (2016) model
Figure 2:
NATURAL RATE HYPOTHESIS 9
been absent the recession. But some of the channels which have been stud-
ied suggest persistent effects, rather than permanent ones. For example, if
some of the long-term unemployed become unemployable, the effect will
eventually disappear as these workers reach the age at which they would
have stopped working anyway.
In short, all relevant models imply an effect of monetary policy on po-
tential output and on the natural rate lasting for some time.2 The goal of the
empirical work must be, at the macro level, to assess the degree of persis-
tence of the effects, and, at the micro level, to identify and examine specific
channels of persistence.
3. Macro evidence on the independence
hypothesis: Monetary policy, recessions,
unemployment, and output
The independence hypothesis is a hypothesis about the effects of monetary
policy shocks on potential output. Thus, the first issue is how to identify
monetary policy shocks. One approach would be to use a vector autoregres-
sion (VAR) methodology with identified monetary policy shocks, trace their
dynamic effects on output or unemployment, and assume that, as the hori-
zon increases, these increasingly reflect their effects on potential output and
the natural unemployment rate. Given the well-known difficulties of identi-
fying those monetary shocks, and the statistical uncertainty associated with
2Put more formally, all realistic models will have a number of state variables, some ofthem affecting potential output. Thus, even if all nominal rigidities were suddenly removedduring a recession, potential output would be different from what it would have been absentthe shock. One can think of hysteresis models as models focusing on those mechanismspotentially leading to long-lasting, or, in the limit, permanent effects on some of these statevariables, and by implication on output and unemployment.
10 OLIVIER BLANCHARD
impulse responses, this approach does not look very promising. A meta-
study of VAR studies by De Grauwe and Costa Storti (2004) finds the mean
effect of a 1 percent interest rate shock on output to be -0.15 percent after
five years. However, the distribution of estimates however has a standard
deviation of 0.27 percent, so a zero effect is not far from the middle of the
distribution.
A more promising approach is to look at recessions associated with in-
tentional disinflations. The shocks are clearly monetary shocks; they are
large; and they are plausibly largely exogenous, reflecting more a change in
policy rather than the response of policy to other shocks. This approach
which has been pursued by a number of authors, in particular Laurence Ball
in a number of contributions (for example Ball (2009), (2014)). It is the ap-
proach I shall follow here, building on Blanchard, Cerutti, Summers (2015).
Details are given in the appendix, but the general approach is as follows.
I look at 22 advanced economies over the last 50 years, and, using a sim-
ple algorithm looking at peaks and troughs (based on Harding Pagan 2002),
I identify 122 recessions. I then classify recessions according to their proxi-
mate cause – such as intentional disinflations, oil price increases, financial
crises, and so on – and focus first on the 22 recessions associated with inten-
tional disinflations. (I shall return to whether and how one can use informa-
tion from the other recessions later.) I then compute the average unemploy-
ment rate over various time intervals both pre-recession and post-recession,
and take the difference between the post- and the pre-recession periods. As
discussed in Blanchard et al, there is a trade-off in looking at averages over
different time intervals. The longer the length of the post-recession period
for example, the more the average can tell us about persistence, but the more
the average is affected by other shocks than the disinflation.
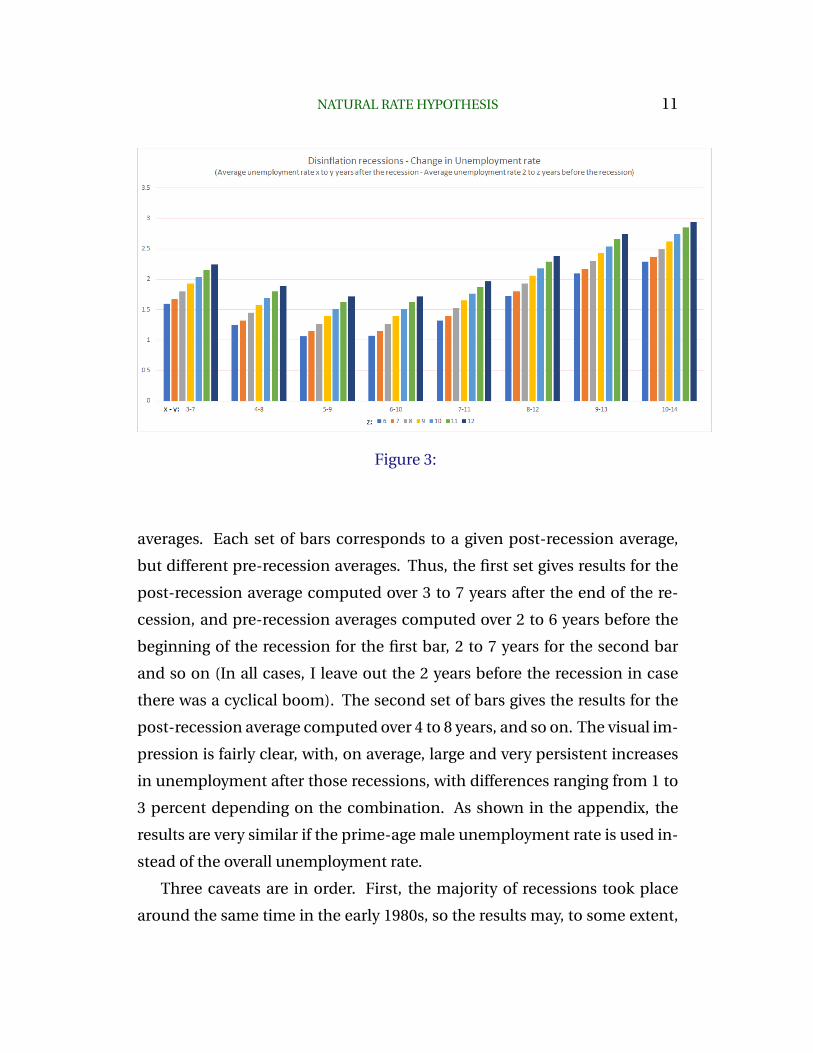
The results are shown in Figure 3. The different bars correspond to the
different time intervals used to compute pre-recession and post-recession
NATURAL RATE HYPOTHESIS 11
Figure 3:
averages. Each set of bars corresponds to a given post-recession average,
but different pre-recession averages. Thus, the first set gives results for the
post-recession average computed over 3 to 7 years after the end of the re-
cession, and pre-recession averages computed over 2 to 6 years before the
beginning of the recession for the first bar, 2 to 7 years for the second bar
and so on (In all cases, I leave out the 2 years before the recession in case
there was a cyclical boom). The second set of bars gives the results for the
post-recession average computed over 4 to 8 years, and so on. The visual im-
pression is fairly clear, with, on average, large and very persistent increases
in unemployment after those recessions, with differences ranging from 1 to
3 percent depending on the combination. As shown in the appendix, the
results are very similar if the prime-age male unemployment rate is used in-
stead of the overall unemployment rate.
Three caveats are in order. First, the majority of recessions took place
around the same time in the early 1980s, so the results may, to some extent,
12 OLIVIER BLANCHARD
reflect common time effects. Second, the averages hide some heterogeneity.
For the combination of time intervals which gives the smallest increase, only
15 out of the 22 recessions are associated with increased unemployment; for
the combination of time intervals which gives the largest increase, the num-
ber increases to 19. Third, the figure shows the changes in the actual un-
employment rate, not necessarily the changes in the natural unemployment
rate. While it is plausible that the two may converge, as we look at longer
and longer intervals pre- and post-recession, one may worry that this is not
the case. This is where, in principle, the behavior of inflation can offer more
information. During the 1980s and early 1990s when these recessions took
place, the evidence (reviewed later in this paper) is that the accelerationist
Phillips curve gave a good characterization of the data, so we can look at
the change in inflation as a signal of the distance between actual and nat-
ural unemployment rates. The average annual change in the inflation rate
over the various pre-recession time intervals ranges from 0.04 to 0.12 per-
cent. The average annual change over the various post-recession intervals
ranges from -0.40 to 0.12 percent. These are small numbers and suggest that
the change in the actual unemployment rate can be interpreted mostly as a
change in the natural rate.
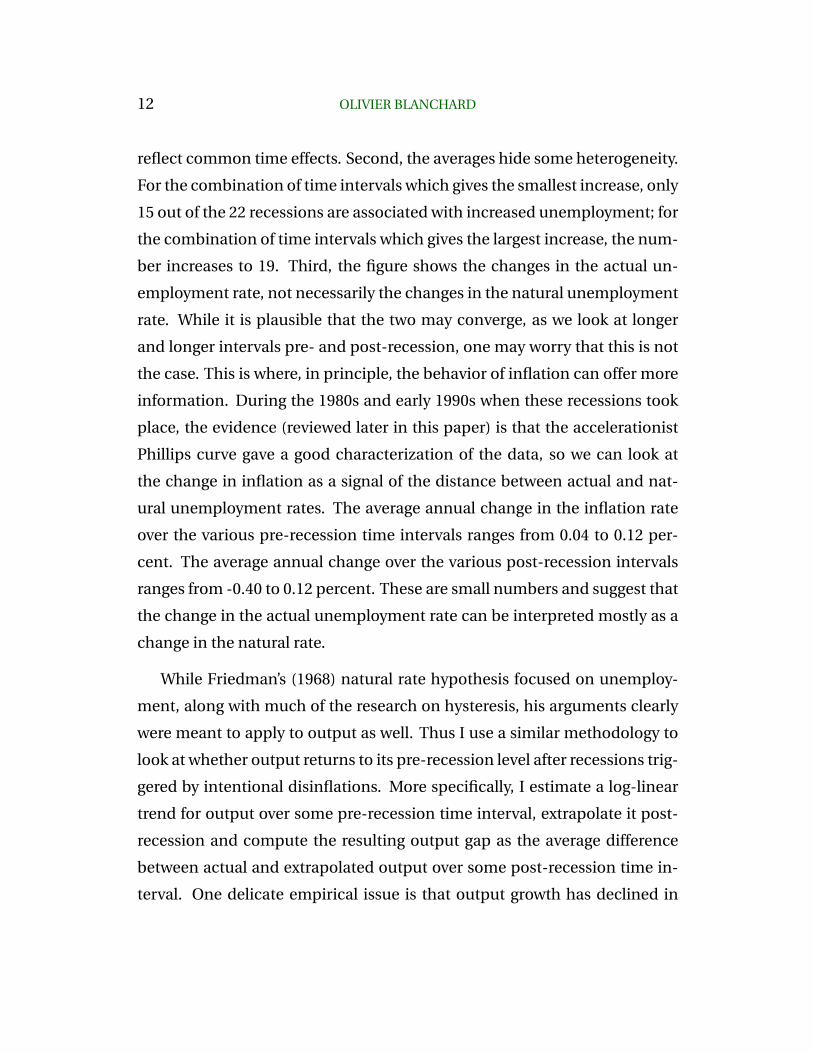
While Friedman’s (1968) natural rate hypothesis focused on unemploy-
ment, along with much of the research on hysteresis, his arguments clearly
were meant to apply to output as well. Thus I use a similar methodology to
look at whether output returns to its pre-recession level after recessions trig-
gered by intentional disinflations. More specifically, I estimate a log-linear
trend for output over some pre-recession time interval, extrapolate it post-
recession and compute the resulting output gap as the average difference
between actual and extrapolated output over some post-recession time in-
terval. One delicate empirical issue is that output growth has declined in
NATURAL RATE HYPOTHESIS 13
Figure 4:
most advanced countries over the sample period; thus the extrapolation of a
log-linear trend over any pre-recession time interval will tend to overpredict
post-recession output, and lead to an estimated negative output gap, even in
the absence of any hysteresis. Thus, I correct for this decrease in the under-
lying trend when extrapolating the pre-recession trend. (How this is done is
described in the appendix).
The results are shown in Figure 4 for the various pre-recession and post-
recession time intervals. The average output gaps are typically negative, but
the results are less consistent than for unemployment, and are more sensi-
tive to the time intervals used to estimate the pre-recession gap. Also, the
averages hide substantial heterogeneity. While the average gaps are nega-
tive, the proportion of negative output gaps over all time intervals is only 55
percent, which offers only weak support for the hysteresis hypothesis.
An obvious question is how to reconcile the unemployment and the out-
put results. To make progress, I decompose the log output gap between a
14 OLIVIER BLANCHARD
log employment gap and a log productivity gap, using for each the same
methodology as for log output, so the sum of the two gaps is equal to the
output gap. The results (reported in the appendix) lead to three main con-
clusions: The employment gaps are consistently negative, largely insensitive
to the choice of time interval, and close to the unemployment gaps reported
above. The productivity gaps are, perhaps surprisingly, often positive, and
are sensitive to the choice of pre-recession time interval. A tentative expla-
nation for this sensitivity is, again, that most disinflation episodes took place
around the same time, and one unusual pre-recession year can affect the re-
sults quite strongly.
Can the evidence from the other 100 recessions, those not caused by ex-
plicit disinflation efforts, be used to learn about persistent effects of mon-
etary policy shocks? The answer is yes, but only if one is willing to make
further assumptions. If, for example, one assumes that long run labor sup-
ply is inelastic – be it individual labor supply or the relation between the
wage and unemployment derived from matching-bargaining models – then
if one finds persistent effects of non-monetary shocks on unemployment,
this suggests the presence of channels relevant for monetary shocks also.
For an example, consider the case of recessions brought on by oil price
increases. To the extent that such shocks are persistent, they imply a de-
crease in real consumption wages relative to trend; but if long run labor
supply is inelastic, this should eventually have no effect on unemployment.
What about output? Theory suggests that, while oil shocks should not have
a direct effect on productivity (as productivity is the ratio of value added—
which, if correctly measured, is unaffected—to employment), they may have
an indirect effect on productivity growth. For example, to the extent that
technological progress is directed by shifts in economic incentives, a change
in oil prices may well lead to a temporary slowdown in productivity growth
NATURAL RATE HYPOTHESIS 15
as firms have to explore technologies corresponding to the new configura-
tion of relative prices. If so, the productivity level may be lower in the long
run than it would have been, absent the increase in the oil price.
Or take the case of recessions brought on by financial crises. By the same
argument, if long-run labor supply is inelastic, one would not expect them to
lead to a permanent increase in unemployment. But to the extent that they
have persistent effects on financial intermediation, be it because of changes
in behavior or changes in regulation, they may well also have persistent ad-
verse effects on productivity. For example, banks may become more risk
averse, financing projects with lower risk but also, by implication, a lower
expected rate of return.
This suggests focusing on unemployment rates, in the same way as I did
earlier. The method of classification and the results are described in the ap-
pendix, and can be summarized as follows. Looking at the 33 oil-related
recessions (all of them taking place from the mid-1970s to the early 1980s)
or the 19 recessions brought on by financial crises (12 of them taking place
in the late 2000s), the evidence in both cases is of large, highly persistent, in-
creases in unemployment, consistent across pre-recession and post-recession
time intervals. The same caveats apply however as for disinflation triggered
recessions before: In particular, the oil price related recessions all happen
around the two episodes of large oil price increases in the mid and late 1970s,
and thus the results could reflect common time effects. The same is true for
the majority of financial crisis related recessions. Nevertheless, the fact that
most recessions are associated with a positive unemployment gap is quite
striking.
For the reasons discussed above, results for output cannot be used to test
the independence hypothesis, as the effects on output may well reflect the
persistent effects of the specific shocks, and thus would not be present for
monetary shocks. They are still worth reporting briefly, with more details
16 OLIVIER BLANCHARD
given in the appendix. Output gaps associated with oil price related reces-
sions are negative, large, and consistent across time intervals. In contrast
to the disinflation related recessions, they reflect mostly productivity gaps.
Output gaps associated with financial crisis related recessions are smaller,
but also consistent across time intervals. They reflect mostly employment
gaps rather than productivity gaps. The current case of the United States
stands as an exception. As shown in Figure 1, output remains far below its
pre-crisis trend, but the unemployment rate is back to its pre-crisis level. It
also shows the limits of the method I have used: There is fairly wide agree-
ment that, at least in the US, the productivity growth slowdown started in
fact a few years before the crisis (for example Fernald 2014). If so, the method-
ology I have used attributes this decrease in productivity (and by implication
the decrease in output) incorrectly to the recession.
To summarize: I read the macroeconomic evidence as suggestive of per-
sistent effects of monetary policy on the natural unemployment rate and po-
tential output. But the evidence is not overwhelming. Moreover, looking just
at recessions has its limits: It cannot answer whether there are symmetrical
effects of booms and recessions, which is a crucial issue for the design of
policy. In this context, a closer look at potential channels of persistence and
more microeconomic evidence may help to assess potential nonlinearities
or asymmetries between recessions and booms.
4. Micro evidence on the independence
hypothesis: Channels for high persistence
Persistent effects of monetary shocks on output may come either from em-
ployment or from productivity.
Starting with employment, the initial mechanism emphasized by Blan-
NATURAL RATE HYPOTHESIS 17
chard and Summers (1986) focused on wage formation. In its simplest form,
the argument was straightforward. Suppose that employed workers (or the
unions representing them) set wages, and did not care about the unem-
ployed. Unemployment would then play no role in wage setting, and would
follow a random walk, with no tendency to return to any particular value. Af-
ter an adverse shock and a recession, it would remain higher. After a boom,
it would remain lower. (A modern treatment along these lines, in a micro-
founded New-Keynesian model with insiders and outsiders, is given by Gali
(2016), and shows the long term effects of monetary shocks.)
The argument correctly emphasized the power of insiders in wage forma-
tion, but it was too strong. Even if the employed workers do not care about
the unemployed, they should care about their own situation, were they to
become unemployed. The higher the unemployment rate, the more willing
they should be to accept a lower wage. Also, wages are not set unilaterally
by workers (or by unions), but rather unilaterally by firms or by a process of
bargaining between firms and workers. In this case, wages will reflect the
option of firms to hire the unemployed. The higher the unemployment rate,
the larger the pool of potential hires, the stronger the firms will be in bar-
gaining. For both reasons, even with selfish insiders, unemployment will
matter.
One of the major research developments of the 1980s and 1990s was the
development of a framework capturing these aspects, based on matching
and bargaining, with the basic framework now known as the DMP model,
for the work by Diamond, Mortensen, and Pissarides. It gives a better way to
think about the effect of unemployment on wages, and how the strength of
the effect depends on the structure of the labor market and on labor market
18 OLIVIER BLANCHARD
institutions.3
For example, consider the potential role of employment protection. The
higher the firing cost, the smaller the risk for an employed worker to be-
come unemployed (leaving the risk of bankruptcy and firm closure aside),
the smaller the effect of unemployment on the wage. The higher the hiring
cost, the smaller the risk for an employed worker of being replaced by an
unemployed worker, and thus the smaller the effect of unemployment on
the wage. In the limit, with high hiring and firing costs, unemployment may
indeed have little effect on the wage, and lead to highly persistent effects
of monetary policy shocks on the natural rate of unemployment. This ana-
lytical framework suggests that high persistence is more likely in countries
with high employment protection, more generous unemployment benefits,
stronger unions. An in-depth analysis, both theoretical and empirical, of the
effect of such cross-country differences on the persistence of shocks on the
natural rate and potential output remains however largely to be done.4
A subsequent explanation focused on the effect of high unemployment
on labor market institutions, and by implication, on the natural unemploy-
ment rate. Indeed, the high unemployment rate triggered by the two oil
shocks of the 1970s led to an increase in employment protection and in
the generosity of unemployment benefits in most European countries (Blan-
chard and Wolfers 2000). While these measures were taken to limit the ini-
tial increase in unemployment and make it less painful, it is likely that they
increased the natural rate. However, this explanation is specific to those re-
cessions, and does not provide for a general channel of high persistence.
3Indeed, the model by Christiano et al. used to generate Figure 2 above incorporates aformalization of the labor market reflecting matching and bargaining. Unemployment is astate variable, leading to a persistent, but not permanent, effect of monetary policy shockson the natural rate.
4In Blanchard and Wolfers (2000), we took a first pass at it, by looking at the interactionof shocks and institutions in determining effects of shocks on unemployment. But muchremains to be done.
NATURAL RATE HYPOTHESIS 19
Yet another channel, and at this point probably the most popular one
among researchers, has focused on the effect of high unemployment on the
morale, skills, and employability of the long-term unemployed.
It has long been known that the probability of becoming employed de-
creases with the duration of unemployment. For example, based on data
from the Current Population Survey for 1994-2016, the average probability of
becoming employed in the following month decreases from 28 percent if un-
employed for less than 27 weeks to 14 percent if unemployed for more than
27 weeks. At the end of 2009, when the U.S. unemployment rate reached a
high of 10 percent, the probability of reemployment in the following month
was 18 percent if unemployed for less than 27 weeks, but only 10 percent if
unemployed for more than 27 weeks.
While these comparisons are suggestive, they do not prove however that
the long-term unemployed become less employable. It may be instead that
the workers who are the most employable are hired first, and thus the longer
the duration, the less employable is the remaining pool. However, two re-
cent papers suggest that hysteresis – in this case, the effect of unemployment
duration on employability – might be at work. First, Krueger et al (2014)
use the time structure of the Current Population Survey(in the sample for
four months, out for eight months, back in for four months) to look at the
more relevant longer transition probabilities, and confirm the message from
monthly probabilities. On average, for the period 1994 to 2012, the average
probability of being employed 15 months later was 55 percent for those un-
employed for less than 27 weeks, but only 40 percent for those unemployed
for more than 27 weeks. Second, Abraham et al. (2016) link data from the
Current Population Survey and the unemployment benefit register, and look
at the employment history of the long-term unemployed. They find that the
probability of being employed eight quarters earlier is roughly similar for the
short-term and the long-term unemployed. If we think of this probability as
20 OLIVIER BLANCHARD
a proxy for workers’ characteristics, this suggests that the long-term unem-
ployed have roughly the same characteristics as the short-term unemployed,
and that their lower probability of becoming employed is primarily caused
by the duration of their unemployment rather than by their unobservable
characteristics.
One more step is needed to prove the case for hysteresis. It could be that
the decreased probability reflects mostly the fact that firms, when they have
the choice, often give priority in hiring to those who have been unemployed
the least time (a decision rule that Diamond and I (1994) have called ”rank-
ing”.) If this is the case, so long as unemployment is high and firms get many
applicants, the long-term unemployed will be less likely to get a job. But
as unemployment decreases and the number of job applicants declines, the
long term unemployed will be more often at the front of the line, and see
their relative probability of employment increase. What might appear like
hysteresis in the short-term will fade away over time. While this hypothesis
can be formally tested by looking at relative probabilities of employment as
a function of overall unemployment, I have not seen it done. The regressions
of transition probabilities for short-term and long-term unemployed on the
overall unemployment rate by Krueger et al (see their Table 2) indicate that
the relative probabilities do not vary much with the state of the labor market.
If so, the data can be seen as providing some evidence for hysteresis.
To the extent that decreased employability is a source of hysteresis, one
can then explore non-linearities and asymmetry between recessions and
booms. As shown in Figure 5, leaving aside short-run dynamics (which lead
to countercyclical loops), the ratio of long-term unemployment to total un-
employment is strongly increasing in unemployment. Put another way, the
long term unemployment rate is convex in the unemployment rate. If we
think of the number of workers who become unemployable as roughly pro-
portional to the number of long-term unemployed, this implies that hystere-
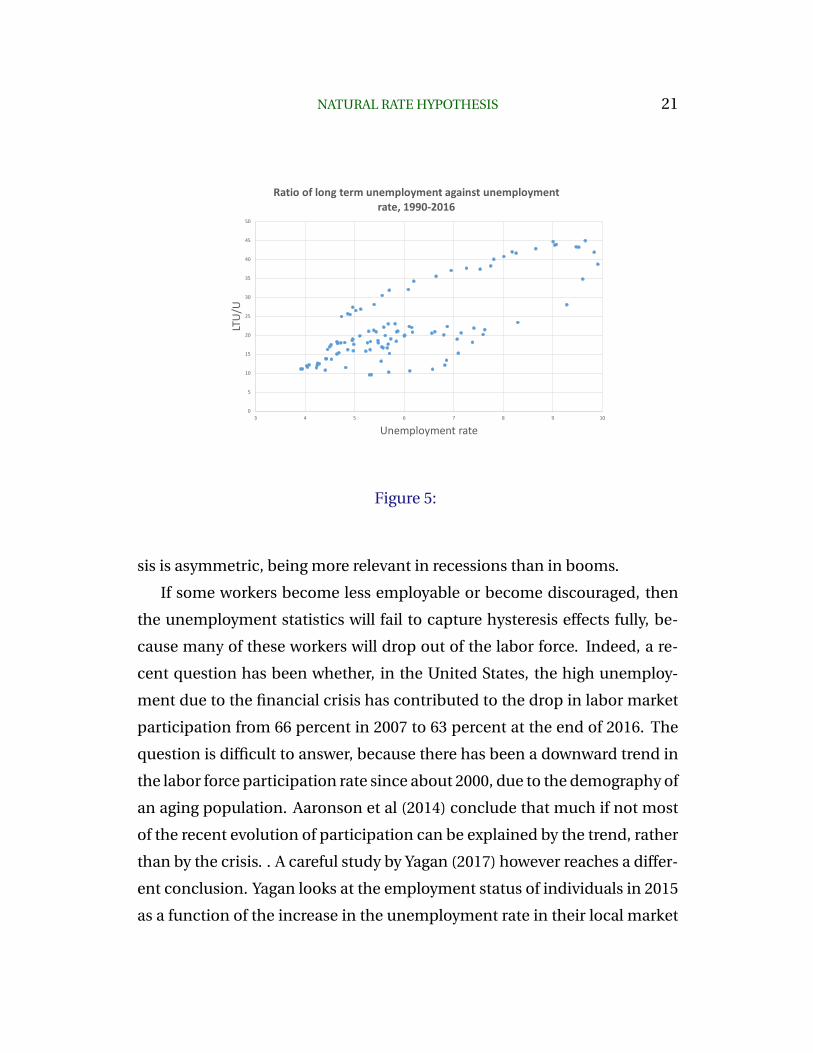
NATURAL RATE HYPOTHESIS 21
0
5
10
15
20
25
30
35
40
45
50
3 4 5 6 7 8 9 10
LTU
/U
Unemployment rate
Ratio of long term unemployment against unemployment rate, 1990-2016
Figure 5:
sis is asymmetric, being more relevant in recessions than in booms.
If some workers become less employable or become discouraged, then
the unemployment statistics will fail to capture hysteresis effects fully, be-
cause many of these workers will drop out of the labor force. Indeed, a re-
cent question has been whether, in the United States, the high unemploy-
ment due to the financial crisis has contributed to the drop in labor market
participation from 66 percent in 2007 to 63 percent at the end of 2016. The
question is difficult to answer, because there has been a downward trend in
the labor force participation rate since about 2000, due to the demography of
an aging population. Aaronson et al (2014) conclude that much if not most
of the recent evolution of participation can be explained by the trend, rather
than by the crisis. . A careful study by Yagan (2017) however reaches a differ-
ent conclusion. Yagan looks at the employment status of individuals in 2015
as a function of the increase in the unemployment rate in their local market
22 OLIVIER BLANCHARD
from 2007 to 2009, controlling for individual characteristics, and concludes
that a 1% increase in the local unemployment rate in 2007-2009 led to a 0.4%
decrease in the probability of being employed in 2015. His estimates imply
that of the 7.2% decrease in the employment rate from 2007 to 2015 of the
birth cohorts aged 30-49 in 2007, 4.8% can be attributed to demographics,
and 1.8% can be explained by the hysteretic effect of high unemployment
during the Great recession.
A complementary approach is to look at the evidence on disability in-
surance. Evidence on both applications and acceptances is useful: Cycli-
cal variations in applications for disability insurance can give information
about the loss of morale among workers as a result of the state of the labor
market. And, once people are accepted and start receiving disability pay-
ments, terminations are rare, except for infrequent program clampdowns
(Autor and Duggan 2006). This implies that, to the extent that recessions
lead to increases in disability insurance rolls, they have a hysteretic effect on
the labor force.
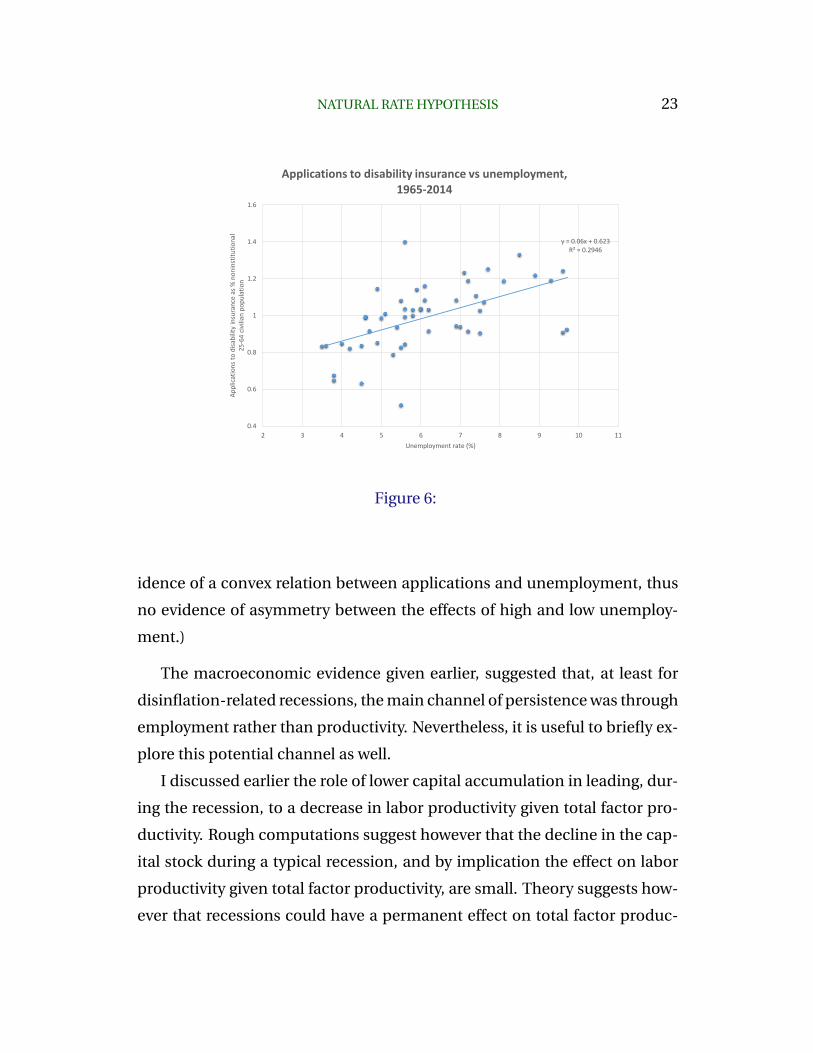
Figure 6 plots the ratio of the flow of applications to the 25-64 year-old
population against the unemployment rate for the period 1965 to 2014. The
relation is strong, statistically and economically significant. An increase in
the unemployment rate from say 5 to 10 percent increases the disability ratio
by 0.3 percent (or about 600,000 workers). If one takes the sum of annual un-
employment rates in excess of 5 percent since 2008, which is roughly equal
to 20 percent, this implies an additional 2.4 million more disability applica-
tions, and given an acceptance rate of about 35 percent, a permanent reduc-
tion in the labor force of about 800,000 workers. This channel may be seen
as a strong piece of micro evidence in favor of hysteresis, relevant not just
for disability insurance, but for the effect of unemployment on labor supply
more generally. (In contrast to the previous graph however, there is no ev-
NATURAL RATE HYPOTHESIS 23
y = 0.06x + 0.623R² = 0.2946
0.4
0.6
0.8
1
1.2
1.4
1.6
2 3 4 5 6 7 8 9 10 11
Appl
icat
ions
to d
isabi
lity
insu
ranc
e as
% n
onin
stitu
tiona
l 25
-64
civi
lian
popu
latio
n
Unemployment rate (%)
Applications to disability insurance vs unemployment, 1965-2014
Figure 6:
idence of a convex relation between applications and unemployment, thus
no evidence of asymmetry between the effects of high and low unemploy-
ment.)
The macroeconomic evidence given earlier, suggested that, at least for
disinflation-related recessions, the main channel of persistence was through
employment rather than productivity. Nevertheless, it is useful to briefly ex-
plore this potential channel as well.
I discussed earlier the role of lower capital accumulation in leading, dur-
ing the recession, to a decrease in labor productivity given total factor pro-
ductivity. Rough computations suggest however that the decline in the cap-
ital stock during a typical recession, and by implication the effect on labor
productivity given total factor productivity, are small. Theory suggests how-
ever that recessions could have a permanent effect on total factor produc-
24 OLIVIER BLANCHARD
tivity itself and, by implication, on labor productivity. If we think, somewhat
simplistically, of total factor productivity as being determined in part by the
sum of past spending on research and development, then lower research
and development during a recession will lead to permanent lower total fac-
tor productivity (and a boom will do the reverse). However, the empirical
evidence suggests again limited effects: A regression of the rate of change
of research and development spending on the rate of change of GDP for the
period 1960-2013 for the United States delivers a low R2 and a coefficient
of about 1 (the regression is given in the appendix). This implies that a 1
percent decrease in GDP is associated with a decrease in research and de-
velopment spending of 1 percent of itself, a small effect.
Another potential way in which recessions may affect total factor pro-
ductivity is through their effect on the speed of adoption of inventions. An-
zaotegui et al. (2016) look at the effects of (detrended) GDP per person on
the speed of adoption of 26 technologies in the United States and the United
Kingdom over the period 1947 to 2003. They find that low activity indeed has
a negative effect on the speed of adoption. To the extent however that full
adoption still eventually takes place, this suggests only a temporary slow-
down in productivity growth – persistence rather than permanence of the
effects of recessions.
Yet another channel discussed in the literature is the effect of recessions
on reallocation, and in turn on productivity growth. The sign of the effect
is a priori ambiguous. Recessions may force low productivity firms to close
sooner, leading to more creative destruction and an increase in productiv-
ity. Alternatively, if the bankruptcy process is inefficient, it may instead force
some high productivity firms with high debt to close, leading to a decrease
in productivity (for example, see Caballero Hammour (1994).) Looking at
past U.S. recessions, Foster et al. (2014) estimate that the effect has been
NATURAL RATE HYPOTHESIS 25
generally positive and surprisingly large. Other things equal, and with the
exception of the recession associated with the financial crisis, the realloca-
tion due to recessions has typically led to increases in productivity growth
of 0.4 to 0.8 percent depending on the depth of the recession (a result which
fits the finding of often positive productivity gaps in disinflation-induced re-
cessions in the previous section).
To summarize: Of the microeconomic channels potentially behind high
persistence, the most persuasive one appears to be that high unemployment
leads some workers to be less employable or to give up on looking for jobs,
increasing unemployment or reducing the labor force, and by implication,
leading to a persistent effect on potential output.
5. The accelerationist hypothesis
The story of the changing Phillips curve – the relation between inflation and
unemployment – has been told many times. Soon after Friedman’s (1968)
presidential address, and just as he had predicted, the trade-off between the
unemployment rate and the inflation rate which had characterized the 1960s
started to weaken, replaced in time by the “accelerationist Phillips curve”,
a relation between the unemployment rate and the change in the inflation
rate. Put another way, the coefficient on lagged inflation in the Phillips curve
steadily increased from a value close to 0 to a value close to 1.
This shift was documented in real time during the 1970s. For example,
Perry (1970) estimated the coefficient on lagged inflation to be 0.34, while
Perry (1978) estimated the same coefficient as 1.0. Starting in the 2000s how-
ever, the coefficient has sharply declined, and appears now to be again close
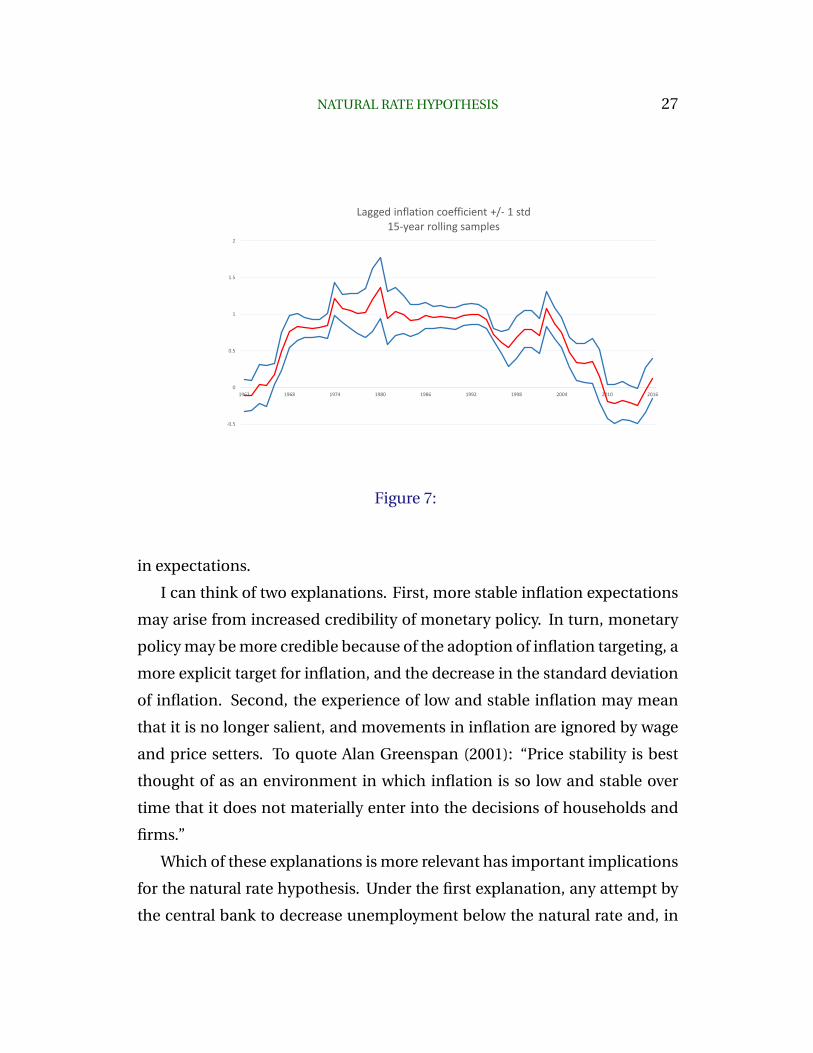
to zero. This is shown in Figure 7, which gives the evolution of the coeffi-
cient on lagged inflation in a simple specification regressing CPI inflation on
a constant term, itself lagged and the unemployment rate, using annual data
26 OLIVIER BLANCHARD
since 1948, and backward-looking rolling samples of 15 years. It shows the
increase in the coefficient early on, the long period of stability around 1, and
the sharp recent decline. The coefficient today is not significantly different
from zero.
A small detour: There is another dimension of change of the Phillips
curve which is not directly relevant to the issue at hand, but is much dis-
cussed and must be mentioned. Since the mid 1990s, the coefficient mea-
suring the effect of unemployment on inflation has become smaller and less
precisely estimated over time (see for example Blanchard et al. 2015, and
Miles et al 2017). The origin of this decrease remains largely mysterious.
This smaller and imprecise estimate makes it hard to pin down what the nat-
ural rate, and raises additional challenges for macroeconomic policy. Some
researchers have argued that unemployment no longer has an effect on in-
flation, at least over some unemployment and inflation range. If it were true,
this would have dramatic implications for macroeconomic policy (see for
example Farmer 2013), or Dupraz et al (2017) for the implications of strict
downward nominal wage rigidity). I find it difficult to believe that a tighter
labor market does not lead to more upward pressure on real wages, and in
turn, given expected inflation, upward pressure on nominal wage inflation.
Indeed, I read the evidence as suggesting that the effect of unemployment
on wage determination and in turn on wage inflation, while smaller, remains
positive.
Returning to the decrease in the coefficient on past inflation, there can be
little doubt that is primarily a change in expectation formation: more specif-
ically, that those setting prices and wages now react less to movements in
past inflation. However, as the Lucas critique has made clear, even a zero co-
efficient does not imply that there is an exploitable trade-off between unem-
ployment and inflation. Thus, the question is what hides behind this change
NATURAL RATE HYPOTHESIS 27
-0.5
0
0.5
1
1.5
2
1962 1968 1974 1980 1986 1992 1998 2004 2010 2016
Lagged inflation coefficient +/- 1 std15-year rolling samples
Figure 7:
in expectations.
I can think of two explanations. First, more stable inflation expectations
may arise from increased credibility of monetary policy. In turn, monetary
policy may be more credible because of the adoption of inflation targeting, a
more explicit target for inflation, and the decrease in the standard deviation
of inflation. Second, the experience of low and stable inflation may mean
that it is no longer salient, and movements in inflation are ignored by wage
and price setters. To quote Alan Greenspan (2001): “Price stability is best
thought of as an environment in which inflation is so low and stable over
time that it does not materially enter into the decisions of households and
firms.”
Which of these explanations is more relevant has important implications
for the natural rate hypothesis. Under the first explanation, any attempt by
the central bank to decrease unemployment below the natural rate and, in
28 OLIVIER BLANCHARD
doing so, increase core inflation will decrease credibility and lead to an ad-
justment of expectations. Under the second, the central bank may be able
to decrease unemployment and increase inflation without affecting expec-
tations, so long as inflation remains low enough not to become salient.
How can one tell which of the hypotheses is more relevant? If credibil-
ity of the inflation target is the underlying explanation, then inflation ex-
pectations should respond more to core inflation, and less to deviations of
headline inflation from core. If instead, decreased salience is the reason, one
should find that inflation expectations respond little to core, but respond to
deviations of headline from core, coming for example from sharp, and thus
more salient, changes in gas prices.
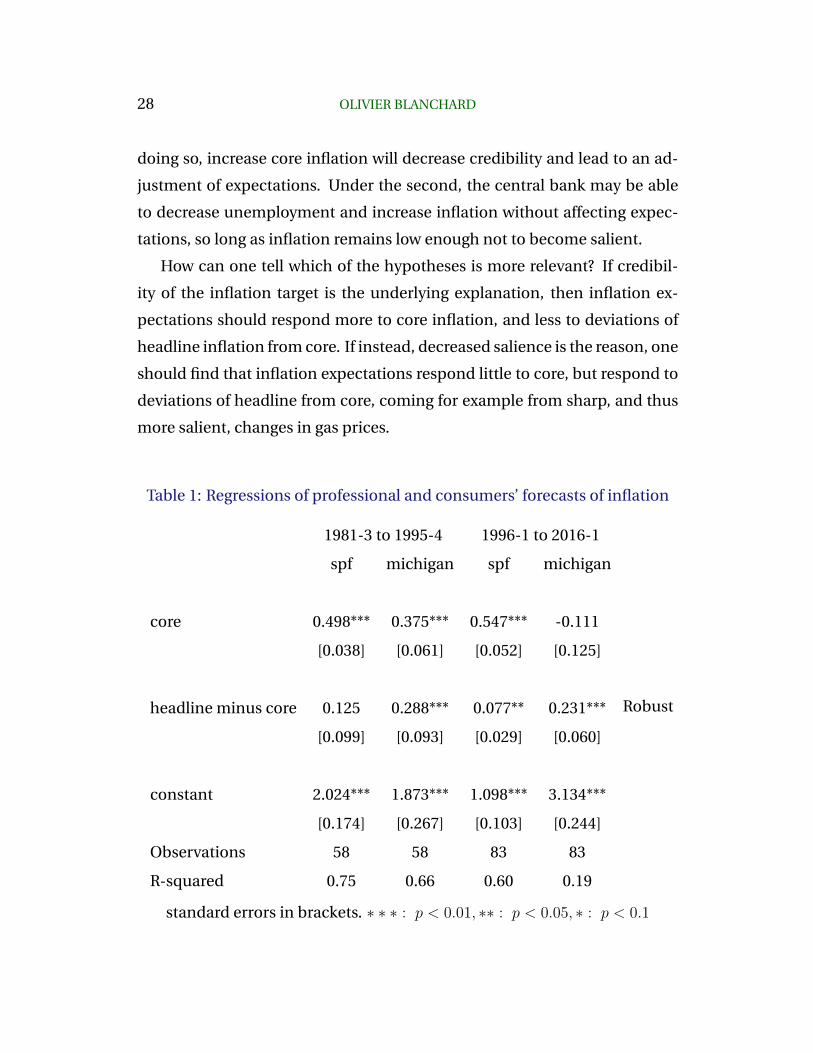
Table 1: Regressions of professional and consumers’ forecasts of inflation
1981-3 to 1995-4 1996-1 to 2016-1
spf michigan spf michigan
core 0.498*** 0.375*** 0.547*** -0.111
[0.038] [0.061] [0.052] [0.125]
headline minus core 0.125 0.288*** 0.077** 0.231***
[0.099] [0.093] [0.029] [0.060]
constant 2.024*** 1.873*** 1.098*** 3.134***
[0.174] [0.267] [0.103] [0.244]
Observations 58 58 83 83
R-squared 0.75 0.66 0.60 0.19
Robust
standard errors in brackets. ∗ ∗ ∗ : p < 0.01, ∗∗ : p < 0.05, ∗ : p < 0.1
NATURAL RATE HYPOTHESIS 29
Given this motivation, Table 1 shows the results of regressions of infla-
tion expectations on core and headline inflation. It looks at two measures of
inflation expectations: the forecast of one-year ahead inflation as reported
by the Survey of Professional Forecasters (columns 1 and 3), and the forecast
constructed from the Michigan survey of consumers (columns 2 and 4). (5
(One wishes that there was a corresponding series of inflation forecasts held
by firms, but such a series does not exist.) The first explanatory variable is
a four-quarter moving average of core inflation—the Consumer Price Index
excluding volatile energy and food prices. The second explanatory variable
is the 4-quarter moving average of headline inflation minus core inflation.
The first two columns look at the subperiod 1981-3 to 1995-4, while the last
two columns look at the subperiod 1996-3 to 2016-1. The basic results in the
table are robust to using 2-quarter to 8-quarter averages, and to dividing the
sample at any date in the 1990s.
The regression results suggest two conclusions. First, professional fore-
casters put more weight on core than on the deviation of headline from core.
In the more recent sample, the weight on core has increased, the weight on
the deviation has decreased, suggesting indeed higher credibility of mone-
tary policy.
Second, consumers put instead more weight on the deviation of headline
minus core than on core. And in the more recent sample, they appear not to
put any weight on core (I have no ready explanation for the negative, but
insignificant, coefficient on core), and some weight, although less than be-
fore, on the deviation of headline from core. This is suggestive of decreased
salience: Consumers now ignore inflation, unless some large change, such
5The questions asked of consumers are: During the next 12 months, do you think pricesin general will go up, or go down, or stay where they are? If people answer “up” or “down”,they are then asked: By about what percent do you expect prices to go (up/down) on theaverage, during the next 12 months? If they give an answer greater than 5%, they are probedto make sure they understood the question. The details of aggregation are given in Curtin(1996)]. What is reported is the median of the distribution.
30 OLIVIER BLANCHARD
as a change in gas or food prices, takes place.
To summarize: The econometric relation between unemployment and
inflation today is at odds with the accelerationist hypothesis, suggesting that
inflation expectations have become largely non-responsive to actual infla-
tion. While increased credibility of policy is clearly a factor, the evidence
from consumers’ expectations suggests that decreased salience may be at
work. To the extent that these expectations, together with those of firms, are
the relevant determinants of wage and price decisions, then, so long as in-
flation remains low enough, there may be an exploitable persistent, if not
permanent, trade-off between unemployment and inflation.
6. Policy Implications and Conclusions
The policy implications of deviations from the natural rate hypothesis de-
pend very much on the specific channels, the non-linearities, the asymme-
tries that each of these channels implies. Persistence based on loss of morale
or skills by workers may have different welfare implications from hysteresis
based on insider-outsider considerations.6 Persistence based on the effects
of long-term unemployment is more likely to be asymmetric than hystere-
sis based on the effects of activity on R&D and technological progress. It is
also more likely to be non-linear with respect to the depth and the length of
recessions. At this point, the empirical evidence is just too crude to give us
precise guidance.
Yet the basic implications of deviations from either the independence hy-
pothesis or the accelerationist hypothesis, or both, can be shown simply.
Start with the independence hypothesis. Assume that (the log of) poten-
6Gali 2016 gives a full treatment of policy implications in a model where hysteresis isderived from insider-outsider considerations. See also the analysis of optimal monetarypolicy in an insider-outsider model by Alogoskoufis (2017)
NATURAL RATE HYPOTHESIS 31
tial output, y∗ follows:
y∗(+1) = ay∗ + b(y − y∗) (1)
Potential output next period depends on potential output today and on
the deviation of actual output from potential output today. For notational
simplicity, the specification ignores all other shocks which affect potential
output, and normalizes long run potential output, if the deviation of output
from potential is equal to zero, to be equal to zero.
The parameter b captures the effect of the output gap on potential out-
put, and the parameter a captures the persistence of the effect. Under the
strict independence hypothesis, b is equal to zero. Under the strict hystere-
sis hypothesis, b is positive and a is equal to one. I have argued however that
these two cases are too extreme. In most models (and in reality...), b is likely
to be positive, and a to be less than one. We can think of the independence
hypothesis as small values of b and a, and the hysteresis hypothesis as large
values of b and a.
Turn to the accelerationist hypothesis. Assume that the relation between
inflation and output is given by:
π = c(y − y∗) + Eπ where Eπ = 0 for − x ≤ π ≤ x, π(−1) otherwise (2)
Inflation depends on the deviation of output from potential, and on ex-
pected inflation. Salience is captured by the parameter x. So long as inflation
or deflation are smaller than x, expected inflation is constant, normalized
here to zero. If inflation or deflation exceed x, inflation or deflation become
salient, and are assumed to be equal to lagged inflation. Thus, deviations
from the accelerationist hypothesis are captured by positive values of x.
32 OLIVIER BLANCHARD
Now, consider the trade-off between inflation and output under different
assumptions.
Suppose first that both the independence hypothesis and the accelera-
tionist hypothesis strictly hold, so b in equation (1) and x in equation (2) are
equal to zero. Consider a one-period increase in the output gap, y−y∗ ≡ ∆ >
0. From equation (2, this one-period increase leads to a permanent increase
in inflation of c∆, an unappealing trade-off.
Relax the independence assumption, so b and a are now positive. The
one-period increase in the output gap now leads to an increase in potential
output in future periods, thus a total increase of ∆(1 + b + ab + a2b + ...) =
∆ + (b/(1 − a))∆, where the first term reflects the initial output gap, and the
second reflects the sum of the increases in potential output that result from
the initial output gap. The increase in inflation is the same as before, thus
equal to c∆. In short, failure of the independence hypothesis leads to a more
appealing trade-off between output and inflation.
Relax instead the accelerationist hypothesis, so x is now positive. Assume
past inflation to be equal to zero. So long as the output gap is such that
inflation does not exceed c∆, the increase in the output gap leads to higher
current inflation, but no increase in inflation in future periods. Thus, failure
of the accelerationist hypothesis leads to a more attractive trade-off between
output and inflation.
Relax both hypotheses, and an increase in the output gap today leads to
both a larger increase in future output, and a smaller increase in future infla-
tion, with both effects leading to an even more attractive trade-off between
output and inflation.
This toy model can and should be extended in many dimensions, in par-
ticular to allow for a richer specification of the response of inflation expecta-
tions to actual inflation, for asymmetric effects of recessions and booms, for
the presence of shocks, and for uncertainty about the extent of the deviation

NATURAL RATE HYPOTHESIS 33
from the natural rate hypothesis. The general conclusion is likely to remain
the same: Failure of either of the hypothesis leads to a more attractive trade-
off between output and inflation, and, in the presence of shocks, suggests a
stronger role for stabilization policy. If the independence hypothesis fails,
adverse shocks are more costly, and stabilization policy more powerful. If
the accelerationist hypothesis fails, there is more room for stabilization pol-
icy to be used at little inflation cost.
Where does this leave us? It would be good to have a sense of the val-
ues of a, b, c and x, or more generally, a sense of the specific channels at
work. The empirical part of this paper has shown that we are still far from it.
Thus, the general advice must be that central banks should keep the natu-
ral rate hypothesis (extended to mean positive but low values of b and a) as
their baseline, but keep an open mind and put some weight on the alterna-
tives. For example, given the evidence on labor force participation and on
the stickiness of inflation expectations presented earlier, I believe that there
is a strong case, although not an overwhelming case, to allow U.S. output to
exceed potential for some time, so as to reintegrate some of the workers who
left the labor force during the last ten years.
34 OLIVIER BLANCHARD
References
[1] Stephanie Aaronson, Tomaz Cajner, Bruce Fallick, Felix Galbis-Reig,
Christopher Smith, and William Wascher. Labor force participation:
Recent developments and future prospects. Brookings Papers on Eco-
nomic Activity, pages 197–272, Fall 2014.
[2] Katherine Abraham, John Haltiwanger, Kristin Sandusky, and James
Spletzer. The consequences of long term unemployment; Evidence
from matched employer employee data. September 2016. NBER work-
ing paper 22665.
[3] George Alogoskoufis. The clash of central bankers with labor market in-
siders, and the persistence of inflation and unemployment. Economica,
pages 1–25, March 2016.
[4] Diego Anzaotegui, Diego Comin, Mark Gertler, and Joseba Martinez.
Endogenous technology adoption and R&D as sources of business cycle
persistence. February 2016. NBER working paper 22005.
[5] David Autor and Mark Duggan. The growth in the social security dis-
ability rolls: A fiscal crisis unfolding. Journal of Economic Perspectives,
20(3):71–96, Summer 2006.
[6] Laurence Ball. Hysteresis in unemployment: Old and new evidence.
March 2009. Fuhrer(ed.), A Phillips Curve Retrospective, Federal Re-
serve Bank of Boston and MIT Press.
[7] Laurence Ball. Long-term damage from the Great Recession in OECD
countries. European Journal of Economics and Economic Policies, pages
149–160, September 2014.
NATURAL RATE HYPOTHESIS 35
[8] Olivier Blanchard, Eugenio Cerutti, and Lawrence Summers.
Inflation and activity. Two explorations, and their monetary
policy implications. ECB E-Book, “Inflation and Unemploy-
ment in Europe”, 2015. ECB Forum on Central Banking,
www.ecb.europa.eu/pub/pdf/other/ecbforumoncentralbanking2015en.pdf.
[9] Olivier Blanchard and Peter Diamond. Ranking, unemployment dura-
tion and wage determination. Review of Economic Studies, 61(3):417–
434, June 2014.
[10] Olivier Blanchard and Lawrence Summers. Hysteresis and the Euro-
pean unemployment problem. NBER Macroeconomics Annual, 1:15–
78, 1986. Stanley Fischer (editor) , MIT Press.
[11] Olivier Blanchard and Justin Wolfers. Shocks and institutions and the
rise of European unemployment. The aggregate evidence. Economic
Journal, 110(1):1–33, March 2000.
[12] Ricardo Caballero and Mohamed Hammour. The cleansing effect of
recessions. American Economic Review, 84(1):1350–1368, 1994.
[13] Lawrence Christiano, Martin Eichenbaum, and Mathias Trabandt. Un-
employment and business cycles. Econometrica, 84:1523–1569, 2016.
[14] Benoit Coeure. Scars or scratches? Hys-
teresis in the euro area. May 2017.
www.ecb.europa.eu/press/key/date/2017/html/ecb.sp170519.en.html.
[15] Richard Curtin. Procedure to estimate price expectations. January 1996.
memo, University of Michigan.
[16] Paul de Grauwe and Claudia Costa Storti. The effects of monetary pol-
icy: A meta-analysis. June 2004. CESifo working paper 1224.
36 OLIVIER BLANCHARD
[17] Stephane Dupraz, Emi Nakamura, and Jon Steinsson. A plucking model
of business cycles. May 2017. manuscript, Columbia University.
[18] Roger Farmer. The natural rate hypothesis: An idea past its sell-by date.
Bank of England Quarterly Bulletin, 2013. Houblon-Norman essay.
[19] John Fernald. Productivity and potential output before, during, and
after the great recession. June 2014. Federal Reserve Bank of San Fran-
cisco, working paper 2014-15.
[20] Lucia Foster, Cheryl Grim, and John Haltiwanger. Reallocation in the
great recession. August 2014. NBER working paper 20427.
[21] Jordi Gali. Insider-outsider labor markets, hysteresis and monetary pol-
icy. April 2016. Universitat Pompeu Fabra working Paper 1506.
[22] Alan Greenspan. Transparency in monetary policy. October 2001. Re-
marks to the Federal Reserve Bank of St. Louis Economic Policy Confer-
ence.
[23] Don Harding and Adrian Pagan. Dissecting the cycle: A methodological
investigation. Journal of Monetary Economics, 49(2):365–381, 2002.
[24] Alan Krueger, Judd Cramer, and David Cho. Are the long-term unem-
ployed on the margins of the labor market? Brookings Papers on Eco-
nomic Activity, pages 229–299, Spring 2014.
[25] David Miles, Ugo Panizza, Ricardo Reis, and Angel Ubide. And yet it
moves. Inflation and the great recession. Geneva Reports on the World
Economy, 2017. ICMB and CEPR.
[26] George Perry. Changing labor markets and inflation. Brookings Papers
on Economic Activity, 3:411–448, 1970.
NATURAL RATE HYPOTHESIS 37
[27] George Perry. Slowing the wage-price spiral: The macroeconomic view.
Brookings Papers on Economic Activity, 2:259–299, 1978.
[28] Edmund Phelps. Inflation policy and unemployment theory: The cost-
benefit approach to monetary planning. MacMillan, London, 1972.
[29] Lawrence Summers. Fiscal policy and full employment. April 2014.
Speech at Center for Budget and Policy Priorities Event on Full Employ-
ment.
[30] Danny Yagan. Employment hysteresis from the Great Recession.
September 2017. NBER working paper 23844.


![Olivier Blanchard Pearson Education - Continental Economicscontinentaleconomics.com/files/Restri_es_da_pol_tica_macroecon_m… · Microsoft PowerPoint - ch24_4e_t [Modo de Compatibilidade]](https://static.fdocuments.us/doc/165x107/5f0247db7e708231d4037b55/olivier-blanchard-pearson-education-continental-economics-microsoft-powerpoint.jpg)