Oklahoma Groundwater Vulnerability Assessment · Vulnerability Assessment V ... of the impact on...
18
8 Vulnerability Assessment VULNERABILITY As used in this report, vulnerability refers to the sensitivity of groundwater to contamination, and is determined by intrinsic characteristics of the aquifer. It is distinct from pollution risk, which depends not only on vulnerability but also on the existence of pollutant loading. The seriousness of the impact on water use depends on the extent and magnitude of the pollution episode and the value of the groundwater resource. DRASTIC The EPA developed DRASTIC to be a standardized system for evaluating groundwater vulnera- bility to pollution. The primary purpose of DRASTIC is to provide assistance in resource allocation and prioritization of many types of groundwater-related activities and to provide a practical educational tool. The method has four assumptions: 1. the contaminant is introduced at the ground surface; 2. the contaminant is flushed into the groundwater by precipitation; 3. the contaminant has the mobility of water; 4. the area being evaluated by DRASTIC is 100 acres or larger. DRASTIC was not designed to deal with pollutants introduced in the shallow or deep subsurface by methods such as leaking underground storage tanks, animal waste lagoons, or injection wells. The methodology is not designed to replace on-site investigations or to locate any type of facility or practice. For example, DRASTIC does not reflect the suitability of a site for waste disposal. Although DRASTIC may be one of many criteria used in siting decisions, it should not be the sole criterion. DRASTIC considers seven hydrogeologic factors, which are described below: Depth to Water (D): The depth to water is the distance, in feet, from the ground surface to the water table. It determines the depth of material through which a contaminant must travel before reaching the aquifer. Thus, the shallower the water depth, the more vulnerable the aquifer is to pollution. Net Recharge (R): The primary source of recharge is precipitation, which infiltrates through the ground surface and percolates to the water table. Net recharge is the total quantity of water per unit area, in inches per year, which reaches the water table. Recharge is the principal vehicle for leaching and transporting contaminants to the water table. The more the recharge, the greater the chance for contaminants to reach the water table. Aquifer Media (A): Aquifer media refers to the consolidated or unconsolidated rock that serves as an aquifer. The larger the grain size and the more fractures or openings within the aquifer, the higher the permeability, and thus vulnerability, of the aquifer. In unconsolidated aquifers, the
Transcript of Oklahoma Groundwater Vulnerability Assessment · Vulnerability Assessment V ... of the impact on...

8
Vulnerability Assessment
VULNERABILITY As used in this report, vulnerability refers to the sensitivity of groundwater to contamination, and is determined by intrinsic characteristics of the aquifer. It is distinct from pollution risk, which depends not only on vulnerability but also on the existence of pollutant loading. The seriousness of the impact on water use depends on the extent and magnitude of the pollution episode and the value of the groundwater resource. DRASTIC The EPA developed DRASTIC to be a standardized system for evaluating groundwater vulnera-bility to pollution. The primary purpose of DRASTIC is to provide assistance in resource allocation and prioritization of many types of groundwater-related activities and to provide a practical educational tool. The method has four assumptions:
1. the contaminant is introduced at the ground surface; 2. the contaminant is flushed into the groundwater by precipitation; 3. the contaminant has the mobility of water; 4. the area being evaluated by DRASTIC is 100 acres or larger.
DRASTIC was not designed to deal with pollutants introduced in the shallow or deep subsurface by methods such as leaking underground storage tanks, animal waste lagoons, or injection wells. The methodology is not designed to replace on-site investigations or to locate any type of facility or practice. For example, DRASTIC does not reflect the suitability of a site for waste disposal. Although DRASTIC may be one of many criteria used in siting decisions, it should not be the sole criterion. DRASTIC considers seven hydrogeologic factors, which are described below: Depth to Water (D): The depth to water is the distance, in feet, from the ground surface to the water table. It determines the depth of material through which a contaminant must travel before reaching the aquifer. Thus, the shallower the water depth, the more vulnerable the aquifer is to pollution. Net Recharge (R): The primary source of recharge is precipitation, which infiltrates through the ground surface and percolates to the water table. Net recharge is the total quantity of water per unit area, in inches per year, which reaches the water table. Recharge is the principal vehicle for leaching and transporting contaminants to the water table. The more the recharge, the greater the chance for contaminants to reach the water table. Aquifer Media (A): Aquifer media refers to the consolidated or unconsolidated rock that serves as an aquifer. The larger the grain size and the more fractures or openings within the aquifer, the higher the permeability, and thus vulnerability, of the aquifer. In unconsolidated aquifers, the
9
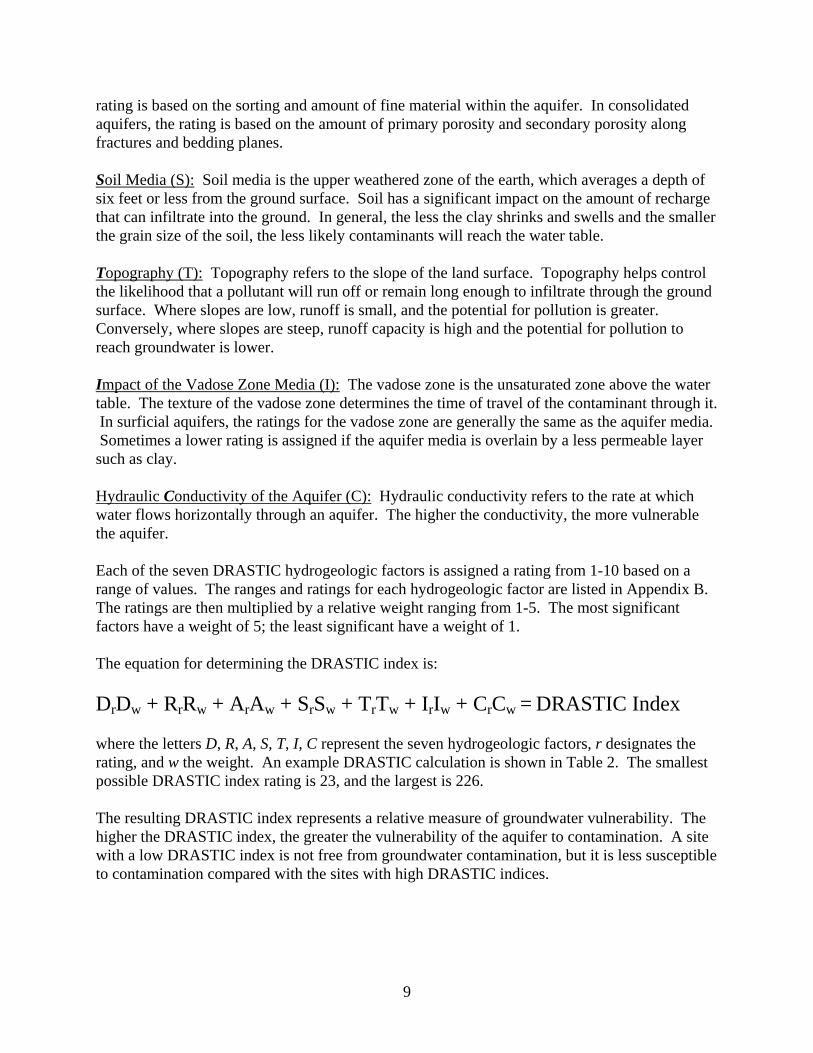
rating is based on the sorting and amount of fine material within the aquifer. In consolidated aquifers, the rating is based on the amount of primary porosity and secondary porosity along fractures and bedding planes. Soil Media (S): Soil media is the upper weathered zone of the earth, which averages a depth of six feet or less from the ground surface. Soil has a significant impact on the amount of recharge that can infiltrate into the ground. In general, the less the clay shrinks and swells and the smaller the grain size of the soil, the less likely contaminants will reach the water table. Topography (T): Topography refers to the slope of the land surface. Topography helps control the likelihood that a pollutant will run off or remain long enough to infiltrate through the ground surface. Where slopes are low, runoff is small, and the potential for pollution is greater. Conversely, where slopes are steep, runoff capacity is high and the potential for pollution to reach groundwater is lower. Impact of the Vadose Zone Media (I): The vadose zone is the unsaturated zone above the water table. The texture of the vadose zone determines the time of travel of the contaminant through it. In surficial aquifers, the ratings for the vadose zone are generally the same as the aquifer media. Sometimes a lower rating is assigned if the aquifer media is overlain by a less permeable layer such as clay. Hydraulic Conductivity of the Aquifer (C): Hydraulic conductivity refers to the rate at which water flows horizontally through an aquifer. The higher the conductivity, the more vulnerable the aquifer. Each of the seven DRASTIC hydrogeologic factors is assigned a rating from 1-10 based on a range of values. The ranges and ratings for each hydrogeologic factor are listed in Appendix B. The ratings are then multiplied by a relative weight ranging from 1-5. The most significant factors have a weight of 5; the least significant have a weight of 1. The equation for determining the DRASTIC index is: DrDw + RrRw + ArAw + SrSw + TrTw + IrIw + CrCw = DRASTIC Index where the letters D, R, A, S, T, I, C represent the seven hydrogeologic factors, r designates the rating, and w the weight. An example DRASTIC calculation is shown in Table 2. The smallest possible DRASTIC index rating is 23, and the largest is 226. The resulting DRASTIC index represents a relative measure of groundwater vulnerability. The higher the DRASTIC index, the greater the vulnerability of the aquifer to contamination. A site with a low DRASTIC index is not free from groundwater contamination, but it is less susceptible to contamination compared with the sites with high DRASTIC indices.

10
Table 2. DRASTIC ranges, ratings, numbers, and index calculation for the Ogallala hydrogeologic basin HYDROGEOLOGIC BASIN: Ogallala HYDROGEOLOGIC
FACTOR
RANGE
WEIGHT
RATING
NUMBER
Depth to Water (ft)
>100
5
1
5
Net Recharge (in/yr)
0-2
4
1
4
Aquifer Media
sand and gravel
3
7
21
Soil Media
clay loam to fine sandy loam, and loamy fine sand
2
5
10
Topography (% slope)
0-2
1
10
10
Impact Vadose Zone
sand and gravel with silt, clay & caliche
5
6
30
Hydraulic Conductivity (gpd/ft2)
100-300
3
2
6
DRASTIC Index
86
For a complete discussion of the DRASTIC method, refer to the EPA publication DRASTIC: A Standardized System for Evaluating Ground Water Pollution Potential Using Hydrogeologic Settings by Aller and others (1987). METHODOLOGY Each hydrogeologic basin was evaluated in terms of DRASTIC's seven hydrogeologic factors. One rating for each factor was assigned to each hydrogeologic basin, and one DRASTIC index was calculated for each basin. The ArcView (ESRI, 1997) Geographic Information System (GIS) was used to compile the geospatial data, to compute the DRASTIC indices, and to generate the final vulnerability map. The DRASTIC ranges, ratings, numbers, and indices for each hydrogeologic basin are listed in Appendix C. Depth to water (D) was determined for each hydrogeologic basin from the average depth to the first water zone, obtained from the OWRB database of well drillers' logs. Figure 4 shows the DRASTIC ratings for depth to water, by basin. Average depth to water ranges from 15-30 feet in alluvium and terrace deposits to greater than 100 feet in the Ogallala basin. Net recharge (R) rates for the basins were obtained from the literature; when not available in the literature, rates were estimated based on those of basins with similar lithology, topography, and


12
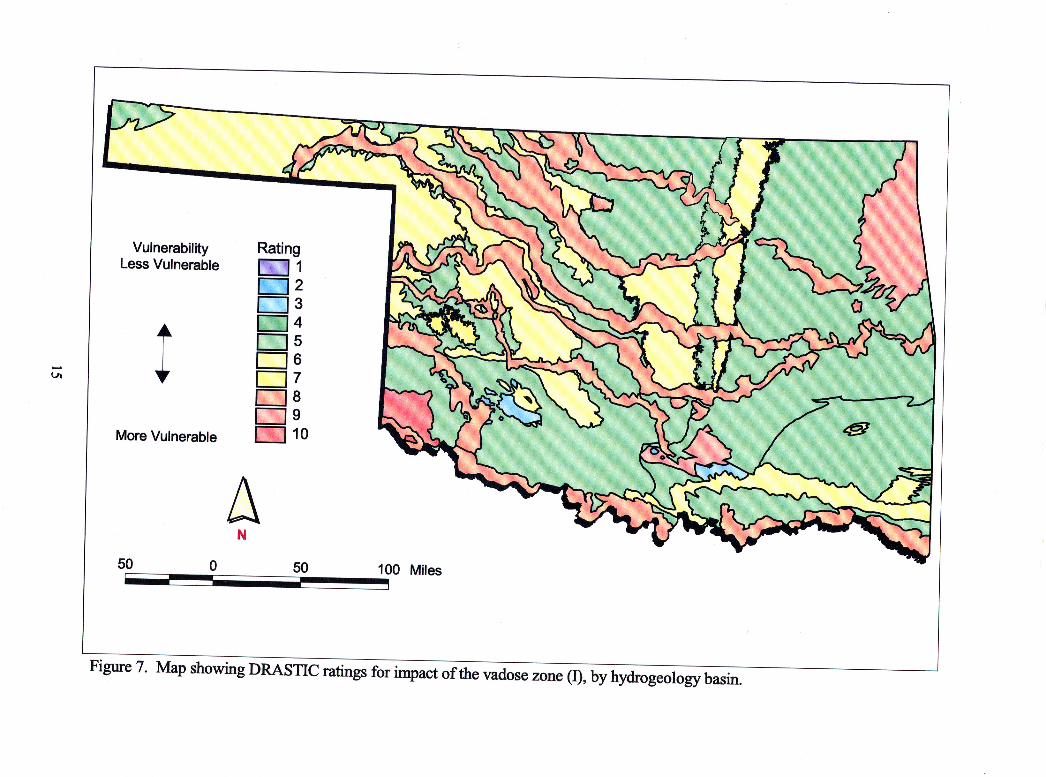
climatic conditions. As can be seen in Figure 5, recharge rates for most of the basins are in the ranges of 0-2 and 2-4 inches per year. Estimated recharge rates for the Boone and Arbuckle-Simpson basins are 4-7 inches per year. Information on aquifer media (A) and impact of the vadose zone media (I) was obtained from groundwater basin studies and the hydrologic atlases of Oklahoma. Because all of the hydrogeologic basins in this study are exposed at the surface, the ratings for these factors are the same unless data were available suggesting that the permeability in the shallow portion of the basin differs from deeper portions. The Ogallala basin, for example, has layers of caliche in the unsaturated zone that make the vadose zone less permeable than the deeper, saturated portion of the aquifer. DRASTIC ratings for aquifer media and the impact of the vadose zone are shown in Figures 6 and 7. Ratings assigned to the hydrogeologic basins range from 2 for the basins composed of igneous rocks, to 10 for the cavernous Blaine basin in southwestern Oklahoma. The DRASTIC rating for soil media (S) was determined with soil information from the U.S. Department of Agriculture's State Soil Geographic Database (STATSGO), represented on a 1:250,000-scale map. Twenty-four surface texture classifications were identified in Oklahoma from the STATSGO data, and are displayed in Figure 8. The soil textures were assigned a DRASTIC rating based on thickness, type of clay, texture, and permeability. Map units with soil textures of weathered and unweathered bedrock were generally less than 10 inches thick, as determined from the depth to bedrock. In accordance with the DRASTIC methodology, they were classified as thin or absent, and assigned a rating of 10. The clay and silty clay surface textures were evaluated in terms of their shrink/swell potential and were found to have a moderate to very high shrinkage rate. Following DRASTIC methodology, they were assigned a rating of 7. The surface texture classifications that did not directly correspond to a DRASTIC soil type were evaluated in terms of permeability. Most of the gravelly soils have moderate permeability rates of 0.6-2.0 inches per hour, and were assigned a DRASTIC rating of 5. The classifications for soil surface textures and the assigned DRASTIC ratings are listed in Table 3. After a DRASTIC rating was assigned to each soil texture, a representative DRASTIC rating was assigned to each hydrogeologic basin. To do this, ArcView GIS software computed the area-weighted average of the DRASTIC soil media ratings by basin, and generated histograms for each basin so that the modal distribution of the soil media ratings could be evaluated. In most basins, the area-weighted average was used. However, the soil media ratings did not follow normal distribution in the North Fork of the Red River, Cretaceous, and Tishomingo Granite basins. In these basins, higher DRASTIC ratings reflecting the more vulnerable soils were assigned instead of the weighted average. Figure 9 illustrates how the DRASTIC soil media rating for the Boone hydrogeologic basin was determined. As displayed graphically and in map view, DRASTIC ratings of 3, 4, and 5 were assigned based on soil texture. The area-weighted average of the soil ratings for the basin is 4.8. Although not normally distributed, a soil media rating of 5 was determined to represent the basin.


17
Table 3. Soil surface texture classifications from STATSGO data and assigned DRASTIC ratings for soil media
Soil Surface Texture
Classification
Description
DRASTIC Rating
for Soil Media UWB
unweathered bedrock
10
WB
weathered bedrock
10
FS
fine sand
9
LS
loamy sand
8
LFS
loamy fine sand
8
C
clay (shrinking)
7
SIC
silty clay (shrinking)
7
FSL
fine sandy loam
6
VFSL
very fine sandy loam
6
L
loam
5
CB-L
cobbly to loam
5
CR-L
cherty to loam
5
CRV-SIL
very cherty to silt loam
5
ST-L
stony to loam
5
ST-FSL
stony to fine sandy loam
5
STV-FSL
very stony to fine sandy loam
5
GR-FSL
gravelly to fine sandy loam
5
GR-L
gravelly to loam
5
GRV-FSL
very gravelly to fine sandy loam
5
GRV-SIL
very gravelly to silt loam
5
SIL
silt loam
4
FL-SIL
flaggy to silt loam
4
SICL
silty clay loam
3
CL
clay loam
3


19
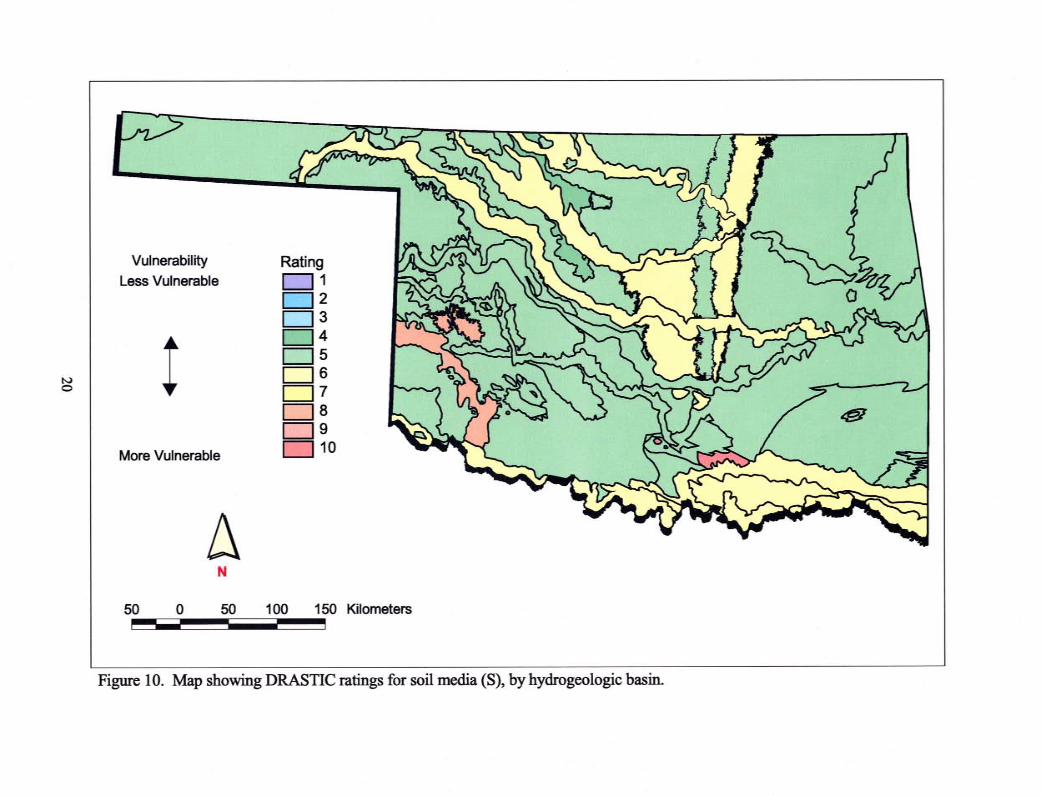
Figure 10 shows the DRASTIC ratings for soil media by basin. Ratings range from 4 to 10, with most between 5 and 6. The highest (most vulnerable) rating of 10 was assigned to the Tishomingo granite, where the soil is thin or absent. The DRASTIC ratings for topography (T) are based on percent slope. The GIS software calculated the average slope for each basin from the USGS's Digital Elevation Model (DEM), with a 60-meter cell resolution. As can be seen in Figure 11, most basins have average slopes in the ranges of 0-2 and 2-6 percent. The greatest degree of slope occurs in the Ouachita and Wichita mountains, with a range of 6-12 percent. Hydraulic conductivity (C) values for the basins were derived from literature; when not available, values were estimated based on those basins with similar lithology. Figure 12 shows the DRASTIC ratings for hydraulic conductivity. Values range from 1-100 gpd/ft2 for many bedrock basins to 700-1,000 gpd/ft2 for the alluvium and terrace basins.


23
Table 5. DRASTIC numbers, indices, and vulnerability classifications, by hydrogeologic basin
BASIN
D
R
A
S
T
I
C
INDEX
VULNERABIL
ITY CLASSIFICAT
ION of the North Fork of the Red River
35
12
24
16
10
40
18
155
of the Salt Fork of the Arkansas River
35
12
24
12
10
40
18
151 of the Red River
35
12
24
12
10
40
18
151
of the Washita River
35
12
24
10
10
40
18
149 Enid Isolated Terrace
35
12
24
10
10
40
18
149
of the Canadian River
35
12
24
10
9
40
18
148 of the Arkansas River
35
12
24
10
9
40
18
148
of the Cimarron River
35
12
24
12
10
40
12
145 of the North Canadian River
35
12
24
12
10
40
12
145
Very High
Gerty Sand
25
4
24
12
9
40
12
126
High
Alluvium
and Terrace Deposits
all other alluvium and terrace deposits
125-155
High-Very High
Boone
15
24
27
10
9
45
3
133 Arbuckle-Simpson
15
24
27
10
9
45
3
133
Blaine
15
4
30
10
10
50
12
131 Elk City
25
12
21
16
10
35
3
122
High
Cedar Hills
25
12
18
8
10
30
3
106
Antlers
25
4
21
12
9
30
3
104 Arbuckle-Timbered Hills
25
4
18
10
9
30
3
99
Arkansas Novaculite
25
4
18
10
5
30
3
95 Rush Springs
15
4
21
10
9
30
3
92
Vamoosa-Ada
15
4
18
12
9
30
3
91 Central Oklahoma
15
4
18
12
9
30
3
91
Moderate
Ouachita Mountains
25
4
15
10
5
25
3
87
Ogallala
5
4
21
10
10
30
6
86 Cretaceous
15
4
15
12
12
25
3
84
Permian
15
4
15
10
9
25
3
81 Pennsylvanian
15
4
15
10
9
25
3
81
Low
Mesozoic
10
4
15
10
9
25
3
76
Tishomingo Granite
10
4
6
20
10
15
3
68 Bedrock
Washita Igneous
10
4
6
10
5
15
3
53
Very Low

24
alluvium and terrace aquifers, nine were classified as very highly vulnerable, and one (the Gerty) as highly vulnerable. The DRASTIC indices for all other alluvium and terrace deposits are not displayed on the vulnerability map, but are assumed to range from 125-155, with a high to very high vulnerability. Most bedrock basins are overlain in part by alluvium and terrace deposits. Where overlain by these deposits, the vulnerability rating for the alluvium and terrace deposits should be used. Four bedrock basins were considered highly vulnerable. The Boone, Arbuckle-Simpson, and Blaine basins are composed of cavernous limestone or gypsum. These basins contain karst features, such as caves, sinkholes, and disappearing streams, which provide direct conduits for precipitation and runoff to transport contaminants to the water table. The Elk City basin has a shallow water table and consists of porous sandstone overlain by permeable sand. Seven bedrock basins were classified as moderately vulnerable. The Cedar Hills, Antlers, and Rush Springs basins consist of sandstone; the Vamoosa-Ada, and Central Oklahoma basins consist of sandstone interbedded with shale; the Arbuckle-Timbered Hills is a carbonate aquifer; and the Arkansas Novaculite produces water from highly fractured chert. Although the basins are composed of different types of aquifer media, all contain high-yielding aquifers. Five basins with DRASTIC indices between 80 and 89 were considered to have low vulnerabil-ity. The Ogallala basin, although consisting of porous, semi-consolidated sand and gravel, has a low vulnerability rating because of its deep water table. The Ouachita Mountains, Cretaceous, Permian, and Pennsylvanian basins consist of interbedded sandstone, limestone, and shale. The porosities and permeabilities of these low-yielding rock formations are low, making them less vulnerable than others. The Mesozoic, Tishomingo Granite, and Washita Igneous hydrogeologic basins have DRASTIC indices less than 80, and have a very low vulnerability. These basins are composed of igneous or sedimentary material of low permeability. MAP LIMITATIONS Groundwater vulnerability was assessed for the 30 hydrogeologic basins described in this report. The hydrogeologic basins include both major and minor aquifers, but are not always the same as an aquifer. Because the basins include only geologic formations exposed at the surface, portions of some bedrock aquifers (such as the Central Oklahoma, Rush Springs, Antlers, Arbuckle-Simpson, and the Arbuckle-Timbered Hills) that are overlain by shallower formations are not included in the vulnerability assessment. The vulnerability map shows the relative vulnerability of the hydrogeologic basins, and is based on average values for each entire basin. The map is acceptable for evaluating relative vulnerabil-ity of the basins, but it should not be used in place of site-specific assessments. The map does not show areas that will be contaminated or areas that cannot be contaminated. Whether a specific site will ever have groundwater contamination depends on the likelihood of contaminant release, the type and quantity of contaminant released, and the hydrogeologic characteristics at that location.
25
The vulnerability assessment was based on available data. The DRASTIC indices and vulnera-bility map can be updated as additional or new information becomes available. The OWRB welcomes any additional data, references, or interpretations that may be used in determining the vulnerability of groundwater. Results from this study can be used in combination with other information (such as land use, potential sources of contamination, water quality, OWRB aquifer classifications, population density, and beneficial uses of the aquifer) to identify areas where special attention or protection efforts are warranted.