
Oil Shipping Today Peter M Swift January 2005 Propeller Club, London.
47
Oil Shipping Today Peter M Swift January 2005 Propeller Club, London
-
Upload
leslie-burns -
Category
Documents
-
view
215 -
download
1
Transcript of Oil Shipping Today Peter M Swift January 2005 Propeller Club, London.
Oil Shipping Today
Peter M SwiftJanuary 2005
Propeller Club, London

Global primary energy consumption by fuelmillion tonnes oil equivalents
24%
25%
6% 6%
39%
Oil: 3563
Gas: 2286
Coal: 2412
Nuclear: 611
Hydro: 593
Source: BP
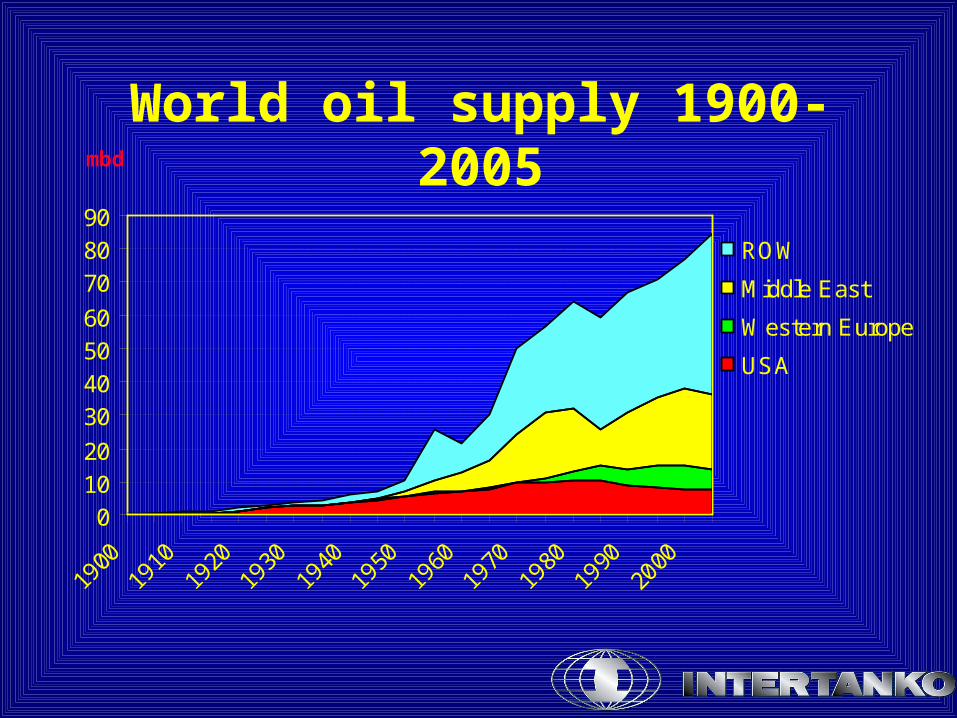
World oil supply 1900-2005mbd
01020
30405060
708090
1900
1910
1920
1930
1940
1950
1960
1970
1980
1990
2000
ROW
Middle East
Western Europe
USA
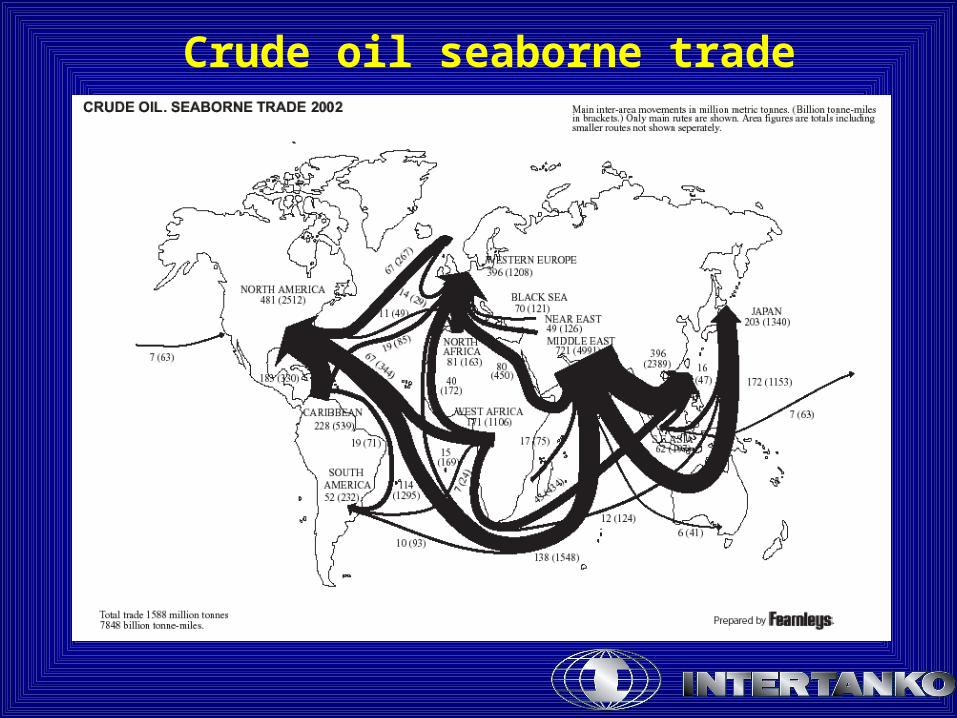
Crude oil seaborne trade

Oil consumption per capita (Litres/day - 2003)
02468
1012
US
Korea
Norway
Japa
n
OECD
Italy
Franc
e UK MEW
orldFSU
L Am
er
China
Africa In
dia
Litre

The world needs tankers
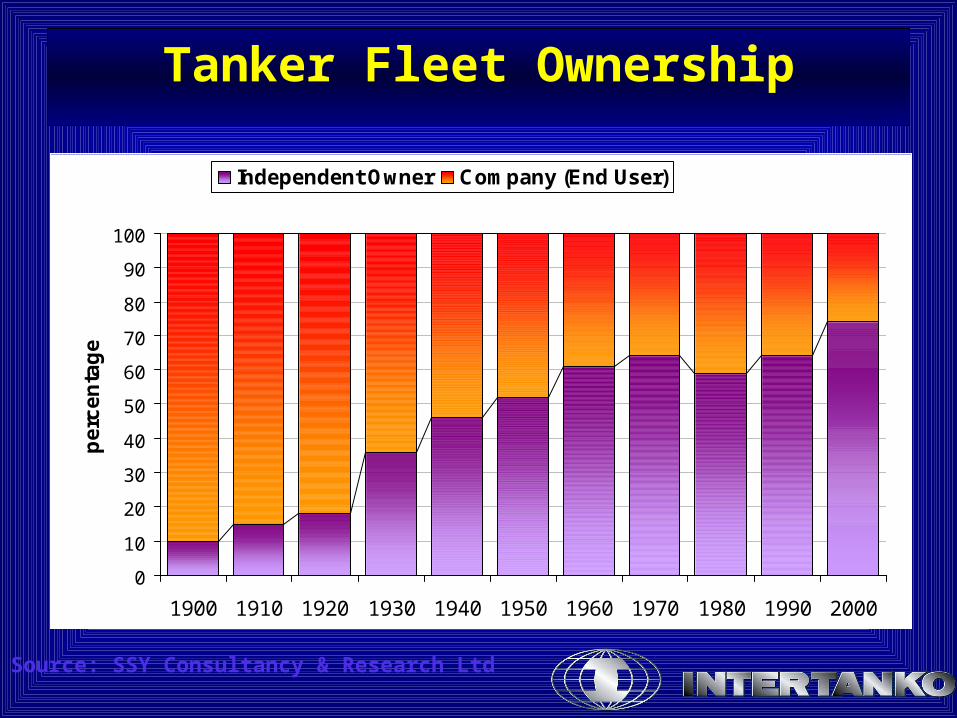
Tanker Fleet Ownership
0
10
20
30
40
50
60
70
80
90
100
1900 1910 1920 1930 1940 1950 1960 1970 1980 1990 2000
pe
rce
nta
ge
Independent Owner Company (End User)
Source: SSY Consultancy & Research Ltd
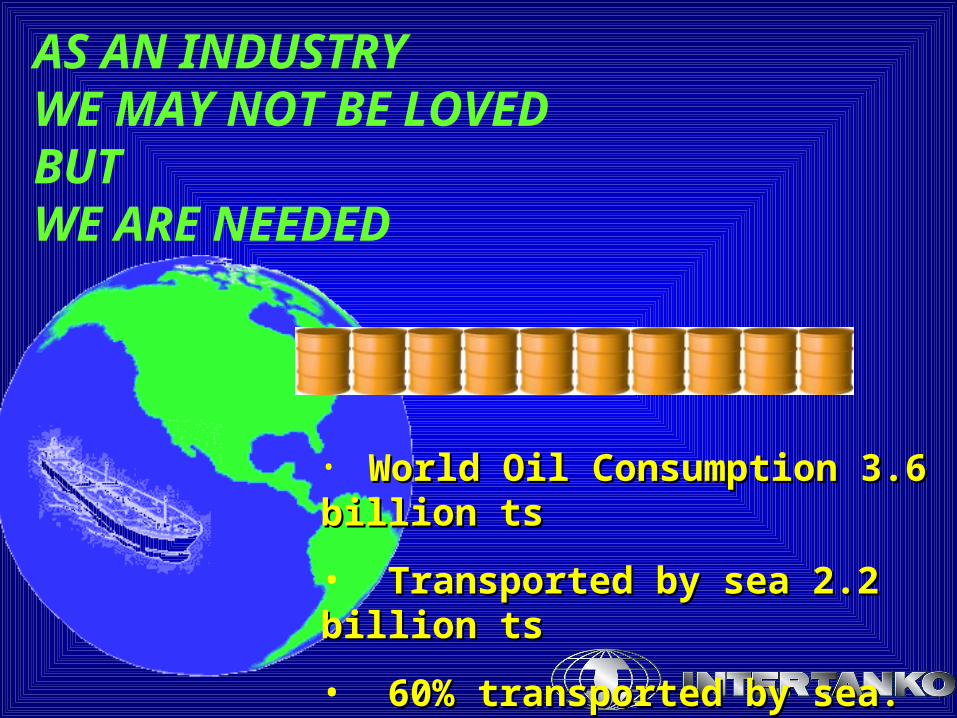
AS AN INDUSTRY WE MAY NOT BE LOVED BUT WE ARE NEEDED
• World Oil World Oil Consumption 3.6 Consumption 3.6 billion tsbillion ts
• Transported by sea Transported by sea 2.2 2.2 billion tsbillion ts
• 6060% transported by sea.% transported by sea.
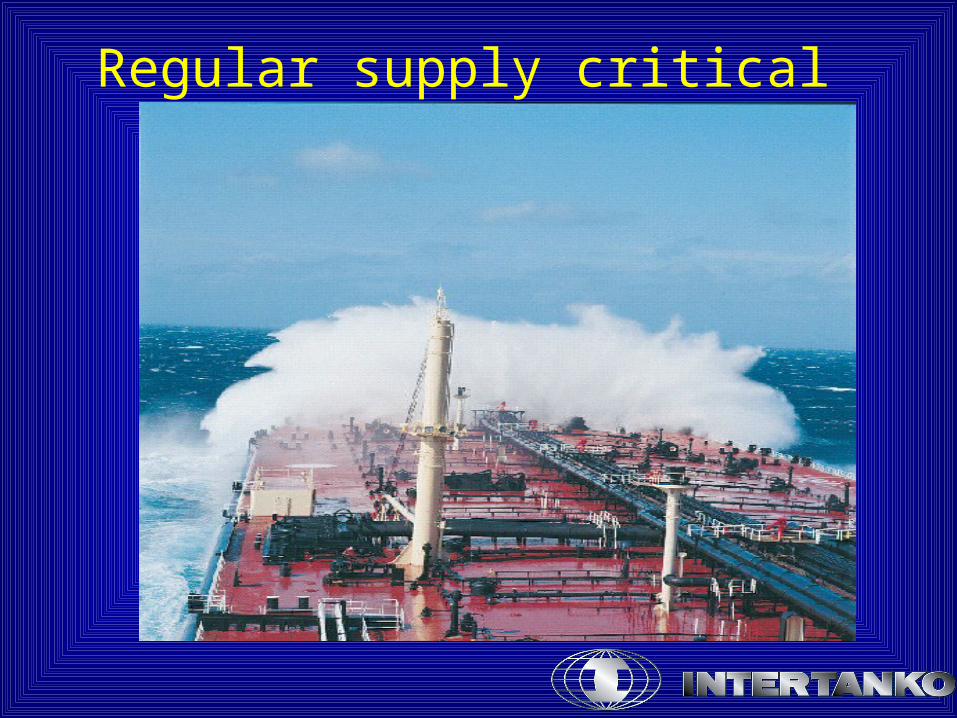
Regular supply critical

Daily VLCC spot rates
0
10
20
30
40
50
60
70
80
90
100
J ul-9
9
Oct-9
9
J an-
00
Apr-0
0
J ul-0
0
Oct-0
0
J an-
01
Apr-0
1
J ul-0
1
Oct-0
1
J an-
02
Apr-0
2
J ul-0
2
Oct-0
2
J an-
03
Apr-0
3
J ul-0
3
Oct-0
3
J an-
04
Apr-0
4
'000 U
SD
/day
Source: INTERTANKO
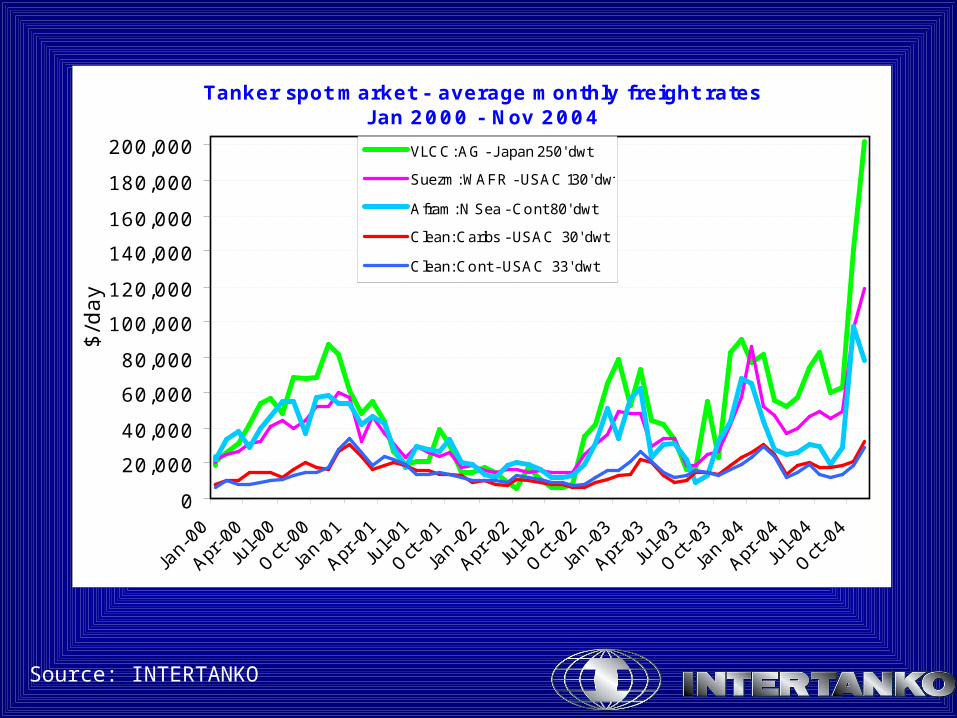
Tanker spot market - average monthly freight ratesJ an 2000 - Nov 2004
0
20,000
40,000
60,000
80,000
100,000
120,000
140,000
160,000
180,000
200,000
J an-
00
Apr-0
0
J ul-0
0
Oct-0
0
J an-
01
Apr-0
1
J ul-0
1
Oct-0
1
J an-
02
Apr-0
2
J ul-0
2
Oct-0
2
J an-
03
Apr-0
3
J ul-0
3
Oct-0
3
J an-
04
Apr-0
4
J ul-0
4
Oct-0
4
$/d
ay
VLCC: AG - J apan 250' dwt
Suezm: WAFR - USAC 130' dwt
Afram: N Sea - Cont 80' dwt
Clean: Caribs - USAC 30' dwt
Clean: Cont - USAC 33' dwt

Oil price and tanker freight rate 1970-2004
0
10
20
30
40
50
60
70
80
70 72 74 76 78 80 82 84 86 88 90 92 94 96 98 00 02
Max
04
US
D p
er b
arre
l
Nominal price Arabian Light
Real Price Arabian Light
Nominal freight rates PG-West
Deflated freight Rates PG-West
Deflated by Consumer Price Index (USD)
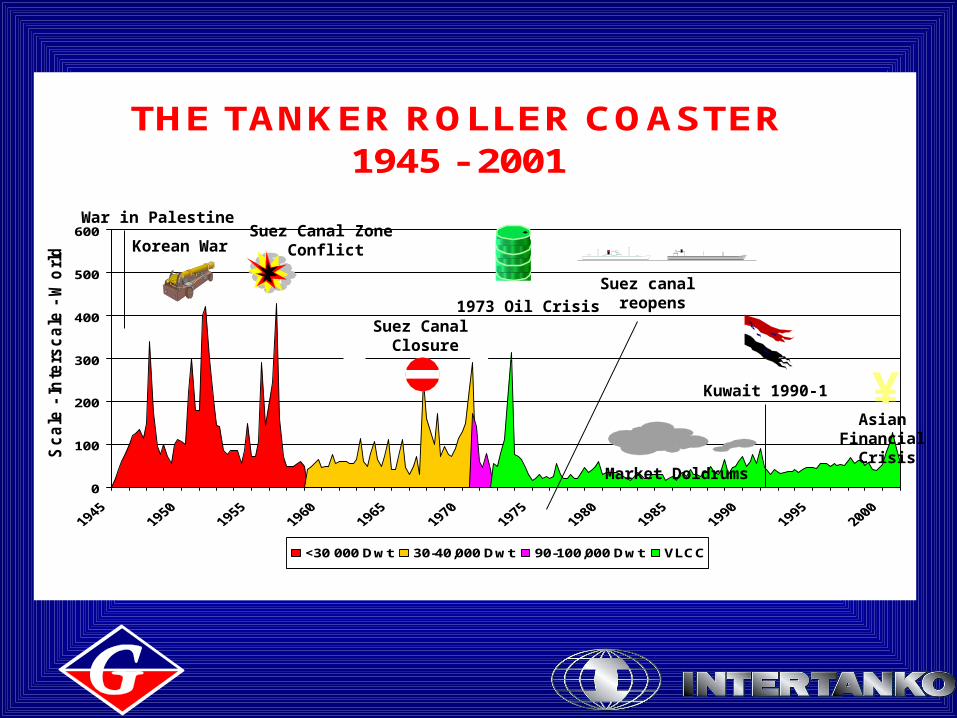
THE TANKER ROLLER COASTER 1945 - 2001
0
100
200
300
400
500
600
Sc
ale
- In
ters
ca
le -
Wo
rld
sc
ale
<30 000 Dwt 30-40,000 Dwt 90-100,000 Dwt VLCC
War in Palestine
Korean WarSuez Canal Zone
Conflict
Suez Canal Closure
1973 Oil Crisis
Suez canal reopens
Market Doldrums
Kuwait 1990-1
Asian Financial
Crisis
¥
Source: E.A. Gibson Shipbrokers
5254
5658
6062
6466
6870
7274
7678
8082
8486
8890
9294
9596
9799
20012002
2004
Years
$0.00
$0.50
$1.00
$1.50
$2.00
$2.50
$3.00
$3.50
$4.00
$4.50
$5.00
$5.50
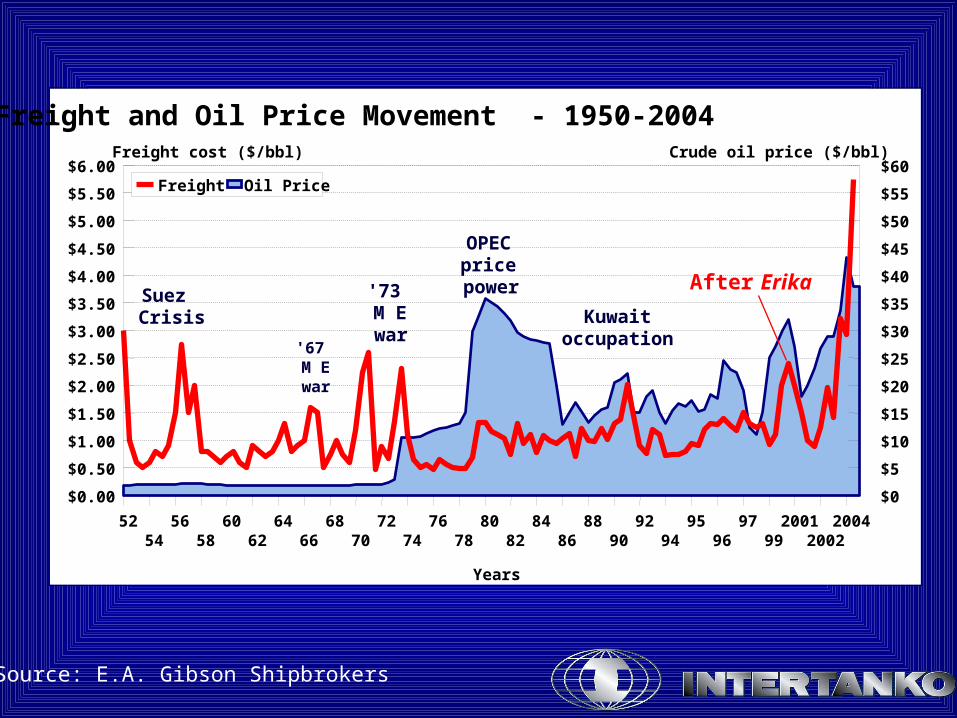
$6.00Freight cost ($/bbl)
$0
$5
$10
$15
$20
$25
$30
$35
$40
$45
$50
$55
$60Crude oil price ($/bbl)
Freight Oil Price
Freight and Oil Price Movement - 1950-2004
Suez Crisis
'67 M E war
'73 M E war
OPEC price
power
Kuwaitoccupation
After Erika
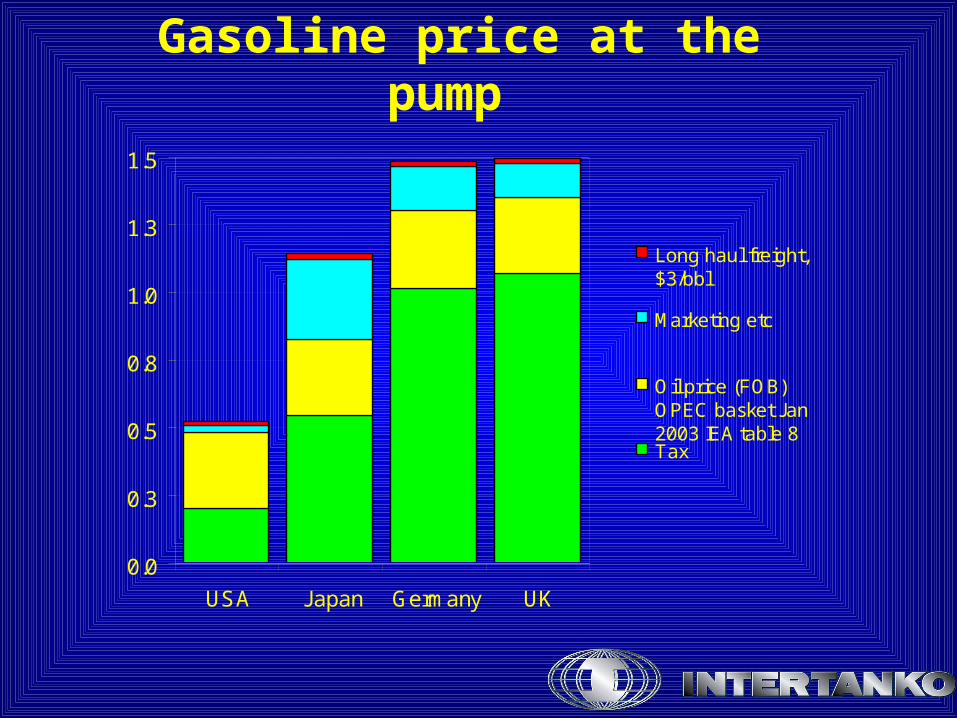
Gasoline price at the pump
0.0
0.3
0.5
0.8
1.0
1.3
1.5
USA Japan Germany UK
Long haul freight,$3/bbl
Marketing etc
Oil price (FOB)OPEC basket Jan2003 IEA table 8Tax
Cost elements making the: gasoline price:
$ per litre
INTERTANKO
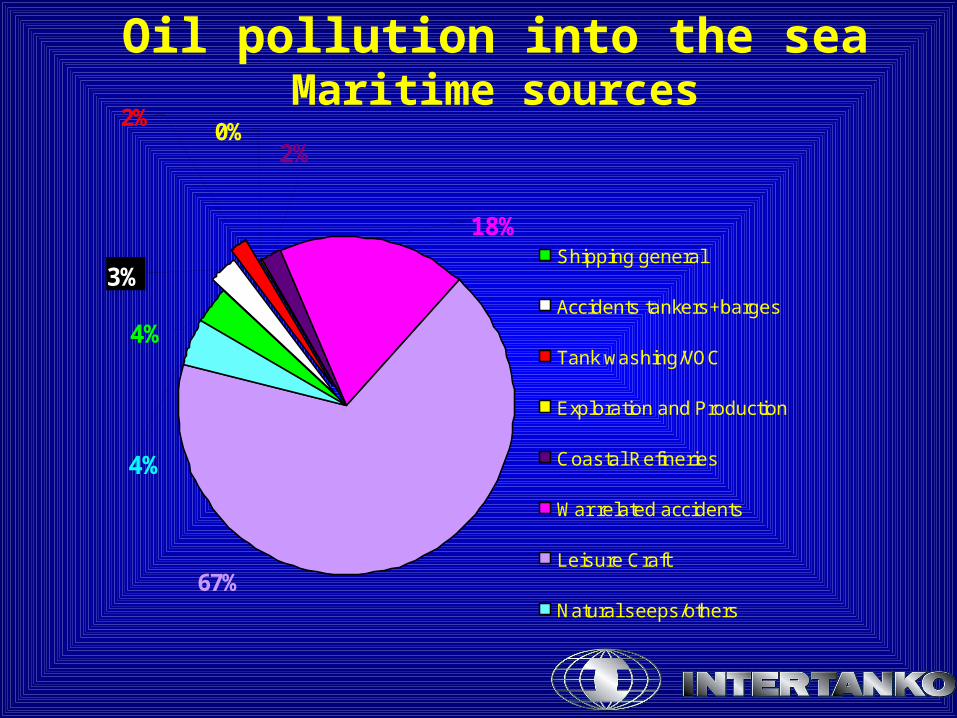
Oil pollution into the seaMaritime sources
4%
67%
4%
2%
3%
2%0%
18%Shipping general
Accidents tankers+barges
Tank washing/VOC
Exploration and Production
Coastal Refineries
War related accidents
Leisure Craft
Natural seeps/others
Tanker/barges: 5%Shippping:9% of which tanker/barge accidents 2.8%
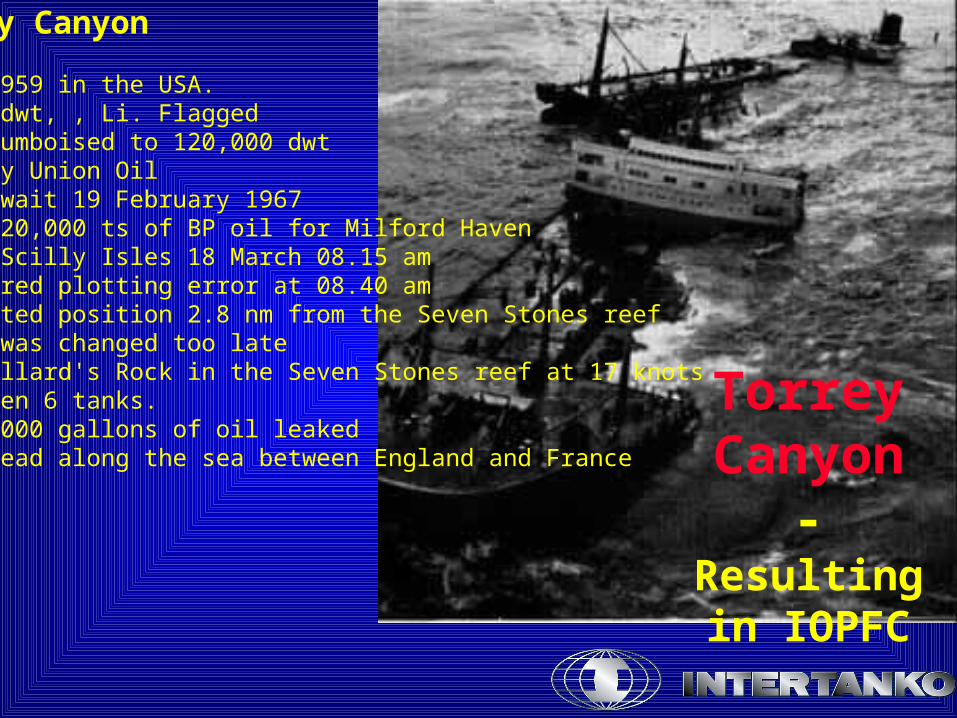
Torrey Canyon
- Resulting in IOPFC
Torrey Canyon
Built 1959 in the USA.60,000 dwt, , Li. FlaggedLater jumboised to 120,000 dwt Owned by Union OilLeft Kuwait 19 February 1967 Cargo 120,000 ts of BP oil for Milford HavenPassed Scilly Isles 18 March 08.15 am Discovered plotting error at 08.40 amRe-plotted position 2.8 nm from the Seven Stones reefCourse was changed too lateHits Pollard's Rock in the Seven Stones reef at 17 knots Rips open 6 tanks. 31,000,000 gallons of oil leaked Oil spread along the sea between England and France
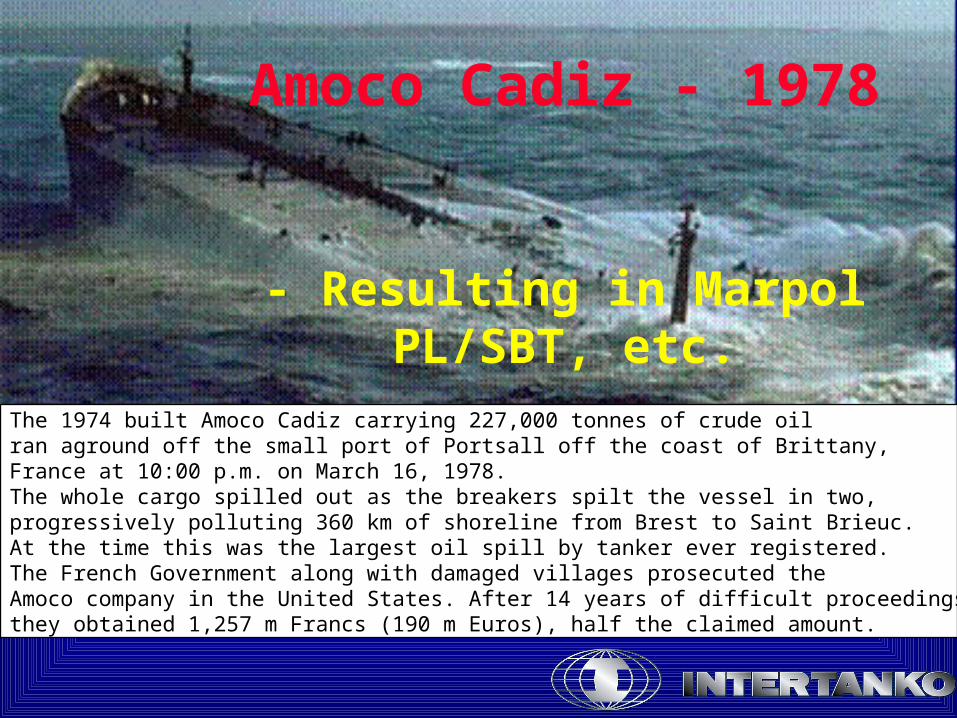
Amoco Cadiz - 1978
- Resulting in Marpol PL/SBT, etc.
The 1974 built Amoco Cadiz carrying 227,000 tonnes of crude oil ran aground off the small port of Portsall off the coast of Brittany, France at 10:00 p.m. on March 16, 1978. The whole cargo spilled out as the breakers spilt the vessel in two, progressively polluting 360 km of shoreline from Brest to Saint Brieuc.At the time this was the largest oil spill by tanker ever registered. The French Government along with damaged villages prosecuted the Amoco company in the United States. After 14 years of difficult proceedingsthey obtained 1,257 m Francs (190 m Euros), half the claimed amount.
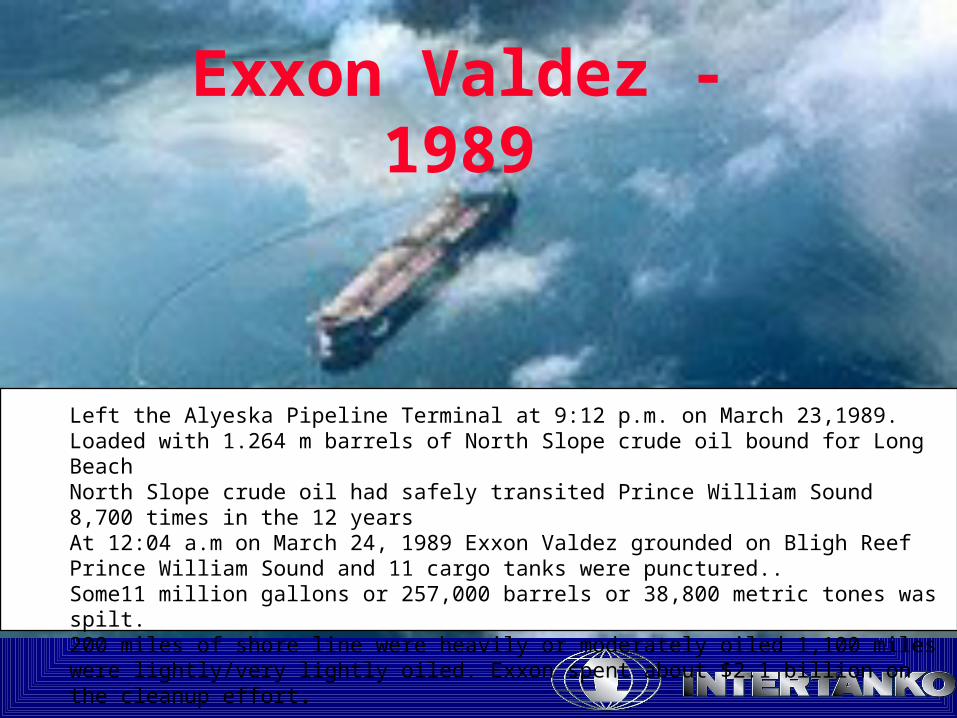
Exxon Valdez - 1989
- Resulting in OPA 90Left the Alyeska Pipeline Terminal at 9:12 p.m. on March 23,1989.Loaded with 1.264 m barrels of North Slope crude oil bound for Long BeachNorth Slope crude oil had safely transited Prince William Sound 8,700 times in the 12 years At 12:04 a.m on March 24, 1989 Exxon Valdez grounded on Bligh ReefPrince William Sound and 11 cargo tanks were punctured..Some11 million gallons or 257,000 barrels or 38,800 metric tones was spilt.200 miles of shore line were heavily or moderately oiled 1,100 miles were lightly/very lightly oiled. Exxon spent about $2.1 billion on the cleanup effort.

Nakhodka -1997- Resulting in proposals to IMO, class and IOPFC
* Built 1970, Ru. Flagged* Cargo of 19,000 ts of heavy oil
* En-route from Shanghai, China to Petropavlovsk, Russia. * Stranded on the coast of Antou,
Mikuni town, Fukui prefecture, Japan • A total of 25.14 billion yen in compensation
was paid to about 6,000 claimants
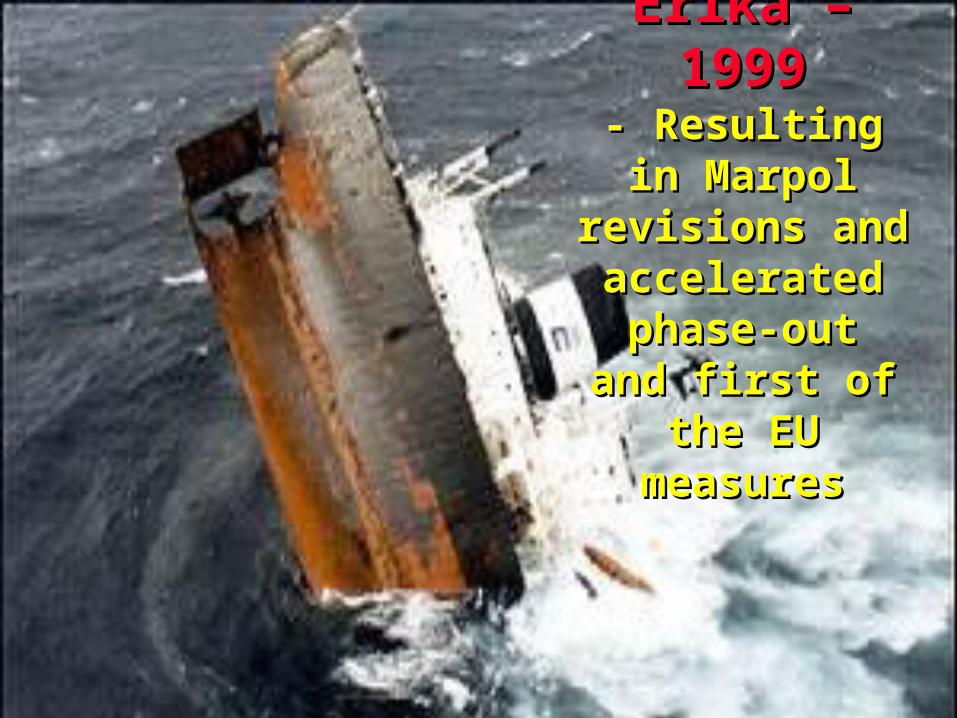
Erika – 1999Erika – 1999- Resulting in - Resulting in
Marpol revisions Marpol revisions and accelerated and accelerated
phase-outphase-outand first of the and first of the EU measuresEU measures

Prestige – 2001 - Resulting in action by EU and later IMO on phase-out and more
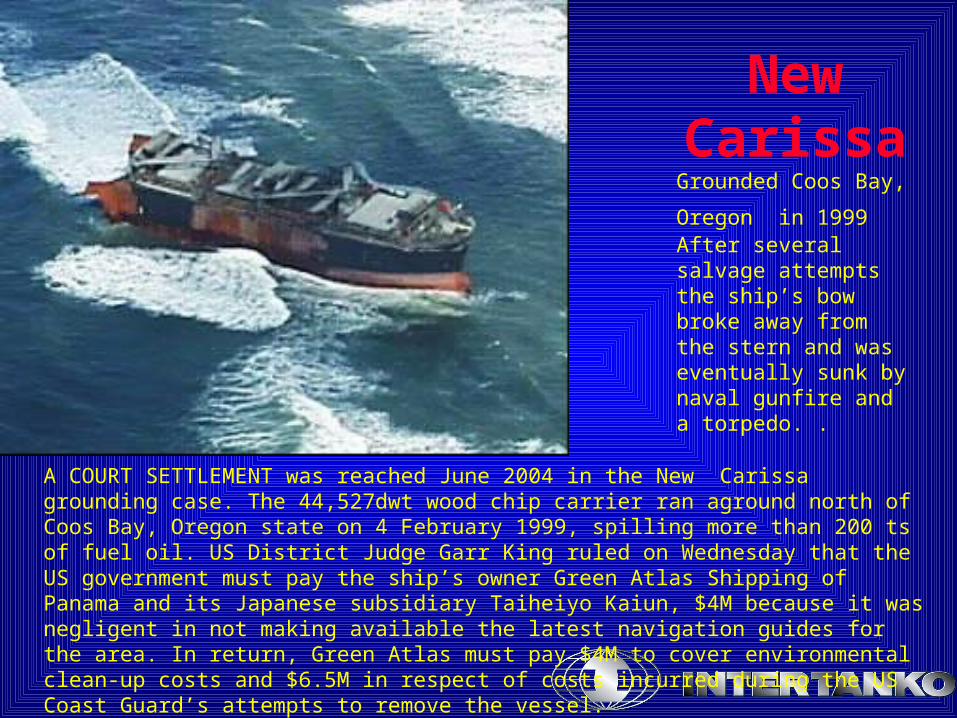
New Carissa
Grounded Coos Bay,
Oregon in 1999 After several salvage attempts the ship’s bow broke away from the stern and was eventually sunk by naval gunfire and a torpedo. .
A COURT SETTLEMENT was reached June 2004 in the New Carissa grounding case. The 44,527dwt wood chip carrier ran aground north of Coos Bay, Oregon state on 4 February 1999, spilling more than 200 ts of fuel oil. US District Judge Garr King ruled on Wednesday that the US government must pay the ship’s owner Green Atlas Shipping of Panama and its Japanese subsidiary Taiheiyo Kaiun, $4M because it was negligent in not making available the latest navigation guides for the area. In return, Green Atlas must pay $4M to cover environmental clean-up costs and $6.5M in respect of costs incurred during the US Coast Guard’s attempts to remove the vessel.

Selendang Ayu
Grounded and broke in two outside the
IslandUnalaska Dec 2004
The container On December 7, the crew of the M/V Selendang Ayu reported that they had lost power and were adrift off Unalaska Island. Efforts to tow the vessel failed and it went aground and broke apart between Skan Bay and Spray Cape at approximately 6pm, December 8. The Selendang Ayu carried approximately 424,000 gallons of Intermediate Fuel Oil (IFO 380) and 18,000 gallons of Marine Diesel (PDF).

Principal Challenges for Oil Shipping Industry Today
1. Meeting society’s expectations
- our licence to trade
- regulation versus self-regulation
The world expects us to have 0 accidents.
Even though 99.9997% of oil is delivered safely
It takes only one accident to change the industry
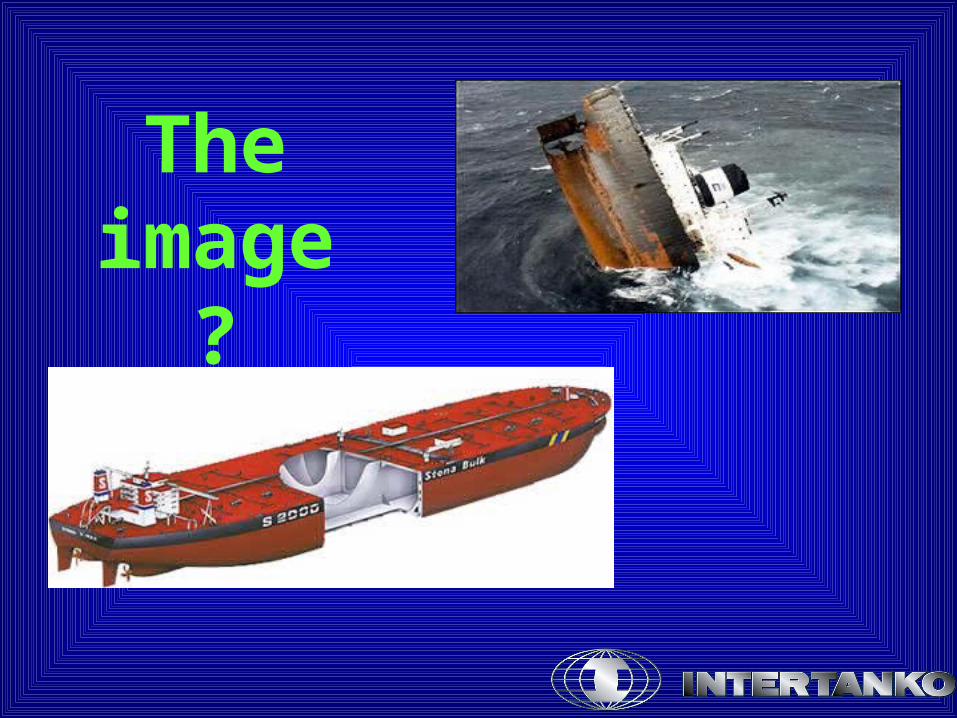
The image ?

OWNER CHARTERER CLASS
IMAGE PROBLEM !
The Rogues of the Tanker Industry

Principal Challenges for Oil Shipping Industry Today
2. Governance structure for the industry- International versus national/regional legislation
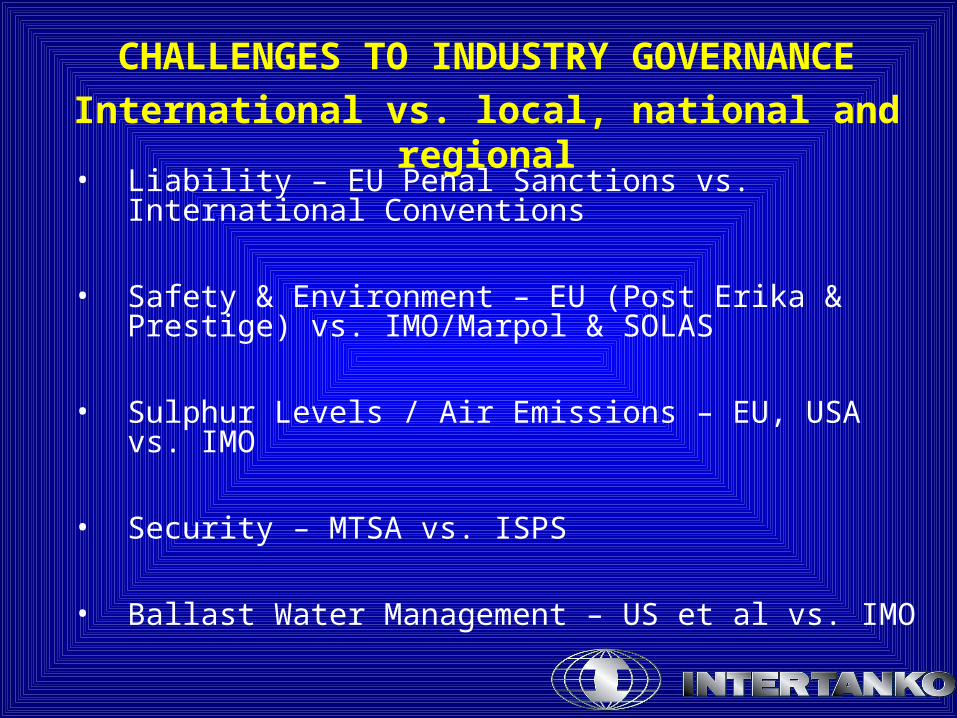
CHALLENGES TO INDUSTRY GOVERNANCE
International vs. local, national and regional
• Liability – EU Penal Sanctions vs. International Conventions
• Safety & Environment – EU (Post Erika & Prestige) vs. IMO/Marpol & SOLAS
• Sulphur Levels / Air Emissions – EU, USA vs. IMO
• Security – MTSA vs. ISPS
• Ballast Water Management – US et al vs. IMO

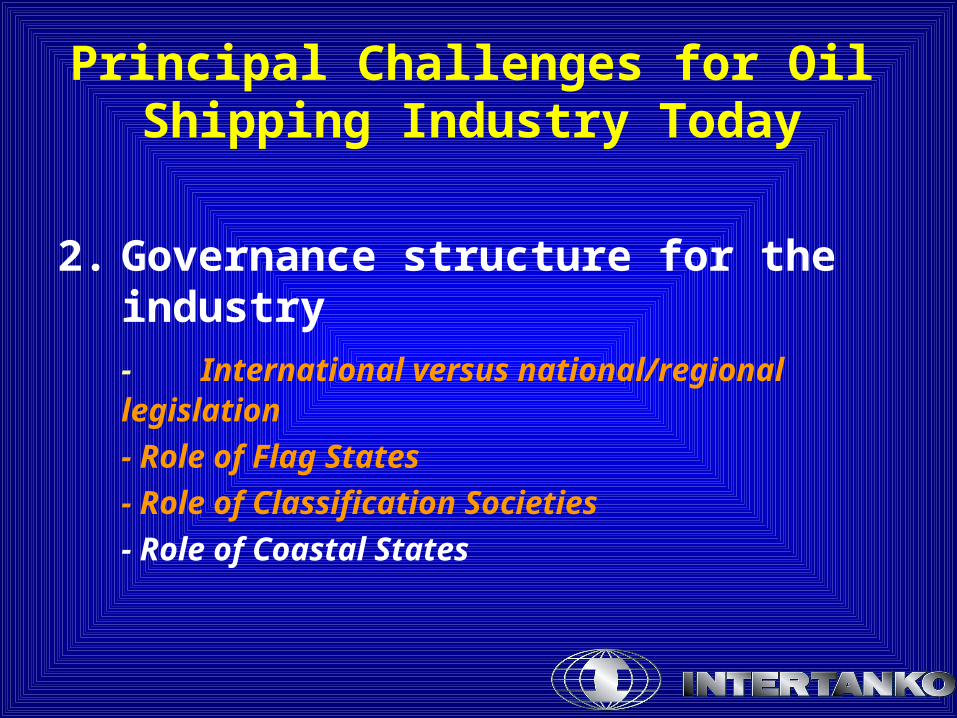
Principal Challenges for Oil Shipping Industry Today
2. Governance structure for the industry- International versus national/regional legislation
- Role of Flag States
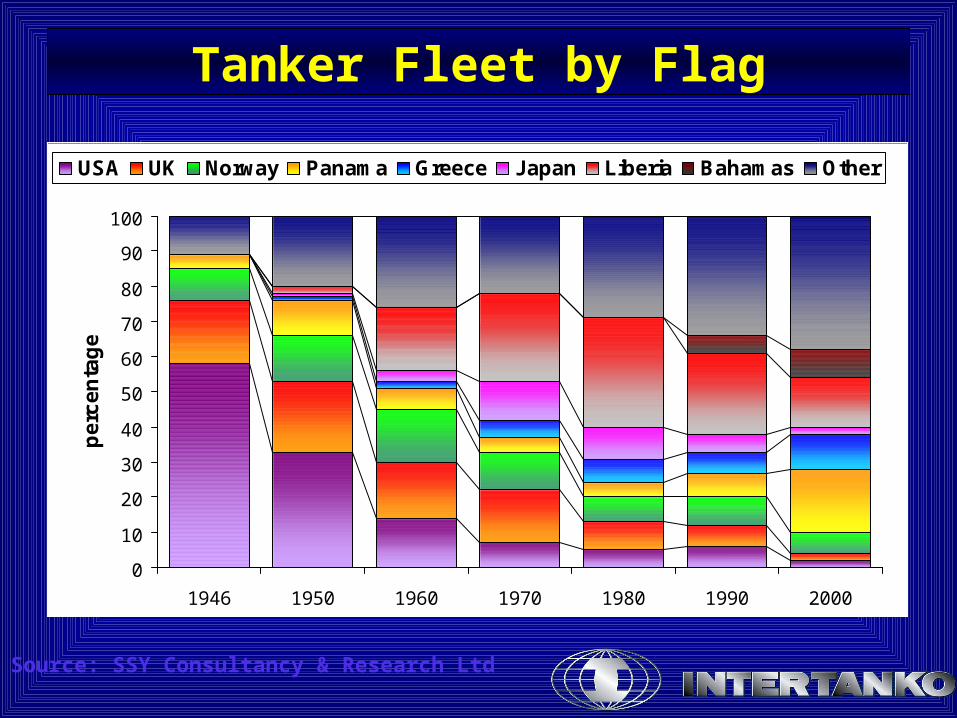
Tanker Fleet by Flag
0
10
20
30
40
50
60
70
80
90
100
1946 1950 1960 1970 1980 1990 2000
pe
rce
nta
ge
USA UK Norway Panama Greece Japan Liberia Bahamas Other
Source: SSY Consultancy & Research Ltd

The good, the bad and … all legitimate

Flag State Guidelines- industry advice

Principal Challenges for Oil Shipping Industry Today
2. Governance structure for the industry- International versus national/regional legislation
- Role of Flag States
- Role of Classification Societies
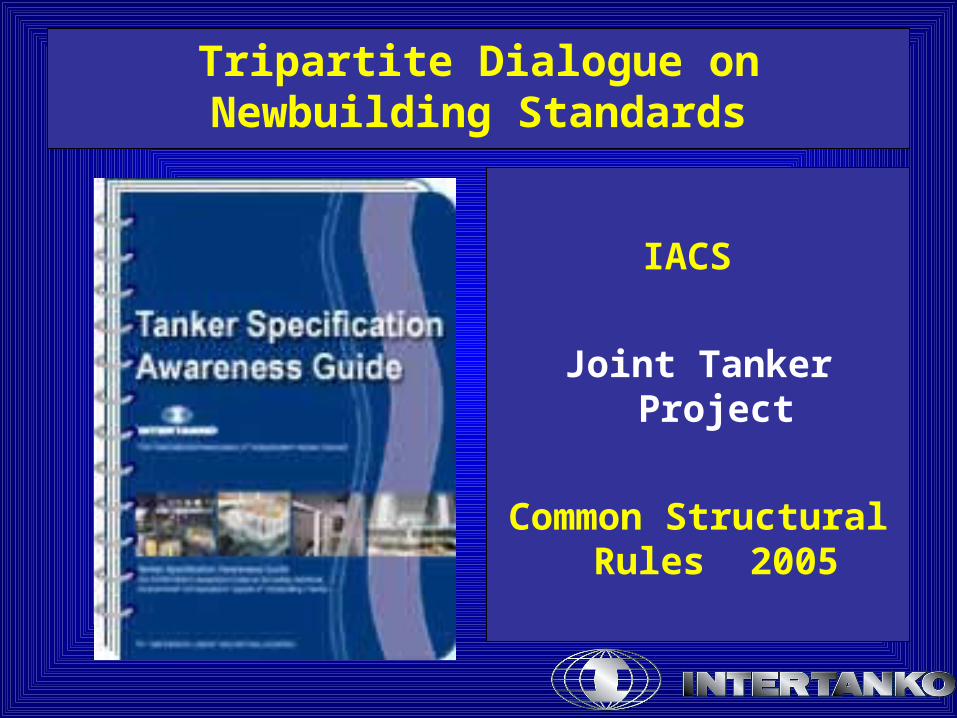
Tripartite Dialogue on Newbuilding Standards
IACS
Joint Tanker Project
Common Structural Rules 2005
Principal Challenges for Oil Shipping Industry Today
2. Governance structure for the industry- International versus national/regional legislation
- Role of Flag States
- Role of Classification Societies
- Role of Coastal States

Principal Challenges for Oil Shipping Industry Today
3. Challenges to international Liability regimes, and
the Increasing Criminalisation of Seafarers
Principal Challenges for Oil Shipping Industry Today
4. Environmental challenges:- inadequate reception facilities- ballast water management- air emissions (engine and cargo)- environmentally-sound recycling- and many more

Oil Shipping Today
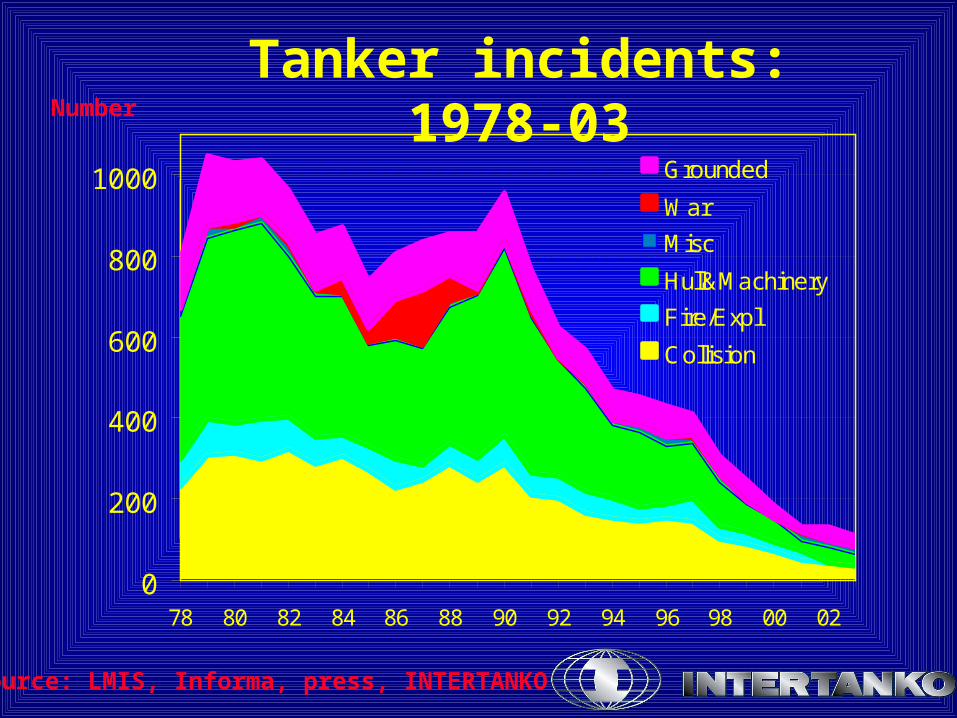
Tanker incidents: 1978-03
0
200
400
600
800
1000
78 80 82 84 86 88 90 92 94 96 98 00 02
Grounded
War
Misc
Hull&Machinery
Fire/Expl
Collision
Source: LMIS, Informa, press, INTERTANKO
Number
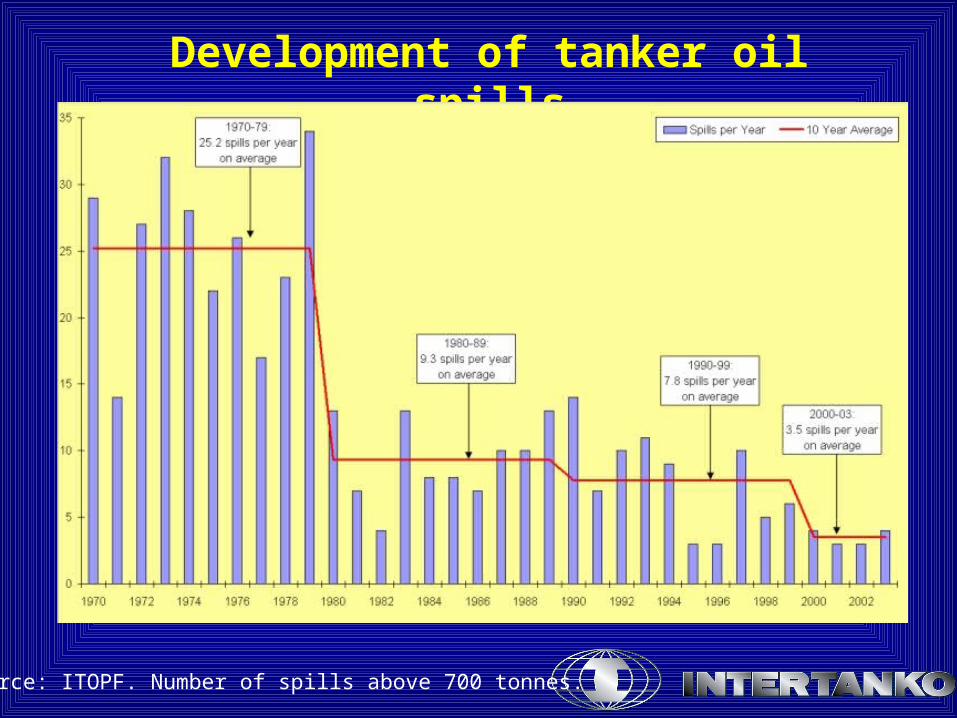
Development of tanker oil spills
Source: ITOPF. Number of spills above 700 tonnes.
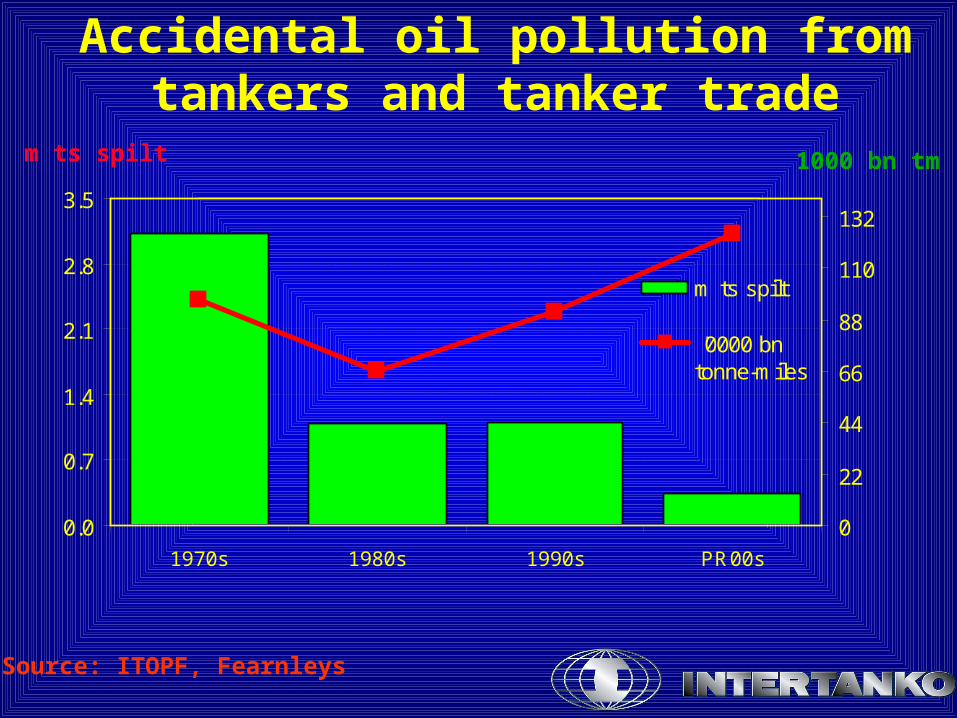
Accidental oil pollution from tankers and tanker trade
0.0
0.7
1.4
2.1
2.8
3.5
1970s 1980s 1990s PR00s
0
22
44
66
88
110
132
m ts spilt
'0000 bntonne-miles
Source: ITOPF, Fearnleys
1000 bn tmm ts spilt

Port State ControlPercentage of inspected ships detained
0%
2%
4%
6%
8%
10%
12%
14%
200410m
2003200220012000199919981997
0%
2%
4%
6%
8%
10%
12%
14%
of which tankers
All ships
2004 10 months: Paris and Tokyo MoU only
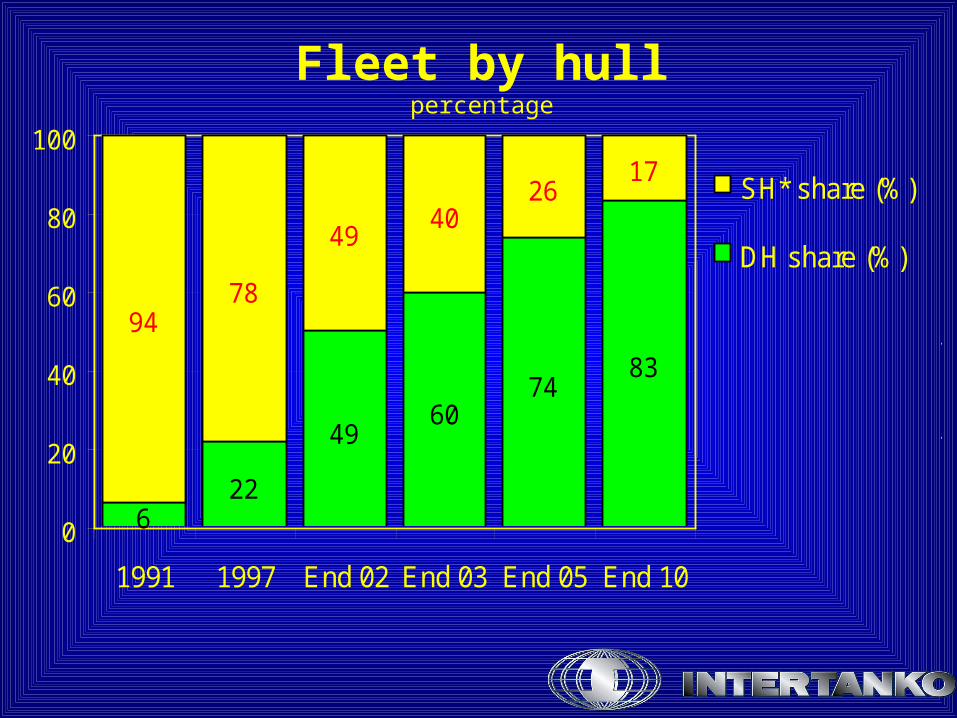
Fleet by hullpercentage
622
6074
83
9478
4940
2617
49
0
20
40
60
80
100
1991 1997 End 02 End 03 End 05 End 10
SH* share (%)
DH share (%)
End 05, all tankers
built 1982 and earlier goneEnd 10, all tankers built 1987 and earlier gonetrading beyond 2010 subject to administrations

“Oil should travel first class”- that is the aim of the oil shipping industry