Classroom Wordlist Session 2 مرکز مطالعات و توسعه آموزش علوم پزشکی.
Upload
truongkietCategory
view
215download
0
Q2 2017www.bmiresearch.com
IRANOIL & GAS REPORTINCLUDES 10-YEAR FORECASTS TO 2026
Published by:BMI Research
Iran Oil & Gas Report Q2 2017INCLUDES 10-YEAR FORECASTS TO 2026
Part of BMI’s Industry Report & Forecasts Series
Published by: BMI Research
Copy deadline: January 2017
ISSN: 1748-4022
BMI Research2 Broadgate CircleLondonEC2M 2QSUnited KingdomTel: +44 (0) 20 7248 0468Fax: +44 (0) 20 7248 0467Email: [email protected]: http://www.bmiresearch.com
© 2017 Business Monitor International LtdAll rights reserved.
All information contained in this publication iscopyrighted in the name of Business MonitorInternational Ltd, and as such no part of thispublication may be reproduced, repackaged,redistributed, resold in whole or in any part, or usedin any form or by any means graphic, electronic ormechanical, including photocopying, recording,taping, or by information storage or retrieval, or byany other means, without the express written consentof the publisher.
DISCLAIMERAll information contained in this publication has been researched and compiled from sources believed to be accurate and reliable at the time ofpublishing. However, in view of the natural scope for human and/or mechanical error, either at source or during production, Business MonitorInternational Ltd accepts no liability whatsoever for any loss or damage resulting from errors, inaccuracies or omissions affecting any part of thepublication. All information is provided without warranty, and Business Monitor International Ltd makes no representation of warranty of any kindas to the accuracy or completeness of any information hereto contained.

CONTENTS
BMI Industry View ............................................................................................................... 7Table: Headline Forecasts (Iran 2015-2021) . . . . . . . . . . . . . . . . . . . . . . . . . . . . . . . . . . . . . . . . . . . . . . . . . . . . . . . . . . . . . . . . . . . . . . . . . . . . . . . . . . . . . . . . . . . . . . . . . . . . . . . . . . . 7
SWOT .................................................................................................................................... 9OIl & Gas SWOT ....................................................................................................................................... 9
Industry Forecast .............................................................................................................. 11Upstream Exploration .............................................................................................................................. 11
Structural Trends ................................................................................................................................... 12
Upstream Projects ................................................................................................................................... 14Table: New Projects Expected To Be Offered Post-Sanctions . . . . . . . . . . . . . . . . . . . . . . . . . . . . . . . . . . . . . . . . . . . . . . . . . . . . . . . . . . . . . . . . . . . . . . . . . . . . . . . . . . . . . . . . . . 14
Upstream Production - Oil ........................................................................................................................ 14
Latest Updates ....................................................................................................................................... 14
Structural Trends ................................................................................................................................... 15Table: New Oil Projects On Offer . . . . . . . . . . . . . . . . . . . . . . . . . . . . . . . . . . . . . . . . . . . . . . . . . . . . . . . . . . . . . . . . . . . . . . . . . . . . . . . . . . . . . . . . . . . . . . . . . . . . . . . . . . . . . . . . . . . . . . 18
Table: Oil Production (Iran 2015-2020) . . . . . . . . . . . . . . . . . . . . . . . . . . . . . . . . . . . . . . . . . . . . . . . . . . . . . . . . . . . . . . . . . . . . . . . . . . . . . . . . . . . . . . . . . . . . . . . . . . . . . . . . . . . . . . . 19
Table: Oil Production (Iran 2021-2026) . . . . . . . . . . . . . . . . . . . . . . . . . . . . . . . . . . . . . . . . . . . . . . . . . . . . . . . . . . . . . . . . . . . . . . . . . . . . . . . . . . . . . . . . . . . . . . . . . . . . . . . . . . . . . . . 19
Upstream Production - Gas ....................................................................................................................... 20
Latest Updates ....................................................................................................................................... 20
Structural Trends ................................................................................................................................... 20Table: South Pars Project Phases . . . . . . . . . . . . . . . . . . . . . . . . . . . . . . . . . . . . . . . . . . . . . . . . . . . . . . . . . . . . . . . . . . . . . . . . . . . . . . . . . . . . . . . . . . . . . . . . . . . . . . . . . . . . . . . . . . . . . . 22
Table: Gas Projects Proposed Under The IPC . . . . . . . . . . . . . . . . . . . . . . . . . . . . . . . . . . . . . . . . . . . . . . . . . . . . . . . . . . . . . . . . . . . . . . . . . . . . . . . . . . . . . . . . . . . . . . . . . . . . . . . . . 22
Table: Gas Production (Iran 2015-2020) . . . . . . . . . . . . . . . . . . . . . . . . . . . . . . . . . . . . . . . . . . . . . . . . . . . . . . . . . . . . . . . . . . . . . . . . . . . . . . . . . . . . . . . . . . . . . . . . . . . . . . . . . . . . . . 23
Table: Gas Production (Iran 2021-2026) . . . . . . . . . . . . . . . . . . . . . . . . . . . . . . . . . . . . . . . . . . . . . . . . . . . . . . . . . . . . . . . . . . . . . . . . . . . . . . . . . . . . . . . . . . . . . . . . . . . . . . . . . . . . . . 24
Refining ................................................................................................................................................. 25
Latest Updates ....................................................................................................................................... 25
Structural Trends ................................................................................................................................... 25Table: Major Iranian Refineries . . . . . . . . . . . . . . . . . . . . . . . . . . . . . . . . . . . . . . . . . . . . . . . . . . . . . . . . . . . . . . . . . . . . . . . . . . . . . . . . . . . . . . . . . . . . . . . . . . . . . . . . . . . . . . . . . . . . . . . . 26
Table: Modernisation Projects . . . . . . . . . . . . . . . . . . . . . . . . . . . . . . . . . . . . . . . . . . . . . . . . . . . . . . . . . . . . . . . . . . . . . . . . . . . . . . . . . . . . . . . . . . . . . . . . . . . . . . . . . . . . . . . . . . . . . . . . . 29
Table: Refining Capacity And Refined Products Production (Iran 2015-2020) . . . . . . . . . . . . . . . . . . . . . . . . . . . . . . . . . . . . . . . . . . . . . . . . . . . . . . . . . . . . . . . . . . . . . . . 29
Table: Refining Capacity And Refined Products Production (Iran 2021-2026) . . . . . . . . . . . . . . . . . . . . . . . . . . . . . . . . . . . . . . . . . . . . . . . . . . . . . . . . . . . . . . . . . . . . . . . 29
Refined Fuels Consumption ....................................................................................................................... 30
Latest Updates ....................................................................................................................................... 30
Structural Trends ................................................................................................................................... 30Table: Approximate Gasoline & Diesel Costs . . . . . . . . . . . . . . . . . . . . . . . . . . . . . . . . . . . . . . . . . . . . . . . . . . . . . . . . . . . . . . . . . . . . . . . . . . . . . . . . . . . . . . . . . . . . . . . . . . . . . . . . . . 32
Table: Refined Products Consumption (Iran 2015-2020) . . . . . . . . . . . . . . . . . . . . . . . . . . . . . . . . . . . . . . . . . . . . . . . . . . . . . . . . . . . . . . . . . . . . . . . . . . . . . . . . . . . . . . . . . . . . . . 33
Table: Refined Products Consumption (Iran 2021-2026) . . . . . . . . . . . . . . . . . . . . . . . . . . . . . . . . . . . . . . . . . . . . . . . . . . . . . . . . . . . . . . . . . . . . . . . . . . . . . . . . . . . . . . . . . . . . . . 33
Gas Consumption .................................................................................................................................... 33
Latest Updates ....................................................................................................................................... 33
Structural Trends ................................................................................................................................... 34Table: Gas Consumption (Iran 2015-2020) . . . . . . . . . . . . . . . . . . . . . . . . . . . . . . . . . . . . . . . . . . . . . . . . . . . . . . . . . . . . . . . . . . . . . . . . . . . . . . . . . . . . . . . . . . . . . . . . . . . . . . . . . . . . 35
Table: Gas Consumption (Iran 2021-2026) . . . . . . . . . . . . . . . . . . . . . . . . . . . . . . . . . . . . . . . . . . . . . . . . . . . . . . . . . . . . . . . . . . . . . . . . . . . . . . . . . . . . . . . . . . . . . . . . . . . . . . . . . . . . 35
Trade - Oil ............................................................................................................................................. 36
Iran Oil & Gas Report Q2 2017
© Business Monitor International Ltd Page 4
Crude Oil Trade Forecast ........................................................................................................................ 36
Latest Updates ....................................................................................................................................... 36
Structural Trends ................................................................................................................................... 36Table: Crude Oil Net Exports (Iran 2015-2021) . . . . . . . . . . . . . . . . . . . . . . . . . . . . . . . . . . . . . . . . . . . . . . . . . . . . . . . . . . . . . . . . . . . . . . . . . . . . . . . . . . . . . . . . . . . . . . . . . . . . . . . 38
Table: Crude Oil Net Exports (Iran 2021-2026) . . . . . . . . . . . . . . . . . . . . . . . . . . . . . . . . . . . . . . . . . . . . . . . . . . . . . . . . . . . . . . . . . . . . . . . . . . . . . . . . . . . . . . . . . . . . . . . . . . . . . . . 39
Refined Products Trade Forecast .............................................................................................................. 39
Latest Updates ....................................................................................................................................... 39
Structural Trends ................................................................................................................................... 39Table: Refined Fuels Net Exports (Iran 2015-2020) . . . . . . . . . . . . . . . . . . . . . . . . . . . . . . . . . . . . . . . . . . . . . . . . . . . . . . . . . . . . . . . . . . . . . . . . . . . . . . . . . . . . . . . . . . . . . . . . . . . 42
Table: Refined Fuels Net Exports (Iran 2021-2026) . . . . . . . . . . . . . . . . . . . . . . . . . . . . . . . . . . . . . . . . . . . . . . . . . . . . . . . . . . . . . . . . . . . . . . . . . . . . . . . . . . . . . . . . . . . . . . . . . . . 42
Trade - Gas (Pipeline And LNG) ................................................................................................................ 42
Latest Updates ....................................................................................................................................... 42
Structural Trends ................................................................................................................................... 42Table: Gas Net Exports (Iran 2015-2020) . . . . . . . . . . . . . . . . . . . . . . . . . . . . . . . . . . . . . . . . . . . . . . . . . . . . . . . . . . . . . . . . . . . . . . . . . . . . . . . . . . . . . . . . . . . . . . . . . . . . . . . . . . . . . . 45
Table: Gas Net Exports (Iran 2021-2026) . . . . . . . . . . . . . . . . . . . . . . . . . . . . . . . . . . . . . . . . . . . . . . . . . . . . . . . . . . . . . . . . . . . . . . . . . . . . . . . . . . . . . . . . . . . . . . . . . . . . . . . . . . . . . . 46
Industry Risk/Reward Index ............................................................................................. 47Middle East - Oil & Gas Risk/Reward Index ................................................................................................. 47
Table: Middle East Oil & Gas Risk/Reward Index . . . . . . . . . . . . . . . . . . . . . . . . . . . . . . . . . . . . . . . . . . . . . . . . . . . . . . . . . . . . . . . . . . . . . . . . . . . . . . . . . . . . . . . . . . . . . . . . . . . . . 47
Upstream: Index Resilient In Lower Price Environment ................................................................................ 48Table: Middle East Upstream Oil & Gas Risk/Reward Index . . . . . . . . . . . . . . . . . . . . . . . . . . . . . . . . . . . . . . . . . . . . . . . . . . . . . . . . . . . . . . . . . . . . . . . . . . . . . . . . . . . . . . . . . . 48
Downstream: Limited Opportunities .......................................................................................................... 50Table: Middle East Downstream Oil & Gas Risk/Reward Index . . . . . . . . . . . . . . . . . . . . . . . . . . . . . . . . . . . . . . . . . . . . . . . . . . . . . . . . . . . . . . . . . . . . . . . . . . . . . . . . . . . . . . 50
Iran - Risk/Reward Index .......................................................................................................................... 52
Upstream Index ..................................................................................................................................... 52
Downstream Index ................................................................................................................................. 53
Market Overview ............................................................................................................... 54Iran Energy Market Overview .................................................................................................................... 54
Overview .............................................................................................................................................. 54Table: Key Upstream Operators - Iran Oil & Gas Sector . . . . . . . . . . . . . . . . . . . . . . . . . . . . . . . . . . . . . . . . . . . . . . . . . . . . . . . . . . . . . . . . . . . . . . . . . . . . . . . . . . . . . . . . . . . . . 54
Table: Key Downstream Operators - Iran Energy Sector . . . . . . . . . . . . . . . . . . . . . . . . . . . . . . . . . . . . . . . . . . . . . . . . . . . . . . . . . . . . . . . . . . . . . . . . . . . . . . . . . . . . . . . . . . . . . 54
Fiscal Regime ........................................................................................................................................ 55
Oil And Gas Infrastructure ........................................................................................................................ 56
Oil Refineries ........................................................................................................................................ 56Table: Refineries In Iran . . . . . . . . . . . . . . . . . . . . . . . . . . . . . . . . . . . . . . . . . . . . . . . . . . . . . . . . . . . . . . . . . . . . . . . . . . . . . . . . . . . . . . . . . . . . . . . . . . . . . . . . . . . . . . . . . . . . . . . . . . . . . . . 56
Service Stations ..................................................................................................................................... 57
Oil Storage Facilities .............................................................................................................................. 57
Oil Terminals/Ports ................................................................................................................................ 58
Oil Pipelines ......................................................................................................................................... 58
Gas Pipelines ........................................................................................................................................ 59Table: Major Proposed Pipelines . . . . . . . . . . . . . . . . . . . . . . . . . . . . . . . . . . . . . . . . . . . . . . . . . . . . . . . . . . . . . . . . . . . . . . . . . . . . . . . . . . . . . . . . . . . . . . . . . . . . . . . . . . . . . . . . . . . . . . . 59
Gas Storage Facilities ............................................................................................................................. 60Table: Operation, Under Construction & Planned Gas Storage . . . . . . . . . . . . . . . . . . . . . . . . . . . . . . . . . . . . . . . . . . . . . . . . . . . . . . . . . . . . . . . . . . . . . . . . . . . . . . . . . . . . . . . 60
Competitive Landscape .................................................................................................... 61
Iran Oil & Gas Report Q2 2017
© Business Monitor International Ltd Page 5

Company Profile ................................................................................................................ 62NIOC .................................................................................................................................................... 62
Table: Major NIOC Subsidiaries . . . . . . . . . . . . . . . . . . . . . . . . . . . . . . . . . . . . . . . . . . . . . . . . . . . . . . . . . . . . . . . . . . . . . . . . . . . . . . . . . . . . . . . . . . . . . . . . . . . . . . . . . . . . . . . . . . . . . . . 63
Table: Fields Proposed Under The New IPC . . . . . . . . . . . . . . . . . . . . . . . . . . . . . . . . . . . . . . . . . . . . . . . . . . . . . . . . . . . . . . . . . . . . . . . . . . . . . . . . . . . . . . . . . . . . . . . . . . . . . . . . . . . 64
Regional Overview ............................................................................................................ 66Middle East Oil & Gas Regional Overview ................................................................................................... 66
Oil Production: Output Cut To Have Marginal Impact .................................................................................. 66Table: Marginal Impact On 2017 Output From Cut (mn b/d) . . . . . . . . . . . . . . . . . . . . . . . . . . . . . . . . . . . . . . . . . . . . . . . . . . . . . . . . . . . . . . . . . . . . . . . . . . . . . . . . . . . . . . . . . . 67
Oil Consumption: Subsidy Reform Tempering Demand ................................................................................. 69Table: Average Gasoline Pump Price June 2015 & December 2016 (USD/Litre) . . . . . . . . . . . . . . . . . . . . . . . . . . . . . . . . . . . . . . . . . . . . . . . . . . . . . . . . . . . . . . . . . . . . . 69
Refining Capacity: Mega Refineries To Support Economic Diversification ........................................................ 70
Gas Production: Gas Projects Move Forward ............................................................................................. 71
Gas Consumption: Industrial Growth And Power Strengthen Consumption ....................................................... 73Table: Middle East Oil & Gas Production, Refining Capacity & Trade . . . . . . . . . . . . . . . . . . . . . . . . . . . . . . . . . . . . . . . . . . . . . . . . . . . . . . . . . . . . . . . . . . . . . . . . . . . . . . . 74
Glossary ............................................................................................................................. 75Table: Glossary Of Terms . . . . . . . . . . . . . . . . . . . . . . . . . . . . . . . . . . . . . . . . . . . . . . . . . . . . . . . . . . . . . . . . . . . . . . . . . . . . . . . . . . . . . . . . . . . . . . . . . . . . . . . . . . . . . . . . . . . . . . . . . . . . . . 75
Methodology ...................................................................................................................... 77Industry Forecast Methodology ................................................................................................................ 77
Source ................................................................................................................................................. 79
Risk/Reward Index Methodology ............................................................................................................... 79Table: Bmi's Oil & Gas Upstream Risk/Reward Index . . . . . . . . . . . . . . . . . . . . . . . . . . . . . . . . . . . . . . . . . . . . . . . . . . . . . . . . . . . . . . . . . . . . . . . . . . . . . . . . . . . . . . . . . . . . . . . . . 81
Table: Weighting . . . . . . . . . . . . . . . . . . . . . . . . . . . . . . . . . . . . . . . . . . . . . . . . . . . . . . . . . . . . . . . . . . . . . . . . . . . . . . . . . . . . . . . . . . . . . . . . . . . . . . . . . . . . . . . . . . . . . . . . . . . . . . . . . . . . . . . 82
Iran Oil & Gas Report Q2 2017
© Business Monitor International Ltd Page 6

BMI Industry View
BMI View: Gas production and consumption will continue to grow in 2017 due to new phases of South
Pars increasing gas availability. Oil production and exports will increase around 230,000b/d in 2017,
roughly reaching pre-sanctions levels. Refined fuels exports will rise following the start up of the first phase
of the Persian Gulf Star refinery.
Table: Headline Forecasts (Iran 2015-2021)
2015 2016e 2017f 2018f 2019f 2020f 2021f
Crude, NGPL & other liquids prod, 000b/d 3,300.8 3,653.6 3,915.7 3,937.6 3,955.9 4,030.6 4,072.6
Refined products production, 000b/d 1,676.0 1,618.3 1,722.0 1,833.5 1,900.5 1,913.8 1,927.2
Refined products consumption & ethanol, 000b/d 1,544.4 1,505.4 1,554.5 1,614.7 1,652.4 1,687.1 1,712.4
Dry natural gas production, bcm 192.5 218.2 237.8 242.5 243.7 245.0 246.2
Dry natural gas consumption, bcm 191.2 214.2 228.5 233.3 234.5 235.7 237.3
Brent, USD/bbl 53.60 45.13 57.00 60.00 64.00 67.00 70.00
f = BMI forecast. Source: BMI, EIA, OPEC, JODI
Latest Updates And Key Forecasts
■ NIOC has pre-qualified 29 international oil companies to participate in upcoming tenders for oil and gasfields. European majors Total, Shell and Eni are involved alongside Chinese, Russia and India nationaloil companies.
■ The status and terms of the IPC, a critical piece of attracting foreign investment, are still yet to bepublished.
■ Indian companies are reportedly close to a deal to develop the Farzad B gas field.
■ French, Russian and Chinese companies are interested in South Pars phase 11.
■ Oil and condensate production in averaged around 3.5mn b/d in 2016.
■ Oil and condensate exports averaged around 2.0mn b/d in 2016.
■ Phases 17, 18, 19, 20 and 21 of South Pars are due to be fully installed and commissioned by March2017, supporting further gas production growth.
■ Gas exports to Iraq are expected to rise via two pipelines in to the Diyala and Basra regions.
■ Gas imports from Turkmenistan have been halted since January 1 2017 due to payment issues.
Iran Oil & Gas Report Q2 2017
© Business Monitor International Ltd Page 7

■ The distillation unit at the first phase of the Persian Gulf Star facility was launched in October and thefirst naphtha consignment has been shipped. The 120,000b/d phase of the facility is due to begincommercial operations in March 2017.
■ Sinopec is due to undertake a major upgrade at the Arak refinery to improve efficiency and refiningdepth.
■ Refined fuels consumption remains muted as Euro-IV standard fuels are increasingly being rolled outacross major cities - improving fuel efficiency.
Iran Oil & Gas Report Q2 2017
© Business Monitor International Ltd Page 8

SWOT
OIl & Gas SWOT
SWOT Analysis
Strengths ■ Iran has the world's fourth largest proven oil reserves (after Saudi Arabia, Venezuela
and Canada) and second-largest proven gas reserves (behind Russia).
■ Lifting costs are low, particularly at the onshore oil fields.
■ Located in strategic geographical position for oil, gas and refined products exports,
lying between Asia and Europe.
■ The new Iran Petroleum Contract structure, while still risk-service, could be among
the most attractive in the Middle East.
Weaknesses ■ Substantial caution surrounding US sanctions related to human rights and terrorism
will inhibit USD banking transactions.
■ Low recovery rates from onshore fields.
■ Given the underinvestment while under sanctions, the oil and gas industry is in need
of substantial capital to improve its reliability and efficiency.
■ Domestic oil and gas service and equipment companies lack advanced technological
knowhow.
Opportunities ■ Iran has outlined 50 oil and gas projects under the IPC for international investment,
with substantial production potential for both oil and gas.
■ Widespread deployment of enhanced oil recovery techniques could significantly
boost output, considering the country's low recovery rate of between 20-30%.
■ The LNG and petrochemical sectors, offer tremendous potential given the gas and
condensates production potential of the South Pars field.
■ There is substantial room for domestic natural gas consumption growth.
Iran Oil & Gas Report Q2 2017
© Business Monitor International Ltd Page 9
SWOT Analysis - Continued
Threats ■ Uncertainty surrounding US foreign policy towards Iran and potential implications for
sanctions.
■ Hardliners continue to maintain substantial influence over the oil and gas sector,
which may limit the attractiveness or extent of new contracts.
■ International companies will be reluctant to commit to the post-sanctions Iranian
market, given many lost billions when sanctions were implemented.
■ Low oil prices are substantially curbing the budgets of mid-sized international
companies sought for smaller field developments.
■ The risks of internal political instability or war within the broader region are ever-
present.
Iran Oil & Gas Report Q2 2017
© Business Monitor International Ltd Page 10
Industry Forecast
Upstream Exploration
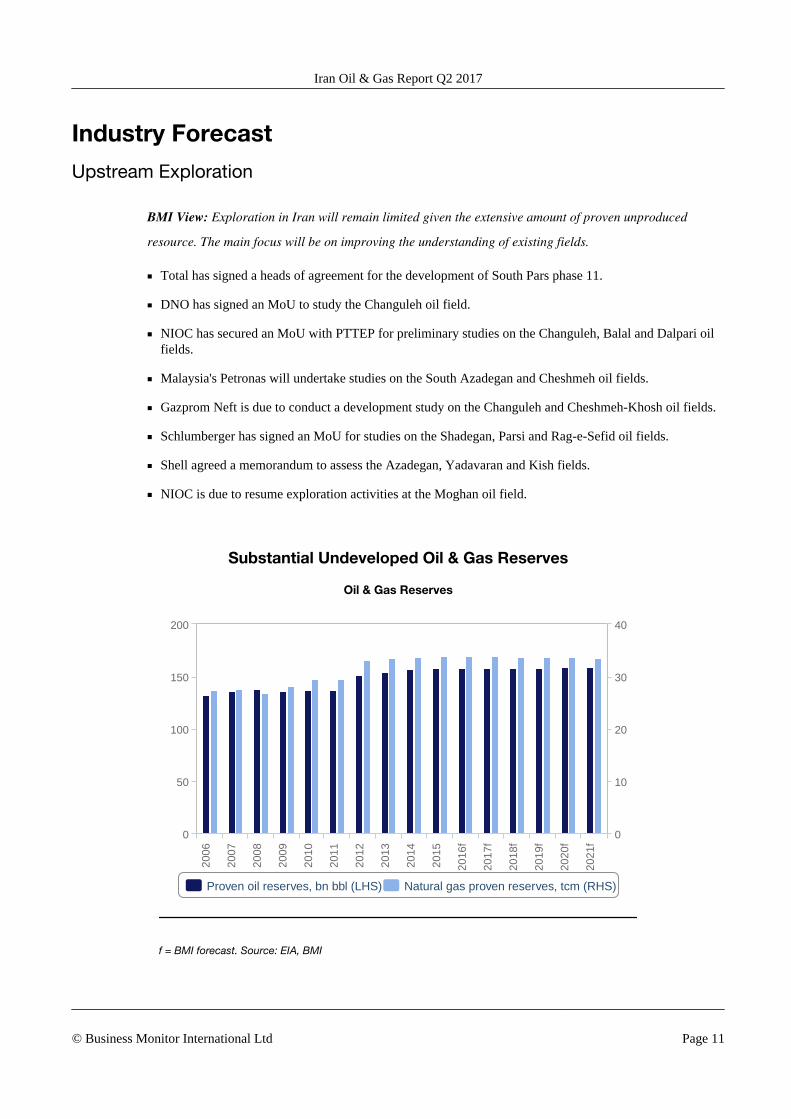
BMI View: Exploration in Iran will remain limited given the extensive amount of proven unproduced
resource. The main focus will be on improving the understanding of existing fields.
■ Total has signed a heads of agreement for the development of South Pars phase 11.
■ DNO has signed an MoU to study the Changuleh oil field.
■ NIOC has secured an MoU with PTTEP for preliminary studies on the Changuleh, Balal and Dalpari oilfields.
■ Malaysia's Petronas will undertake studies on the South Azadegan and Cheshmeh oil fields.
■ Gazprom Neft is due to conduct a development study on the Changuleh and Cheshmeh-Khosh oil fields.
■ Schlumberger has signed an MoU for studies on the Shadegan, Parsi and Rag-e-Sefid oil fields.
■ Shell agreed a memorandum to assess the Azadegan, Yadavaran and Kish fields.
■ NIOC is due to resume exploration activities at the Moghan oil field.
Substantial Undeveloped Oil & Gas Reserves
Oil & Gas Reserves
Proven oil reserves, bn bbl (LHS) Natural gas proven reserves, tcm (RHS)
2006
2007
2008
2009
2010
2011
2012
2013
2014
2015
2016
f
2017
f
2018
f
2019
f
2020
f
2021
f
0
50
100
150
200
0
10
20
30
40
f = BMI forecast. Source: EIA, BMI
Iran Oil & Gas Report Q2 2017
© Business Monitor International Ltd Page 11

Structural Trends
In the post-sanctions period, Iran has aggressively embarked on signing memorandums with international
oil companies to conduct studies on major oil fields. Since late 2016, Iran has signed over seven
memorandums with major companies including Shell, Total, Schlumberger and Petronas. Interestingly,
studies for the same field have been awarded to multiple companies, such as the Azadegan field for which
both Shell and Petronas have been offered studies. The Changuleh field has also been opened to study by
DNO, PTTEP and Gazprom Neft.
It remains unclear whether just one or all of the MoUs signed for fields will be allowed to progress. This
could be a sign that Iran is trying to drive competition to secure the best possible results from the studies,
but also that the country is hedging its bets depending on uncertainty surrounding US foreign policy and
sanctions.
Oil
Iranian oil and gas resources are largely well known, just underdeveloped, hence the large number of MoUs
agreed to more extensively study the resource and production potential. Iran holds the fourth-largest oil
reserves in the world, behind only Venezuela, Saudi Arabia and Canada. Onshore fields comprise more than
70% of total reserves and over 80% of onshore reserves are located in the Khuzestan basin, in south-western
Iran, near the border with Iraq.
According to the EIA, more than 50% of Iran's onshore oil reserves are confined within just five giant
fields, of which the Marun field - estimated to hold 22bn bbl - the Ahwaz field (18bn bbl) and the Aghajari
field (17bn bbl) are the largest. Most of the remaining undeveloped proven oil resources are located in the
offshore Persian Gulf, and amount to around 100mn bbl. The focus of oil exploration and development will
be on these areas, once the Iran Petroleum Contract (IPC) approved by the government and released.
The Iranian section of the Caspian Sea is thought to be highly prospective. In 2012, Iran announced an oil
discovery in its portion of the Caspian Sea. Fars news reported the discovery could have more than 10bn bbl
of potential crude. A significant find (about 2bn bbl of recoverable oil) made by ConocoPhillips in the
Kazakh portion of the Caspian Sea, in addition to producing fields between Azerbaijan and Turkmenistan
have proven the potential of the area. Nevertheless, the cost of offshore exploration and the ongoing
maritime border disputes between Iran, Azerbaijan and Turkmenistan will prevent development projects
until resolved.
Iran Oil & Gas Report Q2 2017
© Business Monitor International Ltd Page 12

Despite large oil reserves, we note that producing Iranian oil fields are very mature. While reserves are
high, years of international sanctions, crude export restrictions and the lack of access to capital and
technology to develop more challenging fields, has prevented Iran from maximising production at its
largest fields. Approximately 60% of Iran's crude oil production comes from oil fields that were discovered
before the nationalisation of the oil industry over 60 years ago. As a result, new foreign investment into Iran
will also result in greater investment into exploring the geology of existing fields to better understand the
full resource potential and optimise production plans. This will offer substantial upside to reserves
estimates.
Under the IPC, there are 29 oil fields on offer of which 21 are offshore and eight onshore. A further 17 have
already been developed and will tender for improved recovery, while the remaining 12 are known, but
undeveloped.
Gas
Similar to oil, the vast majority of Iran's gas resources are also well known. Iran holds the second-largest
gas reserves in the world, estimated at 33.6trn cubic metres (tcm). Reserves are predominantly from
offshore non-associated fields (62% of total reserves). The giant South Pars/North Field gas structure,
spread across Iran and Qatar, accounts for about two thirds of Iran's total proven reserves. Onshore gas
reserves are found in both associated (19%) and non-associated (19%) fields. Other large natural gas fields
include the Kish, North Pars, Tabnak, Forouz, Kangan and Ferdowsi fields.
There is still substantial potential in existing gas resources, negating the need for major exploration
programmes. Similarly to the oil sector, international sanctions have limited Iran's ability to access
sufficient capital and technology to develop its enormous reserves, and to push with further exploration.
Weak oil prices are also straining government revenues and the budget towards oil and gas exploration and
development. This is also the case for producing fields with insufficient investment towards field
maintenance.
Under the IPC 21 natural gas projects are due to be offered. 8 will be offshore, while 13 will be onshore.
The offshore projects are all existing but undeveloped gas fields, while the onshore fields are also largely
undeveloped.
Iran Oil & Gas Report Q2 2017
© Business Monitor International Ltd Page 13

Upstream Projects
Table: New Projects Expected To Be Offered Post-Sanctions
Border Oil Fields Border Gas Fields Other OilFields Other Gas Fields
1 S. Azadegan Ph 1 15 S. Pars Ph 11 23 Mansuri Ph 2 37 Dey
2 N. Azadegan Ph 2 16 Salman Ph 1 24Band-e-Karkheh 38 Sefidzakhor-Halegan
3 Yadavaran Ph 2 17 Salman Ph 2 25 Jofayr 39 Sefidbaghoun
4 Reshadat 18 Farzad A 26 Somar 40 Aghar Ph 2
5 Foroozan 19 Farzad B 27 Danan Ph 2 41 Farashband: Refining Facilities
6S. Pars Oil LayerPh 1 20 Reshadat 28 Darquain Ph 3 42
Varavi: Boosting Gas PressureStations
7 Arvand 21Dalan Kangan AtBalal 29 Susangerd 43
Kangan: Boosting Gas PressureStations
8 Dehloran PhÊ 2 22 Arash 30 Sepehr 44Nar: Boosting Gas PressureStations
9 Peydar Gharb 31CheshmehKhosh 45
Homa: Boosting Gas PressureStations
10 Aban Ph 2 32 Resalat 46 Behregansar Gas Layer
11 Sohrab 33 Abuzar 47 Tangebijar Ph 2
12 Changouleh 34 Doroud 48 Kish Ph 3 3D Seismic
13 Esfandiar Ph 1 35 Norouz 49 Kish Ph 1
14 Arash 36 Zagheh
Source: Iran Oil Ministry
Upstream Production - Oil
BMI View: Crude oil and condensate production averaged 3.5mn b/d in 2016, a 350,000b/d increase on
2015. In 2017 we expect further gains of around 260,000b/d. Long-term upside remains dependent on the
success of the new IPC.
Latest Updates
■ Iranian crude production stabilised over the summer months with output at around 3.5mn b/d, thoughreportedly increased to near 4.0mn b/d at the end of 2016.
■ 2016 exports averaged 2.0mn b/d.
■ Production from the Yadavaran field has reached 115,000b/d.
Iran Oil & Gas Report Q2 2017
© Business Monitor International Ltd Page 14
■ A 30-60,000b/d increase is planned for the Salman and Foruzan fields.
■ 29 international companies have been prequalified to take part in Iran's upstream tender under the IPC.
■ The IPC has yet to be officially released.
Structural Trends
Iranian oil production comes from 34 fields, of which 22 are onshore and 12 offshore. The country's largest
producing field is the onshore Ahwaz-Asmari field, located in the Khuzestan province, with a production
capacity of about 750,000b/d. This is followed by the Amrun and Gachsaran fields. The three fields are
located in the Khuzestan province.
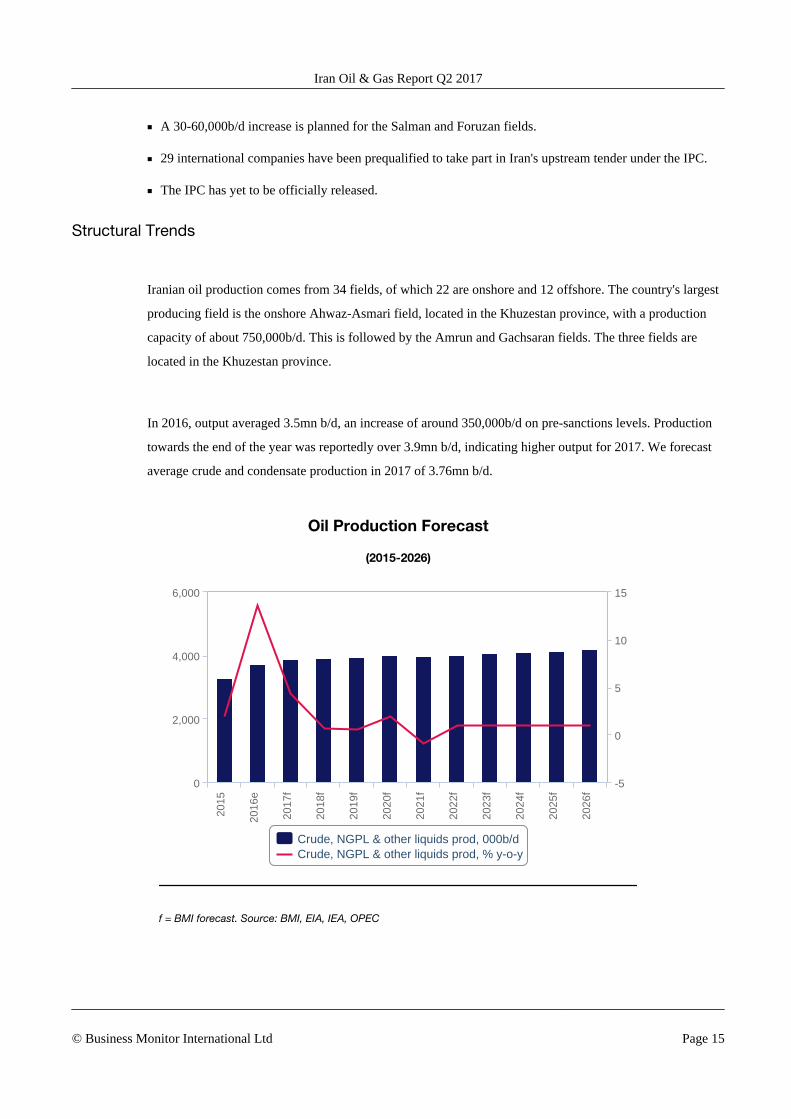
In 2016, output averaged 3.5mn b/d, an increase of around 350,000b/d on pre-sanctions levels. Production
towards the end of the year was reportedly over 3.9mn b/d, indicating higher output for 2017. We forecast
average crude and condensate production in 2017 of 3.76mn b/d.
Oil Production Forecast
(2015-2026)
Crude, NGPL & other liquids prod, 000b/dCrude, NGPL & other liquids prod, % y-o-y
2015
2016
e
2017
f
2018
f
2019
f
2020
f
2021
f
2022
f
2023
f
2024
f
2025
f
2026
f
0
2,000
4,000
6,000
-5
0
5
10
15
f = BMI forecast. Source: BMI, EIA, IEA, OPEC
Iran Oil & Gas Report Q2 2017
© Business Monitor International Ltd Page 15

Oil Upside Tapering Off
According to official OPEC secondary source data, Iran produced an average of 3.5mn barrels of crude and
condensate in 2016. Data from countries importing Iranian crude oil indicates exports averaged 2.0mn b/d
over the same period. Gas for oil substitution in the domestic power sector has been key to freeing up more
oil, while new oil production capacity - from the Yadavaran (85,000b/d) and North Azedegan (75,000b/d)
fields, as well as condensate volumes from new phases of South Pars (~60,000b/d) has added around
220,000b/d of capacity to increase output further.
We expect an average annual increase of 260,000b/d of oil and condensate in 2017, with production rising
to 3.76mn b/d. We expect output to stabilise near current levels and meet the OPEC agreed production
quota of 3.797mn b/d.
Europe Key To Maintain Exports
Iran Crude Exports By Destination (000b/d)
China India Japan South Korea Europe & Other
Jan-
15
Feb
-15
Mar
-15
Apr
-15
May
-15
Jun-
15
Jul-1
5
Aug
-15
Sep
-15
Oct
-15
Nov
-15
Dec
-15
Jan-
16
Feb
-16
Mar
-16
Apr
-16
May
-16
Jun-
16
Jul-1
6
Aug
-16
Sep
-16
Oct
-16
Nov
-16
Dec
-16
e
0
1,000
2,000
3,000
Source: Customs Data, Shipping Data, BMI
Iran Oil & Gas Report Q2 2017
© Business Monitor International Ltd Page 16

We remain conservative with our long-term forecasts for Iran given unknowns regarding the state of
existing fields and infrastructure under sanction. Following the initial gains, production will stagnate under
our current scenario, with new NIOC-led developments sufficient to cover natural declines.
We also remain cautious on investor interest in new oil contracts , which has still not been officially
launched. While the structures are more attractive than the previous buy-back contracts, the risks
surrounding the political environment and with committing large capex sums to major projects over the
long-term remain high. As such, we expect smaller companies willing to take higher risk to be among the
first to invest in Iran. 29 companies have pre-qualified for the IPC tenders though these European majors
Shell, Eni and Total.
We have factored in some increases in oil production from potential new contracts post 2020, though note
the nature of this is highly speculative given the uncertainties with contracts and development timeframes.
Iran is targeting 5.7mn b/d of production capacity by March 2021, which, while we believe is possible given
the below-ground potential, will not be achieved. We note a considerable upside risk to our long-term
outlook for Iranian oil production (post-2020).
Still Awaiting IPC
The Iranian Petroleum Contract has the potential to transform Iranian production, though delays to its
official release are cause for concern. The contract was initially planned for November 2015 and has been
repeatedly delayed, largely by hardliner oppositions to relinquishing too much control over the oil sector.
The long-term outlook will therefore depend on oil price, political stability, the uptake of new contracts and
related negotiation, the ease of doing business and efficient banking. We see upside risk from the following
areas:
■ New Wells, IOR, EOR - Boosting Production At Existing Fields: Iran's producing oil fields aremature, with over 60% of oil production coming from oil fields first developed over 60 years ago.Decades of underinvestment, lack of access to key technology and restrictions to finance, have resulted inparticularly low recovery rates at existing fields of between 20-30%. New wells at existing fields and theincreased application of improved oil recovery (IOR) and enhanced oil recovery (EOR) methods will be apriority for the government as a way to boost production from the field developments offered to foreigninvestors. This provides upside risk to our oil production and export forecast from 2018 onwards.
• New Field Developments - Upside Risk From 2020: New fields will need to be developed for thecountry to significantly boost its production capacity beyond pre-sanction levels. Iran is targeting 5.7mnb/d of production capacity by 2021. This provides substantial upside risks to our production forecast fromaround 2020, given a three to four year negotiation, engineering and development timeframe. While it isimpossible to pin-point quantities, Iran's large oil reserves could in theory allow additional upsideproduction risk of 1-3mn b/d by 2025. A number of fields could provide a large increase to Iran's long-term crude oil production capacity, with border field developments looking to take priority (see below).
Iran Oil & Gas Report Q2 2017
© Business Monitor International Ltd Page 17
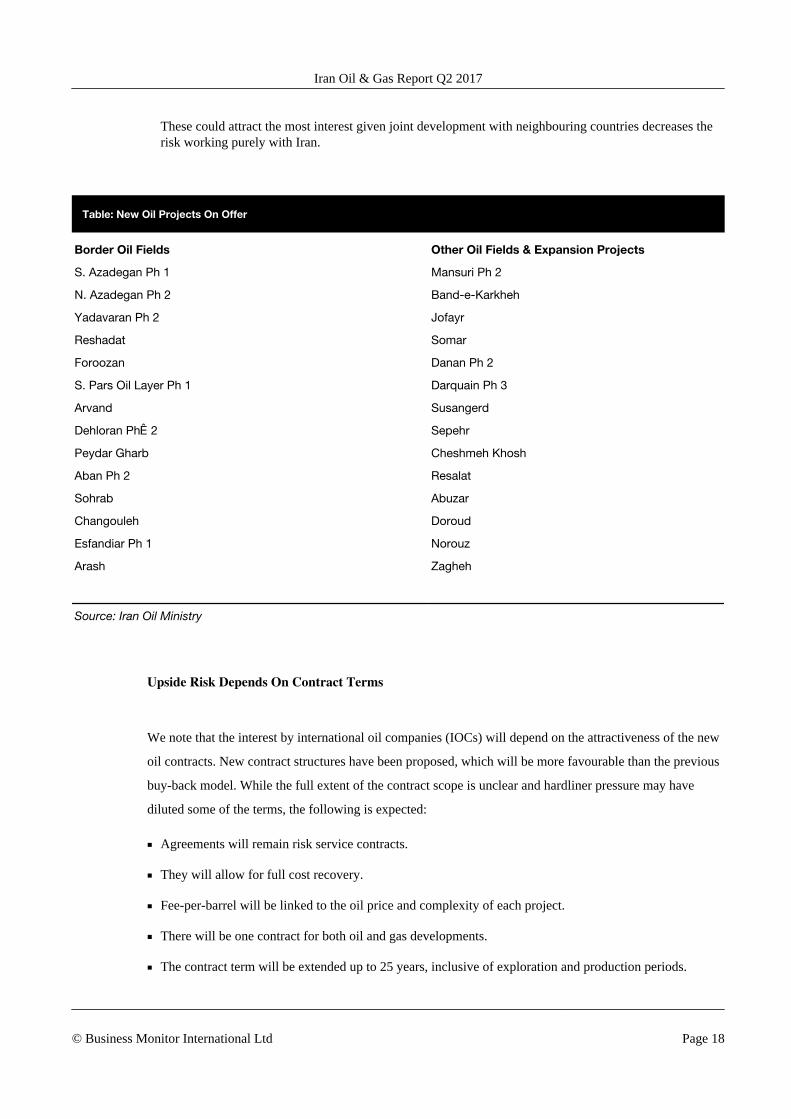
These could attract the most interest given joint development with neighbouring countries decreases therisk working purely with Iran.
Table: New Oil Projects On Offer
Border Oil Fields Other Oil Fields & Expansion Projects
S. Azadegan Ph 1 Mansuri Ph 2
N. Azadegan Ph 2 Band-e-Karkheh
Yadavaran Ph 2 Jofayr
Reshadat Somar
Foroozan Danan Ph 2
S. Pars Oil Layer Ph 1 Darquain Ph 3
Arvand Susangerd
Dehloran PhÊ 2 Sepehr
Peydar Gharb Cheshmeh Khosh
Aban Ph 2 Resalat
Sohrab Abuzar
Changouleh Doroud
Esfandiar Ph 1 Norouz
Arash Zagheh
Source: Iran Oil Ministry
Upside Risk Depends On Contract Terms
We note that the interest by international oil companies (IOCs) will depend on the attractiveness of the new
oil contracts. New contract structures have been proposed, which will be more favourable than the previous
buy-back model. While the full extent of the contract scope is unclear and hardliner pressure may have
diluted some of the terms, the following is expected:
■ Agreements will remain risk service contracts.
■ They will allow for full cost recovery.
■ Fee-per-barrel will be linked to the oil price and complexity of each project.
■ There will be one contract for both oil and gas developments.
■ The contract term will be extended up to 25 years, inclusive of exploration and production periods.
Iran Oil & Gas Report Q2 2017
© Business Monitor International Ltd Page 18
Uncertainty surrounds the possibility of snap-back sanctions should Iran or the US deviate from
commitments under the agreement. The Trump administration may cause more political challenges while
the Iranian presidential election in May 2017 adds risk to the escalation of differences. Uncertainty could
cause a slower uptake in contracts and IOC interest.
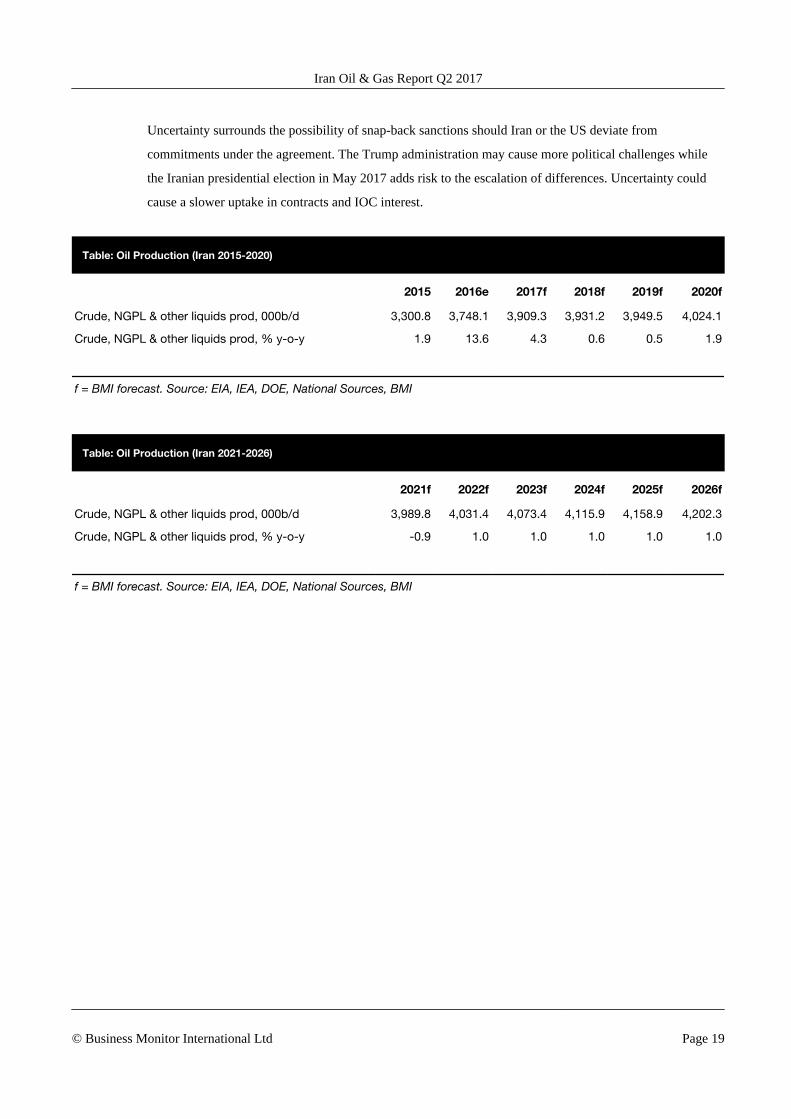
Table: Oil Production (Iran 2015-2020)
2015 2016e 2017f 2018f 2019f 2020f
Crude, NGPL & other liquids prod, 000b/d 3,300.8 3,748.1 3,909.3 3,931.2 3,949.5 4,024.1
Crude, NGPL & other liquids prod, % y-o-y 1.9 13.6 4.3 0.6 0.5 1.9
f = BMI forecast. Source: EIA, IEA, DOE, National Sources, BMI
Table: Oil Production (Iran 2021-2026)
2021f 2022f 2023f 2024f 2025f 2026f
Crude, NGPL & other liquids prod, 000b/d 3,989.8 4,031.4 4,073.4 4,115.9 4,158.9 4,202.3
Crude, NGPL & other liquids prod, % y-o-y -0.9 1.0 1.0 1.0 1.0 1.0
f = BMI forecast. Source: EIA, IEA, DOE, National Sources, BMI
Iran Oil & Gas Report Q2 2017
© Business Monitor International Ltd Page 19
Upstream Production - Gas
BMI View: Gas production will rise in 2017 as new phases 17, 18, 19, 20 and 21 of South Pars reach
production plateau. Long-term upside depends on the interest of foreign investment in gas projects and the
creation of new sources of demand and export infrastructure.
Latest Updates
■ South Pars phase 17, 18 and 19 are operating at half capacity, approximately 20bcm. Production couldincrease to around 40bcm depending on demand.
■ The platform for phase 20, satellite platforms of phases 17 and 18, and platforms A and B of phase 14,are all due to be installed by the end of 2016.
■ Gas processing capacity has reached 260bcm, according to National Iranian Gas Company.
■ More than 20 gas projects are due to be offered for foreign investment: Indian companies have showninterest in the Farzad B project; while Total, Russian and Chinese companies are interested in South Parsphase 11.
■ Majors have indicated more interest in Iran's gas potential rather than oil.
Structural Trends
Gas production reached 192bn cubic metres (bcm) in 2015 and we see this rising to 218bcm in 2016 and
237bcm in 2017. According to NIGC, Iran has now the capacity to process as much as 260bcm of gas. From
2017 our forecast takes into account the start of phases 17, 18, 19, 20 and 21 of South Pars. Currently all of
these phases are producing, though not at full capacity. Full commissioning of all phases is expected before
the new Iranian year in March. Combined, phases 17-19 added over 40bcm of new gas production capacity
in 2016, and full commissioning will allow for further production upside of 20bcm. Phase 20 of South Pars
is also reporting good progress with the loading of the platform in November, and hook up expected in early
2017. Phase 21 is also reportedly producing at 9.8bcm.
Beyond these major project completions we remain cautious, but see strong upside risk to gas production,
depending on:
■ The speed and scope of the return of international oil companies (IOCs) to the Iranian energy sector
■ The potential development of South Pars Phases 11, 13, 14, 22, 23 and 24
■ New gas field developments under the IPC such as Farzad and Kish.
■ The construction of the required gas export infrastructure
Iran Oil & Gas Report Q2 2017
© Business Monitor International Ltd Page 20

Gas Production Forecast
(2015-2026)
Dry natural gas production, bcm Dry natural gas production, bcm, % y-o-y
2015
2016
e
2017
f
2018
f
2019
f
2020
f
2021
f
2022
f
2023
f
2024
f
2025
f
2026
f
0
100
200
300
0
5
10
15
-5
f = BMI forecast; Source: BMI, EIA, IEA, OPEC
The removal of sanctions is accelerating progress on Iranian-led developments of delayed and unfinished
phases of South Pars as access to new funding supports projects. This will enable the country to increase
production at producing phases and to bring online new phases currently under development.
Substantial Upside Risk To Post-2020 Production
Considering Iran has the second largest gas reserves in the world, the country has the potential to become
one of the largest gas producers globally. The removal of sanctions will open more than 20 natural gas
projects up to international investment. We have not yet included these in our forecast given uncertainty in
international interest, but see strong upside to production post 2020 depending on the level of uptake. A
number of phases of South Pars are yet to be developed and could add considerable production capacity
over the forecast.
■ South Pars Phases: Phases 11, 13, 14 and 22-24 have not yet been taken into account in our forecasts.The timing of these phases remains uncertain and could depend on foreign interest. South Pars Phase 11is on the list of gas projects expected to be offered by the Oil Ministry. Together, the ramp-up to fullcapacity of remaining phases could add a cumulative 102bcm of additional gas production capacity.
Iran Oil & Gas Report Q2 2017
© Business Monitor International Ltd Page 21
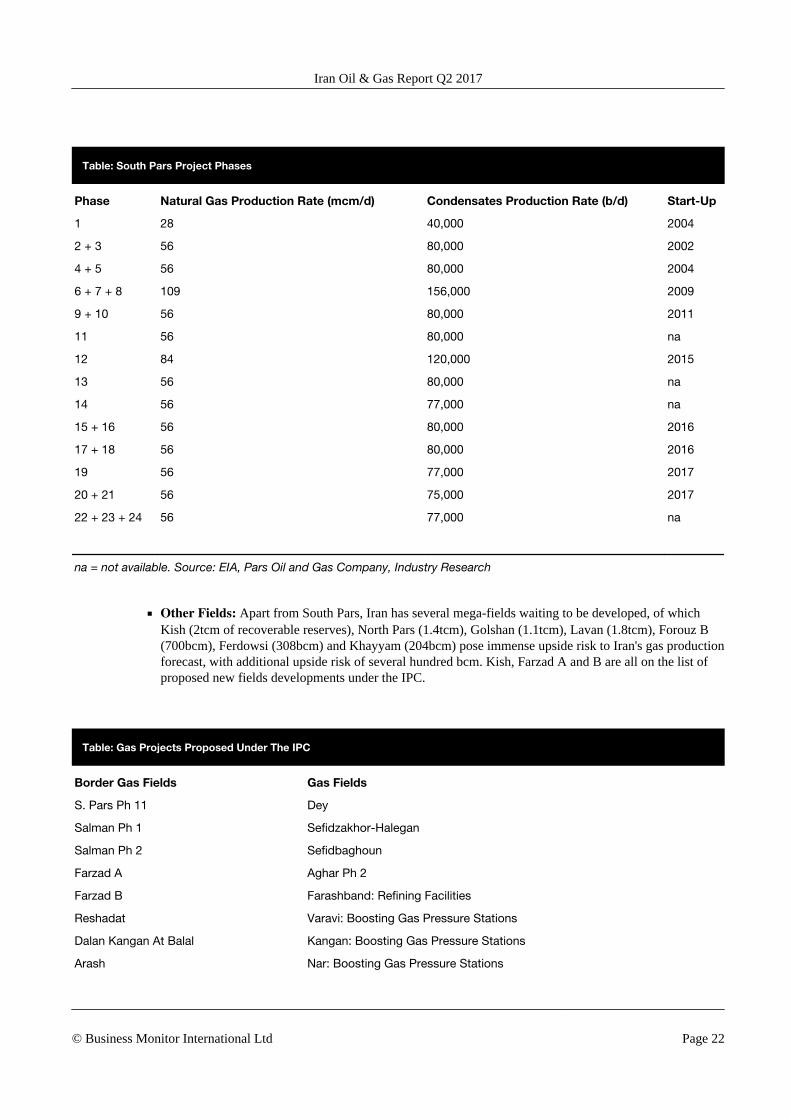
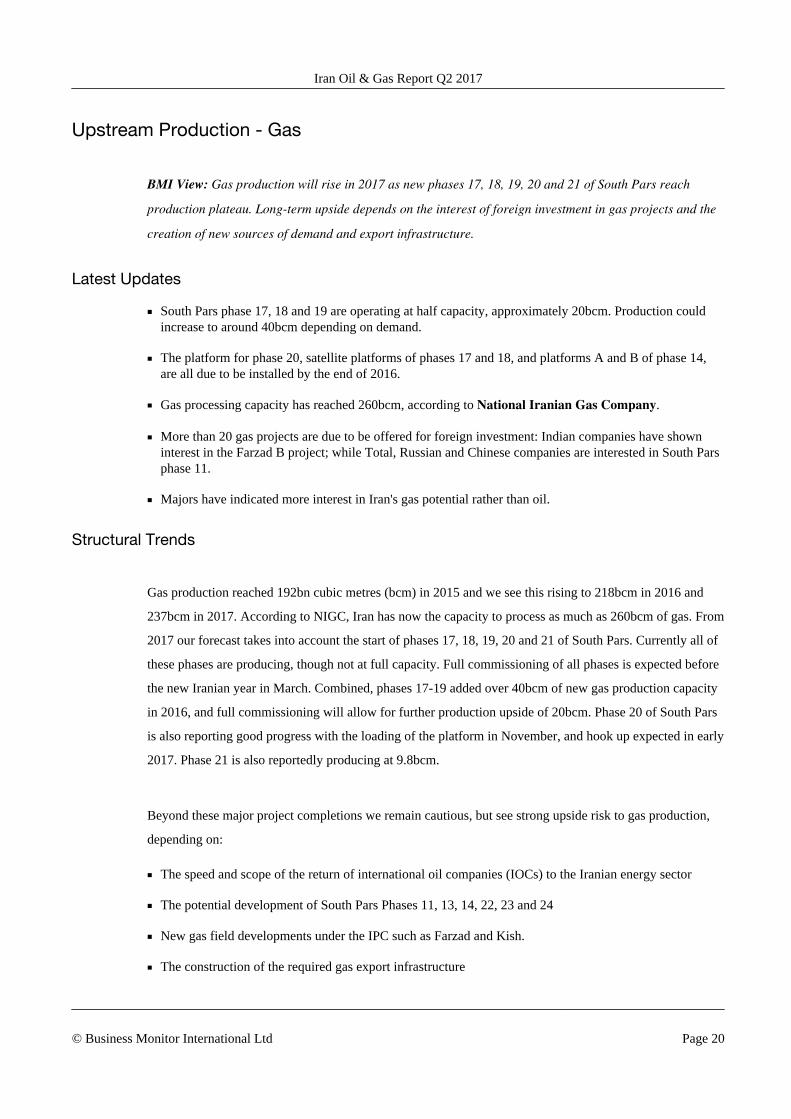
Table: South Pars Project Phases
Phase Natural Gas Production Rate (mcm/d) Condensates Production Rate (b/d) Start-Up
1 28 40,000 2004
2 + 3 56 80,000 2002
4 + 5 56 80,000 2004
6 + 7 + 8 109 156,000 2009
9 + 10 56 80,000 2011
11 56 80,000 na
12 84 120,000 2015
13 56 80,000 na
14 56 77,000 na
15 + 16 56 80,000 2016
17 + 18 56 80,000 2016
19 56 77,000 2017
20 + 21 56 75,000 2017
22 + 23 + 24 56 77,000 na
na = not available. Source: EIA, Pars Oil and Gas Company, Industry Research
■ Other Fields: Apart from South Pars, Iran has several mega-fields waiting to be developed, of whichKish (2tcm of recoverable reserves), North Pars (1.4tcm), Golshan (1.1tcm), Lavan (1.8tcm), Forouz B(700bcm), Ferdowsi (308bcm) and Khayyam (204bcm) pose immense upside risk to Iran's gas productionforecast, with additional upside risk of several hundred bcm. Kish, Farzad A and B are all on the list ofproposed new fields developments under the IPC.
Table: Gas Projects Proposed Under The IPC
Border Gas Fields Gas Fields
S. Pars Ph 11 Dey
Salman Ph 1 Sefidzakhor-Halegan
Salman Ph 2 Sefidbaghoun
Farzad A Aghar Ph 2
Farzad B Farashband: Refining Facilities
Reshadat Varavi: Boosting Gas Pressure Stations
Dalan Kangan At Balal Kangan: Boosting Gas Pressure Stations
Arash Nar: Boosting Gas Pressure Stations
Iran Oil & Gas Report Q2 2017
© Business Monitor International Ltd Page 22
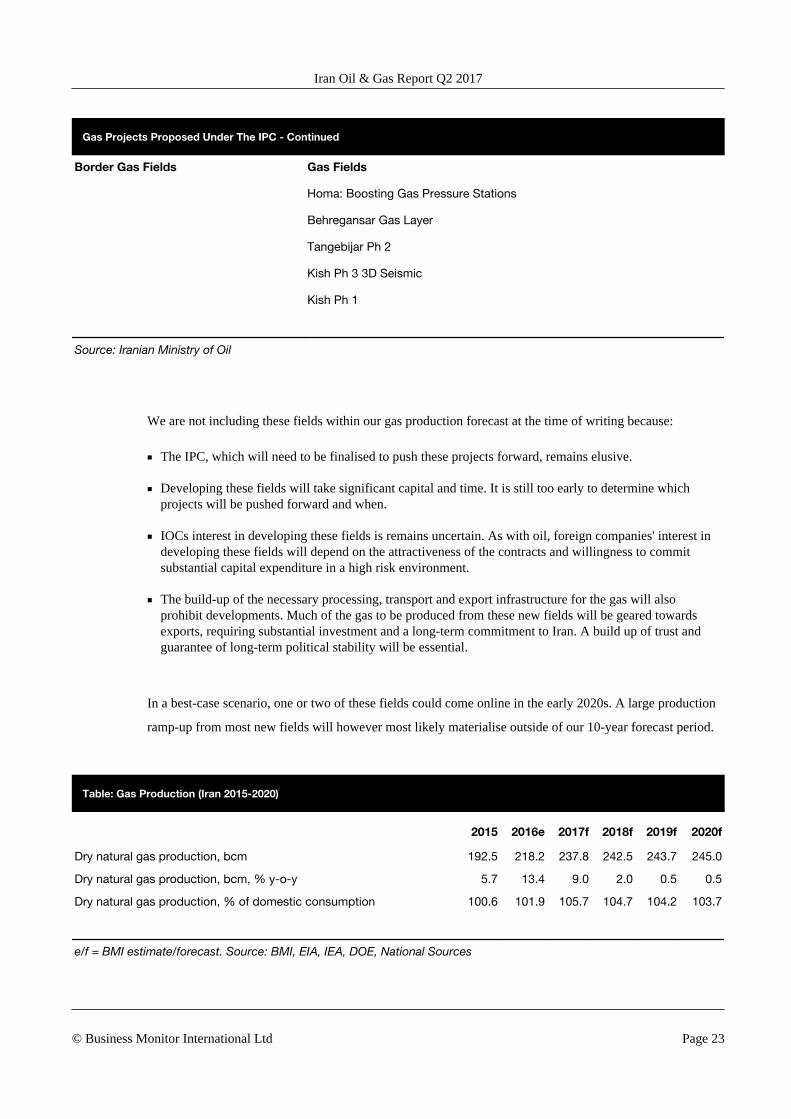
Gas Projects Proposed Under The IPC - Continued
Border Gas Fields Gas Fields
Homa: Boosting Gas Pressure Stations
Behregansar Gas Layer
Tangebijar Ph 2
Kish Ph 3 3D Seismic
Kish Ph 1
Source: Iranian Ministry of Oil
We are not including these fields within our gas production forecast at the time of writing because:
■ The IPC, which will need to be finalised to push these projects forward, remains elusive.
■ Developing these fields will take significant capital and time. It is still too early to determine whichprojects will be pushed forward and when.
■ IOCs interest in developing these fields is remains uncertain. As with oil, foreign companies' interest indeveloping these fields will depend on the attractiveness of the contracts and willingness to commitsubstantial capital expenditure in a high risk environment.
■ The build-up of the necessary processing, transport and export infrastructure for the gas will alsoprohibit developments. Much of the gas to be produced from these new fields will be geared towardsexports, requiring substantial investment and a long-term commitment to Iran. A build up of trust andguarantee of long-term political stability will be essential.
In a best-case scenario, one or two of these fields could come online in the early 2020s. A large production
ramp-up from most new fields will however most likely materialise outside of our 10-year forecast period.
Table: Gas Production (Iran 2015-2020)
2015 2016e 2017f 2018f 2019f 2020f
Dry natural gas production, bcm 192.5 218.2 237.8 242.5 243.7 245.0
Dry natural gas production, bcm, % y-o-y 5.7 13.4 9.0 2.0 0.5 0.5
Dry natural gas production, % of domestic consumption 100.6 101.9 105.7 104.7 104.2 103.7
e/f = BMI estimate/forecast. Source: BMI, EIA, IEA, DOE, National Sources
Iran Oil & Gas Report Q2 2017
© Business Monitor International Ltd Page 23
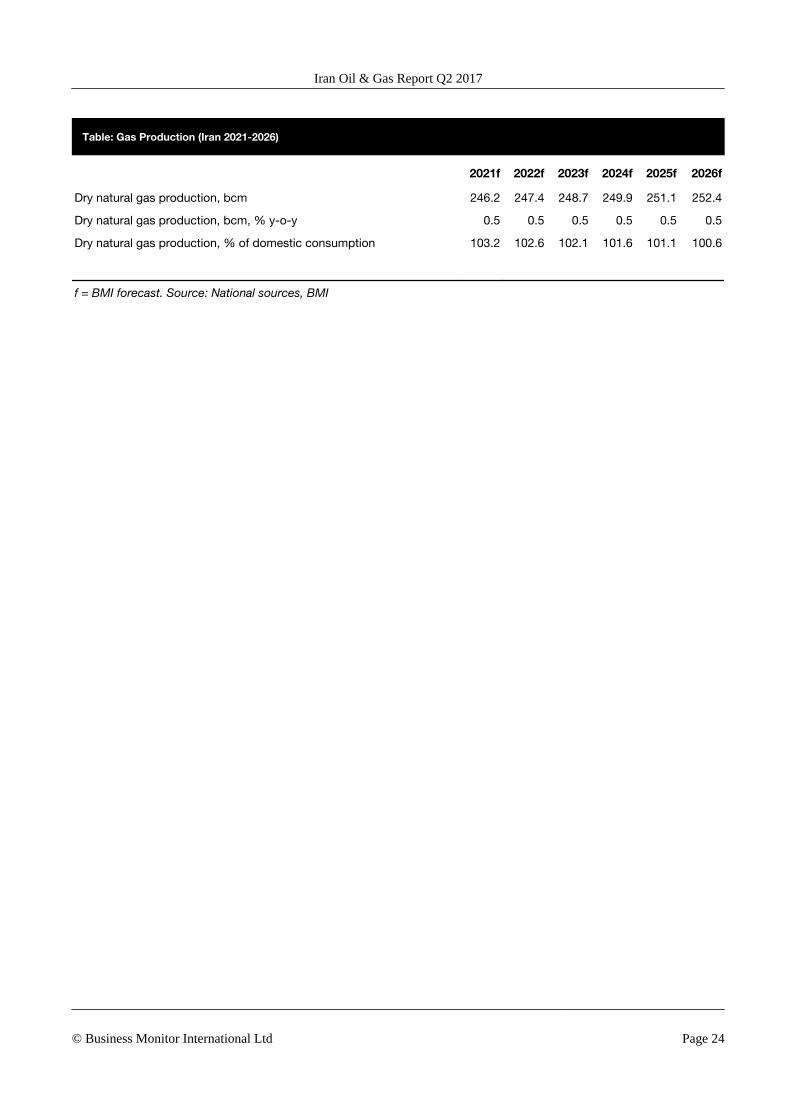
Table: Gas Production (Iran 2021-2026)
2021f 2022f 2023f 2024f 2025f 2026f
Dry natural gas production, bcm 246.2 247.4 248.7 249.9 251.1 252.4
Dry natural gas production, bcm, % y-o-y 0.5 0.5 0.5 0.5 0.5 0.5
Dry natural gas production, % of domestic consumption 103.2 102.6 102.1 101.6 101.1 100.6
f = BMI forecast. Source: National sources, BMI
Iran Oil & Gas Report Q2 2017
© Business Monitor International Ltd Page 24

Refining
BMI View: The phased completion of the Persian Gulf Star refinery will reduce Iran's fuels import needs
from March, with Iran switching to a net gasoline exporter. Refinery developments will focus on upgrades
over greenfield projects.
Latest Updates
■ The first phase of the Persian Gulf Star refinery is in commissioning with the first naphtha consignmenthaving been shipped. Full commercial operation of the 120,000b/d phase is expected by March 2017.
■ The subsequent two 120,000b/d phases of the Persian Gulf Star refinery are due to come on four andeight months after phase 1. Products will be to Euro-IV standard.
■ NIOC is finalising a USD1.2bn contract with Sinopec to upgrade the Abadan refinery to produce Euro-Vstandard gasoline and diesel, while reducing fuel oil output.
■ Pre-commissioning of the new gasoline unit at the Bandar Abbas refinery is complete, increasinggasoline output three fold to 27.5mn b/d.
■ USD14bn has been allocated by the government to support the upgrade of the refining sector, and inparticular the larger refineries at Isfahan, Tehran and Tabriz.
Structural Trends
Currently, Iran has seven large refineries of 100,000b/d+ (including the first phase of the Persian Gulf Star
refinery), and a number of smaller facilities of less than 60,000b/d each. While refining capacity estimates
vary wildly due to the lack of reliable data, we estimate combined capacity, stands at 1.984mn b/d. All
refineries are operated by the National Iranian Oil Refining and Distribution Company (NIORDC),
a National Iranian Oil Company (NIOC) subsidiary.
Refinery output figures for 2016 indicate that refined fuel production will be around 3.5% lower in 2016
than 2015. While products prices remain cheap on the global market, Iran has been accelerating
modernisation programmes, specifically in regards to gasoline output. The government has outlined
USD14bn to support the development of the sector. Upgrades at the Bandar Abbas refinery, the
commissioning of the first phase of the Persian Gulf Star facility, will support a substantial increase in
output in 2017. Subsequent phases of the Persian Gulf Star facility as well as efficiency improvements
across the Iranian refining sector, will increase capacity and improve product output.
Iran Oil & Gas Report Q2 2017
© Business Monitor International Ltd Page 25

Refining Capacity Forecast
(2015-2026)
Crude oil refining capacity, 000b/dCrude oil refining capacity, utilisation, %Refined products production, 000b/d
2015
2016
e
2017
f
2018
f
2019
f
2020
f
2021
f
2022
f
2023
f
2024
f
2025
f
2026
f
0
1,000
2,000
3,000
80
82.5
85
87.5
90
92.5
f = BMI forecast. Source: EIA, JODI, BMI
Table: Major Iranian Refineries
Refinery Crude distillation capacity (000 b/d)
Abadan 400
Isfahan 375
Bandar Abbas 330
Arak 260
Tehran 250
Persian Gulf Star Ph 1 120
Tabriz 110
Lavan Island 60
Shiraz 58
Kermanshah 21
1,984
Source: NIORDC
Iran Oil & Gas Report Q2 2017
© Business Monitor International Ltd Page 26

Gasoline Boost From Persian Gulf Star
Iran has traditionally been a net refined fuel exporter, though the country has generally been a net gasoline
importer. Given the constraints of sanctions on the Iranian budget, since 2012 the country has focused on
maximising gasoline production to become self-sufficient.
Key to meeting this target will be the completion of the Persian Gulf Star refinery, which is due to be
operating commercially by March 2017. The refinery will have a 360,000b/d capacity, though is being
constructed in three 120,000b/d phases. The subsequent two phases of the facility are planned to follow four
and eight months after phase one respectively.
The facility has been specifically designed to process natural gas condensate - which will be derived from
the new South Pars phases coming online in 2016 - into fuels. Gasoline and high octane gasoline will be the
target product with 62% of capacity (226,000b/d), 24% (88,000b/d) will be diesel and 12% (45,000b/d) jet
fuel and LPG.
The Gulf Star refinery will see Iran's refining capacity increase to 2.2mn b/d by 2018. More importantly,
once fully operational, the facility will make Iran self-sufficient in gasoline production.
Iran Oil & Gas Report Q2 2017
© Business Monitor International Ltd Page 27
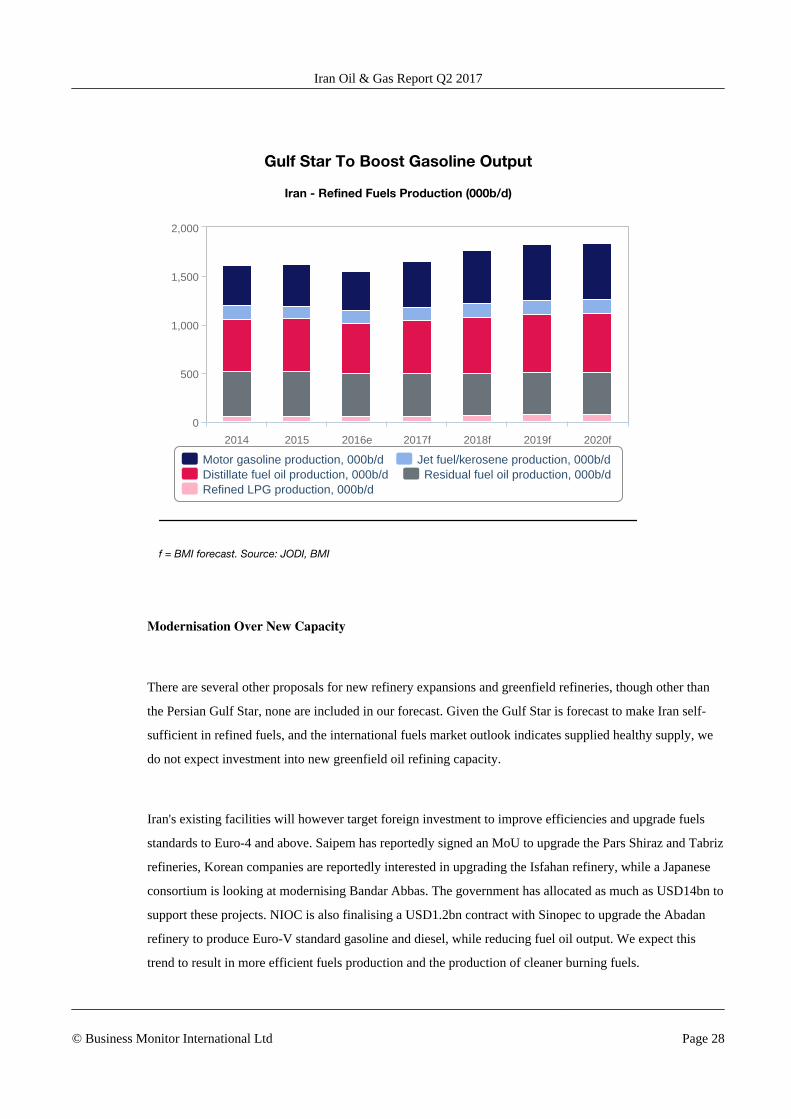
Gulf Star To Boost Gasoline Output
Iran - Refined Fuels Production (000b/d)
Motor gasoline production, 000b/d Jet fuel/kerosene production, 000b/dDistillate fuel oil production, 000b/d Residual fuel oil production, 000b/dRefined LPG production, 000b/d
2014 2015 2016e 2017f 2018f 2019f 2020f
0
500
1,000
1,500
2,000
f = BMI forecast. Source: JODI, BMI
Modernisation Over New Capacity
There are several other proposals for new refinery expansions and greenfield refineries, though other than
the Persian Gulf Star, none are included in our forecast. Given the Gulf Star is forecast to make Iran self-
sufficient in refined fuels, and the international fuels market outlook indicates supplied healthy supply, we
do not expect investment into new greenfield oil refining capacity.
Iran's existing facilities will however target foreign investment to improve efficiencies and upgrade fuels
standards to Euro-4 and above. Saipem has reportedly signed an MoU to upgrade the Pars Shiraz and Tabriz
refineries, Korean companies are reportedly interested in upgrading the Isfahan refinery, while a Japanese
consortium is looking at modernising Bandar Abbas. The government has allocated as much as USD14bn to
support these projects. NIOC is also finalising a USD1.2bn contract with Sinopec to upgrade the Abadan
refinery to produce Euro-V standard gasoline and diesel, while reducing fuel oil output. We expect this
trend to result in more efficient fuels production and the production of cleaner burning fuels.
Iran Oil & Gas Report Q2 2017
© Business Monitor International Ltd Page 28

Table: Modernisation Projects
Refinery Plan Companies Linked
Pars Shiraz Upgrade MoU with Saipem
Tabriz Upgrade MoU with Saipem, JX Nippon Oil & Energy
Lavan Boost Gasoline Production -
Isfahan Residue FCC upgrade Korean Consortium
Bandar Abbas Modernisation Feasibility Chiyoda, Mitsui
Source: BMI, news reports
Table: Refining Capacity And Refined Products Production (Iran 2015-2020)
2015 2016e 2017f 2018f 2019f 2020f
Crude oil refining capacity, 000b/d 1,864.0 1,984.0 2,104.0 2,224.0 2,224.0 2,224.0
Crude oil refining capacity, % y-o-y 1.6 6.4 6.0 5.7 0.0 0.0
Crude oil refining capacity, utilisation, % 89.9 81.6 81.8 82.4 85.5 86.1
Refined products production, 000b/d 1,676.0 1,618.3 1,722.0 1,833.5 1,900.5 1,913.8
Refined products production, % y-o-y 0.5 -3.4 6.4 6.5 3.7 0.7
Refined products production & ethanol, 000b/d 1,676.0 1,618.3 1,722.0 1,833.5 1,900.5 1,913.8
Refined products production & ethanol, % y-o-y 0.5 -3.4 6.4 6.5 3.7 0.7
e/f = BMI estimate/forecast. Source: National sources, BMI
Table: Refining Capacity And Refined Products Production (Iran 2021-2026)
2021f 2022f 2023f 2024f 2025f 2026f
Crude oil refining capacity, 000b/d 2,224.0 2,224.0 2,224.0 2,224.0 2,224.0 2,224.0
Crude oil refining capacity, % y-o-y 0.0 0.0 0.0 0.0 0.0 0.0
Crude oil refining capacity, utilisation, % 86.7 87.3 87.9 88.5 89.1 89.7
Refined products production, 000b/d 1,927.2 1,940.6 1,954.2 1,967.9 1,981.7 1,995.6
Refined products production, % y-o-y 0.7 0.7 0.7 0.7 0.7 0.7
Refined products production & ethanol, 000b/d 1,927.2 1,940.6 1,954.2 1,967.9 1,981.7 1,995.6
Refined products production & ethanol, % y-o-y 0.7 0.7 0.7 0.7 0.7 0.7
e/f = BMI estimate/forecast. Source: BMI, NIORDC, JODI
Iran Oil & Gas Report Q2 2017
© Business Monitor International Ltd Page 29

Refined Fuels Consumption
BMI View: Fuels consumption fell for a fourth straight year in 2016, but is expected to grow in 2017.
Anticipated improvements in economic growth will drive more consistent increases in demand over the next
ten years.
Latest Updates
■ Iranian refined fuels consumption averaged 1.505mn b/d in 2016, down 2.5% on 2015.
■ Diesel consumption fell 8.3%, and gasoline consumption was 2.5% lower in 2016.
■ Diesel consumption will increase as industrial activity and construction growth accelerate.
■ Iran is increasing supply of Euro-IV standard fuels, particularly in the larger cities.
■ Iran's Fuel Conservation Organization is planning to spend USD16bn on energy efficiency projects toreduce fuels
Structural Trends
Iran is targeting the complete removal of all energy subsidies in 2017, though it remains unclear how prices
will be structured and whether the government will be willing to do this in an election year. After taking
power in 2013, President Rouhani introduced steep changes to the generous fuels subsidy system. Currently,
eligible drivers are limited to 60 litres of fuel per month at subsidised prices, but must pay near market
prices for any remaining fuel needs. This drove a 10.5% fall in fuels consumption in 2014, a 2.5% drop in
2015 and a 2.5% drop in 2016. Gasoline prices in Iran are now closer to global market prices, though diesel
remains substantially subsidised.
Iran Oil & Gas Report Q2 2017
© Business Monitor International Ltd Page 30

Refined Products Production And Consumption Forecast
(2015-2026)
Refined products production, 000b/dRefined products consumption, 000b/dRefined products consumption, % y-o-y
2015
2016
e
2017
f
2018
f
2019
f
2020
f
2021
f
2022
f
2023
f
2024
f
2025
f
2026
f
0
1,000
2,000
3,000
0
-5
-2.5
2.5
5
e/f = BMI estimate/forecast. Source: BMI, EIA, JODI
Demand for gasoline and diesel will return to an uptrend, though strengthening oil prices could impact
domestic prices and demand for fuels. The removal of sanctions in January 2016 has facilitated increased
gasoline imports to meet pent up demand, though we consumption fell in 2016 as the economy continues to
transition from sanctions. We expect a return to demand growth in 2017, with more capital inflows
supporting an improved outlook for the Iranian economy and consumers. In particular we see growing
demand for distillates from the construction and industrial sectors and gasoline from consumers.
Fuel Subsidy Changes
Sanctions on the energy sector stemmed Iranian government income, forcing a revision of the fuels subsidy
programme and driving three rounds of subsidy cuts:
■ Phase 1: Iran initiated the first phase of subsidy reform at the end of 2010, decreasing subsidies onenergy prices.
■ Phase 2: Was implemented at the end of April 2014, with fuel subsidy reductions on gasoline, diesel andcompressed natural gas (CNG). The cost of gasoline has increased from IRR4,000 (USD0.16) per litre to
Iran Oil & Gas Report Q2 2017
© Business Monitor International Ltd Page 31

IRR7,000 (USD0.27) per litre, an increase of 75%, while gasoline sold outside quotas rose to IRR10,000(USD0.39) per litre.
■ Phase 3: Iran proceeded with a third wave of subsidy cuts in May 2015, raising gasoline prices toIRR10,000 (USD0.35) per litre, up from IRR7,000.
Gasoline pump prices in Iran are currently around USD0.40/litre, while diesel prices remained more heavily
discounted at USD0.10/litre.
Table: Approximate Gasoline & Diesel Costs
Iranian Domestic Price Approximate Global Market PriceAverage Global
Pump Price
Gasoline, USD/litre 0.40 0.41 1.02
Diesel, USD/litre 0.10 0.58 0.91
Note: Accurate as of February 2017. Source: Globalpetrolprices.com, Bloomberg
Subsidy Cuts Unlikely Before Elections
Lower oil prices have exacerbated fiscal challenges in Iran and will likely keep pressure on the government
to maintain its direction of reform towards market pricing structures - a trend we are seeing accelerate in
other Gulf States as petroleum revenues are low.
That said, inflation in Iran has been high, impacting consumer spending. Subsidy cuts are unpopular and
with the May 2017 election approaching we do not expect further subsidy cuts to be enacted. That said, we
believe further subsidy cuts will still be critical in decreasing the budget deficit over the longer term. While
the increase in oil exports forecast over 2017 will temper the negative effects of subsidies, lower oil prices
will still strain the fiscal budget.
We expect fuels consumption growth to return from 2017 as the economic outlook improves. That said,
higher prices and efficiency drives will moderate the pace of growth over the longer term. A recently
launched initiative by the Fuel Conservation Organization is specifically targeting cost savings from
reducing fuel consumption, which will work to curb consumption over the longer term. Up to USD16.3bn
has been budgeted to:
■ Improve boiler efficiency in buildings
■ Replace large freight vehicles over 35 years old (~65,000)
Iran Oil & Gas Report Q2 2017
© Business Monitor International Ltd Page 32
■ Replace diesel buses with new CNG vehicles (~17,000)
■ Replace old taxis/vans with new CNG vehicles (~140,000)
■ Boost rail transport
Given these factors, despite better economic growth, our forecasts do not see Iran consuming more fuel than
in 2012 until 2026, with growth tapering thereafter.
Table: Refined Products Consumption (Iran 2015-2020)
2015 2016e 2017f 2018f 2019f 2020f
Refined products consumption, 000b/d 1,544.4 1,505.4 1,554.5 1,614.7 1,652.4 1,687.1
Refined products consumption, % y-o-y -2.5 -2.5 3.3 3.9 2.3 2.1
e/f = BMI estimate/forecast. Source: BMI, EIA, JODI
Table: Refined Products Consumption (Iran 2021-2026)
2021f 2022f 2023f 2024f 2025f 2026f
Refined products consumption, 000b/d 1,712.4 1,736.4 1,757.2 1,774.8 1,789.0 1,799.7
Refined products consumption, % y-o-y 1.5 1.4 1.2 1.0 0.8 0.6
f = BMI forecast. Source: National sources, BMI
Gas Consumption
BMI View: New South Pars phases are increasing the availability of natural gas, meeting pent-up demand
and substituting oil products in power generation. Over the longer term, better economic growth and efforts
to boost natural gas use over oil will support greater residential and industrial demand.
Latest Updates
■ Gas processing capacity has reached 260bcm according to National Iranian Gas Company.
■ Phases 17, 18 and of South Pars will have spare capacity to meet a further 20bcm of demand.
■ Phases 14, 20 and 21 will reportedly be commissioned by March 2017.
■ Build out of pipeline infrastructure from IGAT 6, 9 & 11 will enable greater consumption of gas inundersupplied areas of Iran.
Iran Oil & Gas Report Q2 2017
© Business Monitor International Ltd Page 33

Structural Trends
As a result of gas subsidies and a switch in the domestic energy mix from oil to gas, domestic gas
consumption in Iran has seen a rapid rise. Between 2010 and 2016, domestic consumption increased 40%
from 152bcm to 214bcm. We estimate consumption will increase a further 6.7% in 2017 and 2.1% in 2018,
as a result of greater gas availability and gas for oil substitution in power generation.
Gas Production and Consumption Forecast
(2015-2026)
Dry natural gas production, bcm Dry natural gas consumption, bcmDry natural gas consumption, % y-o-y
2015
2016
e
2017
f
2018
f
2019
f
2020
f
2021
f
2022
f
2023
f
2024
f
2025
f
2026
f
0
100
200
300
0
5
10
15
-5
e/f = BMI estimate/forecast. Source: BMI, EIA, IEA, OPEC
We forecast gas consumption to continue growing as new phases of the South Pars field increase
availability of gas for the domestic market. With approximately 260bcm of gas production capacity
operational, Iran has the flexibility to increased output by over 45bcm if needed.
The main uses of gas in Iran are:
■ Reinjection, which will increase as Iran looks to step up oil exports and curb declines at mature fieldsover the coming years. Estimates calculate around 25-30bcm of gas is re-injected every year to maintainreservoir pressure at mature oil fields. This has likely supported the increase in oil exports.
■ Power Generation - since new gas availability in early 2016 oil products burnt at power stations havebeen substituted with gas, reducing direct crude burn and domestic fuel oil and diesel consumption. Thisswitch also facilitated the ramp-up in Iranian crude exports.
Iran Oil & Gas Report Q2 2017
© Business Monitor International Ltd Page 34

■ Residential and industrial use currently accounts for around 34% of total gas consumption, a figureexpected to grow over the medium term as the Iranian economy recovers after years of sanctions. Newpipelines (IGAT6, 9 &11) are being planned to increase supply to Tehran, the northeast and the northwestof the country.
We see substantial upside to consumption over the long term, particularly if Iran is able to effectively
implement its plans build out midstream capacity and introduce more compressed natural gas vehicles.
Table: Gas Consumption (Iran 2015-2020)
2015 2016e 2017f 2018f 2019f 2020f
Dry natural gas consumption, bcm 191.2 214.2 228.5 233.3 234.5 235.7
Dry natural gas consumption, % y-o-y 6.2 12.0 6.7 2.1 0.5 0.5
e/f = BMI estimate/forecast. Source: BMI, EIA, DOE
Table: Gas Consumption (Iran 2021-2026)
2021f 2022f 2023f 2024f 2025f 2026f
Dry natural gas consumption, bcm 237.3 239.2 241.4 243.5 246.0 248.4
Dry natural gas consumption, % y-o-y 0.7 0.8 0.9 0.9 1.0 1.0
f = BMI forecast. Source: BMI, EIA, DOE
Iran Oil & Gas Report Q2 2017
© Business Monitor International Ltd Page 35
Trade - Oil
BMI View: In 2017, average annual crude exports will increase by 230,000b/d as Iran stabilises oil trade.
Iran will have the capacity to export some fuels once the Persian Gulf Star refinery starts up early 2017.
Crude Oil Trade Forecast
Latest Updates
■ According to data from importing countries, Iranian oil exports averaged 2.01mn b/d in over 2016, anincrease of over 800,000b/d y-o-y.
■ China, India and South Korea remain the major importers of Iranian crude, with Japan, Turkey andEuropean countries accepting new volumes.
■ South Pars condensate production from phases 17, 18, 19, 20 and 21 is boosting the volumes ofcondensate for export.
Structural Trends
Crude Export Outlook
We forecast crude and condensate production to rise by an average of 230,000b/d in 2017. We do not
expect exports to consistently average much higher than 2.3mn b/d, with a draw down in floating storage
having supported export levels in late 2016. Long-term upside to exports will depend on the speed and
scope of the return of international oil companies (IOCs) to the Iranian energy sector, and the funds the
government is willing to allocate to upstream expansion.
Iran Oil & Gas Report Q2 2017
© Business Monitor International Ltd Page 36
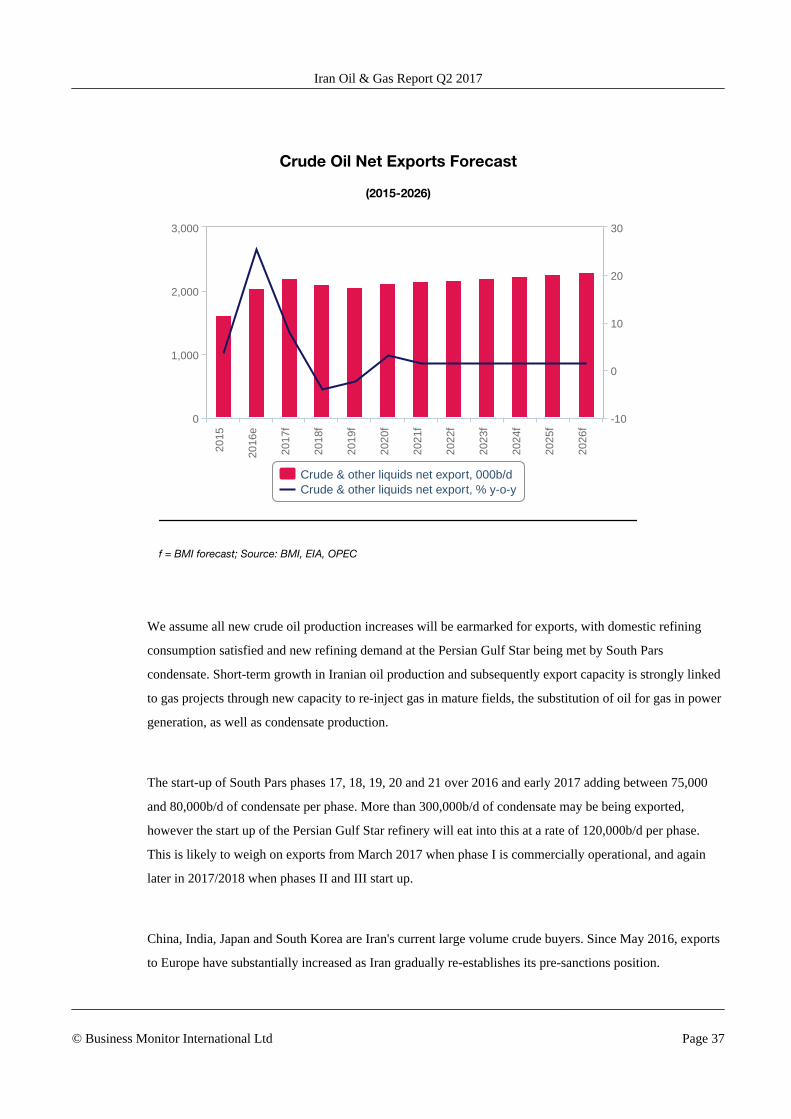
Crude Oil Net Exports Forecast
(2015-2026)
Crude & other liquids net export, 000b/dCrude & other liquids net export, % y-o-y
2015
2016
e
2017
f
2018
f
2019
f
2020
f
2021
f
2022
f
2023
f
2024
f
2025
f
2026
f
0
1,000
2,000
3,000
-10
0
10
20
30
f = BMI forecast; Source: BMI, EIA, OPEC
We assume all new crude oil production increases will be earmarked for exports, with domestic refining
consumption satisfied and new refining demand at the Persian Gulf Star being met by South Pars
condensate. Short-term growth in Iranian oil production and subsequently export capacity is strongly linked
to gas projects through new capacity to re-inject gas in mature fields, the substitution of oil for gas in power
generation, as well as condensate production.
The start-up of South Pars phases 17, 18, 19, 20 and 21 over 2016 and early 2017 adding between 75,000
and 80,000b/d of condensate per phase. More than 300,000b/d of condensate may be being exported,
however the start up of the Persian Gulf Star refinery will eat into this at a rate of 120,000b/d per phase.
This is likely to weigh on exports from March 2017 when phase I is commercially operational, and again
later in 2017/2018 when phases II and III start up.
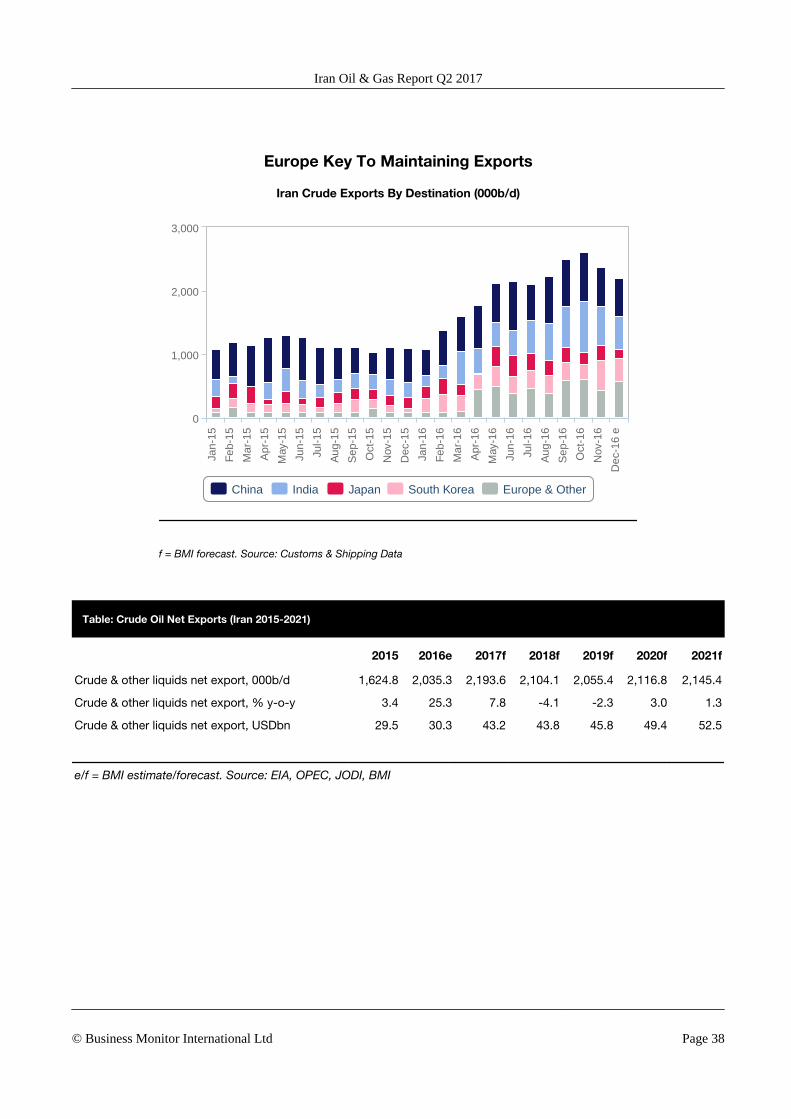
China, India, Japan and South Korea are Iran's current large volume crude buyers. Since May 2016, exports
to Europe have substantially increased as Iran gradually re-establishes its pre-sanctions position.
Iran Oil & Gas Report Q2 2017
© Business Monitor International Ltd Page 37
Europe Key To Maintaining Exports
Iran Crude Exports By Destination (000b/d)
China India Japan South Korea Europe & Other
Jan-
15
Feb
-15
Mar
-15
Apr
-15
May
-15
Jun-
15
Jul-1
5
Aug
-15
Sep
-15
Oct
-15
Nov
-15
Dec
-15
Jan-
16
Feb
-16
Mar
-16
Apr
-16
May
-16
Jun-
16
Jul-1
6
Aug
-16
Sep
-16
Oct
-16
Nov
-16
Dec
-16
e
0
1,000
2,000
3,000
f = BMI forecast. Source: Customs & Shipping Data
Table: Crude Oil Net Exports (Iran 2015-2021)
2015 2016e 2017f 2018f 2019f 2020f 2021f
Crude & other liquids net export, 000b/d 1,624.8 2,035.3 2,193.6 2,104.1 2,055.4 2,116.8 2,145.4
Crude & other liquids net export, % y-o-y 3.4 25.3 7.8 -4.1 -2.3 3.0 1.3
Crude & other liquids net export, USDbn 29.5 30.3 43.2 43.8 45.8 49.4 52.5
e/f = BMI estimate/forecast. Source: EIA, OPEC, JODI, BMI
Iran Oil & Gas Report Q2 2017
© Business Monitor International Ltd Page 38
Table: Crude Oil Net Exports (Iran 2021-2026)
2021f 2022f 2023f 2024f 2025f 2026f
Crude & other liquids net export, 000b/d 2,145.4 2,174.3 2,203.6 2,233.3 2,263.3 2,293.7
Crude & other liquids net export, % y-o-y 1.3 1.3 1.3 1.3 1.3 1.3
Crude & other liquids net export, USDbn 52.5 54.8 57.1 58.7 59.5 60.3
f = BMI forecast. Source: EIA, OPEC, JODI, BMI
Refined Products Trade Forecast
Latest Updates
■ Iran will be self-sufficient in all refined fuels from mid-2017, though will still import more specialisedproducts.
■ New capacity at the Persian Gulf Star refinery will make Iran a net exporter of gasoline for the first timein over 60 years.
Structural Trends
Refined Fuels Trade Outlook
Iran was a net refined fuels importer, though a mixture of falling fuels consumption as a result of sanctions
induced recession and subsidy cuts, Iran became a net fuels exporter in 2014. Refining sector upgrades will
help strengthen this trend over the coming quarters, with more efficient operations expected to increase
output.
Iran Oil & Gas Report Q2 2017
© Business Monitor International Ltd Page 39

Refined Products Net Exports Forecast
(2015-2026)
Refined products net exports, 000b/d Refined products net exports, % y-o-y
2015
2016
e
2017
f
2018
f
2019
f
2020
f
2021
f
2022
f
2023
f
2024
f
2025
f
2026
f
0
100
200
300
0
-25
25
50
75
f = BMI forecast. Source: EIA, OPEC, JODI, BMI
We forecast Iran will be self-sufficient in all refined fuels once the Persian Gulf Star refinery starts up in
early 2017. Due to the growing surplus of residual fuel Iran had some capacity for exports over this time,
albeit in low grade products. Upgrade and modernisation programmes are increasingly adding processing
depth, such as the new FCC at the Bandar Abbas facility.
Iran Oil & Gas Report Q2 2017
© Business Monitor International Ltd Page 40
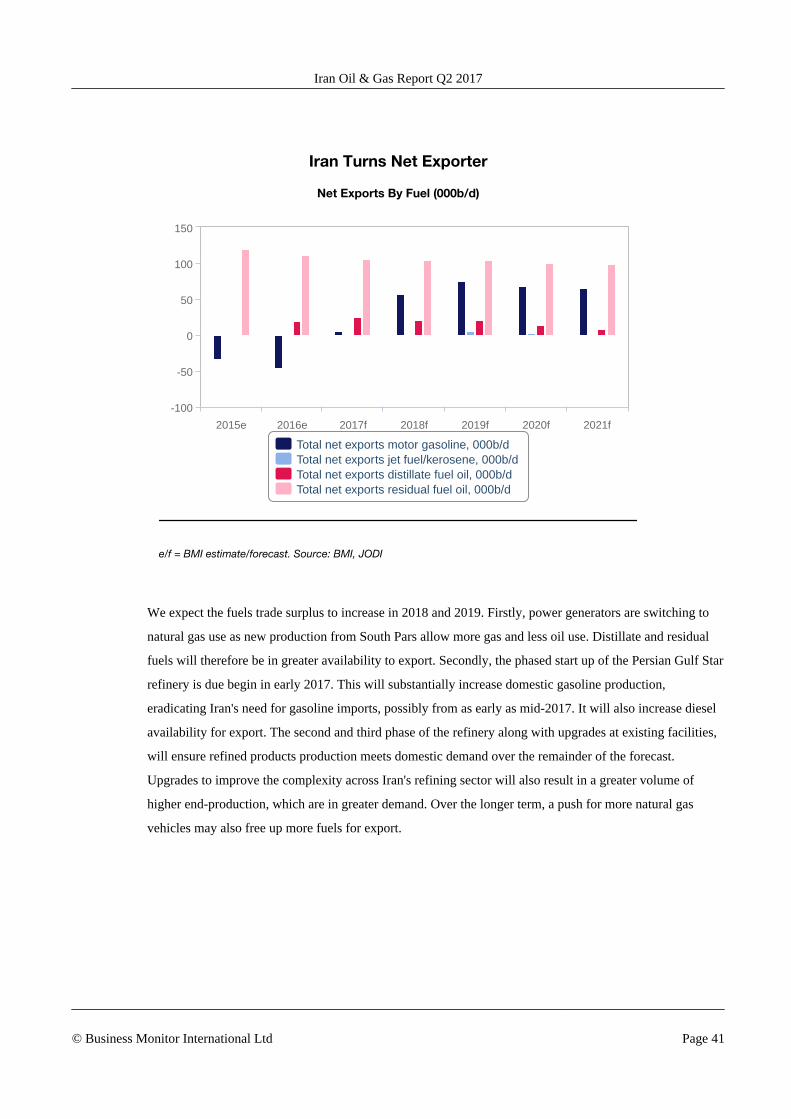
Iran Turns Net Exporter
Net Exports By Fuel (000b/d)
Total net exports motor gasoline, 000b/dTotal net exports jet fuel/kerosene, 000b/dTotal net exports distillate fuel oil, 000b/dTotal net exports residual fuel oil, 000b/d
2015e 2016e 2017f 2018f 2019f 2020f 2021f
-100
-50
0
50
100
150
e/f = BMI estimate/forecast. Source: BMI, JODI
We expect the fuels trade surplus to increase in 2018 and 2019. Firstly, power generators are switching to
natural gas use as new production from South Pars allow more gas and less oil use. Distillate and residual
fuels will therefore be in greater availability to export. Secondly, the phased start up of the Persian Gulf Star
refinery is due begin in early 2017. This will substantially increase domestic gasoline production,
eradicating Iran's need for gasoline imports, possibly from as early as mid-2017. It will also increase diesel
availability for export. The second and third phase of the refinery along with upgrades at existing facilities,
will ensure refined products production meets domestic demand over the remainder of the forecast.
Upgrades to improve the complexity across Iran's refining sector will also result in a greater volume of
higher end-production, which are in greater demand. Over the longer term, a push for more natural gas
vehicles may also free up more fuels for export.
Iran Oil & Gas Report Q2 2017
© Business Monitor International Ltd Page 41
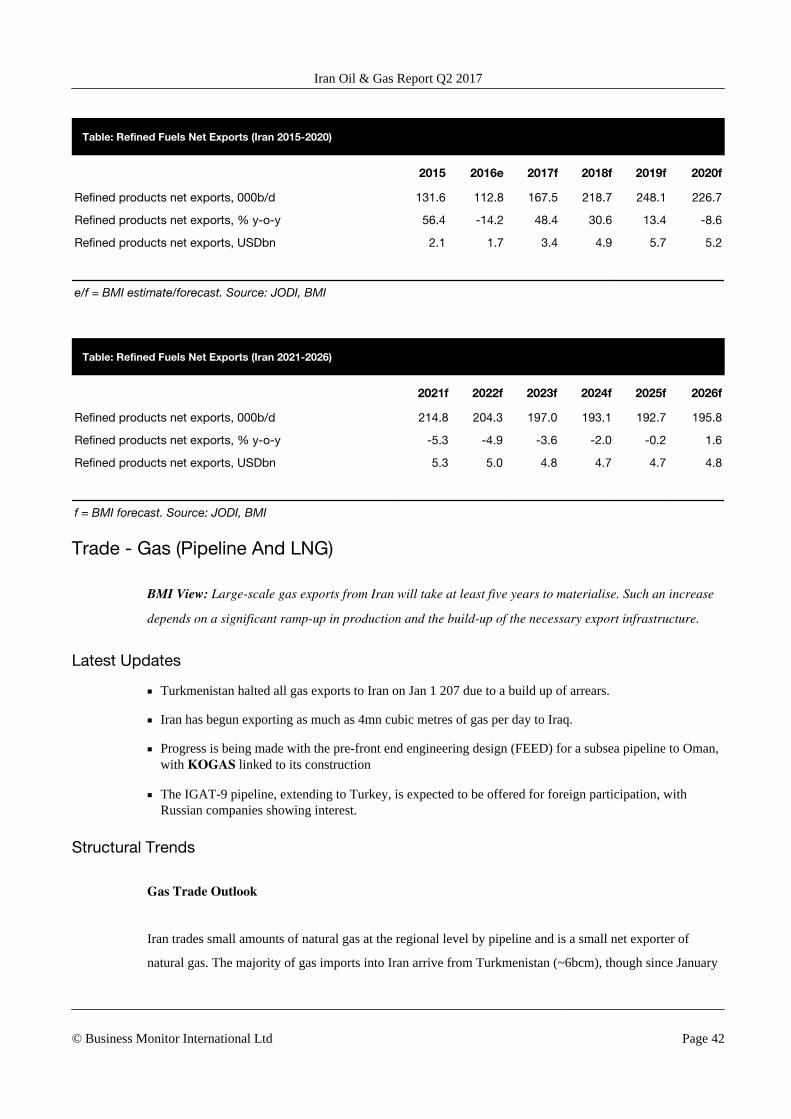
Table: Refined Fuels Net Exports (Iran 2015-2020)
2015 2016e 2017f 2018f 2019f 2020f
Refined products net exports, 000b/d 131.6 112.8 167.5 218.7 248.1 226.7
Refined products net exports, % y-o-y 56.4 -14.2 48.4 30.6 13.4 -8.6
Refined products net exports, USDbn 2.1 1.7 3.4 4.9 5.7 5.2
e/f = BMI estimate/forecast. Source: JODI, BMI
Table: Refined Fuels Net Exports (Iran 2021-2026)
2021f 2022f 2023f 2024f 2025f 2026f
Refined products net exports, 000b/d 214.8 204.3 197.0 193.1 192.7 195.8
Refined products net exports, % y-o-y -5.3 -4.9 -3.6 -2.0 -0.2 1.6
Refined products net exports, USDbn 5.3 5.0 4.8 4.7 4.7 4.8
f = BMI forecast. Source: JODI, BMI
Trade - Gas (Pipeline And LNG)
BMI View: Large-scale gas exports from Iran will take at least five years to materialise. Such an increase
depends on a significant ramp-up in production and the build-up of the necessary export infrastructure.
Latest Updates
■ Turkmenistan halted all gas exports to Iran on Jan 1 207 due to a build up of arrears.
■ Iran has begun exporting as much as 4mn cubic metres of gas per day to Iraq.
■ Progress is being made with the pre-front end engineering design (FEED) for a subsea pipeline to Oman,with KOGAS linked to its construction
■ The IGAT-9 pipeline, extending to Turkey, is expected to be offered for foreign participation, withRussian companies showing interest.
Structural Trends
Gas Trade Outlook
Iran trades small amounts of natural gas at the regional level by pipeline and is a small net exporter of
natural gas. The majority of gas imports into Iran arrive from Turkmenistan (~6bcm), though since January
Iran Oil & Gas Report Q2 2017
© Business Monitor International Ltd Page 42

1 2017, exports have been stopped due to a disagreement over payments. The majority of Iran's exports are
sent to Turkey (~9bcm). The country notably relies on gas imports during the winter months when
residential demand peaks due to the cold weather.
With the start-up of new South Pars phases over 2016/17 Iran will reduce its need for gas imports, enabling
it to have greater export capacity. Iraq and Turkey are expected to be the main benefactors of this, with
Turkmenistan losing out. However, pipeline build out to undersupplied areas of the country will be essential
achieving this. In April, Iran reported it had begun injecting the pipeline planned to supply the Diyala region
of Iraq and Baghdad, at volumes of around 4mn cubic metres per day.
Gas Net Exports Forecast
(2015-2026)
Pipeline gas net exports, bcm LNG net exports, bcm
2015
e
2016
e
2017
f
2018
f
2019
f
2020
f
2021
f
2022
f
2023
f
2024
f
2025
f
2026
f
0
2.5
5
7.5
10
e/f = BMI estimate/forecast; Source: BMI, EIA, OPEC
Limited Gas Export Capacity Over Coming Next Years
We have adjusted our Iranian gas production outlook to take into account production from new phases of
South Pars over 2016/17. However, we only see a marginal increase in Iran's gas net exports, as we expect
the majority of additional production over the coming few years will be consumed domestically. Our
Iran Oil & Gas Report Q2 2017
© Business Monitor International Ltd Page 43

current forecast assumes a small amount of exports to Iraq on top of tharoun 9bcm to Turkey, and a large
reduction in imports from Turkmenistan
Depending on the stability in Iraq, its ability to pay, and the connection of a new pipeline in Basra, export to
Iraq could grow substantially. The full extent of this is not factored into our forecast. In the long term, net
exports will also be highly dependent on the level of investment that goes into the country's gas sector -
particularly LNG - following the lifting of sanctions.
Strong Upside Risk To Exports Past 2020
We note strong upside risk to net gas exports past 2020, based on two conditions:
■ Notable Production Ramp-Up Past 2019: Our gas production forecast currently takes into account theramp-up in South Pars phases 12, 15, 16, 17, 18 and 19 in 2016. We are also forecasting output fromphases 20 and 21 from 2017. However, we do not yet include development of other South Pars phases orother field developments within our forecast. Given the size of the resources left undeveloped, productiongrowth will hinge on the speed and scope of the return of the international oil companies (IOCs) to theIranian energy sector and the pace of prospective gas developments.
■ Pipeline Infrastructure: In addition to an increase in gas production, the build-up of the necessary gasexport infrastructure to neighbouring countries will have to be concretised before Iran's gas net exportscan rise substantially. Iran has pipeline gas export capacity of 13bcm to Turkey, of which about 9bcm isalready in use, offering little spare pipeline capacity. Iran also has small export capacity to Armenia,Azerbaijan and Iraq. Completing the connection with Pakistan (on the Pakistan side) and building a newpipeline into Basra, could provide a substantial outlet for gas in the coming years.
Regional Gas Exports Within Our Forecast Period
We expect three pipeline projects can materialise over our forecast period, reinforcing our expectation that
much of Iran's gas exports over the period will be to regional players.
■ Iraq: The country is suffering from chronic power shortages despite having sufficient gas-fired powergeneration capacity. Securing adequate gas feedstock through imports is vital for Iraq's power sector,providing a good export market for Iranian gas. A 10-year gas agreement was signed between Iran andIraq in July 2013, which stipulates Iran will deliver up to 9.1bcm of gas via pipeline Iraq. Pipelineconstruction is reportedly complete, with gas injection beginning in April 2016. A second pipeline to theBasra region is also being laid, with similar volumes potentially exported.
■ Oman: The pre-FEED for a subsea pipeline connecting Iran to Oman is well underway. The pipelinewould make use of Oman's LNG export facility, freeing up gas produced in Oman for domestic use. If thefull FEED process begins, a pipeline could be in place by 2019 at the earliest. KOGAS has beenidentified as a possible constructor of the subsea pipeline.
■ Pakistan: Pakistan is facing chronic energy shortages that have disrupted industrial production andignited popular discontent. Pakistan is hoping to begin gas imports from Iran via the Iran-PakistanPipeline (IP Pipeline). While Pakistan is facing financial difficulties building its side, we believe the
Iran Oil & Gas Report Q2 2017
© Business Monitor International Ltd Page 44

lifting of sanctions on Iran may drive the completion of this project. Once completed, the pipeline willsupport gas inflows of 8bcm per year to Pakistan.
LNG Prospects
While we expect Iran could become a significant regional gas exporter over the second half of our forecast
period, it will need to tap major gas consumption markets. In our view LNG will be crucial to achieving this
and getting Iranian gas into Europe and Asia.
We do not believe a pipeline option to Europe makes sense. Iran would need to significantly upgrade and
build new pipeline capacity for its gas to reach Europe. Furthermore, in order to develop such a project in a
viable manner, it would likely need the entire capacity of any expansion of the Trans Anatolian Pipeline
(TANAP) - proposed to increase from 16bcm to 31bcm by 2026. The TAP pipeline, which will enter
Europe, has an option to expand by 10bcm; however, this is subject to EU third energy package rules
allowing only 50% of pipeline capacity to one company.
In our view, Europe does not have a sufficient gas demand profile to support a project of sufficient volume
to support exports, nor does it have the capacity to accept large volumes of gas. LNG would remain a more
viable and flexible option to significantly increase Iranian gas exports.
According to National Iranian Gas Export Company, two LNG projects embarked upon prior to
sanctions - Pars and Persian - are at 50% completion. We believe there will be strong IOC interest in LNG
in Iran, given the low cost of gas production. That said, we do not expect IOCs to move quickly with such
projects given reduced capex budgets, high up-front costs and the high risks involved in long-term projects
in Iran. A floating LNG project is also under discussion to fast-track exports of associated gas from the
Forouzan field.
Table: Gas Net Exports (Iran 2015-2020)
2015e 2016e 2017f 2018f 2019f 2020f
Dry natural gas net exports, bcm 1.2 4.1 9.2 9.2 9.2 9.3
Dry natural gas net exports, % y-o-y -39.3 229.9 127.8 -0.5 0.5 0.5
Dry natural gas net exports, USDbn 0.3 0.8 2.5 2.6 2.8 3.0
Pipeline gas net exports, bcm 1.2 4.1 9.2 9.2 9.2 9.3
Pipeline gas net exports, % y-o-y -39.3 229.9 127.8 -0.5 0.5 0.5
Pipeline gas net exports, % of total 100.0 100.0 100.0 100.0 100.0 100.0
Iran Oil & Gas Report Q2 2017
© Business Monitor International Ltd Page 45
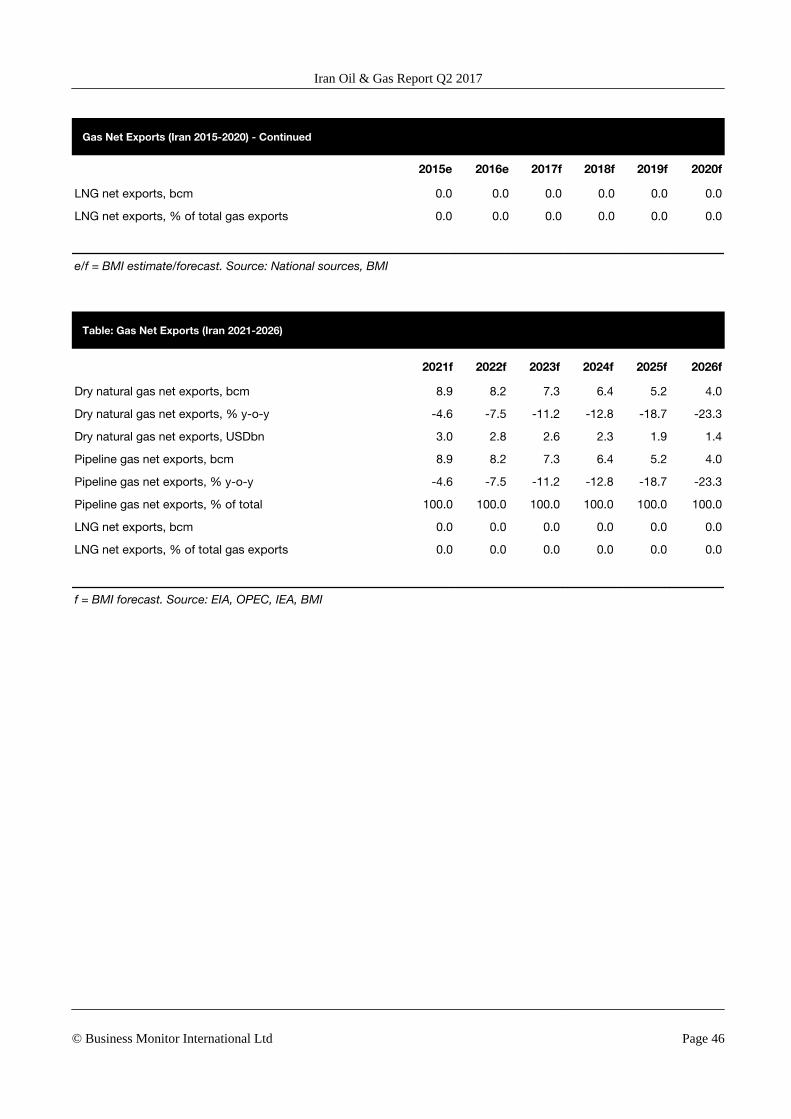
Gas Net Exports (Iran 2015-2020) - Continued
2015e 2016e 2017f 2018f 2019f 2020f
LNG net exports, bcm 0.0 0.0 0.0 0.0 0.0 0.0
LNG net exports, % of total gas exports 0.0 0.0 0.0 0.0 0.0 0.0
e/f = BMI estimate/forecast. Source: National sources, BMI
Table: Gas Net Exports (Iran 2021-2026)
2021f 2022f 2023f 2024f 2025f 2026f
Dry natural gas net exports, bcm 8.9 8.2 7.3 6.4 5.2 4.0
Dry natural gas net exports, % y-o-y -4.6 -7.5 -11.2 -12.8 -18.7 -23.3
Dry natural gas net exports, USDbn 3.0 2.8 2.6 2.3 1.9 1.4
Pipeline gas net exports, bcm 8.9 8.2 7.3 6.4 5.2 4.0
Pipeline gas net exports, % y-o-y -4.6 -7.5 -11.2 -12.8 -18.7 -23.3
Pipeline gas net exports, % of total 100.0 100.0 100.0 100.0 100.0 100.0
LNG net exports, bcm 0.0 0.0 0.0 0.0 0.0 0.0
LNG net exports, % of total gas exports 0.0 0.0 0.0 0.0 0.0 0.0
f = BMI forecast. Source: EIA, OPEC, IEA, BMI
Iran Oil & Gas Report Q2 2017
© Business Monitor International Ltd Page 46

Industry Risk/Reward Index
Middle East - Oil & Gas Risk/Reward Index
BMI View: The Middle East region performs strongly upstream, due to a large and low-cost reserves base
as well as a strong production growth outlook. It has also been among those regions least impacted by the
current industry downturn, with a number of key producers scaling up activities to benefit from widespread
services cost deflation. The above-ground environment remains challenging due to heavy state dominance
in the sector and unattractive licensing regimes and the prospects for improvement here are low and will
continue to drag on the region's risk profile over the coming years.
The main themes from our overall Middle East Oil & Gas Risk/Reward Index (RRI) are:
■ The Middle East outperforms every other region in our Upstream Oil & Gas RRI, supported by asubstantial resource base and strong production profile. Middle Eastern producers are among those leastaffected by the fall in oil prices, due to the region's lower production cost structures.
■ Despite vast proven reserves, Saudi Arabia and Kuwait continue to rank poorly in our Upstream Index.This is the result of the closed nature of both countries' oil and gas sectors, and the lack of opportunitiesfor foreign investors.
■ UAE and Qatar rank at the top of the index, supported by a sizeable reserves base and favourable above-ground environment.
■ Iran's showing in the index saw strong improvements in 2016, following the lifting of internationalsanctions. Further gains are expected in the coming quarters.
■ The Middle East performs poorly in our Downstream Index, due to the high level of state involvementand limited room for non-state competitors.
Table: Middle East Oil & Gas Risk/Reward Index
Upstream R/R Ratings Downstream R/R Ratings Oil & Gas R/R Ratings Rank
UAE 66.1 48.9 57.5 1
Qatar 65.1 42.1 53.6 2
Oman 60.6 44.9 52.7 3
Iraq 64.0 29.7 46.9 4
Saudi Arabia 45.9 45.8 45.8 5
Bahrain 51.8 39.2 45.5 6
Iran 50.0 39.9 45.0 7
Kuwait 47.2 36.3 41.8 8
Yemen 43.2 26.3 34.7 9
Iran Oil & Gas Report Q2 2017
© Business Monitor International Ltd Page 47
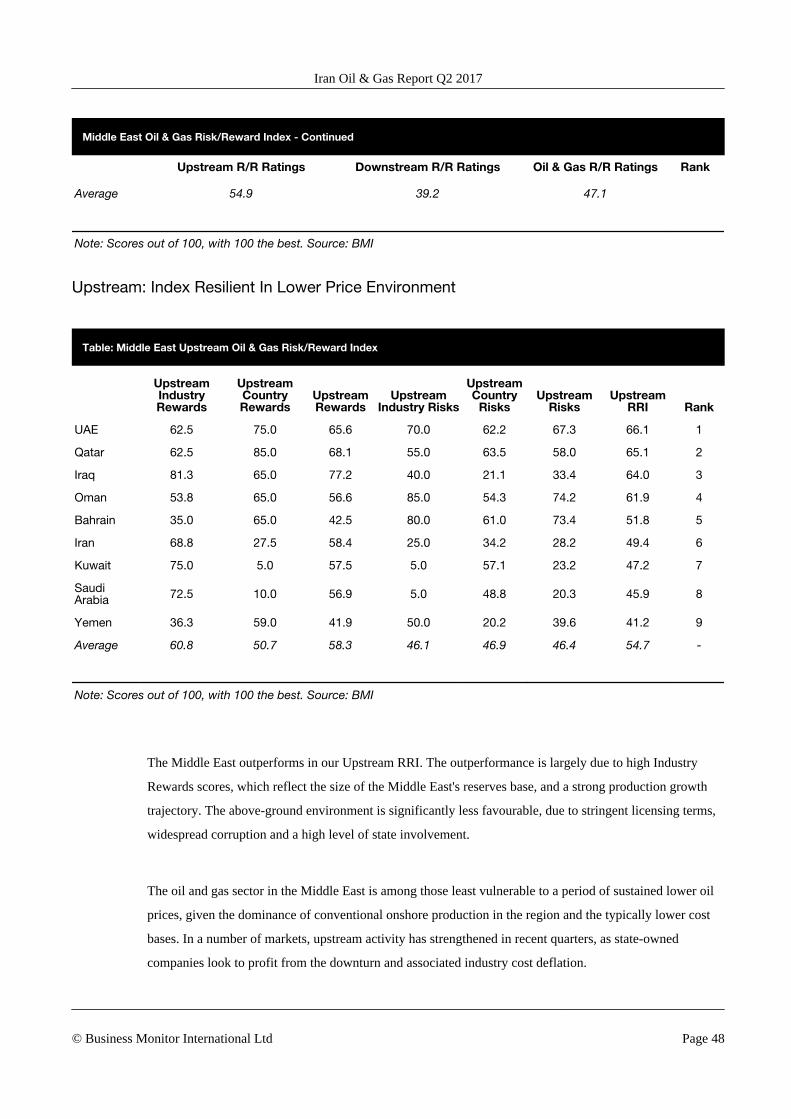
Middle East Oil & Gas Risk/Reward Index - Continued
Upstream R/R Ratings Downstream R/R Ratings Oil & Gas R/R Ratings Rank
Average 54.9 39.2 47.1
Note: Scores out of 100, with 100 the best. Source: BMI
Upstream: Index Resilient In Lower Price Environment
Table: Middle East Upstream Oil & Gas Risk/Reward Index
UpstreamIndustryRewards
UpstreamCountryRewards
UpstreamRewards
UpstreamIndustry Risks
UpstreamCountry
RisksUpstream
RisksUpstream
RRI Rank
UAE 62.5 75.0 65.6 70.0 62.2 67.3 66.1 1
Qatar 62.5 85.0 68.1 55.0 63.5 58.0 65.1 2
Iraq 81.3 65.0 77.2 40.0 21.1 33.4 64.0 3
Oman 53.8 65.0 56.6 85.0 54.3 74.2 61.9 4
Bahrain 35.0 65.0 42.5 80.0 61.0 73.4 51.8 5
Iran 68.8 27.5 58.4 25.0 34.2 28.2 49.4 6
Kuwait 75.0 5.0 57.5 5.0 57.1 23.2 47.2 7
SaudiArabia 72.5 10.0 56.9 5.0 48.8 20.3 45.9 8
Yemen 36.3 59.0 41.9 50.0 20.2 39.6 41.2 9
Average 60.8 50.7 58.3 46.1 46.9 46.4 54.7 -
Note: Scores out of 100, with 100 the best. Source: BMI
The Middle East outperforms in our Upstream RRI. The outperformance is largely due to high Industry
Rewards scores, which reflect the size of the Middle East's reserves base, and a strong production growth
trajectory. The above-ground environment is significantly less favourable, due to stringent licensing terms,
widespread corruption and a high level of state involvement.
The oil and gas sector in the Middle East is among those least vulnerable to a period of sustained lower oil
prices, given the dominance of conventional onshore production in the region and the typically lower cost
bases. In a number of markets, upstream activity has strengthened in recent quarters, as state-owned
companies look to profit from the downturn and associated industry cost deflation.
Iran Oil & Gas Report Q2 2017
© Business Monitor International Ltd Page 48

Strong Production Drives Regional Outperformance
Middle East Upstream Risk/Reward Index
Scores out of 100, with 100 the best. Source: BMI
The countries at the top of our upstream rankings are not those with the greatest reserves or the strongest
production profiles, but those with the best above-ground environments. In particular the UAE and
Qatar are supported by high Country Rewards and Industry Risks scores. This reflects the greater
participation of non-state competitors in these countries, as well as more favourable licensing terms and the
comparatively low level of state ownership of assets. Iraq also benefits from a relatively diverse competitive
landscape, but its fee-per-barrel contracts and the limited private ownership of assets drag the country's
score down.
Those at the bottom of the rankings, in particular Saudi Arabia and Kuwait, suffer from low Country
Rewards and Industry Risks scores. This is due to the closed nature of their upstream sectors, and the
limited opportunities for investment. Licensing terms are unattractive, with both countries offering technical
service contracts, as opposed to production sharing or concessional agreements. Opaque regulatory
environments all weigh on the countries' scores.
Iran Oil & Gas Report Q2 2017
© Business Monitor International Ltd Page 49

Yemen is an outlier, combining a poor fiscal and licensing structure and generally weak business
environment with declining production and a small reserves base. Widespread security issues and growing
political instability are also major causes for concern, triggered repeated supply outages. The country's
Upstream RRI stands at 41.2 out of 100, substantially below the regional average of 54.7.
There is usually little movement in the Middle East upstream rankings, due to the mature nature of the
region's producers. However, we would flag the following current and prospective trends:
■ Iran's Upstream RRI score has risen in recent quarters. The lifting of sanctions has allowed for a ramp-upin output and exports, while the return of foreign capital will strengthen the country's longer-termproduction growth.
■ Ongoing disputes between the central government in Baghdad and the Kurdistan Regional Governmentover revenue-sharing have triggered repeated disruptions to exports and output, which continue to poserisk to the country's Upstream Index.
■ The deal between OPEC and non-OPEC producers to curtail output will not materially alter the region'sRRI, despite the Middle East absorbing the bulk of the cuts. The deal is temporary and rising oil priceswill help offset the loss to output.
Downstream: Limited Opportunities
Table: Middle East Downstream Oil & Gas Risk/Reward Index
DownstreamIndustryRewards
DownstreamCountryRewards
DownstreamRewards
DownstreamIndustryRisks
DownstreamCountry Risks
DownstreamRisks
Down-streamR/RIndex Rank
UAE 48.9 36.0 45.7 50.0 66.0 56.4 48.9 1
SaudiArabia 56.7 36.0 51.5 10.0 66.0 32.4 45.8 2
Oman 41.1 34.0 39.3 60.0 54.9 58.0 44.9 3
Qatar 48.9 26.0 43.2 20.0 68.9 39.6 42.1 4
Iran 50.0 34.0 46.0 10.0 49.2 25.7 39.9 5
Bahrain 30.0 30.0 30.0 60.0 61.3 60.5 39.2 6
Kuwait 42.2 24.0 37.7 15.0 60.6 33.2 36.3 7
Iraq 36.7 22.0 33.0 15.0 32.2 21.9 29.7 8
Yemen 17.8 28.0 20.3 50.0 25.5 40.2 26.3 9
Average 41.4 30.0 38.5 32.2 53.8 40.9 39.2
Note: Scores out of 100, with 100 the best. Source: BMI
Iran Oil & Gas Report Q2 2017
© Business Monitor International Ltd Page 50

The Middle's East refining capacity will continue to grow, as governments target economic diversification
through downstream expansions. We forecast an increase of 1.9mn b/d in the five years to 2021.
Low Scores Capture Lack Of Opportunities
Middle East Downstream Oil & Gas Risk/Reward Index
Note: Scores out of 100, with 100 the best. Source: BMI
The region ranks poorly in our Downstream Risk/Reward Index, with an average score of 39.2 out of 100.
This encompasses several structural weaknesses in the region's downstream sector that combine to severely
limit opportunities for private sector investors.
■ State-owned companies dominate and have control over the bulk of downstream assets.
■ There are limited numbers of non-state competitors. Widespread privatisation of the sector is unlikely,and it is thus doubtful that new entrants will be able to get a toehold in the market.
■ The business environment can be challenging and regulation is often onerous.
The region scores highly on Industry Rewards, reflecting large and growing domestic markets for refined
fuel products. We forecast refined fuel consumption to increase from 7.7mn b/d in 2016 to 9.1mnb/d by
2025. The widespread use of fuels subsidies has weighed on the sector's overall profitability, although the
fall in oil prices and consequent collapse in state revenues has catalysed reforms efforts in a number of
Iran Oil & Gas Report Q2 2017
© Business Monitor International Ltd Page 51
markets across the region: all GCC countries have enacted subsidy reforms in the past 18 months, with
Kuwait the last to cut.
We forecast major capacity expansions in Iran, Saudi Arabia and Kuwait and Oman, putting upside pressure
on the Industry Rewards scores of these markets. However, the new capacity will do little to alter the
fundamentals of a sector largely closed to international participation.
Iran - Risk/Reward Index
Both Iran's Upstream and Downstream Risk/Reward scores remain stable this quarter. Iran holds the world's
fourth largest oil reserves and second largest gas reserves, both of which have attractive production cost
structures sought by oil companies in a period of lower commodity prices. The more attractive petroleum
contracts due to be offered will also improve prospective returns for investors.
Upstream Index
Rewards
Iran's upstream production growth rates are improving with increasing oil exports and new phases of South
Pars boosting gas production. The country remains home to vast undeveloped oil and gas reserves offering
substantial opportunities to invest in production growth offering longer-term upside to the rewards score.
That said, Iran's tight ownership and control over upstream assets limits opportunity and competition.
Uncertainty surrounding the new IPC contracts may also limit rewards if they are not sufficiently investor
friendly.
Risks
Iran's risk score remains unchanged given the expectations for the new Iran Petroleum Contract remain
unchanged. The final draft of the IPC contract is still awaited, though will offer better terms than the
previous buyback agreements. Lack of clarity over joint venture structures, remuneration terms and contract
arbitrations having to go through Iranian courts, remain the key limits to further upside in the risk score.
We also note high levels of corruption persist and existing infrastructure is in poor condition, limiting the
ease and effectiveness of doing business. Confidence over long-term political stability is improving as
support for the Rouhani administration continues.
Iran Oil & Gas Report Q2 2017
© Business Monitor International Ltd Page 52

Downstream Index
Iran has a moderate position in the downstream industry index. The commissioning of the Persian Gulf Star
refinery will boost capacity and production over the coming two years, while a sanction-free economy is
expected to grow more quickly, demanding more refined fuels.
Continued progress with subsidy reform presents some upside, but discounted domestic diesel prices will
keep international companies away from investment in the downstream sector other than through EPC
contracts.
Iran's downstream score suffers from some particularly high-risk factors including a weak legal system,
high levels of corruption and mediocre physical infrastructure.
Iran Oil & Gas Report Q2 2017
© Business Monitor International Ltd Page 53

Market Overview
Iran Energy Market Overview
Overview
Most of Iran's oil and gas production, processing and distribution are carried out by state-owned companies
run directly by the Ministry of Petroleum. Foreign partners, particularly national oil companies, have a
limited presence in the Iranian energy sector, with most foreign oil company (IOC) involvement currently
from national oil companies.
The National Iranian Oil Company (NIOC) dominates all upstream and downstream oil and gas activities.
Refining and distribution activities are carried out under the control of state-run National Iranian Oil
Refining & Distribution Company, which was separated from NIOC in 1991. The company operates nine
crude oil refineries, oil pipelines and more than 1,000 fuels retail outlets. Gas developments are carried out
by the National Iranian Gas Company (NIGC), while petrochemicals production and distribution are the
responsibility of the National Iranian Petrochemical Company.
Table: Key Upstream Operators - Iran Oil & Gas Sector
Company Oil production (000b/d) Market share (%) Gas production (bcm) Market share (%)
NIOC Approx. 3,600-3,800 100 Approx. 200 100
Source: BMI
Table: Key Downstream Operators - Iran Energy Sector
Company Refining capacity ('000b/d) Market share (%) Retail outlets Market share (%)
NIORDC 1,530 100 1,060 100
Source: BMI
Iran Oil & Gas Report Q2 2017
© Business Monitor International Ltd Page 54
Fiscal Regime
Buy-Back Moves To IPC
The buy-back contract model used in pre-sanctions deals is a short-term service contract between the state-
owned NIOC or one of its subsidiaries, and a foreign company. Under this type of contract, the IOC agrees
to explore and/or develop a field and to fully fund the project but does not gain equity rights in the
hydrocarbons produced or the physical assets of the development. Instead, it receives an annual repayment
rate based on a pre-agreed rate of return. The field under development must be returned to NIOC after the
IOC has been paid, usually within a period of seven to nine years.
These contracts are not attractive for IOCs, offering little flexibility and limited returns on investment. In
addition, these types of contracts were of high risk to investors due to the fixed-cost approach: cost recovery
was decided on the initial capital costs estimated before the development of the field. This approach meant
that costs and projects going above budget could not be recovered, further eroding the profitability of a
project.
Iran Petroleum Contract (IPC)
In order to increase the attractiveness of the petroleum sector to foreign investors, the oil ministry will issue
a new type of contract model for IOCs willing to re-enter the Iranian oil & gas market. The contract has a
clear outline but remains in draft format and has been revised on numerous occasions given hardliner
pressure.
A draft of the new contract details was released to attending companies at the Tehran conference on 21-22
November 2015, and will be presented to companies officially once the contract is approved by the
government. The new contract model will be substantially different to the buy-back model, though may not
be as attractive as initially hoped for. We expect the following format:
■ Agreements will be risk service contracts allowing for full cost recovery over the first five to seven years
■ Fee-per-barrel remuneration will be linked to both the oil price and complexity of each project, and paidover the life of the project
■ The contract term will be up to 25 years, with exploration, development and production under the samecontract
■ There will be a single contract for both oil and gas developments
Uncertainties that could dissuade some investment remain over the following:
Iran Oil & Gas Report Q2 2017
© Business Monitor International Ltd Page 55
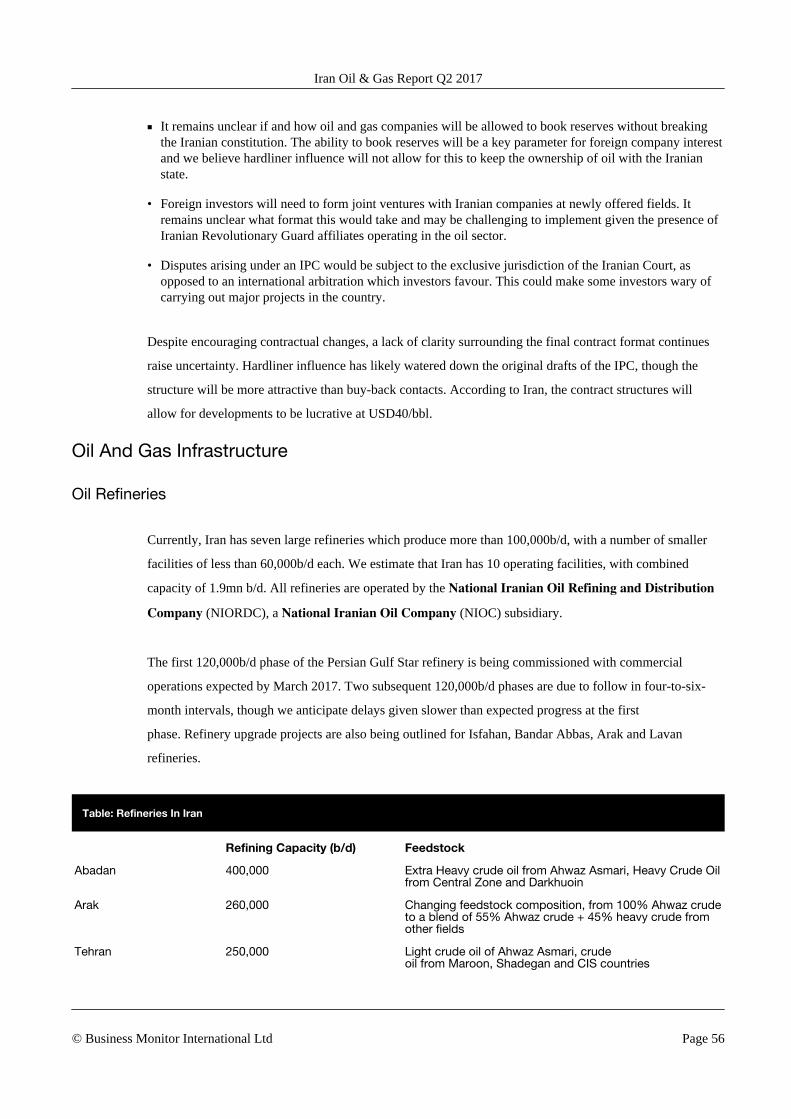
■ It remains unclear if and how oil and gas companies will be allowed to book reserves without breakingthe Iranian constitution. The ability to book reserves will be a key parameter for foreign company interestand we believe hardliner influence will not allow for this to keep the ownership of oil with the Iranianstate.
• Foreign investors will need to form joint ventures with Iranian companies at newly offered fields. Itremains unclear what format this would take and may be challenging to implement given the presence ofIranian Revolutionary Guard affiliates operating in the oil sector.
• Disputes arising under an IPC would be subject to the exclusive jurisdiction of the Iranian Court, asopposed to an international arbitration which investors favour. This could make some investors wary ofcarrying out major projects in the country.
Despite encouraging contractual changes, a lack of clarity surrounding the final contract format continues
raise uncertainty. Hardliner influence has likely watered down the original drafts of the IPC, though the
structure will be more attractive than buy-back contacts. According to Iran, the contract structures will
allow for developments to be lucrative at USD40/bbl.
Oil And Gas Infrastructure
Oil Refineries
Currently, Iran has seven large refineries which produce more than 100,000b/d, with a number of smaller
facilities of less than 60,000b/d each. We estimate that Iran has 10 operating facilities, with combined
capacity of 1.9mn b/d. All refineries are operated by the National Iranian Oil Refining and Distribution
Company (NIORDC), a National Iranian Oil Company (NIOC) subsidiary.
The first 120,000b/d phase of the Persian Gulf Star refinery is being commissioned with commercial
operations expected by March 2017. Two subsequent 120,000b/d phases are due to follow in four-to-six-
month intervals, though we anticipate delays given slower than expected progress at the first
phase. Refinery upgrade projects are also being outlined for Isfahan, Bandar Abbas, Arak and Lavan
refineries.
Table: Refineries In Iran
Refining Capacity (b/d) Feedstock
Abadan 400,000 Extra Heavy crude oil from Ahwaz Asmari, Heavy Crude Oilfrom Central Zone and Darkhuoin
Arak 260,000 Changing feedstock composition, from 100% Ahwaz crudeto a blend of 55% Ahwaz crude + 45% heavy crude fromother fields
Tehran 250,000 Light crude oil of Ahwaz Asmari, crudeoil from Maroon, Shadegan and CIS countries
Iran Oil & Gas Report Q2 2017
© Business Monitor International Ltd Page 56
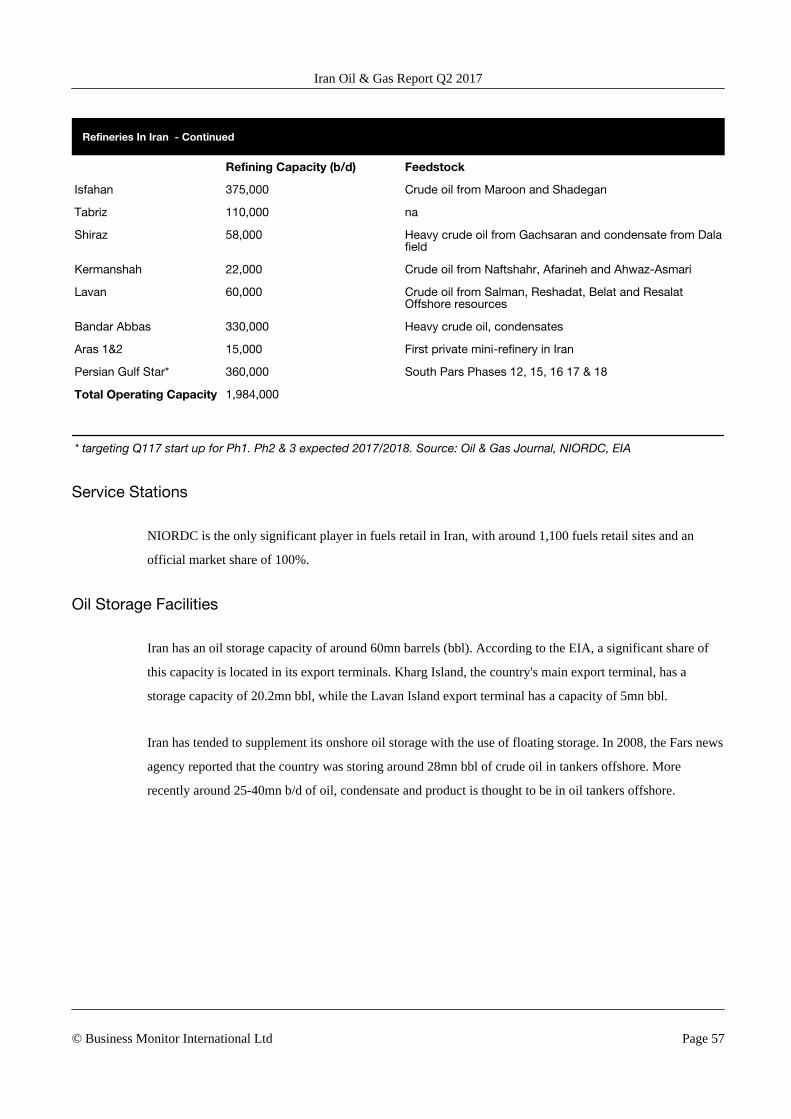
Refineries In Iran - Continued
Refining Capacity (b/d) Feedstock
Isfahan 375,000 Crude oil from Maroon and Shadegan
Tabriz 110,000 na
Shiraz 58,000 Heavy crude oil from Gachsaran and condensate from Dalafield
Kermanshah 22,000 Crude oil from Naftshahr, Afarineh and Ahwaz-Asmari
Lavan 60,000 Crude oil from Salman, Reshadat, Belat and ResalatOffshore resources
Bandar Abbas 330,000 Heavy crude oil, condensates
Aras 1&2 15,000 First private mini-refinery in Iran
Persian Gulf Star* 360,000 South Pars Phases 12, 15, 16 17 & 18
Total Operating Capacity 1,984,000
* targeting Q117 start up for Ph1. Ph2 & 3 expected 2017/2018. Source: Oil & Gas Journal, NIORDC, EIA
Service Stations
NIORDC is the only significant player in fuels retail in Iran, with around 1,100 fuels retail sites and an
official market share of 100%.
Oil Storage Facilities
Iran has an oil storage capacity of around 60mn barrels (bbl). According to the EIA, a significant share of
this capacity is located in its export terminals. Kharg Island, the country's main export terminal, has a
storage capacity of 20.2mn bbl, while the Lavan Island export terminal has a capacity of 5mn bbl.
Iran has tended to supplement its onshore oil storage with the use of floating storage. In 2008, the Fars news
agency reported that the country was storing around 28mn bbl of crude oil in tankers offshore. More
recently around 25-40mn b/d of oil, condensate and product is thought to be in oil tankers offshore.
Iran Oil & Gas Report Q2 2017
© Business Monitor International Ltd Page 57
Oil Terminals/Ports
Iran has significant oil and oil products export capacity with around 10 terminals, most of which are located
on the country's south coast. The two largest terminals are Kharg Island and Lavan Island. Other terminals
include Abadan, Bandar-e Mahshah, Ras Bahregan, Sirri Island, Bandar-e Abbas and Kish Island.
Kharg Island
The Kharg Island terminal, located 483km to the west of the mouth of the Persian Gulf, is Iran's main oil
export terminal. The facility, constructed in the 1960s, is linked to the shore by a 25km subsea pipeline that
starts at a pumping station at Ganaveh. During the 1980s, the terminal was responsible for around 80% of
the country's crude oil exports. The facility was bombed repeatedly in 1985-1986 during the Iraq-Iran war,
and exports ceased. The terminal was rebuilt in the 1990s and according to the EIA now has an export
capacity of up to 5mn b/d, making it one of the largest terminals in the region.
Lavan Island
The Lavan Island terminal is linked to the island's 30,000b/d refinery and is supplied with crude from the
nearby Lavan Group of subsea oil and condensate fields. The terminal is one of Iran's largest, with a
capacity of 200,000b/d according to the EIA. The largest field supplying the terminal is the Salman
structure, which is linked to Lavan Island via a 140km subsea pipeline. Following damage during the Iran-
Iraq war, the Lavan terminal was reopened on May 1 1993.
Bandar-e Mahshah
The Bandar-e Mahshah terminal was one of Iran's main terminals prior to the construction of the Kharg
island facility. Following construction, Bandar-e Mahshah was primarily used for oil product exports from
the Abadan refinery.
Oil Pipelines
According to the EIA, Iran's domestic oil pipeline network comprises five separate pipelines. Two oil
pipelines link the country's largest refinery at Abadan with producing areas in Khuzestan, and then further
north to the Arak refinery. One of the pipelines continues further north to Tehran, and then to the oil
refinery at Tabriz in the north west. Another pipeline transports oil from Khuzestan to the Esfahan refinery,
Iran Oil & Gas Report Q2 2017
© Business Monitor International Ltd Page 58

then south east to the Kerman refinery, and finally to the Bandar-e Abbas refinery and oil export terminal by
the Straits of Hormuz. The Esfahan and Tehran refineries are also linked by pipeline.
Gas Pipelines
Iran has a large and well developed network of both domestic and international gas pipelines, with several
major pipeline projects on the cards. Gas import pipelines link Iran to Azerbaijan and Turkmenistan, and
give the country import capacities of 10bcm and 20bcm respectively. Export pipelines link Iran to Turkey
(10.2bcm) and Armenia (2.3bcm). Additional proposed export pipelines would increase Iran's gas export
capacity to Turkey as well as enabling exports to Pakistan and India.
Table: Major Proposed Pipelines
Project Name Size Unit Companies TimeframeStart
TimeframeEnd Status
Iran-Iraq-Syria NaturalGas Pipeline (FriendshipPipeline)
- -Iranian Gas EngineeringDevelopment Company[Operator] {Iran}
- - At planningstage
Iran - Oman Subsea GasPipeline Project 10.22 bcm/
year
Government of Oman [Sponsor]{Oman}, Government of Iran[Sponsor] {Iran}, IranianOffshore Engineering andConstruction Company (IOEC)[Sponsor]
- - At pre-FEED stage
Iran-Pakistan-IndiaPipeline (Peace Pipeline)Project
1,100 km
Government of India [Sponsor]{India}, Government of Pakistan[Sponsor] {Pakistan},Government of Iran [Sponsor]{Iran}
- 2018 Delayed
Kuwait-Iran Pipeline - -
Kuwait Petroleum Corporation[Sponsor] {Kuwait}, NationalIranian Gas Exports Company(NIGEC) [Sponsor] {Iran}
- - At planningstage
Iran (South Pars GasField) - Iraq (Basra) GasPipeline Project
- -Government of Iraq [Sponsor]{Iraq}, Government of Iran[Sponsor] {Iran}
2015 2016-Gasinjectionunderway
Source: BMI Infrastructure Key Projects
Iran Oil & Gas Report Q2 2017
© Business Monitor International Ltd Page 59

Gas Storage Facilities
Table: Operation, Under Construction & Planned Gas Storage
Facility Status Capacity (bcm)
Shourijeh Operational 4.8
Serajeh Operational 3.3
Nasrabad Progressing 4.5
Yurtsha Progressing ~
Qezeltappeh Planned ~
Source: NIGC, various
Iran Oil & Gas Report Q2 2017
© Business Monitor International Ltd Page 60

Competitive Landscape
Currently the Iranian oil sector is heavily state-dominated in all sectors. The Oil Ministry remains in control
of NIOC, which controls or has a major stake in nearly all oil companies in the country and the bulk of
production. Due to the legacy impact of sanctions there are very few international oil companies operating
in Iran. The Chinese companies of CNPC and Sinopec have been active, but have only progressed work on
key field developments once the crude export restrictions were lifted in January 2016. Other national oil
companies from Russia, India and South East Asia have also shown interest in entering the Iranian market.
The introduction of the IPC is expected to play a big role in increasing the number of foreign companies
operating in the country, though the joint ventures formed under the contract will be 51% owned by the
domestic subsidiary. A number of major European and Asian oil companies have shown interest in entering
or returning to operations in Iran, once the new contacts have been finalised. NIOC is hoping to sign the
first IPC contracts in 2017 or earlier.
Iran Oil & Gas Report Q2 2017
© Business Monitor International Ltd Page 61
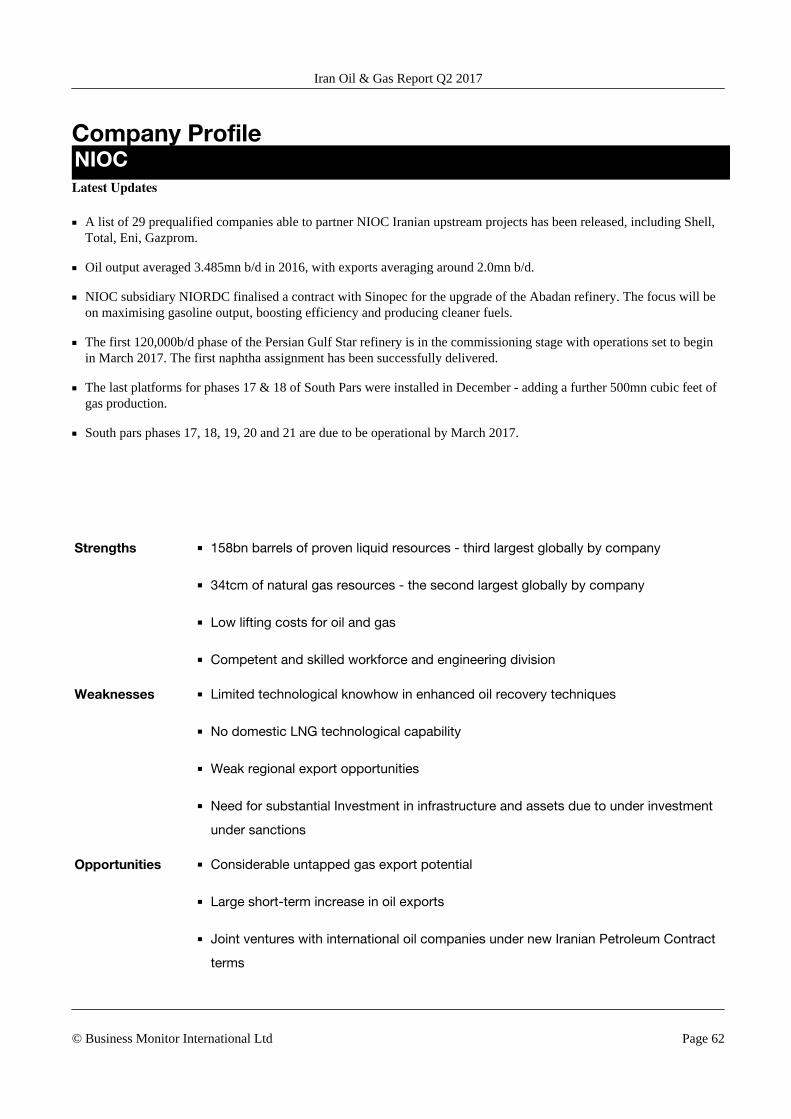
Company ProfileNIOCLatest Updates
■ A list of 29 prequalified companies able to partner NIOC Iranian upstream projects has been released, including Shell,Total, Eni, Gazprom.
■ Oil output averaged 3.485mn b/d in 2016, with exports averaging around 2.0mn b/d.
■ NIOC subsidiary NIORDC finalised a contract with Sinopec for the upgrade of the Abadan refinery. The focus will beon maximising gasoline output, boosting efficiency and producing cleaner fuels.
■ The first 120,000b/d phase of the Persian Gulf Star refinery is in the commissioning stage with operations set to beginin March 2017. The first naphtha assignment has been successfully delivered.
■ The last platforms for phases 17 & 18 of South Pars were installed in December - adding a further 500mn cubic feet ofgas production.
■ South pars phases 17, 18, 19, 20 and 21 are due to be operational by March 2017.
SWOT Analysis
Strengths ■ 158bn barrels of proven liquid resources - third largest globally by company
■ 34tcm of natural gas resources - the second largest globally by company
■ Low lifting costs for oil and gas
■ Competent and skilled workforce and engineering division
Weaknesses ■ Limited technological knowhow in enhanced oil recovery techniques
■ No domestic LNG technological capability
■ Weak regional export opportunities
■ Need for substantial Investment in infrastructure and assets due to under investment
under sanctions
Opportunities ■ Considerable untapped gas export potential
■ Large short-term increase in oil exports
■ Joint ventures with international oil companies under new Iranian Petroleum Contract
terms
Iran Oil & Gas Report Q2 2017
© Business Monitor International Ltd Page 62
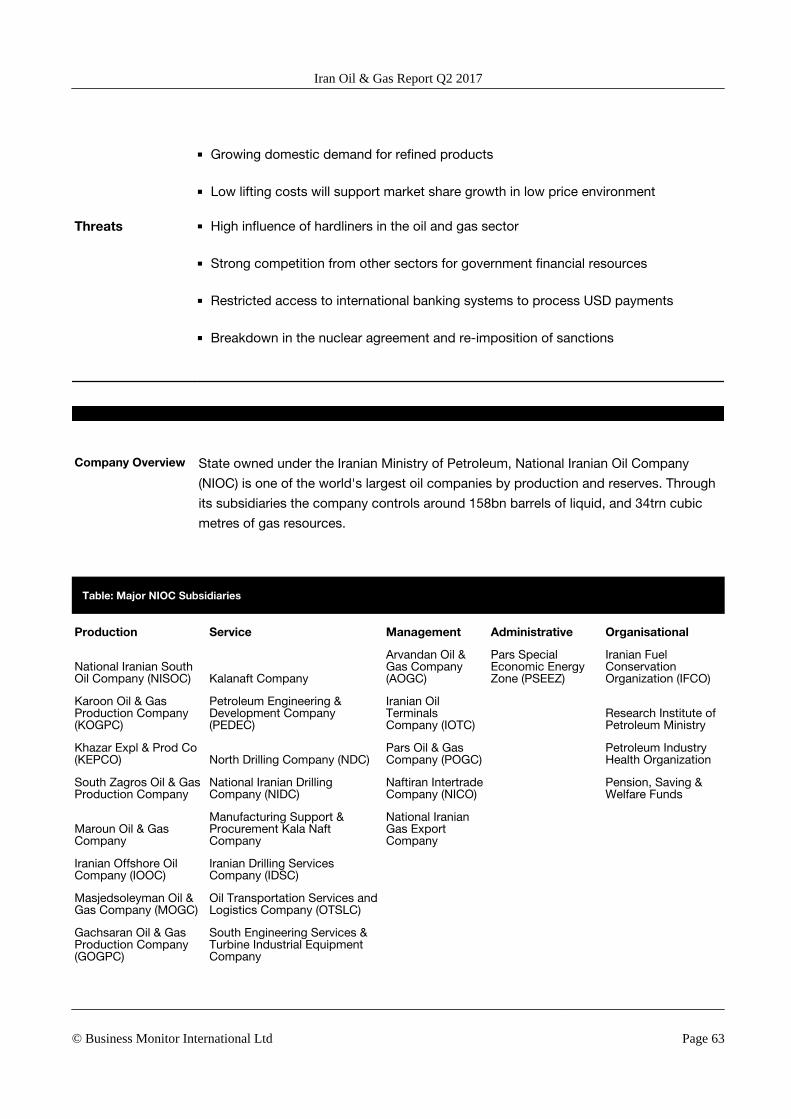
SWOT Analysis - Continued
■ Growing domestic demand for refined products
■ Low lifting costs will support market share growth in low price environment
Threats ■ High influence of hardliners in the oil and gas sector
■ Strong competition from other sectors for government financial resources
■ Restricted access to international banking systems to process USD payments
■ Breakdown in the nuclear agreement and re-imposition of sanctions
Company Overview State owned under the Iranian Ministry of Petroleum, National Iranian Oil Company
(NIOC) is one of the world's largest oil companies by production and reserves. Through
its subsidiaries the company controls around 158bn barrels of liquid, and 34trn cubic
metres of gas resources.
Table: Major NIOC Subsidiaries
Production Service Management Administrative Organisational
National Iranian SouthOil Company (NISOC) Kalanaft Company
Arvandan Oil &Gas Company(AOGC)
Pars SpecialEconomic EnergyZone (PSEEZ)
Iranian FuelConservationOrganization (IFCO)
Karoon Oil & GasProduction Company(KOGPC)
Petroleum Engineering &Development Company(PEDEC)
Iranian OilTerminalsCompany (IOTC)
Research Institute ofPetroleum Ministry
Khazar Expl & Prod Co(KEPCO) North Drilling Company (NDC)
Pars Oil & GasCompany (POGC)
Petroleum IndustryHealth Organization
South Zagros Oil & GasProduction Company
National Iranian DrillingCompany (NIDC)
Naftiran IntertradeCompany (NICO)
Pension, Saving &Welfare Funds
Maroun Oil & GasCompany
Manufacturing Support &Procurement Kala NaftCompany
National IranianGas ExportCompany
Iranian Offshore OilCompany (IOOC)
Iranian Drilling ServicesCompany (IDSC)
Masjedsoleyman Oil &Gas Company (MOGC)
Oil Transportation Services andLogistics Company (OTSLC)
Gachsaran Oil & GasProduction Company(GOGPC)
South Engineering Services &Turbine Industrial EquipmentCompany
Iran Oil & Gas Report Q2 2017
© Business Monitor International Ltd Page 63

Major NIOC Subsidiaries - Continued
Production Service Management Administrative Organisational
Aghajari Oil & GasProduction Company(AOGPC)
West Oil & GasProduction Company
East Oil & GasProduction Company(EOGPC)
Iranian Central OilFields Company(ICOFC)
Source: NIOC
NIOC will be central to Iran's future expansion, as many of its subsidiaries will form joint ventures under the proposed
Iran Petroleum Contract (IPC). In order to attract foreign investment the new contract format will be far more competitive
than the previous buy-back model, though it currently remains in draft format. Many of the targeted field will be those in
border areas under joint development programmes with neighbouring countries, or more technically complex projects.
Given hardliner influence in the IPC, a two-tier system will likely emerge, with buyback contracts remaining and the IPC
being introduced for specific fields.
Table: Fields Proposed Under The New IPC
Border Oil Fields Border Gas Fields Other Oil Fields Other Gas Fields
1 S. Azadegan Ph 1 15 S. Pars Ph 11 23 Mansuri Ph 2 37 Dey
2 N. Azadegan Ph 2 16 Salman Ph 1 24 Band-e-Karkheh 38 Sefidzakhor-Halegan
3 Yadavaran Ph 2 17 Salman Ph 2 25 Jofayr 39 Sefidbaghoun
4 Reshadat 18 Farzad A 26 Somar 40 Aghar Ph 2
5 Foroozan 19 Farzad B 27 Danan Ph 2 41 Farashband: Refining Facilities
6S. Pars Oil Layer Ph1 20 Reshadat 28 Darquain Ph 3 42 Varavi: Boosting Gas Pressure Stations
7 Arvand 21Dalan Kangan AtBalal 29 Susangerd 43
Kangan: Boosting Gas PressureStations
8 Dehloran Ph 2 22 Arash 30 Sepehr 44 Nar: Boosting Gas Pressure Stations
9 Peydar Gharb 31CheshmehKhosh 45 Homa: Boosting Gas Pressure Stations
10 Aban Ph 2 32 Resalat 46 Behregansar Gas Layer
11 Sohrab 33 Abuzar 47 Tangebijar Ph 2
12 Changouleh 34 Doroud 48 Kish Ph 3 3D Seismic
Iran Oil & Gas Report Q2 2017
© Business Monitor International Ltd Page 64
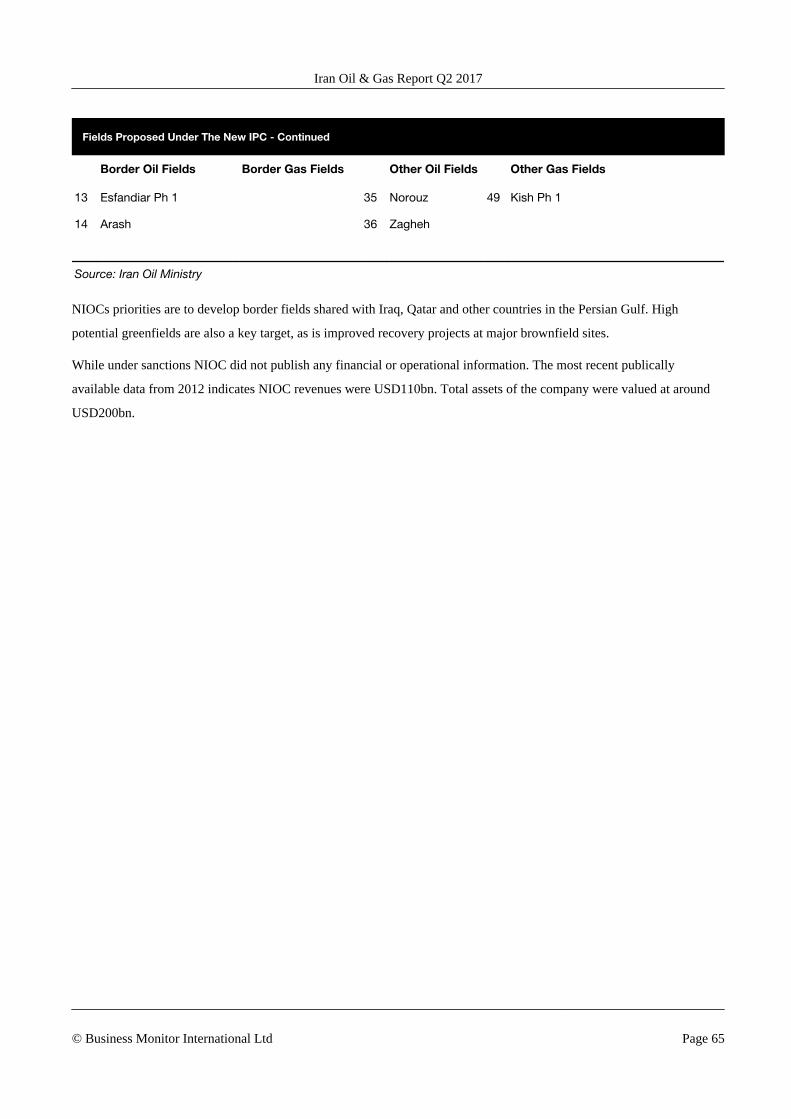
Fields Proposed Under The New IPC - Continued
Border Oil Fields Border Gas Fields Other Oil Fields Other Gas Fields
13 Esfandiar Ph 1 35 Norouz 49 Kish Ph 1
14 Arash 36 Zagheh
Source: Iran Oil Ministry
NIOCs priorities are to develop border fields shared with Iraq, Qatar and other countries in the Persian Gulf. High
potential greenfields are also a key target, as is improved recovery projects at major brownfield sites.
While under sanctions NIOC did not publish any financial or operational information. The most recent publically
available data from 2012 indicates NIOC revenues were USD110bn. Total assets of the company were valued at around
USD200bn.
Iran Oil & Gas Report Q2 2017
© Business Monitor International Ltd Page 65
Regional Overview
Middle East Oil & Gas Regional Overview
BMI View: Gas production in the Middle East is set for substantial growth over the next 10 years freeing
up domestically consumed oil for export. Oil will also increase despite OPEC curtailments, though efforts
to diversify economies will support new refining and petrochemicals projects adding value to exports.
To highlight the key themes that inform BMI's Middle East oil and gas forecasts, we have compared
countries on the basis of the following key indicators:
■ Oil production
■ Oil consumption
■ Refining capacity
■ Gas production
■ Gas consumption
Our Middle East coverage includes Bahrain, Kuwait, Iran, Iraq, Israel, Oman, Qatar, Saudi Arabia, UAE
and Yemen.
Oil Production: Output Cut To Have Marginal Impact
In 2016, all oil producing countries outside of Yemen in the Middle East, will see increased oil production
year on year. The region as a whole will increase output by more than 1.1mn b/d to 30.3mn b/d in 2016, led
by Saudi Arabia, Iraq and Iran. The agreement by OPEC and non-OPEC members to cut production over
H117 will only marginally impact production over the short term. Production targets revealed at the
November 30 meeting, were near output highs for many countries. It remains unclear whether the cut will
be sustained into H217, but it is likely most countries in the Middle East will raise production at least
seasonally. As such we expect higher output from Middle East countries in 2017, though only marginally.
Iran Oil & Gas Report Q2 2017
© Business Monitor International Ltd Page 66
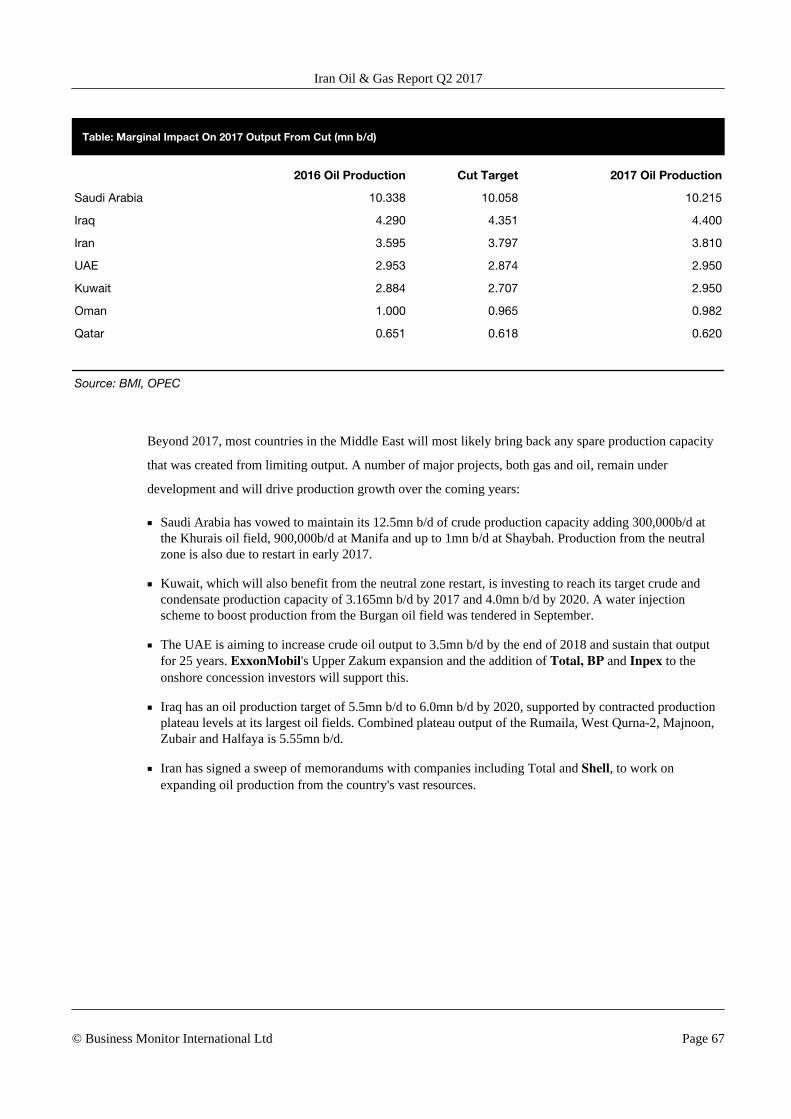
Table: Marginal Impact On 2017 Output From Cut (mn b/d)
2016 Oil Production Cut Target 2017 Oil Production
Saudi Arabia 10.338 10.058 10.215
Iraq 4.290 4.351 4.400
Iran 3.595 3.797 3.810
UAE 2.953 2.874 2.950
Kuwait 2.884 2.707 2.950
Oman 1.000 0.965 0.982
Qatar 0.651 0.618 0.620
Source: BMI, OPEC
Beyond 2017, most countries in the Middle East will most likely bring back any spare production capacity
that was created from limiting output. A number of major projects, both gas and oil, remain under
development and will drive production growth over the coming years:
■ Saudi Arabia has vowed to maintain its 12.5mn b/d of crude production capacity adding 300,000b/d atthe Khurais oil field, 900,000b/d at Manifa and up to 1mn b/d at Shaybah. Production from the neutralzone is also due to restart in early 2017.
■ Kuwait, which will also benefit from the neutral zone restart, is investing to reach its target crude andcondensate production capacity of 3.165mn b/d by 2017 and 4.0mn b/d by 2020. A water injectionscheme to boost production from the Burgan oil field was tendered in September.
■ The UAE is aiming to increase crude oil output to 3.5mn b/d by the end of 2018 and sustain that outputfor 25 years. ExxonMobil's Upper Zakum expansion and the addition of Total, BP and Inpex to theonshore concession investors will support this.
■ Iraq has an oil production target of 5.5mn b/d to 6.0mn b/d by 2020, supported by contracted productionplateau levels at its largest oil fields. Combined plateau output of the Rumaila, West Qurna-2, Majnoon,Zubair and Halfaya is 5.55mn b/d.
■ Iran has signed a sweep of memorandums with companies including Total and Shell, to work onexpanding oil production from the country's vast resources.
Iran Oil & Gas Report Q2 2017
© Business Monitor International Ltd Page 67

Middle East Expansion Continues
Oil Production In Major Middle East Producers (000b/d)
Bahrain Iran Iraq Kuwait Oman QatarSaudi Arabia United Arab Emirates
2015
e
2016
f
2017
f
2018
f
2019
f
2020
f
2021
f
2022
f
2023
f
2024
f
2025
f
0
10,000
20,000
30,000
40,000
e/f = BMI estimate/forecast. Source: National sources, EIA, BMI
We forecast crude, condensate and oil liquids production to increase nearly 3mn b/d from 2016 to 2025,
with the ten countries we cover in the Middle East increasing output from 30.3mn b/d to 33.0mn b/d.
Iran Oil & Gas Report Q2 2017
© Business Monitor International Ltd Page 68
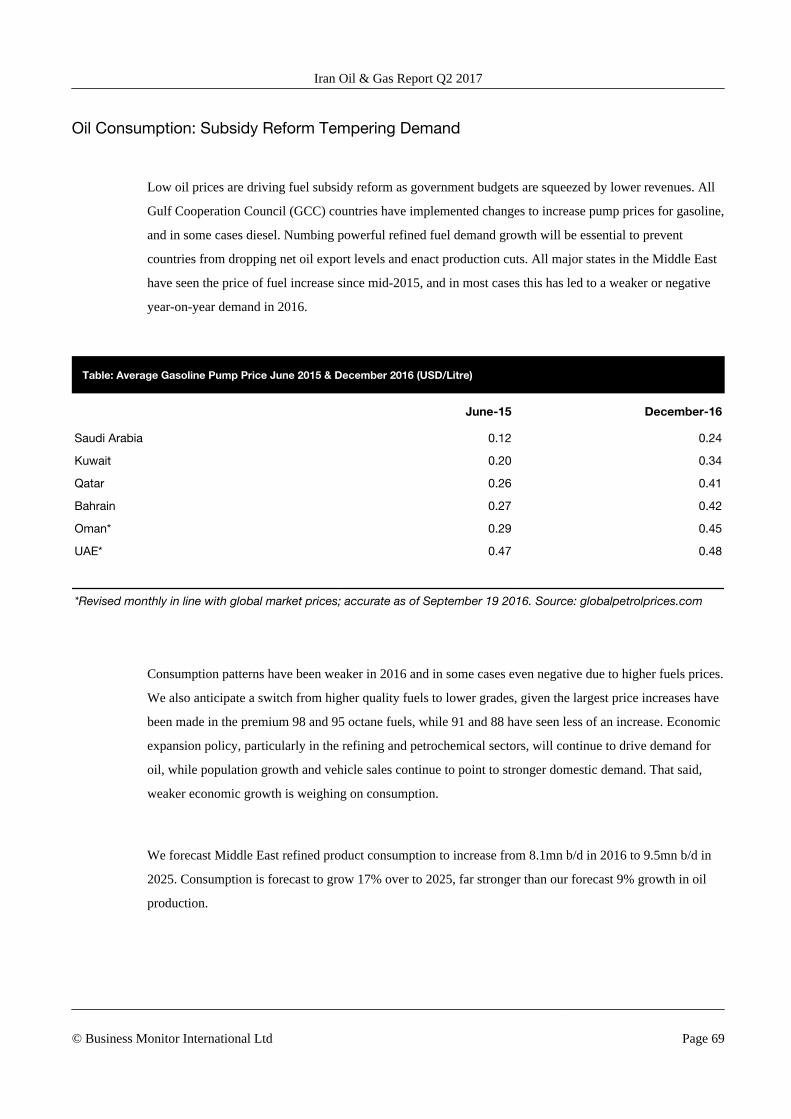
Oil Consumption: Subsidy Reform Tempering Demand
Low oil prices are driving fuel subsidy reform as government budgets are squeezed by lower revenues. All
Gulf Cooperation Council (GCC) countries have implemented changes to increase pump prices for gasoline,
and in some cases diesel. Numbing powerful refined fuel demand growth will be essential to prevent
countries from dropping net oil export levels and enact production cuts. All major states in the Middle East
have seen the price of fuel increase since mid-2015, and in most cases this has led to a weaker or negative
year-on-year demand in 2016.
Table: Average Gasoline Pump Price June 2015 & December 2016 (USD/Litre)
June-15 December-16
Saudi Arabia 0.12 0.24
Kuwait 0.20 0.34
Qatar 0.26 0.41
Bahrain 0.27 0.42
Oman* 0.29 0.45
UAE* 0.47 0.48
*Revised monthly in line with global market prices; accurate as of September 19 2016. Source: globalpetrolprices.com
Consumption patterns have been weaker in 2016 and in some cases even negative due to higher fuels prices.
We also anticipate a switch from higher quality fuels to lower grades, given the largest price increases have
been made in the premium 98 and 95 octane fuels, while 91 and 88 have seen less of an increase. Economic
expansion policy, particularly in the refining and petrochemical sectors, will continue to drive demand for
oil, while population growth and vehicle sales continue to point to stronger domestic demand. That said,
weaker economic growth is weighing on consumption.
We forecast Middle East refined product consumption to increase from 8.1mn b/d in 2016 to 9.5mn b/d in
2025. Consumption is forecast to grow 17% over to 2025, far stronger than our forecast 9% growth in oil
production.
Iran Oil & Gas Report Q2 2017
© Business Monitor International Ltd Page 69
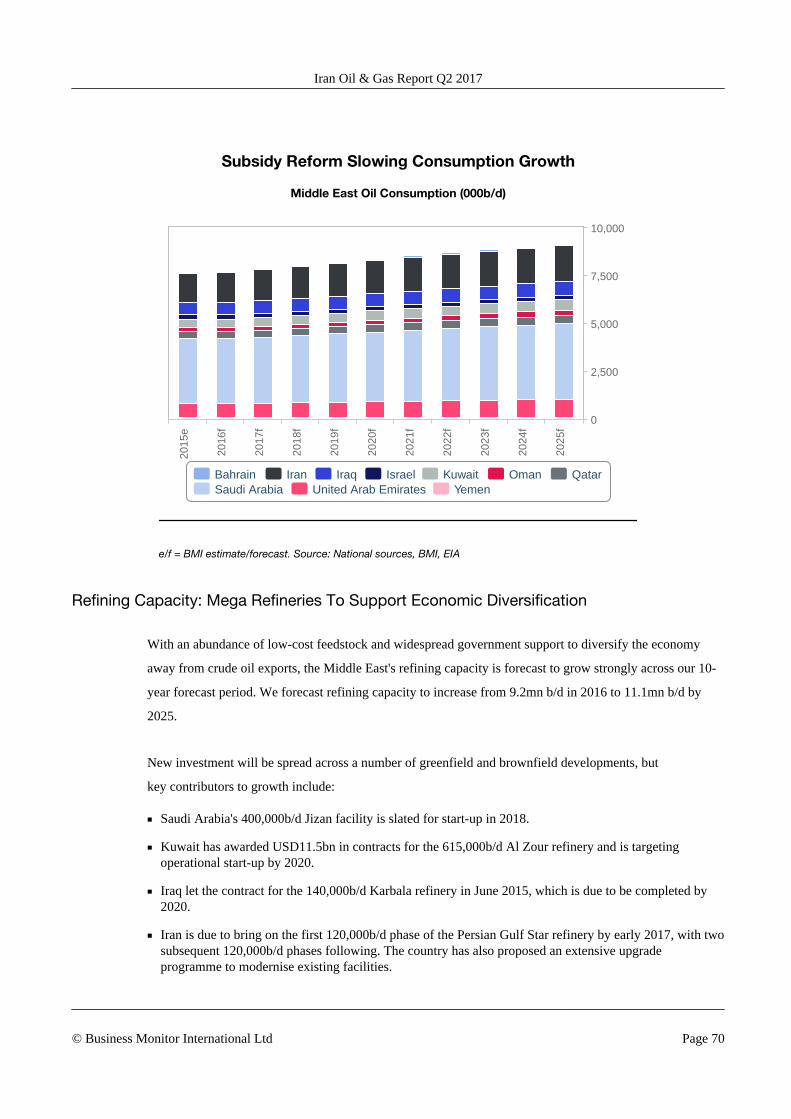
Subsidy Reform Slowing Consumption Growth
Middle East Oil Consumption (000b/d)
Bahrain Iran Iraq Israel Kuwait Oman QatarSaudi Arabia United Arab Emirates Yemen
2015
e
2016
f
2017
f
2018
f
2019
f
2020
f
2021
f
2022
f
2023
f
2024
f
2025
f
0
2,500
5,000
7,500
10,000
e/f = BMI estimate/forecast. Source: National sources, BMI, EIA
Refining Capacity: Mega Refineries To Support Economic Diversification
With an abundance of low-cost feedstock and widespread government support to diversify the economy
away from crude oil exports, the Middle East's refining capacity is forecast to grow strongly across our 10-
year forecast period. We forecast refining capacity to increase from 9.2mn b/d in 2016 to 11.1mn b/d by
2025.
New investment will be spread across a number of greenfield and brownfield developments, but
key contributors to growth include:
■ Saudi Arabia's 400,000b/d Jizan facility is slated for start-up in 2018.
■ Kuwait has awarded USD11.5bn in contracts for the 615,000b/d Al Zour refinery and is targetingoperational start-up by 2020.
■ Iraq let the contract for the 140,000b/d Karbala refinery in June 2015, which is due to be completed by2020.
■ Iran is due to bring on the first 120,000b/d phase of the Persian Gulf Star refinery by early 2017, with twosubsequent 120,000b/d phases following. The country has also proposed an extensive upgradeprogramme to modernise existing facilities.
Iran Oil & Gas Report Q2 2017
© Business Monitor International Ltd Page 70
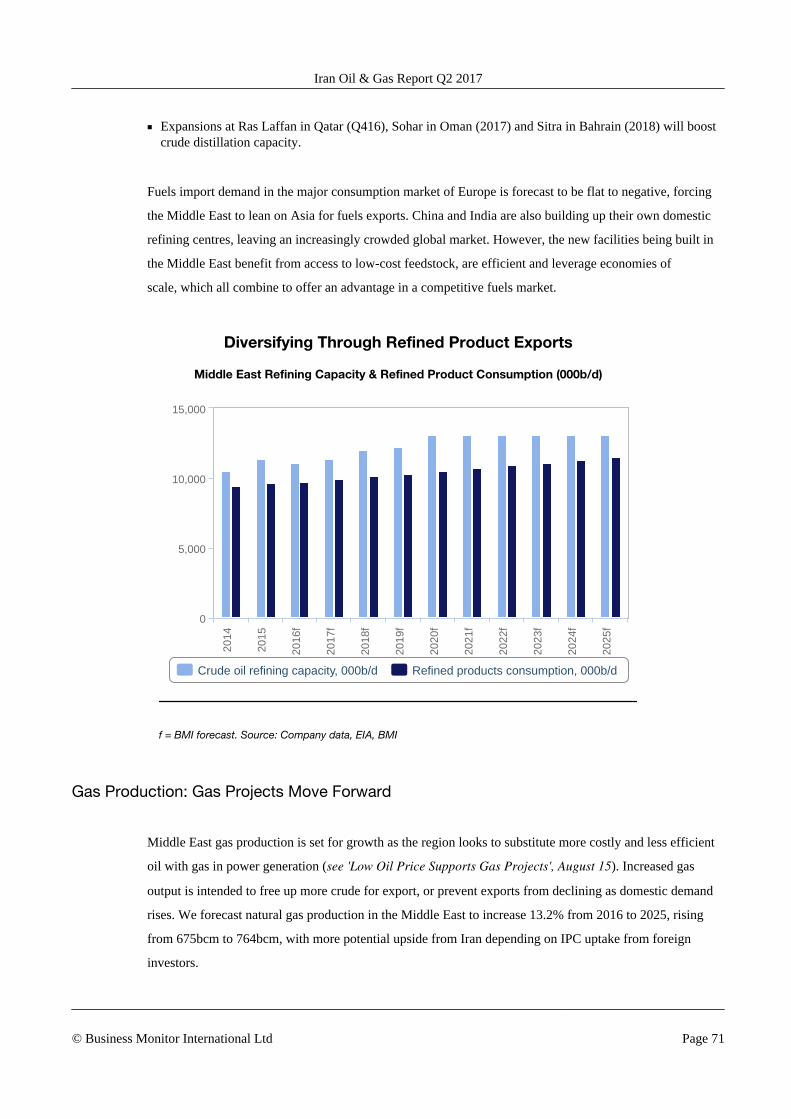
■ Expansions at Ras Laffan in Qatar (Q416), Sohar in Oman (2017) and Sitra in Bahrain (2018) will boostcrude distillation capacity.
Fuels import demand in the major consumption market of Europe is forecast to be flat to negative, forcing
the Middle East to lean on Asia for fuels exports. China and India are also building up their own domestic
refining centres, leaving an increasingly crowded global market. However, the new facilities being built in
the Middle East benefit from access to low-cost feedstock, are efficient and leverage economies of
scale, which all combine to offer an advantage in a competitive fuels market.
Diversifying Through Refined Product Exports
Middle East Refining Capacity & Refined Product Consumption (000b/d)
Crude oil refining capacity, 000b/d Refined products consumption, 000b/d
2014
2015
2016
f
2017
f
2018
f
2019
f
2020
f
2021
f
2022
f
2023
f
2024
f
2025
f0
5,000
10,000
15,000
f = BMI forecast. Source: Company data, EIA, BMI
Gas Production: Gas Projects Move Forward
Middle East gas production is set for growth as the region looks to substitute more costly and less efficient
oil with gas in power generation (see 'Low Oil Price Supports Gas Projects', August 15). Increased gas
output is intended to free up more crude for export, or prevent exports from declining as domestic demand
rises. We forecast natural gas production in the Middle East to increase 13.2% from 2016 to 2025, rising
from 675bcm to 764bcm, with more potential upside from Iran depending on IPC uptake from foreign
investors.
Iran Oil & Gas Report Q2 2017
© Business Monitor International Ltd Page 71

Much of the gas in the Middle East is associated in oilfields and few countries have developed sufficient
infrastructure to collect and transport this resource to demand centres. A further disincentive to progress is
that many countries do not have separate regulations governing associated gas production, creating a lack of
clarity around the reward for monetising gas. As a result, large volumes of gas that could be monetised are
flared - particularly in Iraq and Iran.
Gas Focus Grows
Middle East Gas Production (bcm)
Bahrain Iran Iraq Israel Kuwait Oman QatarSaudi Arabia United Arab Emirates Yemen
2015
e
2016
f
2017
f
2018
f
2019
f
2020
f
2021
f
2022
f
2023
f
2024
f
2025
f
0
1,000
250
500
750
e/f = BMI estimate/forecast. Source: National sources, EIA, BMI
Non-associated gas will be the largest contributor to new gas output:
■ Iran holds the most gas production upside through further phase development of the South Pars field,which could add over 60bcm of production capacity in the next five years.
■ Oman is progressing the Khazzan gas project, which will boost gas production by 15bcm in 2017
■ In Saudi Arabia, the Wasit gas project has already reduced crude burn over 2016 - supporting oil exports- and the Fadhilli gas development (26bcm) will be major boost to gas growth in 2019.
■ The Miran project (8bcm) in the Kurdistan Region of Iraq, Leviathan (12bcm) in Israel and Barzan phase2 (10bcm) in Qatar will also be major additions over the next few years.
Iran Oil & Gas Report Q2 2017
© Business Monitor International Ltd Page 72
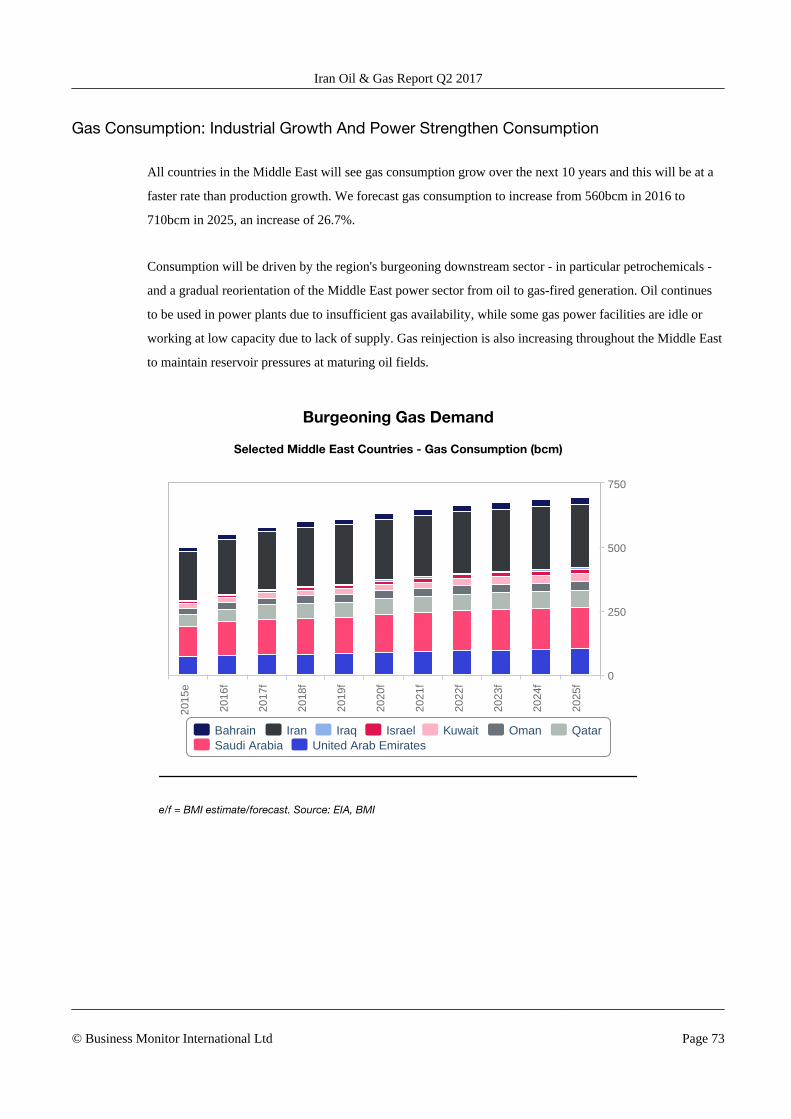
Gas Consumption: Industrial Growth And Power Strengthen Consumption
All countries in the Middle East will see gas consumption grow over the next 10 years and this will be at a
faster rate than production growth. We forecast gas consumption to increase from 560bcm in 2016 to
710bcm in 2025, an increase of 26.7%.
Consumption will be driven by the region's burgeoning downstream sector - in particular petrochemicals -
and a gradual reorientation of the Middle East power sector from oil to gas-fired generation. Oil continues
to be used in power plants due to insufficient gas availability, while some gas power facilities are idle or
working at low capacity due to lack of supply. Gas reinjection is also increasing throughout the Middle East
to maintain reservoir pressures at maturing oil fields.
Burgeoning Gas Demand
Selected Middle East Countries - Gas Consumption (bcm)
Bahrain Iran Iraq Israel Kuwait Oman QatarSaudi Arabia United Arab Emirates
2015
e
2016
f
2017
f
2018
f
2019
f
2020
f
2021
f
2022
f
2023
f
2024
f
2025
f
0
250
500
750
e/f = BMI estimate/forecast. Source: EIA, BMI
Iran Oil & Gas Report Q2 2017
© Business Monitor International Ltd Page 73

Table: Middle East Oil & Gas Production, Refining Capacity & Trade
2015 2016f 2017f 2018f 2019f 2020f 2021f 2022f 2023f 2024f 2025f
Middle Eastoilproduction,000b/d
29,202 30,226 30,831 31,233 31,433 31,742 32,216 32,612 32,971 33,309 33,683
Middle Eastoilconsumption, 000b/d
8,126.7 8,162.4 8,312.3 8,497.2 8,618.3 8,788.4 8,948.1 9,107.3 9,259.6 9,403.8 9,535.5
Middle Eastoil netexports,000b/d
21,076 22,064 22,519 22,736 22,815 22,954 23,268 23,505 23,711 23,906 24,148
Middle Eastoil refinerycapacity,000b/d
9,463.0 9,215.5 9,416.5 10,000.5 10,230.5 11,075.5 11,075.5 11,075.5 11,075.5 11,075.5 11,075.2
Middle Eastgasproduction,bcm
626.1 675.0 705.1 720.4 729.5 749.6 762.4 763.0 762.4 760.6 757.2
Middle Eastgasconsumption, bcm
504.8 552.2 576.0 591.3 605.5 629.3 645.0 662.6 676.3 690.1 705.1
Middle Eastgas netexports,bcm
121.3 122.8 129.1 129.1 124.0 120.2 117.3 100.4 86.2 70.5 52.1
Middle EastLNG netexports,bcm
117.5 120.4 132.7 133.9 123.5 112.1 102.5 87.8 76.4 63.7 49.1
f = BMI forecast. Source: National sources, EIA, JODI, BMI
Iran Oil & Gas Report Q2 2017
© Business Monitor International Ltd Page 74
Glossary
Table: Glossary Of Terms
AOR additional oil recovery KCTS Kazakh Caspian Transport System
APA awards for predefined areas km kilometres
API American Petroleum Institute LAB linear alkyl benzene
bbl barrel LDPE low density polypropylene
bcm billion cubic metres LNG liquefied natural gas
b/d barrels per day LPG liquefied petroleum gas
bn billion m metres
boe barrels of oil equivalent mcm thousand cubic metres
BTC Baku-Tbilisi-Ceyhan Pipeline Mcm mn cubic metres
BTU British thermal unit MEA Middle East and Africa
Capex capital expenditure mn million
CBM coal bed methane MoU memorandum of understanding
CEE Central and Eastern Europe mt metric tonne
CPC Caspian Pipeline Consortium MW megawatts
CSG coal seam gas na not available/ applicable
DoE US Department of Energy NGL natural gas liquids
EBRD European Bank for Reconstruction &Development NOC national oil company
EEZ exclusive economic zone OECD Organisation for Economic Cooperation & Development
e/f estimate/forecast OPEC Organization of the Petroleum Exporting Countries
EIA US Energy Information Administration PE polyethylene
EM emerging markets PP polypropylene
EOR enhanced oil recovery PSA production sharing agreement
E&P exploration and production PSC production sharing contract
EPSA exploration and production sharingagreement q-o-q quarter-on-quarter
FID final investment decision R&D research and development
FDI foreign direct investment R/P reserves/production
FEED front end engineering and design RPR reserves to production ratio
FPSO floating production, storage and offloading SGI strategic gas initiative
FTA free trade agreement SoI statement of intent
FTZ free trade zone SPA sale and purchase agreement
GDP gross domestic product SPR strategic petroleum reserve
Iran Oil & Gas Report Q2 2017
© Business Monitor International Ltd Page 75
Glossary Of Terms - Continued
G&G geological and geophysical t/d tonnes per day
GoM Gulf of Mexico tcm trillion cubic metres
GS geological survey toe tonnes of oil equivalent
GTL gas-to-liquids conversion tpa tonnes per annum
GW gigawatts TRIPS Trade-Related Aspects of IntellectualProperty Rights
GWh gigawatt hours trn trillion
HDPE high density polyethylene T&T Trinidad & Tobago
HoA heads of agreement TTPC Trans-Tunisian Pipeline Company
IEA International Energy Agency TWh terawatt hours
IGCC integrated gasification combined cycle UAE United Arab Emirates
IOC international oil company USGS US Geological Survey
IPI Iran-Pakistan-India Pipeline WAGP West African Gas Pipeline
IPO initial public offering WIPO World Intellectual Property Organization
JOC joint operating company WTI West Texas Intermediate
JPDA joint petroleum development area WTO World Trade Organization
Source: BMI
Iran Oil & Gas Report Q2 2017
© Business Monitor International Ltd Page 76

Methodology
Industry Forecast Methodology
BMI's industry forecasts are generated using the best-practice techniques of time-series modelling and
causal/econometric modelling. The precise form of model we use varies from industry to industry, in each
case being determined, as per standard practice, by the prevailing features of the industry data being
examined.
Common to our analysis of every industry is the use of vector autoregressions. Vector autoregressions allow
us to forecast a variable using more than the variable's own history as explanatory information. For
example, when forecasting oil prices, we can include information about oil consumption, supply and
capacity.
When forecasting for some of our industry sub-component variables, however, using a variable's own
history is often the most desirable method of analysis. Such single-variable analysis is called univariate
modelling. We use the most common and versatile form of univariate models: the autoregressive moving
average model (ARMA).
In some cases, ARMA techniques are inappropriate because there is insufficient historic data or data quality
is poor. In such cases, we use either traditional decomposition methods or smoothing methods as a basis for
analysis and forecasting.
BMI mainly uses OLS estimators and in order to avoid relying on subjective views and encourage the use
of objective views, BMI uses a 'general-to-specific' method. BMI mainly uses a linear model, but simple
non-linear models, such as the log-linear model, are used when necessary. During periods of 'industry
shock', for example poor weather conditions impeding agricultural output, dummy variables are used to
determine the level of impact.
Effective forecasting depends on appropriately selected regression models. BMI selects the best model
according to various different criteria and tests, including but not exclusive to:
■ R2 tests explanatory power; adjusted R2 takes degree of freedom into account;
■ Testing the directional movement and magnitude of coefficients;
■ Hypothesis testing to ensure coefficients are significant (normally t-test and/or P-value);
■ All results are assessed to alleviate issues related to auto-correlation and multi-collinearity.
Iran Oil & Gas Report Q2 2017
© Business Monitor International Ltd Page 77
BMI uses the selected best model to perform forecasting.
Human intervention plays a necessary and desirable role in all of BMI's industry forecasting. Experience,
expertise and knowledge of industry data and trends ensure that analysts spot structural breaks, anomalous
data, turning points and seasonal features where a purely mechanical forecasting process would not.
Sector-Specific Methodology
There are a number of principal criteria that drive our forecasts for each energy indicator.
Energy Supply
This covers the supply of crude oil, natural gas, refined oil products and electrical power, which is
determined largely by investment levels, available capacity, plant utilisation rates and national policy. We
therefore examine:
■ National energy policy, stated output goals and investment levels;
■ Company-specific capacity data, output targets and capital expenditures, using national, regional andmultinational company sources;
■ International quotas, guidelines and projections from organisations such as OPEC, the InternationalEnergy Agency (IEA), and the US Energy Information Administration (EIA).
Energy Consumption
A mixture of methods is used to generate demand forecasts, applied as appropriate to each individual
country:
■ Underlying economic (GDP) growth for individual countries/regions, sourced from BMI publishedestimates;
■ Historic relationships between GDP growth and energy demand growth in an individual country areanalysed and used as the basis for predicting levels of consumption;
■ Government projections for oil, gas and electricity demand;
■ Third-party agency projections for regional demand, from organisations such as the IEA, EIA and OPEC;
Extrapolation of capacity expansion forecasts based on company- or state-specific investment levels.
Iran Oil & Gas Report Q2 2017
© Business Monitor International Ltd Page 78

Cross Checks
Whenever possible, we compare government and/or third-party agency projections with the declared
spending and capacity expansion plans of the companies operating in each individual country. Where there
are discrepancies, we use company-specific data as physical spending patterns to determine capacity and
supply capability. Similarly, we compare capacity expansion plans and demand projections to check the
energy balance of each country. Where the data suggest imports or exports, we check that necessary
capacity exists or that the required investment in infrastructure is taking place.
Source
Sources include those international bodies mentioned above, such as OPEC, IEA, and EIA, as well as local
energy ministries, official company information, and international and national news, plus international and
national news agencies.
Risk/Reward Index Methodology
BMI's Risk/Reward Index (RRI) provides a comparative regional ranking system evaluating the ease of
doing business and the industry-specific opportunities and limitations for potential investors in a given
market. The RRI system is divided into two distinct areas:
Rewards: Evaluation of sector's size and growth potential in each state, and also broader industry/state
characteristics that may inhibit its development. This is further broken down into two sub-categories:
■ Industry Rewards (this is an industry-specific category taking into account current industry size andgrowth forecasts, the openness of market to new entrants and foreign investors, to provide an overallscore for potential returns for investors);
• Country Rewards (this is a country-specific category, and the score factors in favourable political andeconomic conditions for the industry).
Risks: Evaluation of industry-specific dangers and those emanating from the state's political/economic
profile which call into question the likelihood of anticipated returns being realised over the assessed time
period. This is further broken down into two sub-categories:
■ Industry Risks (this is an industry-specific category whose score covers potential operational risks toinvestors, regulatory issues inhibiting the industry, and the relative maturity of a market);
• Country Risks (this is a country-specific category in which political and economic instability,unfavourable legislation and a poor overall business environment are evaluated to provide an overallscore).
Iran Oil & Gas Report Q2 2017
© Business Monitor International Ltd Page 79
We take a weighted average, combining Market and Country Risks, or Industry and Country Rewards.
These two results in turn provide an overall Risk/Reward Index score, which is used to create our regional
ranking system for the risks and rewards of involvement in a specific industry in a particular country.
For each category and sub-category, each state is scored out of 100 (with 100 the best), with the overall
Risk/Reward Index score a weighted average of the total score. Importantly, as most of the countries and
territories evaluated are considered by BMI to be 'emerging markets', our index is revised on a quarterly
basis. This ensures that the index draws on the latest information and data across our broad range of
sources, and the expertise of our analysts.
Sector-Specific Methodology
BMI's approach in assessing the Risk/Reward balance for oil and gas industry investors is three-fold:
■ First, we have disaggregated the upstream (oil and gas exploration and production) and downstream (oilrefining and marketing, gas processing and distribution), enabling us to take a more nuanced approach toanalysing the potential in each segment, and identifying the different risks along the value chain.
■ Second, we have identified objective indicators that may serve as proxies for issues and trends that werepreviously evaluated on a subjective basis.
■ Finally, we have used BMI's proprietary Country Risk Index in a more refined manner in order to ensurethat only those risks most relevant to the industry have been included.
Conceptually, the index is organised in a manner that enables us clearly to present the comparative strengths
and weaknesses of each state. The headline oil and gas index score is the principal score. However, the
differentiation of upstream and downstream and the articulation of the elements that comprise each segment
enable more sophisticated conclusions to be drawn, and also facilitate the use of the index by clients who
have varying levels of exposure and risk appetite.
Our sector-specific industry indices include:
■ Oil & Gas Risk/Reward Index: this is the overall index score, which comprises 50% upstream and 50%downstream;
■ Upstream Oil & Gas Risk/Reward Index: this is the overall upstream index score, which is composed ofrewards/risks (see below);
■ Downstream Oil & Gas Risk/Reward Index: this is the overall downstream index score, which comprisesrewards/risks (see below).
The following indicators have been used. Overall, the index uses three subjectively measured indicators and
41 separate indicators/datasets.
Iran Oil & Gas Report Q2 2017
© Business Monitor International Ltd Page 80
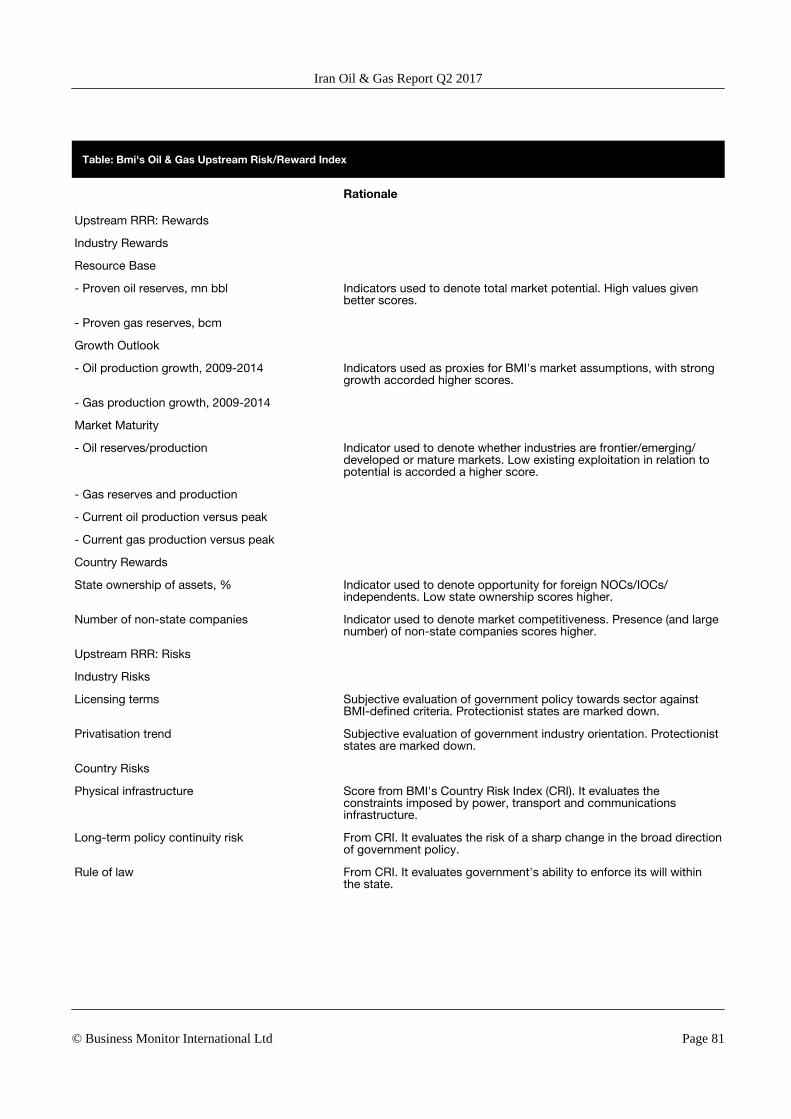
Table: Bmi's Oil & Gas Upstream Risk/Reward Index
Rationale
Upstream RRR: Rewards
Industry Rewards
Resource Base
- Proven oil reserves, mn bbl Indicators used to denote total market potential. High values givenbetter scores.
- Proven gas reserves, bcm
Growth Outlook
- Oil production growth, 2009-2014 Indicators used as proxies for BMI's market assumptions, with stronggrowth accorded higher scores.
- Gas production growth, 2009-2014
Market Maturity
- Oil reserves/production Indicator used to denote whether industries are frontier/emerging/developed or mature markets. Low existing exploitation in relation topotential is accorded a higher score.
- Gas reserves and production
- Current oil production versus peak
- Current gas production versus peak
Country Rewards
State ownership of assets, % Indicator used to denote opportunity for foreign NOCs/IOCs/independents. Low state ownership scores higher.
Number of non-state companies Indicator used to denote market competitiveness. Presence (and largenumber) of non-state companies scores higher.
Upstream RRR: Risks
Industry Risks
Licensing terms Subjective evaluation of government policy towards sector againstBMI-defined criteria. Protectionist states are marked down.
Privatisation trend Subjective evaluation of government industry orientation. Protectioniststates are marked down.
Country Risks
Physical infrastructure Score from BMI's Country Risk Index (CRI). It evaluates theconstraints imposed by power, transport and communicationsinfrastructure.
Long-term policy continuity risk From CRI. It evaluates the risk of a sharp change in the broad directionof government policy.
Rule of law From CRI. It evaluates government's ability to enforce its will withinthe state.
Iran Oil & Gas Report Q2 2017
© Business Monitor International Ltd Page 81
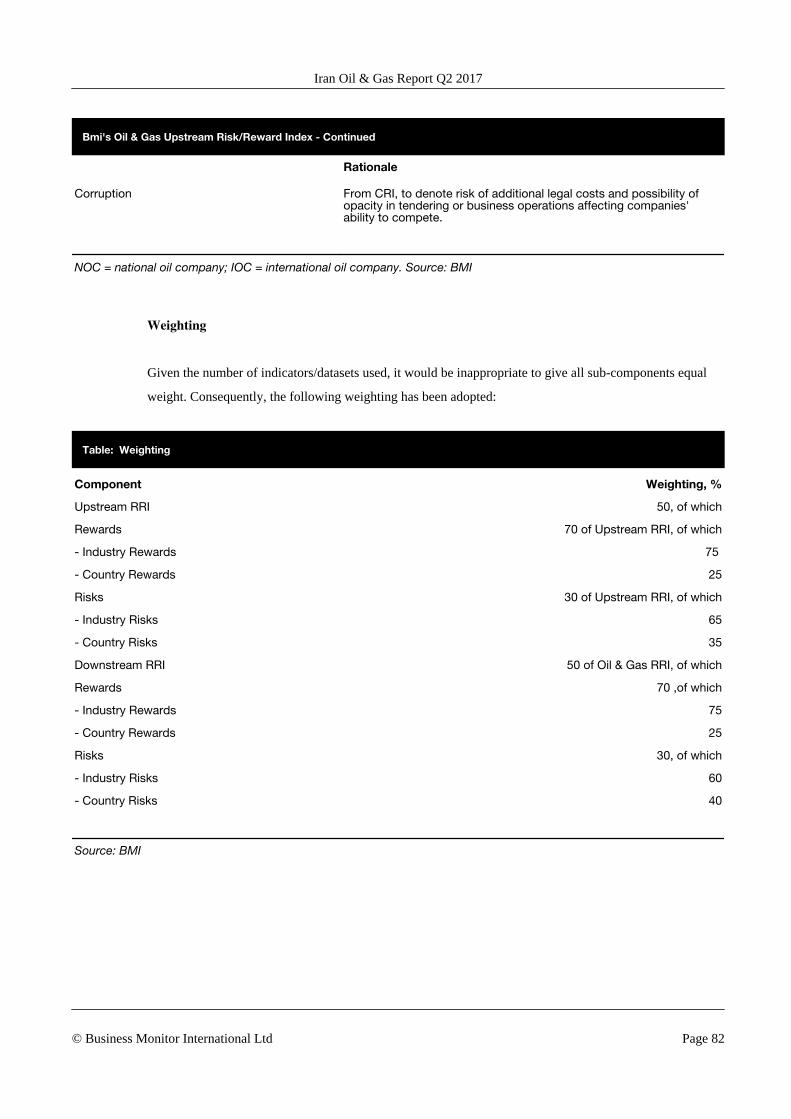
Bmi's Oil & Gas Upstream Risk/Reward Index - Continued
Rationale
Corruption From CRI, to denote risk of additional legal costs and possibility ofopacity in tendering or business operations affecting companies'ability to compete.
NOC = national oil company; IOC = international oil company. Source: BMI
Weighting
Given the number of indicators/datasets used, it would be inappropriate to give all sub-components equal
weight. Consequently, the following weighting has been adopted:
Table: Weighting
Component Weighting, %
Upstream RRI 50, of which
Rewards 70 of Upstream RRI, of which
- Industry Rewards 75
- Country Rewards 25
Risks 30 of Upstream RRI, of which
- Industry Risks 65
- Country Risks 35
Downstream RRI 50 of Oil & Gas RRI, of which
Rewards 70 ,of which
- Industry Rewards 75
- Country Rewards 25
Risks 30, of which
- Industry Risks 60
- Country Risks 40
Source: BMI
Iran Oil & Gas Report Q2 2017
© Business Monitor International Ltd Page 82