OFFICE OF FOSSIL ENERGY - netl.doe.gov Library/Research/Energy Analysis... · Cost and Performance...
281
Cost and Performance Baseline for Fossil Energy Plants Volume 1b: Bituminous Coal (IGCC) to Electricity Revision 2b – Year Dollar Update July 31, 2015 DOE/NETL-2015/1727 OFFICE OF FOSSIL ENERGY National Energy Technology Laboratory
Transcript of OFFICE OF FOSSIL ENERGY - netl.doe.gov Library/Research/Energy Analysis... · Cost and Performance...

Cost and Performance Baseline for Fossil Energy Plants Volume 1b: Bituminous Coal (IGCC) to Electricity Revision 2b – Year Dollar Update July 31, 2015 DOE/NETL-2015/1727
OFFICE OF FOSSIL ENERGY
National Energy Technology Laboratory

Cost and Performance Baseline for Fossil Energy Plants Volume 1b: Revision 2b
Disclaimer This report was prepared as an account of work sponsored by an agency of the United States Government. Neither the United States Government nor any agency thereof, nor any of their employees, makes any warranty, express or implied, or assumes any legal liability or responsibility for the accuracy, completeness, or usefulness of any information, apparatus, product, or process disclosed, or represents that its use would not infringe privately owned rights. Reference therein to any specific commercial product, process, or service by trade name, trademark, manufacturer, or otherwise does not necessarily constitute or imply its endorsement, recommendation, or favoring by the United States Government or any agency thereof. The views and opinions of authors expressed therein do not necessarily state or reflect those of the United States Government or any agency thereof.

Cost and Performance Baseline for Fossil Energy Plants Volume 1b: Revision 2b
Author List:
National Energy Technology Laboratory (NETL)
Tim Fout General Engineer
Office of Program Performance & Benefits
Energy Sector Planning and Analysis (ESPA)
Alexander Zoelle, Dale Keairns, Marc Turner, Mark Woods, Norma Kuehn, Vasant Shah, Vincent Chou
Booz Allen Hamilton
Lora Pinkerton WorleyParsons Group, Inc.
This report was prepared by Energy Sector Planning and Analysis (ESPA) for the United States Department of Energy (DOE), National Energy Technology Laboratory (NETL). This work was completed under DOE NETL Contract Number DE-FE0004001. This work was performed under ESPA Task 341.03, Activity 17.

Cost and Performance Baseline for Fossil Energy Plants Volume 1b: Revision 2b
Acknowledgments The authors wish to acknowledge the excellent guidance, contributions, and cooperation of the NETL staff, particularly:
Tim Fout, NETL Technical Monitor
Kristin Gerdes Director of OPPB
Travis Shultz Director, Performance Division of OPPB
John Wimer Director of OCPR&D
James Black
Daniel Cicero formerly of NETL
Jared Ciferno
Eric Grol
Jeffrey Hoffmann
Julianne Klara
Patrick Le
Michael Matuszewski formerly of NETL
Sean Plasynski
Larry Rath formerly of NETL
Walter Shelton Gary Stiegel formerly of NETL
William Summers
Thomas J. Tarka, P.E.
Maria Vargas
John L. Haslbeck formerly of Booz Allen Hamilton
Eric G. Lewis formerly of Booz Allen Hamilton
Pamela Capicotto formerly of Parsons Corporation
Michael Rutkowski formerly of Parsons Corporation
Ronald Schoff formerly of Parsons Corporation
Thomas Buchanan formerly of WorleyParsons Group, Inc.
James Simpson WorleyParsons Group, Inc.
Elsy Varghese formerly of WorleyParsons Group, Inc.
Vladimir Vaysman WorleyParsons Group, Inc.
Richard Weinstein WorleyParsons Group, Inc.
DOE Contract Number DE-FE0004001

Cost and Performance Baseline for Fossil Energy Plants Volume 1b: Revision 2b
i
Table of Contents Executive Summary .........................................................................................................................1 Results Analysis ...............................................................................................................................3 1 Introduction .................................................................................................................................10 2 General Evaluation Basis ............................................................................................................13 2.1 Site Characteristics...................................................................................................................13 2.2 Coal Characteristics .................................................................................................................15 2.3 Environmental Targets .............................................................................................................16 2.3.1 Study Cases ...........................................................................................................................18 2.3.2 Carbon Dioxide .....................................................................................................................19 2.4 Capacity Factor ........................................................................................................................19 2.4.1 Capacity Factor Assumptions ...............................................................................................19 2.4.2 Capacity Factor for IGCC Plants ..........................................................................................19 2.4.3 Capacity Factor for Plants with Carbon Capture ..................................................................20 2.4.4 Perspective ............................................................................................................................20 2.5 Raw Water Withdrawal and Consumption ..............................................................................20 2.6 Cost Estimating Methodology .................................................................................................21 2.6.1 Capital Costs .........................................................................................................................22 2.6.2 Operation and Maintenance Costs ........................................................................................25 2.6.3 CO2 Transport and Storage ...................................................................................................27 2.6.4 Cost of CO2 Captured and Avoided ......................................................................................29 2.7 Differences in IGCC Study Cost Estimates Compared to Industry Estimates ........................30 2.7.1 Project Scope ........................................................................................................................30 2.7.2 Labor .....................................................................................................................................31 2.7.3 Contracting Methodology .....................................................................................................31 3 IGCC Power Plants .....................................................................................................................32 3.1 IGCC Common Process Areas.................................................................................................32 3.1.1 Coal Receiving and Storage ..................................................................................................32 3.1.2 Air Separation Unit (ASU) Choice and Integration ..............................................................33 3.1.3 Water Gas Shift Reactors ......................................................................................................37 3.1.4 Mercury Removal .................................................................................................................38 3.1.5 Acid Gas Removal (AGR) Process Selection .......................................................................39 3.1.6 Sulfur Recovery/Tail Gas Cleanup Process Selection ..........................................................42 3.1.7 Slag Handling........................................................................................................................44 3.1.8 Power Island..........................................................................................................................45 3.1.9 Steam Generation Island .......................................................................................................48 3.1.10 Accessory Electric Plant .....................................................................................................51 3.1.11 Waste Treatment/Miscellaneous Systems...........................................................................52 3.1.12 Instrumentation and Control ...............................................................................................52 3.1.13 Performance Summary Metrics ..........................................................................................52 3.2 Shell Global Solutions IGCC Cases ........................................................................................54 3.2.1 Gasifier Background .............................................................................................................54 3.2.2 Process Description ...............................................................................................................55 3.2.3 Key System Assumptions .....................................................................................................61 3.2.4 Sparing Philosophy ...............................................................................................................63 3.2.5 Case B1A - Performance Results ..........................................................................................64

Cost and Performance Baseline for Fossil Energy Plants Volume 1b: Revision 2b
ii
3.2.6 Case B1A - Major Equipment List .......................................................................................75 3.2.7 Case B1A - Cost Estimating .................................................................................................80 3.2.8 Case B1B - Shell IGCC Power Plant with CO2 Capture ......................................................86 3.2.9 Case B1B - Performance Results ..........................................................................................91 3.2.10 Case B1B - Major Equipment List....................................................................................100 3.2.11 Case B1B - Cost Estimating .............................................................................................105 3.3 CB&I E-GasTM IGCC Cases ..................................................................................................111 3.3.1 Gasifier Background ...........................................................................................................111 3.3.2 Process Description .............................................................................................................112 3.3.3 Key System Assumptions ...................................................................................................118 3.3.4 Sparing Philosophy .............................................................................................................118 3.3.5 Case B4A - Performance Results ........................................................................................119 3.3.6 Case B4A - Major Equipment List .....................................................................................129 3.3.7 Case B4A - Costs Estimating Results .................................................................................134 3.3.8 Case B4B - E-Gas™ IGCC Power Plant with CO2 Capture ..............................................140 3.3.9 Case B4B - Performance Results ........................................................................................145 3.3.10 Case B4B - Major Equipment List....................................................................................154 3.3.11 Case B4B - Cost Estimating Results .................................................................................159 3.4 General Electric Energy IGCC Cases ....................................................................................165 3.4.1 Gasifier Background ...........................................................................................................165 3.4.2 Process Description .............................................................................................................166 3.4.3 Key System Assumptions ...................................................................................................173 3.4.4 Sparing Philosophy .............................................................................................................175 3.4.5 Case B5A - Performance Results ........................................................................................175 3.4.6 Case B5A - Major Equipment List .....................................................................................186 3.4.7 Case B5A - Cost Estimating ...............................................................................................191 3.4.8 Case B5B - GEE Radiant IGCC with CO2 Capture ............................................................197 3.4.9 Case B5B - Performance Results ........................................................................................201 3.4.10 Case B5B - Major Equipment List....................................................................................211 3.4.11 Case B5B - Cost Estimating .............................................................................................216 3.4.12 Case B5B-Q - GEE Quench IGCC with CO2 Capture .....................................................222 3.4.13 Case B5B-Q - Performance Results ..................................................................................226 3.4.14 Case B5B-Q - Major Equipment List ...............................................................................236 3.4.15 Case B5B-Q - Cost Estimating .........................................................................................241 3.5 IGCC Case Summary .............................................................................................................247 3.5.1 Sensitivities .........................................................................................................................253 4 Revision Control .......................................................................................................................257 5 References .................................................................................................................................261

Cost and Performance Baseline for Fossil Energy Plants Volume 1b: Revision 2b
iii
Exhibits Exhibit ES-1 Case configuration summary ..................................................................................... 1 Exhibit ES-2 Performance summary and environmental profile for all cases ................................ 4 Exhibit ES-3 Net plant efficiency (HHV basis) .............................................................................. 5 Exhibit ES-4 Cost summary for all cases ....................................................................................... 6 Exhibit ES-5 COE by cost component............................................................................................ 8 Exhibit 1-1 Case descriptions ....................................................................................................... 12 Exhibit 2-1 Site characteristics ..................................................................................................... 13 Exhibit 2-2 Site ambient conditions .............................................................................................. 14 Exhibit 2-3 Design coal ................................................................................................................ 15 Exhibit 2-4 Probability distribution of mercury concentration in the Illinois No. 6 coal ............. 16 Exhibit 2-5 MATS and NSPS emission limits for PM, HCl, SO2, NOx, and Hg ......................... 16 Exhibit 2-6 Environmental targets ................................................................................................ 18 Exhibit 2-7 Capital cost levels and their elements ........................................................................ 23 Exhibit 2-8 CO2 transport and storage costs ................................................................................. 29 Exhibit 3-1 Air extracted from the combustion turbine and supplied to the ASU in non-carbon
capture cases ......................................................................................................................... 35 Exhibit 3-2 Typical ASU process schematic ................................................................................ 36 Exhibit 3-3 Flow diagram for a conventional AGR unit .............................................................. 40 Exhibit 3-4 Typical three-stage Claus sulfur plant ....................................................................... 43 Exhibit 3-5 State-of-the-art 2008 F-class combustion turbine performance characteristics using
natural gas (42) ..................................................................................................................... 45 Exhibit 3-6 Typical fuel specification for state-of-the-art 2008 F-class machines ....................... 46 Exhibit 3-7 Allowable gas fuel contaminant level for state-of-the-art 2008 F-class machines .... 47 Exhibit 3-8 Case B1A block flow diagram, Shell IGCC without CO2 capture ............................ 56 Exhibit 3-9 Case B1A stream table, Shell IGCC without capture ................................................ 57 Exhibit 3-10 Shell IGCC plant study configuration matrix .......................................................... 62 Exhibit 3-11 Balance of plant assumptions .................................................................................. 63 Exhibit 3-12 Case B1A plant performance summary ................................................................... 65 Exhibit 3-13 Case B1A plant power summary ............................................................................. 66 Exhibit 3-14 Case B1A air emissions ........................................................................................... 67 Exhibit 3-15 Case B1A carbon balance ........................................................................................ 68 Exhibit 3-16 Case B1A sulfur balance.......................................................................................... 68 Exhibit 3-17 Case B1A water balance .......................................................................................... 69 Exhibit 3-18 Case B1A coal gasification and ASU heat and mass balance schematic ................ 71 Exhibit 3-19 Case B1A syngas cleanup heat and mass balance schematic .................................. 72 Exhibit 3-20 Case B1A combined cycle power generation heat and mass balance schematic .... 73 Exhibit 3-21 Case B1A overall energy balance (0°C [32°F] reference) ....................................... 75 Exhibit 3-22 Case B1A total plant cost details ............................................................................. 81 Exhibit 3-23 Case B1A owner’s costs .......................................................................................... 84 Exhibit 3-24 Case B1A initial and annual operating and maintenance costs ............................... 85 Exhibit 3-25 Case B1A COE breakdown ..................................................................................... 85 Exhibit 3-26 Case B1B block flow diagram, Shell IGCC with CO2 capture ............................... 88 Exhibit 3-27 Case B1B stream table, Shell IGCC with capture ................................................... 89 Exhibit 3-28 Case B1B plant performance summary ................................................................... 91 Exhibit 3-29 Case B1B plant power summary ............................................................................. 92

Cost and Performance Baseline for Fossil Energy Plants Volume 1b: Revision 2b
iv
Exhibit 3-30 Case B1B air emissions ........................................................................................... 93 Exhibit 3-31 Case B1B carbon balance ........................................................................................ 94 Exhibit 3-32 Case B1B sulfur balance .......................................................................................... 94 Exhibit 3-33 Case B1B water balance .......................................................................................... 95 Exhibit 3-34 Case B1B coal gasification and ASU heat and mass balance schematic ................. 96 Exhibit 3-35 Case B1B syngas cleanup heat and mass balance schematic .................................. 97 Exhibit 3-36 Case B1B combined cycle power generation heat and mass balance schematic ..... 98 Exhibit 3-37 Case B1B overall energy balance (0°C [32°F] reference) ..................................... 100 Exhibit 3-38 Case B1B total plant cost details ........................................................................... 106 Exhibit 3-39 Case B1B owner’s costs ........................................................................................ 109 Exhibit 3-40 Case B1B initial and annual operating and maintenance costs ............................. 110 Exhibit 3-41 Case B1B COE breakdown.................................................................................... 110 Exhibit 3-42 Case B4A block flow diagram, E-Gas™ IGCC without CO2 capture .................. 113 Exhibit 3-43 Case B4A stream table, E-Gas™ IGCC without capture ...................................... 114 Exhibit 3-44 E-GasTM IGCC plant study configuration matrix .................................................. 119 Exhibit 3-45 Case B4A plant performance summary ................................................................. 120 Exhibit 3-46 Case B4A plant power summary ........................................................................... 121 Exhibit 3-47 Case B4A air emissions ......................................................................................... 122 Exhibit 3-48 Case B4A carbon balance ...................................................................................... 123 Exhibit 3-49 Case B4A sulfur balance........................................................................................ 123 Exhibit 3-50 Case B4A water balance ........................................................................................ 124 Exhibit 3-51 Case B4A coal gasification and ASU heat and mass balance schematic .............. 125 Exhibit 3-52 Case B4A syngas cleanup heat and mass balance schematic ................................ 126 Exhibit 3-53 Case B4A combined cycle power generation heat and mass balance schematic .. 127 Exhibit 3-54 Case B4A overall energy balance (0°C [32°F] reference) ..................................... 129 Exhibit 3-55 Case B4A total plant cost details ........................................................................... 135 Exhibit 3-56 Case B4A owner’s costs ........................................................................................ 138 Exhibit 3-57 Case B4A initial and annual operating and maintenance costs ............................. 139 Exhibit 3-58 Case B4A COE breakdown ................................................................................... 139 Exhibit 3-59 Case B4B block flow diagram, E-Gas™ IGCC with CO2 capture ........................ 142 Exhibit 3-60 Case B4B stream table, E-Gas™ IGCC with capture............................................ 143 Exhibit 3-61 Case B4B plant performance summary ................................................................. 145 Exhibit 3-62 Case B4B plant power summary ........................................................................... 146 Exhibit 3-63 Case B4B air emissions ......................................................................................... 147 Exhibit 3-64 Case B4B carbon balance ...................................................................................... 148 Exhibit 3-65 Case B4B sulfur balance ........................................................................................ 148 Exhibit 3-66 Case B4B water balance ........................................................................................ 149 Exhibit 3-67 Case B4B coal gasification and ASU heat and mass balance schematic ............... 150 Exhibit 3-68 Case B4B syngas cleanup heat and mass balance schematic ................................ 151 Exhibit 3-69 Case B4B combined cycle power generation heat and mass balance schematic ... 152 Exhibit 3-70 Case B4B overall energy balance (0°C [32°F] reference) ..................................... 154 Exhibit 3-71 Case B4B total plant cost details ........................................................................... 160 Exhibit 3-72 Case B4B owner’s costs ........................................................................................ 163 Exhibit 3-73 Case B4B initial and annual operating and maintenance costs ............................. 164 Exhibit 3-74 Case B4B COE breakdown.................................................................................... 164 Exhibit 3-75 Case B5A block flow diagram, GEE IGCC without CO2 capture......................... 169

Cost and Performance Baseline for Fossil Energy Plants Volume 1b: Revision 2b
v
Exhibit 3-76 Case B5A stream table, GEE IGCC without capture ............................................ 170 Exhibit 3-77 GEE IGCC plant study configuration matrix ........................................................ 174 Exhibit 3-78 Case B5A plant performance summary ................................................................. 176 Exhibit 3-79 Case B5A plant power summary ........................................................................... 177 Exhibit 3-80 Case B5A air emissions ......................................................................................... 178 Exhibit 3-81 Case B5A carbon balance ...................................................................................... 179 Exhibit 3-82 Case B5A sulfur balance........................................................................................ 179 Exhibit 3-83 Case B5A water balance ........................................................................................ 180 Exhibit 3-84 Case B5A coal gasification and ASU heat and mass balance schematic .............. 182 Exhibit 3-85 Case B5A syngas cleanup heat and mass balance schematic ................................ 183 Exhibit 3-86 Case B5A combined-cycle power generation heat and mass balance schematic .. 184 Exhibit 3-87 Case B5A overall energy balance (0°C [32°F] reference) ..................................... 186 Exhibit 3-88 Case B5A total plant cost details ........................................................................... 192 Exhibit 3-89 Case B5A owner’s costs ........................................................................................ 195 Exhibit 3-90 Case B5A initial and annual operating and maintenance costs ............................. 196 Exhibit 3-91 Case B5A COE breakdown ................................................................................... 196 Exhibit 3-92 Case B5B block flow diagram, GEE IGCC with CO2 capture .............................. 198 Exhibit 3-93 Case B5B stream table, GEE IGCC with capture .................................................. 199 Exhibit 3-94 Case B5B plant performance summary ................................................................. 202 Exhibit 3-95 Case B5B plant power summary ........................................................................... 203 Exhibit 3-96 Case B5B air emissions ......................................................................................... 204 Exhibit 3-97 Case B5B carbon balance ...................................................................................... 205 Exhibit 3-98 Case B5B sulfur balance ........................................................................................ 205 Exhibit 3-99 Case B5B water balance ........................................................................................ 206 Exhibit 3-100 Case B5B coal gasification and ASU heat and mass balance schematic............. 207 Exhibit 3-101 Case B5B syngas cleanup heat and mass balance schematic .............................. 208 Exhibit 3-102 Case B5B combined-cycle power generation heat and mass balance schematic 209 Exhibit 3-103 Case B5B overall energy balance (0°C [32°F] reference) ................................... 211 Exhibit 3-104 Case B5B total plant cost details ......................................................................... 217 Exhibit 3-105 Case B5B owner’s costs ...................................................................................... 220 Exhibit 3-106 Case B5B initial and annual operating and maintenance costs ........................... 221 Exhibit 3-107 Case B5B COE breakdown.................................................................................. 221 Exhibit 3-108 Case B5B-Q block flow diagram, GEE quench-only IGCC with CO2 capture ... 223 Exhibit 3-109 Case B5B-Q stream table, GEE quench-only IGCC with capture ...................... 224 Exhibit 3-110 Case B5B-Q plant performance summary ........................................................... 227 Exhibit 3-111 Case B5B-Q plant power summary ..................................................................... 228 Exhibit 3-112 Case B5B-Q air emissions ................................................................................... 229 Exhibit 3-113 Case B5B-Q carbon balance ................................................................................ 230 Exhibit 3-114 Case B5B-Q sulfur balance.................................................................................. 230 Exhibit 3-115 Case B5B-Q water balance .................................................................................. 231 Exhibit 3-116 Case B5B-Q coal gasification and ASU heat and mass balance schematic ........ 232 Exhibit 3-117 Case B5B-Q syngas cleanup heat and mass balance schematic .......................... 233 Exhibit 3-118 Case B5B-Q combined cycle power generation heat and mass balance schematic
............................................................................................................................................. 234 Exhibit 3-119 Case B5B-Q overall energy balance .................................................................... 236 Exhibit 3-120 Case B5B-Q total plant cost details ..................................................................... 242

Cost and Performance Baseline for Fossil Energy Plants Volume 1b: Revision 2b
vi
Exhibit 3-121 Case B5B-Q owner’s costs .................................................................................. 245 Exhibit 3-122 Case B5B-Q initial and annual operating and maintenance costs ....................... 246 Exhibit 3-123 Case B5B-Q COE breakdown ............................................................................. 246 Exhibit 3-124 Estimated performance and cost results for all cases .......................................... 247 Exhibit 3-125 Plant capital cost for all cases .............................................................................. 249 Exhibit 3-126 COE for all cases ................................................................................................. 250 Exhibit 3-127 Cost of CO2 captured and avoided in all cases .................................................... 251 Exhibit 3-128 Raw water withdrawal and consumption in all cases .......................................... 252 Exhibit 3-129 Capacity factor sensitivity of all cases ................................................................. 253 Exhibit 3-130 Sensitivity of COE to coal price for all cases ...................................................... 254 Exhibit 3-131 Impact of carbon emissions price on study technologies .................................... 255 Exhibit 3-132 Impact of carbon sales price on study technologies ............................................ 256 Exhibit 4-1 Record of revisions .................................................................................................. 257

Cost and Performance Baseline for Fossil Energy Plants Volume 1b: Revision 2b
vii
Acronyms and Abbreviations AACE Association for the Advancement
of Cost Engineering acfm Actual cubic feet per minute ACI Activated carbon injection ADIP Aqueous di-isoproponal AEO Annual Energy Outlook AF Available factor AGR Acid gas removal ANSI American National Standards
Institute Ar Argon AR As received Aspen Aspen Plus® ASU Air separation unit atm Atmosphere (14.696 psi) BACT Best available control technology BAH Booz Allen Hamilton BDL Blowdown losses BEC Bare erected cost BFD Block flow diagram BFW Boiler feedwater Btu British thermal unit Btu/hr British thermal units per hour Btu/kWh British thermal units per kilowatt
hour Btu/lb British thermal units per pound Btu/scf British thermal units per standard
cubic foot CAAA Clean Air Act Amendments of 1990 CAIR Clean Air Interstate Rule CAMR Clean Air Mercury Rule CB&I Chicago Bridge & Iron Company CCF Capital charge factor CCS Carbon capture and sequestration CCS Carbon capture and storage CDR Carbon dioxide recovery cf Cubic feet CF Capacity factor cfm Cubic feet per minute CFR Code of Federal Regulations CGE Cold gas efficiency CGCU Cold gas cleanup CH4 Methane CL Closed-loop cm Centimeter CO Carbon monoxide
CO2 Carbon dioxide CO2E Carbon dioxide equivalent COE Cost of electricity COH Cost of hydrogen COR Contracting Officer's Representative COS Carbonyl sulfide CRT Cathode ray tube CS Carbon steel CT Combustion turbine CTG Combustion turbine-generator CWP Circulating water pump CWR Cooling water return CWS Circulating water system CWT Cold water temperature dB Decibel DB Dry basis DCA Direct contact absorber DCS Distributed control system DEA Diethanolamine DI De-ionized Dia. Diameter DIPA Diisopropanolamine DLN Dry low NOx DME Di-methyl ether DOE Department of Energy DSCR Debt service coverage ratio DSI Dry sorbent injection DSRP Direct sulfur recovery process eGRID Emissions & Generation Resource
Integrated Database E-GasTM CB&I gasifier technology EAF Equivalent availability factor EGU Electric utility steam generating units EIA Energy Information Administration EM Electromagnetic EMF Emission modification factors EOR Enhanced oil recovery EPA Environmental Protection Agency EPC Engineer/Procure/Construct EPCC Engineering, Procurement and
Construction Cost EPRI Electric Power Research Institute EPCM Engineering/Procurement/
Construction Management ERC Emission reduction credits

Cost and Performance Baseline for Fossil Energy Plants Volume 1b: Revision 2b
viii
ESP Electrostatic precipitator ESPA Energy Sector Planning and Analysis ETE Effective thermal efficiency FD Forced draft FE Fossil energy FERC Federal Energy Regulatory
Commission FG Flue gas FGD Flue gas desulfurization FO&M Fixed operations and maintenance FOAK First-of-a-kind FRP Fiberglass-reinforced plastic FSQ Full-slurry quench ft Foot, Feet ft, w.g. Feet of water gauge FW Feedwater GADS Generating Availability Data System gal Gallon gal/MWh Gallons per megawatt hour GCV Gross calorific value GDP Gross domestic product GEE General Electric Energy GJ Gigajoule GJ/hr Gigajoules per hour GHG Greenhouse gas GHGEV Greenhouse gas emission value gpd Gallons per day gpm Gallons per minute gr/100 scf grains per one hundred standard cubic
feet GRI Gas Research Institute GSU Generator step-up transformers Gt Gigatonnes GWh Gigawatt-hour h, hr Hour H2 Hydrogen H2A DOE’s Hydrogen Advisory Group H2O Water H2S Hydrogen sulfide H2SO4 Sulfuric acid HAP Hazardous air pollutant HCl Hydrochloric acid HCPV Hydrocarbon pore volume HDPE High density polyethylene Hg Mercury HHV Higher heating value Horiz. Horizontal hp Horsepower
HP High pressure HRSG Heat recovery steam generator HSS Heat stable salts HV High voltage HVAC Heating, ventilating, and air
conditioning HWT Hot water temperature Hz Hertz ICR Information Collection Request ID Induced draft IEA International Energy Agency IEEE Institute of Electrical and Electronics
Engineers IGCC Integrated gasification combined
cycle IGV Inlet guide vane in. H2O Inch water in. Hga Inch mercury (absolute pressure) in. W.C. Inch water column IOU Investor-owned utility IP Intermediate pressure IPCC Intergovernmental Panel on Climate
Change IPM Integrated Planning Model IPP Independent power producer IRR Internal rate of return IRROE Internal rate of return on equity ISBL Inside battery limits ISO International Organization for
Standardization kg/GJ Kilograms per gigajoule kg/hr Kilograms per hour kg/s Kilograms per second kgmol Kilogram mole kgmol/hr Kilogram moles per hour kJ Kilojoule kJ/hr Kilojoules per hour kJ/kg Kilojoules per kilogram km Kilometer KO Knockout kPa Kilopascal kV Kilovolt kW, kWe Kilowatt electric kWh Kilowatt-hour kWt Kilowatt thermal LAER Lowest Achievable Emission Rate lb Pound lb/gal Pound per gallon

Cost and Performance Baseline for Fossil Energy Plants Volume 1b: Revision 2b
ix
lb/hr Pounds per hour lb/ft2 Pounds per square foot lb/MMBtu Pounds per million British thermal
units lbmol Pound mole lbmol/hr Pound moles per hour lb/MWh Pounds per megawatt hour lb/TBtu Pounds per trillion British thermal
units LC Life cycle LCA Life cycle analysis LCC Life cycle cost LCI Life cycle inventory LCIA Life cycle impact assessment LGTI Louisiana Gasification Technology,
Inc. LHV Lower heating value LIBOR London Interbank Offered Rate LMP Locational Marginal Price LNG Liquified natural gas LNB Low NOx burner LP Low pressure LPG Liquefied petroleum gas lpm Liters per minute LSE Load-serving entities LV Low voltage M Thousand m Meter m/min Meters per minute m3/min Cubic meters per minute MAC Main air compressor MAF Moisture and ash free MATS Mercury and Air Toxics Standards Mbbl Thousand barrels Mcf Thousand cubic feet MCR Maximum continuous rate md Millidarcy (a measure of
permeability) MDEA Methyldiethanolamine MeOH Methanol MHz Megahertz mi Mile MJ/Nm3 Megajoules per normal cubic meter MM Million MMBtu Million British thermal units MMBtu/hr Million British thermal units per hour MMscf Million standard cubic feet MMscfd Million standard cubic feet per day
MMscfy Million standard cubic feet per year mol% Mole percent (percent by mole) MNQC Multi Nozzle Quiet Combustor MPa Megapascal mpg Miles per gallon MTG Methanol to gasoline MVA Mega volt-amps MW Megawatt MWe Megawatt electric MWh Megawatt-hour MWt Megawatt thermal N2 Nitrogen N2O Nitrous oxide N/A Not applicable NAAQS National Ambient Air Quality
Standards NaOH Sodium hydroxide NCF Net capacity factor Neg. Negligible NEMA National Electrical Manufacturers
Association NEMS National Energy Modeling System NERC North American Electric Reliability
Council NETL National Energy Technology
Laboratory NFPA National Fire Protection Association NG Natural gas NGCC Natural gas combined cycle NGL Natural gas liquids NH3 Ammonia Nm3 Normal cubic meter Nm3/hr Normal cubic meter per hour NOAK Nth-of-a-kind NOx Oxides of nitrogen NSPS New Source Performance Standards NSR New Source Review O2 Oxygen O&GJ Oil & Gas Journal O&M Operation and maintenance OCFn Category n fixed operating cost for
the initial year of operation OCVnq Category n variable operating cost for
the initial year of operation OD Outside diameter OEM Original equipment manufacturers OFA Overfire air OPPA Office of Program Planning &
Analysis

Cost and Performance Baseline for Fossil Energy Plants Volume 1b: Revision 2b
x
OP/VWO Over pressure/valve wide open OSHA Occupational Safety and Health
Administration PA Primary air PAC Powdered activated carbon PC Pulverized coal PAS PAS, Inc. PC Pulverized coal p.f. Power factor PFD Process flow diagram PM Particulate matter PM10 Particulate matter measuring 10 μm
(micrometers) or less PO Purchase order POTW Publicly owned treatment works ppbw Parts per billion weight ppm Parts per million ppmv Parts per million volume ppmvd Parts per million volume, dry ppmw Parts per million weight ppmwd Parts per million weight, dry PRB Powder River Basin coal region PSA Pressure swing adsorption PSD Prevention of significant deterioration psi Pounds per square inch psia Pound per square inch absolute psid Pound per square inch differential psig Pound per square inch gage PSFM Power systems financial model PTFE Teflon (Polytetrafluoroethylene) PV Present value QGESS Quality Guidelines for Energy
System Studies Qty Quantity R&D Research and development RCRA Resource Conservation and Recovery
Act RD&D Research, development, and
demonstration RDS Research and Development Solutions,
LLC RH Reheater RSC Radiant syngas cooler RSP Required selling price RTO Regional transmission
operations/operator SC Supercritical SC PC Supercritical Pulverized Coal scf Standard cubic feet
scfd Standard cubic feet per day scfh Standard cubic feet per hour scfm Standard cubic feet per minute Sch. Schedule scmh Standard cubic meter per hour SCOT Shell Claus Off-gas Treating SCR Selective catalytic reduction process
or equipment SDA Spray dryer absorber SEAP Office of Strategic Energy Analysis
& Planning SFC Synthetic Fuels Corporation SG Specific gravity SGC Synthesis gas cooler SGS Sour gas shift Shell Shell Global Solutions SO2 Sulfur dioxide SOx Oxides of sulfur SNCR Selective non-catalytic reduction
process or equipment SNG Synthetic natural gas SRU Sulfur recovery unit SS Stainless steel SS Amine SS Specialty Amine st Short ton STG Steam turbine generator SWS Sour water scrubber Syngas Synthetic gas T&D Transmission and distribution T&S Transport and storage TASC Total as-spent cost TCR Total capital requirement TEWAC Totally Enclosed Water-to-Air
Cooled TGTU Tail gas treating unit tonne Metric ton (1,000 kg) TOC Total overnight cost TPC Total plant cost tpd Ton per day tph Tons per hour TPI Total plant investment U.S. United States USC Ultra-supercritical V Volt VOC Volatile organic compound VO&M Variable operations and maintenance V-L Vapor liquid portion of stream
(excluding solids)

Cost and Performance Baseline for Fossil Energy Plants Volume 1b: Revision 2b
xi
vol% Volume percent WB Wet bulb wg Water gauge WGCU Warm gas cleanup WGS Water gas shift wt% Weight percent yr Year ZnO Zinc oxide ZnS Zinc sulfide $/GJ Dollars per gigajoule
$/kW Dollars per kilowatt $/MMBtu Dollars per million British thermal
units $M Millions of dollars μS/cm micro Siemens per cm °C Degrees Celsius °F Degrees Fahrenheit 5-10s Fifty hour work weeks

Cost and Performance Baseline for Fossil Energy Plants Volume 1b: Revision 2b
xii
This page intentionally left blank.

Cost and Performance Baseline for Fossil Energy Plants Volume 1b: Revision 2b
1
Executive Summary This report presents the cost and performance results of an assessment of seven integrated gasification combined cycle (IGCC) plants. The primary value of this report lies not in the absolute accuracy of the capital cost estimates for the individual cases (estimated to be -15 percent/+30), but in the application of a consistent approach to allow meaningful comparisons of relative costs among the cases evaluated.
This report is part of an update to Volume 1 of a four-volume series, which consists of:
• Volume 1: Bituminous Coal and Natural Gas to Electricity • Volume 2: Coal to Synthetic Natural Gas and Ammonia (Various Coal Ranks) • Volume 3: Low Rank Coal and Natural Gas to Electricity • Volume 4: Bituminous Coal to Liquid Fuels
This report, Volume 1b, retains the IGCC design and performance updates from the November 2010 release of Volume 1 (Revision 2)1, but updates the IGCC costs for all cases to 2011 year dollars. Volume 1a covers the cost and performance update of all pulverized coal (PC) and natural gas combined cycle (NGCC) cases. Section 4 has a revision control table listing the updates applied to this report.
Seven power plant configurations were analyzed in this report, including two Shell Global Solutions (Shell) gasifiers (with and without carbon dioxide [CO2] capture), two Chicago Bridge and Iron (CB&I) E-GasTM full-slurry quench (FSQ) gasifiers (with and without CO2 capture), and three General Electric Energy (GEE) gasifiers (one without and two with CO2 capture [one radiant and one quench]). A summary of the case configurations in the report is shown in Exhibit ES-1.
Exhibit ES-1 Case configuration summary
Case Steam Cycle, psig/°F/°F
Combustion Turbine
Gasifier Technology
H2S Separation PM Control CO2
SeparationB
B1A 1800/1050/1050 2 x State-of-the-art 2008 F-Class Shell Sulfinol-M Cyclone, candle filter,
and water scrubber N/A
B1B 1800/1000/1000 2 x State-of-the-art 2008 F-Class Shell Selexol Cyclone, candle filter,
and water scrubber Selexol 2nd
stage
B4A 1800/1050/1050 2 x State-of-the-art 2008 F-Class CB&I E-Gas™ Refrigerated
MDEA Cyclone, candle filter, and water scrubber N/A
B4B 1800/1000/1000 2 x State-of-the-art 2008 F-Class CB&I E-Gas™ Selexol Cyclone, candle filter,
and water scrubber Selexol 2nd
stage
B5A 1800/1050/1050 2 x State-of-the-art 2008 F-Class GEE Radiant Selexol
Quench, water scrubber, and AGR
adsorber N/A
B5B 1800/1000/1000 2 x State-of-the-art 2008 F-Class GEE Radiant Selexol
Quench, water scrubber, and AGR
adsorber
Selexol 2nd stage
B5B-Q 1800/1000/1000 2 x State-of-the-art 2008 F-Class GEE Quench Selexol
Quench, water scrubber, and AGR
adsorber
Selexol 2nd stage
1 In order to meet the new mercury limits, discussed in Section 2.3, the design of the carbon bed was updated to be a dual sequential carbon bed.

Cost and Performance Baseline for Fossil Energy Plants Volume 1b: Revision 2b
2
All plant configurations were evaluated based on installation at a greenfield site. Capacity factors (CF) are assumed to equal approximate availability at 80 percent for all configurations. Achieving such capacity factors would require that these plants be near the top of the dispatch list.
The combustion turbines (CT) used in each of the configurations are manufactured in discrete sizes; each of the configurations utilizes an identical CT design with the output maximized. While the output of the combustion turbines is consistent between configurations, the cases have net outputs ranging from 494 (Case B5B-Q) to 629 MW (Case B1A). The range in net output is caused by the significant auxiliary load imposed in the CO2 capture cases – primarily due to CO2 compression – and the need for extraction steam for CO2 capture and the sour gas shift (SGS) reactions, which reduces steam turbine output.
Environmental emission requirements are based on the mercury (Hg) and hydrochloric acid (HCl) limits set by the March 2013 update to the Utility Mercury and Air Toxics Standards (MATS), and particulate matter (PM), sulfur dioxide (SO2), and nitrogen oxide (NOx) limits set by the February 2013 update to the New Source Performance Standards (NSPS).
Mercury is controlled with dual sulfur-impregnated carbon beds; H2S is separated with an acid gas removal (AGR) process and controlled with a Claus plant to limit SO2 stack emissions; NOx formation is minimized with low NOx burners (LNB) and nitrogen dilution; the particulate matter is controlled with a syngas scrubber, cyclone, and candle filter; the HCl is primarily removed in the syngas scrubber with the remainder removed with the low temperature heat recovery condensate, and the combined effluent is treated with calcium hydroxide.
All of the power plant configurations with carbon capture in this report are designed to achieve 90 percent capture, resulting in atmospheric CO2 emissions at levels far below proposed Environmental Protection Agency (EPA) regulation.2
The performance results presented in this report are unchanged from Revision 2. The methodology used in their development included performing steady-state simulations of the seven power plant configurations using the Aspen Plus® (Aspen) modeling program. The major plant equipment performance and process limits were based on published reports, information obtained from vendors and users of the technology, performance data from design/build utility projects, and/or best engineering judgment.
In Revision 2, mass and energy balance data from the Aspen models were used to size major pieces of equipment, which formed the basis for developing the cost estimates presented in that report. The capital and operating costs for the major equipment and plant sub-systems had been estimated by WorleyParsons based on the simulation results using an in-house database and conceptual estimating models. The cost results were further calibrated using a combination of adjusted vendor-furnished data and scaled estimates from previous design/build projects. All Revision 2 costs were reported in 2007 dollars.
It was the purpose of this report (Revision 2b) to update the costs to 2011 dollars. This effort was accomplished through scaled escalation and corrections. The only exception was to address
2 The Environmental Protection Agency (EPA) proposed a new source performance standard on April 13, 2012, for emissions of carbon dioxide for new fossil fuel-fired electric utility generating units. As of the publication of this report, the proposed regulation has been published in the Federal Register. (54) The limit set by the proposed regulation is 1,100 lb-CO2/MWh-gross.

Cost and Performance Baseline for Fossil Energy Plants Volume 1b: Revision 2b
3
the use of a dual carbon system for Hg removal, which was re-costed from a single carbon system to address environmental targets discussed in Section 2.3.
The baseline fuel cost for this analysis is specified in the November 2012 revision of the Quality Guidelines for Energy System Studies (QGESS) document on “Fuel Prices for Selected Feedstocks in NETL Studies.” (1) The first year of capital expenditure price used is $2.78/GJ ($2.94/MMBtu) for Illinois No. 6 coal delivered to the Midwest, on a higher heating value (HHV) basis and in 2011 United States (U.S.) dollars.
The cost metric used in this report is the cost of electricity (COE), which is the revenue that must be received by the generator per net megawatt-hour produced to meet the desired internal rate of return on equity. The COE is assumed to escalate at a nominal annual rate equal to the general inflation rate, i.e., it remains constant or levelized in real terms over the operational period of the power plant. The cost of CO2 transport and storage (T&S) of $11 per tonne of CO2 is added to the COE and represents a 62 km (100 mile) CO2 pipeline and storage in a deep saline formation in the Midwest.3
The cost and performance of the various fossil fuel-based technologies will be important in determining which combination of technologies will be utilized to meet the demands of the power market in the future.
Selection of new generation technologies will depend on many factors, including:
• Capital and operating costs • Overall energy efficiency • Fuel prices • COE • Availability, reliability, and environmental performance • Current and potential regulations governing air, water, and solid waste discharges from
fossil-fueled power plants • Market penetration of clean coal technologies that have matured and improved as a result
of recent commercial-scale demonstrations under the Department of Energy’s (DOE) Clean Coal and Carbon Management Program
Results Analysis Exhibit ES-2 shows the performance and environmental profile summary for all cases. A graph of the net plant efficiency (HHV basis) is provided in Exhibit ES-3.
3 Estimated using the FE/NETL CO2 Transport Cost Model and the FE/NETL CO2 Saline Storage Cost Model. Additional detail on development of these costs is available in the May 2014 revision of the QGESS document “Carbon Dioxide Transport and Storage Costs in NETL Studies.” (26)

Cost and Performance Baseline for Fossil Energy Plants Volume 1b: Revision 2b
4
Exhibit ES-2 Performance summary and environmental profile for all cases
Integrated Gasification Combined Cycle Shell E-GasTM FSQ GEE R+Q
Case Name (Old Case Name)A B1A (5) B1B (6) B4A (3) B4B (4) B5A (1) B5B (2) B5B-Q (2a) PERFORMANCE
Gross Power Output (MWe) 737 673 738 704 748 734 684 Auxiliary Power Requirement (MWe) 108 177 113 190 126 191 190 Net Power Output (MWe) 629 497 625 513 622 543 494 Coal Flow rate (lb/hr) 436,646 465,264 459,956 484,212 466,898 487,005 486,978 Natural Gas Flow rate (lb/hr) N/A N/A N/A N/A N/A N/A N/A HHV Thermal Input (kWt) 1,492,878 1,590,722 1,572,575 1,655,503 1,596,309 1,665,056 1,664,962 Net Plant HHV Efficiency (%) 42.1% 31.2% 39.7% 31.0% 39.0% 32.6% 29.7% Net Plant HHV Heat Rate (Btu/kWh) 8,100 10,927 8,585 11,002 8,758 10,459 11,505 Raw Water Withdrawal, gpm 4,150 5,652 4,382 5,757 4,755 5,834 6,137 Process Water Discharge, gpm 788 1,021 905 1,095 984 1,080 1,129 Raw Water Consumption, gpm 3,362 4,631 3,477 4,662 3,771 4,754 5,008 CO2 Capture Rate (%) 0 90 0 90 0 90 90 CO₂ Emissions (lb/MMBtu) 197 20 199 20 197 20 20 CO₂ Emissions (lb/MWh-gross) 1,361 161 1,448 158 1,434 152 165 CO₂ Emissions (lb/MWh-net) 1,595 218 1,711 217 1,724 206 228 SO₂ Emissions (lb/MMBtu) 0.004 0.002 0.012 0.002 0.001 0.002 0.002 SO₂ Emissions (lb/MWh-gross) 0.029 0.017 0.085 0.017 0.009 0.017 0.018 NOx Emissions (lb/MMBtu) 0.059 0.049 0.060 0.049 0.059 0.049 0.049 NOx Emissions (lb/MWh-gross) 0.409 0.396 0.434 0.396 0.430 0.376 0.404 PM Emissions (lb/MMBtu) 0.007 0.007 0.007 0.007 0.007 0.007 0.007 PM Emissions (lb/MWh-gross) 0.049 0.057 0.052 0.057 0.052 0.055 0.059 Hg Emissions (lb/TBtu) 0.434 0.372 0.413 0.374 0.412 0.388 0.361 Hg Emissions (lb/MWh-gross) 3.00E-06 3.00E-06 3.00E-06 3.00E-06 3.00E-06 3.00E-06 3.00E-06
A Previous versions of this report used a different naming convention. The old case numbers are provided here, paired with the new case numbers for reference.
The primary conclusions that can be drawn are:
• In the non-carbon capture cases the Shell gasifier has the highest net plant efficiency (42.1 percent), followed by the two-stage E-GasTM slurry fed gasifier (39.7 percent).
• The energy penalty associated with adding CO2 capture is due to steam extraction for use in the SGS reaction, the auxiliary load for the CO2 separation and compression equipment, and a slight derate of the gas turbine due to the higher moisture content of the flue gas. The reduction in net plant efficiency ranges from 6 to 11 percentage points with the variability being due to the optimum gasifier designs (e.g., slurry vs. dry feed, syngas quench vs. syngas heat recovery). The capture and non-capture plant configurations may have different optimum gasifier designs.
• The lowest energy penalty (6 percentage points) corresponds to the GEE Radiant gasifier cases primarily due to the non-capture plant design (slurry feed, water quench), which results in a high moisture content in the syngas and thus a low addition of shift steam for SGS for the capture plant design.

Cost and Performance Baseline for Fossil Energy Plants Volume 1b: Revision 2b
5
• The highest energy penalty (11 percentage points) corresponds to the Shell gasifier cases. The design uses a dry feed system and, in the non-capture configuration, has relatively high heat recovery in the syngas cooler with no water quench, resulting in very low moisture content in the syngas. For the capture configuration, a water quench is added, which increases the moisture content of the syngas for the SGS reaction but decreases the heat recovery in the syngas cooler.
• CB&I E-GasTM has the highest SO2 emissions (0.085 lb/MWh-gross) of the seven cases because refrigerated MDEA has the lowest H2S removal efficiency of the AGR technologies.
• Emissions of Hg, PM, NOx, HCl, and SO2 are all below the regulatory limits currently in effect and applicable to the technologies within this report.
Exhibit ES-3 Net plant efficiency (HHV basis)
Source: NETL
The cost results for all cases are provided in Exhibit ES-4. A graph of the COE is provided in Exhibit ES-5.

Cost and Performance Baseline for Fossil Energy Plants Volume 1b: Revision 2b
6
Exhibit ES-4 Cost summary for all cases
Integrated Gasification Combined CycleA
Shell E-GasTM FSQ GEE R+Q Case Name B1A B1B B4A B4B B5A B5B B5B-Q
COST Total Plant Cost (2011$/kW) 2,725 3,981 2,372 3,540 2,449 3,387 3,405 Bare Erected Cost 2,067 2,963 1,809 2,638 1,870 2,525 2,548 Home Office Expenses 207 296 181 264 187 253 255 Project Contingency 376 562 322 492 330 467 467 Process Contingency 75 160 61 147 61 143 135 Total Overnight Cost (2011$M) 2,107 2,442 1,830 2,252 1,888 2,279 2,086 Total Overnight Cost (2011$/kW) 3,351 4,917 2,929 4,386 3,036 4,195 4,224 Owner's Costs 626 936 557 846 587 807 819 Total As-Spent Cost (2011$/kW) 3,820 5,605 3,339 5,000 3,461 4,782 4,815 COE ($/MWh) (excluding T&S) 107.0 152.6 99.8 141.9 102.6 135.4 138.7 Capital Costs 59.3 87.0 51.8 77.6 53.7 74.2 74.7 Fixed Costs 14.7 20.5 13.5 19.1 13.7 18.2 18.0 Variable Costs 9.3 13.0 9.2 12.8 9.4 12.2 12.2 Fuel Costs 23.8 32.1 25.2 32.3 25.7 30.7 33.8 COE ($/MWh) (including T&S) 107.0 162.4 99.8 151.8 102.6 144.7 148.9 CO₂ T&S Costs 0.0 9.8 0.0 9.9 0.0 9.2 10.2 CO2 Captured Cost (excluding T&S), $/tonneB N/A 78.9 N/A 66.5 N/A 63.2 61.0
CO2 Avoided Cost (including T&S), $/tonneB N/A 118.7 N/A 102.9 N/A 91.7 99.3
AAll cases use high-risk financial assumptions consistent with NETL’s “QGESS: Cost Estimation Methodology for NETL Assessments of Power Plant Performance.” (2) BBoth the costs of CO2 captured and avoided were calculated based on the non-capture supercritical pulverized coal (Case B12A) data provided in the “Cost and Performance Baseline for Fossil Energy Plants, Volume 1a: Bituminous Coal (PC) and Natural Gas to Electricity, Revision 3” report. (3) Case B12A has a COE of $82.3/MWh, a CO2 emission rate of 1,618 lb/MWh-gross, a gross plant output of 579,700 kW, and a net plant output of 550,012 kW.
The primary conclusions that can be drawn are:
• E-GasTM has the lowest total overnight cost (TOC) cost among the non-capture cases. The E-GasTM technology has several features that lend it to being lower cost, such as:
o The firetube syngas cooler is much smaller and less expensive than a radiant section. E-GasTM can use a firetube boiler because the two-stage design reduces the syngas temperature (slurry quench) into a range where a radiant cooler is not needed.
o The firetube syngas cooler sits next to the gasifier instead of above or below it, which reduces the height of the main gasifier structure. The E-GasTM proprietary slag removal system – used instead of lock hoppers below the gasifier – also contributes to the lower structure height.
• The normalized TOC of the GEE Radiant gasifier case is approximately 4 percent greater than E-GasTM, and Shell is approximately 14 percent higher.

Cost and Performance Baseline for Fossil Energy Plants Volume 1b: Revision 2b
7
• The GEE radiant gasifier (GEE quench is less than 1 percent greater than GEE radiant) is the low-cost technology in the CO2 capture cases, with E-GasTM normalized TOC approximately 5 percent higher and Shell approximately 17 percent higher.
• The ASU cost represents, on average, 12 percent of the TOC (range from 10-13 percent). The ASU cost includes oxygen and nitrogen compression, and in the non-capture cases, it also includes the cost of the CT extraction air heat exchanger. With nitrogen dilution used to the maximum extent possible, nitrogen compression costs are significant.
• The normalized TOC premium for adding CO2 capture averages 43 percent ($4,430/kW versus $3,105/kW).
• The COE is dominated by capital costs and is at least 50 percent of the total in all cases. • In the non-capture cases the E-GasTM gasifier has the lowest COE, but the differential
with Shell is reduced (relative to the normalized TOC comparison) primarily because of the higher efficiency of the Shell gasifier. The Shell COE is 7 percent higher than E-GasTM (compared to 14 percent higher normalized TOC). The GEE gasifier COE is about 3 percent higher than E-GasTM.
• In the capture cases the variation in COE is small; however, the order of the GEE and E-GasTM gasifiers is reversed. The range is from $144.7/MWh for GEE Radiant to $162.4/MWh for Shell with GEE Quench and E-GasTM intermediate at $148.9/MWh and $151.8/MWh, respectively. The COE CO2 capture premium for the cases averages 47 percent (range of 41 to 52 percent).
• The CO2 T&S COE component composes less than 7 percent of the total COE in all capture cases.
• In the event that future legislation assigns a cost to carbon emissions, all of the technologies examined in this report will become more expensive. The technologies without carbon capture will be impacted to a larger extent than those with carbon capture.

Cost and Performance Baseline for Fossil Energy Plants Volume 1b: Revision 2b
8
Exhibit ES-5 COE by cost component
Source: NETL
Special Considerations on Reported Costs Capital Costs:
The capital cost estimates documented in this report reflect an uncertainty range of -15 percent/+30 percent, consistent with Association for the Advancement of Cost Engineering (AACE) Class 4 cost estimates (i.e., feasibility study) (4) (5) (6), based on the level of engineering design performed. In all cases, the report intends to represent the next commercial offering and relies on vendor cost estimates for component technologies. It also applies process contingencies at the appropriate subsystem levels in an attempt to account for expected but undefined costs, which can be a challenge for emerging technologies.
Costs of Emerging Technologies and Designs:
The cost estimates for plant designs that include technologies that are not yet fully mature (e.g., IGCC plants and any plant with CO2 capture) use the same cost estimating methodology as for mature plant designs (e.g., PC and NGCC power plants without CO2 capture), which does not fully account for the unique cost premiums associated with the initial, complex integrations of emerging technologies in a commercial application. Thus, it is anticipated that initial deployments of IGCC plants – both with and without CO2 capture – may incur costs higher than those reflected within this report.

Cost and Performance Baseline for Fossil Energy Plants Volume 1b: Revision 2b
9
Other Factors:
Actual reported project costs for all of the plant types are also expected to deviate from the cost estimates in this report due to project- and site-specific considerations (e.g., contracting strategy, local labor costs, seismic conditions, water quality, financing parameters, local environmental concerns, weather delays, etc.) that may make construction more costly. Such variations are not captured by the reported cost uncertainty.
Future Cost Trends:
Continuing research, development, and demonstration (RD&D) is expected to result in designs that are more advanced than those assessed by this report, leading to costs that are lower than those estimated herein.

Cost and Performance Baseline for Fossil Energy Plants Volume 1b: Revision 2b
10
1 Introduction The objective of this report is to present an accurate, independent assessment of the cost and performance of fossil energy power systems, specifically integrated gasification combined cycle (IGCC) plants, using a consistent technical and economic approach that reasonably reflects current market conditions.
This report is part of an update to Volume 1 of the four volume series, which consists of:
• Volume 1: Bituminous Coal and Natural Gas to Electricity • Volume 2: Coal to Synthetic Natural Gas and Ammonia (Various Coal Ranks) • Volume 3: Low Rank Coal and Natural Gas to Electricity • Volume 4: Bituminous Coal to Liquid Fuels
This report, Volume 1b, retains the IGCC design and performance updates from the November 2010 release of Volume 1 (Revision 2)4, but updates the IGCC costs for all cases to 2011 year dollars. Volume 1a covers the cost and performance update of all pulverized coal (PC) and natural gas combined cycle (NGCC) cases (3). Section 4 has a revision control table listing the updates applied to this report.
Selection of new generation technologies will depend on many factors, including:
• Capital and operating costs • Overall energy efficiency • Fuel prices • Cost of electricity (COE) • Availability, reliability, and environmental performance • Current and potential regulation of air, water, and solid waste discharges from fossil-
fueled power plants • Market penetration of clean coal technologies that have matured and improved as a result
of recent commercial-scale demonstrations under the Department of Energy’s (DOE) Clean Coal and Carbon Management Program
Seven power plant configurations were analyzed, as listed in Exhibit 1-1. The list includes two Shell Global Solutions (Shell) gasifiers (with and without carbon dioxide [CO2] capture), two CB&I E-GasTM full-slurry quench (FSQ) gasifiers (with and without CO2 capture), and three General Electric Energy (GEE) gasifiers (one without and two with CO2 capture [one radiant and one quench]).
While input had previously been sought from various technology vendors during the development of the previous revision (Revision 2) of this report, the final assessment of performance was determined independently and has not been reviewed by individual vendors.
4 In order to meet the new mercury limits, discussed in Section 2.3, the design of the carbon bed was updated to be a dual sequential carbon bed.

Cost and Performance Baseline for Fossil Energy Plants Volume 1b: Revision 2b
11
Generating Unit Configurations A summary of plant configurations considered in this report is presented in Exhibit 1-1. Components for each plant configuration are described in more detail in the corresponding report sections for each case.
The cases have different gross and net power outputs because of the combustion turbine (CT) size constraint. The state-of-the-art 2008 F-class CT used to model the cases comes in a standard size of 232 MW when operated on syngas at conditions set by the International Standards Organization (ISO). Each case uses two CTs for a combined gross output of 464 MW. In the combined cycle a heat recovery steam generator (HRSG) extracts heat from the CT exhaust to power a steam turbine.
The CO2 capture cases consume more extraction steam than the non-capture cases, thus reducing the steam turbine output. In addition, the capture cases have a higher auxiliary load requirement than non-capture cases, which serves to further reduce net plant output.
While the two CTs provide 464 MW gross output in all seven cases, the overall combined cycle gross output ranges from 673 to 748 MW, which results in a range of net output from 494 (Case B5B-Q) to 630 MW (Case B1A). The coal feed rate required to achieve the gross power output is also different between the six cases, ranging from 198,220 to 220,899 kg/hr (437,000 to 487,000 lb/hr).
The balance of this report is organized as follows:
• Chapter 2 provides the basis for technical, environmental, and cost evaluations. • Chapter 3 describes the IGCC technologies modeled and presents the results for the
seven cases. • Chapter 4 includes a record of report revisions.

Cost and Performance Baseline for Fossil Energy Plants Volume 1b: Revision 2b
12
Exhibit 1-1 Case descriptions
Case (Old Case NameA)
Unit Cycle
Steam Cycle, psig/°F/°F
Combustion Turbine
Gasifier Technology Oxidant H2S
Separation Sulfur
Removal PM Control NOx Control
CO2 SeparationB
B1A (5) IGCC 1800/1050/1050 2 x State-of-the-art 2008 F-Class Shell 95 mol%
O2 Sulfinol-M Claus Plant
Cyclone, candle filter, and water scrubber
LNB and N2 dilution
B1B (6) IGCC 1800/1000/1000 2 x State-of-the-art 2008 F-Class Shell 95 mol%
O2 Selexol Claus Plant
Cyclone, candle filter, and water scrubber
LNB and N2 dilution
Selexol 2nd stage
B4A (3) IGCC 1800/1050/1050 2 x State-of-the-art 2008 F-Class CB&I E-Gas™ 95 mol%
O2 Refrigerated
MDEA Claus Plant
Cyclone, candle filter, and water scrubber
LNB and N2 dilution
B4B (4) IGCC 1800/1000/1000 2 x State-of-the-art 2008 F-Class CB&I E-Gas™ 95 mol%
O2 Selexol Claus Plant
Cyclone, candle filter, and water scrubber
LNB and N2 dilution
Selexol 2nd stage
B5A (1) IGCC 1800/1050/1050 2 x State-of-the-art 2008 F-Class GEE Radiant 95 mol%
O2 Selexol Claus Plant
Quench, water scrubber, and AGR adsorber
LNB and N2 dilution
B5B (2) IGCC 1800/1000/1000 2 x State-of-the-art 2008 F-Class GEE Radiant 95 mol%
O2 Selexol Claus Plant
Quench, water scrubber, and AGR adsorber
LNB and N2 dilution
Selexol 2nd stage
B5B-Q (2a) IGCC 1800/1000/1000 2 x State-of-the-art 2008 F-Class GEE Quench 95 mol%
O2 Selexol Claus Plant
Quench, water scrubber, and AGR adsorber
LNB and N2 dilution
Selexol 2nd stage
APrevious versions of this report used a different naming convention. The change was made to provide consistent naming conventions across various baseline reports published by NETL. The old case numbers are provided in parenthesis in this table and are paired with the new case numbers for reference, and will henceforth be referred to exclusively by their current nomenclature. BAll cases have a nominal 90 percent removal rate based on the total feedstock minus unburned carbon in slag. The rate of CO2 capture from the syngas in the Selexol systems varies. An explanation for the difference is provided in Section 2.3.2. All capture cases sequester the CO2 offsite.

Cost and Performance Baseline for Fossil Energy Plants Volume 1b: Revision 2b
13
2 General Evaluation Basis For each of the plant configurations analyzed in this report, an Aspen Plus® (Aspen) model was developed and used to generate material and energy balances, which were, in turn, used to provide a design basis for items in the major equipment list. The equipment list and material balances were used as the basis for generating the capital and operating cost estimates. Performance and process limits were based upon published reports, information obtained from vendors and users of the technology, performance data from design/build utility projects, and/or best engineering judgment. Capital and operating costs were estimated by WorleyParsons based on simulation results using an in-house database and conceptual estimating models. Costs were further calibrated using a combination of adjusted vendor-furnished data and scaled estimates from previous design/build projects. These costs were established in 2007 dollars in prior reports and updated to 2011 dollars in this report. No changes were made to the performance or base cost methods in this update. Ultimately, a COE was calculated for each of the cases and is reported as the revenue requirement figure-of-merit.
The balance of this section discusses the design basis common to all technologies, as well as environmental targets and cost assumptions used in this report. Technology specific design criteria are covered in subsequent chapters.
2.1 Site Characteristics All plants in this report are assumed to be located at a generic plant site in Midwestern United States (U.S.), with site characteristics and ambient conditions as presented in Exhibit 2-1 and Exhibit 2-2. The ambient conditions are the same as ISO conditions.
Exhibit 2-1 Site characteristics
Parameter Value
Location Greenfield, Midwestern U.S.
Topography Level
Size, acres 300
Transportation Rail or Highway
Slag Disposal Off-Site
Water 50% Municipal and 50% Ground Water

Cost and Performance Baseline for Fossil Energy Plants Volume 1b: Revision 2b
14
Exhibit 2-2 Site ambient conditions
Parameter Value
Elevation, (ft) 0
Barometric Pressure, MPa (psia) 0.101 (14.696)
Average Ambient Dry Bulb Temperature, °C (°F) 15 (59)
Average Ambient Wet Bulb Temperature, °C (°F) 10.8 (51.5)
Design Ambient Relative Humidity, % 60
Cooling Water Temperature, °C (°F)A 15.6 (60)
Air composition based on published psychrometric data, mass %
N2 75.055
O2 22.998
Ar 1.280
H2O 0.616
CO2 0.050
Total 100.00
AThe cooling water temperature is the cooling tower cooling water exit temperature. This is set to 8.5°F above ambient wet bulb conditions in ISO cases.
The land area assumes that 30 acres are required for the plant proper, and the balance provides a buffer of approximately 0.25 mi to the fence line. The extra land could also provide for a rail loop if required (rail loop is not included in this report).
In all cases it was assumed that the steam turbine is enclosed in a turbine building. The gasifier is not enclosed.
The following design parameters are considered site-specific and are not quantified for this report. Allowances for normal conditions and construction are included in the cost estimates.
• Flood plain considerations • Existing soil/site conditions • Water discharges and reuse • Rainfall/snowfall criteria • Seismic design • Buildings/enclosures • Local code height requirements • Noise regulations – Impact on site and surrounding area • Other localized environmental concerns • Weather delays

Cost and Performance Baseline for Fossil Energy Plants Volume 1b: Revision 2b
15
2.2 Coal Characteristics The design coal is Illinois No. 6 with characteristics presented in Exhibit 2-3. The coal properties are from the January 2012 revision of the Quality Guidelines for Energy System Studies (QGESS) document “Detailed Coal Specifications.” (7)
Fuel costs used in this report are specified according to the November 2012 QGESS document “Fuel Prices for Selected Feedstocks in NETL Studies.” (8) The current coal price is $2.94/MMBtu (HHV basis) for Illinois No. 6 bituminous coal delivered to the Midwest in June 2011 dollars.
Exhibit 2-3 Design coal
Rank Bituminous Seam Illinois No. 6 (Herrin) Source Old Ben Mine
Proximate Analysis (weight %)A As Received Dry Moisture 11.12 0.00 Ash 9.70 10.91 Volatile Matter 34.99 39.37 Fixed Carbon 44.19 49.72 Total 100.00 100.00 Sulfur 2.51 2.82 HHV, kJ/kg (Btu/lb) 27,113 (11,666) 30,506 (13,126) LHV, Btu/lb (Btu/lb) 26,151 (11,252) 29,544 (12,712)
Ultimate Analysis (weight %) As Received Dry Moisture 11.12 0.00 Carbon 63.75 71.72 Hydrogen 4.50 5.06 Nitrogen 1.25 1.41 Chlorine 0.29 0.33 Sulfur 2.51 2.82 Ash 9.70 10.91 OxygenB 6.88 7.75 Total 100.00 100.00
AThe proximate analysis assumes sulfur as volatile matter BBy difference
The mercury content of 34 samples of Illinois No. 6 coal has an arithmetic mean value of 0.09 ppmwd with standard deviation of 0.06 based on coal samples shipped by Illinois mines. (9) Hence, as illustrated in Exhibit 2-4, there is a 50 percent probability that the mercury content in the Illinois No. 6 coal would not exceed 0.09 ppmwd. The coal mercury content for this report was assumed to be 0.15 ppmwd for all cases, which corresponds to the mean plus one standard deviation and encompasses about 84 percent of the samples. It was further assumed that all of the coal Hg enters the gas phase and none leaves with the slag. (10)

Cost and Performance Baseline for Fossil Energy Plants Volume 1b: Revision 2b
16
Exhibit 2-4 Probability distribution of mercury concentration in the Illinois No. 6 coal
Source: NETL
2.3 Environmental Targets The environmental performance of the IGCC configurations described in this report were determined based upon the IGCC performance capabilities at the time of the plant model development in prior revisions. Since that time, specific environmental targets have been identified that require minimal adjustment to the previously designed systems. The only addition was the use of a dual bed carbon system for mercury (Hg) removal. The current environmental targets for this study are as follows:
• Mercury (Hg) and hydrochloric acid (HCl) limits were set by the March 2013 update to the Utility Mercury and Air Toxics Standards (MATS). (11), (12), (13)
• Particulate matter (PM), sulfur dioxide (SO2), and nitrogen oxide (NOx) limits were set by the February 2013 update to the New Source Performance Standards (NSPS). (13), (14)
The regulations divide the coal types into low rank and non-low rank based on their heating value. Coals with a higher heating value (HHV) of greater than 8,300 Btu per pound (Btu/lb) on a moist, mineral-matter free basis are considered non-low rank. Therefore, Illinois No. 6 coal, with an HHV (moist, mineral-matter free) of 12,900 Btu/lb, is considered a non-low rank coal.
The applicable emission limits imposed by MATS and NSPS are provided in Exhibit 2-5.
Exhibit 2-5 MATS and NSPS emission limits for PM, HCl, SO2, NOx, and Hg
PollutantA (lb/MWh-gross) SO2 0.40 NOx 0.70 PM (Filterable) 0.07 Hg 3x10⁻⁶
HCl 0.002 ACO emissions may be considered in later revisions of this report, if necessary.
0%
10%
20%
30%
40%
50%
60%
70%
80%
90%
100%
0.00 ppm Hg 0.05 ppm Hg 0.10 ppm Hg 0.15 ppm Hg 0.20 ppm Hg 0.25 ppm Hg 0.30 ppm Hg
Mercury Concentraion in Coal, ppm db
Prob
abili
ty Il
linoi
s #6
Sam
ple
Will
Be
At o
r Bel
ow V
alue
Arithmetic Mean = 0.09 ppm dbStandard Deviation = 0.06 ppm db

Cost and Performance Baseline for Fossil Energy Plants Volume 1b: Revision 2b
17
These new regulations apply to IGCC technologies that begin construction after May 3, 2011. Furthermore, these regulations state that (13), (15):
Fossil fuel is defined as natural gas, oil, coal, and any form of solid, liquid, or gaseous fuel derived from such material.
Electric utility steam generating units (EGU) are defined as a fossil fuel-fired combustion unit of more than 25 megawatts electric (MWe) that serves a generator that produces electricity for sale. A fossil fuel-fired unit that cogenerates steam and electricity and supplies more than one-third of its potential electric output capacity and more than 25 MWe output to any utility power distribution system for sale is considered an electric utility steam generating unit. Fossil fuel-fired means an EGU that is capable of combusting more than 25 MW of fossil fuels. To be capable of combusting fossil fuels, an EGU would need to have these fuels allowed in its operating permit and have the appropriate fuel handling facilities on-site or otherwise available (e.g., coal handling equipment, including coal storage area, belts and conveyers, pulverizers, etc.; oil storage facilities). Coal-fired electric utility steam generating units are defined as an EGU and meet the definition of “fossil fuel-fired,” which is that it burns coal for more than 10 percent of the average annual heat input during any three consecutive calendar years or for more than 15 percent of the annual heat input during any one calendar year.
Integrated gasification combined cycle electric utility steam generating units, or IGCCs, are defined as an EGU and meet the definition of “fossil fuel-fired,” which is that it burns a synthetic gas derived from coal and/or solid oil-derived fuel for more than 10 percent of the average annual heat input during any three consecutive calendar years or for more than 15 percent of the annual heat input during any one calendar year in a combined-cycle combustion turbine. No solid coal or solid oil-derived fuel is directly burned in the unit during operation.
Unit designed for low-rank virgin coal subcategory is defined as any coal-fired EGU that is designed to burn, and that is burning, non-agglomerating virgin coal having a calorific value (moist, mineral matter-free basis) of less than 19,305 kJ/kg (8,300 Btu/lb) that is constructed and operates at or near the mine that produces such coal.
Unit designed for coal ≥8,300 Btu/lb subcategory is defined as any coal-fired EGU that is not a coal-fired EGU in the “unit designed for low rank virgin coal” subcategory.
Other regulations that could affect emissions limits from a new plant include the New Source Review (NSR) permitting process and Prevention of Significant Deterioration (PSD). The NSR process requires installation of emission control technology, meeting either the Best Available Control Technology (BACT) determinations for new sources being located in areas meeting ambient air quality standards (attainment areas), or Lowest Achievable Emission Rate (LAER) technology for sources being located in areas not meeting ambient air quality standards (non-attainment areas). Environmental area designation varies by county and can be established only for a specific site location. Based on the Environmental Protection Agency’s (EPA) Green Book Non-attainment Area Map, relatively few areas in the Midwestern U.S. are classified as “non-attainment,” so the plant site for this report was assumed to be in an attainment area. (14)

Cost and Performance Baseline for Fossil Energy Plants Volume 1b: Revision 2b
18
In addition to federal regulations, state and local jurisdictions can impose even more stringent regulations on a new facility. However, since each new plant has unique environmental requirements, it was necessary to apply some judgment in setting the environmental targets for this report.
2.3.1 Study Cases Exhibit 2-6 provides the emissions limits for IGCC plants as well as a brief summary of the control technology utilized to satisfy the limits.
Exhibit 2-6 Environmental targets
Pollutant (lb/MWh-gross) Control Technology
SO2 0.40 Selexol, MDEA, or Sulfinol (depending on gasifier technology)A
NOx 0.70 Low NOx burners and syngas nitrogen dilution
PM (Filterable) 0.07 Quench, water scrubber, and/or cyclones and candle filters (depending on gasifier technology)
Hg 3x10⁻⁶ Dual carbon bed
HCl 0.002 Quench, water scrubber, calcium hydroxide treatment, sour water stripper
AThe sulfur control technologies are used to remove H2S formed in the gasifier to ultimately limit SO2 emissions after the syngas is combusted in the CT.
Based on published vendor literature, it was assumed that low NOx burners (LNB) and nitrogen dilution can achieve 15 ppmvd at 15 percent O2, and that value was used for all cases. (16), (17)
The SO2 limit is met via an acid gas removal (AGR) process. As the emissions limit is based on the gross power production of the plant, the actual removal efficiency is dependent on the net plant efficiency. Therefore, the required AGR H2S removal efficiency varies from 75 to 98 percent in the cases without CO2 capture. Vendor data on the AGR processes used in the non-capture cases indicate that the required level of sulfur removal in each technology is possible. The sulfur removal efficiency of the CO2 capture cases is approximately 99.9 percent. The high rate of H2S removal is a function of the CO2 capture rate requirement (described in Section 2.3.2) of the two-stage Selexol process.
Most of the coal ash is removed from the gasifier as slag. The ash that remains entrained in the syngas is captured in the downstream equipment, including the syngas scrubber, cyclone, and either ceramic or metallic candle filters (E-GasTM and Shell). Each combination of particulate control devices can achieve the environmental target.
The Eastman Chemical plant, where syngas from a GEE gasifier is treated, achieved a mercury removal efficiency of 95 percent. Sulfur-impregnated activated carbon is used by Eastman as the adsorbent in the packed beds operated at 30°C (86°F) and 6.2 MPa (900 psig). Mercury removal between 90 and 95 percent has been reported with a bed life of 18 to 24 months. Removal efficiencies may be even higher, but, at 95 percent, the measurement precision limit was reached. Eastman has yet to experience any mercury contamination in its product. (18) As a mercury removal efficiency of up to 97 percent is required to meet the mercury emissions limit, a dual sulfur-impregnated carbon bed system (i.e., two beds in series) is required, which is capable of achieving greater than 99 percent mercury removal. It was assumed that the mercury removal

Cost and Performance Baseline for Fossil Energy Plants Volume 1b: Revision 2b
19
efficiency is linearly related to bed depth and, therefore, the bed depths were chosen to meet the emission limit.
The hydrochloric acid is removed primarily (approximately 95 percent) in the syngas scrubber. The remaining chloride in the syngas eventually drops out with condensed water downstream. The HCl removed in the syngas scrubber is sent to a treatment plant where calcium hydroxide is used to precipitate calcium chloride as a byproduct. The treated stream is mixed with the condensed water streams and sent to the sour water stripper, where the HCl is separated out with the vapor stream and sent to the Claus plant.
2.3.2 Carbon Dioxide The EPA proposed a new source performance standard on April 13, 2012 for emissions of carbon dioxide for new fossil fuel-fired electric utility generating units. As of the publication of this report, the EPA is finalizing a rule that may set CO2 emissions limits below that of fossil fuel-fired electric utility generation units without CO2 capture.
For the cases that have CO2 capture, the basis is a nominal 90 percent carbon removal rate based on carbon input from the coal and excluding carbon that exits the gasifier with the slag. In the GEE and Shell cases, this was accomplished by using two sour gas shift (SGS) reactors, to convert CO to CO2, and a two-stage Selexol process with a second stage CO2 removal efficiency of 92 percent, a number that was supported by vendor quotes. All gasifiers, except E-GasTM, achieve a nominal carbon removal rate of 90 percent. In the E-GasTM case, in an effort to achieve the capture target of 90 percent, a third SGS reactor was added, and the Selexol efficiency was increased to 95 percent (the maximum removal efficiency supported by vendor quotes). This was done because of the high syngas methane content (1.5 vol% compared to 0.10 vol% in the GEE radiant gasifier and 0.06 vol% in the Shell gasifier). The E-GasTM capture case resulted in 89.9 percent carbon capture.
2.4 Capacity Factor 2.4.1 Capacity Factor Assumptions Availability is the percent of time during a specific period that a generating unit is capable of producing electricity. This report assumes that each new plant would be dispatched any time it is available and would be capable of generating the nameplate capacity when online. Therefore, the capacity factor (CF) and availability are equal. The operating period selected is also important. The calculations assume that the capacity factor and availability are constant over the life of the plant, but in actual operation may require that a plant have a higher peak availability to counter lower availability in the first several years of operation.
2.4.2 Capacity Factor for IGCC Plants The Electric Power Research Institute (EPRI) has reported an availability goal for IGCC plants of 85 percent. (19) Plants built before 2000 have achieved availability of 80 percent for limited periods of time. Common projections from technology suppliers and EPRI are that IGCC plants are capable of 80-85 percent availability without a spare gasifier and could achieve greater than 90 percent availability with a spare gasifier. (20), (21), (22), (23), (24), (25) While an availability of 85 percent is the goal, given the IGCC technology experience and the commercialization status compared with the more conventional plants (e.g., PC), a CF of 80 percent was selected for IGCC plants with no spare gasifier.

Cost and Performance Baseline for Fossil Energy Plants Volume 1b: Revision 2b
20
2.4.3 Capacity Factor for Plants with Carbon Capture The addition of carbon capture adds extra equipment to the power plant. Preliminary reliability analyses show small reductions in reliability if the reliability of the base plant components is kept constant. A solvent-based carbon capture technology is used in this report. The capture and CO2 compression technologies have commercial operating experience with demonstrated ability for high reliability. Given the use of commercial technology, the assumption is made that the capacity factors for a given plant with and without carbon capture are the same. Thus, the capacity factor for IGCC plants with capture is 80 percent.
2.4.4 Perspective Important factors required to achieve the projected IGCC plant availability include a quality plant design that utilizes lessons learned from similar plant designs, a focus on life cycle costs, a smart predictive maintenance, a trained plant staff, and an economic demand for unit power.
Plant availability is determined by the plant technology, the capital cost invested in the plant (e.g., what is the design approach with respect to minimizing scheduled and unplanned maintenance), the maintenance requirements, and the customer requirements for the electricity (e.g., customer costs due to a unit not being available). Since the unavailability cost will decrease with increasing unit availability and the maintenance and capital costs increase with increasing unit availability, there will be optimum economic unit availability for a given application. This report assumes that the plant design, plant maintenance, and electricity demand are consistent with the selected availability.
The existing plant data have not been analyzed with regard to the performance of individual plant availability over the life of the plant. As stated, this report assumes a constant availability of 80 percent for each year over the life of the plant. It is recognized that the availability of a given plant will vary over the life of the plant. As demonstrated by existing plant data, coal plants can be designed and operated with yearly availability ranging from 85-100 percent. It is assumed that the plants in this report will have yearly availability factors above and below the selected value with the effective or levelized availability for the life of the plant being the selected value.
2.5 Raw Water Withdrawal and Consumption A water balance was performed for each case on the major water consumers in the process. The total water demand for each subsystem was determined, and internal recycle water available from various sources like boiler feedwater (BFW) blowdown and condensate from syngas (in CO2 capture cases) was applied to offset the water demand. The difference between demand and recycle is raw water withdrawal. Raw water withdrawal is the water removed from the ground or diverted from a municipal source for use in the plant. Raw water consumption is also accounted for as the portion of the raw water withdrawn that is evaporated, transpired, incorporated into products, or otherwise not returned to the water source from which it was withdrawn.
Raw water makeup was assumed to be provided 50 percent by a publicly owned treatment works (POTW) and 50 percent from groundwater. Raw water withdrawal is defined as the water metered from a raw water source and used in the plant processes for any and all purposes, such as cooling tower makeup, BFW makeup, slurry preparation makeup, syngas humidification, and

Cost and Performance Baseline for Fossil Energy Plants Volume 1b: Revision 2b
21
quench system makeup. The difference between withdrawal and process water returned to the source is consumption. Consumption represents the net impact of the process on the water source.
BFW blowdown and a portion of the sour water stripper blowdown were assumed to be treated and recycled to the cooling tower. The cooling tower blowdown and the balance of the SWS blowdown streams were assumed to be treated and 90 percent returned to the water source with the balance sent to the ash ponds for evaporation.
The largest consumer of raw water in all cases is cooling tower makeup. It was assumed that all cases utilized a mechanical draft, evaporative cooling tower, and all process blowdown streams were assumed to be treated and recycled to the cooling tower. The design ambient wet bulb temperature of 11°C (51.5°F) (Exhibit 2-1 and Exhibit 2-2) was used to achieve a cooling water temperature of 16°C (60°F) using an approach of 5°C (8.5°F). The cooling water range was assumed to be 11°C (20°F). The cooling tower makeup rate was determined using the following (26):
• Evaporative losses of 0.8 percent of the circulating water flow rate per 10°F of range • Drift losses of 0.001 percent of the circulating water flow rate • Blowdown losses (BDL) were calculated as follows:
𝐵𝐵𝐵𝐵𝐵𝐵 = 𝐸𝐸𝐵𝐵
𝐶𝐶𝐶𝐶 − 1
Where: EL – Evaporative Losses CC – Cycles of concentration
The cycles of concentration are a measure of water quality and a mid-range value of four was chosen for this report.
The water balances presented in subsequent sections include the water demand of the major water consumers within the process, the amount provided by internal recycle, the amount of raw water withdrawal by difference, the amount of process water returned to the source, and the raw water consumption, again by difference.
2.6 Cost Estimating Methodology Detailed information pertaining to topics such as contracting strategy, engineering, procurement, and construction (EPC) contractor services, estimation of capital cost contingencies, owner’s costs, cost estimate scope, economic assumptions, finance structures, cost of electricity, etc. are available in the April 2011 revision of the QGESS document “Cost Estimation Methodology for NETL Assessment of Power Plant Performance.” (2) Select portions are repeated in this report for completeness.
Capital Costs:
The capital cost estimates documented in this report reflect an uncertainty range of -15 percent/+30 percent, consistent with Association for the Advancement of Cost Engineering (AACE) Class 4 cost estimates (i.e., feasibility study) (4) (5) (6), based on the level of engineering design performed. In all cases, this report intends to represent the next commercial offering and relies on vendor cost estimates for component technologies. It also applies process

Cost and Performance Baseline for Fossil Energy Plants Volume 1b: Revision 2b
22
contingencies at the appropriate subsystem levels in an attempt to account for expected but undefined costs, which can be a challenge for emerging technologies.
Costs of Emerging Technologies and Designs:
The cost estimates for plant designs that include technologies that are not yet fully mature (e.g., IGCC plants and any plant with CO2 capture) use the same cost estimating methodology as for mature plant designs (e.g., PC and NGCC power plants without CO2 capture), which does not fully account for the unique cost premiums associated with the initial, complex integrations of emerging technologies in a commercial application. Thus, it is anticipated that initial deployments of IGCC plants – both with and without CO2 capture – may incur costs higher than those reflected within this report.
Other Factors:
Actual reported project costs for all of the plant types are also expected to deviate from the cost estimates in this report due to project- and site-specific considerations (e.g., contracting strategy, local labor costs, seismic conditions, water quality, financing parameters, local environmental concerns, weather delays, etc.) that may make construction more costly. Such variations are not captured by the reported cost uncertainty.
Future Cost Trends:
Continuing research, development, and demonstration (RD&D) is expected to result in designs that are more advanced than those assessed by this report, leading to costs that are lower than those estimated herein.
2.6.1 Capital Costs As illustrated in Exhibit 2-7, this report defines capital cost at five levels: BEC, EPCC, TPC, TOC, and TASC. BEC, EPCC, TPC, and TOC are “overnight” costs and are expressed in “base-year” dollars. The base year is the first year of capital expenditure. TASC is expressed in mixed, current-year dollars over the entire capital expenditure period, which is assumed in most NETL studies to last five years for coal plants.
The Bare Erected Cost (BEC) comprises the cost of process equipment, on-site facilities and infrastructure that support the plant (e.g., shops, offices, labs, road), and the direct and indirect labor required for its construction and/or installation. The cost of EPC services and contingencies are not included in BEC. BEC is an overnight cost expressed in base-year dollars.
The Engineering, Procurement and Construction Cost (EPCC) comprises the BEC plus the cost of services provided by the EPC contractor. EPC services include: detailed design, contractor permitting (i.e., those permits that individual contractors must obtain to perform their scopes of work, as opposed to project permitting, which is not included here), and project/construction management costs. EPCC is an overnight cost expressed in base-year dollars.
The Total Plant Cost (TPC) comprises the EPCC plus project and process contingencies. TPC is an overnight cost expressed in base-year dollars.
The Total Overnight Cost (TOC) comprises the TPC plus all other overnight costs, including owner’s costs. TOC is an “overnight” cost, expressed in base-year dollars and as such does not include escalation during construction or interest during construction.

Cost and Performance Baseline for Fossil Energy Plants Volume 1b: Revision 2b
23
The Total As-Spent Cost (TASC) is the sum of all capital expenditures as they are incurred during the capital expenditure period including their escalation. TASC also includes interest during construction. Accordingly, TASC is expressed in mixed, current-year dollars over the capital expenditure period.
Exhibit 2-7 Capital cost levels and their elements
Source: NETL
2.6.1.1 Cost Estimate Basis and Classification The TPC and Operation and Maintenance (O&M) costs for each of the cases in the report were estimated by WorleyParsons using an in-house database and conceptual estimating models. Costs were further calibrated using a combination of adjusted vendor-furnished data and scaled estimates from previous design/build projects.
2.6.1.2 System Code-of-Accounts The costs are grouped according to a process/system oriented code of accounts. This type of code-of-account structure has the advantage of grouping all reasonably allocable components of a system or process so they are included in the specific system account. (This would not be the case had a facility, area, or commodity account structure been chosen instead).
2.6.1.3 Estimate Scope The estimates represent a complete power plant facility on a generic site. The plant boundary limit is defined as the total plant facility within the “fence line” including coal receiving and water supply system, but terminating at the high voltage side of the main power transformers. CO2 T&S cost is not included in the reported capital cost or O&M costs, but is treated separately and added to the COE.
process equipmentsupporting facilities
direct and indirect labor
BECEPCC
TPC
TOC
TASC
EPC contractor services
process contingencyproject contingency
pre-production costsinventory capital
financing costsother owner’s costs
escalation during capital expenditure periodinterest on debt during capital expenditure period
Bare Erected CostEngineering, Procurement
and Construction CostTotal Plant Cost
Total Overnight CostTotal As-Spent Cost
BEC, EPCC, TPC and TOC are all “overnight” costs
expressed in base-year dollars.
TASC is expressed in mixed-year current dollars, spread over the capital expenditure
period.

Cost and Performance Baseline for Fossil Energy Plants Volume 1b: Revision 2b
24
2.6.1.4 Capital Cost Assumptions WorleyParsons developed the capital cost estimates for each plant using the company’s in-house database and conceptual estimating models for each of the specific technologies. This database and the respective models are maintained by WorleyParsons as part of a commercial power plant design base of experience for similar equipment in the company’s range of power and process projects. A reference bottom-up estimate for each major component provides the basis for the estimating models.
Other key estimate considerations include the following:
• Labor costs are based on Midwest, Merit Shop. The estimating models are based on U.S. Gulf Coast and the labor has been factored to Midwest. The basis for the factors is the PAS, Inc. (PAS) “Merit Shop Wage & Benefit Survey,” which is published annually. Based on the data provided in PAS, WorleyParsons used the weighted average payroll plus fringe rate for a standard craft distribution as developed for the estimating models. PAS presents information for eight separate regions. For this report, Region 5 (IL, IN, MI, MN, OH, and WI) was selected.
• The estimates are based on a competitive bidding environment, with adequate skilled craft labor available locally.
• Labor is based on a 50-hour work-week (5-10s). No additional incentives such as per- diem allowances or bonuses have been included to attract craft labor.
• While not included at this time, labor incentives may ultimately be required to attract and retain skilled labor depending on the amount of competing work in the region, and the availability of skilled craft in the area at the time the projects proceed to construction.
• The estimates are based on a greenfield site. • The site is considered to be Seismic Zone 1, relatively level, and free from hazardous
materials, archeological artifacts, or excessive rock. Soil conditions are considered adequate for spread footing foundations. The soil bearing capability is assumed adequate such that piling is not needed to support the foundation loads.
• Engineering and Construction Management are estimated at 8-10 percent of BEC. These costs consist of all home office engineering and procurement services as well as field construction management costs. Site staffing generally includes a construction manager, resident engineer, scheduler, and personnel for project controls, document control, materials management, site safety, and field inspection.
2.6.1.5 Price Fluctuations During the course of this report, the prices of equipment and bulk materials fluctuated substantially. Some reference quotes pre-dated the 2011 year cost basis while others were received post-2011. All vendor quotes used to develop these estimates were adjusted to June 2011 dollars accounting for the price fluctuations. Price indices, e.g., The Chemical Engineering Plant Cost Index (27) and the Gross Domestic Product Chain-type Price Index (28), were used as needed for these adjustments.
2.6.1.6 Cross-comparisons In all technology comparison studies, the relative differences in costs are often more significant than the absolute level of TPC. This requires cross-account comparison between technologies to review the consistency of the direction of the costs.

Cost and Performance Baseline for Fossil Energy Plants Volume 1b: Revision 2b
25
In performing such a comparison, it is important to reference the technical parameters for each specific item, as these are the basis for establishing the costs. Scope or assumption differences can quickly explain any apparent anomalies. There are a number of cases where differences in design philosophy occur. Some key examples are:
• The CT account in the GEE cases includes a syngas expander, which is not required for the E-GasTM or Shell cases.
• The CTs for the capture cases include an additional cost for firing a high hydrogen content fuel.
• The Shell gasifier syngas cooling configuration is different between the CO2-capture and non-CO2-capture cases, resulting in a significant differential in thermal duty between the syngas coolers for the two cases.
2.6.1.6.1 Process Contingency Process contingencies were applied to the estimates in this report as follows:
• Slurry Prep and Feed – 5 percent on GEE cases - systems are operating at approximately 800 psia as compared to 600 psia for the other cases
• Gasifiers and Syngas Coolers – 15 percent on all cases - next-generation commercial offering and integration with the power island
• Two-Stage Selexol – 20 percent on all capture cases - unproven technology at commercial scale in IGCC service
• Mercury Removal – 5 percent on all cases - minimal commercial scale experience in IGCC applications
• CTG – 5 percent on all non-capture cases - syngas firing and ASU integration; 10 percent on all capture cases – high hydrogen firing.
• Instrumentation and Controls – 5 percent on all accounts– integration issues
2.6.1.7 Owner’s Costs Two examples of what could be included in the “other” owner’s costs are rail spur and switch yard costs.
Switch yard costs are dependent on voltage, configuration, number of breakers, layout, and air-insulated vs. gas-insulated. As a rule of thumb, a 345 kV switchyard (air-insulated, ring bus) would cost roughly $850,000 per breaker.
On-site only rails (excludes long runs) would be expected to cost in the range of $850,000 to $950,000 per mile (relatively flat level terrain) plus the costs of any switches/turnouts (approximately $50,000 each) and road crossings (approximately $300 per linear foot).
Additional details and explanation of owner’s costs are available in the April 2011 revision of the QGESS document “Cost Estimation Methodology for NETL Assessment of Power Plant Performance.” (2)
2.6.2 Operation and Maintenance Costs The production costs or operating costs and related maintenance expenses (O&M) pertain to those charges associated with operating and maintaining the power plants over their expected life. These costs include:

Cost and Performance Baseline for Fossil Energy Plants Volume 1b: Revision 2b
26
• Operating labor • Maintenance – material and labor • Administrative and support labor • Consumables • Fuel • Waste disposal • Co-product or by-product credit (that is, a negative cost for any by-products sold)
There are two components of O&M costs; fixed O&M, which is independent of power generation, and variable O&M, which is proportional to power generation. Taxes and insurance are included as fixed O&M costs, totaling 2 percent of the TPC.
2.6.2.1 Operating Labor Operating labor cost was determined based on of the number of operators required for each specific case. The average base labor rate used to determine annual cost is $39.70/hour. The associated labor burden is estimated at 30 percent of the base labor rate.
2.6.2.2 Maintenance Material and Labor Maintenance cost was evaluated on the basis of relationships of maintenance cost to initial capital cost. This represents a weighted analysis in which the individual cost relationships were considered for each major plant component or section.
2.6.2.3 Administrative and Support Labor Labor administration and overhead charges are assessed at a rate of 25 percent of the burdened O&M labor.
2.6.2.4 Consumables The cost of consumables, including fuel, was determined on the basis of individual rates of consumption, the unit cost of each specific consumable commodity, and the plant annual operating hours.
Quantities for major consumables such as fuel and sorbent were taken from technology-specific heat and mass balance diagrams developed for each plant application. Other consumables were evaluated on the basis of the quantity required using reference data.
The quantities for initial fills and daily consumables were calculated on a 100 percent operating capacity basis. The annual cost for the daily consumables was then adjusted to incorporate the annual plant operating basis, or CF.
Initial fills of the consumables, fuels and chemicals, are different from the initial chemical loadings, which are included with the equipment pricing in the capital cost.
2.6.2.5 Waste Disposal Waste quantities and disposal costs were determined/evaluated similarly to the consumables. In this report slag is considered a waste with a disposal cost of $27.80/tonne ($25.11/ton). The carbon used for mercury control is considered a hazardous waste with disposal cost of $1,433/tonne ($1,300/ton).

Cost and Performance Baseline for Fossil Energy Plants Volume 1b: Revision 2b
27
2.6.2.6 Co-Products and By-Products By-product quantities were also determined similarly to the consumables. However, due to the variable marketability of these by-products, specifically sulfur, no credit was taken for its potential salable value.
It should be noted that by-product credits and/or disposal costs could potentially be an additional determining factor in the choice of technology for some companies and in selecting some sites. A high local value of the product can establish whether or not added capital should be included in the plant costs to produce a particular co-product. Slag is a potential by-product in certain markets. As stated above, the slag is considered a waste in this report with a concomitant disposal cost.
2.6.3 CO2 Transport and Storage The cost of CO2 transport and storage (T&S) in a deep saline formation is estimated using the FE/NETL CO2 Transport Cost Model and the FE/NETL CO2 Saline Storage Cost Model. Additional detail on development of these costs is available in the May 2014 revision of the QGESS document “Carbon Dioxide Transport and Storage Costs in NETL Studies.” (29)
T&S costs are reported as first-year costs in $/tonne of CO2, increasing at a nominal rate of 3 percent per year, consistent with the general inflation rate assumed in NETL’s energy systems studies. From the perspective of the CO2 source (e.g., a power plant or other energy conversion facility), these costs are treated as a disposal cost for each tonne of CO2 captured during the assumed 30-year operational period. From the pipeline and storage site’s perspective, this cost represents the minimum price that the operators must charge so that they receive the revenue needed across the 30-year operational period to cover all costs and provide the required internal rate of return on equity (IRROE). All costs are reported in 2011 dollars.
The Transport Cost Model provides cost estimates for the construction and operation of a dedicated pipeline for transporting CO2 from a CO2 source to a CO2 storage site. The pipeline is assumed to be buried in the shallow subsurface and the CO2 along the pipeline is assumed to be at the temperature of the surrounding soil, typically about 50 oF. The CO2 entering the pipeline at the plant gate is assumed to be at a pressure of 2,200 psig and exiting the pipeline at the storage site at a pressure of 1,200 psig. At these pressures, CO2 is a liquid at temperatures from approximately -64°F to 88°F.
It is further assumed that the pipeline is 100 km long (62.1 mi) and transports 3.2 million tonnes of CO2 each year on average or approximately 8,770 tonnes per day on average. The pipeline is designed to operate at 80 percent of its maximum mass flow capacity, so the design maximum daily mass flow rate of CO2 is about 10,960 tonnes/day. The model determines the smallest standard diameter pipe that can transport this mass flow of CO2 the required distance without boosting the pressure. The model also determines the smallest standard diameter pipe that can transport this mass flow of CO2 the required distance assuming boost pumps are placed at equal intervals along the pipeline to boost the pressure from 1,200 psig to 2,200 psig. The model then determines which of these configurations (e.g., no boost pumps, one boost pump, two boost pumps, three boost pumps, etc.) is least expensive. The capital and operating costs used in the model were taken from the open literature. The capital costs for the pipeline are based on capital costs for natural gas pipelines reported in the Oil and Gas Journal with adjustments for the higher pressures used in CO2 pipelines.

Cost and Performance Baseline for Fossil Energy Plants Volume 1b: Revision 2b
28
The financial parameters used in the FE/NETL CO2 Transport Cost Model are:
• Debt to equity ratio: 50%/50% • Nominal interest rate on debt: 4.5%/year • Nominal IRROE: 12% • Escalation rate: 3% • Tax rate: 38% • Project contingency factor of 15%
The FE/NETL CO2 Transport Cost Model determines the first-year break-even price that needs to be charged to transport the CO2 in order to cover all costs including the minimum return on equity. The model uses a weighted average cost of capital methodology in determining the break-even first-year CO2 price. From the perspective of the CO2 source, the break-even price is also the minimum cost of transporting CO2. Transport costs are estimated to be $2.24/tonne in 2011 dollars.
Storage costs are based on the FE/NETL CO2 Saline Storage Cost Model. This model provides detailed cost estimates for the injection and monitoring of CO2 under EPA regulations for Class VI injection wells as well as monitoring and reporting requirements under Subpart RR of the Greenhouse Gas Reporting Rule.
Inputs to the FE/NETL CO2 Saline Storage Cost Model that have a significant influence on cost include financial parameters, timelines for the various stages of storage, and important activities occurring in each stage. The financial parameters include:
• Debt to equity ratio: 45%/55% • Nominal interest rate on debt: 5.5%/year • Nominal IRROE: 12% • Escalation rate: 3% • Financial responsibility requirements for post-injection site care and site closure are met
by pre-funding a modified trust fund over the period of injection operations • Project contingency factor of 15% and process contingency factor of 20%
In the FE/NETL CO2 Saline Storage Cost Model, the sequestration process is divided into six stages. The timelines and important activities impacting costs for these stages are as follows:
• Regional evaluation and initial site selection: 1 year • Site characterization: 3 years; four sites undergo site characterization with one successful
site selected; pore space rights are leased • Permitting: 2 years; drill, test, and complete injection wells • Operations: 30 years; installation of buildings, surface equipment, monitoring wells and
other monitoring equipment; comply with permit requirements; fund modified trust fund to cover financial responsibility requirements for post-injection site care and site closure
• Post-injection site care and site closure: 50 years; continue monitoring, verification and accounting (mega volt-amps [MVA]) per permit; costs are covered by storage site operator’s trust fund
• Long-term stewardship: This stage is not explicitly included in the model; however, the possible financial implication of long-term stewardship is included in the model as a state-sponsored trust fund that the storage operator pays into during operations

Cost and Performance Baseline for Fossil Energy Plants Volume 1b: Revision 2b
29
Due to the variances in the geologic formations that make up saline formations across the U.S., region-specific storage and monitoring costs are developed to correspond to the plant locations used in NETL techno-economic studies of energy conversion facilities. Results from the FE/NETL CO2 Saline Storage Cost Model for storage and monitoring costs were aligned with the NETL studies by taking four generic plant locations and overlaying them with possible sequestration basins from the cost model resulting in the following pairings:
• Midwest plant location – Illinois Basin • Texas plant location – East Texas Basin • North Dakota plant location – Williston Basin • Montana plant location – Powder River Basin
CO2 storage supply-cost curves were developed for each of the 4 basins of interest with the resulting cost for each basin at 25 gigatonnes (Gt) of potential storage shown in Exhibit 2-8. Choosing this point on the supply-cost curves provides a conservative estimate of the storage cost since many decades, if not more than a century, will pass before 25 Gt of CO2 is stored in any of the 4 individual basins. For example, 25 Gt of storage would be sufficient for 125 GW of coal power with 90 percent CO2 capture operating over 30 years.
The far right column of Exhibit 2-8 shows the total T&S costs used in NETL system studies for each plant location rounded to the nearest whole dollar. Only the $11/tonne value is used in this volume of the baseline study report since all cases are located in the Midwest.
Exhibit 2-8 CO2 transport and storage costs
Plant Location Basin Transport
(2011 $/tonne) Storage Cost at 25 Gt
(2011 $/tonne) T&S Value for System StudiesA (2011$/tonne)
Midwest Illinois
2.24
8.69 11 Texas East Texas 8.83 11 North Dakota Williston 13.95 16 Montana Powder River 21.81 24
AThe sum of transport and storage costs is rounded to the nearest dollar
2.6.4 Cost of CO2 Captured and Avoided The cost of captured CO2 represents the minimum CO2 plant gate sales price that will incentivize carbon capture in lieu of a defined reference non-capture plant. The cost of captured CO2 is calculated using the following formula:
𝐶𝐶𝐶𝐶𝐶𝐶𝐶𝐶 𝐶𝐶𝑜𝑜 𝐶𝐶𝐶𝐶2 𝐶𝐶𝐶𝐶𝐶𝐶𝐶𝐶𝐶𝐶𝐶𝐶𝐶𝐶𝐶𝐶 =(𝐶𝐶𝐶𝐶𝐸𝐸𝐶𝐶𝐶𝐶𝐶𝐶 − 𝐶𝐶𝐶𝐶𝐸𝐸𝑁𝑁𝑁𝑁𝑁𝑁 𝐶𝐶𝐶𝐶𝐶𝐶)
𝐶𝐶𝐶𝐶2 𝐶𝐶𝐶𝐶𝐶𝐶𝐶𝐶𝐶𝐶𝐶𝐶𝐶𝐶𝐶𝐶
The cost of CO2 avoided represents the minimum CO2 emissions price, when applied to both the capture and non-capture plant that will incentivize carbon capture in lieu of a defined reference non-capture plant. The cost of CO2 avoided is calculated using the following formula:
𝐶𝐶𝐶𝐶𝐶𝐶𝐶𝐶 𝐶𝐶𝑜𝑜 𝐶𝐶𝐶𝐶2 𝐴𝐴𝐴𝐴𝐶𝐶𝐴𝐴𝐶𝐶𝐶𝐶𝐶𝐶 =(𝐶𝐶𝐶𝐶𝐸𝐸𝐶𝐶𝐶𝐶𝐶𝐶 𝑤𝑤𝑤𝑤𝑤𝑤ℎ 𝑇𝑇&𝐶𝐶 − 𝐶𝐶𝐶𝐶𝐸𝐸𝑁𝑁𝑁𝑁𝑁𝑁 𝐶𝐶𝐶𝐶𝐶𝐶)
𝐶𝐶𝐶𝐶2 𝐸𝐸𝐸𝐸𝐴𝐴𝐶𝐶𝐶𝐶𝐴𝐴𝐶𝐶𝐸𝐸𝐶𝐶𝑁𝑁𝑁𝑁𝑁𝑁 𝐶𝐶𝐶𝐶𝐶𝐶 − 𝐶𝐶𝐶𝐶2 𝐸𝐸𝐸𝐸𝐴𝐴𝐶𝐶𝐶𝐶𝐴𝐴𝐶𝐶𝐸𝐸𝐶𝐶𝐶𝐶𝐶𝐶𝐶𝐶

Cost and Performance Baseline for Fossil Energy Plants Volume 1b: Revision 2b
30
where:
• CCS – the capture plant for which the cost of CO2 captured/avoided is being calculated • Non-CCS – the reference non-capture plant, as described below • COE – the cost of electricity, reported in $/MWh
o The CCS plant includes compression to 2,215 psia o For CO2 Captured, the COE excludes T&S costs o For CO2 Avoided, the COE includes T&S costs
• CO2 Captured – the rate of CO2 captured, reported in tonne/MWh • CO2 Emissions – the rate of CO2 emitted out the stack, reported in tonne/MWh
For today’s greenfield coal with CCS plants, the reference non-capture plant used to calculate the cost of captured and avoided CO2 is a supercritical pulverized coal (SCPC) plant without capture.
2.7 Differences in IGCC Study Cost Estimates Compared to Industry Estimates 2.7.1 Project Scope For this report, the scope of work is generally limited to work inside the project “fence line.” For outgoing power, the scope stops at the high voltage side of the main power transformers.
Some typical examples of items outside the fenceline include:
• New access roads and railroad tracks • Upgrades to existing roads to accommodate increased traffic • Makeup water pipe outside the fence line • Landfill for on-site waste (slag) disposal • Electrical transmission lines & substation
Estimates in this report are based on a generic mid-western greenfield site having “normal” characteristics. Accordingly, the estimates do not address items such as:
• Piles or caissons • Rock removal • Excessive dewatering • Expansive soil considerations • Excessive seismic considerations • Extreme temperature considerations • Hazardous or contaminated soils • Demolition or relocation of existing structures • Leasing of offsite land for parking or laydown • Busing of craft labor to site • Costs of offsite storage
This report is based on a reasonably “standard” plant. Some unusual or extraordinary process equipment that is not included in the analysis are as follows:
• Excessive water treatment equipment

Cost and Performance Baseline for Fossil Energy Plants Volume 1b: Revision 2b
31
• Air-cooled condenser • Automated coal reclaim • Zero liquid discharge equipment • SCR catalyst
This report is based on plant equipment sized for non-capture only; none of the equipment has been sized to accommodate a future conversion to CO2 capture.
2.7.2 Labor This report is based on Merit Shop (non-union) labor. If a project is to use union labor, there is a strong likelihood that overall labor costs will be greater than those estimated in this report.
This report is based on a 50 hour work week, with an adequate local supply of skilled craft labor. No additional incentives such as per-diem allowances or bonuses have been included to attract and retain skilled craft labor.
2.7.3 Contracting Methodology The estimates in this report are based on a competitively bid, multiple subcontract approach, often referred to as Engineering/Procurement/Construction Management (EPCM). Accordingly, the estimates do not include premiums associated with an EPC approach. It is believed that, given current market conditions, the premium charged by an EPC contractor could be as much as 30 percent or more over an EPCM approach.

Cost and Performance Baseline for Fossil Energy Plants Volume 1b: Revision 2b
32
3 IGCC Power Plants Seven IGCC power plant configurations were evaluated, and the results are presented in this section. Each design is based on a market-ready technology that is assumed to be commercially available to support startup.
The seven cases are based on the GEE gasifier, the CB&I E-Gas™ gasifier, and the Shell gasifier, each with and without CO2 capture. As discussed in Section 1, the net output for the seven cases varies because of the constraint imposed by the fixed CT output and the high auxiliary loads imparted by the CO2 capture process.
The CT is based on a state-of-the-art 2008 F-class design. The HRSG/steam turbine cycle varies based on the CT exhaust conditions. Steam conditions are nominally 12.4 MPa/560°C/560°C (1800 psig/1040°F/1040°F) for all of the non-CO2 capture cases and 12.4 MPa/534°C/534°C (1800 psig/994°F/994°F) for all of the CO2 capture cases. The capture cases have a lower main and reheat steam temperature primarily because the turbine firing temperature is reduced to allow for a parts life equivalent to NGCC operation with a high-hydrogen content fuel, which results in a lower turbine exhaust temperature.
The evaluation scope included developing heat and mass balances and estimating plant performance. Equipment lists were developed for each design to support plant capital and operating cost estimates. The evaluation basis details, including site ambient conditions, fuel composition, and environmental targets are provided in Section 2. Section 3.1 covers general information that is common to all of the cases; case-specific information is subsequently presented in Sections 3.2, 3.3, and 3.4.
3.1 IGCC Common Process Areas The cases have process areas, which are common to each plant configuration such as coal receiving and storage, oxygen supply, gas cleanup, power generation, etc. As detailed descriptions of these process areas for each case would be burdensome and repetitious, they are presented in this section for general background information. Where there is case-specific performance information, the performance features are presented in the relevant case sections.
3.1.1 Coal Receiving and Storage The function of the coal receiving and storage system is to unload, convey, prepare, and store the coal delivered to the plant. The scope of the system is from the trestle bottom dumper and coal receiving hoppers up to and including the slide gate valves at the outlet of the coal storage silos. Coal receiving and storage is identical in design for all seven cases; however, coal preparation and feed are gasifier-specific.
Operation Description – The coal is delivered to the site by 100-car unit trains comprised of 91 tonne (100 ton) rail cars. The unloading is done by a trestle bottom dumper, which unloads the coal into two receiving hoppers. Coal from each hopper is fed directly into a vibratory feeder. The 8 cm x 0 (3" x 0) coal from the feeder is discharged onto a belt conveyor. Two conveyors with an intermediate transfer tower are assumed to convey the coal to the coal stacker, which transfer the coal to either the long-term storage pile or to the reclaim area. The conveyor passes under a magnetic plate separator to remove tramp iron and then to the reclaim pile.

Cost and Performance Baseline for Fossil Energy Plants Volume 1b: Revision 2b
33
The reclaimer loads the coal into two vibratory feeders located in the reclaim hopper under the pile. The feeders transfer the coal onto a belt conveyor that transfers the coal to the coal surge bin located in the crusher tower. The coal is reduced in size to 3 cm x 0 (1¼" x 0) by the crusher. A conveyor then transfers the coal to a transfer tower. In the transfer tower the coal is routed to the tripper, which loads the coal into one of three silos. Two sampling systems are supplied: the as-received sampling system and the as-fired sampling system. Data from the analyses are used to support the reliable and efficient operation of the plant.
3.1.2 Air Separation Unit (ASU) Choice and Integration In order to economically and efficiently support IGCC projects, air separation equipment has been modified and improved in response to production requirements and the consistent need to increase single train output. “Elevated pressure” air separation designs have been implemented that result in distillation column operating pressures that are about twice as high as traditional plants. In this report, the main air compressor discharge pressure was set at 1.3 MPa (190 psia) compared to a traditional ASU plant operating pressure of about 0.7 MPa (105 psia). (30) For IGCC designs the elevated pressure ASU process minimizes power consumption and decreases the size of some of the equipment items. When the air supply to the ASU is integrated with the CT, the ASU operates at or near the supply pressure from the CT’s air compressor.
The power requirement for the ASU used in this report is 0.039 kW/lb-O2 product for all cases and the total power requirement, including the oxygen and nitrogen compressors, ranges from 0.064 kW/lb-O2 product in the E-GasTM CO2 capture case (B4B) to 0.072 kW/lb-O2 product in the Shell non-capture case (B1A).
3.1.2.1 Residual Nitrogen Injection The residual nitrogen that is available after gasifier oxygen and nitrogen requirements have been met is often compressed and sent to the CT. Since all product streams are being compressed, the ASU air feed pressure is optimized to reduce the total power consumption and to provide a good match with available compressor frame sizes.
Increasing the diluent flow to the CT by injecting residual nitrogen from the ASU can have a number of benefits, depending on the design of the CT:
• Increased diluent increases mass flow through the turbine, thus increasing the power output of the CT while maintaining optimum firing temperatures for syngas operation. This is particularly beneficial for locations where the ambient temperature and/or elevation are high and the CT would normally operate at reduced output.
• By mixing with the syngas or by being injected directly into the combustor, the diluent nitrogen lowers the firing temperature (relative to natural gas) and reduces the formation of thermal NOx.
In this report, the ASU nitrogen product was used as the primary diluent with a design target of reducing the syngas lower heating value (LHV) to 4.4-4.7 MJ/Nm3 (119-125 Btu/scf). If the amount of available nitrogen was not sufficient to meet this target, additional dilution was provided through syngas humidification; if still more dilution was required, the third option was steam injection.

Cost and Performance Baseline for Fossil Energy Plants Volume 1b: Revision 2b
34
3.1.2.2 Air Integration Integration between the ASU and the CT can be practiced by extracting some, or all, of the ASU’s air requirement from the CT. Medium Btu syngas streams result in a higher mass flow than natural gas to provide the same heat content to the CT. Some CT designs may need to extract air to maintain stable compressor or turbine operation in response to increased fuel flow rates. Other CTs may balance air extraction against injection of all of the available nitrogen from the ASU. The amount of air extracted can also be varied as the ambient temperature changes at a given site to optimize year-round performance.
An important aspect of air-integrated designs is the need to efficiently recover the heat of compression contained in the air extracted from the CT. Extraction air temperature is normally in the range of 399 - 454°C (750 - 850°F) and must be cooled to the last stage main air compressor discharge temperature prior to admission to the ASU. High-level recovery from the extracted air occurs by transferring heat to the nitrogen stream to be injected into the CT with a gas-to-gas heat exchanger.
It was not a goal of this project to optimize the integration of the CT and the ASU, although several papers have shown that providing 25-30 percent of the ASU air from the turbine compressor provides the best balance between maximizing plant output and efficiency without compromising plant availability or reliability. (31), (32)
3.1.2.3 Elevated Pressure ASU Experience in Gasification The Buggenum, Netherlands unit built for Demkolec was the first elevated-pressure, fully integrated ASU to be constructed. It was designed to produce up to 1,796 tonnes/day (1,980 tons per day [tpd]) of 95 percent purity oxygen for a Shell coal-based gasification unit that fuels a Siemens V94.2 CT. In normal operation at the Buggenum plant the ASU receives all of its air supply from and sends all residual nitrogen to the CT. (23)
The Polk County, Florida ASU for the Tampa Electric IGCC is also an elevated-pressure, 95 percent purity oxygen design that provides 1,832 tonnes/day (2,020 tpd) of oxygen to a GEE coal-based gasification unit, which fuels a General Electric 7FA CT. All of the nitrogen produced in the ASU is used in the CT. The original design did not allow for air extraction from the CT. After a CT air compressor failure in January, 2005, a modification was made to allow air extraction, which in turn eliminated a bottleneck in ASU capacity and increased overall power output. (33)
3.1.2.4 ASU Basis For this report, air integration is used for the non-carbon capture cases only. In the CO2 capture cases, once the syngas is diluted to the target heating value, all of the available combustion air is required to maintain mass flow through the turbine and hence maintain power output.
The amount of air extracted from the CT in the non-capture cases is determined through a process that includes the following constraints:
• The output of each CT must be maintained at 232 MW • The diluted syngas must meet heating value requirements specified by a CT vendor,
which ranged from 4.4-4.7 MJ/Nm3 (119-125 Btu/scf)

Cost and Performance Baseline for Fossil Energy Plants Volume 1b: Revision 2b
35
Meeting the above constraints resulted in different levels of air extraction in the three non-carbon capture cases as shown in Exhibit 3-1.
Exhibit 3-1 Air extracted from the combustion turbine and supplied to the ASU in non-carbon capture cases
Case No. B1A B4A B5A Gasifier Shell E-GasTM GEE Air Extracted from Combustion Turbine, % 4.0 4.0 4.0 Air Provided to ASU, % of ASU Total 19.4 18.9 16.8
3.1.2.5 Air Separation Plant Process Description The air separation plant is designed to produce 95 percent by volume O2 for use in the gasifier and Claus plant. The ASU is designed with two production trains, one for each gasifier. The air compressor is powered by an electric motor. Nitrogen, containing less than 2 percent by volume of O2, is recovered, compressed, and used as a diluent in the CT combustor. A process schematic of a typical ASU is shown in Exhibit 3-2. (34)
The air feed to the ASU is supplied from two sources. A portion of the air is extracted from the compressor of the CT (non-CO2 capture cases only). The remaining air is supplied from a stand-alone compressor. Air to the stand-alone compressor is first filtered in a suction filter upstream of the compressor. This air filter removes particulate, which may tend to cause compressor wheel erosion and foul intercoolers. The filtered air is then compressed in the centrifugal compressor, with intercooling and aftercooling.

Cost and Performance Baseline for Fossil Energy Plants Volume 1b: Revision 2b
36
Exhibit 3-2 Typical ASU process schematic
Source: NETL
Air from the stand-alone compressor is combined with the extraction air, and the combined stream is cooled and fed to an adsorbent-based pre-purifier system. The adsorbent removes water, CO2, and C4+ saturated hydrocarbons in the air. After passing through the adsorption beds, the air is filtered with a dust filter to remove any adsorbent fines that may be present. Downstream of the dust filter a small stream of air is withdrawn to supply the instrument air requirements of the ASU.
Regeneration of the adsorbent in the pre-purifiers is accomplished by passing a hot nitrogen stream through the off-stream bed(s) in a direction counter current to the normal airflow. The nitrogen is heated against extraction steam (1.7 MPa [250 psia]) in a shell and tube heat exchanger. (34) The regeneration nitrogen drives off the adsorbed contaminants. Following regeneration, the heated bed is cooled to near normal operating temperature by passing a cool nitrogen stream through the adsorbent beds. The bed is re-pressurized with air and placed on stream so that the current on-stream bed(s) can be regenerated.
The air from the pre-purifier is then split into three streams. About 70 percent of the air is fed directly to the cold box. About 25 percent of the air is compressed in an air booster compressor. This boosted air is then cooled in an aftercooler against cooling water in the first stage and against chilled water in the second stage before it is fed to the cold box. The chiller utilizes low-pressure (LP) process steam at 0.3 MPa (50 psia) to drive the absorption refrigeration cycle. The

Cost and Performance Baseline for Fossil Energy Plants Volume 1b: Revision 2b
37
remaining five percent of the air is fed to a turbine-driven, single-stage, centrifugal booster compressor. This stream is cooled in a shell and tube aftercooler against cooling water before it is fed to the cold box. (34)
All three air feeds are cooled in the cold box to cryogenic temperatures against returning product oxygen and nitrogen streams in plate-and-fin heat exchangers. The large air stream is fed directly to the first distillation column to begin the separation process. The second largest air stream is liquefied against boiling liquid oxygen before it is fed to the distillation columns. The third, smallest air stream is fed to the cryogenic expander to produce refrigeration to sustain the cryogenic separation process.
Inside the cold box the air is separated into oxygen and nitrogen products. The oxygen product is withdrawn from the distillation columns as a liquid and is pressurized by a cryogenic pump. The pressurized liquid oxygen is then vaporized against the high-pressure (HP) air feed before being warmed to ambient temperature. The gaseous oxygen exits the cold box and is fed to the centrifugal compressor with intercooling between each stage of compression. The compressed oxygen is then fed to the gasification unit.
Nitrogen is produced from the cold box at two pressure levels. LP nitrogen is split into two streams. The majority of the LP nitrogen is compressed and fed to the CT as diluent nitrogen. A small portion of the nitrogen is used as the regeneration gas for the pre-purifiers and recombined with the diluent nitrogen. A HP nitrogen stream is also produced from the cold box and is further compressed before it is also supplied to the CT.
3.1.3 Water Gas Shift Reactors Selection of Technology In the cases with CO2 separation and capture, the gasifier product must be converted to hydrogen-rich syngas. The first step is to convert most of the syngas CO to CO2 by reacting the CO with water over a bed of catalyst, producing hydrogen (H2) as a byproduct. The H2O:CO molar ratio in the shift reaction, shown below, is adjusted to approximately 2:1 by the addition of steam to the syngas stream thus promoting a high conversion of CO. In the cases without CO2 separation and capture, CO shift convertors are not required.
Water Gas Shift: CO + H2O ↔ CO2 + H2
The CO shift converter can be located either upstream of the AGR step (sour gas shift) or immediately downstream (sweet gas shift). If the CO converter is located downstream of the AGR, then the metallurgy of the unit is less stringent but additional equipment must be added to the process. This is because the CO converter promotes carbonyl sulfide (COS) hydrolysis without a separate catalyst bed. Products from the gasifier are humidified with steam or water and contain a portion of the water vapor necessary to meet the water-to-gas criteria at the reactor inlet. If the CO converter is located downstream of the AGR, then the gasifier product would first have to be cooled and the free water separated and treated. Then additional steam would have to be generated and re-injected into the CO converter feed to meet the required water-to-gas ratio. Therefore, for this report the CO converter was located upstream of the AGR unit and is referred to as SGS.
Process Description - The SGS consists of two paths of parallel fixed-bed reactors arranged in series. Two reactors in series are used in each parallel path to achieve sufficient conversion to

Cost and Performance Baseline for Fossil Energy Plants Volume 1b: Revision 2b
38
meet the 90 percent carbon capture target. In the E-GasTM case, a third shift reactor is added to each path to increase the CO conversion because of the relatively high amount of CH4 present in the syngas. With the third reactor added, carbon capture is 89.9 percent in the E-GasTM case.
Cooling is provided between the series of reactors to control the exothermic temperature rise. The parallel set of reactors is required due to the high gas mass flow rate. In all three CO2 capture cases the heat exchanger after the first SGS reactor is used to vaporize water that is then used to adjust the syngas H2O:CO ratio to 2:1 on a molar basis. The heat exchanger after the second SGS reactor is used to raise intermediate-pressure (IP) steam, which then passes through the reheater (RH) section of the HRSG in the GEE and E-GasTM cases, and is used to preheat the syngas prior to the first SGS reactor in the Shell case. Approximately 97 percent conversion of the CO is achieved in the GEE and Shell cases, and about 98 percent conversion is achieved in the E-GasTM case.
3.1.4 Mercury Removal An IGCC power plant has the potential of removing mercury in a more simple and cost-effective manner than conventional plants (e.g., PC). This is because mercury can be removed from the syngas at elevated pressure and prior to combustion where syngas volumes are much smaller than combusted flue gas volumes in conventional plants. A conceptual design for a sulfur-impregnated, activated carbon bed adsorption system was developed for mercury control. Data on the performance of carbon bed systems were obtained from the Eastman Chemical Company, which uses carbon beds at its syngas facility in Kingsport, Tennessee. (18) The coal mercury content (0.15 ppm dry) and carbon bed removal efficiency (greater than 99 percent) were discussed previously in Sections 2.2 and 2.3, respectively.
Carbon Bed Location – The packed carbon bed vessels are located upstream of the sulfur recovery unit (SRU) and syngas enters at a temperature near 38°C (100°F). Consideration was given to locating the beds further upstream before the COS hydrolysis unit (in non-CO2 capture cases) at a temperature near 204°C (400°F). However, while the mercury removal efficiency of carbon has been found to be relatively insensitive to pressure variations, temperature adversely affects the removal efficiency. (35) Eastman Chemical also operates their beds ahead of their SRU at a temperature of 30°C (86°F). (18)
Consideration was also given to locating the beds downstream of the SRU. However, it was felt that removing the mercury and other contaminants before the SRU would enhance the performance of the SRU and increase the life of the various solvents.
Process Parameters – An empty vessel basis gas residence time of approximately 20 seconds was used based on Eastman Chemical’s experience. (18) Allowable gas velocities are limited by considerations of particle entrainment, bed agitation, and pressure drop. One-foot-per-second superficial velocity is in the middle of the range normally encountered (35) and was selected for this application.
The bed density of 30 lb/ft3 was based on the Calgon Carbon Corporation HGR-P sulfur-impregnated pelletized activated carbon. (36) These parameters determined the size of the vessels and the amount of carbon required. Each gasifier train has two mercury removal beds and there are two gasifier trains in each case, resulting in four carbon beds per case.
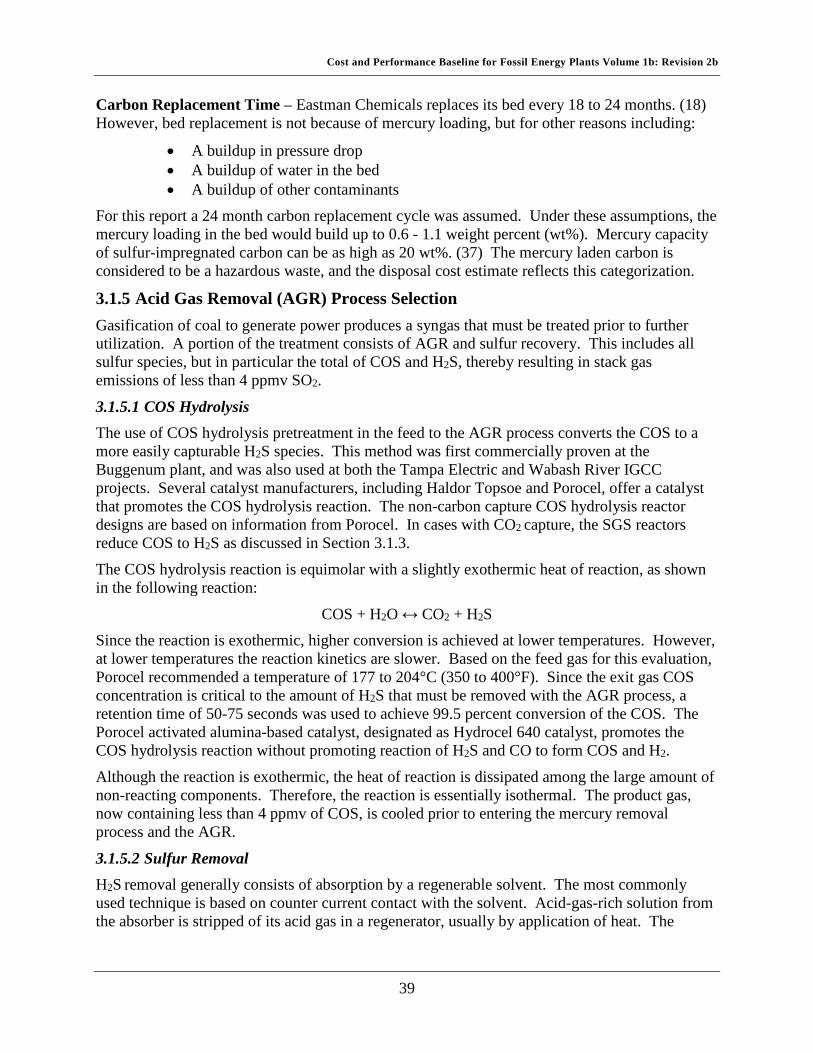
Cost and Performance Baseline for Fossil Energy Plants Volume 1b: Revision 2b
39
Carbon Replacement Time – Eastman Chemicals replaces its bed every 18 to 24 months. (18) However, bed replacement is not because of mercury loading, but for other reasons including:
• A buildup in pressure drop • A buildup of water in the bed • A buildup of other contaminants
For this report a 24 month carbon replacement cycle was assumed. Under these assumptions, the mercury loading in the bed would build up to 0.6 - 1.1 weight percent (wt%). Mercury capacity of sulfur-impregnated carbon can be as high as 20 wt%. (37) The mercury laden carbon is considered to be a hazardous waste, and the disposal cost estimate reflects this categorization.
3.1.5 Acid Gas Removal (AGR) Process Selection Gasification of coal to generate power produces a syngas that must be treated prior to further utilization. A portion of the treatment consists of AGR and sulfur recovery. This includes all sulfur species, but in particular the total of COS and H2S, thereby resulting in stack gas emissions of less than 4 ppmv SO2.
3.1.5.1 COS Hydrolysis The use of COS hydrolysis pretreatment in the feed to the AGR process converts the COS to a more easily capturable H2S species. This method was first commercially proven at the Buggenum plant, and was also used at both the Tampa Electric and Wabash River IGCC projects. Several catalyst manufacturers, including Haldor Topsoe and Porocel, offer a catalyst that promotes the COS hydrolysis reaction. The non-carbon capture COS hydrolysis reactor designs are based on information from Porocel. In cases with CO2 capture, the SGS reactors reduce COS to H2S as discussed in Section 3.1.3.
The COS hydrolysis reaction is equimolar with a slightly exothermic heat of reaction, as shown in the following reaction:
COS + H2O ↔ CO2 + H2S Since the reaction is exothermic, higher conversion is achieved at lower temperatures. However, at lower temperatures the reaction kinetics are slower. Based on the feed gas for this evaluation, Porocel recommended a temperature of 177 to 204°C (350 to 400°F). Since the exit gas COS concentration is critical to the amount of H2S that must be removed with the AGR process, a retention time of 50-75 seconds was used to achieve 99.5 percent conversion of the COS. The Porocel activated alumina-based catalyst, designated as Hydrocel 640 catalyst, promotes the COS hydrolysis reaction without promoting reaction of H2S and CO to form COS and H2.
Although the reaction is exothermic, the heat of reaction is dissipated among the large amount of non-reacting components. Therefore, the reaction is essentially isothermal. The product gas, now containing less than 4 ppmv of COS, is cooled prior to entering the mercury removal process and the AGR.
3.1.5.2 Sulfur Removal H2S removal generally consists of absorption by a regenerable solvent. The most commonly used technique is based on counter current contact with the solvent. Acid-gas-rich solution from the absorber is stripped of its acid gas in a regenerator, usually by application of heat. The

Cost and Performance Baseline for Fossil Energy Plants Volume 1b: Revision 2b
40
regenerated lean solution is then cooled and recirculated to the top of the absorber, completing the cycle. Exhibit 3-3 is a simplified diagram of the AGR process. (38)
Exhibit 3-3 Flow diagram for a conventional AGR unit
Source: NETL
There are well over 30 AGR processes in common commercial use throughout the oil, chemical, and natural gas industries. However, in a 2002 report by SFA Pacific a list of 42 operating and planned gasifiers shows that only six AGR processes are represented: Rectisol, Sulfinol, MDEA, Selexol, aqueous di-isoproponal (ADIP) amine, and FLEXSORB. (39) These processes can be separated into three general types: chemical reagents, physical solvents, and hybrid solvents.
3.1.5.3 AGR/Gasifier Pairings used in Non-capture Cases There are numerous commercial AGR processes that could meet the sulfur environmental target of this report. The most frequently used AGR systems (Selexol, Sulfinol, MDEA, and Rectisol) have all been used with the Shell and GEE gasifiers in various applications. Both existing E-GasTM gasifiers use MDEA, but could in theory use any of the existing AGR technologies. (38) The following selections were made for the AGR process in non-CO2 capture cases:
• GEE gasifier: Selexol was chosen based on the GE gasifier operating at the highest pressure (815 psia versus 615 psia for E-GasTM and Shell), which favors the physical solvent used in the Selexol process.
• E-GasTM gasifier: Refrigerated MDEA was chosen because the two operating E-GasTM gasifiers use MDEA and because Chicago Bridge & Iron Company (CB&I) lists MDEA as the selected AGR process on their website. (39) Refrigerated MDEA was chosen over conventional MDEA because the sulfur emissions environmental target chosen is just outside of the range of conventional (higher temperature) MDEA.
Treated Gas
Cooler
Lean Solvent
L/R Exchanger
Rich Solvent
Absorber
Lean SolventPump
Reboiler
Stripper
Acid Gas
Condenser
Feed Gas
Treated Gas
Cooler
Lean Solvent
L/R Exchanger
Rich Solvent
Absorber
Lean SolventPump
Reboiler
Stripper
Acid Gas
Condenser
Feed Gas

Cost and Performance Baseline for Fossil Energy Plants Volume 1b: Revision 2b
41
• Shell gasifier: The Sulfinol process was chosen for this case because it is a Shell owned technology. While the Shell gasifier can and has been used with other AGR processes, it was concluded the most likely pairing would be with the Sulfinol process.
The two-stage Selexol process is used in all three cases that require CO2 capture. According to the previously referenced SFA Pacific report, “For future IGCC with CO2 removal for sequestration, a two-stage Selexol process presently appears to be the preferred AGR process – as indicated by ongoing engineering studies at EPRI and by various engineering firms with IGCC interests.” (40)
3.1.5.4 AGR used in CO2 Capture Cases This section provides a brief process description of the two-stage selexol process used for capture cases.
Syngas enters the first of two absorbers where H2S is preferentially removed using loaded solvent from the CO2 absorber. The gas exiting the H2S absorber passes through the second absorber where CO2 is removed using first flash regenerated, chilled solvent followed by thermally regenerated solvent added near the top of the column. The treated gas exits the absorber and is sent either directly to the CT or is partially humidified prior to entering the CT. A portion of the gas can also be used for coal drying, when required.
The amount of hydrogen recovered from the syngas stream is dependent on the Selexol process design conditions. In this report, hydrogen recovery is 99.4 percent. The minimal hydrogen slip to the CO2 sequestration stream maximizes the overall plant efficiency. The Selexol plant cost estimates are based on a plant designed to recover this high percentage of hydrogen.
The CO2 loaded solvent exits the CO2 absorber. A portion is sent to the H2S absorber, a portion is sent to a reabsorber, and the remainder is sent to a series of flash drums for regeneration. The CO2 product stream is obtained from the three flash drums. After flash regeneration, the solvent is chilled and returned to the CO2 absorber.
The rich solvent exiting the H2S absorber is combined with the rich solvent from the reabsorber, and the combined stream is heated using the lean solvent from the stripper. The hot, rich solvent enters the H2S concentrator and partially flashes. The remaining liquid contacts nitrogen from the ASU, and a portion of the CO2 along with lesser amounts of H2S and COS are stripped from the rich solvent. The stripped gases from the H2S concentrator are sent to the reabsorber where the H2S and COS that were co-stripped in the concentrator are transferred to a stream of loaded solvent from the CO2 absorber. The clean gas from the reabsorber is combined with the clean gas from the H2S absorber and sent to the CT.
The solvent exiting the H2S concentrator is sent to the stripper where the absorbed gases are liberated by hot gases flowing up the column from the steam heated reboiler. Water in the overhead vapor from the stripper is condensed and returned as reflux to the stripper or exported as necessary to maintain the proper water content of the lean solvent. The acid gas from the stripper is sent to the Claus plant for further processing. The lean solvent exiting the stripper is first cooled by providing heat to the rich solvent, then further cooled by exchange with the product gas and finally chilled in the lean chiller before returning to the top of the CO2 absorber.
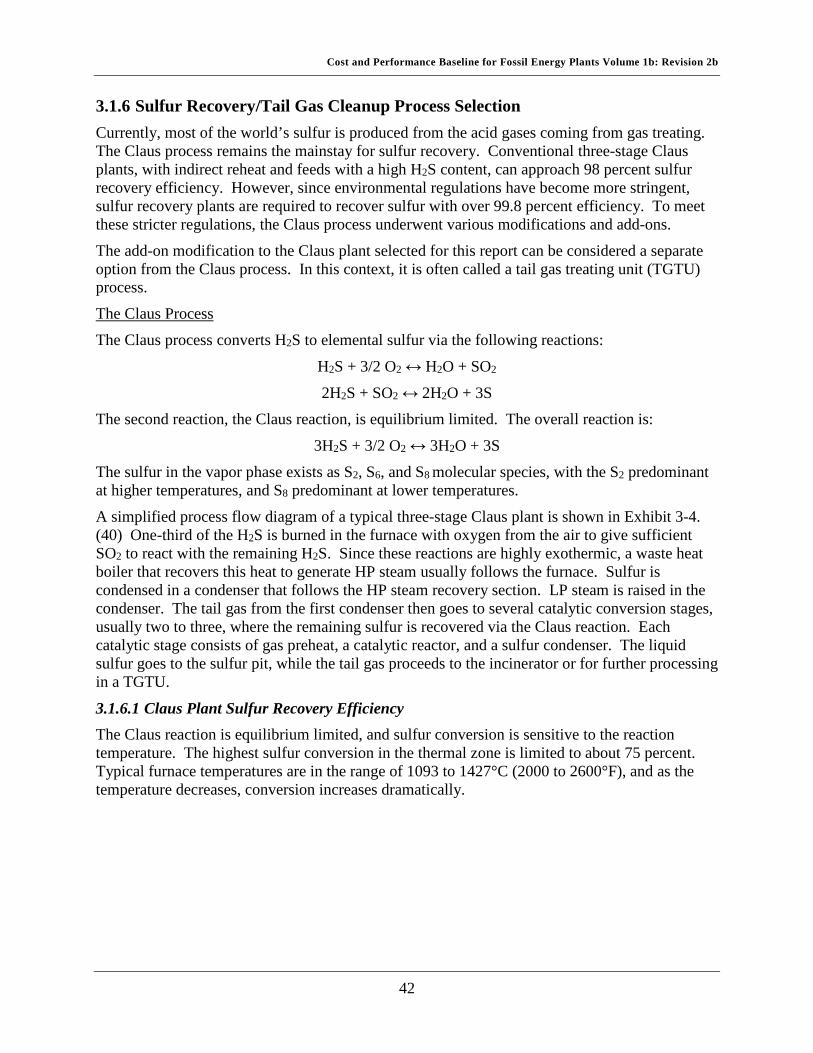
Cost and Performance Baseline for Fossil Energy Plants Volume 1b: Revision 2b
42
3.1.6 Sulfur Recovery/Tail Gas Cleanup Process Selection Currently, most of the world’s sulfur is produced from the acid gases coming from gas treating. The Claus process remains the mainstay for sulfur recovery. Conventional three-stage Claus plants, with indirect reheat and feeds with a high H2S content, can approach 98 percent sulfur recovery efficiency. However, since environmental regulations have become more stringent, sulfur recovery plants are required to recover sulfur with over 99.8 percent efficiency. To meet these stricter regulations, the Claus process underwent various modifications and add-ons.
The add-on modification to the Claus plant selected for this report can be considered a separate option from the Claus process. In this context, it is often called a tail gas treating unit (TGTU) process.
The Claus Process
The Claus process converts H2S to elemental sulfur via the following reactions:
H2S + 3/2 O2 ↔ H2O + SO2
2H2S + SO2 ↔ 2H2O + 3S The second reaction, the Claus reaction, is equilibrium limited. The overall reaction is:
3H2S + 3/2 O2 ↔ 3H2O + 3S
The sulfur in the vapor phase exists as S2, S6, and S8 molecular species, with the S2 predominant at higher temperatures, and S8 predominant at lower temperatures.
A simplified process flow diagram of a typical three-stage Claus plant is shown in Exhibit 3-4. (40) One-third of the H2S is burned in the furnace with oxygen from the air to give sufficient SO2 to react with the remaining H2S. Since these reactions are highly exothermic, a waste heat boiler that recovers this heat to generate HP steam usually follows the furnace. Sulfur is condensed in a condenser that follows the HP steam recovery section. LP steam is raised in the condenser. The tail gas from the first condenser then goes to several catalytic conversion stages, usually two to three, where the remaining sulfur is recovered via the Claus reaction. Each catalytic stage consists of gas preheat, a catalytic reactor, and a sulfur condenser. The liquid sulfur goes to the sulfur pit, while the tail gas proceeds to the incinerator or for further processing in a TGTU.
3.1.6.1 Claus Plant Sulfur Recovery Efficiency The Claus reaction is equilibrium limited, and sulfur conversion is sensitive to the reaction temperature. The highest sulfur conversion in the thermal zone is limited to about 75 percent. Typical furnace temperatures are in the range of 1093 to 1427°C (2000 to 2600°F), and as the temperature decreases, conversion increases dramatically.

Cost and Performance Baseline for Fossil Energy Plants Volume 1b: Revision 2b
43
Exhibit 3-4 Typical three-stage Claus sulfur plant
Source: Milton Beychok (41)
Claus plant sulfur recovery efficiency depends on many factors:
• H2S concentration of the feed gas • Number of catalytic stages • Gas reheat method
In order to keep Claus plant recovery efficiencies approaching 94 to 96 percent for feed gases that contain about 20 to 50 percent H2S, a split-flow design is often used. In this version of the Claus plant, part of the feed gas is bypassed around the furnace to the first catalytic stage, while the rest of the gas is oxidized in the furnace to mostly SO2. This results in a more stable temperature in the furnace.
3.1.6.2 Oxygen-Blown Claus Large diluent streams in the feed to the Claus plant, such as N2 from combustion air, or a high CO2 content in the feed gas, lead to higher cost Claus processes and any add-on or tail gas units. One way to reduce diluent flows through the Claus plant and to obtain stable temperatures in the furnace for dilute H2S streams is the oxygen-blown Claus process.
The oxygen-blown Claus process was originally developed to increase capacity at existing conventional Claus plants and to increase flame temperatures of low H2S content gases. The process has also been used to provide the capacity and operating flexibility for sulfur plants where the feed gas is variable in flow and composition such as often found in refineries. The application of the process has now been extended to grass roots installations, even for rich H2S feed streams, to provide operating flexibility at lower costs than would be the case for conventional Claus units. At least four of the gasification plants in Europe use oxygen enriched Claus units.
Oxygen enrichment results in higher temperatures in the front-end furnace, potentially reaching temperatures as high as 1593 to 1649°C (2900 to 3000°F) as the enrichment moves beyond 40 to 70 vol% O2 in the oxidant feed stream. Although oxygen enrichment has many benefits, its

Cost and Performance Baseline for Fossil Energy Plants Volume 1b: Revision 2b
44
primary benefit for lean H2S feeds is a stable furnace temperature. Sulfur recovery is not significantly enhanced by oxygen enrichment. Because the IGCC process already requires an ASU, the oxygen-blown Claus plant was chosen for all cases.
3.1.6.3 Tail Gas Treating In many refinery and other conventional Claus applications, tail gas treating involves the removal of the remaining sulfur compounds from gases exiting the SRU. Tail gas from a typical Claus process, whether a conventional Claus or one of the extended versions of the process, usually contains small but varying quantities of COS, CS2, H2S, SO2, and elemental sulfur vapors. In addition, there may be H2, CO, and CO2 in the tail gas. In order to remove the rest of the sulfur compounds from the tail gas, all of the sulfur-bearing species must first be converted to H2S. Then, the resulting H2S is absorbed into a solvent and the clean gas vented or recycled for further processing. The clean gas resulting from the hydrolysis step can undergo further cleanup in a dedicated absorption unit or be integrated with an upstream AGR unit. The latter option is particularly suitable with physical absorption solvents. The approach of treating the tail gas in a dedicated amine absorption unit and recycling the resulting acid gas to the Claus plant is the one used by the Shell Claus Off-gas Treating (SCOT) process. With tail gas treatment, Claus plants can achieve overall removal efficiencies in excess of 99.9 percent.
In the case of IGCC applications, the tail gas from the Claus plant can be catalytically hydrogenated and then recycled back into the system with the choice of location being technology dependent, or it can be treated with a SCOT-type process. In each of the seven cases the Claus plant tail gas is hydrogenated, water is separated, the tail gas is compressed and then returned to the AGR process for further treatment.
3.1.6.4 Flare Stack A self-supporting, refractory-lined, carbon steel (CS) flare stack is typically provided to combust and dispose of unreacted gas during startup, shutdown, and upset conditions. However, in all seven cases a flare stack was provided for syngas dumping during startup, shutdown, etc. This flare stack eliminates the need for a separate Claus plant flare.
3.1.7 Slag Handling The slag handling system conveys, stores, and disposes of slag removed from the gasification process. Spent material drains from the gasifier bed into a water bath in the bottom of the gasifier vessel. A slag crusher receives slag from the water bath and grinds the material into pea-sized fragments. A slag/water slurry that is between 5 and 10 percent solids leaves the gasifier pressure boundary through either a proprietary pressure letdown device (E-GasTM) or through the use of lockhoppers (GEE and Shell) to a series of dewatering bins.
The general aspects of slag handling are the same for all three technologies. The slag is dewatered, the water is clarified and recycled, and the dried slag is transferred to a storage area for disposal. The specifics of slag handling vary among the gasification technologies regarding how the water is separated and the end uses of the water recycle streams.
In this report the slag bins were sized for a nominal holdup capacity of 72 hours of full-load operation. At periodic intervals, a convoy of slag-hauling trucks will transit the unloading station underneath the hopper and remove a quantity of slag for disposal. Approximately ten truckloads per day are required to remove the total quantity of slag produced by the plant

Cost and Performance Baseline for Fossil Energy Plants Volume 1b: Revision 2b
45
operating at nominal rated power. While the slag is suitable for use as a component of road paving mixtures, it was assumed in this report that the slag would be landfilled at a specified cost.
3.1.8 Power Island 3.1.8.1 Combustion Turbine The CT generator selected for this application is representative of the state-of-the-art 2008 F-class turbines. This machine is an axial flow, single spool, and constant speed unit, with variable inlet guide vane (IGV). The turbine includes advanced bucket cooling techniques, compressor aerodynamic design and advanced alloys, enabling a higher firing temperature than the previous generation machines. The standard production version of this machine is fired with natural gas and is also commercially offered for use with IGCC derived syngas, although only earlier versions of the turbine are currently operating on syngas. For the purposes of this report, it was assumed that the state-of-the-art 2008 F-class turbine will be commercially available for use on both conventional and high hydrogen content syngas representative of the cases with CO2 capture. High H2 fuel combustion issues like flame stability, flashback, and NOx formation were assumed to be solved in the time frame needed to support deployment. However, because these are FOAK applications, process contingencies were included in the cost estimates as described in Section 2.6. Performance typical of a state-of-the-art 2008 F-class turbine on natural gas at ISO conditions is presented in Exhibit 3-5.
Exhibit 3-5 State-of-the-art 2008 F-class combustion turbine performance characteristics using natural gas (42)
State-of-the-art 2008 F-Class
Firing Temperature Class, °C (°F) 1,371+ (2,500+)
Airflow, kg/s (lb/s) 431 (950)
Pressure Ratio 18.5
Simple Cycle Output, MW 185
Combined cycle performance
Net Output, MW 280
Net Efficiency (LHV), % 57.5
Net Heat Rate (LHV), kJ/kWh (Btu/kWh) 6,256 (5,934)
In this service, with syngas from an IGCC plant, the machine requires some modifications to the burner and turbine nozzles in order to properly combust the low-Btu gas and expand the combustion products in the turbine section of the machine.
The modifications to the machine include a redesign of the original can-annular combustors. A second modification involves increasing the nozzle areas of the turbine to accommodate the mass and volume flow of low-Btu fuel gas combustion products, which are increased relative to those produced when firing natural gas. Other modifications include rearranging the various auxiliary skids that support the machine to accommodate the spatial requirements of the plant’s general arrangement. The generator is a standard hydrogen-cooled machine with static exciter.

Cost and Performance Baseline for Fossil Energy Plants Volume 1b: Revision 2b
46
3.1.8.2 Combustion Turbine Package Scope of Supply The CT is typically supplied in several fully shop-fabricated modules, complete with all mechanical, electrical, and control systems as required for CT operation. Site CT installation involves module inter-connection, and linking CT modules to the plant systems.
3.1.8.3 CT Firing Temperature Control Issue for Low Calorific Value Fuel A CT when fired on LCV syngas has the potential to increase power output due to the increase in flow rate through the turbine. The higher turbine flow and moisture content of the combustion products can contribute to overheating of turbine components, affect rating criteria for the parts lives, and require a reduction in syngas firing temperatures (compared to the natural gas firing) to maintain design metal temperature. (43) Uncontrolled syngas firing temperature could result in more than 50 percent life cycle reduction of stage 1 buckets. Control systems for syngas applications include provisions to compensate for these effects by maintaining virtually constant generation output for the range of the specified ambient conditions. IGVs and firing temperature are used to maintain the turbine output at the maximum torque rating, producing a flat rating up to the IGV full open position. Beyond the IGV full open position, flat output may be extended to higher ambient air temperatures by steam/nitrogen injection.
In this report the firing temperature (defined as inlet rotor temperature) in the non-capture cases is 1333-1343°C (2432-2449°F) and in the CO2 capture cases is 1317-1322°C (2402-2412°F). The reduction in firing temperature in the CO2 capture cases is done to maintain parts life as the H2O content of the combustion products increases from 6-9 vol% in the non-capture cases to 12-14 vol% in the capture cases. The decrease in temperature also results in the lower temperature steam cycle in the CO2 capture cases, ranging from 12.4 MPa/534°C/534°C (1800 psig/993°F/993°F) to 12.4 MPa/534°C/534°C (1800 psig/994°F/994°F) for all of the CO2 capture cases versus 12.4 MPa/559°C/559°C (1800 psig/1038°F/1038°F) to 12.4 MPa/562°C/562°C (1800 psig/1043°F/1043°F) for all of the non-CO2 capture cases.
3.1.8.4 Combustion Turbine Syngas Fuel Requirements Typical fuel specifications and contaminant levels for successful CT operation are provided in GE Power System’s “Specification for Fuel Gases for Combustion in Heavy-Duty Turbines” and presented for state-of-the-art 2008 F-class machines in Exhibit 3-6 and Exhibit 3-7. (44) The vast majority of published CT performance information is specific to natural gas operation. Turbine performance using syngas requires vendor input as was obtained for this report.
Exhibit 3-6 Typical fuel specification for state-of-the-art 2008 F-class machines
Max Min
LHV, kJ/m3 (Btu/scf) None 3.0 (100)
Gas Fuel Pressure, MPa (psia) 3.1 (450)
Gas Fuel Temperature, °C (°F) A Varies with gas pressureB
Flammability Limit Ratio, Rich-to-Lean, Volume Basis
C 2:2.1
Sulfur D
A The maximum fuel temperature is defined in GEK-4189 (45)

Cost and Performance Baseline for Fossil Energy Plants Volume 1b: Revision 2b
47
B To ensure that the fuel gas supply to the CT is 100 percent free of liquids the minimum fuel gas temperature must meet the required superheat over the respective dew point. This requirement is independent of the hydrocarbon and moisture concentration. Superheat calculation shall be performed as described in GEI-4140G (44) C Maximum flammability ratio limit is not defined. Fuel with flammability ratio significantly larger than those of natural gas may require start-up fuel D The quantity of sulfur in syngas is not limited by specification. Experience has shown that fuel sulfur levels up to one percent by volume do not significantly affect oxidation/corrosion rates
3.1.8.5 Normal Operation Inlet air is compressed in a single spool compressor to a pressure ratio of approximately 16:1. This pressure ratio was vendor specified and less than the 17:1 ratio used in natural gas applications. The majority of compressor discharge air remains on board the machine and passes to the burner section to support combustion of the syngas. Compressed air is also used in burner, transition, and film cooling services. About 4-7 percent of the compressor air is extracted and integrated with the air supply of the ASU in non-carbon capture cases. It may be technically possible to integrate the CT and ASU in CO2 capture cases as well; however, in this report integration was considered only for non-carbon capture cases.
Exhibit 3-7 Allowable gas fuel contaminant level for state-of-the-art 2008 F-class machines
Turbine Inlet Limit, ppbw
Fuel Limit, ppmw Turbine Inlet Flow/Fuel Flow 50 12 4
Lead 20 1.0 0.240 .080 Vanadium 10 0.5 0.120 0.040 Calcium 40 2.0 0.480 0.160 Magnesium 40 2.0 0.480 0.160 Sodium + Potassium
Na/K = 28A 20 1.0 0.240 0.080 Na/K = 3 10 0.5 0.120 0.40 Na/K ≤ 1 6 0.3 0.072 0.024
Particulates TotalB 600 30 7.2 2.4 Above 10 microns 6 0.3 0.072 0.024
ANominal sea salt ratio BThe fuel gas delivery system shall be designed to prevent generation or admittance of solid particulate to the CT gas fuel system
Pressurized syngas is combusted in 14 parallel diffusion combustors, and syngas dilution is used to limit NOx formation. As described in Section 3.1.2, nitrogen from the ASU is used as the primary diluent followed by syngas humidification and finally by steam dilution, if necessary, to achieve an LHV of 4.4-4.7 MJ/Nm3 (119-125 Btu/scf). The advantages of using nitrogen as the primary diluent include:
• Nitrogen from the ASU is already partially compressed and using it for dilution eliminates wasting the compression energy.

Cost and Performance Baseline for Fossil Energy Plants Volume 1b: Revision 2b
48
• Limiting the water content reduces the need to de-rate firing temperature, particularly in the high-hydrogen (CO2 capture) cases.
There are some disadvantages to using nitrogen as the primary diluent, and these include:
• There is a significant auxiliary power requirement to further compress the large nitrogen flow from the ASU pressures of 0.4 and 1.3 MPa (56 and 182 psia) to the CT pressure of 3.2 MPa (465 psia).
• Low-quality heat not otherwise useful for other applications can be used to preheat water for the syngas humidification process.
• Nitrogen is not as efficient as water in limiting NOx emissions.
It is not clear that one dilution method provides a significant advantage over the other. However, in this report nitrogen was chosen as the primary diluent based on suggestions by turbine industry experts during peer review of the report.
Hot combustion products are expanded in the three-stage turbine-expander. Given the assumed ambient conditions, back-end loss, and HRSG pressure drop, the CT exhaust temperature is nominally 588°C (1,090°F) for non-CO2 capture cases and 562°C (1,044°F) for capture cases.
Gross turbine power, as measured prior to the generator terminals, is 232 MW per train. The CT generator is a standard hydrogen-cooled machine with static exciter.
3.1.9 Steam Generation Island 3.1.9.1 Heat Recovery Steam Generator The HRSG is a horizontal gas flow, drum-type, multi-pressure design that is matched to the characteristics of the CT exhaust gas. High-temperature flue gas exiting the CT is conveyed through the HRSG to recover the large quantity of thermal energy that remains. Flue gas travels through the HRSG gas path and exits at 132°C (270°F) for all 7 cases.
The HP drum produces steam at main steam pressure, while the IP drum produces process steam and turbine dilution steam, if required. The HRSG drum pressures are nominally 12.4/3.1 MPa (1,800/443 psia) for the HP/IP turbine sections, respectively. In addition to generating and superheating steam, the HRSG performs reheat duty for the cold/hot reheat steam for the steam turbine, provides condensate and feedwater (FW) heating, and also provides deaeration of the condensate.
Natural circulation of steam is accomplished in the HRSG by utilizing differences in densities due to temperature differences of the steam. The natural circulation HRSG provides the most cost-effective and reliable design.
The HRSG drums include moisture separators, internal baffles, and piping for FW/steam. All tubes, including economizers, superheaters, and headers and drums, are equipped with drains.
Safety relief valves are furnished in order to comply with appropriate codes and ensure a safe work place.
Superheater, boiler, and economizer sections are supported by shop-assembled structural steel. Inlet and outlet duct is provided to route the gases from the CT outlet to the HRSG inlet and the HRSG outlet to the stack. A diverter valve is included in the inlet duct to bypass the gas when appropriate. Suitable expansion joints are also included.

Cost and Performance Baseline for Fossil Energy Plants Volume 1b: Revision 2b
49
3.1.9.2 Steam Turbine Generator and Auxiliaries The steam turbine consists of an HP section, an IP section, and one double-flow LP section, all connected to the generator by a common shaft. The HP and IP sections are contained in a single-span, opposed-flow casing, with the double-flow LP section in a separate casing. The LP turbine has a last stage bucket length of 76 cm (30 in).
Main steam from the HRSG and gasifier island is combined in a header, and then passes through the stop valves and control valves and enters the turbine at either 12.4 MPa/559°C to 562°C (1,800 psig/1,038°F to 1,043°F) for the non-carbon capture cases, or 12.4 MPa/534°C (1,800 psig/993°F to 994°F) for the carbon capture cases. The steam initially enters the turbine near the middle of the HP span, flows through the turbine, and returns to the HRSG for reheating. The reheat steam flows through the reheat stop valves and intercept valves and enters the IP section at 3.1 MPa/558°C to 561°C (443 psig/1,036°F to 1,041°F) for the non-carbon capture cases or 3.1 MPa/532°C to 533°C (443 psig/990°F to 992°F) for the carbon capture cases. After passing through the IP section, the steam enters a crossover pipe, which transports the steam to the LP section. The steam divides into two paths and flows through the LP sections, exhausting downward into the condenser.
Turbine bearings are lubricated by a closed-loop (CL), water-cooled, pressurized oil system. The oil is contained in a reservoir located below the turbine floor. During startup or unit trip, an emergency oil pump mounted on the reservoir pumps the oil. When the turbine reaches 95 percent of synchronous speed, the main pump mounted on the turbine shaft pumps oil. The oil flows through water-cooled heat exchangers prior to entering the bearings. The oil then flows through the bearings and returns by gravity to the lube oil reservoir.
Turbine shafts are sealed against air in-leakage or steam blowout using a modern positive pressure variable clearance shaft sealing design arrangement connected to an LP steam seal system. During startup, seal steam is provided from the main steam line. As the unit increases load, HP turbine gland leakage provides the seal steam. Pressure-regulating valves control the gland header pressure and dump any excess steam to the condenser. A steam packing exhauster maintains a vacuum at the outer gland seals to prevent leakage of steam into the turbine room. Any steam collected is condensed in the packing exhauster and returned to the condensate system.
The generator is a hydrogen-cooled synchronous type, generating power at 24 kV. A static, transformer type exciter is provided. The generator is cooled with a hydrogen gas recirculation system using fans mounted on the generator rotor shaft. The heat absorbed by the gas is removed as it passes over finned tube gas coolers mounted in the stator frame. Gas is prevented from escaping at the rotor shafts by a CL oil seal system. The oil seal system consists of storage tank, pumps, filters, and pressure controls, all skid-mounted.
The STG is controlled by a triple-redundant, microprocessor-based electro-hydraulic control system. The system provides digital control of the unit in accordance with programmed control algorithms, color cathode ray tube (CRT) operator interfacing, and datalink interfaces to the balance-of-plant DCS, and incorporates on-line repair capability.
3.1.9.3 Condensate System The condensate system transfers condensate from the condenser hotwell to the deaerator, through the gland steam condenser, gasifier, and the low-temperature economizer section in the HRSG.

Cost and Performance Baseline for Fossil Energy Plants Volume 1b: Revision 2b
50
The system consists of one main condenser; two 50 percent capacity, motor-driven, vertical condensate pumps; one gland steam condenser; and a low-temperature tube bundle in the HRSG. Condensate is delivered to a common discharge header through separate pump discharge lines, each with a check valve and a gate valve. A common minimum flow recirculation line discharging to the condenser is provided to maintain minimum flow requirements for the gland steam condenser and the condensate pumps.
3.1.9.4 Feedwater System The function of the FW system is to pump the various FW streams from the deaerator storage tank in the HRSG to the respective steam drums. Two 50 percent capacity boiler feed pumps are provided for each of 3 pressure levels, HP, IP, and LP. Each pump is provided with inlet and outlet isolation valves, and outlet check valve. Minimum flow recirculation to prevent overheating and cavitation of the pumps during startup and low loads is provided by an automatic recirculation valve and associated piping that discharges back to the deaerator storage tank. Pneumatic flow control valves control the recirculation flow.
The FW pumps are supplied with instrumentation to monitor and alarm on low oil pressure, or high-bearing temperature. FW pump suction pressure and temperature are also monitored. In addition, the suction of each boiler feed pump is equipped with a startup strainer.
3.1.9.5 Main and Reheat Steam Systems The function of the main steam system is to convey main steam generated in the synthesis gas cooler (SGC) and HRSG from the HRSG superheater outlet to the HP turbine stop valves. The function of the reheat system is to convey steam from the HP turbine exhaust to the HRSG RH, and to the turbine reheat stop valves.
Main steam at approximately 12.4 MPa/559°C to 562°C (1,800 psig/1,038°F to 1,043°F) (non- CO2 capture cases) or 12.4 MPa/534°C (1,800 psig/993°F to 994°F) (CO2 capture cases) exits the HRSG superheater through a motor-operated stop/check valve and a motor-operated gate valve, and is routed to the HP turbine. Cold reheat steam at approximately 3.5 MPa/349°C to 372°C (501 psia/661°F to 702°F) exits the HP turbine, flows through a motor-operated isolation gate valve, to the HRSG reheater. Hot reheat steam at approximately 3.1 MPa/558 to 561°C (443 psig/1,036°F to 1,041°F) for the non-carbon capture cases and 3.1 MPa/532°C to 533°C (443 psig/990°F to 992°F) for the CO2 capture cases exits the HRSG RH through a motor-operated gate valve and is routed to the IP turbines.
Steam piping is sloped from the HRSG to the drip pots located near the steam turbine for removal of condensate from the steam lines. Condensate collected in the drip pots and in low-point drains is discharged to the condenser through the drain system.
Steam flow is measured by means of flow nozzles in the steam piping. The flow nozzles are located upstream of any branch connections on the main headers.
Safety valves are installed to comply with appropriate codes and to ensure the safety of personnel and equipment.
3.1.9.6 Circulating Water System The circulating water system (CWS) is a closed-cycle cooling water system that supplies cooling water to the condenser to condense the main turbine exhaust steam. The system also supplies cooling water to the AGR plant as required, and to the auxiliary cooling system. The auxiliary

Cost and Performance Baseline for Fossil Energy Plants Volume 1b: Revision 2b
51
cooling system is a CL process that utilizes a higher quality water to remove heat from compressor intercoolers, oil coolers, and other ancillary equipment and transfers that heat to the main circulating cooling water system in plate and frame heat exchangers. The heat transferred to the circulating water in the condenser and other applications is removed by a mechanical draft cooling tower.
The system consists of two 50 percent capacity vertical CWPs, a mechanical draft evaporative cooling tower, and CS cement-lined interconnecting piping. The pumps are single-stage vertical pumps. The piping system is equipped with butterfly isolation valves and all required expansion joints. The cooling tower is a multi-cell wood frame counterflow mechanical draft cooling tower.
The condenser is a single-pass, horizontal type with divided water boxes. There are two separate circulating water circuits in each box. One-half of the condenser can be removed from service for cleaning or for plugging tubes. This can be done during normal operation at reduced load.
The condenser is equipped with an air extraction system to evacuate the condenser steam space for removal of non-condensable gases during steam turbine operation and to rapidly reduce the condenser pressure from atmospheric pressure before unit startup and admission of steam to the condenser.
3.1.9.7 Raw Water, Fire Protection, and Cycle Makeup Water Systems The raw water system supplies cooling tower makeup, cycle makeup, service water and potable water requirements. The water source is 50 percent from a POTW and 50 percent from groundwater. Booster pumps within the plant boundary provide the necessary pressure.
The fire protection system provides water under pressure to the fire hydrants, hose stations, and fixed water suppression system within the buildings and structures. The system consists of pumps, underground and aboveground supply piping, distribution piping, hydrants, hose stations, spray systems, and deluge spray systems. One motor-operated booster pump is supplied on the intake structure of the cooling tower with a diesel engine backup pump installed on the water inlet line.
The cycle makeup water system provides high-quality demineralized water for makeup to the HRSG cycle, for steam injection ahead of the SGS reactors in CO2 capture cases, and for injection steam to the auxiliary boiler for control of NOx emissions, if required.
The cycle makeup system consists of two 100 percent trains, each with a full-capacity activated carbon filter, primary cation exchanger, primary anion exchanger, mixed bed exchanger, recycle pump, and regeneration equipment. The equipment is skid-mounted and includes a control panel and associated piping, valves, and instrumentation.
3.1.10 Accessory Electric Plant The accessory electric plant consists of switchgear and control equipment, generator equipment, station service equipment, conduit and cable trays, and wire and cable. It also includes the main power transformer, all required foundations, and standby equipment.

Cost and Performance Baseline for Fossil Energy Plants Volume 1b: Revision 2b
52
3.1.11 Waste Treatment/Miscellaneous Systems An onsite water treatment facility treats all runoff, cleaning wastes, blowdown, and backwash. It is anticipated that the treated water will be suitable for discharge into existing systems and be within the EPA standards for suspended solids, oil and grease, pH, and miscellaneous metals.
The waste treatment system is minimal and consists, primarily, of neutralization and oil/water separators (along with the associated pumps, piping, etc.).
A natural gas supply line has been included in all cases for start-up or emergency fuel.
Miscellaneous systems consisting of natural gas, service air, instrument air, and service water are provided. A natural gas supply line has been included in all cases for start-up or emergency fuel. All truck roadways and unloading stations inside the fence area are provided.
3.1.12 Instrumentation and Control An integrated plant-wide distributed control system (DCS) is provided. The DCS is a redundant microprocessor-based, functionally DCS. The control room houses an array of multiple video monitor (CRT) and keyboard units. The CRT/keyboard units are the primary interface between the generating process and operations personnel. The DCS incorporates plant monitoring and control functions for all the major plant equipment. The DCS is designed to be operational and accessible 99.5 percent of the time that it is required (99.5 percent availability). The plant equipment and the DCS are designed for automatic response to load changes from minimum load to 100 percent. Startup and shutdown routines are manually implemented, with operator selection of modular automation routines available. The exception to this, and an important facet of the control system for gasification, is the critical controller system, which is a part of the license package from the gasifier supplier and is a dedicated and distinct hardware segment of the DCS.
This critical controller system is used to control the gasification process. The partial oxidation of the fuel feed and oxygen feed streams to form a syngas product is a stoichiometric, temperature- and pressure-dependent reaction. The critical controller utilizes a redundant microprocessor executing calculations and dynamic controls at 100- to 200-millisecond intervals. The enhanced execution speeds as well as evolved predictive controls allow the critical controller to mitigate process upsets and maintain the reactor operation within a stable set of operating parameters.
3.1.13 Performance Summary Metrics This section details the methodologies of several metrics reported in the performance summaries.
Cold Gas Efficiency The cold gas efficiency is calculated by subtracting the heating value of any gas recycled to the gasifier from the heating value of the gas exiting the gasifier and dividing that difference by the thermal input to the gasifier. This calculation is represented by the equation:
𝐶𝐶𝐶𝐶𝐸𝐸 = (𝐶𝐶𝐶𝐶 − 𝑅𝑅𝑅𝑅)
𝑇𝑇𝑅𝑅
Where: CGE – cold gas efficiency GO – heating value of gas exiting the gasifier RI – heating value of gas recycled to gasifier

Cost and Performance Baseline for Fossil Energy Plants Volume 1b: Revision 2b
53
TI – thermal input to into the gasifier
The thermal input to the gasifier is calculated by taking the coal feed rate and multiplying by the heating value and converting the units to kW.
The components considered for the heating value of the gasifier exit gas and recycle gas are CO, H2, CH4, H2S, NH3, and COS. Their mole fraction is extracted from the model, multiplied by the molar flow of the stream, and then multiplied by their individual heating values.
Combustion Turbine Efficiency The combustion turbine efficiency is calculated by taking the combustion turbine power produced and dividing it by the thermal input to the turbines. This calculation is represented by the equation:
𝐶𝐶𝑇𝑇𝐸𝐸 = 𝐶𝐶𝑇𝑇𝐶𝐶𝑇𝑇𝑅𝑅
Where: CTE – combustion turbine efficiency CTP – combustion turbine power TI – thermal input to turbines
The thermal input is calculated by taking the mole fraction of the individual gases (CO, H2, CH4, H2S, NH3, and COS) multiplied by the molar flow rate of the total stream entering the combustion turbine and then multiplying each by their individual heating values.
Steam Turbine Efficiency The steam turbine efficiency is calculated by taking the steam turbine power produced and dividing it by the difference between the thermal input and thermal output. This calculation is represented by the equation:
𝑆𝑆𝑇𝑇𝐸𝐸 = 𝑆𝑆𝑇𝑇𝐶𝐶
(𝑇𝑇𝑅𝑅 − 𝑇𝑇𝐶𝐶)
Where: STE – steam turbine efficiency STP – steam turbine power TI – thermal input TO – thermal output
The thermal input is considered to be the main steam, the makeup water, and the low pressure steam from the BFW.
The thermal output is considered to be any extractions such as the gasifier steam, the 250 psia header, and the BFW from the condenser.
The IP blowdown, HP blowdown, and superheater losses are also credited to the thermal input as they are extracted from the cycle prior to the main steam but after the condensate BFW.
Steam Turbine Heat Rate The steam turbine heat rate is calculated by taking the inverse of the steam turbine efficiency. This calculation is represented by the equation:
𝑆𝑆𝑇𝑇𝑆𝑆𝑅𝑅 = 1𝑆𝑆𝑇𝑇𝐸𝐸
∗ 3,412

Cost and Performance Baseline for Fossil Energy Plants Volume 1b: Revision 2b
54
Where: STHR – steam turbine heat rate, Btu/kWh STE – steam turbine efficiency, fraction
3.2 Shell Global Solutions IGCC Cases This section contains an evaluation of plant designs for cases B1A and B1B, which are based on the Shell gasifier. Cases B1A and B1B are very similar in terms of process, equipment, scope and arrangement, except that Case B1B employs a syngas quench and includes SGS reactors, CO2 absorption/regeneration, and compression/transport systems. There are no provisions for CO2 removal in Case B1A.
The balance of this section is organized as follows:
• Gasifier Background – provides information on the development and status of the Shell gasification technology.
• Process and System Description – provides an overview of the technology operation as applied to Case B1A. The systems that are common to all gasifiers were covered in Section 3.1 and only features that are unique to Case B1A are discussed further in this section.
• Key Assumptions – provides a summary of study and modeling assumptions relevant to cases B1A and B1B.
• Sparing Philosophy – provided for cases B1A and B1B • Performance Results – provides the main modeling results from Case B1A, including the
performance summary, environmental performance, carbon balance, sulfur balance, water balance, mass and energy balance diagrams, and mass and energy balance tables.
• Equipment List – provides an itemized list of major equipment for Case B1A with account codes that correspond to the cost accounts in the Cost Estimates section.
• Cost Estimates – provides a summary of capital and operating costs for Case B1A. Process and System Description, Performance Results, Equipment List and Cost Estimates are repeated for Case B1B.
3.2.1 Gasifier Background The “Coal Gasification Guidebook: Status, Application, and Technologies” report published by the EPRI provides a detailed history of the development of several types of gasifier technology, including the Shell gasifier, as well as gasifier capacity, distinguishing characteristics, and important coal characteristics. (46) As of 2009, Shell reported ten gasifiers in operation producing 100,000-150,000 Nm3/hr and three of the same size in construction. Another three ranging from 150,000-250,000 Nm3/hr are also in construction. (47) The large gasifier operating in The Netherlands has a bituminous coal-handling capacity of 1,633 tonnes/day (1,800 tpd) and produces dry gas at a rate of 158,575 Nm3/hr (5.6 million scf/hr) with an energy content of about 1,792 GJ/hr (1,700 MMBtu/hr) (HHV). This gasifier was sized to match the fuel gas requirements for the Siemens/Kraftwerk Union V-94.2 CT and could easily be scaled up to match state-of-the-art 2008 F-class turbine requirements. (47)

Cost and Performance Baseline for Fossil Energy Plants Volume 1b: Revision 2b
55
Shell gasifiers are capable of utilizing a wide variety of coal types, and compared to slurry fed gasifiers, the dry-fed, cooled-refractory lined, Shell gasifier has a lower oxygen requirement and produces a gas with a higher H2S/CO2 ratio, which improves sulfur recovery. (46)
While the use of dry feed allows for lower oxygen consumption, the feed system – which includes the coal drying system – is more costly and complicated. (46)
Coal characteristics that are favorable when selecting a coal type for use with a Shell gasifier include low concentrations of ash with a moderate fusion temperature. If a coal is selected that has a high ash fusion temperature, flux addition may be necessary. The negative impact that high ash coals have on the operation of gasifiers are reduced in dry feed systems in comparison to slurry fed gasifiers. (46)
3.2.2 Process Description In this section the overall Shell gasification process for Case B1A is described. The system description follows the block flow diagram (BFD) in Exhibit 3-8 and stream numbers reference the same exhibit. The tables in Exhibit 3-9 provide process data for the numbered streams in the BFD.
3.2.2.1 Coal Preparation and Feed Systems Coal receiving and handling is common to all cases and was covered in Section 3.1.1. The receiving and handling subsystem ends at the coal silo. The Shell process uses a dry feed system, which is sensitive to the coal moisture content. Coal moisture consists of two parts, surface moisture and inherent moisture. For coal to flow smoothly through the lock hoppers, the surface moisture must be removed. The Illinois No. 6 coal used in this report contains 11.12 percent total moisture on an as-received basis (stream 9). It was assumed that the coal must be dried to 5 percent moisture to allow for smooth flow through the dry feed system (stream 10).
The coal is simultaneously crushed and dried in the coal mill then delivered to a surge hopper with an approximate 2-hour capacity. The drying medium is provided by combining the off-gas from the Claus plant TGTU and a slipstream of clean syngas (stream 8) and passing them through an incinerator. The incinerator flue gas, with an oxygen content of 6 vol%, is then used to dry the coal in the mill.
The coal is drawn from the surge hoppers and fed through a pressurization lock hopper system to a dense phase pneumatic conveyor, which uses nitrogen from the ASU to convey the coal to the gasifiers.

Cost and Performance Baseline for Fossil Energy Plants Volume 1b: Revision 2b
56
Exhibit 3-8 Case B1A block flow diagram, Shell IGCC without CO2 capture
Source: NETL
GAS TURBINE
COMBUSTOR
DUCT/SYNGAS COOLERS
GAS COOLINGBFW HEATING& KNOCKOUT
SCRUBBER & COS
HYDROLYSIS
ELEVATEDPRESSURE
ASU
SHELL GASIFIER
MERCURYREMOVAL
SULFINOLCLAUSPLANT
SYNGASREHEAT
HRSG
2X STATE-OF-THE-ART F-CLASS
GAS TURBINES
1AIR TO ASU
2 3
VENTGAS
5
10 11
GASIFIEROXIDANT
DRYCOAL SLAG
14 15
2021
19
4
23
24
TURBINE COOLING AIR
25
AMBIENT AIR
FLUE GAS STACK GAS
HYDROGENATION REACTOR AND GAS
COOLER
22CLEAN GAS
NITROGEN DILUENT
AIR
SULFUR PRODUCT
SYNGAS
COAL DRYER
DRYING GAS PREP
9
WETCOAL
17
8
6
13
12
AIR
SYNGAS
SYNGAS QUENCH RECYCLE
TO SOUR WATER
STRIPPER
ACID GAS
STEAM
SYNGAS HUMIDIFICATION
18
7 TRANSPORT NITROGEN
26CLAUS PLANT
OXIDANT
CLAUS PLANT
OXIDANT
STEAM TURBINE
27Note: Block Flow Diagram is not intended to represent a complete material balance. Only major process streams and equipment are shown.
16
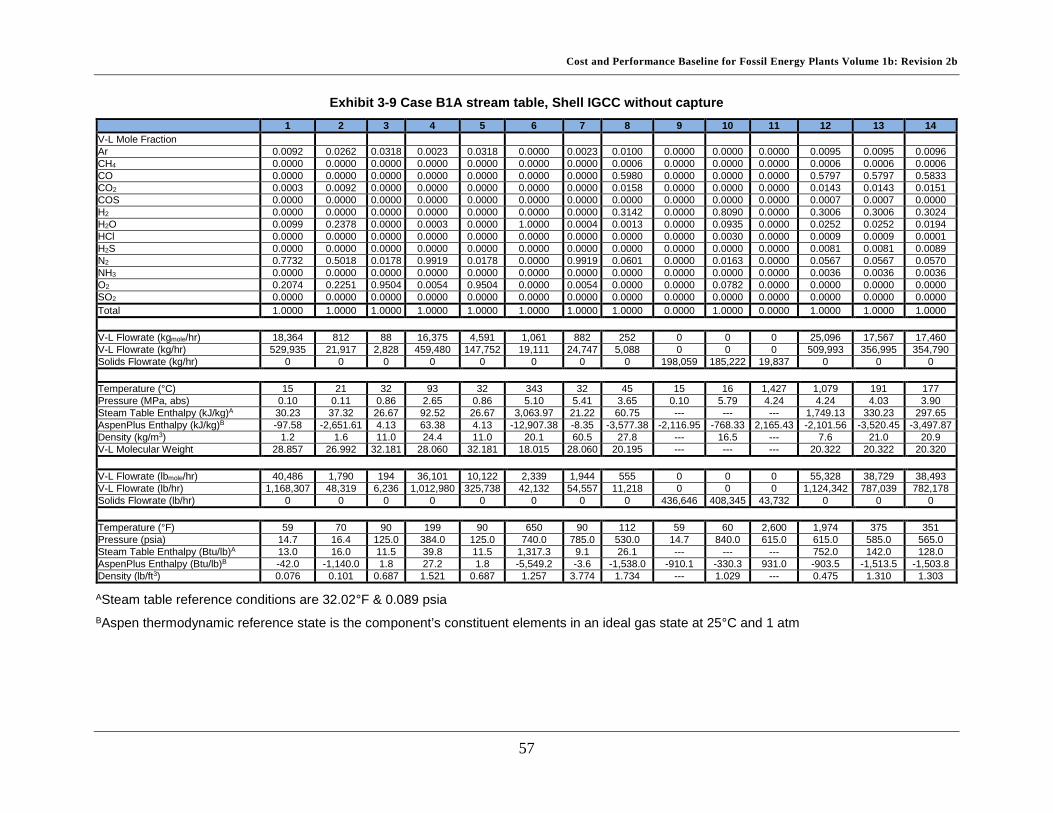
Cost and Performance Baseline for Fossil Energy Plants Volume 1b: Revision 2b
57
Exhibit 3-9 Case B1A stream table, Shell IGCC without capture 1 2 3 4 5 6 7 8 9 10 11 12 13 14
V-L Mole Fraction Ar 0.0092 0.0262 0.0318 0.0023 0.0318 0.0000 0.0023 0.0100 0.0000 0.0000 0.0000 0.0095 0.0095 0.0096 CH4 0.0000 0.0000 0.0000 0.0000 0.0000 0.0000 0.0000 0.0006 0.0000 0.0000 0.0000 0.0006 0.0006 0.0006 CO 0.0000 0.0000 0.0000 0.0000 0.0000 0.0000 0.0000 0.5980 0.0000 0.0000 0.0000 0.5797 0.5797 0.5833 CO2 0.0003 0.0092 0.0000 0.0000 0.0000 0.0000 0.0000 0.0158 0.0000 0.0000 0.0000 0.0143 0.0143 0.0151 COS 0.0000 0.0000 0.0000 0.0000 0.0000 0.0000 0.0000 0.0000 0.0000 0.0000 0.0000 0.0007 0.0007 0.0000 H2 0.0000 0.0000 0.0000 0.0000 0.0000 0.0000 0.0000 0.3142 0.0000 0.8090 0.0000 0.3006 0.3006 0.3024 H2O 0.0099 0.2378 0.0000 0.0003 0.0000 1.0000 0.0004 0.0013 0.0000 0.0935 0.0000 0.0252 0.0252 0.0194 HCl 0.0000 0.0000 0.0000 0.0000 0.0000 0.0000 0.0000 0.0000 0.0000 0.0030 0.0000 0.0009 0.0009 0.0001 H2S 0.0000 0.0000 0.0000 0.0000 0.0000 0.0000 0.0000 0.0000 0.0000 0.0000 0.0000 0.0081 0.0081 0.0089 N2 0.7732 0.5018 0.0178 0.9919 0.0178 0.0000 0.9919 0.0601 0.0000 0.0163 0.0000 0.0567 0.0567 0.0570 NH3 0.0000 0.0000 0.0000 0.0000 0.0000 0.0000 0.0000 0.0000 0.0000 0.0000 0.0000 0.0036 0.0036 0.0036 O2 0.2074 0.2251 0.9504 0.0054 0.9504 0.0000 0.0054 0.0000 0.0000 0.0782 0.0000 0.0000 0.0000 0.0000 SO2 0.0000 0.0000 0.0000 0.0000 0.0000 0.0000 0.0000 0.0000 0.0000 0.0000 0.0000 0.0000 0.0000 0.0000 Total 1.0000 1.0000 1.0000 1.0000 1.0000 1.0000 1.0000 1.0000 0.0000 1.0000 0.0000 1.0000 1.0000 1.0000 V-L Flowrate (kgmole/hr) 18,364 812 88 16,375 4,591 1,061 882 252 0 0 0 25,096 17,567 17,460 V-L Flowrate (kg/hr) 529,935 21,917 2,828 459,480 147,752 19,111 24,747 5,088 0 0 0 509,993 356,995 354,790 Solids Flowrate (kg/hr) 0 0 0 0 0 0 0 0 198,059 185,222 19,837 0 0 0
Temperature (°C) 15 21 32 93 32 343 32 45 15 16 1,427 1,079 191 177 Pressure (MPa, abs) 0.10 0.11 0.86 2.65 0.86 5.10 5.41 3.65 0.10 5.79 4.24 4.24 4.03 3.90 Steam Table Enthalpy (kJ/kg)A 30.23 37.32 26.67 92.52 26.67 3,063.97 21.22 60.75 --- --- --- 1,749.13 330.23 297.65 AspenPlus Enthalpy (kJ/kg)B -97.58 -2,651.61 4.13 63.38 4.13 -12,907.38 -8.35 -3,577.38 -2,116.95 -768.33 2,165.43 -2,101.56 -3,520.45 -3,497.87 Density (kg/m3) 1.2 1.6 11.0 24.4 11.0 20.1 60.5 27.8 --- 16.5 --- 7.6 21.0 20.9 V-L Molecular Weight 28.857 26.992 32.181 28.060 32.181 18.015 28.060 20.195 --- --- --- 20.322 20.322 20.320
V-L Flowrate (lbmole/hr) 40,486 1,790 194 36,101 10,122 2,339 1,944 555 0 0 0 55,328 38,729 38,493 V-L Flowrate (lb/hr) 1,168,307 48,319 6,236 1,012,980 325,738 42,132 54,557 11,218 0 0 0 1,124,342 787,039 782,178 Solids Flowrate (lb/hr) 0 0 0 0 0 0 0 0 436,646 408,345 43,732 0 0 0
Temperature (°F) 59 70 90 199 90 650 90 112 59 60 2,600 1,974 375 351 Pressure (psia) 14.7 16.4 125.0 384.0 125.0 740.0 785.0 530.0 14.7 840.0 615.0 615.0 585.0 565.0 Steam Table Enthalpy (Btu/lb)A 13.0 16.0 11.5 39.8 11.5 1,317.3 9.1 26.1 --- --- --- 752.0 142.0 128.0 AspenPlus Enthalpy (Btu/lb)B -42.0 -1,140.0 1.8 27.2 1.8 -5,549.2 -3.6 -1,538.0 -910.1 -330.3 931.0 -903.5 -1,513.5 -1,503.8 Density (lb/ft3) 0.076 0.101 0.687 1.521 0.687 1.257 3.774 1.734 --- 1.029 --- 0.475 1.310 1.303
ASteam table reference conditions are 32.02°F & 0.089 psia BAspen thermodynamic reference state is the component’s constituent elements in an ideal gas state at 25°C and 1 atm

Cost and Performance Baseline for Fossil Energy Plants Volume 1b: Revision 2b
58
Exhibit 3-9 Case B1A stream table, Shell IGCC without capture (continued) 15 16 17 18 19 20 21 22 23 24 25 26 27
V-L Mole Fraction Ar 0.0098 0.0098 0.0100 0.0079 0.0079 0.0004 0.0000 0.0058 0.0092 0.0092 0.0086 0.0086 0.0000 CH4 0.0006 0.0006 0.0006 0.0005 0.0005 0.0000 0.0000 0.0000 0.0000 0.0000 0.0000 0.0000 0.0000 CO 0.5962 0.5845 0.5980 0.4741 0.4741 0.0167 0.0000 0.1034 0.0000 0.0000 0.0000 0.0000 0.0000 CO2 0.0155 0.0257 0.0158 0.0125 0.0125 0.4460 0.0000 0.2613 0.0003 0.0003 0.0752 0.0752 0.0000 COS 0.0000 0.0000 0.0000 0.0000 0.0000 0.0000 0.0000 0.0006 0.0000 0.0000 0.0000 0.0000 0.0000 H2 0.3091 0.3072 0.3142 0.2491 0.2491 0.0096 0.0000 0.0429 0.0000 0.0000 0.0000 0.0000 0.0000 H2O 0.0014 0.0015 0.0013 0.2083 0.2083 0.0063 0.0000 0.4259 0.0099 0.0099 0.0906 0.0906 1.0000 HCl 0.0000 0.0000 0.0000 0.0000 0.0000 0.0000 0.0000 0.0000 0.0000 0.0000 0.0000 0.0000 0.0000 H2S 0.0091 0.0089 0.0000 0.0000 0.0000 0.3872 0.0000 0.0016 0.0000 0.0000 0.0000 0.0000 0.0000 N2 0.0583 0.0618 0.0601 0.0476 0.0476 0.1338 0.0000 0.1585 0.7732 0.7732 0.7210 0.7210 0.0000 NH3 0.0000 0.0000 0.0000 0.0000 0.0000 0.0000 0.0000 0.0000 0.0000 0.0000 0.0000 0.0000 0.0000 O2 0.0000 0.0000 0.0000 0.0000 0.0000 0.0000 0.0000 0.0000 0.2074 0.2074 0.1046 0.1046 0.0000 SO2 0.0000 0.0000 0.0000 0.0000 0.0000 0.0000 0.0000 0.0000 0.0000 0.0000 0.0000 0.0000 0.0000 Total 1.0000 1.0000 1.0000 1.0000 1.0000 1.0000 0.0000 1.0000 1.0000 1.0000 1.0000 1.0000 1.0000 V-L Flowrate (kgmole/hr) 17,081 17,426 16,771 21,155 21,155 402 0 510 110,253 4,410 137,428 137,428 39,521 V-L Flowrate (kg/hr) 347,994 358,740 338,688 417,666 417,666 14,964 0 13,723 3,181,557 127,262 3,962,154 3,962,154 711,987 Solids Flowrate (kg/hr) 0 0 0 0 0 0 4,959 0 0 0 0 0 0
Temperature (°C) 35 34 45 161 193 45 178 232 15 432 587 132 559 Pressure (MPa, abs) 3.72 3.69 3.65 3.21 3.17 3.65 0.41 0.41 0.10 1.62 0.10 0.10 12.51 Steam Table Enthalpy (kJ/kg) A 45.28 44.26 60.75 710.39 762.94 13.88 --- 1,007.13 30.23 463.79 791.04 280.13 3,496.26 AspenPlus Enthalpy (kJ/kg)B -3,555.60 -3,652.99 -3,577.38 -5,259.88 -5,207.33 -5,041.46 142.76 -7,809.89 -97.58 335.98 -1,163.40 -1,674.31 -12,474.05 Density (kg/m3) 29.5 29.6 27.8 17.7 16.2 60.9 5,278.6 2.6 1.2 7.9 0.4 0.9 35.2 V-L Molecular Weight 20.373 20.587 20.195 19.743 19.743 37.190 --- 26.923 28.857 28.857 28.831 28.831 18.015
V-L Flowrate (lbmole/hr) 37,657 38,417 36,974 46,639 46,639 887 0 1,124 243,066 9,723 302,978 302,978 87,130 V-L Flowrate (lb/hr) 767,195 790,887 746,680 920,796 920,796 32,989 0 30,253 7,014,133 280,565 8,735,054 8,735,054 1,569,663 Solids Flowrate (lb/hr) 0 0 0 0 0 0 10,933 0 0 0 0 0 0
Temperature (°F) 94 94 112 321 380 112 353 450 59 810 1,088 270 1,038 Pressure (psia) 540.0 535.0 530.0 465.0 460.0 530.0 59.3 58.9 14.7 234.9 15.2 15.2 1,814.7 Steam Table Enthalpy (Btu/lb)A 19.5 19.0 26.1 305.4 328.0 6.0 --- 433.0 13.0 199.4 340.1 120.4 1,503.1 AspenPlus Enthalpy (Btu/lb)B -1,528.6 -1,570.5 -1,538.0 -2,261.3 -2,238.7 -2,167.4 61.4 -3,357.6 -42.0 144.4 -500.2 -719.8 -5,362.9 Density (lb/ft3) 1.844 1.850 1.734 1.103 1.011 3.805 329.535 0.163 0.076 0.495 0.026 0.056 2.200
ASteam table reference conditions are 32.02°F & 0.089 psia BAspen thermodynamic reference state is the component’s constituent elements in an ideal gas state at 25°C and 1 atm

Cost and Performance Baseline for Fossil Energy Plants Volume 1b: Revision 2b
59
3.2.2.2 Gasifier There are two Shell dry feed, pressurized, upflow, entrained, slagging gasifiers, operating at 4.2 MPa (615 psia) and processing a total of 4,753 tonnes/day (5,240 tpd) of as-received coal. The air separation plant supplies 3,614 tonnes/day (3,984 tpd) of 95 percent oxygen to the gasifiers (stream 5) and the Claus plant (stream 3). Coal reacts with oxygen and steam at a temperature of 1427°C (2600°F) in the gasifier to produce principally hydrogen and carbon monoxide with little carbon dioxide formed.
The gasifier’s refractory-lined water wall is protected by molten slag that solidifies on the cooled walls.
3.2.2.3 Raw Gas Cooling/Particulate Removal High-temperature heat recovery in each gasifier train is accomplished in three steps, including the gasifier jacket, which cools and solidifies slag touching the gasifier walls and maintains the syngas temperature at 1,427°C (2,600°F). The product gas from the gasifier is cooled to approximately 1,093°C (2,000°F) by adding cooled recycled fuel gas to lower the temperature below the ash melting point. Gas (stream 12) then goes through a duct cooler and syngas cooler, which lower the gas temperature from approximately 1,093°C (2,000°F) to 316°C (600°F), and produce HP steam for use in the steam cycle.
After passing through the duct cooler and syngas cooler, the syngas passes through a cyclone and a raw gas candle filter where a majority of the fine particles are removed and returned to the gasifier with the coal fuel. The filter consists of an array of ceramic candle elements in a pressure vessel. Fines produced by the gasification system are recirculated to extinction. The ash that is not carried out with the gas forms slag and runs down the interior walls, exiting the gasifier in liquid form. The slag is solidified in a quench tank for disposal (stream 11). Lockhoppers are used to reduce the pressure of the solids from 4.2 to 0.1 MPa (615 to 15 psia). The syngas scrubber removes additional PM further downstream.
After passing through the cyclone and ceramic candle filter array, the syngas is further cooled to 191°C (375°F) (stream 13) by raising IP steam.
3.2.2.4 Quench Gas Compressor About 30 percent of the cooled syngas is recycled back to the gasifier exit as quench gas. A single-stage compressor is utilized to boost the pressure of the cooled fuel gas stream from 4.0 MPa (575 psia) to 4.0 MPa (585 psia) to provide quench gas to cool the syngas stream from the gasifier.
3.2.2.5 Syngas Scrubber/Sour Water Stripper
The raw syngas exiting the final raw gas cooler at 191°C (375°F) (stream 13) then enters the scrubber for removal of chlorides, SO2, NH3 and remaining particulate. The quench scrubber washes the syngas in a counter-current flow in two packed beds. The syngas leaves the scrubber saturated at a temperature of 94°C (201ºF). The quench scrubber removes essentially all traces of entrained particles, principally unconverted carbon, slag, and metals. The bottoms from the scrubber are sent to the sour water stripper for processing.
The sour water stripper removes NH3, SO2, and other impurities from the waste stream of the scrubber. The sour gas stripper consists of a sour drum that accumulates sour water from the gas

Cost and Performance Baseline for Fossil Energy Plants Volume 1b: Revision 2b
60
scrubber and condensate from SGCs. Sour water from the drum flows to the sour stripper, which consists of a packed column with a steam-heated reboiler. Sour gas is stripped from the liquid and sent to the SRU. Remaining water is sent to wastewater treatment.
3.2.2.6 COS Hydrolysis, Mercury Removal and AGR H2S and COS are at significant concentrations, requiring removal for the power plant to achieve the low design level of SO2 emissions. H2S is removed in an AGR process; however, because COS is not readily removable, it is first catalytically converted to H2S in a COS hydrolysis unit.
Following the water scrubber, the gas is reheated to 177°C (350°F) and fed to the COS hydrolysis reactor. The COS in the sour gas is hydrolyzed with steam over a catalyst bed to H2S, which is more easily removed by the AGR solvent. Before the raw fuel gas can be treated in the AGR process (stream 14), it must be cooled to about 35°C (95°F). During this cooling through a series of heat exchangers, part of the water vapor condenses. This water, which contains some NH3, is sent to the sour water stripper. The cooled syngas (stream 15) then passes through a series of 2 carbon beds to remove greater than 95 percent of the Hg (Section 3.1.4).
The Sulfinol process, developed by Shell in the early 1960s, is a combination process that uses a mixture of amines and a physical solvent. The solvent consists of an aqueous amine and sulfolane. Sulfinol-D uses diisopropanolamine (DIPA), while Sulfinol-M uses MDEA. The mixed solvents allow for better solvent loadings at high acid gas partial pressures and higher solubility of COS and organic sulfur compounds than straight aqueous amines. Sulfinol-M was selected for this application.
The sour syngas is fed directly into an HP contactor. The HP contactor is an absorption column in which the H2S, COS, CO2, and small amounts of H2 and CO are removed from the gas by the Sulfinol solvent. The overhead gas stream from the HP contactor is then washed with water in the sweet gas scrubber before leaving the unit as the feed gas to the sulfur polishing unit.
The rich solvent from the bottom of the HP contactor flows through a hydraulic turbine and is flashed in the rich solvent flash vessel. The flashed gas is then scrubbed in the LP contactor with lean solvent to remove H2S and COS. The overhead from the LP contactor is flashed in the LP KO drum. This gas can be used as a utility fuel gas, consisting primarily of H2 and CO, at 0.8 MPa (118 psia) and 38°C (101°F). The solvent from the bottom of the LP contactor is returned to the rich solvent flash vessel.
Hot, lean solvent in the lean/rich solvent exchanger then heats the flashed rich solvent before entering the stripper. The stripper strips the H2S, COS, and CO2 from the solvent at LP with heat supplied through the stripper reboiler. The acid gas stream to sulfur recovery/tail gas cleanup is recovered as the flash gas from the stripper accumulator. The lean solvent from the bottom of the stripper is cooled in the lean/rich solvent exchanger and the lean solvent cooler. Most of the lean solvent is pumped to the HP contactor. A small amount goes to the LP contactor.
The Sulfinol process removes essentially all of the CO2 along with the H2S and COS. The acid gas fed to the SRU contains 39 vol% H2S and 45 vol% CO2. The CO2 passes through the SRU, the TGTU and ultimately is vented through the coal dryer. Since the amount of CO2 in the syngas is initially small, this does not have a significant effect on the mass flow reaching the CT. However, the costs of the sulfur recovery/tail gas cleanup are higher than that for a sulfur removal process producing an acid gas stream with a higher sulfur concentration.

Cost and Performance Baseline for Fossil Energy Plants Volume 1b: Revision 2b
61
3.2.2.7 Claus Unit The SRU is a Claus bypass type SRU utilizing oxygen (stream 3) instead of air. The Claus plant produces molten sulfur (stream 21) by reacting approximately one third of the H2S in the feed to SO2, then reacting the H2S and SO2 to sulfur and water. The use of Claus technology results in an overall sulfur recovery exceeding 99 percent.
Utilizing oxygen instead of air in the Claus plant reduces the overall cost of the sulfur recovery plant. The sulfur plant produces approximately 119 tonnes/day (131 tpd) of elemental sulfur. Feed for this case consists of acid gas from both the acid gas cleanup unit (stream 20) and a vent stream from the sour water stripper in the gasifier section. A slipstream of clean syngas (stream 8) is passed through an incinerator and combusted with air. The hot, nearly inert incinerator off gas is used to dry coal before being vented to the atmosphere.
In the furnace waste heat boiler, 11,991 kg/hr (26,435 lb/hr) of 3.0 MPa (430 psia) steam is generated. This steam is used to satisfy all Claus process preheating and reheating requirements as well as to provide some steam to the medium-pressure steam header. The sulfur condensers produce 0.34 MPa (50 psig) steam for the LP steam header.
3.2.2.8 Power Block Clean syngas exiting the Sulfinol absorber (stream 17) is humidified because there is not sufficient nitrogen from the ASU to provide the level of dilution required. The moisturized syngas (stream 18) is reheated (stream 19), further diluted with nitrogen from the ASU (stream 4) and steam, and enters the state-of-the-art 2008 F-class CT burner. The CT compressor provides combustion air to the burner and also 19 percent of the air requirements in the ASU (stream 24). The exhaust gas exits the CT at 587°C (1,088°F) (stream 25) and enters the HRSG where additional heat is recovered until the flue gas exits the HRSG at 132°C (270°F) (stream 26) and is discharged through the plant stack. The steam raised in the HRSG is used to power an advanced, commercially available steam turbine using a 12.4 MPa/559°C/559°C (1,800 psig/1,038°F/1,038°F) steam cycle.
3.2.2.9 Air Separation Unit (ASU) The ASU is designed to produce a nominal output of 3,614 tonnes/day (3,984 tpd) of 95 mol% O2 for use in the gasifier (stream 5) and SRU (stream 3). The plant is designed with two production trains. The air compressor is powered by an electric motor. Approximately 11,028 tonnes/day (12,156 tpd) of nitrogen are also recovered, compressed, and used as dilution in the CT combustor. About 4 percent of the CT air is used to supply approximately 19 percent of the ASU air requirements, in the non-capture case.
3.2.2.10 Balance of Plant Balance of plant items were covered in Sections 3.1.9, 3.1.10, and 3.1.12.
3.2.3 Key System Assumptions System assumptions for Cases B1A and B1B (Shell IGCC with and without CO2 capture) are compiled in Exhibit 3-10.
3.2.3.1 Balance of Plant – Cases B1A and B1B The balance of plant assumptions are common to all cases and presented in Exhibit 3-11.

Cost and Performance Baseline for Fossil Energy Plants Volume 1b: Revision 2b
62
Exhibit 3-10 Shell IGCC plant study configuration matrix
Case B1A B1B Gasifier Pressure, MPa (psia) 4.2 (615) 4.2 (615) O2:Coal Ratio, kg O2/kg dry coal 0.84 0.84 Carbon Conversion, % 99.5 99.5 Syngas HHV at Gasifier Outlet, kJ/Nm3 (Btu/scf) 10,841 (291) 10,849 (291)
Steam Cycle, MPa/°C/°C (psig/°F/°F) 12.4/559/559 (1,800/1,038/1,038)
12.4/534/534 (1,800/993/993)
Condenser Pressure, mm Hg (in Hg) 51 (2.0) 51 (2.0)
CT 2x State-of-the-art 2008
F-Class (232 MW output each)
2x State-of-the-art 2008 F-Class
(232 MW output each)
Gasifier Technology Shell Shell Oxidant 95 vol% Oxygen 95 vol% Oxygen Coal Illinois No. 6 Illinois No. 6 Coal Feed Moisture Content, % 5 5 COS Hydrolysis Yes Occurs in SGS SGS No Yes H2S Separation Sulfinol-M Selexol 1st Stage Sulfur Removal, % 99.7 99.9
Sulfur Recovery Claus Plant with Tail Gas Treatment / Elemental Sulfur
Claus Plant with Tail Gas Treatment / Elemental Sulfur
Particulate Control Cyclone, Candle Filter, Scrubber, and AGR Absorber
Cyclone, Candle Filter, Scrubber, and AGR
Absorber Mercury Control Carbon Bed Carbon Bed
NOx Control MNQC (LNB), N2 Dilution, Humidification and steam
dilution
MNQC (LNB), N2 Dilution and Humidification
CO2 Separation N/A Selexol 2nd Stage Overall Carbon Capture N/A 90.0% CO2 Sequestration N/A Off-site Saline Formation

Cost and Performance Baseline for Fossil Energy Plants Volume 1b: Revision 2b
63
Exhibit 3-11 Balance of plant assumptions
Parameters Values Cooling system Recirculating Wet Cooling Tower Fuel and Other storage Coal 30 days Slag 30 days Sulfur 30 days Sorbent 30 days Plant Distribution Voltage Motors below 1 hp 110/220 V Motors between 1 hp and 250 hp 480 V Motors between 250 hp and 5,000 hp 4,160 V
Motors above 5,000 hp 13,800 V Steam and Combustion Turbine Generators 24,000 V
Grid Interconnection Voltage 345 kV Water and Waste Water
Makeup Water
The water supply is 50 percent from a local POTW and 50 percent from groundwater, and is assumed to be in sufficient quantities to meet plant makeup requirements. Makeup for potable, process, and de-ionized (DI) water is drawn from municipal sources
Process Wastewater Water associated with gasification activity and storm water that contacts equipment surfaces is collected and treated for discharge through a permitted discharge.
Sanitary Waste Disposal
Design includes a packaged domestic sewage treatment plant with effluent discharged to the industrial wastewater treatment system. Sludge is hauled off site. Packaged plant was sized for 5.68 cubic meters per day (1,500 gallons per day)
Water Discharge Most of the process wastewater is recycled to the cooling tower basin. Blowdown is treated for chloride and metals, and discharged.
3.2.4 Sparing Philosophy The sparing philosophy for cases B1A and B1B is provided below. Dual trains are used to accommodate the size of commercial CTs. There is no redundancy other than normal sparing of rotating equipment. The plant design consists of the following major subsystems:
• Two ASUs (2 x 50%) • Two trains of coal drying and dry feed systems (2 x 50%) • Two trains of gasification, including gasifier, SGC, cyclone, and barrier filter (2 x 50%) • Two trains of syngas clean-up process (2 x 50%) • Two trains of Sulfinol-M acid gas removal in Case B1A and two-stage Selexol in Case
B1B (2 x 50%)

Cost and Performance Baseline for Fossil Energy Plants Volume 1b: Revision 2b
64
• Two CO2 compression systems (2 x 50%) in Case B1B • One train of Claus-based sulfur recovery (1 x 100%) • Two CT/HRSG tandems (2 x 50%) • One steam turbine (1 x 100%)
3.2.5 Case B1A - Performance Results The plant produces a net output of 629 MWe at a net plant efficiency of 42.1 percent (HHV basis). Shell has reported expected efficiencies using bituminous coal of around 44-45 percent (HHV basis), although this value excluded the net power impact of coal drying. (48) Accounting for coal drying would reduce the efficiency by only about 0.5-1 percentage points so the efficiency results for the Shell case are still lower in this report than those reported by the vendor.
Overall performance for the entire plant is summarized in Exhibit 3-12; Exhibit 3-13 provides a detailed breakdown of the auxiliary power requirements. The ASU accounts for approximately 79 percent of the total auxiliary load distributed between the main air compressor, oxygen compressor, nitrogen compressor, and ASU auxiliaries. The cooling water system, including the CWPs and cooling tower fan, accounts for approximately 5 percent of the auxiliary load, and the BFW pumps account for an additional 4 percent. All other individual auxiliary loads are 3 percent or less of the total.

Cost and Performance Baseline for Fossil Energy Plants Volume 1b: Revision 2b
65
Exhibit 3-12 Case B1A plant performance summary
Performance Summary Combustion Turbine Power, MWe 464 Sweet Gas Expander Power, MWe 0 Steam Turbine Power, MWe 273 Total Gross Power, MWe 737 Air Separation Unit Main Air Compressor, kWe 45,190 Oxygen Compressor, kWe 8,890 Nitrogen Compressors, kWe 29,850 CO₂ Compression, kWe 0 Acid Gas Removal, kWe 620 Balance of Plant, kWe 23,550 Total Auxiliaries, MWe 108 Net Power, MWe 629 HHV Net Plant Efficiency (%) 42.1% HHV Net Plant Heat Rate, kJ/kWh (Btu/kWh) 8,546 (8,100) HHV Cold Gas Efficiency, % 84.5% HHV Combustion Turbine Efficiency, % 38.3% LHV Net Plant Efficiency (%) 43.7% LHV Net Plant Heat Rate, kJ/kWh (Btu/kWh) 8,242 (7,812) LHV Cold Gas Efficiency, % 82.8% LHV Combustion Turbine Efficiency, % 40.5% Steam Turbine Cycle Efficiency, % 44.8% Steam Turbine Heat Rate, kJ/kWh (Btu/kWh) 8,037 (7,618) Condenser Duty, GJ/hr (MMBtu/hr) 1,397 (1,324) As-Received Coal Feed, kg/hr (lb/hr) 198,059 (436,646) HHV Thermal Input, kWt 1,492,878 LHV Thermal Input, kWt 1,439,899 Raw Water Withdrawal, (m3/min)/MWnet (gpm/MWnet) 0.025 (6.6) Raw Water Consumption, (m3/min)/MWnet (gpm/MWnet) 0.020 (5.3) O₂:Coal 0.705

Cost and Performance Baseline for Fossil Energy Plants Volume 1b: Revision 2b
66
Exhibit 3-13 Case B1A plant power summary
Power Summary Combustion Turbine Power, MWe 464 Sweet Gas Expander Power, MWe 0 Steam Turbine Power, MWe 273 Total Gross Power, MWe 737
Auxiliary Load Summary Coal Handling, kWe 440 Coal Milling, kWe 2,040 Sour Water Recycle Slurry Pump, kWe 0 Slag Handling, kWe 520 Air Separation Unit Auxiliaries, kWe 1,000 Air Separation Unit Main Air Compressor, kWe 45,190 Oxygen Compressor, kWe 8,890 Nitrogen Compressors, kWe 29,850 Feedwater Pumps, kWe 4,500 Quench Water Pump, kWe 0 Syngas Recycle Compressor, kWe 680 CO₂ Compression, kWe 0 Scrubber Pumps, kWe 770 Acid Gas Removal, kWe 620 Combustion Turbine Auxiliaries, kWe 1,000 Steam Turbine Auxiliaries, kWe 100 Condensate Pumps, kWe 230 Circulating Water Pumps, kWe 3,400 Ground Water Pumps, kWe 380 Cooling Tower Fans, kWe 1,760 Claus Plant/TGTU Auxiliaries, kWe 250 Claus Plant TG Recycle Compressor, kWe 890 Miscellaneous Balance of PlantA, kWe 3,000 Transformer Losses, kWe 2,590 Total Auxiliaries, MWe 108 Net Power, MWe 629
AIncludes plant control systems, lighting, HVAC, and miscellaneous low voltage loads
3.2.5.1 Environmental Performance The environmental targets for emissions of Hg, NOx, SO2, and PM were presented in Section 2.3. A summary of the plant air emissions for Case B1A is presented in Exhibit 3-14. All HCl is assumed to be removed and is, therefore, not reported.

Cost and Performance Baseline for Fossil Energy Plants Volume 1b: Revision 2b
67
Exhibit 3-14 Case B1A air emissions
kg/GJ (lb/MMBtu) Tonne/year (ton/year)A kg/MWh (lb/MWh)B
SO2 0.002 (0.004) 68 (75) 0.013 (0.029) NOx 0.025 (0.059) 957 (1,055) 0.185 (0.409) Particulates 0.003 (0.0071) 115 (127) 0.022 (0.049) Hg 1.87E-7 (4.34E-7) 0.007 (0.008) 1.36E-6 (3.00E-6) CO2 85 (197) 3,188,643 (3,514,877) 617 (1,361) CO2C - - 723 (1,595)
ACalculations based on an 80 percent capacity factor BEmissions are based on gross power except where otherwise noted CCO2 emissions based on net power instead of gross power
The low level of SO2 emissions is achieved by capturing the sulfur in the gas by the Sulfinol-M AGR process. The AGR process removes over 99 percent of the sulfur compounds in the fuel gas down to a level of less than 6 ppmv. This results in a concentration in the HRSG flue gas of less than 2 ppmv. The H2S-rich regeneration gas from the AGR system is fed to a Claus plant, producing elemental sulfur. The Claus plant tail gas is compressed and recycled back to the AGR to capture most of the remaining sulfur. The SO2 emissions in Exhibit 3-14 include both the stack emissions and the coal dryer emissions.
NOx emissions are limited by the use of nitrogen dilution, humidification, and steam dilution to 15 ppmvd (as NO2 @ 15 percent O2). Ammonia in the syngas is removed with process condensate prior to the low-temperature AGR process and destroyed in the Claus plant burner. This helps lower NOx levels as well.
Particulate discharge to the atmosphere is limited to extremely low values by the use of a cyclone and a barrier filter in addition to the syngas scrubber and the gas washing effect of the AGR absorber. The particulate emissions represent filterable particulate only.
Approximately 97 percent of the mercury is captured from the syngas by dual activated carbon beds.
CO2 emissions represent the uncontrolled discharge from the process.
The carbon balance for the plant is shown in Exhibit 3-15. The carbon input to the plant consists of carbon in the air in addition to carbon in the coal. Carbon in the air is not neglected here since the Aspen model accounts for air components throughout. Carbon leaves the plant as unburned carbon in the slag and as CO2 in the stack gas and ASU vent gas.

Cost and Performance Baseline for Fossil Energy Plants Volume 1b: Revision 2b
68
Exhibit 3-15 Case B1A carbon balance
Carbon In Carbon Out kg/hr (lb/hr) kg/hr (lb/hr)
Coal 126,252 (278,339) Stack Gas 124,177 (273,764) Air (CO₂) 508 (1,120) Coal Dryer Stack 1,863 (4,106)
CO₂ Product 0 (0) ASU Vent 89 (197) Slag 631 (1,392)
Total 126,760 (279,459) Total 126,760 (279,459)
Exhibit 3-16 shows the sulfur balance for the plant. Sulfur input comes solely from the sulfur in the coal. Sulfur output includes the sulfur recovered in the Claus plant, sulfur in the coal drying gas, and sulfur emitted in the stack gas. Sulfur in the slag is considered to be negligible.
Exhibit 3-16 Case B1A sulfur balance
Sulfur In Sulfur Out kg/hr (lb/hr) kg/hr (lb/hr)
Coal 4,964 (10,944) Stack Gas 5 (11) Coal Dryer Stack 0 (0) CO₂ Product 0 (0) Elemental Sulfur 4,959 (10,933)
Total 4,964 (10,944) Total 4,964 (10,944)
Exhibit 3-17 shows the overall water balance for the plant.
Water demand represents the total amount of water required for a particular process. Some water is recovered within the process, primarily as syngas condensate, and is re-used as internal recycle. The difference between demand and recycle is raw water withdrawal. Raw water withdrawal is defined as the water removed from the ground or diverted from a municipal source for use in the plant and was assumed to be provided 50 percent by a POTW and 50 percent from groundwater. Raw water withdrawal can be represented by the water metered from a raw water source and used in the plant processes for any and all purposes, such as cooling tower makeup, BFW makeup, quench system makeup, and slag handling makeup. The difference between water withdrawal and process water discharge is defined as water consumption and can be represented by the portion of the raw water withdrawn that is evaporated, transpired, incorporated into products or otherwise not returned to the water source from which it was withdrawn. Water consumption represents the net impact of the plant process on the water source balance.

Cost and Performance Baseline for Fossil Energy Plants Volume 1b: Revision 2b
69
Exhibit 3-17 Case B1A water balance
Water Use Water Demand
Internal Recycle
Raw Water Withdrawal
Process Water
Discharge Raw Water
Consumption
m3/min (gpm)
m3/min (gpm)
m3/min (gpm) m3/min (gpm) m3/min (gpm)
Slag Handling 0.43 (114) 0.17 (45) 0.26 (69) – 0.26 (69) Slurry Water – – – – – Quench/Wash – – – – – Humidifier 1.38 (365) – 1.38 (365) – 1.38 (365) SWS Blowdown – – – 0.00 (0.45) 0.00 (-0.45) Condenser Makeup 1.07 (282) – 1.07 (282) – 1.07 (282) BFW Makeup 0.23 (62) – 0.23 (62) – 0.23 (62) Gasifier Steam 0.32 (84) – 0.32 (84) – 0.32 (84) Shift Steam – – – – – CT Steam Dilution 0.51 (135) – 0.51 (135) – 0.51 (135)
Cooling Tower 13.25 (3,501) 0.25 (67) 13.00 (3,435) 2.98 (787) 10.02 (2,647)
BFW Blowdown – 0.23 (62) -0.23 (-62) – -0.23 (-62) SWS Blowdown – 0.02 (4.50) -0.02 (-4.50) – -0.02 (-4.50)
Total 16.13 (4,261) 0.42 (112) 15.71 (4,150) 2.98 (788) 12.73 (3,362)
3.2.5.2 Heat and Mass Balance Diagrams Heat and mass balance diagrams are shown for the following subsystems in Exhibit 3-18 through Exhibit 3-20:
• Coal gasification and ASU • Syngas cleanup, sulfur recovery, and tail gas recycle • Combined cycle power generation, steam, and FW
An overall plant energy balance is provided in tabular form in Exhibit 3-21. The power out is the combined CT and steam turbine power prior to generator losses. The power at the generator terminals (shown in Exhibit 3-12) is calculated by multiplying the power out by a combined generator efficiency of 98.5 percent.

Cost and Performance Baseline for Fossil Energy Plants Volume 1b: Revision 2b
70
This page intentionally left blank

Cost and Performance Baseline for Fossil Energy Plants Volume 1b: Revision 2b
71
Exhibit 3-18 Case B1A coal gasification and ASU heat and mass balance schematic
Source: NETL
DOE/NETL
DUAL TRAIN IGCC PLANTCASE B1A
HEAT AND MATERIAL FLOW DIAGRAM
BITUMINOUS BASELINE STUDYCASE B1A
SHELL GASIFIERASU, GASIFICATION, AND GAS COOLING
DWG. NO.BB-HMB-CS-B1A-PG-1
PLANT PERFORMANCE SUMMARY
LEGEND
PAGES1 OF 3
Ambient Air
IntercooledAir Compressor
ElevatedPressure
ASU
IntercooledNitrogen Compressor
IntercooledOxygen Compressor
Milled Coal
SlagRemoval
Slag
Gross Plant Power: 737 MWeAuxiliary Load: 108 MWeNet Plant Power: 629 MWeNet Plant Efficiency, HHV: 42.1%Net Plant Heat Rate: 8,100 Btu/kWh
Dry CoalCoal
Feeding
Boost Compressor
RecycleCompressor
280,565 W220 T225 P51 H
337,302 W393 T625 P147 H
To Claus Plant
9 10
1
3
4
7
6
11
2
1,168,307 W59 T15 P13 H
48,319 W70 T16 P16 H
937,042 W90 T56 P14 H
130,495 W50 T
182 P3 H
6,236 W90 T
125 P11 H
325,738 W90 T
125 P11 H
325,738 W241 T940 P41 H
54,557 W376 T785 P84 H
436,646 W59 T15 P
408,345 W60 T
840 P
43,732 W2,600 T
615 P
1,124,342 W1,974 T
615 P750 H
787,039 W375 T585 P140 H
280,565 W810 T235 P199 H
1,012,980 W389 T384 P88 H
5
42,132 W650 T740 P
1,309 H
CoalDrying
Incinerator
Syngas Slip StreamIncinerator Air
11,218 W112 T530 P26 H
53,179 W59 T15 P13 H
92,698 W12
8
1,067,536 W199 T384 P40 H
337,302 W375 T585 P140 H
Syngas Cooler
Duct Cooler
Steam Generation
Shell Gasifier
From HP Economizer 2
Air From GT Compressor
N2 to GT Combustor
From HP Economizer 2
To HP Economizer 1
1,124,342 W600 T595 P221 H
Pre Particulat Cooler
Post Particulate
Cooler
CycloneCandle Filter
To Superheater
From LP Economizer
To LP Evaporator
To Superheater
From HP Economizer 2
Raw Syngasto Scrubber
1,124,342 W1,650 T
605 P620 H
1,167,264 W100 T190 P18 H
13
Incinerator Exhaust
Steam
Air
Oxygen
Nitrogen
Coal/Char/Slurry/Slag
Synthesis Gas
Water
Steam
W Flowrate, lbm/hr T Temperature, °FP Absolute Pressure, PSIAH Enthalpy, Btu/lbmMWe Power, Megawatts Electrical
Flue Gas/CombustionProducts
Vent ASU
Notes:1. Enthalpy reference point is natural state
at 32 °F and 0.08865 psia

Cost and Performance Baseline for Fossil Energy Plants Volume 1b: Revision 2b
72
Exhibit 3-19 Case B1A syngas cleanup heat and mass balance schematic
Source: NETL
DOE/NETL
DUAL TRAIN IGCC PLANTCASE B1A
HEAT AND MATERIAL FLOW DIAGRAM
BITUMINOUS BASELINE STUDYCASE B1A
SHELL GASIFIERGAS CLEANUP SYSTEM
PLANT PERFORMANCE SUMMARY
LEGEND
Mercury Removal
KnockOut
Drum
Raw Syngas
Sour Drum
Claus Plant
Tail Gas
Furnace
CatalyticReactorBeds
Sulfur
COSHydrolysis
Reboiler
DWG. NO.BB-HMB-CS-B1A-PG-2
PAGES2 OF 3
SourStripper
Clean Gas
Acid Gas
SyngasScrubber
Gross Plant Power: 737 MWeAuxiliary Load: 108 MWeNet Plant Power: 629 MWeNet Plant Efficiency, HHV: 42.1%Net Plant Heat Rate: 8,100 Btu/kWh
13
AGR- Sulfinol
15
16
20
21
22
787,039 W375 T585 P140 H
23,692 W100 T800 P
5 H
782,178 W201 T580 P75 H
782,178 W351 T565 P128 H
790,887 W94 T
535 P19 H
SyngasCoolers
From HP Economizer 2
746,680 W112 T530 P26 H
1,962 W142 T65 P76 H
30,253 W450 T59 P
433 H
32,989 W112 T530 P
6 H
Knock Out
Tailgas to AGR
To Superheater
782,178 W350 T575 P128 H
767,195 W94 T
540 P19 H
6,561 W119 T57 P45 H
Treated Syngas
14
Slip Stream to Coal Dryer
17
Humidification 18 Humidified Fuel Gas19
8
Tailgas RecycleCompressor
HydrogenationAnd Tail Gas
Cooling
24,042 W120 T57 P38 H
To Preheater and LP Evaporator
From Tail Gas Cooler and LP
Economizer
To Fuel Gas Preheater
To Fuel Gas Preheater
992,575 W195 T580 P159 H
992,575 W150 T
1,205 P113 H
To Water Treatment
Makeup Water
11,218 W112 T530 P26 H
920,796 W380 T460 P328 H
From Syngas Scrubber and HP
Economizer 2
To Syngas Scrubber and HP Economizer 1
920,796 W321 T465 P305 H
From Gland Steam Condenser
To Syngas Cooling
110 T
COS HydrolysisPreheater
56,804 WTo Slag Quench
10,933 W
6,236 W90 T
125 P11 H
3
6,236 W450 T125 P92 H
To Deaerator
From IP BFW
Fuel Gas Preheater
Claus OxygenPreheater
Oxygen
Air
Oxygen
Nitrogen
Coal/Char/Slurry/Slag
Synthesis Gas
Sour Water
Acid Gas
Tailgas
Sour Gas
Sulfur
Hydrogen
Water
W Flowrate, lbm/hr T Temperature, °FP Absolute Pressure, PSIAH Enthalpy, Btu/lbmMWe Power, Megawatts Electrical
Steam
Notes:1. Enthalpy reference point is natural state
at 32 °F and 0.08865 psia

Cost and Performance Baseline for Fossil Energy Plants Volume 1b: Revision 2b
73
Exhibit 3-20 Case B1A combined cycle power generation heat and mass balance schematic
Source: NETL
DOE/NETL
DUAL TRAIN IGCC PLANTCASE B1A
HEAT AND MATERIAL FLOW DIAGRAM
BITUMINOUS BASELINE STUDYCASE B1A
GEE GASIFIERPOWER BLOCK SYSTEM
DWG. NO.BB-HMB-CS-B1A-PG-3
LEGEND
Air
Oxygen
Nitrogen
Coal/Char/Slurry/Slag
Synthesis Gas
PAGES3 OF 3
Sour Gas
Sour Water
Water
Steam
Flue Gas
W Flowrate, lbm/hr T Temperature, °FP Absolute Pressure, PSIAH Enthalpy, Btu/lbmMWe Power, Megawatts Electrical
HPTurbine
IPTurbine
Air Inlet Filter
Steam Seal Regulator
GlandSteam
Condenser
LP Turbine
Stack
ExpanderCompressor
Generator
Generator
Steam Turbine
State-of-the-art 2008 F-Class Turbine
7,014,133 W59 T15 P13 H
1,548,142 W101 T
1 P69 H
8,735,054 W270 T15 P
120 H
920,796 W380 T460 P328 H
1,569,663 W1,038 T1,815 P1,495 H
12,478 W298 T65 P
1,171 H
1,395,353 W537 T65 P
1,293 H
1,548,142 W103 T120 P71 H
1,400 W658 T65 P
1,352 H
1,400 W212 T15 P
180 H
20
24
19
23
Hot Well
Condenser 140,852 W59 T15 P27 H
8,841 W698 T501 P
1,348 H
9,537 W658 T65 P
1,352 H
782 W1,038 T1,815 P1,495 H
1,314 W537 T65 P
1,293 H
Preheater DeaeratorHeater
HP Economizer
1
LP Economizer
HP Economizer
2
HP Evaporator
Superheater/ Reheater
From Syngas CoolerTo Duct/Radiant
Syngas/Pre Particulate Coolers and COS Preheater
From Duct/Radiant Syngas/Pre Particulate Coolers and COS
Preheater
To ASU and Fuel Gas Preheater
Deaerator
From ASU and Fuel Gas Preheater
LP Evaporator
From Claus, Process Extraction, and 250 PSIA Header
LP Extraction Spray
LP Blowdown Hot Reheat
8,735,054 W1,088 T
15 P340 H
22
To WWT
Condensate to Tail Gas Cooling
Process Extraction
235 T
274 T
1,712,806 W274 T45 P
242 H
1,604,593 W279 T
2,251 P247 H
8,564 W274 T79 P
242 H
19,460 W274 T79 P
242 H 35,526 W276 T615 P244 H
571,152 W351 T
2,251 P319 H
305 T 585 T 636 T
34,923 W585 T
2,001 P585 H
636 T
1,190,740 W585 T
2,001 P585 H
1,446,064 W698 T501 P
1,348 H
571,152 W585 T
2,001 P585 H
1,012,980 W385 T389 P87 H
21Air Extraction
280,565 W810 T235 P199 H
187,712 W298 T65 P
266 H
180 T
80,190 W298 T65 P
1,171 H
Steam to Gasifier and Combustion
Turbine109,842 W
688 T745 P
1,327 H
Water Makeup
1,000 W1,038 T1,815 P1,495 H
1,000 W212 T15 P
180 H
31,177 W500 T250 P
1,255 H
IP Extraction Steam to 250 PSIA Header
LP Extraction Spray #1
1,038 T
To Post Particulate
and Syngas Coolers
From Post Particulate
and Syngas Coolers
LP Extraction Spray #2
14,327 W241 T825 P209 H
Process Extraction40,813 W
537 T65 P
1,293 H
Nitrogen Diluent
Fuel Gas Steam Diluent67,710 W
475 T460 P
1,233 H
IP to Claus
LP Pump
IP Pump
HP Pump
PLANT PERFORMANCE SUMMARY
Gross Plant Power: 737 MWeAuxiliary Load: 108 MWeNet Plant Power: 629 MWeNet Plant Efficiency, HHV: 42.1%Net Plant Heat Rate: 8,100 Btu/kWh
CondensatePumps
Notes:1. Enthalpy reference point is natural state
at 32 °F and 0.08865 psia

Cost and Performance Baseline for Fossil Energy Plants Volume 1b: Revision 2b
74
This page intentionally left blank
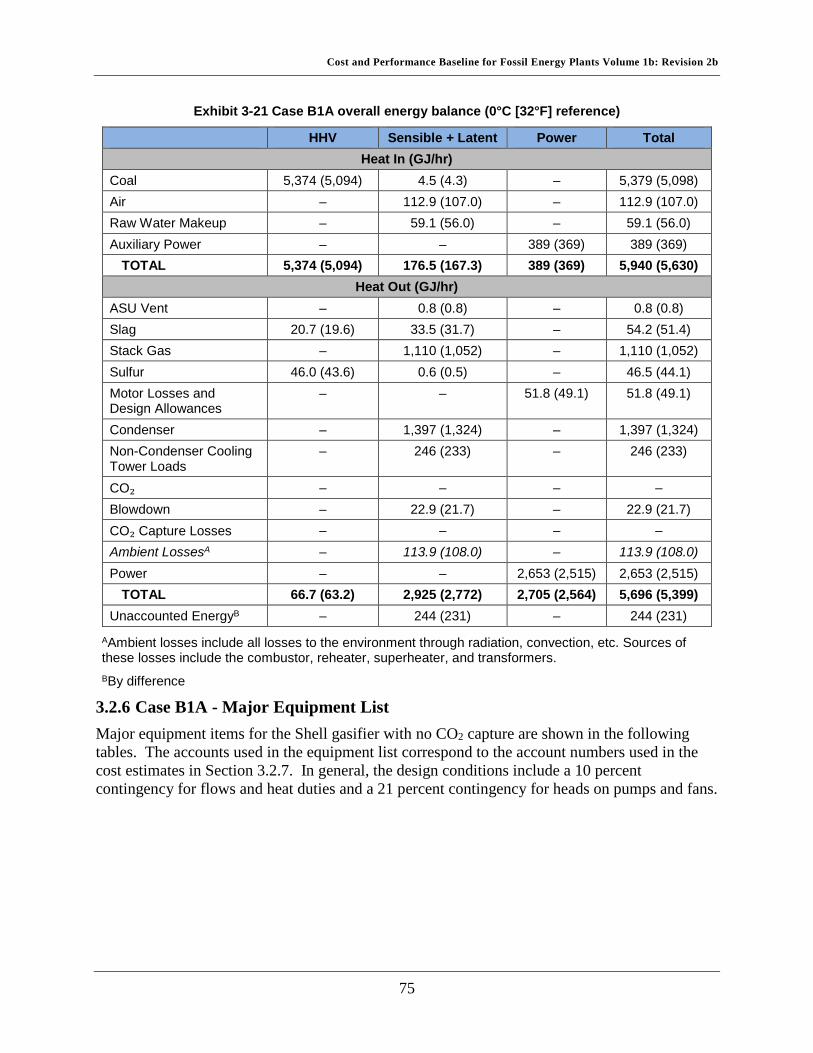
Cost and Performance Baseline for Fossil Energy Plants Volume 1b: Revision 2b
75
Exhibit 3-21 Case B1A overall energy balance (0°C [32°F] reference)
HHV Sensible + Latent Power Total Heat In (GJ/hr)
Coal 5,374 (5,094) 4.5 (4.3) – 5,379 (5,098) Air – 112.9 (107.0) – 112.9 (107.0) Raw Water Makeup – 59.1 (56.0) – 59.1 (56.0) Auxiliary Power – – 389 (369) 389 (369)
TOTAL 5,374 (5,094) 176.5 (167.3) 389 (369) 5,940 (5,630) Heat Out (GJ/hr)
ASU Vent – 0.8 (0.8) – 0.8 (0.8) Slag 20.7 (19.6) 33.5 (31.7) – 54.2 (51.4) Stack Gas – 1,110 (1,052) – 1,110 (1,052) Sulfur 46.0 (43.6) 0.6 (0.5) – 46.5 (44.1) Motor Losses and Design Allowances
– – 51.8 (49.1) 51.8 (49.1)
Condenser – 1,397 (1,324) – 1,397 (1,324) Non-Condenser Cooling Tower Loads
– 246 (233) – 246 (233)
CO₂ – – – – Blowdown – 22.9 (21.7) – 22.9 (21.7) CO₂ Capture Losses – – – – Ambient LossesA – 113.9 (108.0) – 113.9 (108.0) Power – – 2,653 (2,515) 2,653 (2,515)
TOTAL 66.7 (63.2) 2,925 (2,772) 2,705 (2,564) 5,696 (5,399) Unaccounted EnergyB – 244 (231) – 244 (231)
AAmbient losses include all losses to the environment through radiation, convection, etc. Sources of these losses include the combustor, reheater, superheater, and transformers. BBy difference
3.2.6 Case B1A - Major Equipment List Major equipment items for the Shell gasifier with no CO2 capture are shown in the following tables. The accounts used in the equipment list correspond to the account numbers used in the cost estimates in Section 3.2.7. In general, the design conditions include a 10 percent contingency for flows and heat duties and a 21 percent contingency for heads on pumps and fans.

Cost and Performance Baseline for Fossil Energy Plants Volume 1b: Revision 2b
76
Case B1A – Account 1: Coal Handling Equipment
No. Description Type Design Condition Operating Qty. Spares
1 Bottom Trestle Dumper and Receiving Hoppers N/A 181 tonne (200 ton) 2 0
2 Feeder Belt 570 tonne/hr (630 tph) 2 0 3 Conveyor No. 1 Belt 1,130 tonne/hr (1,250 tph) 1 0 4 Conveyor No. 2 Belt 1,130 tonne/hr (1,250 tph) 1 0 5 Stacker/Reclaimer Traveling, linear 1,130 tonne/hr (1,250 tph) 1 0 6 Reclaim Hopper N/A 40 tonne (50 ton) 2 1 7 Feeder Vibratory 160 tonne/hr (180 tph) 2 1 8 Conveyor No. 3 Belt w/ tripper 330 tonne/hr (360 tph) 1 0 9 Coal Surge Bin w/ Vent Filter Dual outlet 160 tonne (180 ton) 2 0
10 Crusher Impactor reduction 8 cm x 0 - 3 cm x 0 (3" x 0 - 1-1/4" x 0) 2 0
11 Conveyor No. 4 Belt w/ tripper 330 tonne/hr (360 tph) 1 0 12 Conveyor No. 5 Belt w/ tripper 330 tonne/hr (360 tph) 1 0
13 Coal Silo w/ Vent Filter and Slide Gates Field erected 730 tonne (800 ton) 3 0
Case B1A – Account 2: Coal Preparation and Feed Equipment
No. Description Type Design Condition Operating Qty. Spares
1 Feeder Vibratory 70 tonne/hr (80 tph) 3 0 2 Conveyor No. 6 Belt w/ tripper 220 tonne/hr (240 tph) 1 0 3 Roller Mill Feed Hopper Dual Outlet 440 tonne (480 ton) 1 0 4 Weigh Feeder Belt 110 tonne/hr (120 tph) 2 0 5 Coal Dryer and Pulverizer Rotary 110 tonne/hr (120 tph) 2 0 6 Coal Dryer Feed Hopper Vertical Hopper 220 tonne (240 ton) 2 0
Case B1A – Account 3: Feedwater and Miscellaneous Systems and Equipment Equipment
No. Description Type Design Condition Operating Qty. Spares
1 Demineralized Water Storage Tank
Vertical, cylindrical, outdoor
1,165,000 liters (308,000 gal) 2 0
2 Condensate Pumps Vertical canned 6,480 lpm @ 90 m H₂O (1,710 gpm @ 300 ft H₂O) 2 1
3 Deaerator (integral w/ HRSG) Horizontal spray type 436,000 kg/hr
(962,000 lb/hr) 2 0
4 Intermediate-Pressure Feedwater Pump
Horizontal centrifugal, single stage
7,410 lpm @ 30 m H₂O (1,960 gpm @ 90 ft H₂O) 2 1
5 High-Pressure Feedwater Pump No. 1
Barrel type, multi-stage, centrifugal
HP water: 6,940 lpm @ 1,800 m H₂O
(1,830 gpm @ 6,100 ft H₂O) 2 1
6 High-Pressure Feedwater Pump No. 2
Barrel type, multi-stage, centrifugal
IP water: 2,470 lpm @ 220 m H₂O (650 gpm @ 730 ft H₂O) 2 1
7 Auxiliary Boiler Shop fabricated, water tube
18,000 kg/hr, 2.8 MPa, 343°C (40,000 lb/hr, 400 psig, 650°F) 1 0
8 Service Air Compressors Flooded screw 28 m3/min @ 0.7 MPa
(1,000 scfm @ 100 psig) 2 1
9 Instrument Air Dryers Duplex, regenerative 28 m3min(1,000 scfm) 2 1
10 Closed Cycle Cooling Heat Exchangers Plate and frame 135 GJ/hr
(128 MMBtu/hr) each 2 0
11 Closed Cycle Cooling Water Pumps Horizontal centrifugal 48,500 lpm @ 20 m H₂O
(12,800 gpm @ 70 ft H₂O) 2 1
12 Engine-Driven Fire Pump
Vertical turbine, diesel engine
3,785 lpm @ 110 m H₂O (1,000 gpm @ 350 ft H₂O) 1 1

Cost and Performance Baseline for Fossil Energy Plants Volume 1b: Revision 2b
77
Equipment No. Description Type Design Condition Operating
Qty. Spares
13 Fire Service Booster Pump
Two-stage horizontal centrifugal
2,650 lpm @ 80 m H₂O (700 gpm @ 250 ft H₂O) 1 1
14 Raw Water Pumps Stainless steel, single suction
4,400 lpm @ 20 m H₂O (1,160 gpm @ 60 ft H₂O) 2 1
15 Ground Water Pumps Stainless steel, single suction
2,930 lpm @ 270 m H₂O (780 gpm @ 880 ft H₂O) 3 1
16 Filtered Water Pumps Stainless steel, single suction
1,780 lpm @ 50 m H₂O (470 gpm @ 160 ft H₂O) 2 1
17 Filtered Water Tank Vertical, cylindrical 852,000 liter (225,000 gal) 2 0
18 Makeup Water Demineralizer
Anion, cation, and mixed bed 320 lpm (90 gpm) 2 0
19 Liquid Waste Treatment System N/A 10 years, 24-hour storm 1 0
Case B1A – Account 4: Gasifier, ASU, and Accessories Including Low Temperature Heat Recovery and Fuel Gas Saturation Equipment
No. Description Type Design Condition Operating Qty. Spares
1 Gasifier Pressurized dry-feed, entrained bed
2,600 tonne/day, 4.2 MPa (2,900 tpd, 615 psia) 2 0
2 Synthesis Gas Cooler Convective spiral-wound tube boiler 280,000 kg/hr (618,000 lb/hr) 2 0
3 Synthesis Gas Cyclone High efficiency 280,000 kg/hr (618,000 lb/hr)
Design efficiency 90% 2 0
4 Candle Filter Pressurized filter with pulse-jet cleaning metallic filters 2 0
5 Syngas Scrubber Including Sour Water Stripper
Vertical upflow 196,000 kg/hr (433,000 lb/hr) 2 0
6 Raw Gas Coolers Shell and tube with condensate drain 193,000 kg/hr (425,000 lb/hr) 8 0
7 Raw Gas Knockout Drum
Vertical with mist eliminator
192,000 kg/hr, 35°C, 3.8 MPa (423,000 lb/hr, 94°F, 545 psia) 2 0
8 Saturation Water Economizers Shell and tube 131 GJ/hr (124 MMBtu/hr) 2 0
9 Fuel Gas Saturator Vertical tray tower 230,000 kg/hr, 161°C, 3.3 MPa (506,000 lb/hr, 321°F, 480 psia) 2 0
10 Saturator Water Pump Centrifugal 3,600 lpm @ 13 m H₂O
(900 gpm @ 42 ft H₂O) 2 2
11 Synthesis Gas Reheater Shell and tube 186,000 kg/hr (411,000 lb/hr) 2 0
12 Flare Stack Self-supporting, carbon steel, stainless steel top, pilot ignition
196,000 kg/hr (433,000 lb/hr) syngas 2 0
13 ASU Main Air Compressor Centrifugal, multi-stage 4,000 m3/min @ 1.3 MPa
(141,000 scfm @ 190 psia) 2 0
14 Cold Box Vendor design 2,000 tonne/day (2,200 tpd) of 95% purity oxygen 2 0
15 Oxygen Compressor Centrifugal, multi-stage 1,000 m3/min (35,000 scfm) Suction - 1.0 MPa (130 psia)
Discharge - 6.5 MPa (940 psia) 2 0
16 Primary Nitrogen Compressor Centrifugal, multi-stage
3,000 m3/min (116,000 scfm) Suction - 0.4 MPa (60 psia)
Discharge - 2.7 MPa (390 psia) 2 0
17 Secondary Nitrogen Compressor
Centrifugal, single-stage
460 m3/min (16,000 scfm) Suction - 1.3 MPa (180 psia)
Discharge - 2.7 MPa (390 psia) 2 0

Cost and Performance Baseline for Fossil Energy Plants Volume 1b: Revision 2b
78
Equipment No. Description Type Design Condition Operating
Qty. Spares
18 Transport Nitrogen Boost Compressor
Centrifugal, single-stage
190 m3/min (7,000 scfm) Suction - 2.6 MPa (380 psia)
Discharge - 5.4 MPa (790 psia) 2 0
19 Extraction Air Heat Exchanger
Gas-to-gas, vendor design
70,000 kg/hr, 432°C, 1.6 MPa (154,000 lb/hr, 810°F, 235 psia) 2 0
Case B1A – Account 5: Syngas Cleanup Equipment
No. Description Type Design Condition Operating Qty. Spares
1 Mercury Adsorber 1 Sulfated carbon bed 191,000 kg/hr (422,000 lb/hr), 35°C (94°F), 3.7 MPa (540 psia) 2 0
2 Mercury Adsorber 2 Sulfated carbon bed 191,000 kg/hr (422,000 lb/hr), 35°C (94°F), 3.7 MPa (535 psia) 2 0
3 Sulfur Plant Claus type 131 tonne/day (144 tpd) 1 0
4 COS Hydrolysis Reactor Fixed bed, catalytic 195,000 kg/hr (430,000 lb/hr),
177°C (350°F), 4.0 MPa (580 psia) 2 0
5 Acid Gas Removal Plant Sulfinol 197,000 kg/hr (435,000 lb/hr),
34°C (94°F), 3.7 MPa (535 psia) 2 0
6 Hydrogenation Reactor Fixed bed, catalytic
15,000 kg/hr (33,000 lb/hr), 232°C (450°F), 0.4 MPa (58.9
psia) 1 0
7 Tail Gas Recycle Compressor Centrifugal 12,000 kg/hr (26,000 lb/hr) each 1 0
Case B1A – Account 6: Combustion Turbine and Auxiliaries Equipment
No. Description Type Design Condition Operating Qty. Spares
1 Combustion Turbine State-of-the-art 2008 F-class 230 MW 2 0
2 Combustion Turbine Generator TEWAC 260 MVA @ 0.9 p.f., 24 kV, 60 Hz,
3-phase 2 0
Case B1A – Account 7: HRSG, Ducting, and Stack Equipment
No. Description Type Design Condition Operating Qty. Spares
1 Stack CS plate, type 409SS liner
76 m (250 ft) high x 8.4 m (28 ft) diameter 1 0
2 Heat Recovery Steam Generator
Drum, multi-pressure with economizer section and integral deaerator
Main steam - 391,593 kg/hr, 12.4 MPa/559°C
(863,314 lb/hr, 1,800 psig/1,038°F) 2 0
Case B1A – Account 8: Steam Turbine Generator and Auxiliaries Equipment
No. Description Type Design Condition Operating Qty. Spares
1 Steam Turbine
Commercially available advanced steam turbine
287 MW 12.4 MPa/559°C/559°C
(1,800 psig/ 1,038°F/1,038°F) 1 0
2 Steam Turbine Generator
Hydrogen cooled, static excitation
320 MVA @ 0.9 p.f., 24 kV, 60 Hz, 3-phase 1 0
3 Surface Condenser
Single pass, divided waterbox including vacuum pumps
1,540GJ/hr (1,460 MMBtu/hr), Inlet water temperature 16°C
(60°F), Water temperature rise 11°C (20°F)
1 0

Cost and Performance Baseline for Fossil Energy Plants Volume 1b: Revision 2b
79
Equipment No. Description Type Design Condition Operating
Qty. Spares
4 Steam Bypass One per HRSG 50% steam flow @ design steam
conditions 2 0
Case B1A – Account 9: Cooling Water System Equipment
No. Description Type Design Condition Operating Qty. Spares
1 Circulating Water Pumps Vertical, wet pit 342,000 lpm @ 30 m
(90,000 gpm @ 100 ft) 2 1
2 Cooling Tower Evaporative, mechanical draft, multi-cell
11°C (51.5°F) wet bulb / 16°C (60°F) CWT / 27°C (80°F) HWT /
1,900 GJ/hr (1,800 MMBtu/hr) heat duty
1 0
Case B1A – Account 10: Slag Recovery and Handling Equipment
No. Description Type Design Condition Operating Qty. Spares
1 Slag Quench Tank Water bath 208,000 liters (55,000 gal) 2 0
2 Slag Crusher Roll 11 tonne/hr (12 tph) 2 0 3 Slag Depressurizer Lock Hopper 11 tonne/hr (12 tph) 2 0 4 Slag Receiving Tank Horizontal, weir 125,000 liters (33,000 gal) 2 0 5 Black Water Overflow Tank Shop fabricated 56,000 liters (15,000 gal) 2 0 6 Slag Conveyor Drag chain 11 tonne/hr (12 tph) 2 0 7 Slag Separation Screen Vibrating 11 tonne/hr (12 tph) 2 0 8 Coarse Slag Conveyor Belt/bucket 11 tonne/hr (12 tph) 2 0 9 Fine Ash Settling Tank Vertical, gravity 178,000 liters (47,000 gal) 2 0
10 Fine Ash Recycle Pumps Horizontal centrifugal 50 lpm @ 14 m H₂O (10 gpm @ 46 ft H₂O) 2 2
11 Grey Water Storage Tank Field erected 57,000 liters (15,000 gal) 2 0
12 Grey Water Pumps Centrifugal 200 lpm @ 430 m H₂O (50 gpm @ 1,420 ft H₂O) 2 2
13 Slag Storage Bin Vertical, field erected 800 tonne (900 tons) 2 0 14 Unloading Equipment Telescoping chute 90 tonne/hr (100 tph) 1 0
Case B1A – Account 11: Accessory Electric Plant Equipment
No. Description Type Design Condition Operating Qty. Spares
1 CTG Transformer Oil-filled 24 kV/345 kV, 260 MVA, 3-ph, 60 Hz 2 0
2 STG Transformer Oil-filled 24 kV/345 kV, 290 MVA, 3-ph, 60 Hz 1 0
3 High Voltage Auxiliary Transformer Oil-filled 345 kV/13.8 kV, 47
MVA, 3-ph, 60 Hz 2 0
4 Medium Voltage Transformer Oil-filled 24 kV/4.16 kV, 23 MVA, 3-ph, 60 Hz 1 1
5 Low Voltage Transformer Dry ventilated 4.16 kV/480 V, 3 MVA, 3-ph, 60 Hz 1 1
6 CTG Isolated Phase Bus Duct and Tap Bus
Aluminum, self-cooled 24 kV, 3-ph, 60 Hz 2 0
7 STG Isolated Phase Bus Duct and Tap Bus
Aluminum, self-cooled 24 kV, 3-ph, 60 Hz 1 0
8 Medium Voltage Switchgear Metal clad 4.16 kV, 3-ph, 60 Hz 1 1 9 Low Voltage Switchgear Metal enclosed 480 V, 3-ph, 60 Hz 1 1
10 Emergency Diesel Generator Sized for emergency shutdown
750 kW, 480 V, 3-ph, 60 Hz 1 0

Cost and Performance Baseline for Fossil Energy Plants Volume 1b: Revision 2b
80
Case B1A – Account 12: Instrumentation and Control Equipment
No. Description Type Design Condition Operating Qty. Spares
1 DCS - Main Control
Monitor/keyboard; Operator printer (laser color); Engineering printer (laser B&W)
Operator stations/printers and engineering stations/printers
1 0
2 DCS - Data Highway Fiber optic Fully redundant, 25% spare 1 0
3.2.7 Case B1A - Cost Estimating Costs Results The cost estimating methodology was described previously in Section 2.6. Exhibit 3-22 shows a detailed breakdown of the capital costs; Exhibit 3-23 shows the owner’s costs, TOC, and TASC; Exhibit 3-24 shows the initial and annual O&M costs; and Exhibit 3-25 shows the COE breakdown.
The estimated TPC of the Shell gasifier with no CO2 capture is $2,725/kW. Process contingency represents 2.8 percent of the TPC, and project contingency represents 13.8 percent. The COE is $107.0/MWh.

Cost and Performance Baseline for Fossil Energy Plants Volume 1b: Revision 2b
81
Exhibit 3-22 Case B1A total plant cost details Case: B1A – Shell IGCC w/o CO₂ Estimate Type: Conceptual
Plant Size (MW,net): 629 Cost Base: Jun 2011 Item Description Equipment Material Labor Bare Erected Eng'g CM Contingencies Total Plant Cost No. Cost Cost Direct Indirect Cost H.O.& Fee Process Project $/1,000 $/kW
1 Coal & Sorbent Handling 1.1 Coal Receive & Unload $4,254 $0 $2,050 $0 $6,305 $630 $0 $1,387 $8,322 $13 1.2 Coal Stackout & Reclaim $5,498 $0 $1,314 $0 $6,812 $681 $0 $1,499 $8,992 $14 1.3 Coal Conveyors & Yd Crush $5,111 $0 $1,301 $0 $6,412 $641 $0 $1,411 $8,464 $13 1.4 Other Coal Handling $1,337 $0 $301 $0 $1,638 $164 $0 $360 $2,162 $3 1.9 Coal & Sorbent Hnd. Foundations $0 $2,841 $7,425 $0 $10,265 $1,027 $0 $2,258 $13,550 $22
Subtotal $16,200 $2,841 $12,391 $0 $31,432 $3,143 $0 $6,915 $41,491 $66 2 Coal & Sorbent Prep & Feed
2.1 Coal Crushing & Drying $48,619 $2,932 $6,987 $0 $58,539 $5,854 $0 $12,878 $77,271 $123 2.2 Prepared Coal Storage & Feed $2,303 $553 $356 $0 $3,212 $321 $0 $707 $4,240 $7 2.3 Dry Coal Injection System $75,787 $873 $6,942 $0 $83,603 $8,360 $0 $18,393 $110,356 $175 2.4 Misc. Coal Prep & Feed $1,266 $925 $2,725 $0 $4,917 $492 $0 $1,082 $6,490 $10 2.9 Coal & Sorbent Feed Foundation $0 $4,645 $3,986 $0 $8,631 $863 $0 $1,899 $11,392 $18
Subtotal $127,976 $9,929 $20,996 $0 $158,901 $15,890 $0 $34,958 $209,749 $334 3 Feedwater & Miscellaneous BOP Systems
3.1 Feedwater System $3,734 $6,444 $3,379 $0 $13,557 $1,356 $0 $2,983 $17,896 $28 3.2 Water Makeup & Pretreating $688 $71 $378 $0 $1,137 $114 $0 $375 $1,626 $3 3.3 Other Feedwater Subsystems $2,099 $694 $620 $0 $3,413 $341 $0 $751 $4,505 $7 3.4 Service Water Systems $402 $802 $2,765 $0 $3,969 $397 $0 $1,310 $5,676 $9 3.5 Other Boiler Plant Systems $2,168 $810 $1,994 $0 $4,971 $497 $0 $1,094 $6,562 $10 3.6 FO Supply Sys & Nat Gas $17,736 $712 $660 $0 $19,108 $1,911 $0 $4,204 $25,223 $40 3.7 Waste Treatment Equipment $931 $0 $576 $0 $1,507 $151 $0 $497 $2,155 $3 3.8 Misc. Power Plant Equipment $1,267 $169 $658 $0 $2,094 $209 $0 $691 $2,994 $5
Subtotal $29,025 $9,703 $11,029 $0 $49,757 $4,976 $0 $11,904 $66,637 $106 4 Gasifier & Accessories
4.1 Syngas Cooler Gasifier System $203,552 $0 $88,237 $0 $291,789 $29,179 $40,524 $55,413 $416,905 $663 4.2 Syngas Cooler w/4.1 $0 w/ 4.1 $0 $0 $0 $0 $0 $0 $0 4.3 ASU & Oxidant Compression $177,729 $0 w/equip. $0 $177,729 $17,773 $0 $19,550 $215,052 $342 4.4 LT Heat Recovery & FG Saturation $18,617 $0 $7,073 $0 $25,691 $2,569 $0 $5,652 $33,911 $54 4.5 Misc. Gasification Equipment w/4.1&4.2 $0 w/4.1&4.2 $0 $0 $0 $0 $0 $0 $0 4.6 Flare Stack System $0 $1,110 $449 $0 $1,559 $156 $0 $343 $2,058 $3 4.8 Major Component Rigging w/4.1&4.2 $0 w/4.1&4.2 $0 $0 $0 $0 $0 $0 $0 4.9 Gasification Foundations $0 $9,370 $5,588 $0 $14,957 $1,496 $0 $4,113 $20,567 $33
Subtotal $399,897 $10,480 $101,347 $0 $511,725 $51,172 $40,524 $85,072 $688,493 $1,095 5A Gas Cleanup & Piping
5A.1 Sulfinol System $45,130 $0 $38,032 $0 $83,162 $8,316 $0 $18,296 $109,774 $175 5A.2 Elemental Sulfur Plant $11,584 $2,258 $14,843 $0 $28,684 $2,868 $0 $6,311 $37,863 $60 5A.3 Mercury Removal $1,400 $0 $1,058 $0 $2,458 $246 $123 $565 $3,392 $5 5A.4 COS Hydrolysis $3,475 $0 $4,507 $0 $7,981 $798 $0 $1,756 $10,535 $17 5A.5 Particulate Removal w/4.1 $0 w/4.1 $0 $0 $0 $0 $0 $0 $0

Cost and Performance Baseline for Fossil Energy Plants Volume 1b: Revision 2b
82
Case: B1A – Shell IGCC w/o CO₂ Estimate Type: Conceptual Plant Size (MW,net): 629 Cost Base: Jun 2011
Item Description Equipment Material Labor Bare Erected Eng'g CM Contingencies Total Plant Cost No. Cost Cost Direct Indirect Cost H.O.& Fee Process Project $/1,000 $/kW
5A.6 Blowback Gas Systems $1,945 $327 $183 $0 $2,455 $245 $0 $540 $3,240 $5 5A.7 Fuel Gas Piping $0 $979 $640 $0 $1,619 $162 $0 $356 $2,137 $3 5A.9 HGCU Foundations $0 $886 $597 $0 $1,483 $148 $0 $489 $2,120 $3
Subtotal $63,533 $4,449 $59,860 $0 $127,842 $12,784 $123 $28,313 $169,062 $269 6 Combustion Turbine & Accessories
6.1 Combustion Turbine Generator $104,201 $0 $7,506 $0 $111,707 $11,171 $5,585 $12,846 $141,309 $225 6.9 Combustion Turbine Foundations $0 $923 $1,068 $0 $1,992 $199 $0 $657 $2,848 $5
Subtotal $104,201 $923 $8,575 $0 $113,699 $11,370 $5,585 $13,504 $144,158 $229 7 HRSG, Ducting, & Stack
7.1 Heat Recovery Steam Generator $31,100 $0 $6,022 $0 $37,122 $3,712 $0 $4,083 $44,918 $71 7.3 Ductwork $0 $2,085 $1,461 $0 $3,546 $355 $0 $780 $4,681 $7 7.4 Stack $4,023 $0 $1,501 $0 $5,524 $552 $0 $608 $6,684 $11 7.9 HRSG, Duct & Stack Foundations $0 $766 $769 $0 $1,535 $153 $0 $506 $2,195 $3
Subtotal $35,123 $2,851 $9,753 $0 $47,727 $4,773 $0 $5,978 $58,477 $93 8 Steam Turbine Generator
8.1 Steam TG & Accessories $38,584 $0 $5,922 $0 $44,506 $4,451 $0 $4,896 $53,852 $86 8.2 Turbine Plant Auxiliaries $241 $0 $549 $0 $791 $79 $0 $87 $957 $2 8.3 Condenser & Auxiliaries $3,110 $0 $1,755 $0 $4,865 $486 $0 $535 $5,886 $9 8.4 Steam Piping $16,344 $0 $7,088 $0 $23,432 $2,343 $0 $6,444 $32,218 $51 8.9 TG Foundations $0 $1,137 $2,009 $0 $3,146 $315 $0 $1,038 $4,499 $7
Subtotal $58,279 $1,137 $17,322 $0 $76,739 $7,674 $0 $13,000 $97,412 $155 9 Cooling Water System
9.1 Cooling Towers $3,610 $0 $1,090 $0 $4,700 $470 $0 $776 $5,946 $9 9.2 Circulating Water Pumps $1,751 $0 $120 $0 $1,871 $187 $0 $309 $2,367 $4 9.3 Circ. Water System Auxiliaries $157 $0 $22 $0 $179 $18 $0 $30 $227 $0 9.4 Circ. Water Piping $0 $6,965 $1,687 $0 $8,652 $865 $0 $1,903 $11,421 $18 9.5 Make-up Water System $395 $0 $542 $0 $937 $94 $0 $206 $1,237 $2 9.6 Component Cooling Water Sys $796 $952 $654 $0 $2,403 $240 $0 $529 $3,171 $5 9.9 Circ. Water System Foundations $0 $2,272 $4,038 $0 $6,310 $631 $0 $2,082 $9,024 $14
Subtotal $6,709 $10,190 $8,153 $0 $25,052 $2,505 $0 $5,834 $33,392 $53 10 Ash & Spent Sorbent Handling Systems
10.1 Slag Dewatering & Cooling $18,726 $0 $9,172 $0 $27,898 $2,790 $0 $3,069 $33,756 $54 10.2 Gasifier Ash Depressurization w/10.1 w/10.1 w/10.1 $0 $0 $0 $0 $0 $0 $0 10.3 Cleanup Ash Depressurization w/10.1 w/10.1 w/10.1 $0 $0 $0 $0 $0 $0 $0 10.6 Ash Storage Silos $635 $0 $686 $0 $1,321 $132 $0 $218 $1,671 $3 10.7 Ash Transport & Feed Equipment $874 $0 $204 $0 $1,078 $108 $0 $178 $1,364 $2 10.8 Misc. Ash Handling Equipment $1,315 $1,612 $478 $0 $3,405 $341 $0 $562 $4,307 $7 10.9 Ash/Spent Sorbent Foundation $0 $53 $70 $0 $123 $12 $0 $41 $176 $0
Subtotal $21,550 $1,665 $10,610 $0 $33,826 $3,383 $0 $4,067 $41,275 $66 11 Accessory Electric Plant
11.1 Generator Equipment $1,155 $0 $1,125 $0 $2,280 $228 $0 $251 $2,758 $4 11.2 Station Service Equipment $4,293 $0 $395 $0 $4,687 $469 $0 $516 $5,672 $9

Cost and Performance Baseline for Fossil Energy Plants Volume 1b: Revision 2b
83
Case: B1A – Shell IGCC w/o CO₂ Estimate Type: Conceptual Plant Size (MW,net): 629 Cost Base: Jun 2011
Item Description Equipment Material Labor Bare Erected Eng'g CM Contingencies Total Plant Cost No. Cost Cost Direct Indirect Cost H.O.& Fee Process Project $/1,000 $/kW
11.3 Switchgear & Motor Control $7,923 $0 $1,473 $0 $9,396 $940 $0 $1,550 $11,885 $19 11.4 Conduit & Cable Tray $0 $4,026 $12,409 $0 $16,435 $1,643 $0 $4,520 $22,598 $36 11.5 Wire & Cable $0 $7,762 $4,722 $0 $12,484 $1,248 $0 $3,433 $17,165 $27 11.6 Protective Equipment $0 $797 $2,958 $0 $3,755 $375 $0 $620 $4,750 $8 11.7 Standby Equipment $275 $0 $274 $0 $548 $55 $0 $90 $693 $1 11.8 Main Power Transformers $17,455 $0 $173 $0 $17,628 $1,763 $0 $2,909 $22,299 $35 11.9 Electrical Foundations $0 $181 $493 $0 $674 $67 $0 $222 $963 $2
Subtotal $31,100 $12,765 $24,020 $0 $67,885 $6,789 $0 $14,110 $88,784 $141 12 Instrumentation & Control
12.1 IGCC Control Equipment w/4.1 $0 w/4.1 $0 $0 $0 $0 $0 $0 $0 12.2 Combustion Turbine Control w/6.1 $0 w/6.1 $0 $0 $0 $0 $0 $0 $0 12.3 Steam Turbine Control w/8.1 $0 w/8.1 $0 $0 $0 $0 $0 $0 $0 12.4 Other Major Component Control $1,195 $0 $814 $0 $2,010 $201 $100 $347 $2,658 $4 12.5 Signal Processing Equipment w/12.7 $0 w/12.7 $0 $0 $0 $0 $0 $0 $0 12.6 Control Boards, Panels & Racks $275 $0 $180 $0 $454 $45 $23 $105 $627 $1 12.7 Computer & Accessories $6,376 $0 $208 $0 $6,585 $658 $329 $757 $8,330 $13 12.8 Instrument Wiring & Tubing $0 $2,455 $4,646 $0 $7,101 $710 $355 $2,042 $10,208 $16 12.9 Other I & C Equipment $4,262 $0 $2,112 $0 $6,374 $637 $319 $1,100 $8,430 $13
Subtotal $12,109 $2,455 $7,961 $0 $22,524 $2,252 $1,126 $4,350 $30,252 $48 13 Improvements to Site
13.1 Site Preparation $0 $117 $2,670 $0 $2,788 $279 $0 $920 $3,986 $6 13.2 Site Improvements $0 $2,089 $2,953 $0 $5,042 $504 $0 $1,664 $7,210 $11 13.3 Site Facilities $3,743 $0 $4,202 $0 $7,945 $794 $0 $2,622 $11,361 $18
Subtotal $3,743 $2,206 $9,825 $0 $15,774 $1,577 $0 $5,206 $22,557 $36 14 Buildings & Structures
14.1 Combustion Turbine Area $0 $317 $179 $0 $496 $50 $0 $109 $655 $1 14.2 Steam Turbine Building $0 $2,909 $4,142 $0 $7,051 $705 $0 $1,163 $8,919 $14 14.3 Administration Building $0 $1,008 $731 $0 $1,739 $174 $0 $287 $2,199 $3 14.4 Circulation Water Pumphouse $0 $199 $105 $0 $304 $30 $0 $50 $384 $1 14.5 Water Treatment Buildings $0 $565 $551 $0 $1,117 $112 $0 $184 $1,413 $2 14.6 Machine Shop $0 $516 $353 $0 $869 $87 $0 $143 $1,099 $2 14.7 Warehouse $0 $833 $537 $0 $1,370 $137 $0 $226 $1,733 $3 14.8 Other Buildings & Structures $0 $499 $388 $0 $887 $89 $0 $195 $1,171 $2 14.9 Waste Treating Building & Str. $0 $1,115 $2,130 $0 $3,245 $325 $0 $714 $4,283 $7
Subtotal $0 $7,961 $9,116 $0 $17,077 $1,708 $0 $3,072 $21,857 $35 Total $909,446 $79,555 $310,959 $0 $1,299,960 $129,996 $47,358 $236,282 $1,713,596 $2,725

Cost and Performance Baseline for Fossil Energy Plants Volume 1b: Revision 2b
84
Exhibit 3-23 Case B1A owner’s costs
Description $/1,000 $/kW Pre-Production Costs
6 Months All Labor $15,220 $24 1 Month Maintenance Materials $3,484 $6 1 Month Non-fuel Consumables $371 $1
1 Month Waste Disposal $405 $1 25% of 1 Months Fuel Cost at 100% CF $2,731 $4
2% of TPC $34,272 $54 Total $56,482 $90
Inventory Capital 60-day supply of fuel and consumables at 100% CF $22,284 $35
0.5% of TPC (spare parts) $8,568 $14 Total $30,852 $49
Other Costs Initial Cost for Catalyst and Chemicals $2,032 $3
Land $900 $1 Other Owner's Costs $257,039 $409
Financing Costs $46,267 $74 Total Overnight Costs (TOC) $2,107,169 $3,351
TASC Multiplier (IOU, high-risk, 35 year) 1.140 Total As-Spent Cost (TASC) $2,402,172 $3,820

Cost and Performance Baseline for Fossil Energy Plants Volume 1b: Revision 2b
85
Exhibit 3-24 Case B1A initial and annual operating and maintenance costs Case: B1A – Shell IGCC w/o CO₂ Cost Base: Jun 2011
Plant Size (MW,net): 629 Heat Rate-net (Btu/kWh): 8,100 Capacity Factor (%): 80 Operating & Maintenance Labor
Operating Labor Operating Labor Requirements per Shift Operating Labor Rate (base): 39.70 $/hour Skilled Operator: 2.0
Operating Labor Burden: 30.00 % of base Operator: 9.0 Labor O-H Charge Rate: 25.00 % of labor Foreman: 1.0
Lab Tech's, etc.: 3.0 Total: 15.0
Fixed Operating Costs Annual Cost ($) ($/kW-net)
Annual Operating Labor: $6,781,554 $10.783 Maintenance Labor: $17,570,241 $27.938
Administrative & Support Labor: $6,087,949 $9.680 Property Taxes and Insurance: $34,271,927 $54.495
Total: $64,711,671 $102.897 Variable Operating Costs
($) ($/MWh-net) Maintenance Material: $33,446,804 $7.58890
Consumables Consumption Cost ($) Initial Fill Per Day Per Unit Initial Fill
Water (/1000 gallons): 0 2,988 $1.67 $0 $1,460,528 $0.33139 Makeup and Waste Water
Treatment Chemicals (lbs): 0 17,801 $0.27 $0 $1,392,224 $0.31589
Carbon (Mercury Removal) (lb): 116,013 199 $5.50 $638,069 $319,034 $0.07239 COS Catalyst (m3): 262 0.18 $3,751.70 $982,135 $196,427 $0.04457
Sulfinol Solution (gal): 26,146 18 $15.73 $411,337 $81,630 $0.01852 Claus Catalyst (ft3): w/equip. 1.82 $203.15 $0 $108,246 $0.02456
Subtotal: $2,031,540 $3,558,089 $0.80731 Waste Disposal
Spent Mercury Catalyst (lb.): 0 199 $0.65 $0 $37,710 $0.00856 Flyash (ton): 0 0 $0.00 $0 $0 $0.00000
Slag (ton): 0 525 $25.11 $0 $3,847,802 $0.87305 Subtotal: $0 $3,885,512 $0.88160
By-Products Sulfur (tons): 0 131 $0.00 $0 $0 $0.00000
Subtotal: $0 $0 $0.00000 Variable Operating Costs Total: $2,031,540 $40,890,405 $9.27782
Fuel Cost Illinois Number 6 (ton): 0 5,240 $68.54 $0 $104,866,703 $23.79370
Total: $0 $104,866,703 $23.79370
Exhibit 3-25 Case B1A COE breakdown
Component Value, $/MWh Percentage Capital 59.3 55%
Fixed 14.7 14% Variable 9.3 9%
Fuel 23.8 22% Total (Excluding T&S) 107.0 N/A
CO2 T&S 0.0 0% Total (Including T&S) 107.0 N/A

Cost and Performance Baseline for Fossil Energy Plants Volume 1b: Revision 2b
86
3.2.8 Case B1B - Shell IGCC Power Plant with CO2 Capture This case is configured to produce electric power with CO2 capture. The plant configuration is the same as Case B1A, namely two Shell gasifier trains, two state-of-the-art 2008 F-class turbines, two HRSGs, and one steam turbine. The gross power output is constrained by the capacity of the two CTs, and since the CO2 capture and compression process increases the auxiliary load on the plant, the net output is significantly reduced relative to Case B1A (497 MW versus 629 MW).
The process description for Case B1B is similar to Case B1A with several notable exceptions to accommodate CO2 capture. A BFD and stream tables for Case B1B are shown in Exhibit 3-26 and Exhibit 3-27, respectively. Instead of repeating the entire process description, only differences from Case B1A are reported here.
3.2.8.1 Coal Preparation and Feed Systems No differences from Case B1A.
3.2.8.2 Gasification The gasification process is the same as Case B1A with the exception that total coal feed to the two gasifiers is 5,065 tonnes/day (5,583 tpd) (stream 9) and the ASU provides 3,852 tonnes/day (4,246 tpd) of 95 mol% oxygen to the gasifier and Claus plant (streams 5 and 3).
3.2.8.3 Raw Gas Cooling/Particulate Removal After the raw syngas is cooled to approximately 1,093°C (2,000°F) by the syngas quench recycle, syngas is further cooled to 899°C (1,650°F) by raising HP steam at 13.8 MPa (2,000 psia). A direct contact water quench follows to cool the raw syngas from 899°C (1,650°F) to 399°C (750°F) while providing a portion of the water required for SGS. The syngas is then cooled to 316°C (600°F) by raising steam, which is used in the SGS unit. After particulate filtration, the syngas is cooled to 232°C (450°F) by raising IP steam at 0.4 MPa (65 psia) before proceeding to the scrubber.
3.2.8.4 Syngas Scrubber/Sour Water Stripper Syngas exits the scrubber at 191°C (376°F).
3.2.8.5 Sour Gas Shift The SGS process was described in Section 3.1.3. In Case B1B the syngas after the scrubber is reheated to 197°C (386°F) and then steam (stream 14) is added to adjust the H2O:CO molar ratio to approximately 1.8:1 prior to the first SGS reactor. The hot syngas exiting the first stage of SGS is used to preheat water used to humidify clean syngas prior to entering the CT. One more stage of SGS (for a total of two) results in 97.8 percent overall conversion of the CO to CO2. The warm syngas from the second stage of SGS is cooled to 248°C (478°F) by preheating the syngas prior to the first stage of SGS. The SGS catalyst also serves to hydrolyze COS thus eliminating the need for a separate COS hydrolysis reactor. Following the second stage of SGS, the syngas is further cooled to 35°C (95°F) prior to the mercury removal beds.
3.2.8.6 Mercury Removal and AGR Mercury removal is the same as in Case B1A.

Cost and Performance Baseline for Fossil Energy Plants Volume 1b: Revision 2b
87
The AGR process in Case B1B is a two-stage Selexol process where H2S is removed in the first stage and CO2 in the second stage of absorption. The process results in three product streams, the clean syngas (stream 18), a CO2-rich stream and an acid gas feed to the Claus plant (stream 22). The acid gas contains 34 percent H2S and 51 percent CO2 with the balance primarily H2. The CO2-rich stream is discussed further in the CO2 compression section.
3.2.8.7 CO2 Compression and Dehydration CO2 from the AGR process is flashed at three pressure levels to separate CO2 and decrease H2 losses to the CO2 product pipeline. The HP CO2 stream is flashed at 2.0 MPa (289.7 psia), compressed, and recycled back to the CO2 absorber. The MP CO2 stream is flashed at 1.0 MPa (149.7 psia). The LP CO2 stream is flashed at 0.1 MPa (16.7 psia), compressed to 1.0 MPa (149.5 psia), and combined with the MP CO2 stream. The combined stream is compressed from 1.0 MPa (149.5 psia) to an SC condition at 15.3 MPa (2215 psia) using a multiple-stage, intercooled compressor. During compression, the CO2 stream is dehydrated to a dew point of -40ºC (-40°F) with triethylene glycol. The raw CO2 stream from the Selexol process contains over 99 percent CO2. The CO2 (stream 21) is transported to the plant fence line and is sequestration ready. CO2 T&S costs were estimated using the methodology described in Section 2.6.
3.2.8.8 Claus Unit The Claus plant is the same as Case B1A with the following exceptions:
• 5,277 kg/hr (11,634 lb/hr) of sulfur (stream 23) are produced • The waste heat boiler generates 13,697 kg/hr (30,197 lb/hr) of 3.0 MPa (430 psia) steam,
which provides all of the Claus plant process needs and provides some additional steam to the medium pressure steam header.
3.2.8.9 Power Block Clean syngas from the AGR plant is combined with a small amount of clean gas from the CO2 compression process (stream 18) and partially humidified because the nitrogen available from the ASU is insufficient to provide adequate dilution. The moisturized syngas is reheated to 193°C (380°F) using HP BFW, diluted with nitrogen (stream 4), and then enters the CT burner. The exhaust gas (stream 27) exits the CT at 562°C (1,043°F) and enters the HRSG where additional heat is recovered. The flue gas exits the HRSG at 132°C (270°F) (stream 28) and is discharged through the plant stack. The steam raised in the HRSG is used to power an advanced commercially available steam turbine using a 12.4 MPa/534°C/534°C (1,800 psig/993°F/993°F) steam cycle.
3.2.8.10 Air Separation Unit (ASU) The same elevated pressure ASU is used as in Case B1A and produces 3,852 tonnes/day (4,246 tpd) of 95 mol% oxygen and 12,290 tonnes/day (13,547 tpd) of nitrogen. There is no integration between the ASU and the CT in the CO2 capture case.
3.2.8.11 Balance of Plant Balance of plant items were covered in Sections 3.1.9, 3.1.10, and 3.1.12.

Cost and Performance Baseline for Fossil Energy Plants Volume 1b: Revision 2b
88
Exhibit 3-26 Case B1B block flow diagram, Shell IGCC with CO2 capture
Source: NETL
GAS TURBINE
COMBUSTOR
SYNGAS QUENCH AND
COOLING
WATER-GAS SHIFT REACTORS & GAS COOLING
WATER SCRUBBER
ELEVATEDPRESSURE
ASU
SHELL GASIFIER
MERCURYREMOVAL
DUAL-STAGE
SELEXOL UNIT
CLAUSPLANT
SYNGASREHEAT
HRSG
2X STATE-OF-THE-ART F-CLASS
GAS TURBINES
1AIR TO ASU
2 3
VENTGAS
5
10 11
GASIFIEROXIDANT
DRYCOAL SLAG
16 17
2223
4
26
TURBINE COOLING AIR
27
AMBIENT AIR
FLUE GAS STACK GAS
HYDROGENATION REACTOR AND GAS
COOLING
24
CLEAN GAS
NITROGEN DILUENT
SULFUR PRODUCT
SYNGAS
COAL DRYER
DRYING GAS PREP
9
WETCOAL
18
8
6
13
12
AIR
SYNGAS
STEAM
CO2 COMPRESSOR
2114
15
CO2 PRODUCT
20
SHIFT STEAM
7 TRANSPORT NITROGEN
28
CLAUS PLANT
OXIDANT
CLAUS PLANT
OXIDANT
STEAM TURBINE
29Note: Block Flow Diagram is not intended to represent a complete material balance. Only major process streams and equipment are shown.
SYNGAS QUENCH RECYCLE
25SOUR
WATER STRIPPER
WATER RECYCLE TO PROCESS
DEMAND
SYNGASHUMIDIFI-
CATION
19

Cost and Performance Baseline for Fossil Energy Plants Volume 1b: Revision 2b
89
Exhibit 3-27 Case B1B stream table, Shell IGCC with capture 1 2 3 4 5 6 7 8 9 10 11 12 13 14
V-L Mole Fraction Ar 0.0092 0.0230 0.0318 0.0023 0.0318 0.0000 0.0023 0.0096 0.0000 0.0000 0.0000 0.0085 0.0061 0.0000 CH4 0.0000 0.0000 0.0000 0.0000 0.0000 0.0000 0.0000 0.0006 0.0000 0.0000 0.0000 0.0005 0.0004 0.0000 CO 0.0000 0.0000 0.0000 0.0000 0.0000 0.0000 0.0000 0.0130 0.0000 0.0000 0.0000 0.5187 0.3712 0.0000 CO2 0.0003 0.0079 0.0000 0.0000 0.0000 0.0000 0.0000 0.0455 0.0000 0.0000 0.0000 0.0126 0.0090 0.0000 COS 0.0000 0.0000 0.0000 0.0000 0.0000 0.0000 0.0000 0.0000 0.0000 0.0000 0.0000 0.0006 0.0004 0.0000 H2 0.0000 0.0000 0.0000 0.0000 0.0000 0.0000 0.0000 0.8727 0.0000 0.8090 0.0000 0.2691 0.1926 0.0000 H2O 0.0099 0.1984 0.0000 0.0003 0.0000 1.0000 0.0004 0.0001 0.0000 0.0935 0.0000 0.1278 0.3758 1.0000 HCl 0.0000 0.0000 0.0000 0.0000 0.0000 0.0000 0.0000 0.0000 0.0000 0.0030 0.0000 0.0008 0.0006 0.0000 H2S 0.0000 0.0000 0.0000 0.0000 0.0000 0.0000 0.0000 0.0000 0.0000 0.0000 0.0000 0.0073 0.0052 0.0000 N2 0.7732 0.5759 0.0178 0.9919 0.0178 0.0000 0.9919 0.0585 0.0000 0.0163 0.0000 0.0507 0.0363 0.0000 NH3 0.0000 0.0000 0.0000 0.0000 0.0000 0.0000 0.0000 0.0000 0.0000 0.0000 0.0000 0.0033 0.0024 0.0000 O2 0.2074 0.1948 0.9504 0.0054 0.9504 0.0000 0.0054 0.0000 0.0000 0.0782 0.0000 0.0000 0.0000 0.0000 SO2 0.0000 0.0000 0.0000 0.0000 0.0000 0.0000 0.0000 0.0000 0.0000 0.0000 0.0000 0.0000 0.0000 0.0000 Total 1.0000 1.0000 1.0000 1.0000 1.0000 1.0000 1.0000 1.0000 0.0000 1.0000 0.0000 1.0000 1.0000 1.0000 V-L Flowrate (kgmole/hr) 24,277 1,004 102 17,310 4,886 1,130 940 308 0 5,809 0 26,493 29,249 11,003 V-L Flowrate (kg/hr) 700,548 27,328 3,289 485,713 157,225 20,363 26,368 1,900 0 37,081 0 531,672 569,894 198,214 Solids Flowrate (kg/hr) 0 0 0 0 0 0 0 0 211,040 160,281 21,137 0 0 0
Temperature (°C) 15 20 32 93 32 343 32 35 15 16 1,427 1,082 232 288 Pressure (MPa, abs) 0.10 0.11 0.86 2.65 0.86 5.10 5.62 3.59 0.10 5.79 4.24 4.24 4.03 5.52 Steam Table Enthalpy (kJ/kg) A 30.23 36.90 26.67 92.51 26.67 3,063.97 20.78 163.14 --- --- --- 2,047.11 1,220.20 2,918.18 AspenPlus Enthalpy (kJ/kg)B -97.58 -2,197.43 4.13 63.47 4.13 -12,907.38 -8.79 -3,104.81 -2,116.95 -768.33 2,165.43 -2,946.51 -6,659.43 -13,053.16 Density (kg/m3) 1.2 1.5 11.0 24.4 11.0 20.1 62.8 8.5 --- 16.5 --- 7.5 19.1 25.6 V-L Molecular Weight 28.857 27.206 32.181 28.060 32.181 18.015 28.060 6.159 --- 6.383 --- 20.069 19.484 18.015
V-L Flowrate (lbmole/hr) 53,521 2,215 225 38,162 10,771 2,492 2,072 680 0 12,807 0 58,407 64,482 24,256 V-L Flowrate (lb/hr) 1,544,445 60,248 7,250 1,070,814 346,622 44,894 58,132 4,188 0 81,749 0 1,172,137 1,256,401 436,986 Solids Flowrate (lb/hr) 0 0 0 0 0 0 0 0 465,264 353,359 46,599 0 0 0
Temperature (°F) 59 68 90 199 90 650 90 94 59 60 2,600 1,980 450 550 Pressure (psia) 14.7 16.4 125.0 384.0 125.0 740.0 815.0 520.0 14.7 840.0 615.0 615.0 585.0 800.0 Steam Table Enthalpy (Btu/lb)A 13.0 15.9 11.5 39.8 11.5 1,317.3 8.9 70.1 --- --- --- 880.1 524.6 1,254.6 AspenPlus Enthalpy (Btu/lb)B -42.0 -944.7 1.8 27.3 1.8 -5,549.2 -3.8 -1,334.8 -910.1 -330.3 931.0 -1,266.8 -2,863.0 -5,611.9 Density (lb/ft3) 0.076 0.097 0.687 1.521 0.687 1.257 3.918 0.531 --- 1.029 --- 0.468 1.190 1.597
ASteam table reference conditions are 32.02°F & 0.089 psia BAspen thermodynamic reference state is the component’s constituent elements in an ideal gas state at 25°C and 1 atm

Cost and Performance Baseline for Fossil Energy Plants Volume 1b: Revision 2b
90
Exhibit 3-27 Case B1B stream table, Shell IGCC with capture (continued) 15 16 17 18 19 20 21 22 23 24 25 26 27 28 29
V-L Mole Fraction Ar 0.0047 0.0062 0.0062 0.0096 0.0086 0.0086 0.0002 0.0017 0.0000 0.0065 0.0102 0.0092 0.0088 0.0088 0.0000 CH4 0.0003 0.0004 0.0004 0.0006 0.0005 0.0005 0.0000 0.0002 0.0000 0.0000 0.0000 0.0000 0.0000 0.0000 0.0000 CO 0.2873 0.0084 0.0084 0.0130 0.0116 0.0116 0.0002 0.0025 0.0000 0.1143 0.0060 0.0000 0.0000 0.0000 0.0000 CO2 0.0070 0.3776 0.3810 0.0455 0.0407 0.0407 0.9944 0.5141 0.0000 0.2866 0.6257 0.0003 0.0080 0.0080 0.0000 COS 0.0003 0.0000 0.0000 0.0000 0.0000 0.0000 0.0000 0.0002 0.0000 0.0004 0.0000 0.0000 0.0000 0.0000 0.0000 H2 0.1491 0.5633 0.5593 0.8727 0.7819 0.7819 0.0050 0.1068 0.0000 0.0659 0.2694 0.0000 0.0000 0.0000 0.0000 H2O 0.5172 0.0016 0.0016 0.0001 0.1041 0.1041 0.0000 0.0300 0.0000 0.4715 0.0017 0.0099 0.1374 0.1374 1.0000 HCl 0.0001 0.0000 0.0000 0.0000 0.0000 0.0000 0.0000 0.0000 0.0000 0.0000 0.0000 0.0000 0.0000 0.0000 0.0000 H2S 0.0040 0.0057 0.0057 0.0000 0.0000 0.0000 0.0000 0.3398 0.0000 0.0014 0.0057 0.0000 0.0000 0.0000 0.0000 N2 0.0281 0.0368 0.0374 0.0585 0.0524 0.0524 0.0002 0.0047 0.0000 0.0516 0.0813 0.7732 0.7397 0.7397 0.0000 NH3 0.0019 0.0000 0.0000 0.0000 0.0000 0.0000 0.0000 0.0000 0.0000 0.0000 0.0000 0.0000 0.0000 0.0000 0.0000 O2 0.0000 0.0000 0.0000 0.0000 0.0000 0.0000 0.0000 0.0000 0.0000 0.0000 0.0000 0.2074 0.1060 0.1060 0.0000 SO2 0.0000 0.0000 0.0000 0.0000 0.0000 0.0000 0.0000 0.0000 0.0000 0.0018 0.0000 0.0000 0.0000 0.0000 0.0000 Total 1.0000 1.0000 1.0000 1.0000 1.0000 1.0000 1.0000 1.0000 0.0000 1.0000 1.0000 1.0000 1.0000 1.0000 1.0000 V-L Flowrate (kgmole/hr) 37,783 28,837 29,237 18,312 20,438 20,438 10,099 488 0 630 400 110,253 139,892 139,892 28,855 V-L Flowrate (kg/hr) 723,426 562,223 574,690 112,786 151,092 151,092 442,270 17,202 0 16,585 12,466 3,181,557 3,818,362 3,818,362 519,836 Solids Flowrate (kg/hr) 0 0 0 0 0 0 0 0 5,277 0 0 0 0 0 0
Temperature (°C) 217 35 35 35 137 193 51 48 178 232 38 15 562 132 534 Pressure (MPa, abs) 3.96 3.62 3.59 3.59 3.21 3.17 15.27 0.16 0.12 0.08 5.51 0.10 0.10 0.10 12.51 Steam Table Enthalpy (kJ/kg) A 1,541.73 45.33 44.53 163.14 1,181.24 1,416.72 -161.70 85.01 --- 1,114.50 8.30 30.23 866.14 371.29 3,432.00 AspenPlus Enthalpy (kJ/kg)B -8,063.86 -7,695.78 -7,701.53 -3,104.81 -5,307.37 -5,071.89 -9,118.58 -6,131.59 142.40 -8,838.52 -7,960.81 -97.58 -720.70 -1,215.55 -12,538.31 Density (kg/m3) 19.5 28.1 28.1 8.5 6.9 6.0 639.8 2.2 5,279.4 0.5 74.4 1.2 0.4 0.8 36.8 V-L Molecular Weight 19.147 19.496 19.656 6.159 7.393 7.393 43.792 35.245 --- 26.336 31.160 28.857 27.295 27.295 18.015
V-L Flowrate (lbmole/hr) 83,298 63,576 64,458 40,371 45,059 45,059 22,265 1,076 0 1,388 882 243,066 308,408 308,408 63,615 V-L Flowrate (lb/hr) 1,594,881 1,239,491 1,266,974 248,650 333,100 333,100 975,038 37,925 0 36,563 27,484 7,014,133 8,418,047 8,418,047 1,146,042 Solids Flowrate (lb/hr) 0 0 0 0 0 0 0 0 11,634 0 0 0 0 0 0
Temperature (°F) 422 95 94 94 278 380 124 119 352 450 100 59 1,043 270 993 Pressure (psia) 575.0 525.0 520.0 520.0 465.0 460.0 2,214.7 23.7 17.3 12.3 799.5 14.7 15.2 15.2 1,814.7 Steam Table Enthalpy (Btu/lb)A 662.8 19.5 19.1 70.1 507.8 609.1 -69.5 36.5 --- 479.1 3.6 13.0 372.4 159.6 1,475.5 AspenPlus Enthalpy (Btu/lb)B -3,466.8 -3,308.6 -3,311.1 -1,334.8 -2,281.8 -2,180.5 -3,920.3 -2,636.1 61.2 -3,799.9 -3,422.5 -42.0 -309.8 -522.6 -5,390.5 Density (lb/ft3) 1.218 1.753 1.753 0.531 0.431 0.374 39.942 0.135 329.584 0.033 4.646 0.076 0.026 0.053 2.295
ASteam table reference conditions are 32.02°F & 0.089 psia BAspen thermodynamic reference state is the component’s constituent elements in an ideal gas state at 25°C and 1 atm

Cost and Performance Baseline for Fossil Energy Plants Volume 1b: Revision 2b
91
3.2.9 Case B1B - Performance Results The Case B1B modeling assumptions were presented previously in Section 3.2.3.
The plant produces a net output of 497 MWe at a net plant efficiency of 31.2 percent (HHV basis). Overall performance for the plant is summarized in Exhibit 3-28; Exhibit 3-29 provides a detailed breakdown of the auxiliary power requirements. The ASU accounts for approximately 58 percent of the auxiliary load between the main air compressor, nitrogen compressor, oxygen compressor, and ASU auxiliaries. The two-stage Selexol process and CO2 compression account for an additional 28 percent of the auxiliary power load. The BFW and CWS (CWPs and cooling tower fan) compose approximately 4 percent of the load, leaving 10 percent of the auxiliary load for all other systems.
Exhibit 3-28 Case B1B plant performance summary
Performance Summary Combustion Turbine Power, MWe 464 Sweet Gas Expander Power, MWe 0 Steam Turbine Power, MWe 209 Total Gross Power, MWe 673 Air Separation Unit Main Air Compressor, kWe 59,740 Oxygen Compressor, kWe 9,460 Nitrogen Compressors, kWe 32,910 CO₂ Compression, kWe 30,210 Acid Gas Removal, kWe 18,650 Balance of Plant, kWe 25,690 Total Auxiliaries, MWe 177 Net Power, MWe 497 HHV Net Plant Efficiency (%) 31.2% HHV Net Plant Heat Rate, kJ/kWh (Btu/kWh) 11,528 (10,927) HHV Cold Gas Efficiency, % 84.5% HHV Combustion Turbine Efficiency, % 35.9% LHV Net Plant Efficiency (%) 32.4% LHV Net Plant Heat Rate, kJ/kWh (Btu/kWh) 11,119 (10,539) LHV Cold Gas Efficiency, % 82.9% LHV Combustion Turbine Efficiency, % 42.3% Steam Turbine Cycle Efficiency, % 39.0% Steam Turbine Heat Rate, kJ/kWh (Btu/kWh) 9,238 (8,756) Condenser Duty, GJ/hr (MMBtu/hr) 1,335 (1,265) As-Received Coal Feed, kg/hr (lb/hr) 211,040 (465,264) HHV Thermal Input, kWt 1,590,722 LHV Thermal Input, kWt 1,534,271 Raw Water Withdrawal, (m3/min)/MWnet (gpm/MWnet) 0.043 (11.4) Raw Water Consumption, (m3/min)/MWnet (gpm/MWnet) 0.035 (9.3) O₂:Coal 0.704

Cost and Performance Baseline for Fossil Energy Plants Volume 1b: Revision 2b
92
Exhibit 3-29 Case B1B plant power summary
Power Summary Combustion Turbine Power, MWe 464 Sweet Gas Expander Power, MWe 0 Steam Turbine Power, MWe 209 Total Gross Power, MWe 673
Auxiliary Load Summary Coal Handling, kWe 460 Coal Milling, kWe 2,170 Sour Water Recycle Slurry Pump, kWe 0 Slag Handling, kWe 550 Air Separation Unit Auxiliaries, kWe 1,000 Air Separation Unit Main Air Compressor, kWe 59,740 Oxygen Compressor, kWe 9,460 Nitrogen Compressors, kWe 32,910 Feedwater Pumps, kWe 3,500 Quench Water Pump, kWe 610 Syngas Recycle Compressor, kWe 790 CO₂ Compression, kWe 30,210 Scrubber Pumps, kWe 360 Acid Gas Removal, kWe 18,650 Combustion Turbine Auxiliaries, kWe 1,000 Steam Turbine Auxiliaries, kWe 100 Condensate Pumps, kWe 280 Circulating Water Pumps, kWe 4,380 Ground Water Pumps, kWe 510 Cooling Tower Fans, kWe 2,270 Claus Plant/TGTU Auxiliaries, kWe 250 Claus Plant TG Recycle Compressor, kWe 1,830 Miscellaneous Balance of PlantA, kWe 3,000 Transformer Losses, kWe 2,630 Total Auxiliaries, MWe 177 Net Power, MWe 497
AIncludes plant control systems, lighting, HVAC, and miscellaneous low voltage loads
3.2.9.1 Environmental Performance The environmental targets for emissions of Hg, NOx, SO2, CO2, and PM were presented in Section 2.4. A summary of the plant air emissions for Case B1B is presented in Exhibit 3-30. All HCl is assumed to be removed and is, therefore, not reported.

Cost and Performance Baseline for Fossil Energy Plants Volume 1b: Revision 2b
93
Exhibit 3-30 Case B1B air emissions
kg/GJ (lb/MMBtu) Tonne/year (ton/year)A kg/MWh (lb/MWh)B
SO2 0.001 (0.002) 37 (40) 0.008 (0.017) NOx 0.021 (0.049) 847 (934) 0.180 (0.396) Particulates 0.003 (0.0071) 123 (135) 0.026 (0.057) Hg 1.60E-7 (3.72E-7) 0.006 (0.007) 1.36E-6 (3.00E-6) CO2 9 (20) 344,507 (379,754) 73 (161) CO2C - - 99 (218)
ACalculations based on an 80 percent capacity factor BEmissions are based on gross power except where otherwise noted CCO2 emissions based on net power instead of gross power
The low level of SO2 emissions is achieved by capturing the sulfur in the gas by the two-stage Selexol AGR process. The CO2 capture target results in the sulfur compounds being removed to a greater extent than required in the environmental targets of Section 2.3. The clean syngas exiting the AGR process has a sulfur concentration of approximately 4 ppmv. This results in a concentration in the HRSG flue gas of less than 1 ppmv. The H2S-rich regeneration gas from the AGR system is fed to a Claus plant, producing elemental sulfur. The Claus plant tail gas is compressed and recycled back to the AGR where most of the remaining sulfur is removed.
NOx emissions are limited by the use of nitrogen dilution and humidification to 15 ppmvd (as NO2 @ 15 percent O2). Ammonia in the syngas is removed with process condensate prior to the low-temperature AGR process and subsequently destroyed in the Claus plant burner. This helps lower NOx levels as well.
Particulate discharge to the atmosphere is limited to extremely low values by the use of a cyclone and a barrier filter in addition to the syngas scrubber and the gas washing effect of the AGR absorber. The particulate emissions represent filterable particulate only.
Approximately 97 percent of mercury is captured from the syngas by dual activated carbon beds.
Ninety two percent of the CO2 from the syngas is captured in the AGR system and compressed for sequestration. Because not all CO is converted to CO2 in the shift reactors, the overall carbon removal is 90.0 percent.
The carbon balance for the plant is shown in Exhibit 3-31. The carbon input to the plant consists of carbon in the air in addition to carbon in the coal. Carbon leaves the plant as unburned carbon in the slag and as CO2 in the stack gas, coal dryer vent gas, ASU vent gas, and the captured CO2 product. The carbon capture efficiency is defined as one minus the amount of carbon in the stack gas relative to the total carbon in less carbon contained in the slag, represented by the following fraction:
𝐶𝐶𝐶𝐶𝐶𝐶𝐶𝐶𝐶𝐶𝐸𝐸 𝐴𝐴𝐸𝐸 𝑆𝑆𝐶𝐶𝐶𝐶𝑆𝑆𝑆𝑆(𝑇𝑇𝐶𝐶𝐶𝐶𝐶𝐶𝑇𝑇 𝐶𝐶𝐶𝐶𝐶𝐶𝐶𝐶𝐶𝐶𝐸𝐸 𝑅𝑅𝐸𝐸) − (𝐶𝐶𝐶𝐶𝐶𝐶𝐶𝐶𝐶𝐶𝐸𝐸 𝐴𝐴𝐸𝐸 𝑆𝑆𝑇𝑇𝐶𝐶𝑆𝑆) = �1 − �
29,578297,754 − 1,483
� ∗�100 = 90.0%

Cost and Performance Baseline for Fossil Energy Plants Volume 1b: Revision 2b
94
Exhibit 3-31 Case B1B carbon balance
Carbon In Carbon Out kg/hr (lb/hr) kg/hr (lb/hr)
Coal 134,527 (296,581) Stack Gas 13,416 (29,578) Air (CO₂) 532 (1,173) Coal Dryer Stack 223 (491)
CO₂ Product 120,652 (265,992) ASU Vent 95 (210) Slag 673 (1,483)
Total 135,059 (297,754) Total 135,059 (297,754)
Exhibit 3-32 shows the sulfur balance for the plant. Sulfur input comes solely from the sulfur in the coal. Sulfur output includes the sulfur recovered in the Claus plant, sulfur emitted in the stack gas, and sulfur from the tail gas unit that is vented through the coal dryer. Sulfur in the slag is considered negligible.
Exhibit 3-32 Case B1B sulfur balance
Sulfur In Sulfur Out kg/hr (lb/hr) kg/hr (lb/hr)
Coal 5,290 (11,661) Stack Gas 3 (6) Coal Dryer Stack 0 (0) CO₂ Product 10 (22) Elemental Sulfur 5,277 (11,634)
Total 5,290 (11,661) Total 5,290 (11,661)
Exhibit 3-33 shows the overall water balance for the plant. The exhibit is presented in an identical manner as for Case B1A.
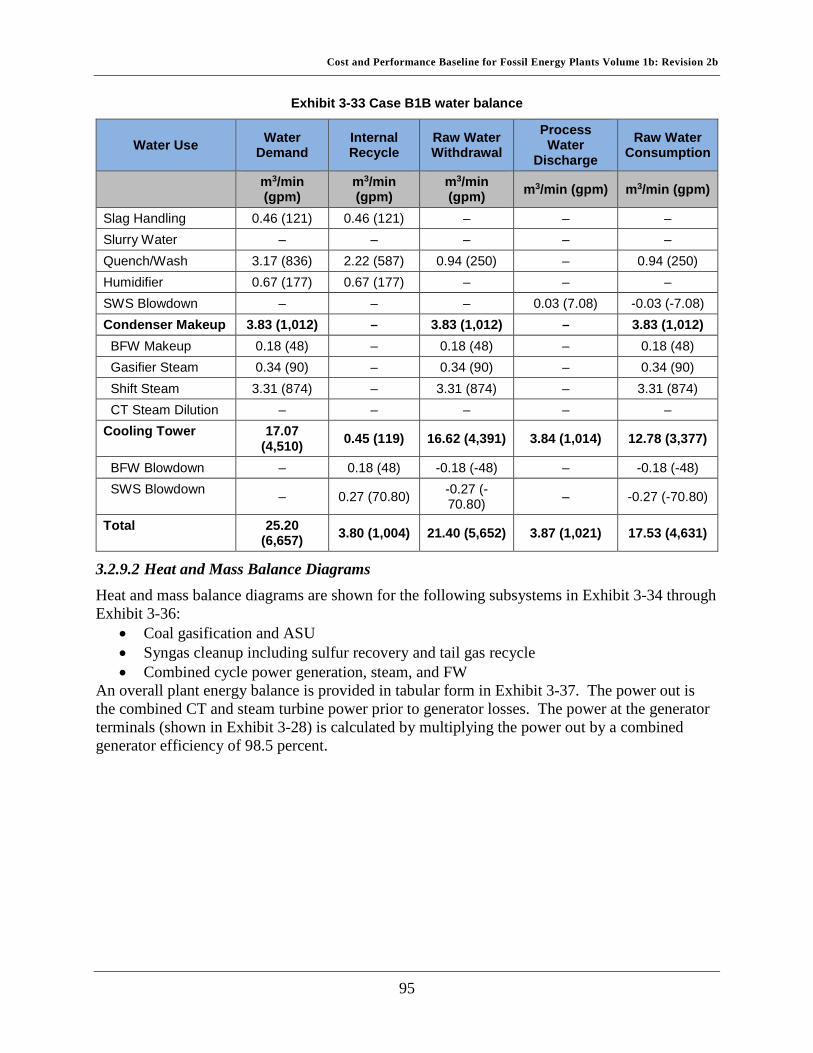
Cost and Performance Baseline for Fossil Energy Plants Volume 1b: Revision 2b
95
Exhibit 3-33 Case B1B water balance
Water Use Water Demand
Internal Recycle
Raw Water Withdrawal
Process Water
Discharge Raw Water
Consumption
m3/min (gpm)
m3/min (gpm)
m3/min (gpm) m3/min (gpm) m3/min (gpm)
Slag Handling 0.46 (121) 0.46 (121) – – – Slurry Water – – – – – Quench/Wash 3.17 (836) 2.22 (587) 0.94 (250) – 0.94 (250) Humidifier 0.67 (177) 0.67 (177) – – – SWS Blowdown – – – 0.03 (7.08) -0.03 (-7.08) Condenser Makeup 3.83 (1,012) – 3.83 (1,012) – 3.83 (1,012) BFW Makeup 0.18 (48) – 0.18 (48) – 0.18 (48) Gasifier Steam 0.34 (90) – 0.34 (90) – 0.34 (90) Shift Steam 3.31 (874) – 3.31 (874) – 3.31 (874) CT Steam Dilution – – – – – Cooling Tower 17.07
(4,510) 0.45 (119) 16.62 (4,391) 3.84 (1,014) 12.78 (3,377)
BFW Blowdown – 0.18 (48) -0.18 (-48) – -0.18 (-48) SWS Blowdown – 0.27 (70.80) -0.27 (-
70.80) – -0.27 (-70.80)
Total 25.20 (6,657) 3.80 (1,004) 21.40 (5,652) 3.87 (1,021) 17.53 (4,631)
3.2.9.2 Heat and Mass Balance Diagrams Heat and mass balance diagrams are shown for the following subsystems in Exhibit 3-34 through Exhibit 3-36:
• Coal gasification and ASU • Syngas cleanup including sulfur recovery and tail gas recycle • Combined cycle power generation, steam, and FW
An overall plant energy balance is provided in tabular form in Exhibit 3-37. The power out is the combined CT and steam turbine power prior to generator losses. The power at the generator terminals (shown in Exhibit 3-28) is calculated by multiplying the power out by a combined generator efficiency of 98.5 percent.

Cost and Performance Baseline for Fossil Energy Plants Volume 1b: Revision 2b
96
Exhibit 3-34 Case B1B coal gasification and ASU heat and mass balance schematic
Source: NETL
DOE/NETL
DUAL TRAIN IGCC PLANTCASE B1B
HEAT AND MATERIAL FLOW DIAGRAM
BITUMINOUS BASELINE STUDYCASE B1B
SHELL GASIFIERASU, GASIFICATION, AND GAS COOLING
DWG. NO.BB-HMB-CS-B1B-PG-1
PLANT PERFORMANCE SUMMARY
LEGEND
Air
Oxygen
Nitrogen
Coal/Char/Slurry/Slag
Synthesis Gas
PAGES1 OF 3
Ambient Air
IntercooledAir Compressor
ElevatedPressure
ASU
IntercooledNitrogen Compressor
IntercooledOxygen Compressor
Milled Coal
Water
Steam
SlagRemoval
Slag
Gross Plant Power: 673 MWeAuxiliary Load: 177 MWeNet Plant Power: 497 MWeNet Plant Efficiency, HHV: 31.2%Net Plant Heat Rate: 10,927 Btu/kWh
Dry CoalCoal
Feeding
Steam
Candle FilterCyclone
N2 to GT Combustor
Boost Compressor
RecycleCompressor
Raw Syngasto Scrubber
333,980 W520 T625 P552 H
To Claus Plant
9 10
1
3
7
6
11
13
2
1,544,445 W59 T15 P13 H
60,248 W68 T16 P16 H
989,843 W90 T56 P14 H 139,103 W
50 T182 P
3 H
7,250 W90 T
125 P11 H
346,622 W90 T
125 P11 H
346,622 W241 T940 P41 H58,132 W
387 T815 P87 H
465,264 W59 T15 P
435,108 W60 T
840 P
46,599 W2,600 T
615 P
1,172,137 W1,980 T
615 P878 H
1,256,401 W450 T585 P523 H
W Flowrate, lbm/hr T Temperature, °FP Absolute Pressure, PSIAH Enthalpy, Btu/lbmMWe Power, Megawatts Electrical
687,451 W385 T384 P87 H
5
44,894 W650 T740 P
1,309 H
CoalDrying
Incinerator
Syngas Slip StreamIncinerator Air
Flue Gas/CombustionProducts
4,188 W94 T
520 P70 H
63,439 W59 T15 P13 H
97,783 W
8
1,128,946 W199 T384 P40 H
333,980 W450 T585 P523 H
SyngasQuenchCooler
Quench Water
418,244 W420 T
1,200 P388 H
To Reheater, Shift Steam, and gasifier
To LP Evaporator
From IP BFWFrom LP
Economizer
N2 Compressor
12
1,590,381 W600 T595 P585 H
1,590,381 W750 T605 P647 H
1,543,066 W100 T190 P18 H
383,362 W385 T469 P87 H
Syngas Cooler
Duct Cooler
Steam Generation
Shell Gasifier
Pre Particulat Cooler
Post Particulate
Cooler
From HP Economizer 2
To HP Economizer 1
To Superheater
From HP Economizer 2
Incinerator Exhaust
ASU Vent
N2 to GT Combustor
Notes:1. Enthalpy reference point is natural state
at 32 °F and 0.08865 psia

Cost and Performance Baseline for Fossil Energy Plants Volume 1b: Revision 2b
97
Exhibit 3-35 Case B1B syngas cleanup heat and mass balance schematic
Source: NETL
DOE/NETL
DUAL TRAIN IGCC PLANTCASE B1B
HEAT AND MATERIAL FLOW DIAGRAM
BITUMINOUS BASELINE STUDYCASE B1B
SHELL GASIFIERGAS CLEANUP SYSTEM
PLANT PERFORMANCE SUMMARY
LEGEND
Air
Oxygen
Nitrogen
Coal/Char/Slurry/Slag
Synthesis Gas
Mercury Removal
KnockOut
Drum
Raw Syngas
Sour Drum
Claus Plant
Tail Gas
Furnace
CatalyticReactorBeds
Sulfur
Sour Water
Reboiler
Acid Gas
Tailgas
Carbon Dioxide
Sour Gas
Sulfur
Hydrogen
DWG. NO.BB-HMB-CS-B1B-PG-2
PAGES2 OF 3
SourStripper
SyngasScrubber
Gross Plant Power: 673 MWeAuxiliary Load: 177 MWeNet Plant Power: 497 MWeNet Plant Efficiency, HHV: 31.2%Net Plant Heat Rate: 10,927 Btu/kWh
Water
13
16
17
22
2324
1,256,401 W450 T585 P523 H
27,484 W100 T800 P
4 H
436,986 W550 T800 P
1,246 H
1,594,881 W485 T565 P424 H
1,266,974 W94 T
520 P19 H
SyngasCoolers
248,650 W94 T
520 P70 H
3,022 W228 T65 P
370 H
36,563 W450 T12 P
479 H
37,925 W119 T24 P37 H
Knock Out
Tailgas to AGR
1,594,881 W422 T575 P663 H
1,239,491 W95 T
525 P19 H
W Flowrate, lbm/hr T Temperature, °FP Absolute Pressure, PSIAH Enthalpy, Btu/lbmMWe Power, Megawatts Electrical
9,080 W114 T11 P40 H
Treated Syngas
18
Humidification 19 Humidified Fuel Gas20
8
Shift Steam
HighTemperature
Shift #1
LowTemperature
Shift #2
Fuel GasHumidification
1,157,895 W376 T580 P435 H
1,157,895 W386 T575 P439 H
1,594,881 W478 T560 P421 H
14
15
Two-StageSelexol
Clean Gas
CO2
Acid Gas
Interstage Knockout
21
Multistage Intercooled CO2
Compressor
975,038 W124 T
2,215 P-70 H
25
Tailgas RecycleCompressor
HydrogenationAnd Tail Gas
Cooling
To Fuel Gas Preheater
From Fuel Gas Preheater
411,354 W376 T580 P380 H
411,354 W150 T
1,205 P118 H
4,188 W94 T
520 P70 H
333,100 W278 T465 P508 H
333,100 W380 T460 P609 H
From IP BFW, LP BFW, and Tail Gas Cooling
To Syngas Cooling
From Gland Steam Condenser
109 T
To LP Turbine, PreheaterWGS/Gasifier Steam
and Reheater
29,998 W120 T11 P
115 H
To Water Treatment
Makeup Water
478,771 WTo Slag Quench
7,250 W90 T
125 P11 H
3
7,250 W450 T125 P92 H
Claus OxygenPreheater
To Deaerator
From IP BFW
11,634 W
CO2 Product
From Syngas Scrubber and HP
Economizer 2
To Syngas Scrubber and HP Economizer 1
Fuel Gas Preheater
Oxygen
Steam
Slip Stream to Coal Dryer
Notes:1. Enthalpy reference point is natural state
at 32 °F and 0.08865 psia

Cost and Performance Baseline for Fossil Energy Plants Volume 1b: Revision 2b
98
Exhibit 3-36 Case B1B combined cycle power generation heat and mass balance schematic
Source: NETL
DOE/NETL
DUAL TRAIN IGCC PLANTCASE B1B
HEAT AND MATERIAL FLOW DIAGRAM
BITUMINOUS BASELINE STUDYCASE B1B
SHELL GASIFIERPOWER BLOCK SYSTEM
DWG. NO.BB-HMB-CS-B1B-PG-3
PLANT PERFORMANCE SUMMARY
LEGEND
Air
Oxygen
Nitrogen
Coal/Char/Slurry/Slag
Synthesis Gas
PAGES3 OF 3
Sour Gas
Sour Water
Water
Steam
Flue Gas
HPTurbine
IPTurbine
Air Inlet Filter
Steam Seal Regulator
GlandSteam
Condenser
LP Turbine
Stack
ExpanderCompressor
Generator
Generator
Steam Turbine
State-of-the-art 2008 F-Class Turbine
7,014,133 W59 T15 P13 H
1,911,334 W101 T
1 P69 H
8,418,047 W270 T15 P
160 H
333,100 W380 T460 P609 H
1,146,042 W993 T
1,815 P1,468 H
8,328 W298 T65 P
1,171 H
1,393,093 W440 T65 P
1,244 H
1,911,334 W103 T120 P71 H
1,400 W614 T65 P
1,331 H
1,400 W212 T15 P
180 H
21
24
16
23
Hot Well
Condenser 506,076 W59 T15 P27 H
9,028 W660 T501 P
1,326 H
9,765 W614 T65 P
1,331 H
30,983 W500 T250 P
1,255 H
799 W993 T
1,815 P1,468 H
1,338 W504 T65 P
1,276 H
Preheater DeaeratorHeater
HP Economizer
1
LP Economizer
HP Economizer
2
HP Evaporator
Superheater/ Reheater
From Syngas Cooler To Duct and Radiant Syngas
Coolers
From Duct and Radiant Syngas Coolers
To ASU and Humidifier
Deaerator
From ASU and Humidifier
LP Evaporator
IP to Pre Particulate and Syngas Coolers
IP From Syngas and Pre Particulate Cooler
WGS Shift Steam
From Claus, Process Extraction, and 250 PSIA Header
LP Extraction Spray
LP Blowdown
LP To Syngas Coolers
Cold Reheat
Hot Reheat
8,418,047 W1,043 T
15 P372 H
22
To WWT
Condensate to Tail Gas Cooling
IP Extraction Steam to 250 PSIA Header
Process Extraction
LP From Syngas Coolers
W Flowrate, lbm/hr T Temperature, °FP Absolute Pressure, PSIAH Enthalpy, Btu/lbmMWe Power, Megawatts Electrical
235 T
274 T
1,843,260 W274 T45 P
242 H
1,169,363 W279 T
2,251 P247 H
9,216 W274 T79 P
242 H
25,067 W274 T79 P
242 H271,164 W
274 T79 P
242 H41,443 W
276 T615 P244 H
282,770 W351 T
2,251 P319 H
305 T 585 T 636 T
23,308 W585 T
2,001 P585 H
294,918 W550 T625 P
1,244 H
325,216 W550 T625 P
1,244 H
636 T
480,228 W585 T
2,001 P585 H
981,188 W661 T501 P
1,327 H
282,770 W585 T
2,001 P585 H
290,257 W298 T65 P
266 H
217,834 W298 T65 P
1,171 H
271,164 W298 T65 P
1,171 H
325,216 W275 T640 P243 H
Nitrogen Diluent 1
Fuel Gas
IP To Claus
0 W
30,298 W550 T625 P
1,244 H
Gasifier Steam
To Post Particulate
Cooler
From Post Particulate
Cooler
LP Extraction Spray #1
LP Extraction Spray #2
Steam to Gasifier and WGS
20,429 W241 T825 P209 H 156,625 W
649 T740 P
1,303 H
1,000 W993 T
1,815 P1,468 H 1,000 W
212 T15 P
180 H
993 T
195 T
Water Makeup
Nitrogen Diluent 2
383,362 W385 T384 P87 H
687,451 W385 T469 P87 H
HP Pump
LP Pump
IP Pump
Gross Plant Power: 673 MWeAuxiliary Load: 177 MWeNet Plant Power: 497 MWeNet Plant Efficiency, HHV: 31.2%Net Plant Heat Rate: 10,927 Btu/kWh
CondensatePumps
Notes:1. Enthalpy reference point is natural state
at 32 °F and 0.08865 psia

Cost and Performance Baseline for Fossil Energy Plants Volume 1b: Revision 2b
99
This page intentionally left blank

Cost and Performance Baseline for Fossil Energy Plants Volume 1b: Revision 2b
100
Exhibit 3-37 Case B1B overall energy balance (0°C [32°F] reference)
HHV Sensible + Latent Power Total
Heat In (GJ/hr)
Coal 5,727 (5,428) 4.8 (4.5) – 5,731
(5,432)
Air – 118.2 (112.1) – 118.2 (112.1)
Raw Water Makeup – 80.5 (76.3) – 80.5 (76.3) Auxiliary Power – – 636 (603) 636 (603)
TOTAL 5,727 (5,428) 203.5 (192.9) 636 (603) 6,566
(6,223) Heat Out (GJ/hr)
ASU Vent – 1.0 (1.0) – 1.0 (1.0) Slag 22.1 (20.9) 35.7 (33.8) – 57.7 (54.7)
Stack Gas – 1,418 (1,344) – 1,418 (1,344)
Sulfur 48.9 (46.3) 0.6 (0.6) – 49.5 (46.9) Motor Losses and Design
Allowances – – 55.5 (52.6) 55.5 (52.6)
Condenser – 1,335 (1,265) – 1,335 (1,265)
Non-Condenser Cooling Tower Loads – 724 (686) – 724 (686)
CO₂ – -71.5 (-67.8) – -71.5 (-67.8) Blowdown – 41.3 (39.1) – 41.3 (39.1)
CO₂ Capture Losses – 171.0 (162.1) – 171.0 (162.1)
Ambient LossesA – 115.3 (109.3) – 115.3 (109.3)
Power – – 2,424 (2,298)
2,424 (2,298)
TOTAL 71.0 (67.2) 3,769 (3,573) 2,480 (2,350)
6,320 (5,990)
Unaccounted EnergyB – 246 (233) – 246 (233)
AAmbient losses include all losses to the environment through radiation, convection, etc. Sources of these losses include the combustor, reheater, superheater, and transformers. BBy difference
3.2.10 Case B1B - Major Equipment List Major equipment items for the Shell gasifier with CO2 capture are shown in the following tables. The accounts used in the equipment list correspond to the account numbers used in the cost

Cost and Performance Baseline for Fossil Energy Plants Volume 1b: Revision 2b
101
estimates in Section 3.2.11. In general, the design conditions include a 10 percent contingency for flows and heat duties and a 21 percent contingency for heads on pumps and fans.
Case B1B – Account 1: Coal Handling Equipment
No. Description Type Design Condition Operating Qty. Spares
1 Bottom Trestle Dumper and Receiving Hoppers N/A 181 tonne (200 ton) 2 0
2 Feeder Belt 570 tonne/hr (630 tph) 2 0 3 Conveyor No. 1 Belt 1,130 tonne/hr (1,250 tph) 1 0 4 Conveyor No. 2 Belt 1,130 tonne/hr (1,250 tph) 1 0 5 Stacker/Reclaimer Traveling, linear 1,130 tonne/hr (1,250 tph) 1 0 6 Reclaim Hopper N/A 40 tonne (50 ton) 2 1 7 Feeder Vibratory 170 tonne/hr (190 tph) 2 1 8 Conveyor No. 3 Belt w/ tripper 350 tonne/hr (380 tph) 1 0 9 Coal Surge Bin w/ Vent Filter Dual outlet 170 tonne (190 ton) 2 0
10 Crusher Impactor reduction 8 cm x 0 - 3 cm x 0 (3" x 0 - 1-1/4" x 0) 2 0
11 Conveyor No. 4 Belt w/ tripper 350 tonne/hr (380 tph) 1 0 12 Conveyor No. 5 Belt w/ tripper 350 tonne/hr (380 tph) 1 0
13 Coal Silo w/ Vent Filter and Slide Gates Field erected 800 tonne (900 ton) 3 0
Case B1B – Account 2: Coal Preparation and Feed Equipment
No. Description Type Design Condition Operating Qty. Spares
1 Feeder Vibratory 80 tonne/hr (90 tph) 3 0 2 Conveyor No. 6 Belt w/ tripper 230 tonne/hr (260 tph) 1 0 3 Roller Mill Feed Hopper Dual Outlet 460 tonne (510 ton) 1 0 4 Weigh Feeder Belt 120 tonne/hr (130 tph) 2 0 5 Coal Dryer and Pulverizer Rotary 120 tonne/hr (130 tph) 2 0 6 Coal Dryer Feed Hopper Vertical Hopper 230 tonne (260 ton) 2 0
Case B1B – Account 3: Feedwater and Miscellaneous Systems and Equipment Equipment
No. Description Type Design Condition Operating Qty. Spares
1 Demineralized Water Storage Tank
Vertical, cylindrical, outdoor 987,000 liters (261,000 gal) 2 0
2 Condensate Pumps Vertical canned 8,000 lpm @ 90 m H₂O (2,110 gpm @ 300 ft H₂O) 2 1
3 Deaerator (integral w/ HRSG) Horizontal spray type 551,000 kg/hr (1,215,000
lb/hr) 2 0
4 Intermediate-Pressure Feedwater Pump
Horizontal centrifugal, single stage
7,970 lpm @ 30 m H₂O (2,110 gpm @ 90 ft H₂O) 2 1
5 High-Pressure Feedwater Pump No. 1
Barrel type, multi-stage, centrifugal
HP water: 5,060 lpm @ 1,800 m H₂O
(1,340 gpm @ 6,100 ft H₂O) 2 1
6 High-Pressure Feedwater Pump No. 2
Barrel type, multi-stage, centrifugal
IP water: 1,220 lpm @ 220 m H₂O (320 gpm @ 730 ft H₂O) 2 1
7 Auxiliary Boiler Shop fabricated, water tube
18,000 kg/hr, 2.8 MPa, 343°C (40,000 lb/hr, 400 psig, 650°F) 1 0
8 Service Air Compressors Flooded Screw 28 m3/min @ 0.7 MPa
(1,000 scfm @ 100 psig) 2 1
9 Instrument Air Dryers Duplex, regenerative 28 m3/min (1,000 scfm) 2 1
10 Closed Cycle Cooling Heat Exchangers Plate and frame 398 GJ/hr
(377 MMBtu/hr) each 2 0
11 Closed Cycle Cooling Water Pumps Horizontal centrifugal 142,800 lpm @ 20 m H₂O
(37,700 gpm @ 70 ft H₂O) 2 1

Cost and Performance Baseline for Fossil Energy Plants Volume 1b: Revision 2b
102
Equipment No. Description Type Design Condition Operating
Qty. Spares
12 Engine-Driven Fire Pump
Vertical turbine, diesel engine
3,785 lpm @ 110 m H₂O (1,000 gpm @ 350 ft H₂O) 1 1
13 Fire Service Booster Pump
Two-stage horizontal centrifugal
2,650 lpm @ 80 m H₂O (700 gpm @ 250 ft H₂O) 1 1
14 Raw Water Pumps Stainless steel, single suction
5,950 lpm @ 20 m H₂O (1,570 gpm @ 60 ft H₂O) 2 1
15 Ground Water Pumps Stainless steel, single suction
2,980 lpm @ 270 m H₂O (790 gpm @ 880 ft H₂O) 4 1
16 Filtered Water Pumps Stainless steel, single suction
4,640 lpm @ 50 m H₂O (1,230 gpm @ 160 ft H₂O) 2 1
17 Filtered Water Tank Vertical, cylindrical 2,226,000 liter (588,000 gal) 2 0
18 Makeup Water Demineralizer
Anion, cation, and mixed bed 2,090 lpm (550 gpm) 2 0
19 Liquid Waste Treatment System N/A 10 years, 24-hour storm 1 0
Case B1B – Account 4: Gasifier, ASU, and Accessories Including Low Temperature Heat Recovery and Fuel Gas Saturation Equipment
No. Description Type Design Condition Operating Qty. Spares
1 Gasifier Pressurized dry-feed, entrained bed
2,800 tonne/day, 4.2 MPa (3,100 tpd, 615 psia) 2 0
2 Synthesis Gas Cooler Convective spiral-wound tube boiler 397,000 kg/hr (875,000 lb/hr) 2 0
3 Synthesis Gas Cyclone High efficiency 313,000 kg/hr (691,000 lb/hr)
Design efficiency 90% 2 0
4 Candle Filter Pressurized filter with pulse-jet cleaning metallic filters 2 0
5 Syngas Scrubber Including Sour Water Stripper
Vertical upflow 313,000 kg/hr (691,000 lb/hr) 2 0
6 Raw Gas Coolers Shell and tube with condensate drain 398,000 kg/hr (877,000 lb/hr) 8 0
7 Raw Gas Knockout Drum
Vertical with mist eliminator
310,000 kg/hr, 35°C, 3.7 MPa (683,000 lb/hr, 95°F, 530 psia) 2 0
8 Saturation Water Economizers Shell and tube 78 GJ/hr (74 MMBtu/hr) 2 0
9 Fuel Gas Saturator Vertical tray tower 83,000 kg/hr, 137°C, 3.6 MPa (183,000 lb/hr, 278°F, 520 psia) 2 0
10 Saturator Water Pump Centrifugal 1,700 lpm @ 13 m H₂O
(500 gpm @ 42 ft H₂O) 2 2
11 Synthesis Gas Reheater Shell and tube 83,000 kg/hr (183,000 lb/hr) 2 0
12 Flare Stack Self-supporting, carbon steel, stainless steel top, pilot ignition
313,000 kg/hr (691,000 lb/hr) syngas 2 0
13 ASU Main Air Compressor Centrifugal, multi-stage 5,000 m3/min @ 1.3 MPa
(186,000 scfm @ 190 psia) 2 0
14 Cold Box Vendor design 2,100 tonne/day (2,300 tpd) of 95% purity oxygen 2 0
15 Oxygen Compressor Centrifugal, multi-stage 1,000 m3/min (37,000 scfm) Suction - 1.0 MPa (130 psia)
Discharge - 6.5 MPa (940 psia) 2 0
16 Primary Nitrogen Compressor Centrifugal, multi-stage
3,000 m3/min (123,000 scfm) Suction - 0.4 MPa (60 psia)
Discharge - 2.7 MPa (390 psia) 2 0

Cost and Performance Baseline for Fossil Energy Plants Volume 1b: Revision 2b
103
Equipment No. Description Type Design Condition Operating
Qty. Spares
17 Secondary Nitrogen Compressor
Centrifugal, single-stage
490 m3/min (17,000 scfm) Suction - 1.3 MPa (180 psia)
Discharge - 2.7 MPa (390 psia) 2 0
18 Gasifier Purge Nitrogen Boost Compressor
Centrifugal, single-stage
1,000 m3/min (48,000 scfm) Suction - 2.6 MPa (380 psia)
Discharge - 3.2 MPa (470 psia) 2 0
Case B1B – Account 5: Syngas Cleanup Equipment
No. Description Type Design Condition Operating Qty. Spares
1 Mercury Adsorber 1 Sulfated carbon bed 309,000 kg/hr (682,000 lb/hr), 35°C (95°F), 3.6 MPa (525 psia) 2 0
2 Mercury Adsorber 2 Sulfated carbon bed 309,000 kg/hr (682,000 lb/hr), 35°C (95°F), 3.6 MPa (520 psia) 2 0
3 Sulfur Plant Claus type 139 tonne/day (154 tpd) 1 0
4 Water Gas Shift Reactors Fixed bed, catalytic 199,000 kg/hr (439,000 lb/hr),
216°C (420°F), 4.0 MPa (580 psia) 4 0
5 Shift Reactor Heat Recovery Exchangers
Shell and Tube Exchanger 1: 121 GJ/hr (114
MMBtu/hr) Exchanger 2: 3 GJ/hr (3 MMBtu/hr)
4 0
6 Acid Gas Removal Plant Two-stage selexol 316,000 kg/hr (697,000 lb/hr),
35°C (94°F), 3.6 MPa (520 psia) 2 0
7 Hydrogenation Reactor Fixed bed, catalytic
18,000 kg/hr (40,000 lb/hr) 232°C (450°F)
0.1 MPa (12.2959488 psia) 1 0
8 Tail Gas Recycle Compressor Centrifugal 14,000 kg/hr (30,000 lb/hr) each 1 0
9 CO2 Compressor Integrally geared, multi-stage centrifugal
1,100 m3/min @ 15.3 MPa (38,700 scfm @ 2,215 psia) 4 0
Case B1B – Account 6: Combustion Turbine and Auxiliaries Equipment
No. Description Type Design Condition Operating Qty. Spares
1 Combustion Turbine State-of-the-art 2008 F-class 230 MW 2 0
2 Combustion Turbine Generator TEWAC 260 MVA @ 0.9 p.f., 24 kV, 60 Hz,
3-phase 2 0
Case B1B – Account 7: HRSG, Ducting, and Stack Equipment
No. Description Type Design Condition Operating Qty. Spares
1 Stack CS plate, type 409SS liner
76 m (250 ft) high x 8.5 m (28 ft) diameter 1 0
2 Heat Recovery Steam Generator
Drum, multi-pressure with economizer section and integral deaerator
Main steam - 285,910 kg/hr, 12.4 MPa/534°C
(630,323 lb/hr, 1,800 psig/993°F) 2 0
Case B1B – Account 8: Steam Turbine Generator and Auxiliaries Equipment
No. Description Type Design Condition Operating Qty. Spares
1 Steam Turbine
Commercially available advanced steam turbine
220 MW 12.4 MPa/534°C/534°C (1,800 psig/
993°F/993°F) 1 0

Cost and Performance Baseline for Fossil Energy Plants Volume 1b: Revision 2b
104
Equipment No. Description Type Design Condition Operating
Qty. Spares
2 Steam Turbine Generator
Hydrogen cooled, static excitation
240 MVA @ 0.9 p.f., 24 kV, 60 Hz, 3-phase 1 0
3 Surface Condenser
Single pass, divided waterbox including vacuum pumps
1,470GJ/hr (1,390 MMBtu/hr), Inlet water temperature 16°C
(60°F), Water temperature rise 11°C (20°F)
1 0
4 Steam Bypass One per HRSG 50% steam flow @ design steam
conditions 2 0
Case B1B – Account 9: Cooling Water System Equipment
No. Description Type Design Condition Operating Qty. Spares
1 Circulating Water Pumps Vertical, wet pit 440,000 lpm @ 30 m
(116,000 gpm @ 100 ft) 2 1
2 Cooling Tower Evaporative, mechanical draft, multi-cell
11°C (51.5°F) wet bulb / 16°C (60°F) CWT / 27°C (80°F) HWT /
2,450 GJ/hr (2,320 MMBtu/hr) heat duty
1 0
Case B1B – Account 10: Slag Recovery and Handling Equipment
No. Description Type Design Condition Operating Qty. Spares
1 Slag Quench Tank Water bath 222,000 liters (59,000 gal) 2 0 2 Slag Crusher Roll 12 tonne/hr (13 tph) 2 0 3 Slag Depressurizer Lock hopper 12 tonne/hr (13 tph) 2 0 4 Slag Receiving Tank Horizontal, weir 133,000 liters (35,000 gal) 2 0 5 Black Water Overflow Tank Shop fabricated 60,000 liters (16,000 gal) 2 0 6 Slag Conveyor Drag chain 12 tonne/hr (13 tph) 2 0 7 Slag Separation Screen Vibrating 12 tonne/hr (13 tph) 2 0 8 Coarse Slag Conveyor Belt/bucket 12 tonne/hr (13 tph) 2 0 9 Fine Ash Settling Tank Vertical, gravity 190,000 liters (50,000 gal) 2 0
10 Fine Ash Recycle Pumps Horizontal centrifugal 50 lpm @ 14 m H₂O (10 gpm @ 46 ft H₂O) 2 2
11 Grey Water Storage Tank Field erected 60,000 liters (16,000 gal) 2 0
12 Grey Water Pumps Centrifugal 210 lpm @ 430 m H₂O (60 gpm @ 1,420 ft H₂O) 2 2
13 Slag Storage Bin Vertical, field erected 800 tonne (900 tons) 2 0 14 Unloading Equipment Telescoping chute 100 tonne/hr (110 tph) 1 0
Case B1B – Account 11: Accessory Electric Plant Equipment
No. Description Type Design Condition Operating Qty. Spares
1 CTG Transformer Oil-filled 24 kV/345 kV, 260 MVA, 3-ph, 60 Hz 2 0
2 STG Transformer Oil-filled 24 kV/345 kV, 200 MVA, 3-ph, 60 Hz 1 0
3 High Voltage Auxiliary Transformer Oil-filled 345 kV/13.8 kV, 74
MVA, 3-ph, 60 Hz 2 0
4 Medium Voltage Transformer Oil-filled 24 kV/4.16 kV, 46 MVA, 3-ph, 60 Hz 1 1
5 Low Voltage Transformer Dry ventilated 4.16 kV/480 V, 7 MVA, 3-ph, 60 Hz 1 1
6 CTG Isolated Phase Bus Duct and Tap Bus
Aluminum, self-cooled 24 kV, 3-ph, 60 Hz 2 0
7 STG Isolated Phase Bus Duct and Tap Bus
Aluminum, self-cooled 24 kV, 3-ph, 60 Hz 1 0

Cost and Performance Baseline for Fossil Energy Plants Volume 1b: Revision 2b
105
Equipment No. Description Type Design Condition Operating
Qty. Spares
8 Medium Voltage Switchgear Metal clad 4.16 kV, 3-ph, 60 Hz 1 1 9 Low Voltage Switchgear Metal enclosed 480 V, 3-ph, 60 Hz 1 1
10 Emergency Diesel Generator Sized for emergency shutdown
750 kW, 480 V, 3-ph, 60 Hz 1 0
Case B1B – Account 12: Instrumentation and Control Equipment
No. Description Type Design Condition Operating Qty. Spares
1 DCS - Main Control
Monitor/keyboard; Operator printer (laser color); Engineering printer (laser B&W)
Operator stations/printers and engineering stations/printers
1 0
2 DCS - Data Highway Fiber optic Fully redundant, 25% spare 1 0
3.2.11 Case B1B - Cost Estimating The cost estimating methodology was described previously in Section 2.6. Exhibit 3-38 shows a detailed breakdown of the capital costs; Exhibit 3-39 shows the owner’s costs, TOC, and TASC; Exhibit 3-40 shows the initial and annual O&M costs; and Exhibit 3-41 shows the COE breakdown.
The estimated TPC of the Shell gasifier with CO2 capture is $3,981/kW. Process contingency represents 4.0 percent of the TPC, and project contingency represents 14.1 percent. The COE, including CO2 T&S costs of $9.8/MWh, is $162.4/MWh.

Cost and Performance Baseline for Fossil Energy Plants Volume 1b: Revision 2b
106
Exhibit 3-38 Case B1B total plant cost details
Case: B1B – Shell IGCC w/ CO₂ Estimate Type: Conceptual Plant Size (MW,net): 497 Cost Base: Jun 2011
Item Description Equipment Material Labor Bare Erected Eng'g CM Contingencies Total Plant Cost No. Cost Cost Direct Indirect Cost H.O.& Fee Process Project $/1,000 $/kW
1 Coal & Sorbent Handling 1.1 Coal Receive & Unload $4,425 $0 $2,133 $0 $6,558 $656 $0 $1,443 $8,656 $17 1.2 Coal Stackout & Reclaim $5,718 $0 $1,367 $0 $7,086 $709 $0 $1,559 $9,353 $19 1.3 Coal Conveyors & Yd Crush $5,316 $0 $1,353 $0 $6,669 $667 $0 $1,467 $8,803 $18 1.4 Other Coal Handling $1,391 $0 $313 $0 $1,704 $170 $0 $375 $2,249 $5 1.9 Coal & Sorbent Hnd. Foundations $0 $2,955 $7,723 $0 $10,677 $1,068 $0 $2,349 $14,094 $28
Subtotal $16,851 $2,955 $12,889 $0 $32,694 $3,269 $0 $7,193 $43,156 $87 2 Coal & Sorbent Prep & Feed
2.1 Coal Crushing & Drying $50,700 $3,058 $7,286 $0 $61,043 $6,104 $0 $13,430 $80,577 $162 2.2 Prepared Coal Storage & Feed $2,401 $577 $371 $0 $3,350 $335 $0 $737 $4,422 $9 2.3 Dry Coal Injection System $79,030 $911 $7,239 $0 $87,180 $8,718 $0 $19,180 $115,078 $232 2.4 Misc. Coal Prep & Feed $1,321 $965 $2,842 $0 $5,127 $513 $0 $1,128 $6,767 $14 2.9 Coal & Sorbent Feed Foundation $0 $4,844 $4,156 $0 $9,000 $900 $0 $1,980 $11,880 $24
Subtotal $133,452 $10,354 $21,894 $0 $165,700 $16,570 $0 $36,454 $218,724 $440 3 Feedwater & Miscellaneous BOP Systems
3.1 Feedwater System $2,970 $5,126 $2,687 $0 $10,784 $1,078 $0 $2,372 $14,234 $29 3.2 Water Makeup & Pretreating $857 $89 $471 $0 $1,416 $142 $0 $467 $2,024 $4 3.3 Other Feedwater Subsystems $1,670 $552 $493 $0 $2,715 $271 $0 $597 $3,584 $7 3.4 Service Water Systems $501 $999 $3,443 $0 $4,942 $494 $0 $1,631 $7,068 $14 3.5 Other Boiler Plant Systems $2,699 $1,009 $2,483 $0 $6,191 $619 $0 $1,362 $8,172 $16 3.6 FO Supply Sys & Nat Gas $17,717 $675 $625 $0 $19,017 $1,902 $0 $4,184 $25,103 $51 3.7 Waste Treatment Equipment $1,159 $0 $718 $0 $1,877 $188 $0 $619 $2,683 $5 3.8 Misc. Power Plant Equipment $1,261 $168 $655 $0 $2,085 $208 $0 $688 $2,981 $6
Subtotal $28,834 $8,617 $11,575 $0 $49,026 $4,903 $0 $11,921 $65,849 $133 4 Gasifier & Accessories
4.1 Syngas Cooler Gasifier System $171,383 $0 $73,493 $0 $244,876 $24,488 $33,487 $46,617 $349,467 $704 4.2 Syngas Cooler w/4.1 $0 w/ 4.1 $0 $0 $0 $0 $0 $0 $0 4.3 ASU & Oxidant Compression $207,843 $0 w/equip. $0 $207,843 $20,784 $0 $22,863 $251,490 $506 4.4 LT Heat Recovery & FG Saturation $30,655 $0 $11,647 $0 $42,303 $4,230 $0 $9,307 $55,840 $112 4.5 Misc. Gasification Equipment w/4.1&4.2 $0 w/4.1&4.2 $0 $0 $0 $0 $0 $0 $0 4.6 Flare Stack System $0 $1,694 $685 $0 $2,379 $238 $0 $523 $3,141 $6 4.8 Major Component Rigging w/4.1&4.2 $0 w/4.1&4.2 $0 $0 $0 $0 $0 $0 $0 4.9 Gasification Foundations $0 $9,672 $5,768 $0 $15,440 $1,544 $0 $4,246 $21,230 $43
Subtotal $409,881 $11,366 $91,593 $0 $512,841 $51,284 $33,487 $83,556 $681,168 $1,371 5A Gas Cleanup & Piping
5A.1 Double Stage Selexol $162,818 $0 w/equip. $0 $162,818 $16,282 $32,564 $42,333 $253,996 $511 5A.2 Elemental Sulfur Plant $12,076 $2,354 $15,473 $0 $29,902 $2,990 $0 $6,579 $39,471 $79 5A.3 Mercury Removal $2,022 $0 $1,528 $0 $3,550 $355 $177 $816 $4,899 $10 5A.4 Shift Reactors $8,880 $0 $3,550 $0 $12,429 $1,243 $0 $2,734 $16,406 $33 5A.5 Particulate Removal w/4.1 $0 w/4.1 $0 $0 $0 $0 $0 $0 $0

Cost and Performance Baseline for Fossil Energy Plants Volume 1b: Revision 2b
107
Case: B1B – Shell IGCC w/ CO₂ Estimate Type: Conceptual Plant Size (MW,net): 497 Cost Base: Jun 2011
Item Description Equipment Material Labor Bare Erected Eng'g CM Contingencies Total Plant Cost No. Cost Cost Direct Indirect Cost H.O.& Fee Process Project $/1,000 $/kW
5A.6 Blowback Gas Systems $2,562 $431 $241 $0 $3,234 $323 $0 $711 $4,269 $9 5A.7 Fuel Gas Piping $0 $1,043 $683 $0 $1,726 $173 $0 $380 $2,278 $5 5A.9 HGCU Foundations $0 $944 $636 $0 $1,581 $158 $0 $522 $2,261 $5
Subtotal $188,356 $4,773 $22,111 $0 $215,240 $21,524 $32,741 $54,075 $323,580 $651 5B CO2 Compression
5B.2 CO₂ Compression & Drying $39,421 $5,913 $16,551 $0 $61,885 $6,188 $0 $13,615 $81,688 $164 Subtotal $39,421 $5,913 $16,551 $0 $61,885 $6,188 $0 $13,615 $81,688 $164 6 Combustion Turbine & Accessories
6.1 Combustion Turbine Generator $111,210 $0 $7,881 $0 $119,091 $11,909 $11,909 $14,291 $157,201 $316 6.9 Combustion Turbine Foundations $0 $923 $1,068 $0 $1,992 $199 $0 $657 $2,848 $6
Subtotal $111,210 $923 $8,950 $0 $121,083 $12,108 $11,909 $14,948 $160,049 $322 7 HRSG, Ducting, & Stack
7.1 Heat Recovery Steam Generator $29,630 $0 $5,739 $0 $35,369 $3,537 $0 $3,891 $42,796 $86 7.3 Ductwork $0 $2,111 $1,480 $0 $3,591 $359 $0 $790 $4,740 $10 7.4 Stack $4,074 $0 $1,520 $0 $5,594 $559 $0 $615 $6,769 $14 7.9 HRSG, Duct & Stack Foundations $0 $776 $779 $0 $1,554 $155 $0 $513 $2,222 $4
Subtotal $33,704 $2,887 $9,517 $0 $46,108 $4,611 $0 $5,809 $56,527 $114 8 Steam Turbine Generator
8.1 Steam TG & Accessories $35,245 $0 $4,790 $0 $40,035 $4,003 $0 $4,404 $48,442 $98 8.2 Turbine Plant Auxiliaries $199 $0 $453 $0 $651 $65 $0 $72 $788 $2 8.3 Condenser & Auxiliaries $3,020 $0 $1,697 $0 $4,717 $472 $0 $519 $5,708 $11 8.4 Steam Piping $13,533 $0 $5,869 $0 $19,402 $1,940 $0 $5,335 $26,677 $54 8.9 TG Foundations $0 $937 $1,655 $0 $2,592 $259 $0 $855 $3,707 $7
Subtotal $51,997 $937 $14,463 $0 $67,397 $6,740 $0 $11,185 $85,322 $172 9 Cooling Water System
9.1 Cooling Towers $4,330 $0 $1,310 $0 $5,640 $564 $0 $931 $7,135 $14 9.2 Circulating Water Pumps $2,088 $0 $154 $0 $2,242 $224 $0 $370 $2,836 $6 9.3 Circ. Water System Auxiliaries $183 $0 $26 $0 $208 $21 $0 $34 $264 $1 9.4 Circ. Water Piping $0 $8,098 $1,962 $0 $10,060 $1,006 $0 $2,213 $13,280 $27 9.5 Make-up Water System $475 $0 $653 $0 $1,128 $113 $0 $248 $1,489 $3 9.6 Component Cooling Water Sys $926 $1,107 $760 $0 $2,794 $279 $0 $615 $3,687 $7 9.9 Circ. Water System Foundations $0 $2,651 $4,711 $0 $7,362 $736 $0 $2,429 $10,527 $21
Subtotal $8,001 $11,857 $9,575 $0 $29,434 $2,943 $0 $6,840 $39,217 $79 10 Ash & Spent Sorbent Handling Systems
10.1 Slag Dewatering & Cooling $19,503 $0 $9,552 $0 $29,055 $2,905 $0 $3,196 $35,156 $71 10.2 Gasifier Ash Depressurization w/10.1 w/10.1 w/10.1 $0 $0 $0 $0 $0 $0 $0 10.3 Cleanup Ash Depressurization w/10.1 w/10.1 w/10.1 $0 $0 $0 $0 $0 $0 $0 10.6 Ash Storage Silos $658 $0 $711 $0 $1,368 $137 $0 $226 $1,731 $3 10.7 Ash Transport & Feed Equipment $905 $0 $211 $0 $1,117 $112 $0 $184 $1,413 $3 10.8 Misc. Ash Handling Equipment $1,362 $1,670 $495 $0 $3,527 $353 $0 $582 $4,462 $9 10.9 Ash/Spent Sorbent Foundation $0 $55 $73 $0 $128 $13 $0 $42 $183 $0
Subtotal $22,428 $1,725 $11,042 $0 $35,195 $3,519 $0 $4,230 $42,945 $86

Cost and Performance Baseline for Fossil Energy Plants Volume 1b: Revision 2b
108
Case: B1B – Shell IGCC w/ CO₂ Estimate Type: Conceptual Plant Size (MW,net): 497 Cost Base: Jun 2011
Item Description Equipment Material Labor Bare Erected Eng'g CM Contingencies Total Plant Cost No. Cost Cost Direct Indirect Cost H.O.& Fee Process Project $/1,000 $/kW
11 Accessory Electric Plant 11.1 Generator Equipment $1,096 $0 $1,067 $0 $2,162 $216 $0 $238 $2,616 $5 11.2 Station Service Equipment $5,293 $0 $487 $0 $5,780 $578 $0 $636 $6,994 $14 11.3 Switchgear & Motor Control $9,770 $0 $1,816 $0 $11,586 $1,159 $0 $1,912 $14,657 $30 11.4 Conduit & Cable Tray $0 $4,964 $15,302 $0 $20,266 $2,027 $0 $5,573 $27,866 $56 11.5 Wire & Cable $0 $9,571 $5,823 $0 $15,394 $1,539 $0 $4,233 $21,167 $43 11.6 Protective Equipment $0 $798 $2,963 $0 $3,761 $376 $0 $621 $4,758 $10 11.7 Standby Equipment $263 $0 $262 $0 $525 $53 $0 $87 $664 $1 11.8 Main Power Transformers $18,593 $0 $162 $0 $18,756 $1,876 $0 $3,095 $23,726 $48 11.9 Electrical Foundations $0 $170 $462 $0 $632 $63 $0 $209 $904 $2
Subtotal $35,016 $15,503 $28,345 $0 $78,864 $7,886 $0 $16,603 $103,353 $208 12 Instrumentation & Control
12.1 IGCC Control Equipment w/4.1 $0 w/4.1 $0 $0 $0 $0 $0 $0 $0 12.2 Combustion Turbine Control w/6.1 $0 w/6.1 $0 $0 $0 $0 $0 $0 $0 12.3 Steam Turbine Control w/8.1 $0 w/8.1 $0 $0 $0 $0 $0 $0 $0 12.4 Other Major Component Control $1,274 $0 $868 $0 $2,143 $214 $107 $370 $2,834 $6 12.5 Signal Processing Equipment w/12.7 $0 w/12.7 $0 $0 $0 $0 $0 $0 $0 12.6 Control Boards, Panels & Racks $293 $0 $192 $0 $484 $48 $24 $111 $669 $1 12.7 Computer & Accessories $6,798 $0 $222 $0 $7,020 $702 $351 $807 $8,880 $18 12.8 Instrument Wiring & Tubing $0 $2,617 $4,953 $0 $7,570 $757 $379 $2,176 $10,882 $22 12.9 Other I & C Equipment $4,544 $0 $2,251 $0 $6,796 $680 $340 $1,172 $8,987 $18
Subtotal $12,909 $2,617 $8,487 $0 $24,013 $2,401 $1,201 $4,637 $32,252 $65 13 Improvements to Site
13.1 Site Preparation $0 $118 $2,686 $0 $2,804 $280 $0 $925 $4,010 $8 13.2 Site Improvements $0 $2,101 $2,970 $0 $5,072 $507 $0 $1,674 $7,252 $15 13.3 Site Facilities $3,765 $0 $4,227 $0 $7,992 $799 $0 $2,637 $11,429 $23
Subtotal $3,765 $2,219 $9,883 $0 $15,868 $1,587 $0 $5,236 $22,691 $46 14 Buildings & Structures
14.1 Combustion Turbine Area $0 $317 $179 $0 $496 $50 $0 $109 $655 $1 14.2 Steam Turbine Building $0 $2,481 $3,532 $0 $6,014 $601 $0 $992 $7,607 $15 14.3 Administration Building $0 $1,027 $745 $0 $1,772 $177 $0 $292 $2,242 $5 14.4 Circulation Water Pumphouse $0 $193 $102 $0 $295 $29 $0 $49 $373 $1 14.5 Water Treatment Buildings $0 $704 $686 $0 $1,391 $139 $0 $229 $1,759 $4 14.6 Machine Shop $0 $526 $360 $0 $885 $89 $0 $146 $1,120 $2 14.7 Warehouse $0 $849 $548 $0 $1,397 $140 $0 $230 $1,767 $4 14.8 Other Buildings & Structures $0 $508 $396 $0 $904 $90 $0 $199 $1,193 $2 14.9 Waste Treating Building & Str. $0 $1,137 $2,171 $0 $3,307 $331 $0 $728 $4,366 $9
Subtotal $0 $7,742 $8,718 $0 $16,460 $1,646 $0 $2,975 $21,081 $42 Total $1,095,825 $90,388 $285,594 $0 $1,471,807 $147,181 $79,338 $279,277 $1,977,603 $3,981

Cost and Performance Baseline for Fossil Energy Plants Volume 1b: Revision 2b
109
Exhibit 3-39 Case B1B owner’s costs
Description $/1,000 $/kW
Pre-Production Costs
6 Months All Labor $15,919 $32
1 Month Maintenance Materials $3,587 $7
1 Month Non-fuel Consumables $682 $1
1 Month Waste Disposal $434 $1
25% of 1 Months Fuel Cost at 100% CF $2,910 $6
2% of TPC $39,552 $80
Total $63,083 $127
Inventory Capital
60-day supply of fuel and consumables at 100% CF $24,228 $49
0.5% of TPC (spare parts) $9,888 $20
Total $34,116 $69
Other Costs
Initial Cost for Catalyst and Chemicals $16,739 $34
Land $900 $2
Other Owner's Costs $296,640 $597
Financing Costs $53,395 $107
Total Overnight Costs (TOC) $2,442,476 $4,917
TASC Multiplier (IOU, high-risk, 35 year) 1.140
Total As-Spent Cost (TASC) $2,784,423 $5,605

Cost and Performance Baseline for Fossil Energy Plants Volume 1b: Revision 2b
110
Exhibit 3-40 Case B1B initial and annual operating and maintenance costs Case: B1B – Shell IGCC w/ CO₂ Cost Base: Jun 2011
Plant Size (MW,net): 497 Heat Rate-net (Btu/kWh): 10,927 Capacity Factor (%): 80 Operating & Maintenance Labor
Operating Labor Operating Labor Requirements per Shift Operating Labor Rate (base): 39.70 $/hour Skilled Operator: 2.0
Operating Labor Burden: 30.00 % of base Operator: 10.0 Labor O-H Charge Rate: 25.00 % of labor Foreman: 1.0
Lab Tech's, etc.: 3.0 Total: 16.0
Fixed Operating Costs Annual Cost ($) ($/kW-net)
Annual Operating Labor: $7,233,658 $14.562 Maintenance Labor: $18,236,067 $36.711
Administrative & Support Labor: $6,367,431 $12.818 Property Taxes and Insurance: $39,552,053 $79.623
Total: $71,389,208 $143.715 Variable Operating Costs
($) ($/MWh-net) Maintenance Material: $34,437,835 $9.89265
Consumables Consumption Cost ($) Initial Fill Per Day Per Unit Initial Fill
Water (/1000 gallons): 0 4,070 $1.67 $0 $1,989,343 $0.57146 Makeup and Waste Water
Treatment Chemicals (lbs): 0 24,247 $0.27 $0 $1,896,308 $0.54474
Carbon (Mercury Removal) (lb): 201,639 345 $5.50 $1,109,016 $554,508 $0.15929 Shift Catalyst (ft3): 6,470 4.43 $771.99 $4,994,685 $998,937 $0.28696
Selexol Solution (gal): 289,068 92 $36.79 $10,635,172 $989,212 $0.28416 Claus Catalyst (ft3): w/equip. 1.93 $203.15 $0 $114,583 $0.03292
Subtotal: $16,738,872 $6,542,891 $1.87952 Waste Disposal
Spent Mercury Catalyst (lb.): 0 345 $0.65 $0 $65,542 $0.01883 Flyash (ton): 0 0 $0.00 $0 $0 $0.00000
Slag (ton): 0 559 $25.11 $0 $4,099,990 $1.17777 Subtotal: $0 $4,165,532 $1.19660
By-Products Sulfur (tons): 0 140 $0.00 $0 $0 $0.00000
Subtotal: $0 $0 $0.00000 Variable Operating Costs Total: $16,738,872 $45,146,258 $12.96876
Fuel Cost Illinois Number 6 (ton): 0 5,583 $68.54 $0 $111,739,739 $32.09848
Total: $0 $111,739,739 $32.09848
Exhibit 3-41 Case B1B COE breakdown
Component Value, $/MWh Percentage Capital 87.0 57%
Fixed 20.5 13% Variable 13.0 8%
Fuel 32.1 21% Total (Excluding T&S) 152.6 N/A
CO2 T&S 9.8 6% Total (Including T&S) 162.4 N/A

Cost and Performance Baseline for Fossil Energy Plants Volume 1b: Revision 2b
111
3.3 CB&I E-GasTM IGCC Cases This section contains an evaluation of plant designs for cases B4A and B4B, which are based on the CB&I E-Gas™ gasifier. Cases B4A and B4B are very similar in terms of process, equipment, scope and arrangement, except that Case B4B includes SGS reactors, CO2 absorption/regeneration and compression/transport systems. There are no provisions for CO2 removal in Case B4A. The balance of this section is organized in an analogous manner to Section 3.2:
• Gasifier Background • Process System Description for Case B4A • Key Assumptions for Cases B4A and B4B • Sparing Philosophy for Cases B4A and B4B • Performance Results for Case B4A • Equipment List for Case B4A • Cost Estimates for Case B4A • Process and System Description, Performance Results, Equipment List, and Cost
Estimate for Case B4B 3.3.1 Gasifier Background As mentioned in Section 3.2.1, the “Coal Gasification Guidebook: Status, Application, and Technologies” report published by EPRI provides a detailed history of the development of several types of gasifier technology, including the Shell gasifier, as well as gasifier capacity, distinguishing characteristics, and important coal characteristics. (46) In January of 2000, CB&I completed construction of an E-GASTM demonstration facility, located at the Wabash River Generating Station in West Terre Haute, Indiana. It is still operational as a baseload unit. (39) The Wabash River unit has a coal handling capacity of 1,678 tonnes/day (1,850 tons/day) – on a moisture and ash-free (MAF) basis – for bituminous coal with a high sulfur content. The unit produces dry gas at a rate of 189,724 Nm3/hr (6.7 million scf/hr) with an energy content of about 1,950 GJ/hr (1,850 MMBtu/hr) (HHV). This size matches the CT, which is a GE 7FA. (46) The E-GasTM
gasifier has significant operating experience with bituminous coal at full commercial scale via the Wabash plant. (46) Compared to a single stage slurry-fed gasifier, the E-GasTM technology demonstrates superior efficiency and lower oxygen requirements. (46) Notable characteristics of the E-GasTM gasifier are the relatively short refractory life and the high waste heat recovery rate, resulting from the high operating temperature. The E-GasTM gasifier produces a syngas with a higher CH4 content than other single-stage slurry fed gasifiers, due to the use of quenching in the second stage. However, in CO2 capture cases the CH4 passes through the SGS reactors without change, and is also not separated by the AGR thus limiting the amount of carbon that can be captured. (46) Bituminous coals with low moisture content are desired for use with the E-GasTM gasifier as it benefits the slurry concentration and lowers the oxygen requirement. As with all slagging gasifiers, low concentrations of ash with low to moderate ash fusion temperatures are preferred. (46)

Cost and Performance Baseline for Fossil Energy Plants Volume 1b: Revision 2b
112
3.3.2 Process Description In this section the overall E-GasTM gasification process is described. The system description follows the BFD in Exhibit 3-42 and stream numbers reference the same exhibit. The tables in Exhibit 3-43 provide process data for the numbered streams in the BFD.
3.3.2.1 Coal Grinding and Slurry Preparation Coal receiving and handling is common to all cases and was covered in Section 3.1.1. The receiving and handling subsystem ends at the coal silo. Coal grinding and slurry preparation is similar to the GEE cases but repeated here for completeness.
Coal from the coal silo is fed onto a conveyor by vibratory feeders located below each silo. The conveyor feeds the coal to an inclined conveyor that delivers the coal to the rod mill feed hopper. The feed hopper provides a surge capacity of about two hours and contains two hopper outlets. Each hopper outlet discharges onto a weigh feeder, which in turn feeds a rod mill. Each rod mill is sized to process 55 percent of the coal feed requirements of the gasifier. The rod mill grinds the coal and wets it with treated slurry water transferred from the slurry water tank by the slurry water pumps. The coal slurry is discharged through a trommel screen into the rod mill discharge tank, and then the slurry is pumped to the slurry storage tanks. The dry solids concentration of the final slurry is 63 percent. The Polk Power Station operates at a slurry concentration of 62-68 percent using bituminous coal, and ConocoPhillips presented a paper showing the slurry concentration of Illinois No. 6 coal as 63 percent. (49)
The coal grinding system is equipped with a dust suppression system consisting of water sprays aided by a wetting agent. The degree of dust suppression required depends on local environmental regulations. All of the tanks are equipped with vertical agitators to keep the coal slurry solids suspended.
The equipment in the coal grinding and slurry preparation system is fabricated of materials appropriate for the abrasive environment present in the system. The tanks and agitators are rubber lined. The pumps are either rubber-lined or hardened metal to minimize erosion. Piping is fabricated of HDPE.
3.3.2.2 Gasification This plant utilizes two gasification trains to process a total of 5,007 tonnes/day (5,519 tpd) of Illinois No. 6 coal. Each of the 2 x 50 percent gasifiers operate at maximum capacity. The E-GasTM two-stage coal gasification technology features an oxygen-blown, entrained-flow, refractory-lined gasifier with continuous slag removal. About 78 percent of the total slurry feed is fed to the first (or bottom) stage of the gasifier. The air separation plant supplies 3,711 tonnes/day (4,090 tpd) of 95 percent oxygen to the gasifiers (stream 5) and the Claus plant (stream 3). All oxygen for gasification is fed to this stage of the gasifier at a pressure of 4.2 MPa (615 psia). This stage is best described as a horizontal cylinder with two horizontally opposed burners. The highly exothermic gasification/oxidation reactions take place rapidly at temperatures of 1,316 to 1,427°C (2,400 to 2,600°F). The hot raw gas from the first stage enters the second (top) stage, which is a vertical cylinder perpendicular to the first stage. The remaining 22 percent of coal slurry is injected into this hot raw gas. The endothermic gasification/devolatilization reaction in this stage reduces the gasifier exit temperature to about 1,038°C (1,900°F). Total slurry to both stages is shown as stream 7 in Exhibit 3-42.

Cost and Performance Baseline for Fossil Energy Plants Volume 1b: Revision 2b
113
Exhibit 3-42 Case B4A block flow diagram, E-Gas™ IGCC without CO2 capture
Source: NETL
GAS TURBINE
COMBUSTOR
SYNGAS SCRUBBER
GAS COOLINGBFW HEATING& KNOCKOUT
COSHYDROLYSIS
ELEVATEDPRESSURE
ASU
E-GASTM GASIFIER
SOURWATER
STRIPPER
MERCURYREMOVAL
MDEA CLAUSPLANT
SYNGASREHEAT
HRSG
2X STATE-OF-THE-ART F-CLASS
GAS TURBINES
1
AIR TO ASU
2 3
VENTGAS
5
7
GASIFIEROXIDANT
AS-RECEIVED COAL
SLAG
10
11 12
1718
14
16
4
21
22
TURBINE COOLING AIR
23 24
WATER RECYCLE TO SLURRY PREPARATION
FLUE GAS
STACK GAS
HYDROGENATION REACTOR AND GAS
COOLER
19
TAIL GAS RECYCLE TO MDEA
NOTE: TAIL GAS BOOST COMPRESSOR MODELED, BUT
NOT SHOWN
CLEAN GAS
NITROGEN DILUENT
AIR EXTRACTION
SULFUR PRODUCT
SYNGAS
NOTE: FLASH GAS BOOST COMPRESSOR MODELED,
BUT NOT SHOWN
NOTE: SYNGAS RECYCLE COMPRESSOR MODELED,
BUT NOT SHOWN
NOTE: ACID GAS BOOST COMPRESSOR MODELED,
BUT NOT SHOWN
TAIL GAS
SYNGAS COOLING,
CYCLONES & FILTERS
SYNGAS HUMIDIFICATION
15
RECYCLE TO GASIFIER
CLAUS PLANT
OXIDANT
CLAUS PLANT
OXIDANT
STEAM TURBINE
25Note: Block Flow Diagram is not intended to represent a complete material balance. Only major process streams and equipment are shown.
SLURRY MIXER
8
9
20
13
TAIL GAS RECYCLE FROM CLAUS PLANT
6 STEAM

Cost and Performance Baseline for Fossil Energy Plants Volume 1b: Revision 2b
114
Exhibit 3-43 Case B4A stream table, E-Gas™ IGCC without capture 1 2 3 4 5 6 7 8 9 10 11 12 13 14
V-L Mole Fraction Ar 0.0092 0.0241 0.0318 0.0023 0.0318 0.0000 0.0000 0.0000 0.0000 0.0078 0.0078 0.0096 0.0095 0.0098 CH4 0.0000 0.0000 0.0000 0.0000 0.0000 0.0000 0.0000 0.0000 0.0000 0.0465 0.0465 0.0575 0.0555 0.0576 CO 0.0000 0.0000 0.0000 0.0000 0.0000 0.0000 0.0000 0.0000 0.0000 0.3011 0.3011 0.3727 0.3597 0.3734 CO2 0.0003 0.0083 0.0000 0.0000 0.0000 0.0000 0.0000 0.0000 0.0000 0.1556 0.1559 0.1929 0.2137 0.1931 COS 0.0000 0.0000 0.0000 0.0000 0.0000 0.0000 0.0000 0.0000 0.0000 0.0003 0.0000 0.0000 0.0000 0.0000 H2 0.0000 0.0000 0.0000 0.0000 0.0000 0.0000 0.0000 0.0000 0.0000 0.2725 0.2725 0.3372 0.3299 0.3425 H2O 0.0099 0.2164 0.0000 0.0003 0.0000 1.0000 0.0000 0.9968 0.0000 0.1888 0.1885 0.0015 0.0015 0.0015 HCl 0.0000 0.0000 0.0000 0.0000 0.0000 0.0000 0.0000 0.0000 0.0000 0.0002 0.0002 0.0000 0.0000 0.0000 H2S 0.0000 0.0000 0.0000 0.0000 0.0000 0.0000 0.0000 0.0000 0.0000 0.0072 0.0075 0.0092 0.0090 0.0000 N2 0.7732 0.5456 0.0178 0.9919 0.0178 0.0000 0.0000 0.0000 0.0000 0.0157 0.0157 0.0194 0.0213 0.0221 NH3 0.0000 0.0000 0.0000 0.0000 0.0000 0.0000 0.0000 0.0032 0.0000 0.0045 0.0045 0.0000 0.0000 0.0000 O2 0.2074 0.2055 0.9504 0.0054 0.9504 0.0000 0.0000 0.0000 0.0000 0.0000 0.0000 0.0000 0.0000 0.0000 SO2 0.0000 0.0000 0.0000 0.0000 0.0000 0.0000 0.0000 0.0000 0.0000 0.0000 0.0000 0.0000 0.0000 0.0000 Total 1.0000 1.0000 1.0000 1.0000 1.0000 1.0000 0.0000 1.0000 0.0000 1.0000 1.0000 1.0000 1.0000 1.0000 V-L Flowrate (kgmole/hr) 18,975 915 111 17,428 4,694 3,766 0 4,758 0 21,815 21,815 17,626 18,275 17,601 V-L Flowrate (kg/hr) 547,573 24,798 3,567 489,025 151,055 67,847 0 85,706 0 459,698 459,698 384,238 408,328 380,348 Solids Flowrate (kg/hr) 0 0 0 0 0 0 208,633 0 21,295 0 0 0 0 0
Temperature (°C) 15 20 32 93 32 343 15 149 1,038 186 186 35 34 45 Pressure (MPa, abs) 0.10 0.11 0.86 2.65 0.86 5.10 0.10 5.79 4.24 4.07 4.00 3.83 3.79 3.76 Steam Table Enthalpy (kJ/kg) A 30.23 36.92 26.67 92.52 26.67 3,063.97 --- 567.36 --- 673.89 673.68 39.55 36.82 55.08 AspenPlus Enthalpy (kJ/kg)B -97.58 -2,404.24 4.13 63.38 4.13 -12,907.38 -2,116.95 -15,363.86 1,005.43 -6,602.13 -6,602.13 -5,592.59 -5,753.40 -5,625.00 Density (kg/m3) 1.2 1.6 11.0 24.4 11.0 20.1 --- 862.4 --- 22.7 22.3 33.0 33.7 31.0 V-L Molecular Weight 28.857 27.090 32.181 28.060 32.181 18.015 --- 18.012 --- 21.073 21.073 21.799 22.344 21.610
V-L Flowrate (lbmole/hr) 41,834 2,018 244 38,422 10,348 8,303 0 10,490 0 48,093 48,093 38,859 40,289 38,803 V-L Flowrate (lb/hr) 1,207,192 54,670 7,864 1,078,115 333,020 149,578 0 188,950 0 1,013,462 1,013,462 847,100 900,209 838,525 Solids Flowrate (lb/hr) 0 0 0 0 0 0 459,956 0 46,947 0 0 0 0 0
Temperature (°F) 59 69 90 199 90 650 59 300 1,900 367 367 95 94 112 Pressure (psia) 14.7 16.4 125.0 384.0 125.0 740.0 14.7 840.0 615.0 590.0 580.0 555.0 550.0 545.0 Steam Table Enthalpy (Btu/lb)A 13.0 15.9 11.5 39.8 11.5 1,317.3 --- 243.9 --- 289.7 289.6 17.0 15.8 23.7 AspenPlus Enthalpy (Btu/lb)B -42.0 -1,033.6 1.8 27.2 1.8 -5,549.2 -910.1 -6,605.3 432.3 -2,838.4 -2,838.4 -2,404.4 -2,473.5 -2,418.3 Density (lb/ft3) 0.076 0.098 0.687 1.521 0.687 1.257 --- 53.837 --- 1.416 1.391 2.061 2.105 1.938
ASteam table reference conditions are 32.02°F & 0.089 psia BAspen thermodynamic reference state is the component’s constituent elements in an ideal gas state at 25°C and 1 atm

Cost and Performance Baseline for Fossil Energy Plants Volume 1b: Revision 2b
115
Exhibit 3-43 Case B4A stream table, E-Gas™ IGCC without capture (continued) 15 16 17 18 19 20 21 22 23 24 25
V-L Mole Fraction Ar 0.0085 0.0085 0.0000 0.0000 0.0041 0.0055 0.0092 0.0092 0.0087 0.0087 0.0000 CH4 0.0500 0.0500 0.0002 0.0000 0.0001 0.0000 0.0000 0.0000 0.0000 0.0000 0.0000 CO 0.3241 0.3241 0.0010 0.0000 0.0848 0.0061 0.0000 0.0000 0.0000 0.0000 0.0000 CO2 0.1676 0.1676 0.7537 0.0000 0.4983 0.7790 0.0003 0.0003 0.0803 0.0803 0.0000 COS 0.0000 0.0000 0.0001 0.0000 0.0003 0.0000 0.0000 0.0000 0.0000 0.0000 0.0000 H2 0.2973 0.2973 0.0009 0.0000 0.0209 0.1311 0.0000 0.0000 0.0000 0.0000 0.0000 H2O 0.1333 0.1333 0.0000 0.0000 0.3350 0.0018 0.0099 0.0099 0.0860 0.0860 1.0000 HCl 0.0000 0.0000 0.0000 0.0000 0.0000 0.0000 0.0000 0.0000 0.0000 0.0000 0.0000 H2S 0.0000 0.0000 0.2443 0.0000 0.0014 0.0043 0.0000 0.0000 0.0000 0.0000 0.0000 N2 0.0192 0.0192 0.0000 0.0000 0.0537 0.0723 0.7732 0.7732 0.7250 0.7250 0.0000 NH3 0.0000 0.0000 0.0000 0.0000 0.0000 0.0000 0.0000 0.0000 0.0000 0.0000 0.0000 O2 0.0000 0.0000 0.0000 0.0000 0.0000 0.0000 0.2074 0.2074 0.1000 0.1000 0.0000 SO2 0.0000 0.0000 0.0000 0.0000 0.0013 0.0000 0.0000 0.0000 0.0000 0.0000 0.0000 Total 1.0000 1.0000 1.0000 0.0000 1.0000 1.0000 1.0000 1.0000 1.0000 1.0000 1.0000 V-L Flowrate (kgmole/hr) 20,276 20,276 674 0 873 649 110,253 4,410 137,247 137,247 40,181 V-L Flowrate (kg/hr) 428,547 428,547 27,980 0 28,108 24,090 3,181,557 127,262 3,971,867 3,971,867 723,870 Solids Flowrate (kg/hr) 0 0 0 5,215 0 0 0 0 0 0 0
Temperature (°C) 143 193 45 175 232 38 15 432 588 132 561 Pressure (MPa, abs) 3.21 3.17 3.76 0.41 0.41 5.51 0.10 1.62 0.10 0.10 12.51 Steam Table Enthalpy (kJ/kg) A 489.40 569.86 -0.67 --- 731.47 -6.63 30.23 463.79 783.86 272.30 3,500.61 AspenPlus Enthalpy (kJ/kg)B -6,348.13 -6,267.67 -7,288.11 140.10 -8,672.98 -8,318.28 -97.58 335.98 -1,186.76 -1,698.31 -12,469.70 Density (kg/m3) 19.7 17.3 73.5 5,285.4 3.1 96.3 1.2 7.9 0.4 0.9 35.2 V-L Molecular Weight 21.135 21.135 41.529 --- 32.209 37.141 28.857 28.857 28.940 28.940 18.015
V-L Flowrate (lbmole/hr) 44,702 44,702 1,485 0 1,924 1,430 243,066 9,723 302,577 302,577 88,584 V-L Flowrate (lb/hr) 944,784 944,784 61,685 0 61,967 53,109 7,014,133 280,565 8,756,467 8,756,467 1,595,860 Solids Flowrate (lb/hr) 0 0 0 11,497 0 0 0 0 0 0 0
Temperature (°F) 290 380 112 347 450 100 59 810 1,091 270 1,041 Pressure (psia) 465.0 460.0 545.0 59.3 58.9 799.5 14.7 234.9 15.2 15.2 1,814.7 Steam Table Enthalpy (Btu/lb)A 210.4 245.0 -0.3 --- 314.5 -2.8 13.0 199.4 337.0 117.1 1,505.0 AspenPlus Enthalpy (Btu/lb)B -2,729.2 -2,694.6 -3,133.3 60.2 -3,728.7 -3,576.2 -42.0 144.4 -510.2 -730.1 -5,361.0 Density (lb/ft3) 1.230 1.081 4.586 329.954 0.195 6.012 0.076 0.495 0.026 0.056 2.194
ASteam table reference conditions are 32.02°F & 0.089 psia BAspen thermodynamic reference state is the component’s constituent elements in an ideal gas state at 25°C and 1 atm

Cost and Performance Baseline for Fossil Energy Plants Volume 1b: Revision 2b
116
The syngas produced by the E-GasTM gasifier is higher in methane content than either the GEE or Shell gasifier. The two-stage design allows for improved cold gas efficiency (CGE) and lower oxygen consumption, but the quenched second stage allows some CH4 to remain. The syngas CH4 concentration exiting the gasifier in Case B4A is 4.3 vol% (compared to 0.10 vol% in Case B5A [GEE] and 0.001 vol% in Case B1A [Shell]). The relatively high CH4 concentration impacts carbon capture efficiency as discussed in Section 3.3.8.
3.3.2.3 Raw Gas Cooling/Particulate Removal
The raw syngas, less than 1,038°C (1,900°F), from the second stage of the gasifier is cooled to 316°C (600°F) in the waste heat recovery (SGC) unit, which consists of a fire-tube boiler and convective superheating and economizing sections. 554,830 kg/hr (1,223,171 lb/hr) of HP saturated steam is raised as a result of the raw gas cooling. Fire-tube boilers cost markedly less than comparable duty water-tube boilers. This is because of the large savings in high-grade steel associated with containing the hot HP syngas in relatively small tubes.
The coal ash is converted to molten slag, which flows down through a tap hole. The molten slag is quenched in water and removed through a proprietary continuous-pressure letdown/dewatering system (stream 9). Char is produced in the second gasifier stage and is captured and recycled to the hotter first stage to be gasified.
The cooled gas from the SGC is cleaned of remaining particulate via a cyclone collector followed by a ceramic candle filter. Recycled syngas is used as the pulse gas to clean the candle filters. The recovered fines are pneumatically returned to the first stage of the gasifier. The combination of recycled char and recycled particulate results in high overall carbon conversion (99.2 percent used in this report).
Following particulate removal, additional heat is removed from the syngas to raise saturated IP steam at 0.4 MPa (65 psia). In this manner the syngas is cooled to 232°C (450°F) prior to the syngas scrubber.
3.3.2.4 Syngas Scrubber/Sour Water Stripper Syngas exiting the second of the two low-temperature heat exchangers passes to a syngas scrubber where a water wash is used to remove chlorides, SO2, NH3, and particulate. The syngas exits the scrubber saturated at 169°C (337°F).
The sour water stripper removes NH3, SO2, and impurities from the scrubber and other waste streams. The stripper consists of a sour drum that accumulates sour water from the gas scrubber and condensate from SGCs. Sour water from the drum flows to the sour stripper, which consists of a packed column with a steam-heated reboiler. Sour gas is stripped from the liquid and sent to the SRU. Remaining water is sent to wastewater treatment.
3.3.2.5 COS Hydrolysis, Mercury Removal and Acid Gas Removal Syngas exiting the scrubber is reheated to 186°C (367°F) by using HP steam from the HRSG evaporator prior to entering a COS hydrolysis reactor (stream 10). About 99.5 percent of the COS is converted to CO2 and H2O (Section 3.1.5). The gas exiting the COS reactor (stream 11) passes through a series of heat exchangers and KO drums to lower the syngas temperature to 35°C (95°F) and to separate entrained water. The cooled syngas (stream 12) then passes through a carbon bed to remove approximately 97 percent of the Hg (Section 3.1.4).

Cost and Performance Baseline for Fossil Energy Plants Volume 1b: Revision 2b
117
Cool, particulate-free syngas (stream 13) enters the absorber unit at approximately 3.8 MPa (550 psia) and 34°C (94°F). In the absorber, H2S is preferentially removed from the fuel gas stream by contact with MDEA. The absorber column is operated at 44°C (112°F) by refrigerating the lean MDEA solvent. The lower temperature is required to achieve an outlet H2S concentration of less than 30 ppmv in the sweet syngas. The stripper acid gas stream (stream 17), consisting of 24 percent H2S and 75 percent CO2, is sent to the Claus unit. The acid gas is combined with the sour water stripper off gas and introduced into the Claus plant burner section.
3.3.2.6 Claus Unit Acid gas from the MDEA unit is preheated to 232°C (450°F). A portion of the acid gas along with all of the sour gas from the stripper and oxygen from the ASU are fed to the Claus furnace. In the furnace, H2S is catalytically oxidized to SO2 at a furnace temperature of 1,316°C (2,400°F), which must be maintained in order to thermally decompose all of the NH3 present in the sour gas stream.
Following the thermal stage and condensation of sulfur, two reheaters and two sulfur converters are used to obtain a per-pass H2S conversion of approximately 99.5 percent. The Claus Plant tail gas is hydrogenated and recycled back to the gasifier (stream 20). In the furnace waste heat boiler, 13,866 kg/hr (30,568 lb/hr) of 3.0 MPa (430 psia) steam is generated. This steam is used to satisfy all Claus process preheating and reheating requirements as well as to provide some steam to the medium-pressure steam header. The sulfur condensers produce 0.34 MPa (50 psig) steam for the LP steam header and IP steam at 2.9 MPa (415 psig).
A flow rate of 5,215 kg/hr (11,497 lb/hr) of elemental sulfur (stream 18) is recovered from the fuel gas stream. This value represents an overall sulfur recovery efficiency of 99.7 percent.
3.3.2.7 Power Block Clean syngas exiting the MDEA absorber (stream 14) is partially humidified (stream 15) because there is not sufficient nitrogen from the ASU to provide the level of dilution required to reach the target syngas heating value. The moisturized syngas stream is reheated (stream 16), further diluted with nitrogen from the ASU (stream 4) and enters the state-of-the-art 2008 F-class CT burner. The CT compressor provides combustion air to the burner and also 19 percent of the total ASU air requirement (stream 22). The exhaust gas exits the CT at 588°C (1,091°F) (stream 23) and enters the HRSG where additional heat is recovered until the flue gas exits the HRSG at 132°C (270°F) (stream 24) and is discharged through the plant stack. The steam raised in the HRSG is used to power an advanced, commercially available steam turbine using a 12.4 MPa/561°C/561°C (1,800 psig/1,041°F/1,041°F) steam cycle.
3.3.2.8 Air Separation Unit The elevated pressure ASU was described in Section 3.1.2. In Case B4A, the ASU is designed to produce a nominal output of 3,711 tonnes/day (4,091 tpd) of 95 mol% O2 for use in the gasifier (stream 5) and Claus plant (stream 3). The plant is designed with two production trains. The air compressor is powered by an electric motor. Approximately 11,736 tonnes/day (12,937 tpd) of nitrogen is also recovered, compressed, and used as dilution in the CT combustor (stream 4). About 4 percent of the CT air is used to supply approximately 19 percent of the ASU air requirements (stream 22) in the non-capture case.

Cost and Performance Baseline for Fossil Energy Plants Volume 1b: Revision 2b
118
3.3.2.9 Balance of Plant Balance of plant items were covered in Sections 3.1.9, 3.1.10, and 3.1.12.
3.3.3 Key System Assumptions System assumptions for cases B4A and B4B, E-GasTM IGCC with and without CO2 capture, are compiled in Exhibit 3-44.
3.3.3.1 Balance of Plant – Cases B4A and B4B The balance of plant assumptions are common to all cases and were presented previously in Exhibit 3-11.
3.3.4 Sparing Philosophy The sparing philosophy for cases B4A and B4B is provided below. Dual trains are used to accommodate the size of commercial CTs. There is no redundancy other than normal sparing of rotating equipment. The plant design consists of the following major subsystems:
• Two ASUs (2 x 50%) • Two trains of slurry preparation and slurry pumps (2 x 50%) • Two trains of gasification, including gasifier, SGC, cyclone, and candle filter (2 x 50%) • Two trains of syngas clean-up process (2 x 50%) • Two trains of refrigerated MDEA AGR in Case B4A and two-stage Selexol in Case B4B
(2 x 50%) • Two CO2 compression systems (2 x 50%) in Case B4B • One train of Claus-based sulfur recovery (1 x 100%) • Two CT/HRSG tandems (2 x 50%) • One steam turbine (1 x 100%)

Cost and Performance Baseline for Fossil Energy Plants Volume 1b: Revision 2b
119
Exhibit 3-44 E-GasTM IGCC plant study configuration matrix
Case B4A B4B
Gasifier Pressure, MPa (psia) 4.2 (615) 4.2 (615)
O2:Coal Ratio, kg O2/kg dry coal 0.81 0.88
Carbon Conversion, % 99.2 99.2
Syngas HHV at Gasifier Outlet, kJ/Nm3 (Btu/scf) 8,319 (223) 7,021 (189)
Steam Cycle, MPa/°C/°C (psig/°F/°F) 12.4/561/561 (1,800/1,041/1,041) 12.4/534/534 (1,800/994/994)
Condenser Pressure, mm Hg (in Hg) 51 (2.0) 51 (2.0)
CT 2x State-of-the-Art 2008 F-Class (232 MW output each)
2x State-of-the-Art 2008 F-Class (232 MW output each)
Gasifier Technology CB&I E-Gas™ CB&I E-Gas™
Oxidant 95 vol% Oxygen 95 vol% Oxygen
Coal Illinois No. 6 Illinois No. 6
Coal Slurry Solids Content, % 63 63
COS Hydrolysis Yes Occurs in SGS
SGS No Yes
H2S Separation Refrigerated MDEA Selexol 1st Stage
Sulfur Removal, % 99.7 99.9
Sulfur Recovery Claus Plant with Tail Gas Recycle to Gasifier/ Elemental Sulfur
Claus Plant with Tail Gas Recycle to Gasifier/ Elemental Sulfur
Particulate Control Cyclone, Candle Filter, Scrubber, and AGR Absorber
Cyclone, Candle Filter, Scrubber, and AGR Absorber
Mercury Control Carbon Bed Carbon Bed
NOx Control MNQC (LNB), N2 Dilution and Humidification
MNQC (LNB), N2 Dilution and Humidification
CO2 Separation N/A Selexol 2nd Stage
Overall Carbon Capture N/A 89.9%
CO2 Sequestration N/A Off-site Saline Formation
3.3.5 Case B4A - Performance Results The plant produces a net output of 625 MWe at a net plant efficiency of 39.7 percent (HHV basis).
Overall performance for the entire plant is summarized in Exhibit 3-45; Exhibit 3-46 provides a detailed breakdown of the auxiliary power requirements. The ASU accounts for approximately 76 percent of the total auxiliary load distributed between the main air compressor, oxygen compressor, nitrogen compressor, and ASU auxiliaries. The cooling water system, including the CWPs and cooling tower fan, accounts for approximately 5 percent of the auxiliary load, and the

Cost and Performance Baseline for Fossil Energy Plants Volume 1b: Revision 2b
120
BFW pumps account for an additional 3.9 percent. All other individual auxiliary loads are less than 3.5 percent of the total.
Exhibit 3-45 Case B4A plant performance summary
Performance Summary
Combustion Turbine Power, MWe 464
Sweet Gas Expander Power, MWe 0
Steam Turbine Power, MWe 274
Total Gross Power, MWe 738
Air Separation Unit Main Air Compressor, kWe 46,700
Oxygen Compressor, kWe 7,920
Nitrogen Compressors, kWe 29,910
CO₂ Compression, kWe 0
Acid Gas Removal, kWe 3,150
Balance of Plant, kWe 25,530
Total Auxiliaries, MWe 113
Net Power, MWe 625
HHV Net Plant Efficiency (%) 39.7%
HHV Net Plant Heat Rate, kJ/kWh (Btu/kWh) 9,058 (8,585)
HHV Cold Gas Efficiency, % 82.0%
HHV Combustion Turbine Efficiency, % 37.2%
LHV Net Plant Efficiency (%) 41.2%
LHV Net Plant Heat Rate, kJ/kWh (Btu/kWh) 8,737 (8,281)
LHV Cold Gas Efficiency, % 78.2%
LHV Combustion Turbine Efficiency, % 40.4%
Steam Turbine Cycle Efficiency, % 45.3%
Steam Turbine Heat Rate, kJ/kWh (Btu/kWh) 7,951 (7,536)
Condenser Duty, GJ/hr (MMBtu/hr) 1,415 (1,341)
As-Received Coal Feed, kg/hr (lb/hr) 208,633 (459,956)
HHV Thermal Input, kWt 1,572,575
LHV Thermal Input, kWt 1,516,768
Raw Water Withdrawal, (m3/min)/MWnet (gpm/MWnet) 0.027 (7.0)
Raw Water Consumption, (m3/min)/MWnet (gpm/MWnet) 0.021 (5.6)
O₂:Coal 0.684

Cost and Performance Baseline for Fossil Energy Plants Volume 1b: Revision 2b
121
Exhibit 3-46 Case B4A plant power summary
Power Summary Combustion Turbine Power, MWe 464 Sweet Gas Expander Power, MWe 0 Steam Turbine Power, MWe 274 Total Gross Power, MWe 738
Auxiliary Load Summary Coal Handling, kWe 460 Coal Milling, kWe 2,150 Sour Water Recycle Slurry Pump, kWe 180 Slag Handling, kWe 1,100 Air Separation Unit Auxiliaries, kWe 1,000 Air Separation Unit Main Air Compressor, kWe 46,700 Oxygen Compressor, kWe 7,920 Nitrogen Compressors, kWe 29,910 Feedwater Pumps, kWe 4,410 Quench Water Pump, kWe 0 Syngas Recycle Compressor, kWe 810 CO₂ Compression, kWe 0 Scrubber Pumps, kWe 320 Acid Gas Removal, kWe 3,150 Combustion Turbine Auxiliaries, kWe 1,000 Steam Turbine Auxiliaries, kWe 100 Condensate Pumps, kWe 240 Circulating Water Pumps, kWe 3,890 Ground Water Pumps, kWe 400 Cooling Tower Fans, kWe 2,010 Claus Plant/TGTU Auxiliaries, kWe 250 Claus Plant TG Recycle Compressor, kWe 1,610 Miscellaneous Balance of PlantA, kWe 3,000 Transformer Losses, kWe 2,600 Total Auxiliaries, MWe 113 Net Power, MWe 625
AIncludes plant control systems, lighting, HVAC, and miscellaneous low voltage loads
3.3.5.1 Environmental Performance The environmental targets for emissions of Hg, NOx, SO2, and PM were presented in Section 2.3. A summary of the plant air emissions for Case B4A is presented in Exhibit 3-47. All HCl is assumed to be removed and is, therefore, not reported.

Cost and Performance Baseline for Fossil Energy Plants Volume 1b: Revision 2b
122
Exhibit 3-47 Case B4A air emissions
kg/GJ (lb/MMBtu) Tonne/year (ton/year)A kg/MWh (lb/MWh)B
SO2 0.005 (0.012) 200 (220) 0.039 (0.085) NOx 0.026 (0.060) 1,017 (1,122) 0.197 (0.434) Particulates 0.003 (0.0071) 121 (133) 0.023 (0.052) Hg 1.77E-7 (4.13E-7) 0.007 (0.008) 1.36E-6 (3.00E-6) CO2 86 (199) 3,398,347 (3,746,036) 657 (1,448) CO2C - - 776 (1,711)
ACalculations based on an 80 percent capacity factor BEmissions are based on gross power except where otherwise noted CCO2 emissions based on net power instead of gross power
The low level of SO2 in the plant emissions is achieved by capturing the sulfur in the gas by the refrigerated MDEA AGR process. The AGR process removes 99.7 percent of the sulfur compounds in the fuel gas down to a level of less than 30 ppmv. This results in a concentration in the flue gas of less than 4 ppmv. The H2S-rich regeneration gas from the AGR system is fed to a Claus plant, producing elemental sulfur. The Claus plant tail gas is hydrogenated to convert all sulfur species to H2S and then recycled back to the gasifier, thereby eliminating the need for a tail gas treatment unit.
NOx emissions are limited by the use of nitrogen dilution (primarily) and humidification (to a lesser extent) to 15 ppmvd (as NO2 @ 15 percent O2). Ammonia in the syngas is removed with process condensate prior to the low-temperature AGR process and destroyed in the Claus plant burner. This helps lower NOx levels as well.
Particulate discharge to the atmosphere is limited to extremely low values by the use of a cyclone and a barrier filter in addition to the syngas scrubber and the gas washing effect of the AGR absorber. The particulate emissions represent filterable particulate only.
Approximately 97 percent of the mercury is captured from the syngas by dual activated carbon beds.
CO2 emissions represent the uncontrolled discharge from the process.
The carbon balance for the plant is shown in Exhibit 3-48. The carbon input to the plant consists of carbon in the air in addition to carbon in the coal. Carbon in the air is not neglected here since the Aspen model accounts for air components throughout. Carbon leaves the plant as unburned carbon in the slag and as CO2 in the stack gas and ASU vent gas.

Cost and Performance Baseline for Fossil Energy Plants Volume 1b: Revision 2b
123
Exhibit 3-48 Case B4A carbon balance
Carbon In Carbon Out kg/hr (lb/hr) kg/hr (lb/hr)
Coal 132,992 (293,198) Stack Gas 132,344 (291,768) Air (CO₂) 507 (1,118) CO₂ Product 0 (0)
ASU Vent 92 (202) Slag 1,064 (2,346)
Total 133,499 (294,316) Total 133,499 (294,316)
Exhibit 3-49 shows the sulfur balance for the plant. Sulfur input comes solely from the sulfur in the coal. Sulfur output includes the sulfur recovered in the Claus plant and sulfur emitted in the stack gas. Sulfur in the slag is considered to be negligible.
Exhibit 3-49 Case B4A sulfur balance
Sulfur In Sulfur Out kg/hr (lb/hr) kg/hr (lb/hr)
Coal 5,229 (11,528) Stack Gas 14 (31) CO₂ Product 0 (0) Elemental Sulfur 5,215 (11,497)
Total 5,229 (11,528) Total 5,229 (11,528)
Exhibit 3-50 shows the overall water balance for the plant. The water balance was explained in Case B1A [Shell], but is also presented here for completeness.
Water demand represents the total amount of water required for a particular process. Some water is recovered within the process, primarily as syngas condensate, and is re-used as internal recycle. The difference between demand and recycle is raw water withdrawal. Raw water withdrawal is defined as the water removed from the ground or diverted from a surface-water source for use in the plant and was assumed to be provided 50 percent by a POTW and 50 percent from groundwater. Raw water withdrawal can be represented by the water metered from a raw water source and used in the plant processes for any and all purposes, such as cooling tower makeup, BFW makeup, quench system makeup, and slag handling makeup. The difference between water withdrawal and process water discharge is defined as water consumption and can be represented by the portion of the raw water withdrawn that is evaporated, transpired, incorporated into products or otherwise not returned to the water source from which it was withdrawn. Water consumption represents the net impact of the plant process on the water source balance.

Cost and Performance Baseline for Fossil Energy Plants Volume 1b: Revision 2b
124
Exhibit 3-50 Case B4A water balance
Water Use Water Demand
Internal Recycle
Raw Water Withdrawal
Process Water
Discharge Raw Water
Consumption
m3/min (gpm)
m3/min (gpm)
m3/min (gpm) m3/min (gpm) m3/min (gpm)
Slag Handling 0.46 (122) 0.46 (122) – – – Slurry Water 1.43 (378) 0.99 (262) 0.44 (115) – 0.44 (115) Quench/Wash – – – – – Humidifier 0.84 (222) 0.84 (222) – – – SWS Blowdown – – – 0.01 (3.84) -0.01 (-3.84) Condenser Makeup 1.34 (354) – 1.34 (354) – 1.34 (354) BFW Makeup 0.21 (55) – 0.21 (55) – 0.21 (55) Gasifier Steam 1.13 (299) – 1.13 (299) – 1.13 (299) Shift Steam – – – – – CT Steam Dilution – – – – – Cooling Tower 15.16
(4,006) 0.35 (93) 14.81 (3,913) 3.41 (901) 11.40 (3,012)
BFW Blowdown – 0.21 (55) -0.21 (-55) – -0.21 (-55) SWS Blowdown – 0.15 (38.44) -0.15 (-
38.44) – -0.15 (-38.44)
Total 19.24 (5,082) 2.65 (700) 16.59 (4,382) 3.42 (905) 13.16 (3,477)
3.3.5.2 Heat and Mass Balance Diagrams Heat and mass balance diagrams are shown for the following subsystems in Exhibit 3-51 through Exhibit 3-53:
• Coal gasification and ASU • Syngas cleanup, sulfur recovery, and tail gas recycle • Combined cycle power generation, steam, and FW
An overall plant energy balance is provided in tabular form in Exhibit 3-54. The power out is the combined CT and steam turbine power prior to generator losses. The power at the generator terminals (shown in Exhibit 3-45) is calculated by multiplying the power out by a combined generator efficiency of 98.5 percent.

Cost and Performance Baseline for Fossil Energy Plants Volume 1b: Revision 2b
125
Exhibit 3-51 Case B4A coal gasification and ASU heat and mass balance schematic
Source: NETL
DOE/NETL
DUAL TRAIN IGCC PLANTCASE B4A
HEAT AND MATERIAL FLOW DIAGRAM
BITUMINOUS BASELINE STUDYCASE B4A
COP GASIFIERASU AND GASIFICATION
DWG. NO.BB-HMB-CS-B4A-PG-1
PLANT PERFORMANCE SUMMARY
LEGEND
PAGES1 OF 3
Ambient Air
Four Stage AirCompressor
ElevatedPressure
ASU
Four Stage N2Compressor
Four Stage O2Compressor
ASU Vent
1,207,192 W59 T15 P13 H
333,020 W90 T
125 P11 H
333,020 W223 T740 P38 H
To Claus Plant
7,864 W90 T
125 P11 H
54,670 W69 T16 P16 H
957,130 W90 T56 P14 H
133,997 W50 T
182 P3 H
5
1
3
2
Candle Filter
Slurry Mix Tank
E-Gas TM Gasifier
Milled Coal
Water
Slag
Cyclones
FireTubeBoiler459,956 W
59 T15 P
188,950 W300 T840 P244 H
46,947 W1,900 T
615 P
1,241,587 W600 T605 P422 H
9
648,906 W162 T840 P
1,241,587 W600 T605 P422 H
1,241,587 W1,834 T
615 P969 H
144,018 W159 T800 P37 H
1,241,587 W450 T600 P361 H
1,206,115 W100 T190 P18 H
7
8
Steam
149,578 W650 T740 P
1,309 H
Syngas RecycleCompressor 144,018 W
105 T600 P19 H
From LP Economizer
To LP Evaporator
1,061,557 W450 T600 P361 H
6
280,565 W220 T225 P51 H
280,565 W810 T235 P199 H
1,078,115 W389 T384 P88 H
Air From GT Compressor
N2 to GT Combustor
From HP Economizer 2
To HP Economizer 1
13,012 W376 T785 P84 H
Boost Compressor
22
1,078,115 W199 T384 P40 H
4
To Superheater
From HP Economizer 2
Post Particulate
Cooler
Raw Syngas
to Scrubber
Gross Plant Power: 738 MWeAuxiliary Load: 113 MWeNet Plant Power: 625 MWeNet Plant Efficiency, HHV: 39.7%Net Plant Heat Rate: 8,585 Btu/kWh
Air
Oxygen
Nitrogen
Coal/Char/Slurry/Slag
Synthesis Gas
Water
Steam
W Flowrate, lbm/hr T Temperature, °FP Absolute Pressure, PSIAH Enthalpy, Btu/lbmMWe Power, Megawatts Electrical
Flue Gas/CombustionProducts
Notes:1. Enthalpy reference point is natural state
at 32 °F and 0.08865 psia

Cost and Performance Baseline for Fossil Energy Plants Volume 1b: Revision 2b
126
Exhibit 3-52 Case B4A syngas cleanup heat and mass balance schematic
Source: NETL
Mercury Removal
KnockOut
DrumRaw Syngas
Humidified Fuel Gas
SourDrum
To Coal Slurry and Slag Quench
Claus Plant
Tail Gas
Furnace
CatalyticReactorBeds
Sulfur
Knock Out
From ASU
SyngasCoolers
SourStripper
SyngasScrubber
1,061,557 W450 T600 P361 H
1,013,462 W337 T595 P284 H
900,209 W94 T
550 P16 H
944,784 W290 T465 P210 H
61,685 W112 T545 P
0 H
944,784 W380 T460 P245 H
11,497 W 61,967 W450 T59 P
314 H
3,916 W191 T65 P
190 H
7,864 W90 T
125 P11 H
DOE/NETL
DUAL TRAIN IGCC PLANTCASE B4A
HEAT AND MATERIAL FLOW DIAGRAM
BITUMINOUS BASELINE STUDYCASE B4A
COP GASIFIERGAS CLEANUP SYSTEM
DWG. NO.BB-HMB-CS-B4A-PG-2
PLANT PERFORMANCE SUMMARY
LEGEND
PAGES2 OF 3
14
18
12
16
20
847,100 W95 T
555 P17 H
8,858 W119 T57 P45 H
3
53,109 W100 T800 P
-3 H
Humidification 15
838,525 W112 T545 P24 H
7,864 W450 T125 P92 H
COS Hydrolysis 1,013,462 W367 T580 P289 H
1,013,462 W367 T590 P289 H10 11
19
Clean Gas
Acid Gas
13
AGR- MDEA
17
Tail GasCompressor
HydrogenationAnd Tail Gas
Cooling
388,450 W150 T
1,205 P117 H
388,450 W337 T595 P326 H
From Fuel Gas Preheater
To Fuel Gas Preheater
249,929 W
From Gland Steam Condenser
To Syngas Cooling
113 T
53,768 W120 T57 P33 H
To Preheater and LP Evaporator
From Tail Gas Cooler and LP
Economizer
COS HydrolysisPreheater
From HP Economizer 2 To Superheater
To Water Treatment
Makeup Water
Reboiler
From Syngas Scrubber and HP
Economizer 2
To Syngas Scrubber and HP
Economizer 1
Claus OxygenPreheater
To Deaerator
From IP BFW
Fuel Gas Preheater
Gross Plant Power: 738 MWeAuxiliary Load: 113 MWeNet Plant Power: 625 MWeNet Plant Efficiency, HHV: 39.7%Net Plant Heat Rate: 8,585 Btu/kWh
Air
Oxygen
Nitrogen
Coal/Char/Slurry/Slag
Synthesis Gas
Sour Water
Acid Gas
Tailgas
Sour Gas
Sulfur
Hydrogen
Water
W Flowrate, lbm/hr T Temperature, °FP Absolute Pressure, PSIAH Enthalpy, Btu/lbmMWe Power, Megawatts Electrical
Steam
Notes:1. Enthalpy reference point is natural state
at 32 °F and 0.08865 psia

Cost and Performance Baseline for Fossil Energy Plants Volume 1b: Revision 2b
127
Exhibit 3-53 Case B4A combined cycle power generation heat and mass balance schematic
Source: NETL
DOE/NETL
DUAL TRAIN IGCC PLANTCASE B4A
HEAT AND MATERIAL FLOW DIAGRAM
BITUMINOUS BASELINE STUDYCASE B4A
COP GASIFIERPOWER BLOCK SYSTEM
DWG. NO.BB-HMB-CS-B4A-PG-3
PLANT PERFORMANCE SUMMARY
LEGEND
Air
Oxygen
Nitrogen
Coal/Char/Slurry/Slag
Synthesis Gas
PAGES3 OF 3
Sour Gas
Sour Water
Water
Steam
Flue Gas
W Flowrate, lbm/hr T Temperature, °FP Absolute Pressure, PSIAH Enthalpy, Btu/lbmMWe Power, Megawatts Electrical
HPTurbine
IPTurbine
Air Inlet Filter
Steam Seal Regulator
GlandSteam
Condenser
LP Turbine
Stack
ExpanderCompressor
Generator
GeneratorCondensate
Pumps
Steam Turbine
State-of-the-art 2008 F-Class Turbine
7,014,133 W59 T15 P13 H
1,602,981 W101 T
1 P69 H
8,756,467 W270 T15 P
117 H
944,784 W380 T460 P245 H
1,595,860 W1,041 T1,815 P1,497 H
9,989 W298 T65 P
1,171 H
1,414,148 W540 T65 P
1,294 H
1,400 W660 T65 P
1,353 H
1,400 W212 T15 P
180 H
21
25
16
24
Hot Well
Condenser 176,911 W59 T15 P27 H
8,829 W700 T501 P
1,350 H
9,522 W660 T65 P
1,353 H
1,313 W540 T65 P
1,294 H
Preheater DeaeratorHeater
HP Economizer
1
LP Economizer
HP Economizer
2
HP Evaporator
Superheater/ Reheater
From Syngas Cooler
Blowdown Flash
Deaerator
LP Evaporator
From Claus, Process Extractions, and 250 PSIA Header
LP Extraction Spray
LP Blowdown Hot Reheat
8,756,467 W1,091 T
15 P337 H
23
To WWT
Condensate to Tail Gas Cooling
Process Extraction
46,042 W276 T615 P244 H
1,872,987 W274 T45 P
242 H
24,616 W274 T79 P
242 H
9,365 W274 T79 P
242 H
1,623,815 W279 T
2,251 P247 H
306,059 W298 T65 P
266 H
235 T 305 T 585 T 636 T
117,894 W351 T
2,251 P319 H
117,894 W585 T
2,001 P585 H
27,956 W585 T
2,001 P585 H
1,223,167 W585 T
2,001 P585 H
636 T
215,192 W298 T65 P
1,171 H
1,437,747 W701 T501 P
1,350 H
22280,565 W
810 T235 P199 H
195 T
Process Extraction14,000 W
540 T65 P
1,294 H
1,078,115 W385 T389 P87 H
Steam to Gasifier149,578 W
690 T745 P
1,328 H
LP Extraction Spray #2
19,510 W241 T825 P209 H
Water Makeup
1,000 W1,041 T1,815 P1,497 H
1,000 W212 T15 P
180 H
781 W1,041 T1,815 P1,497 H 30,828 W
500 T250 P
1,255 H
IP Extraction Steam to 250 PSIA Header
LP Extraction Spray #1
1,602,981 W103 T120 P71 H
274 T
To Post Particulate
and Syngas Coolers
From Post Particulate
and Syngas Coolers
From ASU and Fuel Gas Preheater
To ASU and Fuel Gas Preheater
To Fire Tube Boiler and COS Preheater
From Fire Tube Boiler and COS Preheater
1,041 T
To Claus
Nitrogen Diluent
Fuel Gas
Air Extraction
Ambient Air
HP Pump
LP Pump
IP Pump
Gross Plant Power: 738 MWeAuxiliary Load: 113 MWeNet Plant Power: 625 MWeNet Plant Efficiency, HHV: 39.7%Net Plant Heat Rate: 8,585 Btu/kWh
Notes:1. Enthalpy reference point is natural state
at 32 °F and 0.08865 psia

Cost and Performance Baseline for Fossil Energy Plants Volume 1b: Revision 2b
128
This page intentionally left blank

Cost and Performance Baseline for Fossil Energy Plants Volume 1b: Revision 2b
129
Exhibit 3-54 Case B4A overall energy balance (0°C [32°F] reference)
HHV Sensible + Latent Power Total
Heat In (GJ/hr)
Coal 5,661 (5,366)
4.7 (4.5) – 5,666 (5,370)
Air – 112.7 (106.8) – 112.7 (106.8)
Raw Water Makeup – 62.4 (59.1) – 62.4 (59.1) Auxiliary Power – – 408 (386) 408 (386)
TOTAL 5,661 (5,366)
179.8 (170.4) 408 (386) 6,249 (5,923)
Heat Out (GJ/hr) ASU Vent – 0.9 (0.9) – 0.9 (0.9)
Slag 34.9 (33.1) 23.9 (22.7) – 58.8 (55.7)
Stack Gas – 1,082 (1,025) – 1,082 (1,025)
Sulfur 48.3 (45.8) 0.6 (0.6) – 48.9 (46.4) Motor Losses and Design
Allowances – – 52.3 (49.6) 52.3 (49.6)
Condenser – 1,415 (1,341) – 1,415 (1,341)
Non-Condenser Cooling Tower Loads
– 445 (421) – 445 (421)
CO₂ – – – – Blowdown – 32.2 (30.5) – 32.2 (30.5)
CO₂ Capture Losses – – – –
Ambient LossesA – 157.4 (149.2) – 157.4 (149.2)
Power – – 2,658 (2,519)
2,658 (2,519)
TOTAL 83.2 (78.9) 3,157 (2,992) 2,710 (2,568)
5,950 (5,639)
Unaccounted EnergyB – 299 (283) – 299 (283) AAmbient losses include all losses to the environment through radiation, convection, etc. Sources of these losses include the combustor, reheater, superheater, and transformers. BBy difference
3.3.6 Case B4A - Major Equipment List Major equipment items for the E-GasTM gasifier with no CO2 capture are shown in the following tables. The accounts used in the equipment list correspond to the account numbers used in the cost estimates in Section 3.3.7. In general, the design conditions include a 10 percent contingency for flows and heat duties, and a 21 percent contingency for heads on pumps and fans.

Cost and Performance Baseline for Fossil Energy Plants Volume 1b: Revision 2b
130
Case B4A – Account 1: Coal Handling Equipment
No. Description Type Design Condition Operating Qty. Spares
1 Bottom Trestle Dumper and Receiving Hoppers N/A 181 tonne (200 ton) 2 0
2 Feeder Belt 570 tonne/hr (630 tph) 2 0 3 Conveyor No. 1 Belt 1,130 tonne/hr (1,250 tph) 1 0 4 Conveyor No. 2 Belt 1,130 tonne/hr (1,250 tph) 1 0 5 Stacker/Reclaimer Traveling, linear 1,130 tonne/hr (1,250 tph) 1 0 6 Reclaim Hopper N/A 40 tonne (50 ton) 2 1 7 Feeder Vibratory 170 tonne/hr (190 tph) 2 1 8 Conveyor No. 3 Belt w/ tripper 340 tonne/hr (380 tph) 1 0 9 Coal Surge Bin w/ Vent Filter Dual outlet 170 tonne (190 ton) 2 0
10 Crusher Impactor reduction 8 cm x 0 - 3 cm x 0 (3" x 0 - 1-1/4" x 0) 2 0
11 Conveyor No. 4 Belt w/ tripper 340 tonne/hr (380 tph) 1 0 12 Conveyor No. 5 Belt w/ tripper 340 tonne/hr (380 tph) 1 0
13 Coal Silo w/ Vent Filter and Slide Gates Field erected 760 tonne (840 ton) 3 0
Case B4A – Account 2: Coal Preparation and Feed Equipment
No. Description Type Design Condition Operating Qty. Spares
1 Feeder Vibratory 80 tonne/h (80 tph) 3 0 2 Conveyor No. 6 Belt w/ tripper 230 tonne/h (250 tph) 1 0 3 Rod Mill Feed Hopper Dual Outlet 460 tonne (510 ton) 1 0 4 Weigh Feeder Belt 110 tonne/h (130 tph) 2 0 5 Rod Mill Rotary 110 tonne/h (130 tph) 2 0
6 Slurry Water Storage Tank with Agitator Field erected 283,240 liters (74,820 gal) 2 0
7 Slurry Water Pumps Centrifugal 790 lpm (210 gpm) 2 1 8 Trommel Screen Coarse 160 tonne/h (180 tph) 2 0
9 Rod Mill Discharge Tank with Agitator Field erected 370,530 liters (97,880 gal) 2 0
10 Rod Mill Product Pumps Centrifugal 3,100 lpm (800 gpm) 2 2
11 Slurry Storage Tank with Agitator Field erected 1,111,600 liters (293,600
gal) 2 0
12 Slurry Recycle Pumps Centrifugal 6,200 lpm (1,600 gpm) 2 2
13 Slurry Product Pumps Positive displacement 3,100 lpm (800 gpm) 2 2
Case B4A – Account 3: Feedwater and Miscellaneous Systems and Equipment Equipment
No. Description Type Design Condition Operating Qty. Spares
1 Demineralized Water Storage Tank
Vertical, cylindrical, outdoor 1,083,000 liters (286,000 gal) 2 0
2 Condensate Pumps Vertical canned 6,710 lpm @ 90 m H₂O (1,770 gpm @ 300 ft H₂O) 2 1
3 Deaerator (integral w/ HRSG) Horizontal spray type 479,000 kg/hr (1,055,000
lb/hr) 2 0
4 Intermediate-Pressure Feedwater Pump
Horizontal centrifugal, single stage
8,100 lpm @ 30 m H₂O (2,140 gpm @ 90 ft H₂O) 2 1
5 High-Pressure Feedwater Pump No. 1
Barrel type, multi-stage, centrifugal
HP water: 7,020 lpm @ 1,800 m H₂O
(1,860 gpm @ 6,100 ft H₂O) 2 1
6 High-Pressure Feedwater Pump No. 2
Barrel type, multi-stage, centrifugal
IP water: 510 lpm @ 220 m H₂O (130 gpm @ 730 ft H₂O) 2 1
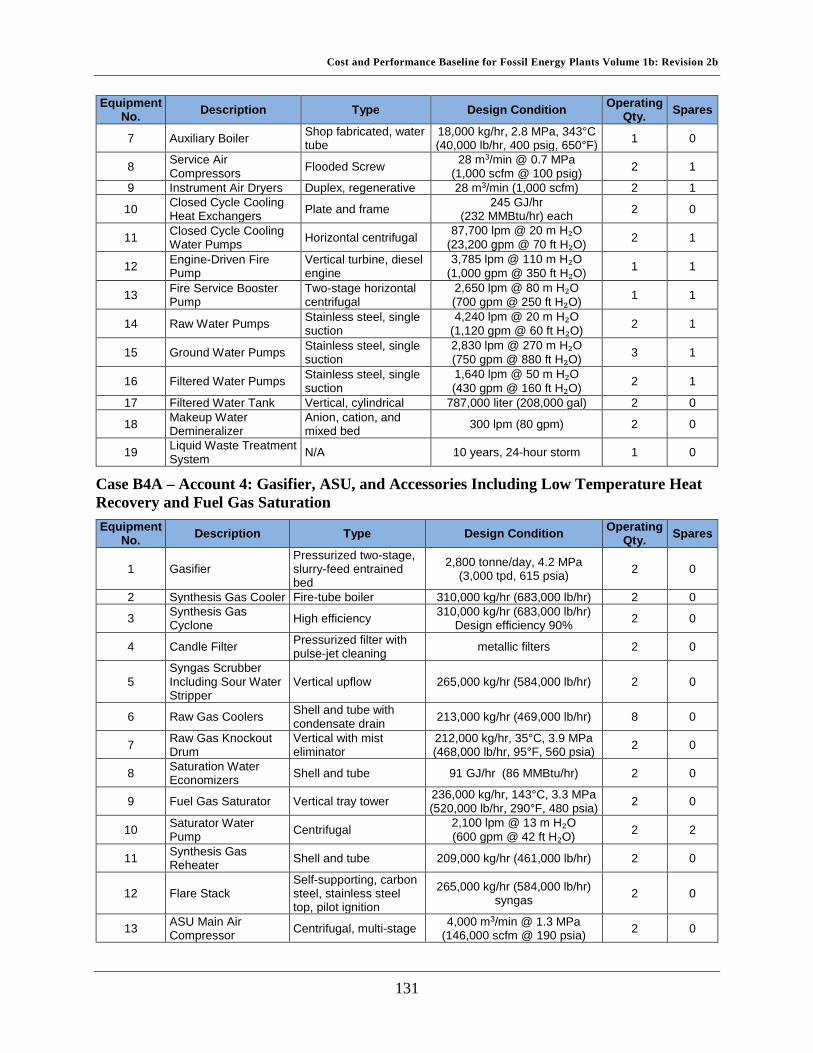
Cost and Performance Baseline for Fossil Energy Plants Volume 1b: Revision 2b
131
Equipment No. Description Type Design Condition Operating
Qty. Spares
7 Auxiliary Boiler Shop fabricated, water tube
18,000 kg/hr, 2.8 MPa, 343°C (40,000 lb/hr, 400 psig, 650°F) 1 0
8 Service Air Compressors Flooded Screw 28 m3/min @ 0.7 MPa
(1,000 scfm @ 100 psig) 2 1
9 Instrument Air Dryers Duplex, regenerative 28 m3/min (1,000 scfm) 2 1
10 Closed Cycle Cooling Heat Exchangers Plate and frame 245 GJ/hr
(232 MMBtu/hr) each 2 0
11 Closed Cycle Cooling Water Pumps Horizontal centrifugal 87,700 lpm @ 20 m H₂O
(23,200 gpm @ 70 ft H₂O) 2 1
12 Engine-Driven Fire Pump
Vertical turbine, diesel engine
3,785 lpm @ 110 m H₂O (1,000 gpm @ 350 ft H₂O) 1 1
13 Fire Service Booster Pump
Two-stage horizontal centrifugal
2,650 lpm @ 80 m H₂O (700 gpm @ 250 ft H₂O) 1 1
14 Raw Water Pumps Stainless steel, single suction
4,240 lpm @ 20 m H₂O (1,120 gpm @ 60 ft H₂O) 2 1
15 Ground Water Pumps Stainless steel, single suction
2,830 lpm @ 270 m H₂O (750 gpm @ 880 ft H₂O) 3 1
16 Filtered Water Pumps Stainless steel, single suction
1,640 lpm @ 50 m H₂O (430 gpm @ 160 ft H₂O) 2 1
17 Filtered Water Tank Vertical, cylindrical 787,000 liter (208,000 gal) 2 0
18 Makeup Water Demineralizer
Anion, cation, and mixed bed 300 lpm (80 gpm) 2 0
19 Liquid Waste Treatment System N/A 10 years, 24-hour storm 1 0
Case B4A – Account 4: Gasifier, ASU, and Accessories Including Low Temperature Heat Recovery and Fuel Gas Saturation Equipment
No. Description Type Design Condition Operating Qty. Spares
1 Gasifier Pressurized two-stage, slurry-feed entrained bed
2,800 tonne/day, 4.2 MPa (3,000 tpd, 615 psia) 2 0
2 Synthesis Gas Cooler Fire-tube boiler 310,000 kg/hr (683,000 lb/hr) 2 0
3 Synthesis Gas Cyclone High efficiency 310,000 kg/hr (683,000 lb/hr)
Design efficiency 90% 2 0
4 Candle Filter Pressurized filter with pulse-jet cleaning metallic filters 2 0
5 Syngas Scrubber Including Sour Water Stripper
Vertical upflow 265,000 kg/hr (584,000 lb/hr) 2 0
6 Raw Gas Coolers Shell and tube with condensate drain 213,000 kg/hr (469,000 lb/hr) 8 0
7 Raw Gas Knockout Drum
Vertical with mist eliminator
212,000 kg/hr, 35°C, 3.9 MPa (468,000 lb/hr, 95°F, 560 psia) 2 0
8 Saturation Water Economizers Shell and tube 91 GJ/hr (86 MMBtu/hr) 2 0
9 Fuel Gas Saturator Vertical tray tower 236,000 kg/hr, 143°C, 3.3 MPa (520,000 lb/hr, 290°F, 480 psia) 2 0
10 Saturator Water Pump Centrifugal 2,100 lpm @ 13 m H₂O
(600 gpm @ 42 ft H₂O) 2 2
11 Synthesis Gas Reheater Shell and tube 209,000 kg/hr (461,000 lb/hr) 2 0
12 Flare Stack Self-supporting, carbon steel, stainless steel top, pilot ignition
265,000 kg/hr (584,000 lb/hr) syngas 2 0
13 ASU Main Air Compressor Centrifugal, multi-stage 4,000 m3/min @ 1.3 MPa
(146,000 scfm @ 190 psia) 2 0

Cost and Performance Baseline for Fossil Energy Plants Volume 1b: Revision 2b
132
Equipment No. Description Type Design Condition Operating
Qty. Spares
14 Cold Box Vendor design 2,000 tonne/day (2,200 tpd) of 95% purity oxygen 2 0
15 Oxygen Compressor Centrifugal, multi-stage 1,000 m3/min (36,000 scfm) Suction - 1.0 MPa (130 psia)
Discharge - 5.1 MPa (740 psia) 2 0
16 Primary Nitrogen Compressor Centrifugal, multi-stage
3,000 m3/min (119,000 scfm) Suction - 0.4 MPa (60 psia)
Discharge - 2.7 MPa (390 psia) 2 0
17 Secondary Nitrogen Compressor
Centrifugal, single-stage
470 m3/min (17,000 scfm) Suction - 1.3 MPa (180 psia)
Discharge - 2.7 MPa (390 psia) 2 0
18 Transport Nitrogen Boost Compressor
Centrifugal, single-stage
50 m3/min (2,000 scfm) Suction - 2.6 MPa (380 psia)
Discharge - 5.4 MPa (790 psia) 2 0
19 Extraction Air Heat Exchanger
Gas-to-gas, vendor design
70,000 kg/hr, 432°C, 1.6 MPa (154,000 lb/hr, 810°F, 235 psia) 2 0
Case B4A – Account 5: Syngas Cleanup Equipment
No. Description Type Design Condition Operating Qty. Spares
1 Mercury Adsorber 1 Sulfated carbon bed 211,000 kg/hr (466,000 lb/hr), 35°C (95°F), 3.8 MPa (555 psia) 2 0
2 Mercury Adsorber 2 Sulfated carbon bed 211,000 kg/hr (466,000 lb/hr), 35°C (95°F), 3.8 MPa (550 psia) 2 0
3 Sulfur Plant Claus type 138 tonne/day (152 tpd) 1 0
4 COS Hydrolysis Reactor Fixed bed, catalytic 253,000 kg/hr (557,000 lb/hr),
188°C (370°F), 4.1 MPa (590 psia) 2 0
5 Acid Gas Removal Plant MDEA 225,000 kg/hr (495,000 lb/hr),
34°C (94°F), 3.8 MPa (550 psia) 2 0
6 Hydrogenation Reactor Fixed bed, catalytic
31,000 kg/hr (68,000 lb/hr), 232°C (450°F), 0.4 MPa (58.9
psia) 1 0
7 Tail Gas Recycle Compressor Centrifugal 26,000 kg/hr (58,000 lb/hr) each 1 0
Case B4A – Account 6: Combustion Turbine and Auxiliaries Equipment
No. Description Type Design Condition Operating Qty. Spares
1 Combustion Turbine State-of-the-art 2008 F-class 230 MW 2 0
2 Combustion Turbine Generator TEWAC 260 MVA @ 0.9 p.f., 24 kV, 60 Hz,
3-phase 2 0
Case B4A – Account 7: HRSG, Ducting, and Stack Equipment
No. Description Type Design Condition Operating Qty. Spares
1 Stack CS plate, type 409SS liner
76 m (250 ft) high x 8.4 m (28 ft) diameter 1 0
2 Heat Recovery Steam Generator
Drum, multi-pressure with economizer section and integral deaerator
Main steam - 398,129 kg/hr, 12.4 MPa/561°C
(877,723 lb/hr, 1,800 psig/1,041°F) 2 0

Cost and Performance Baseline for Fossil Energy Plants Volume 1b: Revision 2b
133
Case B4A – Account 8: Steam Turbine Generator and Auxiliaries Equipment
No. Description Type Design Condition Operating Qty. Spares
1 Steam Turbine
Commercially available advanced steam turbine
289 MW 12.4 MPa/561°C/561°C(1,800psig/
1,041°F/1,041°F) 1 0
2 Steam Turbine Generator
Hydrogen cooled, static excitation
320 MVA @ 0.9 p.f., 24 kV, 60 Hz, 3-phase 1 0
3 Surface Condenser
Single pass, divided waterbox including vacuum pumps
1,560GJ/hr (1,480 MMBtu/hr), Inlet water temperature 16°C
(60°F), Water temperature rise 11°C (20°F)
1 0
4 Steam Bypass One per HRSG 50% steam flow @ design steam
conditions 2 0
Case B4A – Account 9: Cooling Water System Equipment
No. Description Type Design Condition Operating Qty. Spares
1 Circulating Water Pumps Vertical, wet pit 391,000 lpm @ 30 m
(103,000 gpm @ 100 ft) 2 1
2 Cooling Tower Evaporative, mechanical draft, multi-cell
11°C (51.5°F) wet bulb / 16°C (60°F) CWT / 27°C (80°F) HWT /
2,180 GJ/hr (2,060 MMBtu/hr) heat duty
1 0
Case B4A – Account 10: Slag Recovery and Handling Equipment
No. Description Type Design Condition Operating Qty. Spares
1 Slag Quench Tank Water bath 223,000 liters (59,000 gal) 2 0 2 Slag Crusher Roll 12 tonne/hr (13 tph) 2 0 3 Slag Depressurizer Proprietary 12 tonne/hr (13 tph) 2 0 4 Slag Receiving Tank Horizontal, weir 134,000 liters (36,000 gal) 2 0 5 Black Water Overflow Tank Shop fabricated 61,000 liters (16,000 gal) 2 0 6 Slag Conveyor Drag chain 12 tonne/hr (13 tph) 2 0 7 Slag Separation Screen Vibrating 12 tonne/hr (13 tph) 2 0 8 Coarse Slag Conveyor Belt/bucket 12 tonne/hr (13 tph) 2 0 9 Fine Ash Settling Tank Vertical, gravity 191,000 liters (50,000 gal) 2 0
10 Fine Ash Recycle Pumps Horizontal centrifugal 50 lpm @ 14 m H₂O (10 gpm @ 46 ft H₂O) 2 2
11 Grey Water Storage Tank Field erected 61,000 liters (16,000 gal) 2 0
12 Grey Water Pumps Centrifugal 220 lpm @ 430 m H₂O (60 gpm @ 1,420 ft H₂O) 2 2
13 Slag Storage Bin Vertical, field erected 800 tonne (900 tons) 2 0 14 Unloading Equipment Telescoping chute 100 tonne/hr (110 tph) 1 0

Cost and Performance Baseline for Fossil Energy Plants Volume 1b: Revision 2b
134
Case B4A – Account 11: Accessory Electric Plant Equipment
No. Description Type Design Condition Operating Qty. Spares
1 CTG Transformer Oil-filled 24 kV/345 kV, 260 MVA, 3-ph, 60 Hz 2 0
2 STG Transformer Oil-filled 24 kV/345 kV, 290 MVA, 3-ph, 60 Hz 1 0
3 High Voltage Auxiliary Transformer Oil-filled 345 kV/13.8 kV, 47
MVA, 3-ph, 60 Hz 2 0
4 Medium Voltage Transformer Oil-filled 24 kV/4.16 kV, 29 MVA, 3-ph, 60 Hz 1 1
5 Low Voltage Transformer Dry ventilated 4.16 kV/480 V, 4 MVA, 3-ph, 60 Hz 1 1
6 CTG Isolated Phase Bus Duct and Tap Bus
Aluminum, self-cooled 24 kV, 3-ph, 60 Hz 2 0
7 STG Isolated Phase Bus Duct and Tap Bus
Aluminum, self-cooled 24 kV, 3-ph, 60 Hz 1 0
8 Medium Voltage Switchgear Metal clad 4.16 kV, 3-ph, 60 Hz 1 1 9 Low Voltage Switchgear Metal enclosed 480 V, 3-ph, 60 Hz 1 1
10 Emergency Diesel Generator Sized for emergency shutdown
750 kW, 480 V, 3-ph, 60 Hz 1 0
Case B4A – Account 12: Instrumentation and Control Equipment
No. Description Type Design Condition Operating Qty. Spares
1 DCS - Main Control
Monitor/keyboard; Operator printer (laser color); Engineering printer (laser B&W)
Operator stations/printers and engineering stations/printers
1 0
2 DCS - Data Highway Fiber optic Fully redundant, 25% spare 1 0
3.3.7 Case B4A - Costs Estimating Results The cost estimating methodology was described previously in Section 2.6. Exhibit 3-55 shows a detailed breakdown of the capital costs; Exhibit 3-56 shows the owner’s costs, TOC, and TASC; Exhibit 3-57 shows the initial and annual O&M costs; and Exhibit 3-58 shows the COE breakdown.
The estimated TPC of the E-GasTM gasifier with no CO2 capture is $2,372/kW. Process contingency represents 2.6 percent of the TPC, and project contingency is 13.6 percent. The COE is $99.8/MWh.
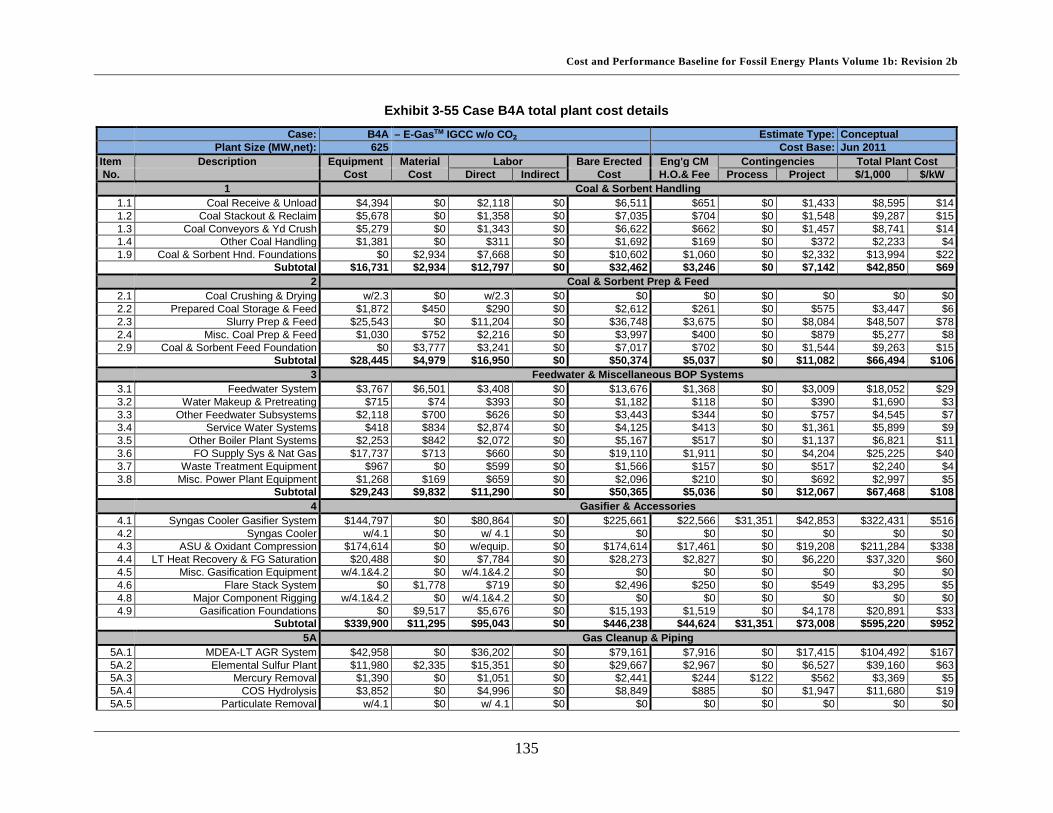
Cost and Performance Baseline for Fossil Energy Plants Volume 1b: Revision 2b
135
Exhibit 3-55 Case B4A total plant cost details Case: B4A – E-GasTM IGCC w/o CO₂ Estimate Type: Conceptual
Plant Size (MW,net): 625 Cost Base: Jun 2011 Item Description Equipment Material Labor Bare Erected Eng'g CM Contingencies Total Plant Cost No. Cost Cost Direct Indirect Cost H.O.& Fee Process Project $/1,000 $/kW
1 Coal & Sorbent Handling 1.1 Coal Receive & Unload $4,394 $0 $2,118 $0 $6,511 $651 $0 $1,433 $8,595 $14 1.2 Coal Stackout & Reclaim $5,678 $0 $1,358 $0 $7,035 $704 $0 $1,548 $9,287 $15 1.3 Coal Conveyors & Yd Crush $5,279 $0 $1,343 $0 $6,622 $662 $0 $1,457 $8,741 $14 1.4 Other Coal Handling $1,381 $0 $311 $0 $1,692 $169 $0 $372 $2,233 $4 1.9 Coal & Sorbent Hnd. Foundations $0 $2,934 $7,668 $0 $10,602 $1,060 $0 $2,332 $13,994 $22
Subtotal $16,731 $2,934 $12,797 $0 $32,462 $3,246 $0 $7,142 $42,850 $69 2 Coal & Sorbent Prep & Feed
2.1 Coal Crushing & Drying w/2.3 $0 w/2.3 $0 $0 $0 $0 $0 $0 $0 2.2 Prepared Coal Storage & Feed $1,872 $450 $290 $0 $2,612 $261 $0 $575 $3,447 $6 2.3 Slurry Prep & Feed $25,543 $0 $11,204 $0 $36,748 $3,675 $0 $8,084 $48,507 $78 2.4 Misc. Coal Prep & Feed $1,030 $752 $2,216 $0 $3,997 $400 $0 $879 $5,277 $8 2.9 Coal & Sorbent Feed Foundation $0 $3,777 $3,241 $0 $7,017 $702 $0 $1,544 $9,263 $15
Subtotal $28,445 $4,979 $16,950 $0 $50,374 $5,037 $0 $11,082 $66,494 $106 3 Feedwater & Miscellaneous BOP Systems
3.1 Feedwater System $3,767 $6,501 $3,408 $0 $13,676 $1,368 $0 $3,009 $18,052 $29 3.2 Water Makeup & Pretreating $715 $74 $393 $0 $1,182 $118 $0 $390 $1,690 $3 3.3 Other Feedwater Subsystems $2,118 $700 $626 $0 $3,443 $344 $0 $757 $4,545 $7 3.4 Service Water Systems $418 $834 $2,874 $0 $4,125 $413 $0 $1,361 $5,899 $9 3.5 Other Boiler Plant Systems $2,253 $842 $2,072 $0 $5,167 $517 $0 $1,137 $6,821 $11 3.6 FO Supply Sys & Nat Gas $17,737 $713 $660 $0 $19,110 $1,911 $0 $4,204 $25,225 $40 3.7 Waste Treatment Equipment $967 $0 $599 $0 $1,566 $157 $0 $517 $2,240 $4 3.8 Misc. Power Plant Equipment $1,268 $169 $659 $0 $2,096 $210 $0 $692 $2,997 $5
Subtotal $29,243 $9,832 $11,290 $0 $50,365 $5,036 $0 $12,067 $67,468 $108 4 Gasifier & Accessories
4.1 Syngas Cooler Gasifier System $144,797 $0 $80,864 $0 $225,661 $22,566 $31,351 $42,853 $322,431 $516 4.2 Syngas Cooler w/4.1 $0 w/ 4.1 $0 $0 $0 $0 $0 $0 $0 4.3 ASU & Oxidant Compression $174,614 $0 w/equip. $0 $174,614 $17,461 $0 $19,208 $211,284 $338 4.4 LT Heat Recovery & FG Saturation $20,488 $0 $7,784 $0 $28,273 $2,827 $0 $6,220 $37,320 $60 4.5 Misc. Gasification Equipment w/4.1&4.2 $0 w/4.1&4.2 $0 $0 $0 $0 $0 $0 $0 4.6 Flare Stack System $0 $1,778 $719 $0 $2,496 $250 $0 $549 $3,295 $5 4.8 Major Component Rigging w/4.1&4.2 $0 w/4.1&4.2 $0 $0 $0 $0 $0 $0 $0 4.9 Gasification Foundations $0 $9,517 $5,676 $0 $15,193 $1,519 $0 $4,178 $20,891 $33
Subtotal $339,900 $11,295 $95,043 $0 $446,238 $44,624 $31,351 $73,008 $595,220 $952 5A Gas Cleanup & Piping
5A.1 MDEA-LT AGR System $42,958 $0 $36,202 $0 $79,161 $7,916 $0 $17,415 $104,492 $167 5A.2 Elemental Sulfur Plant $11,980 $2,335 $15,351 $0 $29,667 $2,967 $0 $6,527 $39,160 $63 5A.3 Mercury Removal $1,390 $0 $1,051 $0 $2,441 $244 $122 $562 $3,369 $5 5A.4 COS Hydrolysis $3,852 $0 $4,996 $0 $8,849 $885 $0 $1,947 $11,680 $19 5A.5 Particulate Removal w/4.1 $0 w/ 4.1 $0 $0 $0 $0 $0 $0 $0

Cost and Performance Baseline for Fossil Energy Plants Volume 1b: Revision 2b
136
Case: B4A – E-GasTM IGCC w/o CO₂ Estimate Type: Conceptual Plant Size (MW,net): 625 Cost Base: Jun 2011
Item Description Equipment Material Labor Bare Erected Eng'g CM Contingencies Total Plant Cost No. Cost Cost Direct Indirect Cost H.O.& Fee Process Project $/1,000 $/kW
5A.6 Blowback Gas Systems $601 $337 $188 $0 $1,127 $113 $0 $248 $1,487 $2 5A.7 Fuel Gas Piping $0 $984 $644 $0 $1,628 $163 $0 $358 $2,149 $3 5A.9 HGCU Foundations $0 $891 $600 $0 $1,491 $149 $0 $492 $2,132 $3
Subtotal $60,783 $4,547 $59,033 $0 $124,363 $12,436 $122 $27,548 $164,470 $263 6 Combustion Turbine & Accessories
6.1 Combustion Turbine Generator $104,200 $0 $7,506 $0 $111,706 $11,171 $5,585 $12,846 $141,308 $226 6.9 Combustion Turbine Foundations $0 $923 $1,068 $0 $1,992 $199 $0 $657 $2,848 $5
Subtotal $104,200 $923 $8,575 $0 $113,698 $11,370 $5,585 $13,504 $144,157 $231 7 HRSG, Ducting, & Stack
7.1 Heat Recovery Steam Generator $31,180 $0 $6,038 $0 $37,218 $3,722 $0 $4,094 $45,034 $72 7.3 Ductwork $0 $2,084 $1,461 $0 $3,544 $354 $0 $780 $4,679 $7 7.4 Stack $4,021 $0 $1,500 $0 $5,522 $552 $0 $607 $6,681 $11 7.9 HRSG, Duct & Stack Foundations $0 $766 $768 $0 $1,534 $153 $0 $506 $2,194 $4
Subtotal $35,201 $2,849 $9,768 $0 $47,818 $4,782 $0 $5,987 $58,588 $94 8 Steam Turbine Generator
8.1 Steam TG & Accessories $38,955 $0 $5,943 $0 $44,898 $4,490 $0 $4,939 $54,326 $87 8.2 Turbine Plant Auxiliaries $242 $0 $551 $0 $793 $79 $0 $87 $960 $2 8.3 Condenser & Auxiliaries $3,140 $0 $1,774 $0 $4,914 $491 $0 $541 $5,946 $10 8.4 Steam Piping $16,507 $0 $7,158 $0 $23,665 $2,367 $0 $6,508 $32,540 $52 8.9 TG Foundations $0 $1,141 $2,015 $0 $3,156 $316 $0 $1,042 $4,513 $7
Subtotal $58,844 $1,141 $17,441 $0 $77,426 $7,743 $0 $13,116 $98,285 $157 9 Cooling Water System
9.1 Cooling Towers $3,980 $0 $1,210 $0 $5,190 $519 $0 $856 $6,565 $11 9.2 Circulating Water Pumps $1,923 $0 $137 $0 $2,060 $206 $0 $340 $2,605 $4 9.3 Circ. Water System Auxiliaries $170 $0 $24 $0 $194 $19 $0 $32 $246 $0 9.4 Circ. Water Piping $0 $7,546 $1,828 $0 $9,374 $937 $0 $2,062 $12,373 $20 9.5 Make-up Water System $408 $0 $560 $0 $968 $97 $0 $213 $1,278 $2 9.6 Component Cooling Water Sys $863 $1,032 $708 $0 $2,603 $260 $0 $573 $3,436 $5 9.9 Circ. Water System Foundations $0 $2,470 $4,389 $0 $6,859 $686 $0 $2,264 $9,809 $16
Subtotal $7,343 $11,048 $8,857 $0 $27,248 $2,725 $0 $6,340 $36,313 $58 10 Ash & Spent Sorbent Handling Systems
10.1 Slag Dewatering & Cooling $20,022 $0 $9,806 $0 $29,828 $2,983 $0 $3,281 $36,092 $58 10.2 Gasifier Ash Depressurization w/10.1 w/10.1 w/10.1 $0 $0 $0 $0 $0 $0 $0 10.3 Cleanup Ash Depressurization w/10.1 w/10.1 w/10.1 $0 $0 $0 $0 $0 $0 $0 10.6 Ash Storage Silos $660 $0 $714 $0 $1,374 $137 $0 $227 $1,738 $3 10.7 Ash Transport & Feed Equipment $909 $0 $212 $0 $1,121 $112 $0 $185 $1,418 $2 10.8 Misc. Ash Handling Equipment $1,368 $1,676 $497 $0 $3,542 $354 $0 $584 $4,480 $7 10.9 Ash/Spent Sorbent Foundation $0 $55 $73 $0 $128 $13 $0 $42 $184 $0
Subtotal $22,959 $1,732 $11,302 $0 $35,994 $3,599 $0 $4,320 $43,913 $70 11 Accessory Electric Plant
11.1 Generator Equipment $1,156 $0 $1,126 $0 $2,282 $228 $0 $251 $2,761 $4 11.2 Station Service Equipment $4,391 $0 $404 $0 $4,795 $479 $0 $527 $5,802 $9

Cost and Performance Baseline for Fossil Energy Plants Volume 1b: Revision 2b
137
Case: B4A – E-GasTM IGCC w/o CO₂ Estimate Type: Conceptual Plant Size (MW,net): 625 Cost Base: Jun 2011
Item Description Equipment Material Labor Bare Erected Eng'g CM Contingencies Total Plant Cost No. Cost Cost Direct Indirect Cost H.O.& Fee Process Project $/1,000 $/kW
11.3 Switchgear & Motor Control $8,105 $0 $1,506 $0 $9,611 $961 $0 $1,586 $12,158 $19 11.4 Conduit & Cable Tray $0 $4,118 $12,694 $0 $16,812 $1,681 $0 $4,623 $23,116 $37 11.5 Wire & Cable $0 $7,940 $4,831 $0 $12,770 $1,277 $0 $3,512 $17,559 $28 11.6 Protective Equipment $0 $798 $2,961 $0 $3,759 $376 $0 $620 $4,755 $8 11.7 Standby Equipment $275 $0 $274 $0 $548 $55 $0 $90 $694 $1 11.8 Main Power Transformers $17,611 $0 $173 $0 $17,785 $1,778 $0 $2,934 $22,497 $36 11.9 Electrical Foundations $0 $181 $493 $0 $674 $67 $0 $223 $964 $2
Subtotal $31,538 $13,036 $24,462 $0 $69,036 $6,904 $0 $14,367 $90,306 $144 12 Instrumentation & Control
12.1 IGCC Control Equipment w/4.1 $0 w/4.1 $0 $0 $0 $0 $0 $0 $0 12.2 Combustion Turbine Control w/6.1 $0 w/6.1 $0 $0 $0 $0 $0 $0 $0 12.3 Steam Turbine Control w/8.1 $0 w/8.1 $0 $0 $0 $0 $0 $0 $0 12.4 Other Major Component Control $1,186 $0 $808 $0 $1,994 $199 $100 $344 $2,637 $4 12.5 Signal Processing Equipment w/12.7 $0 w/12.7 $0 $0 $0 $0 $0 $0 $0 12.6 Control Boards, Panels & Racks $273 $0 $178 $0 $451 $45 $23 $104 $622 $1 12.7 Computer & Accessories $6,326 $0 $207 $0 $6,533 $653 $327 $751 $8,264 $13 12.8 Instrument Wiring & Tubing $0 $2,435 $4,610 $0 $7,045 $705 $352 $2,025 $10,127 $16 12.9 Other I & C Equipment $4,229 $0 $2,095 $0 $6,324 $632 $316 $1,091 $8,364 $13
Subtotal $12,014 $2,435 $7,898 $0 $22,347 $2,235 $1,117 $4,315 $30,014 $48 13 Improvements to Site
13.1 Site Preparation $0 $118 $2,672 $0 $2,790 $279 $0 $921 $3,990 $6 13.2 Site Improvements $0 $2,090 $2,955 $0 $5,046 $505 $0 $1,665 $7,215 $12 13.3 Site Facilities $3,746 $0 $4,205 $0 $7,951 $795 $0 $2,624 $11,370 $18
Subtotal $3,746 $2,208 $9,833 $0 $15,787 $1,579 $0 $5,210 $22,575 $36 14 Buildings & Structures
14.1 Combustion Turbine Area $0 $317 $179 $0 $496 $50 $0 $109 $655 $1 14.2 Steam Turbine Building $0 $2,917 $4,153 $0 $7,069 $707 $0 $1,166 $8,943 $14 14.3 Administration Building $0 $1,008 $731 $0 $1,740 $174 $0 $287 $2,201 $4 14.4 Circulation Water Pumphouse $0 $199 $105 $0 $304 $30 $0 $50 $384 $1 14.5 Water Treatment Buildings $0 $588 $573 $0 $1,161 $116 $0 $192 $1,468 $2 14.6 Machine Shop $0 $516 $353 $0 $869 $87 $0 $143 $1,099 $2 14.7 Warehouse $0 $833 $538 $0 $1,371 $137 $0 $226 $1,734 $3 14.8 Other Buildings & Structures $0 $499 $388 $0 $888 $89 $0 $195 $1,172 $2 14.9 Waste Treating Building & Str. $0 $1,116 $2,131 $0 $3,247 $325 $0 $714 $4,286 $7
Subtotal $0 $7,993 $9,151 $0 $17,144 $1,714 $0 $3,083 $21,942 $35 Total $750,947 $76,953 $302,400 $0 $1,130,300 $113,030 $38,175 $201,088 $1,482,594 $2,372

Cost and Performance Baseline for Fossil Energy Plants Volume 1b: Revision 2b
138
Exhibit 3-56 Case B4A owner’s costs
Description $/1,000 $/kW Pre-Production Costs
6 Months All Labor $14,793 $24 1 Month Maintenance Materials $3,377 $5 1 Month Non-fuel Consumables $399 $1
1 Month Waste Disposal $434 $1 25% of 1 Months Fuel Cost at 100% CF $2,877 $5
2% of TPC $29,652 $47 Total $51,532 $82
Inventory Capital 60-day supply of fuel and consumables at 100% CF $23,491 $38
0.5% of TPC (spare parts) $7,413 $12 Total $30,904 $49
Other Costs Initial Cost for Catalyst and Chemicals $2,218 $4
Land $900 $1 Other Owner's Costs $222,389 $356
Financing Costs $40,030 $64 Total Overnight Costs (TOC) $1,830,567 $2,929
TASC Multiplier (IOU, high-risk, 35 year) 1.140 Total As-Spent Cost (TASC) $2,086,847 $3,339

Cost and Performance Baseline for Fossil Energy Plants Volume 1b: Revision 2b
139
Exhibit 3-57 Case B4A initial and annual operating and maintenance costs Case: B4A – E-GasTM IGCC w/o CO₂ Cost Base: Jun 2011
Plant Size (MW,net): 625 Heat Rate-net (Btu/kWh): 8,585 Capacity Factor (%): 80 Operating & Maintenance Labor
Operating Labor Operating Labor Requirements per Shift Operating Labor Rate (base): 39.70 $/hour Skilled Operator: 2.0
Operating Labor Burden: 30.00 % of base Operator: 9.0 Labor O-H Charge Rate: 25.00 % of labor Foreman: 1.0
Lab Tech's, etc.: 3.0 Total: 15.0
Fixed Operating Costs Annual Cost ($) ($/kW-net)
Annual Operating Labor: $6,781,554 $10.851 Maintenance Labor: $16,886,458 $27.019
Administrative & Support Labor: $5,917,003 $9.467 Property Taxes and Insurance: $29,651,871 $47.444
Total: $59,236,887 $94.781 Variable Operating Costs
($) ($/MWh-net) Maintenance Material: $32,421,135 $7.40220
Consumables Consumption Cost ($) Initial Fill Per Day Per Unit Initial Fill
Water (/1000 gallons): 0 3,155 $1.67 $0 $1,542,265 $0.35212 Makeup and Waste Water
Treatment Chemicals (lbs): 0 18,798 $0.27 $0 $1,470,139 $0.33565
Carbon (Mercury Removal) (lb): 115,489 198 $5.50 $635,191 $317,595 $0.07251 COS Catalyst (m3): 327 0.22 $3,751.70 $1,227,074 $245,415 $0.05603
MDEA Solution (gal): 26,146 37 $13.62 $356,095 $146,323 $0.03341 Claus Catalyst (ft3): w/equip. 1.91 $203.15 $0 $113,350 $0.02588
Subtotal: $2,218,360 $3,835,086 $0.87560 Waste Disposal
Spent Mercury Catalyst (lb.): 0 198 $0.65 $0 $37,539 $0.00857 Flyash (ton): 0 0 $0.00 $0 $0 $0.00000
Slag (ton): 0 563 $25.11 $0 $4,130,607 $0.94308 Subtotal: $0 $4,168,147 $0.95165
By-Products Sulfur (tons): 0 138 $0.00 $0 $0 $0.00000
Subtotal: $0 $0 $0.00000 Variable Operating Costs Total: $2,218,360 $40,424,368 $9.22946
Fuel Cost Illinois Number 6 (ton): 0 5,519 $68.54 $0 $110,464,984 $25.22072
Total: $0 $110,464,984 $25.22072
Exhibit 3-58 Case B4A COE breakdown
Component Value, $/MWh Percentage Capital 51.8 52%
Fixed 13.5 14% Variable 9.2 9%
Fuel 25.2 25% Total (Excluding T&S) 99.8 N/A
CO2 T&S 0.0 0% Total (Including T&S) 99.8 N/A

Cost and Performance Baseline for Fossil Energy Plants Volume 1b: Revision 2b
140
3.3.8 Case B4B - E-Gas™ IGCC Power Plant with CO2 Capture This case is configured to produce electric power with CO2 capture. The plant configuration is the same as Case B4A, namely two gasifier trains, two state-of-the-art 2008 F-class turbines, two HRSGs, and one steam turbine. The gross power output from the plant is constrained by the capacity of the two CTs, and since the CO2 capture and compression process increases the auxiliary load on the plant, the net output is significantly reduced relative to Case B4A.
The process description for Case B4B is similar to Case B4A with several notable exceptions to accommodate CO2 capture. A BFD and stream tables for Case B4B are shown in Exhibit 3-59 and Exhibit 3-60, respectively. Instead of repeating the entire process description, only differences from Case B4A are reported here.
3.3.8.1 Coal Preparation and Feed Systems No differences from Case B4A.
3.3.8.2 Gasification The gasification process is the same as Case B4A with the exception that total coal feed to the two gasifiers is 5,271 tonnes/day (5,811 tpd) (stream 8) and the ASU provides 4,234 tonnes/day (4,668 tpd) of 95 mol% oxygen to the gasifier and Claus plant (streams 5 and 3).
3.3.8.3 Raw Gas Cooling/Particulate Removal Raw gas cooling and particulate removal are the same as Case B4A with the exception that approximately 418,710 kg/hr (923,082 lb/hr) of saturated steam at 13.8 MPa (2,000 psia) is generated in the SGC.
3.3.8.4 Syngas Scrubber/Sour Water Stripper No differences from Case B4A.
3.3.8.5 Sour Gas Shift The SGS process was described in Section 3.1.3. In Case B4B steam (stream 11) is added to the syngas exiting the scrubber to adjust the H2O:CO molar ratio to approximately 2.25:1 prior to the first SGS reactor. The hot syngas exiting the first stage of SGS is used to preheat a portion of the water used to humidify the clean syngas leaving the AGR. The final stage of SGS brings the overall conversion of the CO to CO2 to 98.5 percent. The syngas exiting the final stage of SGS still contains 1.2 vol% CH4, which is subsequently oxidized to CO2 in the CT and results in a carbon capture of 89.9 percent. The warm syngas exiting the second stage of the SGS at 204°C (400°F) (stream 12) is cooled to 201°C (393°F) by preheating the syngas entering the first SGS reactor. The SGS catalyst also serves to hydrolyze COS thus eliminating the need for a separate COS hydrolysis reactor. The syngas is further dehydrated and cooled to 35°C (95°F) in syngas coolers prior to the mercury removal beds.
3.3.8.6 Mercury Removal and Acid Gas Removal Mercury removal is the same as in Case B4A.
The AGR process in Case B4B is a two-stage Selexol process where H2S is removed in the first stage and CO2 in the second stage of absorption, as previously described in Section 3.1.5. The process results in three product streams: the clean syngas, a CO2-rich stream, and an acid gas feed to the Claus plant. The acid gas (stream 19) contains 21.5 percent H2S and 70 percent CO2

Cost and Performance Baseline for Fossil Energy Plants Volume 1b: Revision 2b
141
with the balance primarily H2. The CO2-rich stream is discussed further in the CO2 compression section.
3.3.8.7 CO2 Compression and Dehydration CO2 from the AGR process is flashed at three pressure levels to separate CO2 and decrease H2 losses to the CO2 product pipeline. The HP CO2 stream is flashed at 2.0 MPa (289.7 psia), compressed, and recycled back to the CO2 absorber. The MP CO2 stream is flashed at 1.0 MPa (149.7 psia). The LP CO2 stream is flashed at 0.1 MPa (16.7 psia), compressed to 1.0 MPa (149.5 psia), and combined with the MP CO2 stream. The combined stream is compressed from 1.0 MPa (149.5 psia) to an SC condition at 15.3 MPa (2215 psia) using a multiple-stage, intercooled compressor. During compression, the CO2 stream is dehydrated to a dew point of -40ºC (-40°F) with triethylene glycol. The raw CO2 stream from the Selexol process contains over 99 percent CO2. The CO2 (stream 18) is transported to the plant fence line and is sequestration ready. CO2 T&S costs were estimated using the methodology described in Section 2.6.
3.3.8.8 Claus Unit The Claus plant is the same as Case B4A with the following exceptions:
• 5,494 kg/hr (12,112 lb/hr) of sulfur (stream 20) are produced • The waste heat boiler generates 12,679 kg/hr (27,953 lb/hr) of 3.0 MPa (430 psia) steam,
which provides all of the Claus plant process needs and provides some additional steam to the medium pressure steam header
3.3.8.9 Power Block Clean syngas from the AGR plant is partially humidified to 4 percent because the nitrogen available from the ASU is insufficient to provide adequate dilution. The moisturized syngas is reheated (stream 17) to 193°C (380°F) using HP BFW, diluted with nitrogen (stream 4), and then enters the CT burner. There is no integration between the CT and the ASU in this case. The exhaust gas (stream 23) exits the CT at 562°C (1044°F) and enters the HRSG where additional heat is recovered. The flue gas exits the HRSG at 132°C (270°F) (stream 24) and is discharged through the plant stack. The steam raised in the HRSG is used to power an advanced commercially available steam turbine using a 12.4 MPa/534°C/534°C (1,800 psig/994°F/994°F) steam cycle.
3.3.8.10 Air Separation Unit (ASU) The elevated pressure ASU is the same as in other cases and produces 4,234 tonnes/day (4,668 tpd) of 95 mol% oxygen and 14,230 tonnes/day (15,686 tpd) of nitrogen. There is no integration between the ASU and the CT for the CO2 capture case.
3.3.8.11 Balance of Plant Balance of plant items were covered in Sections 3.1.9, 3.1.10, and 3.1.12.

Cost and Performance Baseline for Fossil Energy Plants Volume 1b: Revision 2b
142
Exhibit 3-59 Case B4B block flow diagram, E-Gas™ IGCC with CO2 capture
Source: NETL
SYNGAS SCRUBBER
GAS COOLINGBFW HEATING& KNOCKOUT
SHIFT REACTORS
ELEVATEDPRESSURE ASU
E-GASTM GASIFIER
SOURWATER
STRIPPER
MERCURYREMOVAL
DUAL STAGE
SELEXOLUNIT
CLAUSPLANT
HRSG
AMBIENT AIR
HYDROGENATION REACTOR AND GAS
COOLER
GAS TURBINE
COMBUSTOR
TURBINE COOLING AIR
SYNGAS COOLING,
CYCLONES & FILTERS
CO2 COMPRESSION
1
5
11
12 13
17
19
20
18
8 10
2 3
4
22
23 24
AIR TO ASU
AS-RECEIVED COAL
SLAG
SHIFTSTEAM
WATER RECYCLE TO SLURRY
PREPARATION
NITROGEN DILUENT
SYNGAS
CLEAN GAS
CO2 STREAMS
CO2 PRODUCT
SULFUR
TAIL GAS RECYCLE TO
SELEXOL
NOTE: TAIL GAS BOOST COMPRESSOR MODELED,
BUT NOT SHOWN
FLUE GAS
STACK GAS
VENT GAS
14
SYNGAS REHEATER
NOTE: SYNGAS RECYCLE MODELED, BUT NOT SHOWN
GASIFIER OXIDANT
RECYCLE TO GASIFIER OUTLET
2X STATE-OF-THE-ART F-CLASS
GAS TURBINES
CLAUS PLANT
OXIDANT
CLAUS PLANT
OXIDANT
STEAM TURBINE
25
Note: Block Flow Diagram is not intended to represent a complete material balance. Only major process streams and equipment are shown.
SLURRY MIXER
9SLURRY WATER
21TAIL GAS
RECYCLE FROM CLAUS PLANT
6
7
SOUR WATER
STEAM
SYNGAS HUMIDIFICATION
15
16

Cost and Performance Baseline for Fossil Energy Plants Volume 1b: Revision 2b
143
Exhibit 3-60 Case B4B stream table, E-Gas™ IGCC with capture 1 2 3 4 5 6 7 8 9 10 11 12 13 14
V-L Mole Fraction Ar 0.0092 0.0209 0.0318 0.0023 0.0318 0.0000 0.0000 0.0000 0.0000 0.0000 0.0000 0.0054 0.0071 0.0071 CH4 0.0000 0.0000 0.0000 0.0000 0.0000 0.0000 0.0000 0.0000 0.0000 0.0000 0.0000 0.0125 0.0164 0.0159 CO 0.0000 0.0000 0.0000 0.0000 0.0000 0.0000 0.0000 0.0000 0.0000 0.0000 0.0000 0.0028 0.0037 0.0038 CO2 0.0003 0.0071 0.0000 0.0000 0.0000 0.0000 0.0000 0.0000 0.0000 0.0000 0.0000 0.3103 0.4090 0.4172 COS 0.0000 0.0000 0.0000 0.0000 0.0000 0.0000 0.0000 0.0000 0.0000 0.0000 0.0000 0.0000 0.0000 0.0000 H2 0.0000 0.0000 0.0000 0.0000 0.0000 0.0000 0.0000 0.0000 0.0000 0.0000 0.0000 0.4128 0.5441 0.5341 H2O 0.0099 0.1780 0.0000 0.0003 0.0000 1.0000 1.0000 0.0000 0.9963 0.0000 1.0000 0.2376 0.0015 0.0015 HCl 0.0000 0.0000 0.0000 0.0000 0.0000 0.0000 0.0000 0.0000 0.0000 0.0000 0.0000 0.0001 0.0000 0.0000 H2S 0.0000 0.0000 0.0000 0.0000 0.0000 0.0000 0.0000 0.0000 0.0000 0.0000 0.0000 0.0048 0.0063 0.0062 N2 0.7732 0.6187 0.0178 0.9919 0.0178 0.0000 0.0000 0.0000 0.0000 0.0000 0.0000 0.0090 0.0119 0.0142 NH3 0.0000 0.0000 0.0000 0.0000 0.0000 0.0000 0.0000 0.0000 0.0037 0.0000 0.0000 0.0046 0.0000 0.0000 O2 0.2074 0.1754 0.9504 0.0054 0.9504 0.0000 0.0000 0.0000 0.0000 0.0000 0.0000 0.0000 0.0000 0.0000 SO2 0.0000 0.0000 0.0000 0.0000 0.0000 0.0000 0.0000 0.0000 0.0000 0.0000 0.0000 0.0000 0.0000 0.0000 Total 1.0000 1.0000 1.0000 1.0000 1.0000 1.0000 1.0000 0.0000 1.0000 0.0000 1.0000 1.0000 1.0000 1.0000 V-L Flowrate (kgmole/hr) 26,685 1,231 145 19,704 5,338 1,287 4,969 0 5,009 0 9,357 37,866 26,948 27,761 V-L Flowrate (kg/hr) 770,042 33,603 4,654 552,893 171,782 23,193 89,523 0 90,226 0 168,565 748,369 547,649 575,208 Solids Flowrate (kg/hr) 0 0 0 0 0 0 0 219,635 0 22,418 0 0 0 0
Temperature (°C) 15 19 32 93 32 154 343 15 171 1,038 288 204 35 34 Pressure (MPa, abs) 0.10 0.11 0.86 2.65 0.86 5.79 5.10 0.10 5.79 4.24 5.52 4.07 3.79 3.76 Steam Table Enthalpy (kJ/kg) A 30.23 36.49 26.67 92.50 26.67 646.63 3,062.93 --- 673.50 --- 2,917.15 874.40 40.91 39.04 AspenPlus Enthalpy (kJ/kg)B -97.58 -1,964.01 4.13 63.47 4.13 -15,372.01 -12,907.38 -2,116.95 -15,251.86 1,005.43 -13,053.16 -8,872.57 -8,024.73 -8,027.16 Density (kg/m3) 1.2 1.5 11.0 24.4 11.0 857.7 20.1 --- 836.0 --- 25.6 20.6 30.9 31.3 V-L Molecular Weight 28.857 27.295 32.181 28.060 32.181 18.015 18.015 --- 18.012 --- 18.015 19.764 20.322 20.720
V-L Flowrate (lbmole/hr) 58,830 2,714 319 43,440 11,768 2,838 10,955 0 11,044 0 20,628 83,479 59,411 61,202 V-L Flowrate (lb/hr) 1,697,652 74,082 10,260 1,218,920 378,715 51,133 197,365 0 198,914 0 371,622 1,649,872 1,207,359 1,268,117 Solids Flowrate (lb/hr) 0 0 0 0 0 0 0 484,212 0 49,422 0 0 0 0
Temperature (°F) 59 67 90 199 90 310 650 59 340 1,900 550 400 95 94 Pressure (psia) 14.7 16.4 125.0 384.0 125.0 840.0 740.0 14.7 840.0 615.0 800.0 590.0 550.0 545.0 Steam Table Enthalpy (Btu/lb)A 13.0 15.7 11.5 39.8 11.5 278.0 1,316.8 --- 289.6 --- 1,254.1 375.9 17.6 16.8 AspenPlus Enthalpy (Btu/lb)B -42.0 -844.4 1.8 27.3 1.8 -6,608.8 -5,549.2 -910.1 -6,557.1 432.3 -5,611.9 -3,814.5 -3,450.0 -3,451.1 Density (lb/ft3) 0.076 0.095 0.687 1.521 0.687 53.543 1.257 --- 52.192 --- 1.597 1.285 1.928 1.953
ASteam table reference conditions are 32.02°F & 0.089 psia BAspen thermodynamic reference state is the component’s constituent elements in an ideal gas state at 25°C and 1 atm

Cost and Performance Baseline for Fossil Energy Plants Volume 1b: Revision 2b
144
Exhibit 3-60 Case B4B stream table, E-Gas™ IGCC with capture (continued) 15 16 17 18 19 20 21 22 23 24 25
V-L Mole Fraction Ar 0.0119 0.0114 0.0114 0.0002 0.0011 0.0000 0.0068 0.0092 0.0090 0.0090 0.0000 CH4 0.0262 0.0251 0.0251 0.0008 0.0045 0.0000 0.0000 0.0000 0.0000 0.0000 0.0000 CO 0.0063 0.0060 0.0060 0.0001 0.0007 0.0000 0.0076 0.0000 0.0000 0.0000 0.0000 CO2 0.0352 0.0338 0.0338 0.9945 0.7021 0.0000 0.6907 0.0003 0.0082 0.0082 0.0000 COS 0.0000 0.0000 0.0000 0.0000 0.0001 0.0000 0.0000 0.0000 0.0000 0.0000 0.0000 H2 0.8964 0.8588 0.8588 0.0044 0.0591 0.0000 0.2007 0.0000 0.0000 0.0000 0.0000 H2O 0.0001 0.0421 0.0421 0.0000 0.0162 0.0000 0.0017 0.0099 0.1246 0.1246 1.0000 HCl 0.0000 0.0000 0.0000 0.0000 0.0000 0.0000 0.0000 0.0000 0.0000 0.0000 0.0000 H2S 0.0000 0.0000 0.0000 0.0000 0.2153 0.0000 0.0026 0.0000 0.0000 0.0000 0.0000 N2 0.0239 0.0229 0.0229 0.0001 0.0010 0.0000 0.0901 0.7732 0.7529 0.7529 0.0000 NH3 0.0000 0.0000 0.0000 0.0000 0.0000 0.0000 0.0000 0.0000 0.0000 0.0000 0.0000 O2 0.0000 0.0000 0.0000 0.0000 0.0000 0.0000 0.0000 0.2074 0.1052 0.1052 0.0000 SO2 0.0000 0.0000 0.0000 0.0000 0.0000 0.0000 0.0000 0.0000 0.0000 0.0000 0.0000 Total 1.0000 1.0000 1.0000 1.0000 1.0000 0.0000 1.0000 1.0000 1.0000 1.0000 1.0000 V-L Flowrate (kgmole/hr) 16,435 17,155 17,155 10,499 800 0 812 110,253 139,694 139,694 34,515 V-L Flowrate (kg/hr) 83,813 96,780 96,780 459,855 31,069 0 27,560 3,181,557 3,831,230 3,831,230 621,792 Solids Flowrate (kg/hr) 0 0 0 0 0 5,494 0 0 0 0 0
Temperature (°C) 34 108 193 51 48 176 38 15 562 132 534 Pressure (MPa, abs) 3.76 3.21 3.17 15.27 0.16 0.12 5.51 0.10 0.10 0.10 12.51 Steam Table Enthalpy (kJ/kg) A 196.11 903.06 1,360.50 -162.35 62.13 --- 1.77 30.23 839.77 348.19 3,432.70 AspenPlus Enthalpy (kJ/kg)B -3,190.25 -4,169.46 -3,712.02 -9,119.38 -7,323.59 140.70 -8,075.42 -97.58 -608.99 -1,100.57 -12,537.61 Density (kg/m3) 7.4 5.6 4.6 641.8 2.4 5,283.7 83.6 1.2 0.4 0.9 36.7 V-L Molecular Weight 5.100 5.642 5.642 43.800 38.814 --- 33.925 28.857 27.426 27.426 18.015
V-L Flowrate (lbmole/hr) 36,233 37,820 37,820 23,146 1,765 0 1,791 243,066 307,972 307,972 76,092 V-L Flowrate (lb/hr) 184,776 213,363 213,363 1,013,808 68,496 0 60,759 7,014,133 8,446,417 8,446,417 1,370,817 Solids Flowrate (lb/hr) 0 0 0 0 0 12,112 0 0 0 0 0
Temperature (°F) 94 227 380 124 119 349 100 59 1,044 270 994 Pressure (psia) 545.0 465.0 460.0 2,214.7 23.7 17.3 799.5 14.7 15.2 15.2 1,814.7 Steam Table Enthalpy (Btu/lb)A 84.3 388.2 584.9 -69.8 26.7 --- 0.8 13.0 361.0 149.7 1,475.8 AspenPlus Enthalpy (Btu/lb)B -1,371.6 -1,792.5 -1,595.9 -3,920.6 -3,148.6 60.5 -3,471.8 -42.0 -261.8 -473.2 -5,390.2 Density (lb/ft3) 0.461 0.352 0.285 40.067 0.149 329.851 5.220 0.076 0.026 0.053 2.293
ASteam table reference conditions are 32.02°F & 0.089 psia BAspen thermodynamic reference state is the component’s constituent elements in an ideal gas state at 25°C and 1 atm

Cost and Performance Baseline for Fossil Energy Plants Volume 1b: Revision 2b
145
3.3.9 Case B4B - Performance Results The Case B4B modeling assumptions were presented previously in Section 3.3.3.
The plant produces a net output of 513 MWe at a net plant efficiency of 31.0 percent (HHV basis). Overall performance for the entire plant is summarized in Exhibit 3-61; Exhibit 3-62 provides a detailed breakdown of the auxiliary power requirements. The ASU accounts for nearly 58 percent of the auxiliary load between the main air compressor, nitrogen compressor, oxygen compressor, and ASU auxiliaries. The two-stage Selexol process and CO2 compression account for an additional 27 percent of the auxiliary power load. The BFW pumps and cooling water system (CWPs and cooling tower fan) compose nearly 6 percent of the load, leaving 9 percent of the auxiliary load for all other systems.
Exhibit 3-61 Case B4B plant performance summary
Performance Summary Combustion Turbine Power, MWe 464 Sweet Gas Expander Power, MWe 0 Steam Turbine Power, MWe 240 Total Gross Power, MWe 704 Air Separation Unit Main Air Compressor, kWe 65,670 Oxygen Compressor, kWe 9,010 Nitrogen Compressors, kWe 35,340 CO₂ Compression, kWe 31,380 Acid Gas Removal, kWe 19,900 Balance of Plant, kWe 28,950 Total Auxiliaries, MWe 190 Net Power, MWe 513 HHV Net Plant Efficiency (%) 31.0% HHV Net Plant Heat Rate, kJ/kWh (Btu/kWh) 11,607 (11,002) HHV Cold Gas Efficiency, % 81.0% HHV Combustion Turbine Efficiency, % 36.1% LHV Net Plant Efficiency (%) 32.2% LHV Net Plant Heat Rate, kJ/kWh (Btu/kWh) 11,195 (10,611) LHV Cold Gas Efficiency, % 76.9% LHV Combustion Turbine Efficiency, % 42.4% Steam Turbine Cycle Efficiency, % 41.5% Steam Turbine Heat Rate, kJ/kWh (Btu/kWh) 8,668 (8,216) Condenser Duty, GJ/hr (MMBtu/hr) 1,408 (1,334) As-Received Coal Feed, kg/hr (lb/hr) 219,635 (484,212) HHV Thermal Input, kWt 1,655,503 LHV Thermal Input, kWt 1,596,753 Raw Water Withdrawal, (m3/min)/MWnet (gpm/MWnet) 0.042 (11.2) Raw Water Consumption, (m3/min)/MWnet (gpm/MWnet) 0.034 (9.1) O₂:Coal 0.739

Cost and Performance Baseline for Fossil Energy Plants Volume 1b: Revision 2b
146
Exhibit 3-62 Case B4B plant power summary
Power Summary Combustion Turbine Power, MWe 464 Sweet Gas Expander Power, MWe 0 Steam Turbine Power, MWe 240 Total Gross Power, MWe 704
Auxiliary Load Summary Coal Handling, kWe 470 Coal Milling, kWe 2,260 Sour Water Recycle Slurry Pump, kWe 200 Slag Handling, kWe 1,160 Air Separation Unit Auxiliaries, kWe 1,000 Air Separation Unit Main Air Compressor, kWe 65,670 Oxygen Compressor, kWe 9,010 Nitrogen Compressors, kWe 35,340 Feedwater Pumps, kWe 4,160 Quench Water Pump, kWe 0 Syngas Recycle Compressor, kWe 520 CO₂ Compression, kWe 31,380 Scrubber Pumps, kWe 400 Acid Gas Removal, kWe 19,900 Combustion Turbine Auxiliaries, kWe 1,000 Steam Turbine Auxiliaries, kWe 100 Condensate Pumps, kWe 310 Circulating Water Pumps, kWe 4,700 Ground Water Pumps, kWe 520 Cooling Tower Fans, kWe 2,430 Claus Plant/TGTU Auxiliaries, kWe 250 Claus Plant TG Recycle Compressor, kWe 3,700 Miscellaneous Balance of PlantA, kWe 3,000 Transformer Losses, kWe 2,770 Total Auxiliaries, MWe 190 Net Power, MWe 513
AIncludes plant control systems, lighting, HVAC, and miscellaneous low voltage loads
3.3.9.1 Environmental Performance The environmental targets for emissions of Hg, NOx, SO2, CO2, and PM were presented in Section 2.3. A summary of the plant air emissions for Case B4B is presented in Exhibit 3-63. All HCl is assumed to be removed and is, therefore, not reported.

Cost and Performance Baseline for Fossil Energy Plants Volume 1b: Revision 2b
147
Exhibit 3-63 Case B4B air emissions
kg/GJ (lb/MMBtu) Tonne/year (ton/year)A kg/MWh (lb/MWh)B
SO2 0.001 (0.002) 39 (43) 0.008 (0.017) NOx 0.021 (0.049) 885 (976) 0.180 (0.396) Particulates 0.003 (0.0071) 127 (141) 0.026 (0.057) Hg 1.61E-7 (3.74E-7) 0.007 (0.007) 1.36E-6 (3.00E-6) CO2 8 (20) 354,267 (390,512) 72 (158) CO2C - - 98 (217)
ACalculations based on an 80 percent capacity factor BEmissions are based on gross power except where otherwise noted CCO2 emissions based on net power instead of gross power
The low level of SO2 emissions is achieved by capturing the sulfur in the gas by the two-stage Selexol AGR process. The CO2 capture target results in the sulfur compounds being removed to a greater extent than required in the environmental targets of Section 2.3. The clean syngas exiting the AGR process has a sulfur concentration of approximately 5 ppmv. This results in a concentration in the flue gas of less than 1 ppmv. The H2S-rich regeneration gas from the AGR system is fed to a Claus plant, producing elemental sulfur. The Claus plant tail gas is hydrogenated to convert all sulfur species to H2S, and then recycled back to the Selexol, thereby eliminating the need for a tail gas treatment unit.
NOx emissions are limited by the use of humidification and nitrogen dilution to 15 ppmvd (NO2 @ 15 percent O2). Ammonia in the syngas is removed with process condensate prior to the low-temperature AGR process and ultimately destroyed in the Claus plant burner. This helps lower NOx levels as well.
Particulate discharge to the atmosphere is limited to extremely low values by the use of a cyclone and a barrier filter in addition to the syngas scrubber and the gas washing effect of the AGR absorber. The particulate emissions represent filterable particulate only.
Approximately 97 percent of the mercury is captured from the syngas by dual activated carbon beds.
Ninety five percent of the CO2 from the syngas is captured in the AGR system and compressed for sequestration. Because not all CO is converted to CO2 in the shift reactors, the overall carbon removal is 89.9 percent.
The carbon balance for the plant is shown in Exhibit 3-64. The carbon input to the plant consists of carbon in the air in addition to carbon in the coal. Carbon leaves the plant as unburned carbon in the slag and as CO2 in the stack gas, ASU vent gas, and the captured CO2 product. The carbon capture efficiency is defined as one minus the amount of carbon in the stack gas relative to the total carbon in less carbon contained in the slag, represented by the following fraction:
𝐶𝐶𝐶𝐶𝐶𝐶𝐶𝐶𝐶𝐶𝐸𝐸 𝐴𝐴𝐸𝐸 𝑆𝑆𝐶𝐶𝐶𝐶𝑆𝑆𝑆𝑆(𝑇𝑇𝐶𝐶𝐶𝐶𝐶𝐶𝑇𝑇 𝐶𝐶𝐶𝐶𝐶𝐶𝐶𝐶𝐶𝐶𝐸𝐸 𝑅𝑅𝐸𝐸) − (𝐶𝐶𝐶𝐶𝐶𝐶𝐶𝐶𝐶𝐶𝐸𝐸 𝐴𝐴𝐸𝐸 𝑆𝑆𝑇𝑇𝐶𝐶𝑆𝑆) = �1 − �
30,416309,844 − 2,469
� ∗�100 = 89.9%

Cost and Performance Baseline for Fossil Energy Plants Volume 1b: Revision 2b
148
The high methane content of the syngas, relative to the GEE and Shell cases, prevented reaching the nominal 90 percent carbon capture. In order to achieve 90 percent capture, the two-stage Selexol CO2 removal efficiency was increased from 92 to 95 percent.
Exhibit 3-64 Case B4B carbon balance
Carbon In Carbon Out kg/hr (lb/hr) kg/hr (lb/hr)
Coal 140,006 (308,659) Stack Gas 13,796 (30,416) Air (CO₂) 537 (1,185) CO₂ Product 125,522 (276,728)
ASU Vent 105 (231) Slag 1,120 (2,469) 140,543 (309,844) Total 140,543 (309,844)
Exhibit 3-65 shows the sulfur balance for the plant. Sulfur input comes solely from the sulfur in the coal. Sulfur output includes the sulfur recovered in the Claus plant, sulfur emitted in the stack gas, and sulfur in the CO2 product. Sulfur in the slag is considered to be negligible.
Exhibit 3-65 Case B4B sulfur balance
Sulfur In Sulfur Out kg/hr (lb/hr) kg/hr (lb/hr)
Coal 5,505 (12,136) Stack Gas 3 (6) CO₂ Product 8 (18) Elemental Sulfur 5,494 (12,112)
Total 5,505 (12,136) Total 5,505 (12,136)
Exhibit 3-66 shows the overall water balance for the plant. The exhibit is presented in an identical manner for cases B1A through B4A.

Cost and Performance Baseline for Fossil Energy Plants Volume 1b: Revision 2b
149
Exhibit 3-66 Case B4B water balance
Water Use Water Demand
Internal Recycle
Raw Water Withdrawal
Process Water
Discharge Raw Water
Consumption
m3/min (gpm)
m3/min (gpm)
m3/min (gpm) m3/min (gpm) m3/min (gpm)
Slag Handling 0.49 (128) 0.49 (128) – – – Slurry Water 1.51 (398) 1.51 (398) – – – Quench/Wash – 0.00 () – – – Humidifier 0.23 (61) 0.23 (61) – – – SWS Blowdown – – – 0.03 (6.78) -0.03 (-6.78) Condenser Makeup 4.52 (1,193) – 4.52 (1,193) – 4.52 (1,193) BFW Makeup 0.21 (55) – 0.21 (55) – 0.21 (55) Gasifier Steam 1.49 (395) – 1.49 (395) – 1.49 (395) Shift Steam 2.81 (743) – 2.81 (743) – 2.81 (743) CT Steam Dilution – – – – – Cooling Tower 18.32
(4,839) 1.04 (274) 17.28 (4,565) 4.12 (1,088) 13.16 (3,476)
BFW Blowdown – 0.21 (55) -0.21 (-55) – -0.21 (-55) SWS Blowdown – 0.26 (67.78) -0.26 (-
67.78) – -0.26 (-67.78)
Total 25.05 (6,618) 3.26 (861) 21.79 (5,757) 4.14 (1,095) 17.65 (4,662)
3.3.9.2 Heat and Mass Balance Diagrams Heat and mass balance diagrams are shown for the following subsystems in Exhibit 3-67 through Exhibit 3-69:
• Coal gasification and ASU • Syngas cleanup including sulfur recovery and tail gas recycle • Combined cycle power generation, steam, and FW
An overall plant energy balance is provided in tabular form in Exhibit 3-70. The power out is the combined CT and steam turbine power prior to generator losses. The power at the generator terminals (shown in Exhibit 3-61) is calculated by multiplying the power out by a combined generator efficiency of 98.5 percent.

Cost and Performance Baseline for Fossil Energy Plants Volume 1b: Revision 2b
150
Exhibit 3-67 Case B4B coal gasification and ASU heat and mass balance schematic
Source: NETL
DOE/NETL
DUAL TRAIN IGCC PLANTCASE B4B
HEAT AND MATERIAL FLOW DIAGRAM
BITUMINOUS BASELINE STUDYCASE B4B
COP GASIFIERASU AND GASIFICATION
DWG. NO.BB-HMB-CS-B4B-PG-1
PLANT PERFORMANCE SUMMARY
LEGEND
PAGES1 OF 3
Ambient Air
Four Stage AirCompressor
ElevatedPressure
ASU
Four Stage N2Compressor
Four Stage O2Compressor
ASU Vent
1,697,652 W59 T15 P13 H
378,715 W90 T
125 P11 H
378,715 W223 T740 P38 H
To Claus Plant
10,260 W90 T
125 P11 H
74,082 W67 T16 P16 H
1,080,178 W90 T56 P14 H
152,901 W50 T
182 P3 H
5
1
3
2
457,753 W385 T469 P87 H
Candle Filter
Slurry Mix Tank
E-Gas TM Gasifier
Slag
Cyclones
Syngas RecycleFire
TubeBoiler
484,212 W59 T15 P
198,914 W340 T840 P290 H
49,422 W1,900 T
615 P
1,355,003 W600 T605 P486 H
761,167 W385 T384 P87 H
10
683,126 W179 T840 P
1,355,003 W600 T605 P486 H
1,355,003 W1,802 T
615 P1,029 H
Boost Compressor
79,928 W161 T800 P43 H
1,355,003 W450 T600 P423 H
1,696,136 W100 T190 P18 H
8
9
7
6197,365 W
650 T740 P
1,309 H
51,133 W310 T840 P278 H
Syngas RecycleCompressor
79,928 W105 T585 P22 H
From LPEconomizer
To LPEvaporator
To Superheater
From HP Economizer 2
Post Particulate
Cooler
Raw Syngas
to Scrubber
From HP Economizer 2
To HP Economizer 1
N2 to GT Combustor
N2 to GT Combustor
14,159 W387 T815 P87 H
Boost Compressor
4
Air
Oxygen
Nitrogen
Coal/Char/Slurry/Slag
Synthesis Gas
Water
Steam
W Flowrate, lbm/hr T Temperature, °FP Absolute Pressure, PSIAH Enthalpy, Btu/lbmMWe Power, Megawatts Electrical
Flue Gas/CombustionProducts
Gross Plant Power: 704 MWeAuxiliary Load: 190 MWeNet Plant Power: 513 MWeNet Plant Efficiency, HHV: 31.0%Net Plant Heat Rate: 11,002 Btu/kWh
Sour Water
Steam
Water
Milled Coal
Notes:1. Enthalpy reference point is natural state
at 32 °F and 0.08865 psia

Cost and Performance Baseline for Fossil Energy Plants Volume 1b: Revision 2b
151
Exhibit 3-68 Case B4B syngas cleanup heat and mass balance schematic
Source: NETL
Mercury Removal
KnockOut
DrumMultistage
Intercooled CO2 Compressor
Raw Syngas
Humidified Fuel Gas
SourDrum
To Coal Slurrry and Slag Quench
Interstage Knockout
Claus Plant
Tail Gas
Furnace
CatalyticReactorBeds
Sulfur
HighTemperature
Shift #1
Low Temperature
Shift #2
Knock Out
Shift Steam
SyngasCoolers
SourStripper
Two-StageSelexol
Clean Gas
CO2
Acid Gas
SyngasScrubber
371,622 W550 T800 P
1,246 H
1,278,250 W363 T590 P340 H
1,355,003 W450 T600 P423 H
1,278,250 W353 T595 P344 H
1,268,117 W94 T
545 P17 H
213,363 W227 T465 P388 H
68,496 W119 T24 P27 H
1,013,808 W124 T
2,215 P-70 H
1,547,580 W393 T585 P372 H
213,363 W380 T460 P585 H
12,112 W
72,809 W280 T17 P
313 H
6,165 W195 T65 P
206 H
DOE/NETL
DUAL TRAIN IGCC PLANTCASE B4B
HEAT AND MATERIAL FLOW DIAGRAM
BITUMINOUS BASELINE STUDYCASE B4B
COP GASIFIERGAS CLEANUP SYSTEM
DWG. NO.BB-HMB-CS-B4B-PG-2
PLANT PERFORMANCE SUMMARY
LEGEND
PAGES2 OF 3
1,649,872 W398 T590 P546 H
1,649,872 W400 T590 P398 H
15
20
19
18
14
13
12
17
21
72,809 W550 T11 P
333 H
1,207,359 W95 T
550 P18 H
12,050 W112 T11 P37 H
3
Syngas Recycle
11
60,759 W100 T800 P
1 H
1,649,872 W400 T590 P376 H
1,649,872 W698 T590 P533 H
102,292 W393 T585 P372 H
Humidification 16
184,776 W94 T
545 P84 H
Tail GasCompressor
HydrogenationAnd Tail Gas
Cooling
469,170 W353 T595 P347 H
469,170 W150 T
1,205 P116 H
To Fuel Gas Preheater
From Fuel Gas Preheater
338,892 W
To Water Treatment
Makeup Water
Reboiler
10,260 W90 T
125 P11 H
10,260 W450 T125 P92 H
Claus OxygenPreheater
To Deaerator
From IP BFW
From Syngas Scrubber and HP
Economizer 2
To Syngas Scrubber and HP
Economizer 1
From IP BFW, LP BFW, and Tail Gas Cooling
To LP Turbine, PreheaterWGS/Gasifier Steam
and Reheater
Fuel Gas Humidification
CO2 Product
From Gland Steam Condenser To Syngas
Cooling111 T
Fuel Gas Preheater
COS Hydrolysis Preheater
Air
Oxygen
Nitrogen
Coal/Char/Slurry/Slag
Synthesis Gas
Sour Water
Acid Gas
Tailgas
Carbon Dioxide
Sour Gas
Sulfur
Hydrogen
Water
W Flowrate, lbm/hr T Temperature, °FP Absolute Pressure, PSIAH Enthalpy, Btu/lbmMWe Power, Megawatts Electrical
Steam
Gross Plant Power: 704 MWeAuxiliary Load: 190 MWeNet Plant Power: 513 MWeNet Plant Efficiency, HHV: 31.0%Net Plant Heat Rate: 11,002 Btu/kWh
Notes:1. Enthalpy reference point is natural state
at 32 °F and 0.08865 psia

Cost and Performance Baseline for Fossil Energy Plants Volume 1b: Revision 2b
152
Exhibit 3-69 Case B4B combined cycle power generation heat and mass balance schematic
Source: NETL
DOE/NETL
DUAL TRAIN IGCC PLANTCASE B4B
HEAT AND MATERIAL FLOW DIAGRAM
BITUMINOUS BASELINE STUDYCASE B4B
COP GASIFIERPOWER BLOCK SYSTEM
DWG. NO.BB-HMB-CS-B4B-PG-3
PLANT PERFORMANCE SUMMARY
LEGEND
Air
Oxygen
Nitrogen
Coal/Char/Slurry/Slag
Synthesis Gas
PAGES3 OF 3
Sour Gas
Sour Water
Water
Steam
Flue Gas
W Flowrate, lbm/hr T Temperature, °FP Absolute Pressure, PSIAH Enthalpy, Btu/lbmMWe Power, Megawatts Electrical
HPTurbine
IPTurbine
Air Inlet Filter
Steam Seal Regulator
GlandSteam
Condenser
LP Turbine
Stack
ExpanderCompressor
Generator
GeneratorCondensate
Pumps
Steam Turbine
State-of-the-art 2008 F-Class Turbine
7,014,133 W59 T15 P13 H
2,068,815 W101 T
1 P69 H
8,446,417 W270 T15 P
150 H
213,363 W380 T460 P585 H
1,370,817 W994 T
1,815 P1,468 H
9,744 W298 T65 P
1,171 H
1,460,272 W465 T65 P
1,257 H
1,400 W615 T65 P
1,331 H
1,400 W212 T15 P
180 H
21
25
16
24
Hot Well
Condenser 596,381 W59 T15 P27 H
9,026 W660 T501 P
1,327 H
9,762 W615 T65 P
1,331 H
1,337 W505 T65 P
1,277 H
Preheater DeaeratorHeater
HP Economizer
1
LP Economizer
HP Economizer
2
HP Evaporator
Superheater/ Reheater
From Syngas Cooler
Blowdown Flash
Deaerator
LP Evaporator
From Claus, Process Extractions, and 250 PSIA Header
LP Extraction Spray
LP Blowdown Hot Reheat
8,446,417 W1,044 T
15 P361 H
23
To WWT
Condensate to Tail Gas Cooling
Process Extraction1,973,163 W
274 T45 P
242 H
26,434 W274 T79 P
242 H
9,866 W274 T79 P
242 H
1,398,140 W279 T
2,251 P247 H
353,694 W298 T65 P
266 H
235 T 305 T 585 T 636 T
300,993 W351 T
2,251 P319 H
300,993 W585 T
2,001 P585 H
27,273 W585 T
2,001 P585 H
923,082 W585 T
2,001 P585 H
636 T
265,292 W298 T65 P
1,171 H
1,195,395 W661 T501 P
1,327 H
205 T
761,167 W385 T469 P87 H
Steam to Gasifier168,786 W
650 T740 P
1,303 H
LP Extraction Spray #2
22,016 W241 T825 P209 H
Water Makeup
1,000 W994 T
1,815 P1,468 H
1,000 W212 T15 P
180 H
798 W994 T
1,815 P1,468 H 29,461 W
500 T250 P
1,255 H
IP Extraction Steam to 250 PSIA Header
LP Extraction Spray #1
2,068,815 W103 T120 P71 H
274 T
To Post Particulate
Cooler
From Post Particulate
Cooler
From ASU and Fuel Gas Preheater
To ASU and Fuel Gas Preheater
To Fire Tube Boiler
From Fire Tube Boiler
994 T
Nitrogen Diluent
Fuel Gas
Ambient Air
LP Pump
HP Pump
IP Pump
IP From Syngas and Pre Particulate Cooler
WGS Shift Steam
Cold Reheat
261,370 W550 T600 P
1,247 H
400,181 W550 T600 P
1,247 H
0 W
138,811 W550 T600 P
1,247 H
Gasifier Steam
LP To Syngas Coolers
264,385 W274 T79 P
242 H
LP From Syngas Coolers
264,385 W298 T65 P
1,171 H
IP to Pre Particulate and Syngas Coolers
58,909 W276 T615 P244 H
400,181 W275 T615 P243 H
IP To Claus
Gross Plant Power: 704 MWeAuxiliary Load: 190 MWeNet Plant Power: 513 MWeNet Plant Efficiency, HHV: 31.0%Net Plant Heat Rate: 11,002 Btu/kWh
Notes:1. Enthalpy reference point is natural state
at 32 °F and 0.08865 psia

Cost and Performance Baseline for Fossil Energy Plants Volume 1b: Revision 2b
153
This page intentionally left blank

Cost and Performance Baseline for Fossil Energy Plants Volume 1b: Revision 2b
154
Exhibit 3-70 Case B4B overall energy balance (0°C [32°F] reference)
HHV Sensible + Latent Power Total
Heat In (GJ/hr) Coal 5,960
(5,649) 5.0 (4.7) – 5,965
(5,654) Air – 119.4 (113.2) – 119.4
(113.2) Raw Water Makeup – 81.9 (77.7) – 81.9 (77.7)
Auxiliary Power – – 685 (649) 685 (649) TOTAL 5,960
(5,649) 206.4 (195.6) 685 (649) 6,851
(6,494) Heat Out (GJ/hr)
ASU Vent – 1.2 (1.2) – 1.2 (1.2) Slag 36.7 (34.8) 25.2 (23.9) – 61.9 (58.7)
Stack Gas – 1,334 (1,264) – 1,334 (1,264)
Sulfur 50.9 (48.3) 0.6 (0.6) – 51.5 (48.8) Motor Losses and Design
Allowances – – 58.6 (55.6) 58.6 (55.6)
Condenser – 1,408 (1,334) – 1,408 (1,334)
Non-Condenser Cooling Tower Loads – 801 (760) – 801 (760)
CO₂ – -74.7 (-70.8) – -74.7 (-70.8) Blowdown – 42.7 (40.5) – 42.7 (40.5)
CO₂ Capture Losses – 182.6 (173.0) – 182.6 (173.0)
Ambient LossesA – 168.2 (159.5) – 168.2 (159.5)
Power – – 2,533 (2,401)
2,533 (2,401)
TOTAL 87.6 (83.1) 3,889 (3,686) 2,592 (2,457)
6,569 (6,226)
Unaccounted EnergyB – 282 (268) – 282 (268) AAmbient losses include all losses to the environment through radiation, convection, etc. Sources of these losses include the combustor, reheater, superheater, and transformers. BBy difference
3.3.10 Case B4B - Major Equipment List Major equipment items for the E-GasTM gasifier with CO2 capture are shown in the following tables. The accounts used in the equipment list correspond to the account numbers used in the cost estimates in Section 3.3.11. In general, the design conditions include a 10 percent contingency for flows and heat duties and a 21 percent contingency for heads on pumps and fans.

Cost and Performance Baseline for Fossil Energy Plants Volume 1b: Revision 2b
155
Case B4B – Account 1: Coal Handling Equipment
No. Description Type Design Condition Operating Qty. Spares
1 Bottom Trestle Dumper and Receiving Hoppers N/A 181 tonne (200 ton) 2 0
2 Feeder Belt 570 tonne/hr (630 tph) 2 0 3 Conveyor No. 1 Belt 1,130 tonne/hr (1,250 tph) 1 0 4 Conveyor No. 2 Belt 1,130 tonne/hr (1,250 tph) 1 0 5 Stacker/Reclaimer Traveling, linear 1,130 tonne/hr (1,250 tph) 1 0 6 Reclaim Hopper N/A 50 tonne (50 ton) 2 1 7 Feeder Vibratory 180 tonne/hr (200 tph) 2 1 8 Conveyor No. 3 Belt w/ tripper 360 tonne/hr (400 tph) 1 0 9 Coal Surge Bin w/ Vent Filter Dual outlet 180 tonne (200 ton) 2 0
10 Crusher Impactor reduction 8 cm x 0 - 3 cm x 0 (3" x 0 - 1-1/4" x 0) 2 0
11 Conveyor No. 4 Belt w/ tripper 360 tonne/hr (400 tph) 1 0 12 Conveyor No. 5 Belt w/ tripper 360 tonne/hr (400 tph) 1 0
13 Coal Silo w/ Vent Filter and Slide Gates Field erected 800 tonne (900 ton) 3 0
Case B4B – Account 2: Coal Preparation and Feed Equipment
No. Description Type Design Condition Operating Qty. Spares
1 Feeder Vibratory 80 tonne/h (90 tph) 3 0 2 Conveyor No. 6 Belt w/ tripper 240 tonne/h (270 tph) 1 0 3 Rod Mill Feed Hopper Dual Outlet 480 tonne (530 ton) 1 0 4 Weigh Feeder Belt 120 tonne/h (130 tph) 2 0 5 Rod Mill Rotary 120 tonne/h (130 tph) 2 0
6 Slurry Water Storage Tank with Agitator Field erected 298,180 liters (78,770 gal) 2 0
7 Slurry Water Pumps Centrifugal 830 lpm (220 gpm) 2 1 8 Trommel Screen Coarse 170 tonne/h (190 tph) 2 0
9 Rod Mill Discharge Tank with Agitator Field erected 390,070 liters
(103,040 gal) 2 0
10 Rod Mill Product Pumps Centrifugal 3,300 lpm (900 gpm) 2 2
11 Slurry Storage Tank with Agitator Field erected 1,170,200 liters
(309,100 gal) 2 0
12 Slurry Recycle Pumps Centrifugal 6,500 lpm (1,700 gpm) 2 2
13 Slurry Product Pumps Positive displacement 3,300 lpm (900 gpm) 2 2
Case B4B – Account 3: Feedwater and Miscellaneous Systems and Equipment Equipment
No. Description Type Design Condition Operating Qty. Spares
1 Demineralized Water Storage Tank
Vertical, cylindrical, outdoor 1,100,000 liters (291,000 gal) 2 0
2 Condensate Pumps Vertical canned 8,660 lpm @ 90 m H₂O (2,290 gpm @ 300 ft H₂O) 2 1
3 Deaerator (integral w/ HRSG) Horizontal spray type 607,000 kg/hr (1,338,000
lb/hr) 2 0
4 Intermediate-Pressure Feedwater Pump
Horizontal centrifugal, single stage
8,540 lpm @ 30 m H₂O (2,260 gpm @ 90 ft H₂O) 2 1
5 High-Pressure Feedwater Pump No. 1
Barrel type, multi-stage, centrifugal
HP water: 6,050 lpm @ 1,800 m H₂O
(1,600 gpm @ 6,100 ft H₂O) 2 1
6 High-Pressure Feedwater Pump No. 2
Barrel type, multi-stage, centrifugal
IP water: 1,300 lpm @ 220 m H₂O (340 gpm @ 730 ft H₂O) 2 1

Cost and Performance Baseline for Fossil Energy Plants Volume 1b: Revision 2b
156
Equipment No. Description Type Design Condition Operating
Qty. Spares
7 Auxiliary Boiler Shop fabricated, water tube
18,000 kg/hr, 2.8 MPa, 343°C (40,000 lb/hr, 400 psig, 650°F) 1 0
8 Service Air Compressors Flooded Screw 28 m3/min @ 0.7 MPa
(1,000 scfm @ 100 psig) 2 1
9 Instrument Air Dryers Duplex, regenerative 28 m3/min (1,000 scfm) 2 1
10 Closed Cycle Cooling Heat Exchangers Plate and frame 441 GJ/hr
(418 MMBtu/hr) each 2 0
11 Closed Cycle Cooling Water Pumps Horizontal centrifugal 158,100 lpm @ 20 m H₂O
(41,800 gpm @ 70 ft H₂O) 2 1
12 Engine-Driven Fire Pump
Vertical turbine, diesel engine
3,785 lpm @ 110 m H₂O (1,000 gpm @ 350 ft H₂O) 1 1
13 Fire Service Booster Pump
Two-stage horizontal centrifugal
2,650 lpm @ 80 m H₂O (700 gpm @ 250 ft H₂O) 1 1
14 Raw Water Pumps Stainless steel, single suction
5,660 lpm @ 20 m H₂O (1,490 gpm @ 60 ft H₂O) 2 1
15 Ground Water Pumps Stainless steel, single suction
2,830 lpm @ 270 m H₂O (750 gpm @ 880 ft H₂O) 4 1
16 Filtered Water Pumps Stainless steel, single suction
3,070 lpm @ 50 m H₂O (810 gpm @ 160 ft H₂O) 2 1
17 Filtered Water Tank Vertical, cylindrical 1,471,000 liter (389,000 gal) 2 0
18 Makeup Water Demineralizer
Anion, cation, and mixed bed 1,850 lpm (490 gpm) 2 0
19 Liquid Waste Treatment System N/A 10 years, 24-hour storm 1 0
Case B4B – Account 4: Gasifier, ASU, and Accessories Including Low Temperature Heat Recovery and Fuel Gas Saturation Equipment
No. Description Type Design Condition Operating Qty. Spares
1 Gasifier Pressurized two-stage, slurry-feed entrained bed
2,900 tonne/day, 4.2 MPa (3,200 tpd, 615 psia) 2 0
2 Synthesis Gas Cooler Fire-tube boiler 338,000 kg/hr (745,000 lb/hr) 2 0
3 Synthesis Gas Cyclone High efficiency 338,000 kg/hr (745,000 lb/hr)
Design efficiency 90% 2 0
4 Candle Filter Pressurized filter with pulse-jet cleaning metallic filters 2 0
5 Syngas Scrubber Including Sour Water Stripper
Vertical upflow 338,000 kg/hr (745,000 lb/hr) 2 0
6 Raw Gas Coolers Shell and tube with condensate drain 386,000 kg/hr (851,000 lb/hr) 8 0
7 Raw Gas Knockout Drum
Vertical with mist eliminator
303,000 kg/hr, 35°C, 3.8 MPa (668,000 lb/hr, 95°F, 555 psia) 2 0
8 Saturation Water Economizers Shell and tube 36 GJ/hr (34 MMBtu/hr) 2 0
9 Fuel Gas Saturator Vertical tray tower 53,000 kg/hr, 108°C, 3.8 MPa (117,000 lb/hr, 227°F, 545 psia) 2 0
10 Saturator Water Pump Centrifugal 700 lpm @ 13 m H₂O
(200 gpm @ 42 ft H₂O) 2 2
11 Synthesis Gas Reheater Shell and tube 53,000 kg/hr (117,000 lb/hr) 2 0
12 Flare Stack Self-supporting, carbon steel, stainless steel top, pilot ignition
338,000 kg/hr (745,000 lb/hr) syngas 2 0
13 ASU Main Air Compressor Centrifugal, multi-stage 6,000 m3/min @ 1.3 MPa
(205,000 scfm @ 190 psia) 2 0

Cost and Performance Baseline for Fossil Energy Plants Volume 1b: Revision 2b
157
Equipment No. Description Type Design Condition Operating
Qty. Spares
14 Cold Box Vendor design 2,300 tonne/day (2,600 tpd) of 95% purity oxygen 2 0
15 Oxygen Compressor Centrifugal, multi-stage 1,000 m3/min (41,000 scfm) Suction - 1.0 MPa (130 psia)
Discharge - 5.1 MPa (740 psia) 2 0
16 Primary Nitrogen Compressor Centrifugal, multi-stage
4,000 m3/min (134,000 scfm) Suction - 0.4 MPa (60 psia)
Discharge - 2.7 MPa (390 psia) 2 0
17 Secondary Nitrogen Compressor
Centrifugal, single-stage
540 m3/min (19,000 scfm) Suction - 1.3 MPa (180 psia)
Discharge - 2.7 MPa (390 psia) 2 0
18 Gasifier Purge Nitrogen Boost Compressor
Centrifugal, single-stage
2,000 m3/min (57,000 scfm) Suction - 2.6 MPa (380 psia)
Discharge - 3.2 MPa (470 psia) 2 0
Case B4B – Account 5: Syngas Cleanup Equipment
No. Description Type Design Condition Operating Qty. Spares
1 Mercury Adsorber 1 Sulfated carbon bed 301,000 kg/hr (664,000 lb/hr), 35°C (95°F), 3.8 MPa (550 psia) 2 0
2 Mercury Adsorber 2 Sulfated carbon bed 301,000 kg/hr (664,000 lb/hr), 35°C (95°F), 3.8 MPa (550 psia) 2 0
3 Sulfur Plant Claus type 145 tonne/day (160 tpd) 1 0
4 Water Gas Shift Reactors Fixed bed, catalytic 206,000 kg/hr (454,000 lb/hr),
204°C (400°F), 4.1 MPa (590 psia) 4 0
5 Shift Reactor Heat Recovery Exchangers
Shell and Tube Exchanger 1: 94 GJ/hr (89
MMBtu/hr) Exchanger 2: 3 GJ/hr (3 MMBtu/hr)
4 0
6 Acid Gas Removal Plant Two-stage Selexol 316,000 kg/hr (697,000 lb/hr),
34°C (94°F), 3.8 MPa (545 psia) 2 0
7 Hydrogenation Reactor Fixed bed, catalytic
36,000 kg/hr (80,000 lb/hr), 232°C (450°F), 0.1 MPa (12.3
psia) 1 0
8 Tail Gas Recycle Compressor Centrifugal 30,000 kg/hr (67,000 lb/hr) each 1 0
9 CO₂ Compressor Integrally geared, multi-stage centrifugal
1,100 m3/min @ 15.3 MPa (40,300 scfm @ 2,215 psia) 4 0
Case B4B – Account 6: Combustion Turbine and Auxiliaries Equipment
No. Description Type Design Condition Operating Qty. Spares
1 Combustion Turbine State-of-the-art 2008 F-class 230 MW 2 0
2 Combustion Turbine Generator TEWAC 260 MVA @ 0.9 p.f., 24 kV, 60 Hz,
3-phase 2 0
Case B4B – Account 7: HRSG, Ducting, and Stack Equipment
No. Description Type Design Condition Operating Qty. Spares
1 Stack CS plate, type 409SS liner
76 m (250 ft) high x 8.5 m (28 ft) diameter 1 0
2 Heat Recovery Steam Generator
Drum, multi-pressure with economizer section and integral deaerator
Main steam - 341,986 kg/hr, 12.4 MPa/534°C
(753,949 lb/hr, 1,800 psig/994°F) 2 0

Cost and Performance Baseline for Fossil Energy Plants Volume 1b: Revision 2b
158
Case B4B – Account 8: Steam Turbine Generator and Auxiliaries Equipment
No. Description Type Design Condition Operating Qty. Spares
1 Steam Turbine
Commercially available advanced steam turbine
252 MW 12.4 MPa/534°C/534°C (1,800 psig/
994°F/994°F) 1 0
2 Steam Turbine Generator
Hydrogen cooled, static excitation
280 MVA @ 0.9 p.f., 24 kV, 60 Hz, 3-phase 1 0
3 Surface Condenser
Single pass, divided waterbox including vacuum pumps
1,550GJ/hr (1,470 MMBtu/hr), Inlet water temperature 16°C
(60°F), Water temperature rise 11°C (20°F)
1 0
4 Steam Bypass One per HRSG 50% steam flow @ design steam
conditions 2 0
Case B4B – Account 9: Cooling Water System Equipment
No. Description Type Design Condition Operating Qty. Spares
1 Circulating Water Pumps Vertical, wet pit 472,000 lpm @ 30 m
(125,000 gpm @ 100 ft) 2 1
2 Cooling Tower Evaporative, mechanical draft, multi-cell
11°C (51.5°F) wet bulb / 16°C (60°F) CWT / 27°C (80°F) HWT /
2,630 GJ/hr (2,490 MMBtu/hr) heat duty
1 0
Case B4B – Account 10: Slag Recovery and Handling Equipment
No. Description Type Design Condition Operating Qty. Spares
1 Slag Quench Tank Water bath 235,000 liters (62,000 gal) 2 0 2 Slag Crusher Roll 12 tonne/hr (14 tph) 2 0 3 Slag Depressurizer Proprietary 12 tonne/hr (14 tph) 2 0 4 Slag Receiving Tank Horizontal, weir 142,000 liters (37,000 gal) 2 0 5 Black Water Overflow Tank Shop fabricated 64,000 liters (17,000 gal) 2 0 6 Slag Conveyor Drag chain 12 tonne/hr (14 tph) 2 0 7 Slag Separation Screen Vibrating 12 tonne/hr (14 tph) 2 0 8 Coarse Slag Conveyor Belt/bucket 12 tonne/hr (14 tph) 2 0 9 Fine Ash Settling Tank Vertical, gravity 201,000 liters (53,000 gal) 2 0
10 Fine Ash Recycle Pumps Horizontal centrifugal 50 lpm @ 14 m H₂O (10 gpm @ 46 ft H₂O) 2 2
11 Grey Water Storage Tank Field erected 64,000 liters (17,000 gal) 2 0
12 Grey Water Pumps Centrifugal 230 lpm @ 430 m H₂O (60 gpm @ 1,420 ft H₂O) 2 2
13 Grey Water Recycle Heat Exchanger Shell and tube 52,200 kg/hr (30,000
lb/hr) 2 0
14 Slag Storage Bin Vertical, field erected 890 tonne (980 tons) 2 0 15 Unloading Equipment Telescoping chute 100 tonne/hr (110 tph) 1 0
Case B4B – Account 11: Accessory Electric Plant Equipment
No. Description Type Design Condition Operating Qty. Spares
1 CTG Transformer Oil-filled 24 kV/345 kV, 260 MVA, 3-ph, 60 Hz 2 0
2 STG Transformer Oil-filled 24 kV/345 kV, 230 MVA, 3-ph, 60 Hz 1 0
3 High Voltage Auxiliary Transformer Oil-filled 345 kV/13.8 kV, 79
MVA, 3-ph, 60 Hz 2 0

Cost and Performance Baseline for Fossil Energy Plants Volume 1b: Revision 2b
159
4 Medium Voltage Transformer Oil-filled 24 kV/4.16 kV, 51 MVA, 3-ph, 60 Hz 1 1
5 Low Voltage Transformer Dry ventilated 4.16 kV/480 V, 8 MVA, 3-ph, 60 Hz 1 1
6 CTG Isolated Phase Bus Duct and Tap Bus
Aluminum, self-cooled 24 kV, 3-ph, 60 Hz 2 0
7 STG Isolated Phase Bus Duct and Tap Bus
Aluminum, self-cooled 24 kV, 3-ph, 60 Hz 1 0
8 Medium Voltage Switchgear Metal clad 4.16 kV, 3-ph, 60 Hz 1 1 9 Low Voltage Switchgear Metal enclosed 480 V, 3-ph, 60 Hz 1 1
10 Emergency Diesel Generator Sized for emergency shutdown
750 kW, 480 V, 3-ph, 60 Hz 1 0
Case B4B – Account 12: Instrumentation and Control Equipment
No. Description Type Design Condition Operating Qty. Spares
1 DCS - Main Control
Monitor/keyboard; Operator printer (laser color); Engineering printer (laser B&W)
Operator stations/printers and engineering stations/printers
1 0
2 DCS - Data Highway Fiber optic Fully redundant, 25% spare 1 0
3.3.11 Case B4B - Cost Estimating Results The cost estimating methodology was described previously in Section 2.6. Exhibit 3-71 shows a detailed breakdown of the capital costs; Exhibit 3-72 shows the owner’s costs, TOC, and TASC; Exhibit 3-73 shows the initial and annual O&M costs; and Exhibit 3-74 shows the COE breakdown.
The estimated TPC of the E-GasTM gasifier with CO2 capture is $3,540/kW. Process contingency represents 4.1 percent of the TPC, and project contingency represents 13.9 percent. The COE, including CO2 T&S costs of $9.8/MWh, is $151.8/MWh.

Cost and Performance Baseline for Fossil Energy Plants Volume 1b: Revision 2b
160
Exhibit 3-71 Case B4B total plant cost details
Case: B4B – E-GasTM IGCC w/ CO₂ Estimate Type: Conceptual Plant Size (MW,net): 514 Cost Base: Jun 2011
Item Description Equipment Material Labor Bare Erected Eng'g CM Contingencies Total Plant Cost No. Cost Cost Direct Indirect Cost H.O.& Fee Process Project $/1,000 $/kW
1 Coal & Sorbent Handling 1.1 Coal Receive & Unload $4,536 $0 $2,186 $0 $6,722 $672 $0 $1,479 $8,873 $17 1.2 Coal Stackout & Reclaim $5,862 $0 $1,402 $0 $7,263 $726 $0 $1,598 $9,587 $19 1.3 Coal Conveyors & Yd Crush $5,450 $0 $1,387 $0 $6,836 $684 $0 $1,504 $9,024 $18 1.4 Other Coal Handling $1,426 $0 $321 $0 $1,747 $175 $0 $384 $2,306 $4 1.9 Coal & Sorbent Hnd. Foundations $0 $3,029 $7,916 $0 $10,945 $1,095 $0 $2,408 $14,447 $28
Subtotal $17,273 $3,029 $13,211 $0 $33,513 $3,351 $0 $7,373 $44,238 $86 2 Coal & Sorbent Prep & Feed
2.1 Coal Crushing & Drying w/2.3 $0 w/2.3 $0 $0 $0 $0 $0 $0 $0 2.2 Prepared Coal Storage & Feed $1,937 $465 $300 $0 $2,702 $270 $0 $594 $3,566 $7 2.3 Slurry Prep & Feed $26,425 $0 $11,591 $0 $38,015 $3,802 $0 $8,363 $50,180 $98 2.4 Misc. Coal Prep & Feed $1,065 $778 $2,292 $0 $4,135 $414 $0 $910 $5,459 $11 2.9 Coal & Sorbent Feed Foundation $0 $3,907 $3,352 $0 $7,259 $726 $0 $1,597 $9,582 $19
Subtotal $29,427 $5,150 $17,535 $0 $52,112 $5,211 $0 $11,465 $68,788 $134 3 Feedwater & Miscellaneous BOP Systems
3.1 Feedwater System $3,381 $5,834 $3,059 $0 $12,274 $1,227 $0 $2,700 $16,202 $32 3.2 Water Makeup & Pretreating $868 $90 $477 $0 $1,434 $143 $0 $473 $2,051 $4 3.3 Other Feedwater Subsystems $1,901 $628 $561 $0 $3,090 $309 $0 $680 $4,079 $8 3.4 Service Water Systems $507 $1,012 $3,488 $0 $5,007 $501 $0 $1,652 $7,160 $14 3.5 Other Boiler Plant Systems $2,735 $1,022 $2,515 $0 $6,272 $627 $0 $1,380 $8,279 $16 3.6 FO Supply Sys & Nat Gas $17,726 $693 $642 $0 $19,061 $1,906 $0 $4,193 $25,160 $49 3.7 Waste Treatment Equipment $1,174 $0 $727 $0 $1,901 $190 $0 $627 $2,719 $5 3.8 Misc. Power Plant Equipment $1,294 $173 $672 $0 $2,140 $214 $0 $706 $3,060 $6
Subtotal $29,586 $9,452 $12,142 $0 $51,179 $5,118 $0 $12,413 $68,710 $134 4 Gasifier & Accessories
4.1 Syngas Cooler Gasifier System $137,262 $0 $76,506 $0 $213,769 $21,377 $29,564 $40,623 $305,333 $594 4.2 Syngas Cooler w/4.1 $0 w/ 4.1 $0 $0 $0 $0 $0 $0 $0 4.3 ASU & Oxidant Compression $222,841 $0 w/equip. $0 $222,841 $22,284 $0 $24,513 $269,638 $525 4.4 LT Heat Recovery & FG Saturation $28,817 $0 $10,949 $0 $39,766 $3,977 $0 $8,749 $52,492 $102 4.5 Misc. Gasification Equipment w/4.1&4.2 $0 w/4.1&4.2 $0 $0 $0 $0 $0 $0 $0 4.6 Flare Stack System $0 $1,981 $801 $0 $2,782 $278 $0 $612 $3,672 $7 4.8 Major Component Rigging w/4.1&4.2 $0 w/4.1&4.2 $0 $0 $0 $0 $0 $0 $0 4.9 Gasification Foundations $0 $9,765 $5,824 $0 $15,589 $1,559 $0 $4,287 $21,434 $42
Subtotal $388,921 $11,746 $94,080 $0 $494,747 $49,475 $29,564 $78,784 $652,569 $1,271 5A Gas Cleanup & Piping
5A.1 Double Stage Selexol $162,818 $0 w/equip. $0 $162,818 $16,282 $32,564 $42,333 $253,996 $495 5A.2 Elemental Sulfur Plant $12,406 $2,418 $15,897 $0 $30,721 $3,072 $0 $6,759 $40,552 $79 5A.3 Mercury Removal $1,867 $0 $1,411 $0 $3,278 $328 $164 $754 $4,524 $9 5A.4 Shift Reactors $8,605 $0 $3,440 $0 $12,044 $1,204 $0 $2,650 $15,898 $31 5A.5 Particulate Removal w/4.1 $0 w/4.1 $0 $0 $0 $0 $0 $0 $0

Cost and Performance Baseline for Fossil Energy Plants Volume 1b: Revision 2b
161
Case: B4B – E-GasTM IGCC w/ CO₂ Estimate Type: Conceptual Plant Size (MW,net): 514 Cost Base: Jun 2011
Item Description Equipment Material Labor Bare Erected Eng'g CM Contingencies Total Plant Cost No. Cost Cost Direct Indirect Cost H.O.& Fee Process Project $/1,000 $/kW
5A.6 Blowback Gas Systems $657 $369 $206 $0 $1,232 $123 $0 $271 $1,626 $3 5A.7 Fuel Gas Piping $0 $926 $606 $0 $1,532 $153 $0 $337 $2,022 $4 5A.9 HGCU Foundations $0 $838 $565 $0 $1,403 $140 $0 $463 $2,007 $4
Subtotal $186,353 $4,551 $22,125 $0 $213,029 $21,303 $32,727 $53,566 $320,626 $624 5B CO₂ Compression
5B.2 CO₂ Compression & Drying $40,408 $6,061 $17,509 $0 $63,978 $6,398 $0 $14,075 $84,451 $164 Subtotal $40,408 $6,061 $17,509 $0 $63,978 $6,398 $0 $14,075 $84,451 $164 6 Combustion Turbine & Accessories
6.1 Combustion Turbine Generator $111,210 $0 $7,881 $0 $119,091 $11,909 $11,909 $14,291 $157,201 $306 6.9 Combustion Turbine Foundations $0 $923 $1,068 $0 $1,992 $199 $0 $657 $2,848 $6
Subtotal $111,210 $923 $8,950 $0 $121,083 $12,108 $11,909 $14,948 $160,049 $312 7 HRSG, Ducting, & Stack
7.1 Heat Recovery Steam Generator $29,570 $0 $5,725 $0 $35,295 $3,530 $0 $3,882 $42,707 $83 7.3 Ductwork $0 $2,109 $1,479 $0 $3,588 $359 $0 $789 $4,736 $9 7.4 Stack $4,071 $0 $1,519 $0 $5,590 $559 $0 $615 $6,763 $13 7.9 HRSG, Duct & Stack Foundations $0 $775 $778 $0 $1,553 $155 $0 $512 $2,221 $4
Subtotal $33,641 $2,884 $9,501 $0 $46,026 $4,603 $0 $5,799 $56,428 $110 8 Steam Turbine Generator
8.1 Steam TG & Accessories $36,358 $0 $5,336 $0 $41,695 $4,169 $0 $4,586 $50,450 $98 8.2 Turbine Plant Auxiliaries $219 $0 $500 $0 $719 $72 $0 $79 $870 $2 8.3 Condenser & Auxiliaries $3,130 $0 $1,764 $0 $4,894 $489 $0 $538 $5,922 $12 8.4 Steam Piping $15,068 $0 $6,534 $0 $21,603 $2,160 $0 $5,941 $29,703 $58 8.9 TG Foundations $0 $1,034 $1,827 $0 $2,861 $286 $0 $944 $4,091 $8
Subtotal $54,776 $1,034 $15,962 $0 $71,771 $7,177 $0 $12,089 $91,037 $177 9 Cooling Water System
9.1 Cooling Towers $4,540 $0 $1,466 $0 $6,006 $601 $0 $991 $7,597 $15 9.2 Circulating Water Pumps $2,187 $0 $164 $0 $2,351 $235 $0 $388 $2,974 $6 9.3 Circ. Water System Auxiliaries $190 $0 $27 $0 $217 $22 $0 $36 $274 $1 9.4 Circ. Water Piping $0 $8,426 $2,041 $0 $10,468 $1,047 $0 $2,303 $13,817 $27 9.5 Make-up Water System $480 $0 $660 $0 $1,140 $114 $0 $251 $1,505 $3 9.6 Component Cooling Water Sys $963 $1,152 $791 $0 $2,907 $291 $0 $639 $3,837 $7 9.9 Circ. Water System Foundations $0 $2,765 $4,913 $0 $7,678 $768 $0 $2,534 $10,980 $21
Subtotal $8,360 $12,344 $10,063 $0 $30,767 $3,077 $0 $7,142 $40,985 $80 10 Ash & Spent Sorbent Handling Systems
10.1 Slag Dewatering & Cooling $20,691 $0 $10,134 $0 $30,825 $3,083 $0 $3,391 $37,299 $73 10.2 Gasifier Ash Depressurization w/10.1 w/10.1 w/10.1 $0 $0 $0 $0 $0 $0 $0 10.3 Cleanup Ash Depressurization w/10.1 w/10.1 w/10.1 $0 $0 $0 $0 $0 $0 $0 10.6 Ash Storage Silos $680 $0 $734 $0 $1,414 $141 $0 $233 $1,789 $3 10.7 Ash Transport & Feed Equipment $935 $0 $218 $0 $1,154 $115 $0 $190 $1,459 $3 10.8 Misc. Ash Handling Equipment $1,408 $1,725 $512 $0 $3,644 $364 $0 $601 $4,610 $9 10.9 Ash/Spent Sorbent Foundation $0 $57 $75 $0 $132 $13 $0 $44 $189 $0
Subtotal $23,714 $1,782 $11,674 $0 $37,169 $3,717 $0 $4,459 $45,346 $88

Cost and Performance Baseline for Fossil Energy Plants Volume 1b: Revision 2b
162
Case: B4B – E-GasTM IGCC w/ CO₂ Estimate Type: Conceptual Plant Size (MW,net): 514 Cost Base: Jun 2011
Item Description Equipment Material Labor Bare Erected Eng'g CM Contingencies Total Plant Cost No. Cost Cost Direct Indirect Cost H.O.& Fee Process Project $/1,000 $/kW
11 Accessory Electric Plant 11.1 Generator Equipment $1,124 $0 $1,095 $0 $2,219 $222 $0 $244 $2,685 $5 11.2 Station Service Equipment $5,488 $0 $505 $0 $5,993 $599 $0 $659 $7,252 $14 11.3 Switchgear & Motor Control $10,130 $0 $1,883 $0 $12,013 $1,201 $0 $1,982 $15,196 $30 11.4 Conduit & Cable Tray $0 $5,147 $15,866 $0 $21,013 $2,101 $0 $5,779 $28,893 $56 11.5 Wire & Cable $0 $9,924 $6,038 $0 $15,961 $1,596 $0 $4,389 $21,947 $43 11.6 Protective Equipment $0 $799 $2,967 $0 $3,766 $377 $0 $621 $4,764 $9 11.7 Standby Equipment $269 $0 $268 $0 $536 $54 $0 $88 $678 $1 11.8 Main Power Transformers $19,358 $0 $167 $0 $19,525 $1,952 $0 $3,222 $24,699 $48 11.9 Electrical Foundations $0 $175 $477 $0 $652 $65 $0 $215 $933 $2
Subtotal $36,369 $16,045 $29,264 $0 $81,678 $8,168 $0 $17,200 $107,046 $208 12 Instrumentation & Control
12.1 IGCC Control Equipment w/4.1 $0 w/4.1 $0 $0 $0 $0 $0 $0 $0 12.2 Combustion Turbine Control w/6.1 $0 w/6.1 $0 $0 $0 $0 $0 $0 $0 12.3 Steam Turbine Control w/8.1 $0 w/8.1 $0 $0 $0 $0 $0 $0 $0 12.4 Other Major Component Control $1,292 $0 $880 $0 $2,173 $217 $109 $375 $2,873 $6 12.5 Signal Processing Equipment w/12.7 $0 w/12.7 $0 $0 $0 $0 $0 $0 $0 12.6 Control Boards, Panels & Racks $297 $0 $194 $0 $491 $49 $25 $113 $678 $1 12.7 Computer & Accessories $6,893 $0 $225 $0 $7,119 $712 $356 $819 $9,005 $18 12.8 Instrument Wiring & Tubing $0 $2,654 $5,023 $0 $7,677 $768 $384 $2,207 $11,035 $21 12.9 Other I & C Equipment $4,608 $0 $2,283 $0 $6,891 $689 $345 $1,189 $9,113 $18
Subtotal $13,090 $2,654 $8,606 $0 $24,350 $2,435 $1,217 $4,702 $32,705 $64 13 Improvements to Site
13.1 Site Preparation $0 $121 $2,743 $0 $2,864 $286 $0 $945 $4,095 $8 13.2 Site Improvements $0 $2,146 $3,033 $0 $5,179 $518 $0 $1,709 $7,406 $14 13.3 Site Facilities $3,845 $0 $4,316 $0 $8,161 $816 $0 $2,693 $11,670 $23
Subtotal $3,845 $2,266 $10,092 $0 $16,203 $1,620 $0 $5,347 $23,171 $45 14 Buildings & Structures
14.1 Combustion Turbine Area $0 $317 $179 $0 $496 $50 $0 $109 $655 $1 14.2 Steam Turbine Building $0 $2,691 $3,831 $0 $6,521 $652 $0 $1,076 $8,250 $16 14.3 Administration Building $0 $1,042 $756 $0 $1,798 $180 $0 $297 $2,274 $4 14.4 Circulation Water Pumphouse $0 $196 $104 $0 $299 $30 $0 $49 $378 $1 14.5 Water Treatment Buildings $0 $713 $696 $0 $1,409 $141 $0 $232 $1,782 $3 14.6 Machine Shop $0 $533 $365 $0 $898 $90 $0 $148 $1,136 $2 14.7 Warehouse $0 $861 $556 $0 $1,417 $142 $0 $234 $1,792 $3 14.8 Other Buildings & Structures $0 $516 $401 $0 $917 $92 $0 $202 $1,211 $2 14.9 Waste Treating Building & Str. $0 $1,153 $2,202 $0 $3,356 $336 $0 $738 $4,430 $9
Subtotal $0 $8,023 $9,089 $0 $17,112 $1,711 $0 $3,086 $21,909 $43 Total $976,972 $87,945 $289,801 $0 $1,354,718 $135,472 $75,418 $252,447 $1,818,056 $3,540
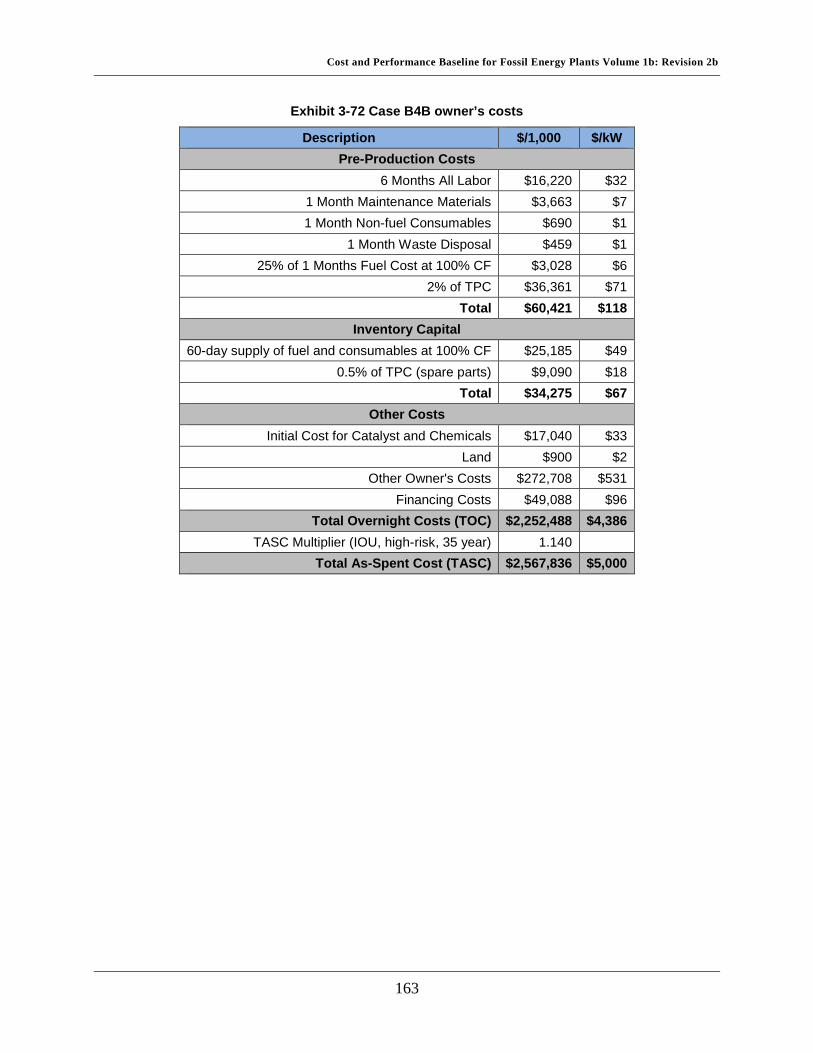
Cost and Performance Baseline for Fossil Energy Plants Volume 1b: Revision 2b
163
Exhibit 3-72 Case B4B owner’s costs
Description $/1,000 $/kW Pre-Production Costs
6 Months All Labor $16,220 $32 1 Month Maintenance Materials $3,663 $7 1 Month Non-fuel Consumables $690 $1
1 Month Waste Disposal $459 $1 25% of 1 Months Fuel Cost at 100% CF $3,028 $6
2% of TPC $36,361 $71 Total $60,421 $118
Inventory Capital 60-day supply of fuel and consumables at 100% CF $25,185 $49
0.5% of TPC (spare parts) $9,090 $18 Total $34,275 $67
Other Costs Initial Cost for Catalyst and Chemicals $17,040 $33
Land $900 $2 Other Owner's Costs $272,708 $531
Financing Costs $49,088 $96 Total Overnight Costs (TOC) $2,252,488 $4,386
TASC Multiplier (IOU, high-risk, 35 year) 1.140 Total As-Spent Cost (TASC) $2,567,836 $5,000

Cost and Performance Baseline for Fossil Energy Plants Volume 1b: Revision 2b
164
Exhibit 3-73 Case B4B initial and annual operating and maintenance costs Case: B4B – E-GasTM IGCC w/ CO₂ Cost Base: Jun 2011
Plant Size (MW,net): 514 Heat Rate-net (Btu/kWh): 11,002 Capacity Factor (%): 80 Operating & Maintenance Labor
Operating Labor Operating Labor Requirements per Shift Operating Labor Rate (base): 39.70 $/hour Skilled Operator: 2.0
Operating Labor Burden: 30.00 % of base Operator: 10.0 Labor O-H Charge Rate: 25.00 % of labor Foreman: 1.0
Lab Tech's, etc.: 3.0 Total: 16.0
Fixed Operating Costs Annual Cost ($) ($/kW-net)
Annual Operating Labor: $7,233,658 $14.084 Maintenance Labor: $18,718,137 $36.444
Administrative & Support Labor: $6,487,949 $12.632 Property Taxes and Insurance: $36,361,120 $70.795
Total: $68,800,863 $133.955 Variable Operating Costs
($) ($/MWh-net) Maintenance Material: $35,160,939 $9.76861
Consumables Consumption Cost ($) Initial Fill Per Day Per Unit Initial Fill
Water (/1000 gallons): 0 4,145 $1.67 $0 $2,026,257 $0.56295 Makeup and Waste Water
Treatment Chemicals (lbs): 0 24,697 $0.27 $0 $1,931,496 $0.53662
Carbon (Mercury Removal) (lb): 177,789 304 $5.50 $977,839 $488,920 $0.13583 Shift Catalyst (ft3): 6,484 4.44 $771.99 $5,005,557 $1,001,111 $0.27813
Selexol Solution (gal): 300,533 98 $36.79 $11,056,980 $1,055,946 $0.29337 Claus Catalyst (ft3): w/equip. 2.00 $203.15 $0 $118,896 $0.03303
Subtotal: $17,040,376 $6,622,626 $1.83994 Waste Disposal
Spent Mercury Catalyst (lb.): 0 304 $0.65 $0 $57,790 $0.01606 Flyash (ton): 0 0 $0.00 $0 $0 $0.00000
Slag (ton): 0 593 $25.11 $0 $4,348,431 $1.20811 Subtotal: $0 $4,406,221 $1.22416
By-Products Sulfur (tons): 0 145 $0.00 $0 $0 $0.00000
Subtotal: $0 $0 $0.00000 Variable Operating Costs Total: $17,040,376 $46,189,787 $12.83271
Fuel Cost Illinois Number 6 (ton): 0 5,811 $68.54 $0 $116,290,256 $32.30842
Total: $0 $116,290,256 $32.30842
Exhibit 3-74 Case B4B COE breakdown
Component Value, $/MWh Percentage Capital 77.6 55%
Fixed 19.1 13% Variable 12.8 9%
Fuel 32.3 23% Total (Excluding T&S) 141.9 N/A
CO2 T&S 9.9 7% Total (Including T&S) 151.8 N/A

Cost and Performance Baseline for Fossil Energy Plants Volume 1b: Revision 2b
165
3.4 General Electric Energy IGCC Cases This section contains an evaluation of three GEE plant designs (radiant-only [with and without CO2 capture] and quench-only [with CO2 capture]). Cases B5A and B5B are based on the GEE gasifier in the “radiant-only” configuration and Case B5B-Q is based on the GEE gasifier in the “quench-only” configuration. GEE offers three design configurations (50):
• Quench: In this configuration, the hot syngas exiting the gasifier passes through a pool of water to quench the temperature to 289°C (550°F) before entering the syngas scrubber. It is the simplest and lowest capital cost design, but also the least efficient.
• Radiant: In this configuration, the hot syngas exiting the gasifier passes through a radiant syngas cooler where it is cooled from about 1,316°C (2,400°F) to 677°C (1,250°F), and then passes through a water quench where the syngas is further cooled to about 232°C (450°F) prior to entering the syngas scrubber. Relative to the quench configuration, the radiant design offers increased output, higher efficiency, improved reliability/availability, and results in the lowest COE. This configuration was chosen by GEE and Bechtel for the design of their reference plant.
• Radiant-Convective: In this configuration, the hot syngas exiting the gasifier passes through a radiant syngas cooler where it is cooled from about 1,316°C (2,400°F) to 760°C (1,400°F), then passes over a pool of water where particulate is removed but the syngas is not quenched, then through a convective syngas cooler where the syngas is further cooled to about 371°C (700°F) prior to entering additional heat exchangers or the scrubber. This configuration has the highest overall efficiency, but at the expense of highest capital cost and the lowest availability. This is the configuration used at Tampa Electric’s Polk Power Station.
Note that the radiant configuration includes a water quench and, based on functionality, would be more appropriately named radiant-quench. The term radiant is used to distinguish it from the radiant-convective configuration. Since radiant is the terminology used by GEE, it will be used throughout this report.
The balance of this section is organized in an analogous manner to Sections 3.2 and 3.3:
• Gasifier Background • Process System Description for Case B5A • Key Assumptions for Cases B5A, B5B, and B5B-Q • Sparing Philosophy for Cases B5A, B5B, and B5B-Q • Performance Results for Case B5A • Equipment List for Case B5A • Cost Estimates for Case B5A • Process and System Description, Performance Results, Equipment List, and Cost
Estimate for Cases B5B and B5B-Q
3.4.1 Gasifier Background As mentioned in Sections 3.2.1 and 3.3.1, the “Coal Gasification Guidebook: Status, Application, and Technologies” report published by the EPRI provides a detailed history of the development of several types of gasifier technology, including the GEE gasifier, as well as gasifier capacity, distinguishing characteristics, and important coal characteristics. (46)

Cost and Performance Baseline for Fossil Energy Plants Volume 1b: Revision 2b
166
The largest GEE gasifier is the unit at Tampa Electric, which consists of the radiant-convective configuration. The daily coal-handling capacity of this unit is 2,268 tonnes (2,500 tons) of bituminous coal. The dry gas production rate is 0.19 million Nm3/hr (6.7 million scfh) with an energy content of about 1,897 million kJ/hr (HHV) (1,800 million Btu/hr). This size matches the F-Class CTs that are used at Tampa.
The GEE gasifier operates at the highest pressure of the three gasifiers in this report, 5.6 MPa (815 psia) compared to 4.2 MPa (615 psia) for E-GasTM and Shell. The relatively high H2/CO ratio and CO2 content of GEE gasification fuel gas helps achieve low NOx and CO emissions in even the higher-temperature advanced CTs. (46)
In contrast to the Shell and E-GasTM gasification technologies, the GEE gasifier has a relatively low refractory life and a high oxygen requirement. These characteristics are more prevalent in the single-stage quench design, with a lower efficiency. However, the quench design has a significantly lower capital cost for syngas cooling. (46) Coals with low concentrations of ash and soluble salts are preferred for use with the GEE gasifiers, as high levels of ash increase the oxygen requirement and soluble salts may build-up in concentration with high levels of process condensate recycle is used. (46)
The slurry feeding also favors the use of high-rank coals, such as bituminous coal, since their low inherent moisture content increases the moisture-free solids content of the slurry and thereby reduces oxygen requirements. (46)
3.4.2 Process Description In this section the overall GEE gasification process is described. The system description follows the BFD in Exhibit 3-75 and stream numbers reference the same exhibit. The tables in Exhibit 3-76 provide stream compositions, temperature, pressure, enthalpy, and flow rates for the numbered streams in the BFD.
3.4.2.1 Coal Grinding and Slurry Preparation Coal receiving and handling is common to all cases and was covered in Section 3.1.1. The receiving and handling subsystem ends at the coal silo. Coal is then fed onto a conveyor by vibratory feeders located below each silo. The conveyor feeds the coal to an inclined conveyor that delivers the coal to the rod mill feed hopper. The feed hopper provides a surge capacity of about two hours and contains two hopper outlets. Each hopper outlet discharges onto a weigh feeder, which in turn feeds a rod mill. Each rod mill is sized to process 55 percent of the coal feed requirements of the gasifier. The rod mill grinds the coal and wets it with treated slurry water transferred from the slurry water tank by the slurry water pumps. The coal slurry is discharged through a trommel screen into the rod mill discharge tank, and then the slurry is pumped to the slurry storage tanks. The dry solids concentration of the final slurry is 63 percent. The Polk Power Station operates at a slurry concentration of 62-68 percent using bituminous coal, and ConocoPhillips presented a paper showing the slurry concentration of Illinois No. 6 coal as 63 percent. (49)
The coal grinding system is equipped with a dust suppression system consisting of water sprays aided by a wetting agent. The degree of dust suppression required depends on local environmental regulations. All of the tanks are equipped with vertical agitators to keep the coal slurry solids suspended.

Cost and Performance Baseline for Fossil Energy Plants Volume 1b: Revision 2b
167
The equipment in the coal grinding and slurry preparation system is fabricated of materials appropriate for the abrasive environment present in the system. The tanks and agitators are rubber lined. The pumps are either rubber-lined or hardened metal to minimize erosion. Piping is fabricated of high-density polyethylene (HDPE).
3.4.2.2 Gasification This plant utilizes two gasification trains to process a total of 5,083 tonnes/day (5,603 tpd) of Illinois No. 6 coal. Each of the 2 x 50 percent gasifiers operates at maximum capacity. The largest operating GEE gasifier is the 2,268 tonne/day (2,500 tpd) unit at Polk Power Station. However, that unit operates at about 2.8 MPa (400 psia). The gasifier in this report, which operates at 5.6 MPa (815 psia), will be able to process more coal and maintain the same gas residence time.
The slurry feed pump takes suction from the slurry run tank, and the discharge is sent to the feed injector of the GEE gasifier (stream 6). Oxygen from the ASU is vented during preparation for startup and is sent to the feed injector during normal operation. The air separation plant supplies 4,171 tonnes/day (4,597 tpd) of 95 mol% oxygen to the gasifiers (stream 5) and the Claus plant (stream 3). Carbon conversion in the gasifier is assumed to be 98 percent, including a fines recycle stream.
The gasifier vessel is a refractory-lined, HP combustion chamber. The coal slurry feedstock and oxygen are fed through a fuel injector at the top of the gasifier vessel. The coal slurry and the oxygen react in the gasifier at 5.6 MPa (815 psia) and 1,316°C (2,400°F) to produce syngas. The syngas consists primarily of hydrogen and carbon monoxide, with lesser amounts of water vapor and carbon dioxide, and small amounts of hydrogen sulfide, COS, methane, argon, and nitrogen. The heat in the gasifier liquefies coal ash. Hot syngas and molten solids from the reactor flow downward into a radiant heat exchanger where the syngas is cooled.
3.4.2.3 Raw Gas Cooling/Particulate Removal Syngas is cooled from 1,316°C (2,400°F) to 677°C (1,250°F) in the radiant SGC (stream 9), and the molten slag solidifies in the process. The solids collect in the water sump at the bottom of the gasifier and are removed periodically using a lock hopper system (stream 8). The waste heat from this cooling is used to generate HP steam. BFW in the tubes is saturated, and then steam and water are separated in a steam drum. Approximately 412,096 kg/hr (908,500 lb/hr) of saturated steam at 13.8 MPa (2,000 psia) is produced. This steam then forms part of the general heat recovery system that provides steam to the steam turbine.
The syngas exiting the radiant cooler is directed downwards by a dip tube into a water sump. Most of the entrained solids are separated from the syngas at the bottom of the dip tube as the syngas goes upwards through the water. The syngas exits the quench chamber saturated at a temperature of 232°C (450°F).
The slag handling system removes solids from the gasification process equipment. These solids consist of a small amount of unconverted carbon and essentially all of the ash contained in the feed coal. These solids are in the form of glass, which fully encapsulates any metals. Solids collected in the water sump below the radiant SGC are removed by gravity and forced circulation of water from the lock hopper circulating pump. The fine solids not removed from the bottom of the quench water sump remain entrained in the water circulating through the quench chamber. In

Cost and Performance Baseline for Fossil Energy Plants Volume 1b: Revision 2b
168
order to limit the amount of solids recycled to the quench chamber, a continuous blowdown stream is removed from the bottom of the syngas quench. The blowdown is sent to the vacuum flash drum in the black water flash section. The circulating quench water is pumped by circulating pumps to the quench gasifier.
3.4.2.4 Syngas Scrubber/Sour Water Stripper Syngas exiting the water quench passes to a syngas scrubber where a water wash is used to remove remaining chlorides, NH3, SO2, and PM. The syngas exits the scrubber still saturated at 206°C (403°F) before it is preheated to 223°C (433°F) (stream 10) prior to entering the COS hydrolysis reactor.
The sour water stripper removes NH3, SO2, and other impurities from the scrubber and other waste streams. The stripper consists of a sour drum that accumulates sour water from the gas scrubber and condensate from SGCs. Sour water from the drum flows to the sour stripper, which consists of a packed column with a steam-heated reboiler. Sour gas is stripped from the liquid and sent to the SRU. Remaining water is sent to wastewater treatment.

Cost and Performance Baseline for Fossil Energy Plants Volume 1b: Revision 2b
169
Exhibit 3-75 Case B5A block flow diagram, GEE IGCC without CO2 capture
Source: NETL
GAS TURBINE
COMBUSTOR
QUENCH AND
SYNGASSCRUBBER
GAS COOLINGBFW HEATING& KNOCKOUT
COSHYDROLYSIS
ELEVATEDPRESSURE
ASU
GEE GASIFIERSECTION(RADIANTCOOLER)
SOURWATER
STRIPPER
MERCURYREMOVAL
SELEXOL UNIT
CLAUSPLANT
SYNGASH/P
REHEAT
HRSG
2X STATE-OF-THE-ART F-CLASS
GAS TURBINES
1
AIR TO ASU
2 3
VENTGAS
5
6 8
GASIFIEROXIDANT
AS-RECEIVED COAL
SLAG
9
10
11 12 13
1415
17
18
194
20
21
TURBINE COOLING AIR
22
WATER RECYCLE TO PROCESS DEMAND
AMBIENT AIR
FLUE GAS
STACK GAS
SYNGAS EXPANDER
NOTE: WATER FROM TAIL GAS COOLER MODELED,
BUT NOT SHOWN
HYDROGENATION REACTOR AND GAS
COOLER
16
TAIL GAS RECYCLE TO SELEXOL
NOTE: TAIL GAS BOOST COMPRESSOR MODELED, BUT
NOT SHOWN
CLEAN GAS
NITROGEN DILUENT
AIR
SULFUR PRODUCT
SYNGAS
CLAUS PLANT OXIDANT
23CLAUS PLANT
OXIDANT
STEAM TURBINE
24Note: Block Flow Diagram is not intended to represent a complete material balance. Only major process streams and equipment are shown.
SLURRY MIXER
7
SLURRY WATER

Cost and Performance Baseline for Fossil Energy Plants Volume 1b: Revision 2b
170
Exhibit 3-76 Case B5A stream table, GEE IGCC without capture 1 2 3 4 5 6 7 8 9 10 11 12 13 14
V-L Mole Fraction Ar 0.0092 0.0234 0.0318 0.0023 0.0318 0.0000 0.0000 0.0000 0.0086 0.0068 0.0068 0.0099 0.0097 0.0000 CH4 0.0000 0.0000 0.0000 0.0000 0.0000 0.0000 0.0000 0.0000 0.0012 0.0009 0.0009 0.0013 0.0013 0.0000 CO 0.0000 0.0000 0.0000 0.0000 0.0000 0.0000 0.0000 0.0000 0.3579 0.2825 0.2825 0.4151 0.3977 0.0002 CO2 0.0003 0.0081 0.0000 0.0000 0.0000 0.0000 0.0000 0.0000 0.1366 0.1078 0.1079 0.1586 0.1811 0.6124 COS 0.0000 0.0000 0.0000 0.0000 0.0000 0.0000 0.0000 0.0000 0.0002 0.0001 0.0000 0.0000 0.0000 0.0000 H2 0.0000 0.0000 0.0000 0.0000 0.0000 0.0000 0.0000 0.0000 0.3416 0.2696 0.2696 0.3961 0.3812 0.0000 H2O 0.0099 0.2084 0.0000 0.0003 0.0000 0.0000 0.9994 0.0000 0.1358 0.3181 0.3180 0.0012 0.0012 0.0128 HCl 0.0000 0.0000 0.0000 0.0000 0.0000 0.0000 0.0000 0.0000 0.0008 0.0002 0.0002 0.0000 0.0000 0.0000 H2S 0.0000 0.0000 0.0000 0.0000 0.0000 0.0000 0.0000 0.0000 0.0073 0.0057 0.0059 0.0085 0.0086 0.1817 N2 0.7732 0.5614 0.0178 0.9919 0.0178 0.0000 0.0000 0.0000 0.0080 0.0063 0.0063 0.0092 0.0191 0.1905 NH3 0.0000 0.0000 0.0000 0.0000 0.0000 0.0000 0.0006 0.0000 0.0021 0.0020 0.0020 0.0000 0.0000 0.0000 O2 0.2074 0.1987 0.9504 0.0054 0.9504 0.0000 0.0000 0.0000 0.0000 0.0000 0.0000 0.0000 0.0000 0.0023 SO2 0.0000 0.0000 0.0000 0.0000 0.0000 0.0000 0.0000 0.0000 0.0000 0.0000 0.0000 0.0000 0.0000 0.0000 Total 1.0000 1.0000 1.0000 1.0000 1.0000 0.0000 1.0000 0.0000 1.0000 1.0000 1.0000 1.0000 1.0000 1.0000 V-L Flowrate (kgmole/hr) 21,872 1,065 102 19,382 5,298 0 4,829 0 22,212 28,142 28,142 19,153 19,992 951 V-L Flowrate (kg/hr) 631,159 28,895 3,290 543,851 170,484 0 87,000 0 446,029 552,590 552,590 390,592 422,589 36,883 Solids Flowrate (kg/hr) 0 0 0 0 0 211,781 0 23,236 0 0 0 0 0 0
Temperature (°C) 15 20 32 93 32 15 146 1,316 677 223 223 35 35 45 Pressure (MPa, abs) 0.10 0.11 0.86 2.65 0.86 0.10 5.79 5.62 5.55 5.48 5.41 5.24 5.21 5.17 Steam Table Enthalpy (kJ/kg) A 30.23 36.81 26.67 92.52 26.67 --- 558.58 --- 1,427.78 1,067.54 1,067.44 40.35 36.92 -1.24 AspenPlus Enthalpy (kJ/kg)B -97.58 -2,311.18 4.13 63.39 4.13 -2,116.95 -15,404.71 -727.24 -5,219.35 -7,386.27 -7,386.27 -5,336.38 -5,478.96 -6,427.70 Density (kg/m3) 1.2 1.6 11.0 24.4 11.0 --- 866.9 --- 13.9 26.7 26.3 41.9 43.4 95.0 V-L Molecular Weight 28.857 27.130 32.181 28.060 32.181 --- 18.015 --- 20.081 19.636 19.636 20.393 21.138 38.795
V-L Flowrate (lbmole/hr) 48,220 2,348 225 42,729 11,679 0 10,647 0 48,969 62,042 62,042 42,225 44,075 2,096 V-L Flowrate (lb/hr) 1,391,468 63,703 7,253 1,198,986 375,853 0 191,802 0 983,326 1,218,253 1,218,253 861,109 931,649 81,312 Solids Flowrate (lb/hr) 0 0 0 0 0 466,898 0 51,227 0 0 0 0 0 0
Temperature (°F) 59 68 90 199 90 59 295 2,400 1,250 433 433 95 94 112 Pressure (psia) 14.7 16.4 125.0 384.0 125.0 14.7 840.0 815.0 805.0 795.0 785.0 760.0 755.0 750.0 Steam Table Enthalpy (Btu/lb)A 13.0 15.8 11.5 39.8 11.5 --- 240.1 --- 613.8 459.0 458.9 17.3 15.9 -0.5 AspenPlus Enthalpy (Btu/lb)B -42.0 -993.6 1.8 27.3 1.8 -910.1 -6,622.8 -312.7 -2,243.9 -3,175.5 -3,175.5 -2,294.2 -2,355.5 -2,763.4 Density (lb/ft3) 0.076 0.098 0.687 1.521 0.687 --- 54.120 --- 0.870 1.665 1.643 2.617 2.712 5.932
ASteam table reference conditions are 32.02°F & 0.089 psia BAspen thermodynamic reference state is the component’s constituent elements in an ideal gas state at 25°C and 1 atm

Cost and Performance Baseline for Fossil Energy Plants Volume 1b: Revision 2b
171
Exhibit 3-76 Case B5A stream table, GEE IGCC without capture (continued) 15 16 17 18 19 20 21 22 23 24
V-L Mole Fraction Ar 0.0000 0.0040 0.0100 0.0100 0.0100 0.0092 0.0092 0.0089 0.0089 0.0000 CH4 0.0000 0.0000 0.0013 0.0013 0.0013 0.0000 0.0000 0.0000 0.0000 0.0000 CO 0.0000 0.0021 0.4089 0.4089 0.4089 0.0000 0.0000 0.0000 0.0000 0.0000 CO2 0.0000 0.6947 0.1562 0.1562 0.1562 0.0003 0.0003 0.0807 0.0807 0.0000 COS 0.0000 0.0001 0.0000 0.0000 0.0000 0.0000 0.0000 0.0000 0.0000 0.0000 H2 0.0000 0.0415 0.3920 0.3920 0.3920 0.0000 0.0000 0.0000 0.0000 0.0000 H2O 0.0000 0.0018 0.0006 0.0006 0.0006 0.0099 0.0099 0.0638 0.0638 1.0000 HCl 0.0000 0.0000 0.0000 0.0000 0.0000 0.0000 0.0000 0.0000 0.0000 0.0000 H2S 0.0000 0.0111 0.0000 0.0000 0.0000 0.0000 0.0000 0.0000 0.0000 0.0000 N2 0.0000 0.2448 0.0309 0.0309 0.0309 0.7732 0.7732 0.7427 0.7427 0.0000 NH3 0.0000 0.0000 0.0000 0.0000 0.0000 0.0000 0.0000 0.0000 0.0000 0.0000 O2 0.0000 0.0000 0.0000 0.0000 0.0000 0.2074 0.2074 0.1039 0.1039 0.0000 SO2 0.0000 0.0000 0.0000 0.0000 0.0000 0.0000 0.0000 0.0000 0.0000 0.0000 Total 0.0000 1.0000 1.0000 1.0000 1.0000 1.0000 1.0000 1.0000 1.0000 1.0000 V-L Flowrate (kgmole/hr) 0 839 19,445 19,445 19,445 110,253 4,410 136,883 136,883 35,596 V-L Flowrate (kg/hr) 0 31,996 397,044 397,044 397,044 3,181,557 127,262 3,995,191 3,995,191 641,268 Solids Flowrate (kg/hr) 5,307 0 0 0 0 0 0 0 0 0
Temperature (°C) 174 38 45 241 196 15 432 589 132 561 Pressure (MPa, abs) 0.41 5.51 5.17 5.14 3.17 0.10 1.62 0.10 0.10 12.51 Steam Table Enthalpy (kJ/kg) A --- -5.04 54.55 365.19 296.11 30.23 463.79 741.45 235.13 3,502.79 AspenPlus Enthalpy (kJ/kg)B 138.98 -7,219.57 -5,220.07 -4,909.43 -4,978.51 -97.58 335.98 -999.91 -1,506.23 -12,467.52 Density (kg/m3) 5,288.2 97.7 40.0 24.1 16.4 1.2 7.9 0.4 0.9 35.1 V-L Molecular Weight --- 38.145 20.419 20.419 20.419 28.857 28.857 29.187 29.187 18.015
V-L Flowrate (lbmole/hr) 0 1,849 42,869 42,869 42,869 243,066 9,723 301,776 301,776 78,475 V-L Flowrate (lb/hr) 0 70,540 875,333 875,333 875,333 7,014,133 280,565 8,807,888 8,807,888 1,413,754 Solids Flowrate (lb/hr) 11,699 0 0 0 0 0 0 0 0 0
Temperature (°F) 345 100 112 465 386 59 810 1,093 270 1,043 Pressure (psia) 59.3 799.5 750.0 745.0 460.0 14.7 234.9 15.2 15.2 1,814.7 Steam Table Enthalpy (Btu/lb)A --- -2.2 23.5 157.0 127.3 13.0 199.4 318.8 101.1 1,505.9 AspenPlus Enthalpy (Btu/lb)B 59.8 -3,103.9 -2,244.2 -2,110.7 -2,140.4 -42.0 144.4 -429.9 -647.6 -5,360.1 Density (lb/ft3) 330.129 6.098 2.499 1.508 1.026 0.076 0.495 0.027 0.057 2.191
ASteam table reference conditions are 32.02°F & 0.089 psia BAspen thermodynamic reference state is the component’s constituent elements in an ideal gas state at 25°C and 1 atm

Cost and Performance Baseline for Fossil Energy Plants Volume 1b: Revision 2b
172
3.4.2.5 COS Hydrolysis, Mercury Removal and Acid Gas Removal Syngas exiting the scrubber (stream 10) passes through a COS hydrolysis reactor where about 99.5 percent of the COS is converted to CO2 and H2S (Section 3.1.5). The gas exiting the COS reactor (stream 11) passes through a series of heat exchangers and knockout (KO) drums to lower the syngas temperature to 35°C (95°F) and to separate entrained water. The cooled syngas (stream 12) then passes through dual carbon beds to remove approximately 97 percent of the Hg (Section 3.1.4).
Cool, particulate-free syngas (stream 13) enters the Selexol absorber unit at approximately 5.2 MPa (755 psia) and 34°C (94°F). In this absorber, H2S is preferentially removed from the fuel gas stream along with smaller amounts of CO2, COS, and other gases, such as hydrogen. The rich solution leaving the bottom of the absorber is heated against the lean solvent returning from the regenerator before entering the H2S concentrator. A portion of the non-sulfur bearing absorbed gases is driven from the solvent in the H2S concentrator using N2 from the ASU as the stripping medium. The temperature of the H2S concentrator overhead stream is reduced prior to entering the reabsorber where a second stage of H2S absorption occurs. The rich solvent from the reabsorber is combined with the rich solvent from the absorber and sent to the stripper where it is regenerated through the indirect application of thermal energy via condensation of LP steam in a reboiler. The stripper acid gas stream (stream 14), consisting of 18 percent H2S and 61 percent CO2 (with the balance mostly N2), is then sent to the Claus unit.
3.4.2.6 Claus Unit Acid gas from the first-stage stripper of the Selexol unit is routed to the Claus plant. The Claus plant partially oxidizes the H2S in the acid gas to elemental sulfur. About 5,307 kg/hr (11,699 lb/hr) of elemental sulfur (stream 15) are recovered from the fuel gas stream. This value represents an overall sulfur recovery efficiency of 99.6 percent.
Acid gas from the Selexol unit is preheated to 232°C (450°F). A portion of the acid gas along with all of the sour gas from the stripper and oxygen from the ASU are fed to the Claus furnace. In the furnace, H2S is catalytically oxidized to SO2 at a furnace temperature greater than 1,343°C (2,450°F), which must be maintained in order to thermally decompose all of the NH3 present in the sour gas stream.
Following the thermal stage and condensation of sulfur, two reheater and two sulfur converters are used to obtain a per-pass H2S conversion of approximately 99.9 percent. The Claus Plant tail gas is hydrogenated and recycled back to the Selexol process (stream 16). In the furnace waste heat boiler, 12,432 kg/hr (27,408 lb/hr) of 4.2 MPa (605 psia) steam are generated. This steam is used to satisfy all Claus process preheating and reheating requirements as well as to produce some steam for the medium-pressure steam header. The sulfur condensers produce 0.34 MPa (50 psig) of steam for the LP steam header and 2.9 MPa (415 psig) for IP steam.
3.4.2.7 Power Block Clean syngas exiting the Selexol absorber is re-heated (stream 18) using HP BFW and then expanded to 3.2 MPa (460 psia) using an expansion turbine (stream 19). The syngas stream is diluted with nitrogen from the ASU (stream 4) and enters the state-of-the-art 2008 F-class CT burner. The CT compressor provides combustion air to the burner and also 17 percent of the air requirements in the ASU (stream 21). The exhaust gas exits the CT at 589°C (1,093°F) (stream 22) and enters the HRSG where additional heat is recovered until the flue gas exits the HRSG at

Cost and Performance Baseline for Fossil Energy Plants Volume 1b: Revision 2b
173
132°C (270°F) (stream 23) and is discharged through the plant stack. The steam raised in the HRSG is used to power an advanced, commercially available steam turbine using a 12.4 MPa/562°C/562°C (1,800 psig/1,043°F/1,043°F) steam cycle 132°C (270°F) (stream 23) and is discharged through the plant stack. The steam raised in the HRSG is used to power an advanced, commercially available steam turbine using a 12.4 MPa/562°C/562°C (1,800 psig/1,043°F/1,043°F) steam cycle.
3.4.2.8 Air Separation Unit The elevated pressure ASU was described in Section 3.1.2. In Case B5A the ASU is designed to produce a nominal output of 4,171 tonnes/day (4,597 tpd) of 95 mol% O2 for use in the gasifier (stream 5) and Claus plant (stream 3). The plant is designed with two production trains. The air compressor is powered by an electric motor. Approximately 13,051 tonnes/day (14,387 tpd) of nitrogen is also recovered, compressed, and used for dilution in the CT combustor (stream 4). About 4 percent of the CT air is used to supply approximately 17 percent of the ASU air requirements (stream 21) in the non-capture case.
3.4.2.9 Balance of Plant Balance of plant items were covered in Sections 3.1.9, 3.1.10, and 3.1.12.
3.4.3 Key System Assumptions System assumptions for cases B5A, B5B, and B5B-Q, GEE IGCC with and without CO2 capture, are presented in Exhibit 3-77.

Cost and Performance Baseline for Fossil Energy Plants Volume 1b: Revision 2b
174
Exhibit 3-77 GEE IGCC plant study configuration matrix
Case B5A B5B B5B-Q Gasifier Pressure, MPa (psia) 5.6 (815) 5.6 (815) 5.6 (815)
O2:Coal Ratio, kg O2/kg dry coal 0.91 0.91 0.91
Carbon Conversion, % 98 98 98
Syngas HHV at Gasifier Outlet, kJ/Nm3 (Btu/scf) 8,663 (233) 8,644 (232) 8,655 (232)
Steam Cycle, MPa/°C/°C (psig/°F/°F)
12.4/562/562 (1,800/1,043/1,043)
12.4/534/534 (1,800/994/994)
12.4/534/534 (1,800/994/994)
Condenser Pressure, mm Hg (in Hg)
51 (2.0) 51 (2.0) 51 (2.0)
Combustion Turbine 2x State-of-the-Art 2008
F-Class (232 MW output each)
2x State-of-the-Art 2008 F-Class
(232 MW output each)
2x State-of-the-Art 2008 F-Class
(232 MW output each)
Gasifier Technology GEE Radiant GEE Radiant GEE Quench
Oxidant 95 vol% Oxygen 95 vol% Oxygen 95 vol% Oxygen
Coal Illinois No. 6 Illinois No. 6 Illinois No. 6
Coal Slurry Solids Content, % 63 63 63
COS Hydrolysis Yes Occurs in SGS Occurs in SGS
Sour Gas Shift No Yes Yes
H2S Separation Selexol Selexol 1st Stage Selexol 1st Stage
Sulfur Removal, % 99.7 99.9 99.8
Sulfur Recovery Claus Plant with Tail Gas
Recycle to Selexol/ Elemental Sulfur
Claus Plant with Tail Gas Recycle to Selexol/
Elemental Sulfur
Claus Plant with Tail Gas Recycle to Selexol/
Elemental Sulfur
Particulate Control Water Quench, Scrubber, and AGR Absorber
Water Quench, Scrubber, and AGR Absorber
Water Quench, Scrubber, and AGR Absorber
Mercury Control Carbon Bed Carbon Bed Carbon Bed
NOx Control Multi Nozzle Quiet
Combustor (MNQC) (LNB) and N2 Dilution
MNQC (LNB) and N2 Dilution
MNQC (LNB) and N2 Dilution
CO2 Separation N/A Selexol 2nd Stage Selexol 2nd Stage
Overall Carbon Capture N/A 90.0% 90.0%
CO2 Sequestration N/A Off-site Saline Formation Off-site Saline Formation

Cost and Performance Baseline for Fossil Energy Plants Volume 1b: Revision 2b
175
3.4.3.1 Balance of Plant – Cases B5A, B5B, and B5B-Q The balance of plant assumptions are common to all cases and are presented in Exhibit 3-11.
3.4.4 Sparing Philosophy The sparing philosophy for cases B5A, B5B, and B5B-Q is provided below. Dual trains are used to accommodate the size of commercial CTs. There is no redundancy other than normal sparing of rotating equipment. The plant design consists of the following major subsystems:
• Two ASUs (2 x 50%) • Two trains of slurry preparation and slurry pumps (2 x 50%) • Two trains of gasification, including gasifier, SGC, quench and scrubber (2 x 50%) • Two trains of syngas clean-up process (2 x 50%) • Two trains of Selexol AGR, single-stage in Case B5A and two-stage in Case B5B,
(2 x 50%) and one Claus-based SRU (1 x 100%) • Two CO2 compression systems (2 x 50%) in cases B5B and B5B-Q • Two CT/HRSG tandems (2 x 50%) • One steam turbine (1 x 100%)
3.4.5 Case B5A - Performance Results The plant produces a net output of 622 MWe at a net plant efficiency of 39.0 percent (HHV basis). GEE has reported a net plant efficiency of 38.5 percent for their reference plant, and they also presented a range of efficiencies of 38.5-40 percent depending on fuel type. (16), (51) Typically the higher efficiencies result from fuel blends that include petroleum coke.
Overall performance for the plant is summarized in Exhibit 3-78; Exhibit 3-79 provides a detailed breakdown of the auxiliary power requirements. The ASU accounts for approximately 78 percent of the auxiliary load between the main air compressor, nitrogen compressor, oxygen compressor, and ASU auxiliaries. The cooling water system, including the CWPs and the cooling tower fan, accounts for approximately 5 percent of the auxiliary load, and the BFW pumps account for an additional 3 percent. All other individual auxiliary loads are less than 3 percent of the total.

Cost and Performance Baseline for Fossil Energy Plants Volume 1b: Revision 2b
176
Exhibit 3-78 Case B5A plant performance summary
Performance Summary Combustion Turbine Power, MWe 464 Sweet Gas Expander Power, MWe 8 Steam Turbine Power, MWe 276 Total Gross Power, MWe 748 Air Separation Unit Main Air Compressor, kWe 53,820 Oxygen Compressor, kWe 10,260 Nitrogen Compressors, kWe 33,350 CO₂ Compression, kWe 0 Acid Gas Removal, kWe 2,590 Balance of Plant, kWe 25,840 Total Auxiliaries, MWe 126 Net Power, MWe 622 HHV Net Plant Efficiency (%) 39.0% HHV Net Plant Heat Rate, kJ/kWh (Btu/kWh) 9,240 (8,758) HHV Cold Gas Efficiency, % 79.6% HHV Combustion Turbine Efficiency, % 37.5% LHV Net Plant Efficiency (%) 40.4% LHV Net Plant Heat Rate, kJ/kWh (Btu/kWh) 8,912 (8,447) LHV Cold Gas Efficiency, % 76.2% LHV Combustion Turbine Efficiency, % 40.6% Steam Turbine Cycle Efficiency, % 43.3% Steam Turbine Heat Rate, kJ/kWh (Btu/kWh) 8,323 (7,889) Condenser Duty, GJ/hr (MMBtu/hr) 1,536 (1,456) As-Received Coal Feed, kg/hr (lb/hr) 211,781 (466,898) HHV Thermal Input, kWt 1,596,309 LHV Thermal Input, kWt 1,539,660 Raw Water Withdrawal, (m3/min)/MWnet (gpm/MWnet) 0.029 (7.6) Raw Water Consumption, (m3/min)/MWnet (gpm/MWnet) 0.023 (6.1) O₂:Coal 0.761

Cost and Performance Baseline for Fossil Energy Plants Volume 1b: Revision 2b
177
Exhibit 3-79 Case B5A plant power summary
Power Summary Combustion Turbine Power, MWe 464 Sweet Gas Expander Power, MWe 8 Steam Turbine Power, MWe 276 Total Gross Power, MWe 748
Auxiliary Load Summary Coal Handling, kWe 460 Coal Milling, kWe 2,180 Sour Water Recycle Slurry Pump, kWe 180 Slag Handling, kWe 1,120 Air Separation Unit Auxiliaries, kWe 1,000 Air Separation Unit Main Air Compressor, kWe 53,820 Oxygen Compressor, kWe 10,260 Nitrogen Compressors, kWe 33,350 Feedwater Pumps, kWe 3,980 Quench Water Pump, kWe 520 Syngas Recycle Compressor, kWe 0 CO₂ Compression, kWe 0 Scrubber Pumps, kWe 220 Acid Gas Removal, kWe 2,590 Combustion Turbine Auxiliaries, kWe 1,000 Steam Turbine Auxiliaries, kWe 100 Condensate Pumps, kWe 230 Circulating Water Pumps, kWe 4,220 Ground Water Pumps, kWe 430 Cooling Tower Fans, kWe 2,180 Claus Plant/TGTU Auxiliaries, kWe 250 Claus Plant TG Recycle Compressor, kWe 2,090 Miscellaneous Balance of PlantA,B, kWe 3,000 Transformer Losses, kWe 2,680 Total Auxiliaries, MWe 126 Net Power, MWe 622
AIncludes plant control systems, lighting, HVAC, and miscellaneous low voltage loads
3.4.5.1 Environmental Performance The environmental targets for emissions of Hg, NOx, SO2, and PM were presented in Section 2.4. A summary of the plant air emissions for Case B5A is presented in Exhibit 3-80. All HCl is assumed to be removed and is, therefore, not reported.

Cost and Performance Baseline for Fossil Energy Plants Volume 1b: Revision 2b
178
Exhibit 3-80 Case B5A air emissions
kg/GJ (lb/MMBtu) Tonne/year (ton/year)A kg/MWh (lb/MWh)B
SO2 0.001 (0.001) 21 (24) 0.004 (0.009) NOx 0.025 (0.059) 1,023 (1,128) 0.195 (0.430) Particulates 0.003 (0.0071) 123 (136) 0.023 (0.052) Hg 1.77E-7 (4.12E-7) 0.007 (0.008) 1.36E-6 (3.00E-6) CO2 85 (197) 3,407,878 (3,756,542) 650 (1,434)
CO2C - - 782 (1,724)
ACalculations based on an 80 percent capacity factor BEmissions are based on gross power except where otherwise noted CCO2 emissions based on net power instead of gross power
The low level of SO2 emissions is achieved by capturing the sulfur in the gas by the Selexol AGR process. The AGR process removes over 99 percent of the sulfur compounds in the fuel gas down to a level of less than 30 ppmv. This results in a concentration in the flue gas of less than 4 ppmv. The H2S-rich regeneration gas from the AGR system is fed to a Claus plant, producing elemental sulfur. The Claus plant tail gas is hydrogenated to convert all sulfur species to H2S and then recycled back to the Selexol process, thereby eliminating the need for a tail gas treatment unit.
NOx emissions are limited by nitrogen dilution of the syngas to 15 ppmvd (as NO2 @15 percent O2). Ammonia in the syngas is removed with process condensate prior to the low-temperature AGR process and ultimately destroyed in the Claus plant burner. This helps lower NOx levels as well.
Particulate discharge to the atmosphere is limited to extremely low values by the use of the syngas quench in addition to the syngas scrubber and the gas washing effect of the AGR absorber. The particulate emissions represent filterable particulate only.
Approximately 97 percent of the mercury is captured from the syngas by dual activated carbon beds.
CO2 emissions represent the uncontrolled discharge from the process.
The carbon balance for the plant is shown in Exhibit 3-81. The carbon input to the plant consists of carbon in the air in addition to carbon in the coal. Carbon in the air is not neglected here since the Aspen model accounts for air components throughout. Carbon leaves the plant as unburned carbon in the slag and as CO2 in the stack gas and ASU vent gas.

Cost and Performance Baseline for Fossil Energy Plants Volume 1b: Revision 2b
179
Exhibit 3-81 Case B5A carbon balance
Carbon In Carbon Out kg/hr (lb/hr) kg/hr (lb/hr)
Coal 134,999 (297,623) Stack Gas 132,715 (292,586) Air (CO₂) 519 (1,143) CO₂ Product 0 (0)
ASU Vent 103 (227) Slag 2,700 (5,952)
Total 135,518 (298,766) Total 135,518 (298,766)
Exhibit 3-82 shows the sulfur balances for the plant. Sulfur input comes solely from the sulfur in the coal. Sulfur output includes the sulfur recovered in the Claus plant and sulfur emitted in the stack gas. Sulfur in the slag is considered to be negligible.
Exhibit 3-82 Case B5A sulfur balance
Sulfur In Sulfur Out kg/hr (lb/hr) kg/hr (lb/hr)
Coal 5,308 (11,702) Stack Gas 2 (3) CO₂ Product 0 (0) Elemental Sulfur (11,699)
Total 5,308 (11,702) Total 5,308 (11,702)
Exhibit 3-83 shows the overall water balance for the plant. The water balance was explained in cases B1A (Shell) and B4A (E-GasTM), but is also presented here for completeness
Water demand represents the total amount of water required for a particular process. Some water is recovered within the process, primarily as syngas condensate, and is re-used as internal recycle. The difference between demand and recycle is raw water withdrawal. Raw water withdrawal is defined as the water removed from the ground or diverted from a surface-water source for use in the plant. For this report, it was assumed to be provided 50 percent by a POTW and 50 percent from groundwater. Raw water withdrawal can be represented by the water metered from a raw water source and used in the plant processes for any and all purposes, such as cooling tower makeup, BFW makeup, quench system makeup, and slag handling makeup. The difference between water withdrawal and process water discharge is defined as water consumption and can be represented by the portion of the raw water withdrawn that is evaporated, transpired, incorporated into products, or otherwise not returned to the water source from which it was withdrawn. Water consumption represents the net impact of the plant process on the water source balance.

Cost and Performance Baseline for Fossil Energy Plants Volume 1b: Revision 2b
180
Exhibit 3-83 Case B5A water balance
Water Use Water Demand
Internal Recycle
Raw Water Withdrawal
Process Water
Discharge Raw Water
Consumption
m3/min (gpm)
m3/min (gpm)
m3/min (gpm) m3/min (gpm) m3/min (gpm)
Slag Handling 0.50 (133) 0.50 (133) – – – Slurry Water 1.45 (384) 1.45 (384) – – – Quench/Wash 2.75 (726) 0.90 (237) 1.85 (489) – 1.85 (489) Humidifier – – – – – SWS Blowdown – – – 0.03 (7.54) -0.03 (-7.54) Condenser Makeup 0.20 (54) – 0.20 (54) – 0.20 (54) BFW Makeup 0.20 (54) – 0.20 (54) – 0.20 (54) Gasifier Steam – – – – – Shift Steam – – – – – CT Steam Dilution – – – – – Cooling Tower 16.43
(4,341) 0.49 (129) 15.94 (4,211) 3.70 (976) 12.25 (3,235)
BFW Blowdown – 0.20 (54) -0.20 (-54) – -0.20 (-54) SWS Blowdown – 0.29 (75.38) -0.29 (-
75.38) – -0.29 (-75.38)
Total 21.34 (5,638) 3.34 (883) 18.00 (4,755) 3.72 (984) 14.27 (3,771)
3.4.5.2 Heat and Mass Balance Diagrams Heat and mass balance diagrams are shown for the following subsystems in Exhibit 3-84 through Exhibit 3-86:
• Coal gasification and ASU • Syngas cleanup, sulfur recovery, and tail gas recycle • Combined cycle power generation, steam, and FW
An overall plant energy balance is provided in tabular form in Exhibit 3-87. The power out is the combined CT, steam turbine, and expander power prior to generator losses. The power at the generator terminals (shown in Exhibit 3-78) is calculated by multiplying the power out by a combined generator efficiency of 98.5 percent.

Cost and Performance Baseline for Fossil Energy Plants Volume 1b: Revision 2b
181
This page intentionally left blank

Cost and Performance Baseline for Fossil Energy Plants Volume 1b: Revision 2b
182
Exhibit 3-84 Case B5A coal gasification and ASU heat and mass balance schematic
Source: NETL
DOE/NETL
DUAL TRAIN IGCC PLANTCASE B5A
HEAT AND MATERIAL FLOW DIAGRAM
BITUMINOUS BASELINE STUDYCASE B5A
GEE GASIFIERASU AND GASIFICATION
DWG. NO.BB-HMB-CS-B5A-PG-1
PLANT PERFORMANCE SUMMARY
LEGEND
PAGES1 OF 3
Four Stage AirCompressor
ElevatedPressure
ASU
Four Stage N2Compressor
Four Stage O2Compressor
ASU Vent
1,391,468 W59 T15 P13 H
375,853 W90 T
125 P11 H
375,853 W241 T940 P41 H
To Claus Plant
7,253 W90 T
125 P11 H
63,703 W68 T16 P16 H
1,073,388 W90 T56 P14 H
150,594 W50 T
182 P3 H
5
1
3
2
Slurry Mix Tank
Slag
466,898 W59 T15 P
191,802 W295 T840 P240 H
51,227 W2,400 T
815 P
1,198,986 W389 T384 P88 H
658,700 W160 T840 P
1,390,226 W100 T190 P18 H
6
Air From GTCompressor
280,565 W220 T225 P51 H
280,565 W810 T235 P199 H
1,198,986 W199 T384 P40 H
21
N2 BoostCompressor24,996 W
199 T384 P40 H
24,996 W376 T785 P84 H
GE Energy Gasifier
RadiantSyngasCooler
Raw Fuel Gas
Syngas Scrubber
Slag Quench Section
Drag Conveyor
4
983,326 W1,250 T
805 P612 H
1,218,253 W403 T800 P446 H
SyngasQuench
1,346,408 W450 T805 P536 H
8
9
363,082 W371 T
1,200 P329 H
370,996 W403 T800 P418 H
To Fuel Gas Preheater
From Fuel Gas Preheater
To Sour Water Stripper
From Sour Water Stripper
66,538 W293 T115 P236 H
7
370,996 W150 T
1,205 P118 H
N2 to GT Combustor
To HP Economizer 1
From HP Economizer 2
N2 to AGR
Ambient Air
To Superheater
From HP Economizer 2
Notes:
Air
Oxygen
Nitrogen
Coal/Char/Slurry/Slag
Synthesis Gas
Water
Steam
W Flowrate, lbm/hr T Temperature, °FP Absolute Pressure, PSIAH Enthalpy, Btu/lbmMWe Power, Megawatts Electrical
Flue Gas/CombustionProducts
Gross Plant Power: 748 MWeAuxiliary Load: 126 MWeNet Plant Power: 622 MWeNet Plant Efficiency, HHV: 39.0%Net Plant Heat Rate: 8,758 Btu/kWh
Milled Coal
1. Enthalpy reference point is natural state at 32 °F and 0.08865 psia

Cost and Performance Baseline for Fossil Energy Plants Volume 1b: Revision 2b
183
Exhibit 3-85 Case B5A syngas cleanup heat and mass balance schematic
Source: NETL
DOE/NETL
DUAL TRAIN IGCC PLANTCASE B5A
HEAT AND MATERIAL FLOW DIAGRAM
BITUMINOUS BASELINE STUDYCASE B5A
GEE GASIFIERGAS CLEANUP SYSTEM
DWG. NO.BB-HMB-CS-B5A-PG-2
PLANT PERFORMANCE SUMMARY
LEGEND
PAGES2 OF 3
Mercury Removal
KnockOut
Drum
SourDrum
Claus Plant
Tail Gas
Furnace
CatalyticReactorBeds
Sulfur
SyngasCoolers
SourStripper
1,218,253 W403 T800 P458 H
931,649 W94 T
755 P16 H
81,312 W112 T750 P
-1 H
875,333 W386 T460 P127 H
11,699 W
79,720 W450 T59 P
250 H2,855 W
235 T65 P
405 H
15
12
16
71,391 W120 T57 P32 H
861,109 W95 T
760 P17 H
9,181 W118 T57 P44 H
70,540 W100 T800 P
-2 H
17875,333 W
112 T750 P23 H
COS Hydrolysis 1,218,253 W433 T785 P459 H
1,218,253 W433 T795 P459 H
10 11
Clean Gas
Acid Gas
13
AGR- Selexol
14
Fuel GasExpander
19
875,333 W465 T745 P157 H
18
N2 to AGR
24,996 W90 T
785 P9 H
Hydrogenation and Tail Gas
Cooling
Tail Gas RecycleCompressor
621,422 W
Blowdown to Waste Water Treatment
Raw Syngas
COS HydrolysisPreheater
To Superheater
From HP Economizer 2
From Syngas Scrubber
Makeup Water
Reboiler
To Coal Slurry, Syngas Quench, and Slag Quench
Knock Out
From Gland Steam Condenser
To Syngas Cooling
115 T
7,253 W90 T
125 P11 H
3
7,253 W450 T125 P92 H
Claus OxygenPreheater
To Deaerator
From IP BFW
From ASU
Fuel Gas To CT
To Syngas Scrubber and HP
Economizer 1
Fuel Gas Preheater
From Syngas Scrubber and HP
Economizer 2
To Preheater and LP Evaporator
From Tail Gas Cooler and LP
Economizer
Notes:
Air
Oxygen
Nitrogen
Coal/Char/Slurry/Slag
Synthesis Gas
Sour Water
Acid Gas
Tailgas
Sour Gas
Sulfur
Hydrogen
Water
W Flowrate, lbm/hr T Temperature, °FP Absolute Pressure, PSIAH Enthalpy, Btu/lbmMWe Power, Megawatts Electrical
Steam
1. Enthalpy reference point is natural state at 32 °F and 0.08865 psia
Gross Plant Power: 748 MWeAuxiliary Load: 126 MWeNet Plant Power: 622 MWeNet Plant Efficiency, HHV: 39.0%Net Plant Heat Rate: 8,758 Btu/kWh

Cost and Performance Baseline for Fossil Energy Plants Volume 1b: Revision 2b
184
Exhibit 3-86 Case B5A combined-cycle power generation heat and mass balance schematic
Source: NETL
Notes:
DOE/NETL
DUAL TRAIN IGCC PLANTCASE B5A
HEAT AND MATERIAL FLOW DIAGRAM
BITUMINOUS BASELINE STUDYCASE B5A
GEE GASIFIERPOWER BLOCK SYSTEM
DWG. NO.BB-HMB-CS-B5A-PG-3
PLANT PERFORMANCE SUMMARY
LEGEND
Air
Oxygen
Nitrogen
Coal/Char/Slurry/Slag
Synthesis Gas
PAGES3 OF 3
Sour Gas
Sour Water
Water
Steam
Flue Gas
W Flowrate, lbm/hr T Temperature, °FP Absolute Pressure, PSIAH Enthalpy, Btu/lbmMWe Power, Megawatts Electrical
HPTurbine
IPTurbine
Nitrogen Diluent
Air Inlet Filter
Ambient Air
Steam Seal Regulator
BlowdownFlash
GlandSteam
Condenser
LP Turbine
Stack
ExpanderCompressor
Fuel Gas
Generator
Generator
CondensatePumps
Steam Turbine
State-of-the-art 2008 F-Class Turbine
7,014,133 W59 T15 P13 H
1,581,175 W101 T
1 P69 H
8,807,888 W270 T15 P
101 H
875,333 W386 T460 P127 H
1,413,754 W1,043 T1,815 P1,498 H
9,644 W298 T65 P
1,171 H
1,542,249 W512 T65 P
1,280 H
1,581,175 W103 T120 P71 H
1,400 W662 T65 P
1,354 H
1,400 W212 T15 P
180 H
20
24
19
23
Hot Well
Condenser
Make-up
27,011 W59 T15 P27 H
8,822 W702 T501 P
1,350 H
9,515 W662 T65 P
1,354 H
780 W1,043 T1,815 P1,498 H
1,312 W541 T65 P
1,294 H
Preheater DeaeratorHeater
HP Economizer
1
LP Economizer
HP Economizer
2
HP Evaporator
Superheater/ Reheater
From Syngas CoolerTo Radiant
Syngas Cooler
From Radiant Syngas Cooler
To ASU and Fuel Gas Preheater
Deaerator
HP Pump
IP Pump
From ASU and Fuel Gas Preheater
LP Evaporator
From Claus, Process Extraction, and 250 PSIA Header
LP Extraction Spray
LP Blowdown Hot Reheat
8,807,888 W1,093 T
15 P319 H
22
To WWT
Process Extraction
LP Pump
235 T
274 T
1,932,503 W274 T45 P
242 H
1,440,746 W279 T
2,251 P247 H
9,663 W274 T79 P
242 H
7,083 W274 T79 P
242 H 45,731 W276 T615 P244 H
240,921 W351 T
2,251 P319 H
305 T 585 T 636 T
26,992 W585 T
2,001 P593 H
636 T
908,447 W585 T
2,001 P585 H
1,385,727 W702 T501 P
1,351 H
240,921 W585 T
2,001 P585 H
1,198,986 W385 T389 P87 H
21Air Extraction
280,565 W810 T235 P199 H
387,415 W298 T65 P
266 H
1,581,175 W185 T105 P153 H
299,058 W298 T65 P
1,171 H
1,000 W1,043 T1,815 P1,498 H
1,000 W212 T15 P
180 H
42,626 W500 T250 P
1,255 H
IP Extraction Steam to 250 PSIA Header
LP Extraction Spray #1
Condensate to Tail Gas Cooling
To Claus
To Syngas Coolers
From Syngas Coolers
1,043 T
Gross Plant Power: 748 MWeAuxiliary Load: 126 MWeNet Plant Power: 622 MWeNet Plant Efficiency, HHV: 39.0%Net Plant Heat Rate: 8,758 Btu/kWh
1. Enthalpy reference point is natural state at 32 °F and 0.08865 psia

Cost and Performance Baseline for Fossil Energy Plants Volume 1b: Revision 2b
185
This page intentionally left blank

Cost and Performance Baseline for Fossil Energy Plants Volume 1b: Revision 2b
186
Exhibit 3-87 Case B5A overall energy balance (0°C [32°F] reference)
HHV Sensible + Latent Power Total
Heat In (GJ/hr) Coal 5,747
(5,447) 4.8 (4.6) – 5,752
(5,451) Air – 115.2 (109.2) – 115.2
(109.2) Raw Water Makeup – 67.7 (64.1) – 67.7 (64.1)
Auxiliary Power – – 453 (429) 453 (429) TOTAL 5,747
(5,447) 187.7 (177.9) 453 (429) 6,388
(6,054) Heat Out (GJ/hr)
ASU Vent – 1.1 (1.0) – 1.1 (1.0) Slag 88.5 (83.9) 36.3 (34.4) – 124.8
(118.3) Stack Gas – 939 (890) – 939 (890)
Sulfur 49.2 (46.6) 0.6 (0.6) – 49.8 (47.2) Motor Losses and Design
Allowances – – 53.9 (51.1) 53.9 (51.1)
Condenser – 1,536 (1,456) – 1,536 (1,456)
Non-Condenser Cooling Tower Loads
– 458 (434) – 458 (434)
CO₂ – – – – Blowdown – 41.0 (38.9) – 41.0 (38.9)
CO₂ Capture Losses – – – – Ambient LossesA – 157.9 (149.6) – 157.9
(149.6) Power – – 2,692
(2,552) 2,692
(2,552) TOTAL 137.7
(130.5) 3,171 (3,005) 2,746
(2,603) 6,055
(5,739) Unaccounted EnergyB – 333 (316) – 333 (316)
AAmbient losses include all losses to the environment through radiation, convection, etc. Sources of these losses include the combustor, reheater, superheater, and transformers. BBy difference.
3.4.6 Case B5A - Major Equipment List Major equipment items for the GEE gasifier with no CO2 capture are shown in the following tables. The accounts used in the equipment list correspond to the account numbers used in the

Cost and Performance Baseline for Fossil Energy Plants Volume 1b: Revision 2b
187
cost estimates in Section 3.4.7. In general, the design conditions include a 10 percent contingency for flows and heat duties and a 21 percent contingency for heads on pumps and fans.
Case B5A – Account 1: Coal Handling Equipment
No. Description Type Design Condition Operating Qty. Spares
1 Bottom Trestle Dumper and Receiving Hoppers N/A 181 tonne (200 ton) 2 0
2 Feeder Belt 570 tonne/hr (630 tph) 2 0 3 Conveyor No. 1 Belt 1,130 tonne/hr (1,250 tph) 1 0 4 Conveyor No. 2 Belt 1,130 tonne/hr (1,250 tph) 1 0 5 Stacker/Reclaimer Traveling, linear 1,130 tonne/hr (1,250 tph) 1 0 6 Reclaim Hopper N/A 40 tonne (50 ton) 2 1 7 Feeder Vibratory 170 tonne/hr (190 tph) 2 1 8 Conveyor No. 3 Belt w/ tripper 350 tonne/hr (390 tph) 1 0 9 Coal Surge Bin w/ Vent Filter Dual outlet 170 tonne (190 ton) 2 0
10 Crusher Impactor reduction 8 cm x 0 - 3 cm x 0 (3" x 0 - 1-1/4" x 0) 2 0
11 Conveyor No. 4 Belt w/ tripper 350 tonne/hr (390 tph) 1 0 12 Conveyor No. 5 Belt w/ tripper 350 tonne/hr (390 tph) 1 0
13 Coal Silo w/ Vent Filter and Slide Gates Field erected 780 tonne (860 ton) 3 0
Case B5A – Account 2: Coal Preparation and Feed Equipment
No. Description Type Design Condition Operating Qty. Spares
1 Feeder Vibratory 80 tonne/h (90 tph) 3 0 2 Conveyor No. 6 Belt w/ tripper 230 tonne/h (260 tph) 1 0 3 Rod Mill Feed Hopper Dual Outlet 470 tonne (510 ton) 1 0 4 Weigh Feeder Belt 120 tonne/h (130 tph) 2 0 5 Rod Mill Rotary 120 tonne/h (130 tph) 2 0
6 Slurry Water Storage Tank with Agitator Field erected 287,520 liters (75,950 gal) 2 0
7 Slurry Water Pumps Centrifugal 800 lpm (210 gpm) 2 1 8 Trommel Screen Coarse 160 tonne/h (180 tph) 2 0
9 Rod Mill Discharge Tank with Agitator Field erected 376,120 liters (99,360 gal) 2 0
10 Rod Mill Product Pumps Centrifugal 3,100 lpm (800 gpm) 2 2
11 Slurry Storage Tank with Agitator Field erected 1,128,400 liters
(298,100 gal) 2 0
12 Slurry Recycle Pumps Centrifugal 6,300 lpm (1,700 gpm) 2 2
13 Slurry Product Pumps Positive displacement 3,100 lpm (800 gpm) 2 2
Case B5A – Account 3: Feedwater and Miscellaneous Systems and Equipment Equipment
No. Description Type Design Condition Operating Qty. Spares
1 Demineralized Water Storage Tank
Vertical, cylindrical, outdoor 1,083,000 liters (286,000 gal) 2 0
2 Condensate Pumps Vertical canned 6,620 lpm @ 90 m H₂O (1,750 gpm @ 300 ft H₂O) 2 1
3 Deaerator (integral w/ HRSG) Horizontal spray type 494,000 kg/hr (1,088,000
lb/hr) 2 0
4 Intermediate-Pressure Feedwater Pump
Horizontal centrifugal, single stage
8,360 lpm @ 30 m H₂O (2,210 gpm @ 90 ft H₂O) 2 1
5 High-Pressure Feedwater Pump No. 1
Barrel type, multi-stage, centrifugal
HP water: 6,230 lpm @ 1,800 m H₂O
(1,650 gpm @ 6,100 ft H₂O) 2 1

Cost and Performance Baseline for Fossil Energy Plants Volume 1b: Revision 2b
188
Equipment No. Description Type Design Condition Operating
Qty. Spares
6 High-Pressure Feedwater Pump No. 2
Barrel type, multi-stage, centrifugal
IP water: 1,040 lpm @ 220 m H₂O (280 gpm @ 730 ft H₂O) 2 1
7 Auxiliary Boiler Shop fabricated, water tube
18,000 kg/hr, 2.8 MPa, 343°C (40,000 lb/hr, 400 psig, 650°F) 1 0
8 Service Air Compressors Flooded Screw 28 m3/min @ 0.7 MPa
(1,000 scfm @ 100 psig) 2 1
9 Instrument Air Dryers Duplex, regenerative 28 m3/min (1,000 scfm) 2 1
10 Closed Cycle Cooling Heat Exchangers Plate and frame 252 GJ/hr
(239 MMBtu/hr) each 2 0
11 Closed Cycle Cooling Water Pumps Horizontal centrifugal 90,400 lpm @ 20 m H₂O
(23,900 gpm @ 70 ft H₂O) 2 1
12 Engine-Driven Fire Pump
Vertical turbine, diesel engine
3,785 lpm @ 110 m H₂O (1,000 gpm @ 350 ft H₂O) 1 1
13 Fire Service Booster Pump
Two-stage horizontal centrifugal
2,650 lpm @ 80 m H₂O (700 gpm @ 250 ft H₂O) 1 1
14 Raw Water Pumps Stainless steel, single suction
4,630 lpm @ 20 m H₂O (1,220 gpm @ 60 ft H₂O) 2 1
15 Ground Water Pumps Stainless steel, single suction
3,080 lpm @ 270 m H₂O (810 gpm @ 880 ft H₂O) 3 1
16 Filtered Water Pumps Stainless steel, single suction
2,090 lpm @ 50 m H₂O (550 gpm @ 160 ft H₂O) 2 1
17 Filtered Water Tank Vertical, cylindrical 1,002,000 liter (265,000 gal) 2 0
18 Makeup Water Demineralizer
Anion, cation, and mixed bed 300 lpm (80 gpm) 2 0
19 Liquid Waste Treatment System N/A 10 years, 24-hour storm 1 0
Case B5A – Account 4: Gasifier, ASU, and Accessories Including Low Temperature Heat Recovery and Fuel Gas Saturation Equipment
No. Description Type Design Condition Operating Qty. Spares
1 Gasifier Pressurized slurry-feed, entrained bed
2,800 tonne/day, 5.6 MPa (3,100 tpd, 815 psia) 2 0
2 Synthesis Gas Cooler
Vertical downflow radiant heat exchanger with outlet quench chamber
245,000 kg/hr (541,000 lb/hr) 2 0
3 Synthesis Gas Cyclone High efficiency 336,000 kg/hr (741,000 lb/hr)
Design efficiency 90% 2 0
4 Raw Gas Coolers Shell and tube with condensate drain 216,000 kg/hr (476,000 lb/hr) 8 0
5 Raw Gas Knockout Drum
Vertical with mist eliminator
215,000 kg/hr, 35°C, 5.3 MPa (475,000 lb/hr, 95°F, 765 psia) 2 0
6 Flare Stack Self-supporting, carbon steel, stainless steel top, pilot ignition
336,000 kg/hr (741,000 lb/hr) syngas 2 0
7 ASU Main Air Compressor Centrifugal, multi-stage 5,000 m3/min @ 1.3 MPa
(168,000 scfm @ 190 psia) 2 0
8 Cold Box Vendor design 2,300 tonne/day (2,500 tpd) of 95% purity oxygen 2 0
9 Oxygen Compressor Centrifugal, multi-stage 1,000 m3/min (41,000 scfm) Suction - 1.0 MPa (130 psia)
Discharge - 6.5 MPa (940 psia) 2 0
10 Primary Nitrogen Compressor Centrifugal, multi-stage
4,000 m3/min (133,000 scfm) Suction - 0.4 MPa (60 psia)
Discharge - 2.7 MPa (390 psia) 2 0

Cost and Performance Baseline for Fossil Energy Plants Volume 1b: Revision 2b
189
Equipment No. Description Type Design Condition Operating
Qty. Spares
11 Secondary Nitrogen Compressor
Centrifugal, single-stage
530 m3/min (19,000 scfm) Suction - 1.3 MPa (180 psia)
Discharge - 2.7 MPa (390 psia) 2 0
12 AGR Nitrogen Boost Compressor
Centrifugal, single-stage
90 m3/min (3,000 scfm) Suction - 2.6 MPa (380 psia)
Discharge - 5.4 MPa (790 psia) 2 0
13 Extraction Air Heat Exchanger
Gas-to-gas, vendor design
70,000 kg/hr, 432°C, 1.6 MPa (154,000 lb/hr, 810°F, 235 psia) 2 0
Case B5A – Account 5: Syngas Cleanup Equipment
No. Description Type Design Condition Operating Qty. Spares
1 Mercury Adsorber 1 Sulfated carbon bed 215,000 kg/hr (474,000 lb/hr), 35°C (95°F), 5.2 MPa (760 psia) 2 0
2 Mercury Adsorber 2 Sulfated carbon bed 215,000 kg/hr (474,000 lb/hr), 35°C (95°F), 5.2 MPa (760 psia) 2 0
3 Sulfur Plant Claus type 140 tonne/day (154 tpd) 1 0
4 COS Hydrolysis Reactor Fixed bed, catalytic 304,000 kg/hr (670,000 lb/hr),
221°C (430°F), 5.4 MPa (790 psia) 2 0
5 Acid Gas Removal Plant Selexol 232,000 kg/hr (512,000 lb/hr),
35°C (94°F), 5.2 MPa (755 psia) 2 0
6 Hydrogenation Reactor Fixed bed, catalytic
40,000 kg/hr (88,000 lb/hr) 232°C (450°F)
0.4 MPa (58.9 psia) 1 0
7 Tail Gas Recycle Compressor Centrifugal 35,000 kg/hr (78,000 lb/hr) each 1 0
Case B5A – Account 6: Combustion Turbine and Auxiliaries Equipment
No. Description Type Design Condition Operating Qty. Spares
1 Combustion Turbine State-of-the-art 2008 F-class 230 MW 2 0
2 Combustion Turbine Generator TEWAC 260 MVA @ 0.9 p.f., 24 kV, 60 Hz,
3-phase 2 0
3 Syngas Expansion Turbine/Generator Turbo Expander
218,400 kg/h (481,400 lb/h) 5.1 MPa (745 psia) Inlet
3.2 MPa (460 psia) Outlet 2 0
Case B5A – Account 7: HRSG, Ducting, and Stack Equipment
No. Description Type Design Condition Operating Qty. Spares
1 Stack CS plate, type 409SS liner
76 m (250 ft) high x 8.4 m (27 ft) diameter 1 0
2 Heat Recovery Steam Generator
Drum, multi-pressure with economizer section and integral deaerator
Main steam - 352,698 kg/hr, 12.4 MPa/561°C
(777,565 lb/hr, 1,800 psig/1,043°F) 2 0

Cost and Performance Baseline for Fossil Energy Plants Volume 1b: Revision 2b
190
Case B5A – Account 8: Steam Turbine Generator and Auxiliaries Equipment
No. Description Type Design Condition Operating Qty. Spares
1 Steam Turbine
Commercially available advanced steam turbine
291 MW 12.4 MPa/561°C/561°C
(1,800 psig/ 1,043°F/1,043°F) 1 0
2 Steam Turbine Generator
Hydrogen cooled, static excitation
320 MVA @ 0.9 p.f., 24 kV, 60 Hz, 3-phase 1 0
3 Surface Condenser
Single pass, divided waterbox including vacuum pumps
1,690GJ/hr (1,600 MMBtu/hr), Inlet water temperature 16°C
(60°F), Water temperature rise 11°C (20°F)
1 0
4 Steam Bypass One per HRSG 50% steam flow @ design steam
conditions 2 0
Case B5A – Account 9: Cooling Water System Equipment
No. Description Type Design Condition Operating Qty. Spares
1 Circulating Water Pumps Vertical, wet pit 423,000 lpm @ 30 m
(112,000 gpm @ 100 ft) 2 1
2 Cooling Tower Evaporative, mechanical draft, multi-cell
11°C (51.5°F) wet bulb / 16°C (60°F) CWT / 27°C (80°F) HWT /
2,360 GJ/hr (2,240 MMBtu/hr) heat duty
1 0
Case B5A – Account 10: Slag Recovery and Handling Equipment
No. Description Type Design Condition Operating Qty. Spares
1 Slag Quench Tank Water bath 244,000 liters (64,000 gal) 2 0 2 Slag Crusher Roll 13 tonne/hr (14 tph) 2 0 3 Slag Depressurizer Lock Hopper 13 tonne/hr (14 tph) 2 0 4 Slag Receiving Tank Horizontal, weir 147,000 liters (39,000 gal) 2 0 5 Black Water Overflow Tank Shop fabricated 66,000 liters (17,000 gal) 2 0 6 Slag Conveyor Drag chain 13 tonne/hr (14 tph) 2 0 7 Slag Separation Screen Vibrating 13 tonne/hr (14 tph) 2 0 8 Coarse Slag Conveyor Belt/bucket 13 tonne/hr (14 tph) 2 0 9 Fine Ash Settling Tank Vertical, gravity 208,000 liters (55,000 gal) 2 0
10 Fine Ash Recycle Pumps Horizontal centrifugal 50 lpm @ 14 m H₂O (10 gpm @ 46 ft H₂O) 2 2
11 Grey Water Storage Tank Field erected 66,000 liters (18,000 gal) 2 0
12 Grey Water Pumps Centrifugal 240 lpm @ 560 m H₂O (60 gpm @ 1,850 ft H₂O) 2 2
13 Slag Storage Bin Vertical, field erected 900 tonne (1,000 tons) 2 0 14 Unloading Equipment Telescoping chute 110 tonne/hr (120 tph) 1 0

Cost and Performance Baseline for Fossil Energy Plants Volume 1b: Revision 2b
191
Case B5A – Account 11: Accessory Electric Plant Equipment
No. Description Type Design Condition Operating Qty. Spares
1 CTG Transformer Oil-filled 24 kV/345 kV, 260 MVA, 3-ph, 60 Hz 2 0
2 STG Transformer Oil-filled 24 kV/345 kV, 290 MVA, 3-ph, 60 Hz 1 0
3 High Voltage Auxiliary Transformer Oil-filled 345 kV/13.8 kV, 54
MVA, 3-ph, 60 Hz 2 0
4 Medium Voltage Transformer Oil-filled 24 kV/4.16 kV, 29 MVA, 3-ph, 60 Hz 1 1
5 Low Voltage Transformer Dry ventilated 4.16 kV/480 V, 4 MVA, 3-ph, 60 Hz 1 1
6 CTG Isolated Phase Bus Duct and Tap Bus
Aluminum, self-cooled 24 kV, 3-ph, 60 Hz 2 0
7 STG Isolated Phase Bus Duct and Tap Bus
Aluminum, self-cooled 24 kV, 3-ph, 60 Hz 1 0
8 Medium Voltage Switchgear Metal clad 4.16 kV, 3-ph, 60 Hz 1 1 9 Low Voltage Switchgear Metal enclosed 480 V, 3-ph, 60 Hz 1 1
10 Emergency Diesel Generator Sized for emergency shutdown
750 kW, 480 V, 3-ph, 60 Hz 1 0
Case B5A – Account 12: Instrumentation and Control Equipment
No. Description Type Design Condition Operating Qty. Spares
1 DCS - Main Control
Monitor/keyboard; Operator printer (laser color); Engineering printer (laser B&W)
Operator stations/printers and engineering stations/printers
1 0
2 DCS - Data Highway Fiber optic Fully redundant, 25% spare 1 0
3.4.7 Case B5A - Cost Estimating The cost estimating methodology was described previously in Section 2.6. Exhibit 3-88 shows a detailed breakdown of the capital costs; Exhibit 3-89 shows the owner’s costs, TOC, and TASC; Exhibit 3-90 shows the initial and annual O&M costs; and Exhibit 3-91 shows the COE breakdown.
The estimated TPC of the GEE gasifier with no CO2 capture is $2,449/kW. Process contingency represents 2.5 percent of the TPC, and project contingency represents 13.5 percent. The COE is $102.6/MWh.

Cost and Performance Baseline for Fossil Energy Plants Volume 1b: Revision 2b
192
Exhibit 3-88 Case B5A total plant cost details Case: B5A – GEE Radiant IGCC w/o CO₂ Estimate Type: Conceptual
Plant Size (MW,net): 622 Cost Base: Jun 2011 Item Description Equipment Material Labor Bare Erected Eng'g CM Contingencies Total Plant Cost No. Cost Cost Direct Indirect Cost H.O.& Fee Process Project $/1,000 $/kW
1 Coal & Sorbent Handling 1.1 Coal Receive & Unload $4,435 $0 $2,137 $0 $6,572 $657 $0 $1,446 $8,675 $14 1.2 Coal Stackout & Reclaim $5,731 $0 $1,370 $0 $7,101 $710 $0 $1,562 $9,373 $15 1.3 Coal Conveyors & Yd Crush $5,328 $0 $1,356 $0 $6,684 $668 $0 $1,470 $8,823 $14 1.4 Other Coal Handling $1,394 $0 $314 $0 $1,708 $171 $0 $376 $2,254 $4 1.9 Coal & Sorbent Hnd. Foundations $0 $2,961 $7,739 $0 $10,701 $1,070 $0 $2,354 $14,125 $23
Subtotal $16,887 $2,961 $12,917 $0 $32,765 $3,277 $0 $7,208 $43,250 $70 2 Coal & Sorbent Prep & Feed
2.1 Coal Crushing & Drying w/ 2.3 $0 w/ 2.3 $0 $0 $0 $0 $0 $0 $0 2.2 Prepared Coal Storage & Feed $1,891 $454 $292 $0 $2,638 $264 $0 $580 $3,482 $6 2.3 Slurry Prep & Feed $25,812 $0 $11,252 $0 $37,064 $3,706 $1,853 $8,525 $51,149 $82 2.4 Misc. Coal Prep & Feed $1,040 $760 $2,238 $0 $4,037 $404 $0 $888 $5,329 $9 2.9 Coal & Sorbent Feed Foundation $0 $3,814 $3,273 $0 $7,087 $709 $0 $1,559 $9,355 $15
Subtotal $28,743 $5,028 $17,055 $0 $50,826 $5,083 $1,853 $11,552 $69,314 $111 3 Feedwater & Miscellaneous BOP Systems
3.1 Feedwater System $3,461 $5,974 $3,132 $0 $12,567 $1,257 $0 $2,765 $16,589 $27 3.2 Water Makeup & Pretreating $758 $78 $416 $0 $1,252 $125 $0 $413 $1,791 $3 3.3 Other Feedwater Subsystems $1,946 $643 $575 $0 $3,164 $316 $0 $696 $4,176 $7 3.4 Service Water Systems $443 $883 $3,045 $0 $4,372 $437 $0 $1,443 $6,251 $10 3.5 Other Boiler Plant Systems $2,388 $892 $2,196 $0 $5,476 $548 $0 $1,205 $7,228 $12 3.6 FO Supply Sys & Nat Gas $17,740 $718 $665 $0 $19,123 $1,912 $0 $4,207 $25,242 $41 3.7 Waste Treatment Equipment $1,025 $0 $635 $0 $1,660 $166 $0 $548 $2,374 $4 3.8 Misc. Power Plant Equipment $1,277 $170 $664 $0 $2,111 $211 $0 $697 $3,019 $5
Subtotal $29,037 $9,360 $11,328 $0 $49,725 $4,972 $0 $11,973 $66,670 $107 4 Gasifier & Accessories
4.1 Syngas Cooler Gasifier System $136,778 $0 $75,333 $0 $212,111 $21,211 $29,509 $40,271 $303,102 $487 4.2 Syngas Cooler w/4.1 $0 w/4.1 $0 $0 $0 $0 $0 $0 $0 4.3 ASU & Oxidant Compression $195,452 $0 w/equip. $0 $195,452 $19,545 $0 $21,500 $236,496 $380 4.4 Scrubber & LT Heat Recovery $7,080 $5,763 $5,957 $0 $18,800 $1,880 $0 $4,136 $24,816 $40 4.5 Black Water & Sour Gas Section w/4.1 $0 w/4.1 $0 $0 $0 $0 $0 $0 $0 4.6 Soot Recovery & SARU $2,159 $1,025 $2,013 $0 $5,197 $520 $0 $1,143 $6,860 $11 4.8 Major Component Rigging w/4.1&4.2 $0 w/4.1&4.2 $0 $0 $0 $0 $0 $0 $0 4.9 Gasification Foundations $0 $7,429 $6,482 $0 $13,911 $1,391 $0 $3,826 $19,128 $31
Subtotal $341,469 $14,218 $89,784 $0 $445,471 $44,547 $29,509 $70,875 $590,403 $949 5A Gas Cleanup & Piping
5A.1 Single Stage Selexol $50,584 $0 $42,628 $0 $93,212 $9,321 $0 $20,507 $123,040 $198 5A.2 Elemental Sulfur Plant $12,121 $2,363 $15,532 $0 $30,015 $3,002 $0 $6,603 $39,620 $64 5A.3 Mercury Removal $1,515 $0 $1,145 $0 $2,661 $266 $133 $612 $3,672 $6 5A.4 COS Hydrolysis $4,309 $0 $5,589 $0 $9,898 $990 $0 $2,178 $13,066 $21 5A.7 Fuel Gas Piping $0 $882 $577 $0 $1,459 $146 $0 $321 $1,926 $3

Cost and Performance Baseline for Fossil Energy Plants Volume 1b: Revision 2b
193
Case: B5A – GEE Radiant IGCC w/o CO₂ Estimate Type: Conceptual Plant Size (MW,net): 622 Cost Base: Jun 2011
Item Description Equipment Material Labor Bare Erected Eng'g CM Contingencies Total Plant Cost No. Cost Cost Direct Indirect Cost H.O.& Fee Process Project $/1,000 $/kW
5A.9 HGCU Foundations $0 $798 $538 $0 $1,336 $134 $0 $441 $1,911 $3 Subtotal $68,530 $4,043 $66,009 $0 $138,582 $13,858 $133 $30,662 $183,234 $295 6 Combustion Turbine & Accessories
6.1 Combustion Turbine Generator $104,200 $0 $7,506 $0 $111,706 $11,171 $5,585 $12,846 $141,308 $227 6.2 Syngas Expander $7,146 $0 $981 $0 $8,126 $813 $0 $1,341 $10,280 $17 6.9 Combustion Turbine Foundations $0 $1,016 $1,175 $0 $2,191 $219 $0 $723 $3,133 $5
Subtotal $111,346 $1,016 $9,662 $0 $122,024 $12,202 $5,585 $14,910 $154,721 $249 7 HRSG, Ducting, & Stack
7.1 Heat Recovery Steam Generator $31,080 $0 $6,019 $0 $37,099 $3,710 $0 $4,081 $44,890 $72 7.3 Ductwork $0 $2,080 $1,458 $0 $3,538 $354 $0 $778 $4,670 $8 7.4 Stack $4,014 $0 $1,498 $0 $5,511 $551 $0 $606 $6,669 $11 7.9 HRSG, Duct & Stack Foundations $0 $764 $767 $0 $1,531 $153 $0 $505 $2,190 $4
Subtotal $35,094 $2,844 $9,741 $0 $47,679 $4,768 $0 $5,971 $58,418 $94 8 Steam Turbine Generator
8.1 Steam TG & Accessories $38,955 $0 $5,979 $0 $44,934 $4,493 $0 $4,943 $54,370 $87 8.2 Turbine Plant Auxiliaries $243 $0 $554 $0 $798 $80 $0 $88 $965 $2 8.3 Condenser & Auxiliaries $3,300 $0 $1,878 $0 $5,178 $518 $0 $570 $6,265 $10 8.4 Steam Piping $15,350 $0 $6,657 $0 $22,006 $2,201 $0 $6,052 $30,258 $49 8.9 TG Foundations $0 $1,147 $2,027 $0 $3,174 $317 $0 $1,047 $4,539 $7
Subtotal $57,848 $1,147 $17,094 $0 $76,089 $7,609 $0 $12,699 $96,397 $155 9 Cooling Water System
9.1 Cooling Towers $4,180 $0 $1,270 $0 $5,450 $545 $0 $899 $6,894 $11 9.2 Circulating Water Pumps $2,012 $0 $146 $0 $2,158 $216 $0 $356 $2,730 $4 9.3 Circ. Water System Auxiliaries $177 $0 $25 $0 $202 $20 $0 $33 $256 $0 9.4 Circ. Water Piping $0 $7,847 $1,901 $0 $9,747 $975 $0 $2,144 $12,867 $21 9.5 Make-up Water System $428 $0 $589 $0 $1,017 $102 $0 $224 $1,342 $2 9.6 Component Cooling Water Sys $897 $1,073 $737 $0 $2,707 $271 $0 $595 $3,573 $6 9.9 Circ. Water System Foundations $0 $2,576 $4,576 $0 $7,152 $715 $0 $2,360 $10,227 $16
Subtotal $7,695 $11,495 $9,243 $0 $28,433 $2,843 $0 $6,612 $37,889 $61 10 Ash & Spent Sorbent Handling Systems
10.1 Slag Dewatering & Cooling $14,251 $7,858 $15,855 $0 $37,965 $3,797 $0 $4,176 $45,938 $74 10.2 Gasifier Ash Depressurization w/10.1 w/10.1 w/10.1 $0 $0 $0 $0 $0 $0 $0 10.3 Cleanup Ash Depressurization w/10.1 w/10.1 w/10.1 $0 $0 $0 $0 $0 $0 $0 10.6 Ash Storage Silos $693 $0 $749 $0 $1,442 $144 $0 $238 $1,825 $3 10.7 Ash Transport & Feed Equipment $954 $0 $223 $0 $1,177 $118 $0 $194 $1,489 $2 10.8 Misc. Ash Handling Equipment $1,436 $1,760 $522 $0 $3,718 $372 $0 $613 $4,703 $8 10.9 Ash/Spent Sorbent Foundation $0 $58 $76 $0 $135 $13 $0 $44 $193 $0
Subtotal $17,335 $9,676 $17,426 $0 $44,437 $4,444 $0 $5,266 $54,147 $87 11 Accessory Electric Plant
11.1 Generator Equipment $1,165 $0 $1,134 $0 $2,299 $230 $0 $253 $2,782 $4 11.2 Station Service Equipment $4,601 $0 $423 $0 $5,024 $502 $0 $553 $6,080 $10 11.3 Switchgear & Motor Control $8,493 $0 $1,579 $0 $10,071 $1,007 $0 $1,662 $12,740 $20

Cost and Performance Baseline for Fossil Energy Plants Volume 1b: Revision 2b
194
Case: B5A – GEE Radiant IGCC w/o CO₂ Estimate Type: Conceptual Plant Size (MW,net): 622 Cost Base: Jun 2011
Item Description Equipment Material Labor Bare Erected Eng'g CM Contingencies Total Plant Cost No. Cost Cost Direct Indirect Cost H.O.& Fee Process Project $/1,000 $/kW
11.4 Conduit & Cable Tray $0 $4,315 $13,302 $0 $17,617 $1,762 $0 $4,845 $24,223 $39 11.5 Wire & Cable $0 $8,320 $5,062 $0 $13,382 $1,338 $0 $3,680 $18,400 $30 11.6 Protective Equipment $0 $805 $2,988 $0 $3,793 $379 $0 $626 $4,798 $8 11.7 Standby Equipment $276 $0 $275 $0 $552 $55 $0 $91 $698 $1 11.8 Main Power Transformers $18,037 $0 $175 $0 $18,211 $1,821 $0 $3,005 $23,037 $37 11.9 Electrical Foundations $0 $183 $498 $0 $680 $68 $0 $225 $973 $2
Subtotal $32,572 $13,623 $25,436 $0 $71,630 $7,163 $0 $14,938 $93,732 $151 12 Instrumentation & Control
12.1 IGCC Control Equipment w/4.1 $0 w/4.1 $0 $0 $0 $0 $0 $0 $0 12.2 Combustion Turbine Control w/6.1 $0 w/6.1 $0 $0 $0 $0 $0 $0 $0 12.3 Steam Turbine Control w/8.1 $0 w/8.1 $0 $0 $0 $0 $0 $0 $0 12.4 Other Major Component Control $1,187 $0 $809 $0 $1,996 $200 $100 $344 $2,640 $4 12.5 Signal Processing Equipment w/12.7 $0 w/12.7 $0 $0 $0 $0 $0 $0 $0 12.6 Control Boards, Panels & Racks $273 $0 $178 $0 $451 $45 $23 $104 $623 $1 12.7 Computer & Accessories $6,332 $0 $207 $0 $6,539 $654 $327 $752 $8,272 $13 12.8 Instrument Wiring & Tubing $0 $2,438 $4,614 $0 $7,052 $705 $353 $2,027 $10,137 $16 12.9 Other I & C Equipment $4,233 $0 $2,097 $0 $6,330 $633 $317 $1,092 $8,372 $13
Subtotal $12,025 $2,438 $7,906 $0 $22,368 $2,237 $1,118 $4,319 $30,043 $48 13 Improvements to Site
13.1 Site Preparation $0 $118 $2,689 $0 $2,807 $281 $0 $926 $4,014 $6 13.2 Site Improvements $0 $2,103 $2,973 $0 $5,077 $508 $0 $1,675 $7,260 $12 13.3 Site Facilities $3,769 $0 $4,231 $0 $8,000 $800 $0 $2,640 $11,440 $18
Subtotal $3,769 $2,222 $9,893 $0 $15,884 $1,588 $0 $5,242 $22,714 $37 14 Buildings & Structures
14.1 Combustion Turbine Area $0 $317 $179 $0 $496 $50 $0 $109 $655 $1 14.2 Steam Turbine Building $0 $2,930 $4,172 $0 $7,102 $710 $0 $1,172 $8,984 $14 14.3 Administration Building $0 $1,013 $734 $0 $1,747 $175 $0 $288 $2,210 $4 14.4 Circulation Water Pumphouse $0 $200 $106 $0 $305 $31 $0 $50 $386 $1 14.5 Water Treatment Buildings $0 $623 $607 $0 $1,230 $123 $0 $203 $1,556 $3 14.6 Machine Shop $0 $518 $354 $0 $873 $87 $0 $144 $1,104 $2 14.7 Warehouse $0 $837 $540 $0 $1,377 $138 $0 $227 $1,742 $3 14.8 Other Buildings & Structures $0 $501 $390 $0 $891 $89 $0 $196 $1,177 $2 14.9 Waste Treating Building & Str. $0 $1,121 $2,140 $0 $3,261 $326 $0 $717 $4,304 $7
Subtotal $0 $8,059 $9,222 $0 $17,282 $1,728 $0 $3,107 $22,117 $36 Total $762,350 $88,130 $312,716 $0 $1,163,195 $116,320 $38,199 $205,336 $1,523,050 $2,449

Cost and Performance Baseline for Fossil Energy Plants Volume 1b: Revision 2b
195
Exhibit 3-89 Case B5A owner’s costs
Description $/1,000 $/kW Pre-Production Costs
6 Months All Labor $14,667 $24 1 Month Maintenance Materials $3,346 $5 1 Month Non-fuel Consumables $452 $1
1 Month Waste Disposal $473 $1 25% of 1 Months Fuel Cost at 100% CF $2,920 $5
2% of TPC $30,461 $49 Total $52,318 $84
Inventory Capital 60-day supply of fuel and consumables at 100% CF $23,916 $38
0.5% of TPC (spare parts) $7,615 $12 Total $31,532 $51
Other Costs Initial Cost for Catalyst and Chemicals $11,013 $18
Land $900 $1 Other Owner's Costs $228,457 $367
Financing Costs $41,122 $66 Total Overnight Costs (TOC) $1,888,393 $3,036
TASC Multiplier (IOU, high-risk, 35 year) 1.140 Total As-Spent Cost (TASC) $2,152,768 $3,461

Cost and Performance Baseline for Fossil Energy Plants Volume 1b: Revision 2b
196
Exhibit 3-90 Case B5A initial and annual operating and maintenance costs Case: B5A – GEE Radiant IGCC w/o CO₂ Cost Base: Jun 2011
Plant Size (MW,net): 622 Heat Rate-net (Btu/kWh): 8,758 Capacity Factor (%): 80 Operating & Maintenance Labor
Operating Labor Operating Labor Requirements per Shift Operating Labor Rate (base): 39.70 $/hour Skilled Operator: 2.0
Operating Labor Burden: 30.00 % of base Operator: 9.0 Labor O-H Charge Rate: 25.00 % of labor Foreman: 1.0
Lab Tech's, etc.: 3.0 Total: 15.0
Fixed Operating Costs Annual Cost ($) ($/kW-net)
Annual Operating Labor: $6,781,554 $10.904 Maintenance Labor: $16,685,386 $26.828
Administrative & Support Labor: $5,866,735 $9.433 Property Taxes and Insurance: $30,460,991 $48.977
Total: $59,794,666 $96.142 Variable Operating Costs
($) ($/MWh-net) Maintenance Material: $32,119,526 $7.36931
Consumables Consumption Cost ($) Initial Fill Per Day Per Unit Initial Fill
Water (/1000 gallons): 0 3,423 $1.67 $0 $1,673,317 $0.38392 Makeup and Waste Water
Treatment Chemicals (lbs): 0 20,395 $0.27 $0 $1,595,062 $0.36596
Carbon (Mercury Removal) (lb): 92,086 158 $5.50 $506,474 $253,237 $0.05810 COS Catalyst (m3): 422 0.29 $3,751.70 $1,582,971 $316,594 $0.07264
Selexol Solution (gal): 242,554 36 $36.79 $8,923,873 $386,544 $0.08869 Claus Catalyst (ft3): w/equip. 1.94 $203.15 $0 $115,175 $0.02643
Subtotal: $11,013,317 $4,339,929 $0.99573 Waste Disposal
Spent Mercury Catalyst (lb.): 0 158 $0.65 $0 $29,932 $0.00687 Flyash (ton): 0 0 $0.00 $0 $0 $0.00000
Slag (ton): 0 615 $25.11 $0 $4,507,185 $1.03410 Subtotal: $0 $4,537,118 $1.04097
By-Products Sulfur (tons): 0 140 $0.00 $0 $0 $0.00000
Subtotal: $0 $0 $0.00000 Variable Operating Costs Total: $11,013,317 $40,996,573 $9.40600
Fuel Cost Illinois Number 6 (ton): 0 5,603 $68.54 $0 $112,132,176 $25.72691
Total: $0 $112,132,176 $25.72691
Exhibit 3-91 Case B5A COE breakdown
Component Value, $/MWh Percentage Capital 53.7 52%
Fixed 13.7 13% Variable 9.4 9%
Fuel 25.7 25% Total (Excluding T&S) 102.6 N/A
CO2 T&S 0.0 0% Total (Including T&S) 102.6 N/A

Cost and Performance Baseline for Fossil Energy Plants Volume 1b: Revision 2b
197
3.4.8 Case B5B - GEE Radiant IGCC with CO2 Capture Case B5B is configured to produce electric power with CO2 capture. The plant configuration is the same as Case B5A, namely two gasifier trains, two state-of-the-art 2008 F-class turbines, two HRSGs, and one steam turbine. The gross power output from the plant is constrained by the capacity of the two CTs, and since the CO2 capture process increases the auxiliary load on the plant, the net output is significantly reduced relative to Case B5A.
The process description for Case B5B is similar to Case B5A with several notable exceptions to accommodate CO2 capture. A BFD and stream tables for Case B5B are shown in Exhibit 3-92 and Exhibit 3-93, respectively. Instead of repeating the entire process description, only differences from Case B5A are reported here.
3.4.8.1 Gasification The gasification process is the same as Case B5A with the exception that total coal feed to the two gasifiers is 5,302 tonnes/day (5,844 tpd) (stream 6) and the ASU provides 4,342 tonnes/day (4,786 tpd) of 95 percent oxygen to the gasifier and Claus plant (streams 3 and 5).
3.4.8.2 Raw Gas Cooling/Particulate Removal Raw gas cooling and particulate removal are the same as Case B5A with the exception that approximately 443,118 kg/hr (976,891 lb/hr) of saturated steam at 13.8 MPa (2,000 psia) is generated in the radiant SGCs.
3.4.8.3 Syngas Scrubber/Sour Water Stripper No differences from Case B5A.
3.4.8.4 Sour Gas Shift The SGS process was described in Section 3.1.3. In Case B5B steam (stream 11) is added to the syngas exiting the scrubber to adjust the H2O:CO molar ratio to 2:1 prior to the first SGS reactor. The hot syngas exiting the first stage of SGS is used to generate the steam that is added in stream 11. A second stage of SGS results in 97 percent overall conversion of the CO to CO2. The warm syngas from the second stage of SGS (stream 12) is cooled to 236°C (456°F) by preheating the unshifted syngas prior to the SGS. The SGS catalyst also serves to hydrolyze COS, thus eliminating the need for a separate COS hydrolysis reactor. Following the second SGS cooler, the syngas is further cooled to 35°C (95°F) prior to the mercury removal beds.
3.4.8.5 Mercury Removal and AGR Mercury removal is the same as in Case B5A.
The AGR process in Case B5B is a two-stage Selexol process where H2S is removed in the first stage and CO2 in the second stage of absorption, as previously described in Section 3.1.5. The process results in three product streams: the clean syngas, a CO2-rich stream and an acid gas feed to the Claus plant. The acid gas (stream 18) contains 35 percent H2S and 52 percent CO2 with the balance primarily N2. The CO2-rich stream is discussed further in the CO2 compression section.

Cost and Performance Baseline for Fossil Energy Plants Volume 1b: Revision 2b
198
Exhibit 3-92 Case B5B block flow diagram, GEE IGCC with CO2 capture
Source: NETL
GAS TURBINE
COMBUSTOR
TURBINE COOLING AIR
QUENCH AND SYNGAS
SCRUBBER
GAS COOLINGBFW HEATING& KNOCKOUT
SHIFT REACTORS
ELEVATEDPRESSURE
ASU
GEE GASIFIER SECTION (RADIANT COOLER)
SOURWATER
STRIPPER
MERCURYREMOVAL
DUAL STAGE
SELEXOLUNIT
CLAUSPLANT
HRSG
AMBIENT AIR
SYNGAS EXPANDER
HYDROGENATION REACTOR AND GAS
COOLER
CO2 COMPRESSION
1
5
9
10
11
12 13 14
17
19
20
21
18
6 8
2 3
4
22
23 24
AIR TO ASU
AS-RECEIVED COAL
SLAG
SHIFTSTEAM
WATER RECYCLE TO PROCESS
DEMAND
NOTE: WATER FROM TAIL GAS COOLER MODELED,
BUT NOT SHOWN
NITROGEN DILUENTSYNGAS
CLEANGAS
CO2 STREAMS
CO2 PRODUCT
SULFUR
TAIL GAS RECYCLE TO
SELEXOL
NOTE: TAIL GAS BOOST COMPRESSOR MODELED,
BUT NOT SHOWN
FLUE GAS
STACK GAS
VENT GAS
CLAUS PLANT
OXIDANT
2X STATE-OF-THE-ART F-CLASS
GAS TURBINES
SYNGASH/P
REHEAT
15
16
CLAUS PLANT
OXIDANT
STEAM TURBINE
25Note: Block Flow Diagram is not intended to represent a complete material balance. Only major process streams and equipment are shown.
20
TAIL GAS RECYCLE FROM CLAUS PLANT
SLURRY MIXER
7SLURRY WATER

Cost and Performance Baseline for Fossil Energy Plants Volume 1b: Revision 2b
199
Exhibit 3-93 Case B5B stream table, GEE IGCC with capture 1 2 3 4 5 6 7 8 9 10 11 12 13 14
V-L Mole Fraction Ar 0.0092 0.0166 0.0318 0.0023 0.0318 0.0000 0.0000 0.0000 0.0086 0.0068 0.0000 0.0054 0.0071 0.0071 CH4 0.0000 0.0000 0.0000 0.0000 0.0000 0.0000 0.0000 0.0000 0.0011 0.0009 0.0000 0.0007 0.0009 0.0009 CO 0.0000 0.0000 0.0000 0.0000 0.0000 0.0000 0.0000 0.0000 0.3576 0.2823 0.0000 0.0060 0.0078 0.0077 CO2 0.0003 0.0054 0.0000 0.0000 0.0000 0.0000 0.0000 0.0000 0.1380 0.1089 0.0000 0.3082 0.4019 0.4055 COS 0.0000 0.0000 0.0000 0.0000 0.0000 0.0000 0.0000 0.0000 0.0002 0.0001 0.0000 0.0000 0.0000 0.0000 H2 0.0000 0.0000 0.0000 0.0000 0.0000 0.0000 0.0000 0.0000 0.3406 0.2689 0.0000 0.4366 0.5692 0.5649 H2O 0.0099 0.1363 0.0000 0.0003 0.0000 0.0000 0.9995 0.0000 0.1369 0.3190 1.0000 0.2325 0.0012 0.0013 HCl 0.0000 0.0000 0.0000 0.0000 0.0000 0.0000 0.0000 0.0000 0.0008 0.0002 0.0000 0.0001 0.0000 0.0000 H2S 0.0000 0.0000 0.0000 0.0000 0.0000 0.0000 0.0000 0.0000 0.0073 0.0057 0.0000 0.0047 0.0061 0.0061 N2 0.7732 0.7061 0.0178 0.9920 0.0178 0.0000 0.0000 0.0000 0.0070 0.0055 0.0000 0.0044 0.0058 0.0064 NH3 0.0000 0.0000 0.0000 0.0000 0.0000 0.0000 0.0005 0.0000 0.0019 0.0016 0.0000 0.0013 0.0000 0.0000 O2 0.2074 0.1356 0.9504 0.0054 0.9504 0.0000 0.0000 0.0000 0.0000 0.0000 0.0000 0.0000 0.0000 0.0000 SO2 0.0000 0.0000 0.0000 0.0000 0.0000 0.0000 0.0000 0.0000 0.0000 0.0000 0.0000 0.0000 0.0000 0.0000 Total 1.0000 1.0000 1.0000 1.0000 1.0000 0.0000 1.0000 0.0000 1.0000 1.0000 1.0000 1.0000 1.0000 1.0000 V-L Flowrate (kgmole/hr) 27,361 1,650 96 20,050 5,526 0 5,037 0 23,122 29,284 7,193 36,477 27,978 28,367 V-L Flowrate (kg/hr) 789,549 45,326 3,080 562,613 177,826 0 90,747 0 465,238 575,977 129,586 705,563 552,385 564,913 Solids Flowrate (kg/hr) 0 0 0 0 0 220,902 0 24,237 0 0 0 0 0 0
Temperature (°C) 15 18 32 93 32 15 142 1,316 677 206 288 240 35 35 Pressure (MPa, abs) 0.10 0.11 0.86 2.65 0.86 0.10 5.79 5.62 5.55 5.52 5.52 5.41 5.14 5.10 Steam Table Enthalpy (kJ/kg) A 30.23 35.64 26.67 92.50 26.67 --- 537.77 --- 1,428.30 1,066.52 2,917.15 942.88 37.11 36.40 AspenPlus Enthalpy (kJ/kg)B -97.58 -1,492.10 4.13 63.47 4.13 -2,116.95 -15,427.03 -727.24 -5,246.11 -7,406.90 -13,053.16 -8,863.69 -8,084.69 -8,087.64 Density (kg/m3) 1.2 1.5 11.0 24.4 11.0 --- 872.0 --- 14.0 27.2 25.6 24.8 40.7 40.9 V-L Molecular Weight 28.857 27.476 32.181 28.060 32.181 --- 18.015 --- 20.121 19.669 18.015 19.343 19.744 19.914
V-L Flowrate (lbmole/hr) 60,320 3,637 211 44,204 12,182 0 11,105 0 50,975 64,560 15,858 80,418 61,680 62,539 V-L Flowrate (lb/hr) 1,740,658 99,926 6,790 1,240,349 392,039 0 200,062 0 1,025,674 1,269,812 285,687 1,555,499 1,217,800 1,245,421 Solids Flowrate (lb/hr) 0 0 0 0 0 487,005 0 53,433 0 0 0 0 0 0
Temperature (°F) 59 65 90 199 90 59 287 2,400 1,250 403 550 463 95 95 Pressure (psia) 14.7 16.4 125.0 384.0 125.0 14.7 840.0 815.0 805.0 800.0 800.0 785.0 745.0 740.0 Steam Table Enthalpy (Btu/lb)A 13.0 15.3 11.5 39.8 11.5 --- 231.2 --- 614.1 458.5 1,254.1 405.4 16.0 15.7 AspenPlus Enthalpy (Btu/lb)B -42.0 -641.5 1.8 27.3 1.8 -910.1 -6,632.4 -312.7 -2,255.4 -3,184.4 -5,611.9 -3,810.7 -3,475.8 -3,477.1 Density (lb/ft3) 0.076 0.091 0.687 1.521 0.687 --- 54.440 --- 0.871 1.699 1.597 1.550 2.544 2.552
ASteam table reference conditions are 32.02°F & 0.089 psia BAspen thermodynamic reference state is the component’s constituent elements in an ideal gas state at 25°C and 1 atm

Cost and Performance Baseline for Fossil Energy Plants Volume 1b: Revision 2b
200
Exhibit 3-93 Case B5B stream table, GEE IGCC with capture (continued) 15 16 17 18 19 20 21 22 23 24 25
V-L Mole Fraction Ar 0.0115 0.0115 0.0115 0.0002 0.0018 0.0000 0.0103 0.0092 0.0091 0.0091 0.0000 CH4 0.0015 0.0015 0.0015 0.0000 0.0004 0.0000 0.0000 0.0000 0.0000 0.0000 0.0000 CO 0.0124 0.0124 0.0124 0.0002 0.0022 0.0000 0.0064 0.0000 0.0000 0.0000 0.0000 CO2 0.0502 0.0502 0.0502 0.9948 0.5214 0.0000 0.6664 0.0003 0.0083 0.0083 0.0000 COS 0.0000 0.0000 0.0000 0.0000 0.0002 0.0000 0.0000 0.0000 0.0000 0.0000 0.0000 H2 0.9139 0.9139 0.9139 0.0048 0.1028 0.0000 0.2562 0.0000 0.0000 0.0000 0.0000 H2O 0.0001 0.0001 0.0001 0.0000 0.0226 0.0000 0.0017 0.0099 0.1222 0.1222 1.0000 HCl 0.0000 0.0000 0.0000 0.0000 0.0000 0.0000 0.0000 0.0000 0.0000 0.0000 0.0000 H2S 0.0000 0.0000 0.0000 0.0000 0.3477 0.0000 0.0050 0.0000 0.0000 0.0000 0.0000 N2 0.0105 0.0105 0.0105 0.0000 0.0008 0.0000 0.0541 0.7732 0.7541 0.7541 0.0000 NH3 0.0000 0.0000 0.0000 0.0000 0.0000 0.0000 0.0000 0.0000 0.0000 0.0000 0.0000 O2 0.0000 0.0000 0.0000 0.0000 0.0000 0.0000 0.0000 0.2074 0.1064 0.1064 0.0000 SO2 0.0000 0.0000 0.0000 0.0000 0.0000 0.0000 0.0000 0.0000 0.0000 0.0000 0.0000 Total 1.0000 1.0000 1.0000 1.0000 1.0000 0.0000 1.0000 1.0000 1.0000 1.0000 1.0000 V-L Flowrate (kgmole/hr) 17,423 17,423 17,423 10,425 497 0 390 110,253 139,657 139,657 34,514 V-L Flowrate (kg/hr) 90,178 90,178 90,178 456,650 17,683 0 12,529 3,181,557 3,834,349 3,834,349 621,772 Solids Flowrate (kg/hr) 0 0 0 0 0 5,524 0 0 0 0 0
Temperature (°C) 35 241 196 51 48 178 38 15 562 132 534 Pressure (MPa, abs) 5.10 5.07 3.17 15.27 0.16 0.12 5.51 0.10 0.10 0.10 12.51 Steam Table Enthalpy (kJ/kg) A 195.53 1,389.05 1,124.24 -162.31 74.87 --- 5.30 30.23 834.76 343.83 3,432.88 AspenPlus Enthalpy (kJ/kg)B -4,051.34 -2,857.82 -3,122.63 -9,120.19 -6,107.59 141.99 -8,217.57 -97.58 -587.80 -1,078.73 -12,537.44 Density (kg/m3) 10.1 6.0 4.2 641.8 2.2 5,280.5 77.9 1.2 0.4 0.9 36.7 V-L Molecular Weight 5.176 5.176 5.176 43.805 35.588 --- 32.150 28.857 27.456 27.456 18.015
V-L Flowrate (lbmole/hr) 38,412 38,412 38,412 22,983 1,095 0 859 243,066 307,891 307,891 76,089 V-L Flowrate (lb/hr) 198,808 198,808 198,808 1,006,740 38,985 0 27,621 7,014,133 8,453,292 8,453,292 1,370,772 Solids Flowrate (lb/hr) 0 0 0 0 0 12,178 0 0 0 0 0
Temperature (°F) 95 465 384 124 119 352 100 59 1,044 270 994 Pressure (psia) 740.0 735.0 460.0 2,214.7 23.7 17.3 799.5 14.7 15.2 15.2 1,814.7 Steam Table Enthalpy (Btu/lb)A 84.1 597.2 483.3 -69.8 32.2 --- 2.3 13.0 358.9 147.8 1,475.9 AspenPlus Enthalpy (Btu/lb)B -1,741.8 -1,228.6 -1,342.5 -3,921.0 -2,625.8 61.0 -3,532.9 -42.0 -252.7 -463.8 -5,390.1 Density (lb/ft3) 0.630 0.377 0.260 40.068 0.137 329.649 4.864 0.076 0.026 0.053 2.293
ASteam table reference conditions are 32.02°F & 0.089 psia BAspen thermodynamic reference state is the component’s constituent elements in an ideal gas state at 25°C and 1 atm

Cost and Performance Baseline for Fossil Energy Plants Volume 1b: Revision 2b
201
3.4.8.6 CO2 Compression and Dehydration CO2 from the AGR process is flashed at three pressure levels to separate CO2 and decrease H2 losses to the CO2 product pipeline. The HP CO2 stream is flashed at 2.0 MPa (289.7 psia), compressed, and recycled back to the CO2 absorber. The MP CO2 stream is flashed at 1.0 MPa (149.7 psia). The LP CO2 stream is flashed at 0.1 MPa (16.7 psia), compressed to 1.0 MPa (149.5 psia), and combined with the MP CO2 stream. The combined stream is compressed from 2.1 MPa (149.5 psia) to an SC condition at 15.3 MPa (2,215 psia) using a multiple-stage, intercooled compressor. During compression, the CO2 stream is dehydrated to a dew point of -40ºC (-40°F) with triethylene glycol. The raw CO2 stream from the Selexol process contains over 99 percent CO2. The CO2 (stream 17) is transported to the plant fence line and is sequestration ready. CO2 T&S costs were estimated using the methodology described in Section 2.6.
3.4.8.7 Claus Unit The Claus plant is the same as Case B5A with the following exceptions:
• 5,528 kg/hr (12,178 lb/hr) of sulfur (stream 19) are produced • The waste heat boiler generates 13,555 kg/hr (29,884 lb/hr) of 4.0 MPa (575 psia) steam
of which 12,679 kg/hr (27,953 lb/hr) is available to the medium pressure steam header
3.4.8.8 Power Block Clean syngas from the AGR plant is heated to 241°C (465°F) using HP BFW before passing through an expansion turbine. The clean syngas (stream 16) is diluted with nitrogen (stream 4) and then enters the CT burner. There is no integration between the CT and the ASU in this case. The exhaust gas (stream 22) exits the CT at 562°C (1,044°F) and enters the HRSG where additional heat is recovered. The flue gas exits the HRSG at 132°C (270°F) (stream 23) and is discharged through the plant stack. The steam raised in the HRSG is used to power an advanced commercially available steam turbine using a 12.4 MPa/534°C/534°C (1,800 psig/994°F/994°F) steam cycle.
3.4.8.9 Air Separation Unit (ASU) The same elevated pressure ASU is used in Case B5B and produces 4,342 tonnes/day (4,786 tpd) of 95 mol% oxygen and 14,591 tonnes/day (16,084 tpd) of nitrogen. There is no integration between the ASU and the CT in the CO2 capture case.
3.4.9 Case B5B - Performance Results The Case B5B modeling assumptions were presented previously in Section 3.4.3.
The plant produces a net output of 543 MW at a net plant efficiency of 32.6 percent (HHV basis). Overall performance for the entire plant is summarized in Exhibit 3-94; Exhibit 3-95 provides a detailed breakdown of the auxiliary power requirements. The ASU accounts for nearly 60 percent of the auxiliary load between the main air compressor, nitrogen compressor, oxygen compressor, and ASU auxiliaries. The two-stage Selexol process and CO2 compression account for an additional 26 percent of the auxiliary power load. The BFW pumps and cooling water system (CWPs and cooling tower fan) compose over 6 percent of the load, leaving 8 percent of the auxiliary load for all other systems.

Cost and Performance Baseline for Fossil Energy Plants Volume 1b: Revision 2b
202
Exhibit 3-94 Case B5B plant performance summary
Performance Summary
Combustion Turbine Power, MWe 464
Sweet Gas Expander Power, MWe 7
Steam Turbine Power, MWe 264
Total Gross Power, MWe 734
Air Separation Unit Main Air Compressor, kWe 67,330
Oxygen Compressor, kWe 10,640
Nitrogen Compressors, kWe 35,640
CO₂ Compression, kWe 31,160
Acid Gas Removal, kWe 19,230
Balance of Plant, kWe 26,870
Total Auxiliaries, MWe 191
Net Power, MWe 543
HHV Net Plant Efficiency (%) 32.6%
HHV Net Plant Heat Rate, kJ/kWh (Btu/kWh) 11,034 (10,459)
HHV Cold Gas Efficiency, % 79.2%
HHV Combustion Turbine Efficiency, % 36.0%
LHV Net Plant Efficiency (%) 33.8%
LHV Net Plant Heat Rate, kJ/kWh (Btu/kWh) 10,643 (10,087)
LHV Cold Gas Efficiency, % 75.9%
LHV Combustion Turbine Efficiency, % 42.4%
Steam Turbine Cycle Efficiency, % 42.4%
Steam Turbine Heat Rate, kJ/kWh (Btu/kWh) 8,496 (8,053)
Condenser Duty, GJ/hr (MMBtu/hr) 1,513 (1,434)
As-Received Coal Feed, kg/hr (lb/hr) 220,902 (487,005)
HHV Thermal Input, kWt 1,665,056
LHV Thermal Input, kWt 1,605,967
Raw Water Withdrawal, (m3/min)/MWnet (gpm/MWnet) 0.041 (10.7)
Raw Water Consumption, (m3/min)/MWnet (gpm/MWnet) 0.033 (8.8)
O₂:Coal 0.761

Cost and Performance Baseline for Fossil Energy Plants Volume 1b: Revision 2b
203
Exhibit 3-95 Case B5B plant power summary
Power Summary
Combustion Turbine Power, MWe 464
Sweet Gas Expander Power, MWe 7
Steam Turbine Power, MWe 264
Total Gross Power, MWe 734
Auxiliary Load Summary
Coal Handling, kWe 470
Coal Milling, kWe 2,270
Sour Water Recycle Slurry Pump, kWe 190
Slag Handling, kWe 1,160
Air Separation Unit Auxiliaries, kWe 1,000
Air Separation Unit Main Air Compressor, kWe 67,330
Oxygen Compressor, kWe 10,640
Nitrogen Compressors, kWe 35,640
Feedwater Pumps, kWe 4,180
Quench Water Pump, kWe 540
Syngas Recycle Compressor, kWe 0
CO₂ Compression, kWe 31,160
Scrubber Pumps, kWe 230
Acid Gas Removal, kWe 19,230
Combustion Turbine Auxiliaries, kWe 1,000
Steam Turbine Auxiliaries, kWe 100
Condensate Pumps, kWe 280
Circulating Water Pumps, kWe 4,630
Ground Water Pumps, kWe 530
Cooling Tower Fans, kWe 2,400
Claus Plant/TGTU Auxiliaries, kWe 250
Claus Plant TG Recycle Compressor, kWe 1,780
Miscellaneous Balance of PlantA,B, kWe 3,000
Transformer Losses, kWe 2,860
Total Auxiliaries, MWe 191
Net Power, MWe 543
AIncludes plant control systems, lighting, HVAC, and miscellaneous low voltage loads

Cost and Performance Baseline for Fossil Energy Plants Volume 1b: Revision 2b
204
3.4.9.1 Environmental Performance The environmental targets for emissions of Hg, NOx, SO2, and PM were presented in Section 2.4. A summary of the plant air emissions for Case B5B is presented in Exhibit 3-96. All HCl is assumed to be removed and is, therefore, not reported.
Exhibit 3-96 Case B5B air emissions
kg/GJ (lb/MMBtu) Tonne/year (ton/year)A kg/MWh (lb/MWh)B
SO2 0.001 (0.002) 39 (43) 0.008 (0.017)
NOx 0.021 (0.049) 878 (967) 0.171 (0.376)
Particulates 0.003 (0.0071) 128 (141) 0.025 (0.055)
Hg 1.67E-7 (3.88E-7) 0.007 (0.008) 1.36E-6 (3.00E-6)
CO2 8 (20) 355,435 (391,800) 69 (152)
CO2C - - 93 (206)
ACalculations based on an 80 percent capacity factor BEmissions are based on gross power except where otherwise noted CCO2 emissions based on net power instead of gross power
The low level of SO2 emissions is achieved by capturing the sulfur in the gas by the two-stage Selexol AGR process. As a result of achieving the 90 percent CO2 removal target, the sulfur compounds are removed to an extent that exceeds the environmental target in Section 2.3. The clean syngas exiting the AGR process has a sulfur concentration of approximately 5 ppmv. This results in a concentration in the flue gas of less than 1 ppmv. The H2S-rich regeneration gas from the AGR system is fed to a Claus plant, producing elemental sulfur. The Claus plant tail gas is hydrogenated to convert all sulfur species to H2S and then recycled back to the Selexol process, thereby eliminating the need for a tail gas treatment unit.
NOx emissions are limited by nitrogen dilution to 15 ppmvd (as NO2 @15 percent O2). Ammonia in the syngas is removed with process condensate prior to the low-temperature AGR process. This helps lower NOx levels as well.
Particulate discharge to the atmosphere is limited to extremely low values by the use of the syngas quench in addition to the syngas scrubber and the gas washing effect of the AGR absorber. The particulate emissions represent filterable particulate only.
Approximately 97 percent of the mercury is captured from the syngas by dual activated carbon beds.
Ninety two percent of the CO2 from the syngas is captured in the AGR system and compressed for sequestration. Because not all CO is converted to CO2 in the shift reactors, the overall carbon removal is 90.0 percent.
The carbon balance for the plant is shown in Exhibit 3-97. The carbon input to the plant consists of carbon in the air in addition to carbon in the coal. Carbon leaves the plant as unburned carbon in the slag and as CO2 in the stack gas, ASU vent gas, and the captured CO2 product. The carbon capture efficiency is defined as one minus the amount of carbon in the stack gas relative to the total carbon in less carbon contained in the slag, represented by the following fraction:

Cost and Performance Baseline for Fossil Energy Plants Volume 1b: Revision 2b
205
𝐶𝐶𝐶𝐶𝐶𝐶𝐶𝐶𝐶𝐶𝐸𝐸 𝐴𝐴𝐸𝐸 𝑆𝑆𝐶𝐶𝐶𝐶𝑆𝑆𝑆𝑆(𝑇𝑇𝐶𝐶𝐶𝐶𝐶𝐶𝑇𝑇 𝐶𝐶𝐶𝐶𝐶𝐶𝐶𝐶𝐶𝐶𝐸𝐸 𝑅𝑅𝐸𝐸) − (𝐶𝐶𝐶𝐶𝐶𝐶𝐶𝐶𝐶𝐶𝐸𝐸 𝐴𝐴𝐸𝐸 𝑆𝑆𝑇𝑇𝐶𝐶𝑆𝑆) = �1 − �
30,516311,631 − 6,209
� ∗�100 = 90.0%
Exhibit 3-97 Case B5B carbon balance
Carbon In Carbon Out
kg/hr (lb/hr) kg/hr (lb/hr)
Coal 140,813 (310,440) Stack Gas 13,842 (30,516)
Air (CO₂) 540 (1,191) CO₂ Product 124,589 (274,672)
ASU Vent 107 (237)
Slag 2,816 (6,209)
Total 141,353 (311,631) Total 141,353 (311,631)
Exhibit 3-98 shows the sulfur balance for the plant. Sulfur input comes solely from the sulfur in the coal. Sulfur output includes the sulfur recovered in the Claus plant and sulfur emitted in the stack gas. Sulfur in the slag is considered to be negligible.
Exhibit 3-98 Case B5B sulfur balance
Sulfur In Sulfur Out
kg/hr (lb/hr) kg/hr (lb/hr)
Coal 5,537 (12,206) Stack Gas 3 (6)
CO₂ Product 10 (23)
Elemental Sulfur 5,524 (12,178)
Total 5,537 (12,206) Total 5,537 (12,206)
Exhibit 3-99 shows the overall water balance for the plant. The exhibit is presented in an identical manner as for cases B1A-B5A.

Cost and Performance Baseline for Fossil Energy Plants Volume 1b: Revision 2b
206
Exhibit 3-99 Case B5B water balance
Water Use Water Demand
Internal Recycle
Raw Water Withdrawal
Process Water
Discharge Raw Water
Consumption
m3/min (gpm)
m3/min (gpm)
m3/min (gpm) m3/min (gpm) m3/min (gpm)
Slag Handling 0.53 (139) 0.53 (139) – – –
Slurry Water 1.51 (400) 1.51 (400) – – –
Quench/Wash 2.86 (757) 0.72 (191) 2.14 (566) – 2.14 (566)
Humidifier – – – – –
SWS Blowdown – – – 0.03 (7.30) -0.03 (-7.30)
Condenser Makeup 2.37 (627) – 2.37 (627) – 2.37 (627)
BFW Makeup 0.21 (56) – 0.21 (56) – 0.21 (56)
Gasifier Steam – – – – –
Shift Steam 2.16 (571) – 2.16 (571) – 2.16 (571)
CT Steam Dilution – – – – –
Cooling Tower 18.06 (4,770) 0.49 (129) 17.57 (4,641) 4.06 (1,073) 13.51 (3,568)
BFW Blowdown – 0.21 (56) -0.21 (-56) – -0.21 (-56)
SWS Blowdown – 0.28 (72.96) -0.28 (-72.96) – -0.28 (-72.96)
Total 25.33 (6,692) 3.25 (858) 22.08 (5,834) 4.09 (1,080) 18.00 (4,754)
3.4.9.2 Heat and Mass Balance Diagrams Heat and mass balance diagrams are shown for the following subsystems in Exhibit 3-100 through Exhibit 3-102:
• Coal gasification and ASU • Syngas cleanup, sulfur recovery, and tail gas recycle • Combined cycle power generation, steam, and FW
An overall plant energy balance is presented in tabular form in Exhibit 3-103. The power out is the combined CT, steam turbine, and expander power prior to generator losses. The power at the generator terminals (shown in Exhibit 3-94) is calculated by multiplying the power out by a combined generator efficiency of 98.5 percent.

Cost and Performance Baseline for Fossil Energy Plants Volume 1b: Revision 2b
207
Exhibit 3-100 Case B5B coal gasification and ASU heat and mass balance schematic
Source: NETL
DOE/NETL
DUAL TRAIN IGCC PLANTCASE B5B
HEAT AND MATERIAL FLOW DIAGRAM
BITUMINOUS BASELINE STUDYCASE B5B
GEE GASIFIERASU AND GASIFICATION
DWG. NO.BB-HMB-CS-B5B-PG-1
PLANT PERFORMANCE SUMMARY
LEGEND
PAGES1 OF 3
Ambient Air
Four Stage AirCompressor
ElevatedPressure
ASU
Four Stage N2Compressor
Four Stage O2Compressor
ASU Vent
1,740,658 W59 T15 P13 H
392,039 W90 T
125 P11 H
392,039 W241 T940 P41 H
To Claus Plant
6,790 W90 T
125 P11 H
99,926 W65 T16 P15 H
1,083,575 W90 T56 P14 H
156,775 W50 T
182 P3 H
5
1
3
2
Slurry Mix Tank
Slag
487,005 W59 T15 P
200,062 W287 T840 P231 H
53,433 W2,400 T
815 P
676,490 W385 T384 P87 H
687,067 W156 T840 P
1,739,104 W100 T190 P18 H
6
676,490 W199 T384 P40 H
N2 BoostCompressor563,859 W
199 T384 P40 H
563,859 W385 T469 P87 H
GE Energy Gasifier
RadiantSyngasCooler
Syngas Scrubber
Slag Quench Section
Drag Conveyor
4
1,025,674 W1,250 T
805 P612 H
1,269,812 W403 T800 P458 H
SyngasQuench
1,403,971 W450 T805 P536 H
8
9
10
378,297 W371 T
1,200 P329 H
From SourWater Stripper
To Fuel Gas Preheater
From Fuel Gas Preheater
386,894 W403 T800 P419 H
386,894 W150 T
1,205 P118 H
To SourWater Stripper
69,404 W286 T115 P228 H
7
N2 to GT Combustor
N2 to GT Combustor
Raw Fuel Gas
From HP Economizer 2
To HP Economizer 1
To Superheater
From HP Economizer 2
Air
Oxygen
Nitrogen
Coal/Char/Slurry/Slag
Synthesis Gas
Water
Steam
W Flowrate, lbm/hr T Temperature, °FP Absolute Pressure, PSIAH Enthalpy, Btu/lbmMWe Power, Megawatts Electrical
Flue Gas/CombustionProducts
Gross Plant Power: 734 MWeAuxiliary Load: 191 MWeNet Plant Power: 543 MWeNet Plant Efficiency, HHV: 32.6%Net Plant Heat Rate: 10,459 Btu/kWh
Milled Coal
Notes:1. Enthalpy reference point is natural state
at 32 °F and 0.08865 psia

Cost and Performance Baseline for Fossil Energy Plants Volume 1b: Revision 2b
208
Exhibit 3-101 Case B5B syngas cleanup heat and mass balance schematic
Source: NETL
DOE/NETL
DUAL TRAIN IGCC PLANTCASE B5B
HEAT AND MATERIAL FLOW DIAGRAM
BITUMINOUS BASELINE STUDYCASE B5B
GEE GASIFIERGAS CLEANUP SYSTEM
DWG. NO.BB-HMB-CS-B5B-PG-2
PLANT PERFORMANCE SUMMARY
LEGEND
PAGES2 OF 3
Mercury Removal
KnockOut
Drum
SourDrum
Claus Plant
Tail Gas
Furnace
CatalyticReactorBeds
Sulfur
Knock Out
SyngasCoolers
SourStripper
1,269,812 W403 T800 P458 H
1,245,421 W95 T
740 P16 H
38,985 W119 T24 P32 H
198,808 W384 T460 P483 H
12,178 W
36,092 W450 T12 P
458 H
2,495 W239 T65 P
442 H
19
1320
36,092 W550 T11 P
419 H
1,217,800 W95 T
745 P16 H
8,470 W114 T11 P40 H
27,621 W100 T800 P
2 H
15198,808 W
95 T740 P84 H
18
Fuel GasExpander
16198,808 W
465 T735 P597 H
HighTemperature
Shift #1
Low Temperature
Shift #2
12
11
1,269,812 W413 T795 P450 H
285,687 W550 T800 P
1,246 H
1,555,499 W436 T795 P598 H
1,555,499 W776 T795 P582 H
1,555,499 W400 T795 P408 H
1,555,499 W463 T785 P405 H
1,555,499 W456 T780 P402 H
Two-StageSelexol
Clean Gas
CO2
Acid Gas
Multistage Intercooled CO2
Compressor
Interstage Knockout
17
10
14
1,006,740 W124 T
2,215 P-70 H
Tail Gas RecycleCompressor
Hydrogenation and Tail Gas
Cooling
From IP BFW
To Reheater and Shift Steam
From IP BFW, LP BFW, and
Tail Gas Cooling
647,763 W
From Syngas Scrubber
To Coal Slurry, Syngas Quench, and Slag Quench
To Water Treatment
Makeup Water
Raw Syngas
COS Hydrolysis Preheater
Reboiler
From Syngas Scrubber and HP
Economizer 2
To Syngas Scrubber and HP
Economizer 1
Fuel Gas Preheater Fuel Gas to CT
36,790 W
90 T125 P11 H
6,790 W450 T125 P92 H
To Deaerator
From IP BFW
Claus Oxygen
Preheater
From Gland Steam Condenser To Syngas
Cooling109 T
CO2 Product
To LP Turbine, PreheaterWGS/Gasifier Steam
and Reheater
Air
Oxygen
Nitrogen
Coal/Char/Slurry/Slag
Synthesis Gas
Sour Water
Acid Gas
Tailgas
Carbon Dioxide
Sour Gas
Sulfur
Hydrogen
Water
W Flowrate, lbm/hr T Temperature, °FP Absolute Pressure, PSIAH Enthalpy, Btu/lbmMWe Power, Megawatts Electrical
Steam
Gross Plant Power: 734 MWeAuxiliary Load: 191 MWeNet Plant Power: 543 MWeNet Plant Efficiency, HHV: 32.6%Net Plant Heat Rate: 10,459 Btu/kWh
Shift Steam
Notes:1. Enthalpy reference point is natural state
at 32 °F and 0.08865 psia

Cost and Performance Baseline for Fossil Energy Plants Volume 1b: Revision 2b
209
Exhibit 3-102 Case B5B combined-cycle power generation heat and mass balance schematic
Source: NETL
DOE/NETL
DUAL TRAIN IGCC PLANTCASE B5B
HEAT AND MATERIAL FLOW DIAGRAM
BITUMINOUS BASELINE STUDYCASE B5B
GEE GASIFIERPOWER BLOCK SYSTEM
DWG. NO.BB-HMB-CS-B5B-PG-3
PLANT PERFORMANCE SUMMARY
LEGEND
Air
Oxygen
Nitrogen
Coal/Char/Slurry/Slag
Synthesis Gas
PAGES3 OF 3
Sour Gas
Sour Water
Water
Steam
Flue Gas
HPTurbine
IPTurbine
Air Inlet Filter
Steam Seal Regulator
GlandSteam
Condenser
LP Turbine
Stack
ExpanderCompressor
Generator
Generator
CondensatePumps
Steam Turbine
State-of-the-art 2008 F-Class Turbine
7,014,133 W59 T15 P13 H
1,875,814 W101 T
1 P69 H
8,453,292 W270 T15 P
148 H
198,808 W384 T460 P483 H
1,370,772 W994 T
1,815 P1,468 H
10,302 W298 T65 P
1,171 H
1,550,148 W475 T65 P
1,262 H
1,875,814 W103 T120 P71 H
1,400 W615 T65 P
1,331 H
1,400 W212 T15 P
180 H
21
24
16
23
Hot Well
Condenser
Make-up
313,504 W59 T15 P27 H
9,026 W660 T501 P
1,327 H
9,761 W615 T65 P
1,331 H
798 W994 T
1,815 P1,468 H
1,337 W505 T65 P
1,277 H
Preheater DeaeratorHeater
HP Economizer
1
LP Economizer
HP Economizer
2
HP Evaporator
Superheater/ Reheater
From Syngas Cooler HP BFW to
Radiant Syngas Cooler
From Radiant Syngas Cooler
To ASU and Fuel Gas Preheater
Deaerator
HP Pump
IP Pump
LP Evaporator
IP to Syngas and WGS Coolers
WGS Shift Steam
From Claus, Process Extraction, and 250 PSIA Header
LP Extraction Spray
LP Blowdown
LP To Syngas Coolers
Cold Reheat
Hot Reheat
8,453,292 W1,044 T
15 P359 H
22
To WWT
Process Extraction
LP Pump
LP From Syngas Coolers
W Flowrate, lbm/hr T Temperature, °FP Absolute Pressure, PSIAH Enthalpy, Btu/lbmMWe Power, Megawatts Electrical
235 T
274 T
1,857,220 W274 T45 P
242 H
1,398,890 W279 T
2,251 P247 H
9,286 W274 T79 P
242 H
6,109 W274 T79 P
242 H294,721 W274 T79 P
242 H 39,399 W276 T615 P244 H
397,467 W351 T
2,251 P319 H
305 T 585 T 636 T
28,833 W585 T
2,001 P585 H
285,687 W550 T805 P
1,221 H
550 T
636 T
976,880 W585 T
2,001 P585 H
1,342,123 W661 T501 P
1,327 H
397,467 W585 T
2,001 P585 H
303,963 W298 T65 P
266 H
195 T
224,565 W298 T65 P
1,171 H
148,214 W298 T65 P
1,171 H
293,460 W276 T820 P244 H
1,000 W994 T
1,815 P1,468 H
1,000 W212 T15 P
180 H
40,696 W500 T250 P
1,255 H
IP Extraction Steam to 250 PSIA Header
LP Extraction Spray #1
Condensate to Tail Gas Cooling
676,490 W385 T469 P87 H
Nitrogen Diluent
Fuel Gas
Ambient Air
7,773 W550 T805 P
1,221 H
IP From Syngas and WGS Coolers
994 T
298 T
From ASU and Fuel Gas Preheater
Nitrogen Diluent563,859 W
385 T384 P87 H
Blowdown Flash
Gross Plant Power: 734 MWeAuxiliary Load: 191 MWeNet Plant Power: 543 MWeNet Plant Efficiency, HHV: 32.6%Net Plant Heat Rate: 10,459 Btu/kWh
To Claus
Notes:1. Enthalpy reference point is natural state
at 32 °F and 0.08865 psia

Cost and Performance Baseline for Fossil Energy Plants Volume 1b: Revision 2b
210
This page intentionally left blank

Cost and Performance Baseline for Fossil Energy Plants Volume 1b: Revision 2b
211
Exhibit 3-103 Case B5B overall energy balance (0°C [32°F] reference)
HHV Sensible + Latent Power Total
Heat In (GJ/hr) Coal 5,994
(5,681) 5.0 (4.7) – 5,999
(5,686) Air – 120.0 (113.8) – 120.0
(113.8) Raw Water Makeup – 83.0 (78.7) – 83.0 (78.7)
Auxiliary Power – – 687 (651) 687 (651) TOTAL 5,994
(5,681) 208.1 (197.2) 687 (651) 6,889
(6,530) Heat Out (GJ/hr)
ASU Vent – 1.6 (1.5) – 1.6 (1.5) Slag 92.3 (87.5) 37.8 (35.9) – 130.2
(123.4) Stack Gas – 1,318 (1,250) – 1,318
(1,250) Sulfur 51.2 (48.5) 0.6 (0.6) – 51.8 (49.1)
Motor Losses and Design Allowances
– – 60.1 (57.0) 60.1 (57.0)
Condenser – 1,513 (1,434) – 1,513 (1,434)
Non-Condenser Cooling Tower Loads
– 668 (633) – 668 (633)
CO₂ – -74.1 (-70.2) – -74.1 (-70.2) Blowdown – 43.3 (41.0) – 43.3 (41.0)
CO₂ Capture Losses – 176.4 (167.2) – 176.4 (167.2)
Ambient LossesA – 162.4 (154.0) – 162.4 (154.0)
Power – – 2,643 (2,505)
2,643 (2,505)
TOTAL 143.5 (136.0)
3,848 (3,647) 2,703 (2,562)
6,694 (6,345)
Unaccounted EnergyB – 195 (185) – 195 (185) AAmbient losses include all losses to the environment through radiation, convection, etc. Sources of these losses include the combustor, reheater, superheater, and transformers.
3.4.10 Case B5B - Major Equipment List Major equipment items for the GEE gasifier with CO2 capture are shown in the following tables. The accounts used in the equipment list correspond to the account numbers used in the cost estimates in Section 3.4.11. In general, the design conditions include a 10 percent contingency for flows and heat duties and a 21 percent contingency for heads on pumps and fans.

Cost and Performance Baseline for Fossil Energy Plants Volume 1b: Revision 2b
212
Case B5B – Account 1: Coal Handling Equipment
No. Description Type Design Condition Operating Qty. Spares
1 Bottom Trestle Dumper and Receiving Hoppers N/A 181 tonne (200 ton) 2 0
2 Feeder Belt 570 tonne/hr (630 tph) 2 0 3 Conveyor No. 1 Belt 1,130 tonne/hr (1,250 tph) 1 0 4 Conveyor No. 2 Belt 1,130 tonne/hr (1,250 tph) 1 0 5 Stacker/Reclaimer Traveling, linear 1,130 tonne/hr (1,250 tph) 1 0 6 Reclaim Hopper N/A 50 tonne (50 ton) 2 1 7 Feeder Vibratory 180 tonne/hr (200 tph) 2 1 8 Conveyor No. 3 Belt w/ tripper 360 tonne/hr (400 tph) 1 0 9 Coal Surge Bin w/ Vent Filter Dual outlet 180 tonne (200 ton) 2 0
10 Crusher Impactor reduction 8 cm x 0 - 3 cm x 0 (3" x 0 - 1-1/4" x 0) 2 0
11 Conveyor No. 4 Belt w/ tripper 360 tonne/hr (400 tph) 1 0 12 Conveyor No. 5 Belt w/ tripper 360 tonne/hr (400 tph) 1 0
13 Coal Silo w/ Vent Filter and Slide Gates Field erected 800 tonne (900 ton) 3 0
Case B5B – Account 2: Coal Preparation and Feed Equipment
No. Description Type Design Condition Operating Qty. Spares
1 Feeder Vibratory 80 tonne/h (90 tph) 3 0 2 Conveyor No. 6 Belt w/ tripper 240 tonne/h (270 tph) 1 0 3 Rod Mill Feed Hopper Dual Outlet 490 tonne (540 ton) 1 0 4 Weigh Feeder Belt 120 tonne/h (130 tph) 2 0 5 Rod Mill Rotary 120 tonne/h (130 tph) 2 0
6 Slurry Water Storage Tank with Agitator Field erected 299,900 liters (79,220 gal) 2 0
7 Slurry Water Pumps Centrifugal 830 lpm (220 gpm) 2 1 8 Trommel Screen Coarse 170 tonne/h (190 tph) 2 0
9 Rod Mill Discharge Tank with Agitator Field erected 392,320 liters
(103,640 gal) 2 0
10 Rod Mill Product Pumps Centrifugal 3,300 lpm (900 gpm) 2 2
11 Slurry Storage Tank with Agitator Field erected 1,176,900 liters
(310,900 gal) 2 0
12 Slurry Recycle Pumps Centrifugal 6,500 lpm (1,700 gpm) 2 2
13 Slurry Product Pumps Positive displacement 3,300 lpm (900 gpm) 2 2
Case B5B – Account 3: Feedwater and Miscellaneous Systems and Equipment Equipment
No. Description Type Design Condition Operating Qty. Spares
1 Demineralized Water Storage Tank
Vertical, cylindrical, outdoor 1,094,000 liters (289,000 gal) 2 0
2 Condensate Pumps Vertical canned 7,850 lpm @ 90 m H₂O (2,070 gpm @ 300 ft H₂O) 2 1
3 Deaerator (integral w/ HRSG) Horizontal spray type 546,000 kg/hr (1,205,000
lb/hr) 2 0
4 Intermediate-Pressure Feedwater Pump
Horizontal centrifugal, single stage
8,030 lpm @ 30 m H₂O (2,120 gpm @ 90 ft H₂O) 2 1
5 High-Pressure Feedwater Pump No. 1
Barrel type, multi-stage, centrifugal
HP water: 6,050 lpm @ 1,800 m H₂O
(1,600 gpm @ 6,100 ft H₂O) 2 1
6 High-Pressure Feedwater Pump No. 2
Barrel type, multi-stage, centrifugal
IP water: 1,720 lpm @ 220 m H₂O (450 gpm @ 730 ft H₂O) 2 1

Cost and Performance Baseline for Fossil Energy Plants Volume 1b: Revision 2b
213
Equipment No. Description Type Design Condition Operating
Qty. Spares
7 Auxiliary Boiler Shop fabricated, water tube
18,000 kg/hr, 2.8 MPa, 343°C (40,000 lb/hr, 400 psig, 650°F) 1 0
8 Service Air Compressors Flooded Screw 28 m3/min @ 0.7 MPa
(1,000 scfm @ 100 psig) 2 1
9 Instrument Air Dryers Duplex, regenerative 28 m3/min (1,000 scfm) 2 1
10 Closed Cycle Cooling Heat Exchangers Plate and frame 368 GJ/hr (348 MMBtu/hr)
each 2 0
11 Closed Cycle Cooling Water Pumps Horizontal centrifugal 131,900 lpm @ 20 m H₂O
(34,800 gpm @ 70 ft H₂O) 2 1
12 Engine-Driven Fire Pump
Vertical turbine, diesel engine
3,785 lpm @ 110 m H₂O (1,000 gpm @ 350 ft H₂O) 1 1
13 Fire Service Booster Pump
Two-stage horizontal centrifugal
2,650 lpm @ 80 m H₂O (700 gpm @ 250 ft H₂O) 1 1
14 Raw Water Pumps Stainless steel, single suction
5,730 lpm @ 20 m H₂O (1,510 gpm @ 60 ft H₂O) 2 1
15 Ground Water Pumps Stainless steel, single suction
2,870 lpm @ 270 m H₂O (760 gpm @ 880 ft H₂O) 4 1
16 Filtered Water Pumps Stainless steel, single suction
3,350 lpm @ 50 m H₂O (890 gpm @ 160 ft H₂O) 2 1
17 Filtered Water Tank Vertical, cylindrical 1,610,000 liter (425,000 gal) 2 0
18 Makeup Water Demineralizer
Anion, cation, and mixed bed 1,490 lpm (390 gpm) 2 0
19 Liquid Waste Treatment System N/A 10 years, 24-hour storm 1 0
Case B5B – Account 4: Gasifier, ASU, and Accessories Including Low Temperature Heat Recovery and Fuel Gas Saturation Equipment
No. Description Type Design Condition Operating Qty. Spares
1 Gasifier Pressurized slurry-feed, entrained bed
2,900 tonne/day, 5.6 MPa (3,200 tpd, 815 psia) 2 0
2 Synthesis Gas Cooler
Vertical downflow radiant heat exchanger with outlet quench chamber
256,000 kg/hr (564,000 lb/hr) 2 0
3 Synthesis Gas Cyclone High efficiency 350,000 kg/hr (772,000 lb/hr)
Design efficiency 90% 2 0
4 Raw Gas Coolers Shell and tube with condensate drain 388,000 kg/hr (856,000 lb/hr) 8 0
5 Raw Gas Knockout Drum
Vertical with mist eliminator
304,000 kg/hr, 35°C, 5.2 MPa (671,000 lb/hr, 95°F, 750 psia) 2 0
6 Flare Stack Self-supporting, carbon steel, stainless steel top, pilot ignition
350,000 kg/hr (772,000 lb/hr) syngas 2 0
7 ASU Main Air Compressor Centrifugal, multi-stage 6,000 m3/min @ 1.3 MPa
(210,000 scfm @ 190 psia) 2 0
8 Cold Box Vendor design 2,400 tonne/day (2,600 tpd) of 95% purity oxygen 2 0
9 Oxygen Compressor Centrifugal, multi-stage 1,000 m3/min (42,000 scfm) Suction - 1.0 MPa (130 psia)
Discharge - 6.5 MPa (940 psia) 2 0
10 Primary Nitrogen Compressor Centrifugal, multi-stage
4,000 m3/min (134,000 scfm) Suction - 0.4 MPa (60 psia)
Discharge - 2.7 MPa (390 psia) 2 0
11 Secondary Nitrogen Compressor
Centrifugal, single-stage
550 m3/min (19,000 scfm) Suction - 1.3 MPa (180 psia)
Discharge - 2.7 MPa (390 psia) 2 0

Cost and Performance Baseline for Fossil Energy Plants Volume 1b: Revision 2b
214
Equipment No. Description Type Design Condition Operating
Qty. Spares
12 Syngas Dilution Nitrogen Boost Compressor
Centrifugal, single-stage
2,000 m3/min (70,000 scfm) Suction - 2.6 MPa (380 psia)
Discharge - 3.2 MPa (470 psia) 2 0
Case B5B – Account 5: Syngas Cleanup Equipment
No. Description Type Design Condition Operating Qty. Spares
1 Mercury Adsorber 1 Sulfated carbon bed 304,000 kg/hr (670,000 lb/hr), 35°C (95°F), 5.1 MPa (745 psia) 2 0
2 Mercury Adsorber 2 Sulfated carbon bed 304,000 kg/hr (670,000 lb/hr), 35°C (95°F), 5.1 MPa (745 psia) 2 0
3 Sulfur Plant Claus type 146 tonne/day (161 tpd) 1 0
4 Water Gas Shift Reactors Fixed bed, catalytic 194,000 kg/hr (428,000 lb/hr),
227°C (440°F), 5.4 MPa (790 psia) 4 0
5 Shift Reactor Heat Recovery Exchangers
Shell and Tube Exchanger 1: 157 GJ/hr (149
MMBtu/hr) Exchanger 2: 3 GJ/hr (3 MMBtu/hr)
4 0
6 Acid Gas Removal Plant Two-stage Selexol 311,000 kg/hr (685,000 lb/hr),
35°C (95°F), 5.1 MPa (740 psia) 2 0
7 Hydrogenation Reactor Fixed bed, catalytic
18,000 kg/hr (40,000 lb/hr), 232°C (450°F), 0.1 MPa (12.3
psia) 1 0
8 Tail Gas Recycle Compressor Centrifugal 14,000 kg/hr (30,000 lb/hr) each 1 0
9 CO₂ Compressor Integrally geared, multi-stage centrifugal
1,100 m3/min @ 15.3 MPa (40,000 scfm @ 2,215 psia) 4 0
Case B5B – Account 6: Combustion Turbine and Auxiliaries Equipment
No. Description Type Design Condition Operating Qty. Spares
1 Combustion Turbine State-of-the-art 2008 F-class 230 MW 2 0
2 Combustion Turbine Generator TEWAC 260 MVA @ 0.9 p.f., 24 kV, 60 Hz,
3-phase 2 0
3 Syngas Expansion Turbine/Generator Turbo Expander
49,600 kg/h (109,300 lb/h) 5.1 MPa (735 psia) Inlet
3.2 MPa (460 psia) Outlet 2 0
Case B5B – Account 7: HRSG, Ducting, and Stack Equipment
No. Description Type Design Condition Operating Qty. Spares
1 Stack CS plate, type 409SS liner
76 m (250 ft) high x 8.5 m (28 ft) diameter 1 0
2 Heat Recovery Steam Generator
Drum, multi-pressure with economizer section and integral deaerator
Main steam - 341,975 kg/hr, 12.4 MPa/534°C
(753,925 lb/hr, 1,800 psig/994°F) 2 0

Cost and Performance Baseline for Fossil Energy Plants Volume 1b: Revision 2b
215
Case B5B – Account 8: Steam Turbine Generator and Auxiliaries Equipment
No. Description Type Design Condition Operating Qty. Spares
1 Steam Turbine
Commercially available advanced steam turbine
277 MW 12.4 MPa/534°C/534°C (1,800 psig/
994°F/994°F) 1 0
2 Steam Turbine Generator
Hydrogen cooled, static excitation
310 MVA @ 0.9 p.f., 24 kV, 60 Hz, 3-phase 1 0
3 Surface Condenser
Single pass, divided waterbox including vacuum pumps
1,660GJ/hr (1,580 MMBtu/hr), Inlet water temperature 16°C
(60°F), Water temperature rise 11°C (20°F)
1 0
4 Steam Bypass One per HRSG 50% steam flow @ design steam
conditions 2 0
Case B5B – Account 9: Cooling Water System Equipment
No. Description Type Design Condition Operating Qty. Spares
1 Circulating Water Pumps Vertical, wet pit 465,000 lpm @ 30 m
(123,000 gpm @ 100 ft) 2 1
2 Cooling Tower Evaporative, mechanical draft, multi-cell
11°C (51.5°F) wet bulb / 16°C (60°F) CWT / 27°C (80°F) HWT /
2,590 GJ/hr (2,460 MMBtu/hr) heat duty
1 0
Case B5B – Account 10: Slag Recovery and Handling Equipment
No. Description Type Design Condition Operating Qty. Spares
1 Slag Quench Tank Water bath 254,000 liters (67,000 gal) 2 0 2 Slag Crusher Roll 13 tonne/hr (15 tph) 2 0 3 Slag Depressurizer Lock Hopper 13 tonne/hr (15 tph) 2 0 4 Slag Receiving Tank Horizontal, weir 153,000 liters (40,000 gal) 2 0 5 Black Water Overflow Tank Shop fabricated 69,000 liters (18,000 gal) 2 0 6 Slag Conveyor Drag chain 13 tonne/hr (15 tph) 2 0 7 Slag Separation Screen Vibrating 13 tonne/hr (15 tph) 2 0 8 Coarse Slag Conveyor Belt/bucket 13 tonne/hr (15 tph) 2 0 9 Fine Ash Settling Tank Vertical, gravity 217,000 liters (57,000 gal) 2 0
10 Fine Ash Recycle Pumps Horizontal centrifugal 60 lpm @ 14 m H₂O (10 gpm @ 46 ft H₂O) 2 2
11 Grey Water Storage Tank Field erected 69,000 liters (18,000 gal) 2 0
12 Grey Water Pumps Centrifugal 250 lpm @ 560 m H₂O (60 gpm @ 1,850 ft H₂O) 2 2
13 Slag Storage Bin Vertical, field erected 1,000 tonne (1,100 tons) 2 0 14 Unloading Equipment Telescoping chute 110 tonne/hr (120 tph) 1 0

Cost and Performance Baseline for Fossil Energy Plants Volume 1b: Revision 2b
216
Case B5B – Account 11: Accessory Electric Plant Equipment
No. Description Type Design Condition Operating Qty. Spares
1 CTG Transformer Oil-filled 24 kV/345 kV, 260 MVA, 3-ph, 60 Hz 2 0
2 STG Transformer Oil-filled 24 kV/345 kV, 260 MVA, 3-ph, 60 Hz 1 0
3 High Voltage Auxiliary Transformer Oil-filled 345 kV/13.8 kV, 80
MVA, 3-ph, 60 Hz 2 0
4 Medium Voltage Transformer Oil-filled 24 kV/4.16 kV, 48 MVA, 3-ph, 60 Hz 1 1
5 Low Voltage Transformer Dry ventilated 4.16 kV/480 V, 7 MVA, 3-ph, 60 Hz 1 1
6 CTG Isolated Phase Bus Duct and Tap Bus
Aluminum, self-cooled 24 kV, 3-ph, 60 Hz 2 0
7 STG Isolated Phase Bus Duct and Tap Bus
Aluminum, self-cooled 24 kV, 3-ph, 60 Hz 1 0
8 Medium Voltage Switchgear Metal clad 4.16 kV, 3-ph, 60 Hz 1 1 9 Low Voltage Switchgear Metal enclosed 480 V, 3-ph, 60 Hz 1 1
10 Emergency Diesel Generator Sized for emergency shutdown
750 kW, 480 V, 3-ph, 60 Hz 1 0
Case B5B – Account 12: Instrumentation and Control Equipment
No. Description Type Design Condition Operating Qty. Spares
1 DCS - Main Control
Monitor/keyboard; Operator printer (laser color); Engineering printer (laser B&W)
Operator stations/printers and engineering stations/printers
1 0
2 DCS - Data Highway Fiber optic Fully redundant, 25% spare 1 0
3.4.11 Case B5B - Cost Estimating The cost estimating methodology was described previously in Section 2.6. Exhibit 3-104 shows a detailed breakdown of the capital costs; Exhibit 3-105 shows the owner’s costs, TOC, and TASC; Exhibit 3-106 shows the initial and annual O&M costs; and Exhibit 3-107 shows the COE breakdown.
The estimated TPC of the GEE gasifier with CO2 capture is $3,387/kW. Process contingency represents 4.2 percent of the TPC, and project contingency represents 13.8 percent. The COE, including CO2 T&S costs of $9.2/MWh, is $144.7/MWh.

Cost and Performance Baseline for Fossil Energy Plants Volume 1b: Revision 2b
217
Exhibit 3-104 Case B5B total plant cost details Case: B5B – GEE Radiant IGCC w/ CO₂ Estimate Type: Conceptual
Plant Size (MW,net): 543 Cost Base: Jun 2011 Item Description Equipment Material Labor Bare Erected Eng'g CM Contingencies Total Plant Cost No. Cost Cost Direct Indirect Cost H.O.& Fee Process Project $/1,000 $/kW
1 Coal & Sorbent Handling 1.1 Coal Receive & Unload $4,552 $0 $2,194 $0 $6,746 $675 $0 $1,484 $8,905 $16 1.2 Coal Stackout & Reclaim $5,882 $0 $1,407 $0 $7,289 $729 $0 $1,604 $9,621 $18 1.3 Coal Conveyors & Yd Crush $5,469 $0 $1,392 $0 $6,861 $686 $0 $1,509 $9,056 $17 1.4 Other Coal Handling $1,431 $0 $322 $0 $1,753 $175 $0 $386 $2,314 $4 1.9 Coal & Sorbent Hnd. Foundations $0 $3,040 $7,944 $0 $10,984 $1,098 $0 $2,417 $14,499 $27
Subtotal $17,335 $3,040 $13,259 $0 $33,633 $3,363 $0 $7,399 $44,396 $82 2 Coal & Sorbent Prep & Feed
2.1 Coal Crushing & Drying w/2.3 $0 w/2.3 $0 $0 $0 $0 $0 $0 $0 2.2 Prepared Coal Storage & Feed $1,944 $467 $301 $0 $2,712 $271 $0 $597 $3,580 $7 2.3 Slurry Prep & Feed $26,551 $0 $11,574 $0 $38,125 $3,812 $1,906 $8,769 $52,612 $97 2.4 Misc. Coal Prep & Feed $1,069 $781 $2,301 $0 $4,151 $415 $0 $913 $5,479 $10 2.9 Coal & Sorbent Feed Foundation $0 $3,922 $3,365 $0 $7,287 $729 $0 $1,603 $9,619 $18
Subtotal $29,564 $5,170 $17,541 $0 $52,275 $5,227 $1,906 $11,882 $71,290 $131 3 Feedwater & Miscellaneous BOP Systems
3.1 Feedwater System $3,381 $5,835 $3,059 $0 $12,275 $1,227 $0 $2,700 $16,203 $30 3.2 Water Makeup & Pretreating $876 $91 $481 $0 $1,448 $145 $0 $478 $2,071 $4 3.3 Other Feedwater Subsystems $1,901 $628 $561 $0 $3,090 $309 $0 $680 $4,079 $8 3.4 Service Water Systems $512 $1,022 $3,521 $0 $5,055 $505 $0 $1,668 $7,228 $13 3.5 Other Boiler Plant Systems $2,761 $1,032 $2,539 $0 $6,331 $633 $0 $1,393 $8,358 $15 3.6 FO Supply Sys & Nat Gas $17,735 $710 $658 $0 $19,104 $1,910 $0 $4,203 $25,217 $46 3.7 Waste Treatment Equipment $1,185 $0 $734 $0 $1,919 $192 $0 $633 $2,745 $5 3.8 Misc. Power Plant Equipment $1,326 $177 $689 $0 $2,193 $219 $0 $724 $3,135 $6
Subtotal $29,677 $9,494 $12,243 $0 $51,415 $5,142 $0 $12,479 $69,035 $127 4 Gasifier & Accessories
4.1 Syngas Cooler Gasifier System $140,246 $0 $77,258 $0 $217,504 $21,750 $30,249 $41,297 $310,800 $572 4.2 Syngas Cooler w/4.1 $0 w/ 4.1 $0 $0 $0 $0 $0 $0 $0 4.3 ASU & Oxidant Compression $234,789 $0 w/equip. $0 $234,789 $23,479 $0 $25,827 $284,094 $523 4.4 Scrubber & LT Heat Recovery $7,292 $5,935 $6,135 $0 $19,363 $1,936 $0 $4,260 $25,560 $47 4.5 Black Water & Sour Gas Section w/4.1 $0 w/4.1 $0 $0 $0 $0 $0 $0 $0 4.6 Soot Recovery & SARU $2,224 $1,056 $2,073 $0 $5,353 $535 $0 $1,178 $7,066 $13 4.8 Major Component Rigging w/4.1 $0 w/4.1 $0 $0 $0 $0 $0 $0 $0 4.9 Gasification Foundations $0 $7,429 $6,482 $0 $13,911 $1,391 $0 $3,826 $19,128 $35
Subtotal $384,551 $14,421 $91,949 $0 $490,920 $49,092 $30,249 $76,387 $646,648 $1,190 5A Gas Cleanup & Piping
5A.1 Double Stage Selexol $160,990 $0 w/equip. $0 $160,990 $16,099 $32,198 $41,857 $251,145 $462 5A.2 Elemental Sulfur Plant $12,451 $2,427 $15,954 $0 $30,833 $3,083 $0 $6,783 $40,699 $75 5A.3 Mercury Removal $1,973 $0 $1,491 $0 $3,464 $346 $173 $797 $4,780 $9 5A.4 Shift Reactors $11,566 $0 $4,624 $0 $16,190 $1,619 $0 $3,562 $21,370 $39 5A.7 Fuel Gas Piping $0 $812 $531 $0 $1,344 $134 $0 $296 $1,774 $3

Cost and Performance Baseline for Fossil Energy Plants Volume 1b: Revision 2b
218
Case: B5B – GEE Radiant IGCC w/ CO₂ Estimate Type: Conceptual Plant Size (MW,net): 543 Cost Base: Jun 2011
Item Description Equipment Material Labor Bare Erected Eng'g CM Contingencies Total Plant Cost No. Cost Cost Direct Indirect Cost H.O.& Fee Process Project $/1,000 $/kW
5A.9 HGCU Foundations $0 $735 $495 $0 $1,231 $123 $0 $406 $1,760 $3 Subtotal $186,980 $3,974 $23,096 $0 $214,051 $21,405 $32,371 $53,701 $321,528 $592 5B CO₂ Compression
5B.2 CO₂ Compression & Drying $40,237 $6,036 $17,430 $0 $63,703 $6,370 $0 $14,015 $84,088 $155 Subtotal $40,237 $6,036 $17,430 $0 $63,703 $6,370 $0 $14,015 $84,088 $155 6 Combustion Turbine & Accessories
6.1 Combustion Turbine Generator $111,210 $0 $7,881 $0 $119,091 $11,909 $11,909 $14,291 $157,201 $289 6.2 Syngas Expander $6,691 $0 $918 $0 $7,609 $761 $0 $1,256 $9,626 $18 6.9 Combustion Turbine Foundations $0 $1,016 $1,175 $0 $2,191 $219 $0 $723 $3,133 $6
Subtotal $117,901 $1,016 $9,975 $0 $128,892 $12,889 $11,909 $16,270 $169,960 $313 7 HRSG, Ducting, & Stack
7.1 Heat Recovery Steam Generator $29,560 $0 $5,723 $0 $35,283 $3,528 $0 $3,881 $42,693 $79 7.3 Ductwork $0 $2,109 $1,478 $0 $3,587 $359 $0 $789 $4,735 $9 7.4 Stack $4,070 $0 $1,519 $0 $5,589 $559 $0 $615 $6,762 $12 7.9 HRSG, Duct & Stack Foundations $0 $775 $778 $0 $1,553 $155 $0 $512 $2,220 $4
Subtotal $33,630 $2,884 $9,498 $0 $46,012 $4,601 $0 $5,797 $56,411 $104 8 Steam Turbine Generator
8.1 Steam TG & Accessories $37,100 $0 $5,758 $0 $42,858 $4,286 $0 $4,714 $51,858 $95 8.2 Turbine Plant Auxiliaries $235 $0 $535 $0 $771 $77 $0 $85 $932 $2 8.3 Condenser & Auxiliaries $3,290 $0 $1,868 $0 $5,158 $516 $0 $567 $6,241 $11 8.4 Steam Piping $15,068 $0 $6,534 $0 $21,602 $2,160 $0 $5,941 $29,703 $55 8.9 TG Foundations $0 $1,108 $1,958 $0 $3,067 $307 $0 $1,012 $4,385 $8
Subtotal $55,693 $1,108 $16,654 $0 $73,456 $7,346 $0 $12,319 $93,121 $171 9 Cooling Water System
9.1 Cooling Towers $4,490 $0 $1,360 $0 $5,850 $585 $0 $965 $7,400 $14 9.2 Circulating Water Pumps $2,175 $0 $163 $0 $2,338 $234 $0 $386 $2,957 $5 9.3 Circ. Water System Auxiliaries $189 $0 $27 $0 $216 $22 $0 $36 $273 $1 9.4 Circ. Water Piping $0 $8,386 $2,031 $0 $10,417 $1,042 $0 $2,292 $13,751 $25 9.5 Make-up Water System $484 $0 $665 $0 $1,150 $115 $0 $253 $1,517 $3 9.6 Component Cooling Water Sys $959 $1,147 $787 $0 $2,893 $289 $0 $636 $3,818 $7 9.9 Circ. Water System Foundations $0 $2,738 $4,866 $0 $7,604 $760 $0 $2,509 $10,874 $20
Subtotal $8,296 $12,271 $9,900 $0 $30,467 $3,047 $0 $7,077 $40,591 $75 10 Ash & Spent Sorbent Handling Systems
10.1 Slag Dewatering & Cooling $14,630 $8,067 $16,277 $0 $38,975 $3,897 $0 $4,287 $47,159 $87 10.2 Gasifier Ash Depressurization w/10.1 w/10.1 w/10.1 $0 $0 $0 $0 $0 $0 $0 10.3 Cleanup Ash Depressurization w/10.1 w/10.1 w/10.1 $0 $0 $0 $0 $0 $0 $0 10.6 Ash Storage Silos $710 $0 $767 $0 $1,476 $148 $0 $244 $1,868 $3 10.7 Ash Transport & Feed Equipment $977 $0 $228 $0 $1,205 $120 $0 $199 $1,524 $3 10.8 Misc. Ash Handling Equipment $1,470 $1,801 $534 $0 $3,806 $381 $0 $628 $4,814 $9 10.9 Ash/Spent Sorbent Foundation $0 $60 $78 $0 $138 $14 $0 $46 $197 $0
Subtotal $17,787 $9,928 $17,885 $0 $45,600 $4,560 $0 $5,403 $55,563 $102 11 Accessory Electric Plant

Cost and Performance Baseline for Fossil Energy Plants Volume 1b: Revision 2b
219
Case: B5B – GEE Radiant IGCC w/ CO₂ Estimate Type: Conceptual Plant Size (MW,net): 543 Cost Base: Jun 2011
Item Description Equipment Material Labor Bare Erected Eng'g CM Contingencies Total Plant Cost No. Cost Cost Direct Indirect Cost H.O.& Fee Process Project $/1,000 $/kW
11.1 Generator Equipment $1,152 $0 $1,122 $0 $2,274 $227 $0 $250 $2,752 $5 11.2 Station Service Equipment $5,513 $0 $507 $0 $6,020 $602 $0 $662 $7,285 $13 11.3 Switchgear & Motor Control $10,176 $0 $1,891 $0 $12,068 $1,207 $0 $1,991 $15,266 $28 11.4 Conduit & Cable Tray $0 $5,170 $15,938 $0 $21,109 $2,111 $0 $5,805 $29,024 $53 11.5 Wire & Cable $0 $9,969 $6,065 $0 $16,034 $1,603 $0 $4,409 $22,047 $41 11.6 Protective Equipment $0 $806 $2,995 $0 $3,801 $380 $0 $627 $4,808 $9 11.7 Standby Equipment $274 $0 $273 $0 $547 $55 $0 $90 $692 $1 11.8 Main Power Transformers $19,599 $0 $172 $0 $19,771 $1,977 $0 $3,262 $25,011 $46 11.9 Electrical Foundations $0 $180 $491 $0 $672 $67 $0 $222 $961 $2
Subtotal $36,715 $16,126 $29,455 $0 $82,297 $8,230 $0 $17,319 $107,845 $199 12 Instrumentation & Control
12.1 IGCC Control Equipment w/4.1 $0 w/4.1 $0 $0 $0 $0 $0 $0 $0 12.2 Combustion Turbine Control w/6.1 $0 w/6.1 $0 $0 $0 $0 $0 $0 $0 12.3 Steam Turbine Control w/8.1 $0 w/8.1 $0 $0 $0 $0 $0 $0 $0 12.4 Other Major Component Control $1,321 $0 $900 $0 $2,221 $222 $111 $383 $2,937 $5 12.5 Signal Processing Equipment w/12.7 $0 w/12.7 $0 $0 $0 $0 $0 $0 $0 12.6 Control Boards, Panels & Racks $304 $0 $199 $0 $502 $50 $25 $116 $693 $1 12.7 Computer & Accessories $7,046 $0 $230 $0 $7,277 $728 $364 $837 $9,205 $17 12.8 Instrument Wiring & Tubing $0 $2,713 $5,135 $0 $7,847 $785 $392 $2,256 $11,280 $21 12.9 Other I & C Equipment $4,710 $0 $2,334 $0 $7,044 $704 $352 $1,215 $9,316 $17
Subtotal $13,381 $2,713 $8,797 $0 $24,891 $2,489 $1,245 $4,807 $33,431 $62 13 Improvements to Site
13.1 Site Preparation $0 $123 $2,799 $0 $2,922 $292 $0 $964 $4,178 $8 13.2 Site Improvements $0 $2,189 $3,095 $0 $5,284 $528 $0 $1,744 $7,556 $14 13.3 Site Facilities $3,923 $0 $4,404 $0 $8,327 $833 $0 $2,748 $11,907 $22
Subtotal $3,923 $2,312 $10,297 $0 $16,532 $1,653 $0 $5,456 $23,641 $44 14 Buildings & Structures
14.1 Combustion Turbine Area $0 $317 $179 $0 $496 $50 $0 $109 $655 $1 14.2 Steam Turbine Building $0 $2,849 $4,056 $0 $6,904 $690 $0 $1,139 $8,734 $16 14.3 Administration Building $0 $1,057 $766 $0 $1,823 $182 $0 $301 $2,306 $4 14.4 Circulation Water Pumphouse $0 $198 $105 $0 $303 $30 $0 $50 $384 $1 14.5 Water Treatment Buildings $0 $720 $702 $0 $1,422 $142 $0 $235 $1,799 $3 14.6 Machine Shop $0 $541 $370 $0 $911 $91 $0 $150 $1,152 $2 14.7 Warehouse $0 $873 $563 $0 $1,437 $144 $0 $237 $1,818 $3 14.8 Other Buildings & Structures $0 $523 $407 $0 $930 $93 $0 $205 $1,228 $2 14.9 Waste Treating Building & Str. $0 $1,169 $2,233 $0 $3,403 $340 $0 $749 $4,492 $8
Subtotal $0 $8,248 $9,382 $0 $17,630 $1,763 $0 $3,175 $22,568 $42 Total $975,671 $98,741 $297,361 $0 $1,371,773 $137,177 $77,680 $253,485 $1,840,115 $3,387

Cost and Performance Baseline for Fossil Energy Plants Volume 1b: Revision 2b
220
Exhibit 3-105 Case B5B owner’s costs
Description $/1,000 $/kW Pre-Production Costs
6 Months All Labor $16,298 $30 1 Month Maintenance Materials $3,682 $7 1 Month Non-fuel Consumables $676 $1
1 Month Waste Disposal $494 $1 25% of 1 Months Fuel Cost at 100% CF $3,046 $6
2% of TPC $36,802 $68 Total $60,998 $112
Inventory Capital 60-day supply of fuel and consumables at 100% CF $25,290 $47
0.5% of TPC (spare parts) $9,201 $17 Total $34,491 $63
Other Costs Initial Cost for Catalyst and Chemicals $16,548 $30
Land $900 $2 Other Owner's Costs $276,017 $508
Financing Costs $49,683 $91 Total Overnight Costs (TOC) $2,278,752 $4,195
TASC Multiplier (IOU, high-risk, 35 year) 1.140 Total As-Spent Cost (TASC) $2,597,777 $4,782

Cost and Performance Baseline for Fossil Energy Plants Volume 1b: Revision 2b
221
Exhibit 3-106 Case B5B initial and annual operating and maintenance costs Case: B5B – GEE Radiant IGCC w/ CO₂ Cost Base: Jun 2011
Plant Size (MW,net): 543 Heat Rate-net (Btu/kWh): 10,459 Capacity Factor (%): 80 Operating & Maintenance Labor
Operating Labor Operating Labor Requirements per Shift Operating Labor Rate (base): 39.70 $/hour Skilled Operator: 2.0
Operating Labor Burden: 30.00 % of base Operator: 10.0 Labor O-H Charge Rate: 25.00 % of labor Foreman: 1.0
Lab Tech's, etc.: 3.0 Total: 16.0
Fixed Operating Costs Annual Cost ($) ($/kW-net)
Annual Operating Labor: $7,233,658 $13.316 Maintenance Labor: $18,843,231 $34.687
Administrative & Support Labor: $6,519,222 $12.001 Property Taxes and Insurance: $36,802,296 $67.747
Total: $69,398,406 $127.751 Variable Operating Costs
($) ($/MWh-net) Maintenance Material: $35,348,580 $9.28526
Consumables Consumption Cost ($) Initial Fill Per Day Per Unit Initial Fill
Water (/1000 gallons): 0 4,201 $1.67 $0 $2,053,253 $0.53934 Makeup and Waste Water
Treatment Chemicals (lbs): 0 25,026 $0.27 $0 $1,957,230 $0.51412
Carbon (Mercury Removal) (lb): 135,182 231 $5.50 $743,501 $371,751 $0.09765 Shift Catalyst (ft3): 6,246 4.28 $771.99 $4,822,025 $964,405 $0.25333
Selexol Solution (gal): 298,498 95 $36.79 $10,982,126 $1,020,094 $0.26796 Claus Catalyst (ft3): w/equip 2.01 $203.15 $0 $119,487 $0.03139
Subtotal: $16,547,652 $6,486,219 $1.70378 Waste Disposal
Spent Mercury Catalyst (lb.): 0 231 $0.65 $0 $43,941 $0.01154 Flyash (ton): 0 0 $0.00 $0 $0 $0.00000
Slag (ton): 0 641 $25.11 $0 $4,701,292 $1.23492 Subtotal: $0 $4,745,232 $1.24646
By-Products Sulfur (tons): 0 146 $0.00 $0 $0 $0.00000
Subtotal: $0 $0 $0.00000 Variable Operating Costs Total: $16,547,652 $46,580,031 $12.23551
Fuel Cost Illinois Number 6 (ton): 0 5,844 $68.54 $0 $116,961,258 $30.72304
Total: $0 $116,961,258 $30.72304
Exhibit 3-107 Case B5B COE breakdown
Component Value, $/MWh Percentage Capital 74.2 55%
Fixed 18.2 13% Variable 12.2 9%
Fuel 30.7 23% Total (Excluding T&S) 135.4 N/A
CO2 T&S 9.2 7% Total (Including T&S) 144.7 N/A

Cost and Performance Baseline for Fossil Energy Plants Volume 1b: Revision 2b
222
3.4.12 Case B5B-Q - GEE Quench IGCC with CO2 Capture Case B5B-Q is configured to produce electric power with CO2 capture. The plant configuration is the same as Case B5B, namely two gasifier trains, two state-of-the-art 2008 F-class turbines, two HRSGs, and one steam turbine.
The process description for Case B5B-Q is similar to Case B5B with the exception that the gasifier is operated in quench-only mode. A BFD and stream tables for Case B5B-Q are shown in Exhibit 3-108 and Exhibit 3-109, respectively. Rather than repeating the entire process description, only differences from Case B5B are reported here.
3.4.12.1 Gasification The gasification process is the same as Case B5B with the exception that the syngas exiting the gasifier passes through a water quench where the temperature is reduced from 1,316°C (2,400°F) to 288°C (550°F). The total coal feed to the two gasifiers is 5,301 tonnes/day (5,844 tpd) (stream 6) and the ASU provides 4,343 tonnes/day (4,787 tpd) of 95 percent oxygen to the gasifier and Claus plant (streams 3 and 5).
3.4.12.2 Raw Gas Cooling/Particulate Removal Particulate is largely removed in the quench tank and no additional heat recovery occurs prior to the syngas scrubber.
3.4.12.3 Syngas Scrubber/Sour Water Stripper The outlet temperature from the syngas scrubber is 227°C (440°F) (stream 10).
3.4.12.4 Sour Gas Shift The SGS process is the same as described for Case B5B with a 97 percent overall conversion of the CO to CO2. The warm syngas from the second stage of SGS (stream 12) is cooled to 244°C (471°F) by heating the syngas entering the first shift reactor. The syngas is then cooled to 193°C (380°F) by producing IP steam that is sent to the RH in the HRSG. The SGS catalyst also serves to hydrolyze COS thus eliminating the need for a separate COS hydrolysis reactor. Following the second SGS cooler the syngas is further cooled to 35°C (95°F) before entering the mercury removal beds.

Cost and Performance Baseline for Fossil Energy Plants Volume 1b: Revision 2b
223
Exhibit 3-108 Case B5B-Q block flow diagram, GEE quench-only IGCC with CO2 capture
Source: NETL
GAS TURBINE
COMBUSTOR
TURBINE COOLING AIR
QUENCH AND SYNGAS
SCRUBBER
GAS COOLINGBFW HEATING& KNOCKOUT
SHIFT REACTORS
ELEVATEDPRESSURE
ASU
GEE GASIFIER SECTION
SOURWATER
STRIPPER
MERCURYREMOVAL
DUAL STAGE
SELEXOLUNIT
CLAUSPLANT
HRSG
AMBIENT AIR
SYNGAS EXPANDER
HYDROGENATION REACTOR AND GAS
COOLER
CO2 COMPRESSION
1
5
9
10
11 12 13 14
17
19
20
21
18
8
2 3
4
22
23 24
AIR TO ASU
SLAG
SHIFTSTEAM
WATER RECYCLE TO PROCESS
DEMAND
NOTE: WATER FROM TAIL GAS COOLER MODELED,
BUT NOT SHOWN
NITROGEN DILUENTSYNGAS
CLEANGAS
CO2 STREAMS
CO2 PRODUCT
SULFUR
TAIL GAS RECYCLE TO
SELEXOL
NOTE: TAIL GAS BOOST COMPRESSOR MODELED,
BUT NOT SHOWN
FLUE GAS
STACK GAS
VENT GAS
CLAUS PLANT
OXIDANT
2X STATE-OF-THE-ART F-CLASS
GAS TURBINES
SYNGASH/P
REHEAT
15
16
CLAUS PLANT
OXIDANT
STEAM TURBINE
25
SLURRY MIXER
6
AS-RECEIVED
COAL
7SLURRY WATER
GASIFIER OXIDANT
Note: Block Flow Diagram is not intended to represent a complete material balance. Only major process streams and equipment are shown.
20TAIL GAS
RECYCLE FROM CLAUS PLANT

Cost and Performance Baseline for Fossil Energy Plants Volume 1b: Revision 2b
224
Exhibit 3-109 Case B5B-Q stream table, GEE quench-only IGCC with capture 1 2 3 4 5 6 7 8 9 10 11 12 13 14
V-L Mole Fraction Ar 0.0092 0.0165 0.0318 0.0023 0.0318 0.0000 0.0000 0.0000 0.0086 0.0053 0.0000 0.0053 0.0071 0.0071 CH4 0.0000 0.0000 0.0000 0.0000 0.0000 0.0000 0.0000 0.0000 0.0011 0.0007 0.0000 0.0007 0.0009 0.0009 CO 0.0000 0.0000 0.0000 0.0000 0.0000 0.0000 0.0000 0.0000 0.3576 0.2197 0.0000 0.0060 0.0081 0.0081 CO2 0.0003 0.0054 0.0000 0.0000 0.0000 0.0000 0.0000 0.0000 0.1380 0.0848 0.0000 0.2985 0.4017 0.4053 COS 0.0000 0.0000 0.0000 0.0000 0.0000 0.0000 0.0000 0.0000 0.0002 0.0001 0.0000 0.0000 0.0000 0.0000 H2 0.0000 0.0000 0.0000 0.0000 0.0000 0.0000 0.0000 0.0000 0.3406 0.2093 0.0000 0.4229 0.5690 0.5647 H2O 0.0099 0.1355 0.0000 0.0003 0.0000 0.0000 0.9997 0.0000 0.1369 0.4700 1.0000 0.2562 0.0012 0.0012 HCl 0.0000 0.0000 0.0000 0.0000 0.0000 0.0000 0.0000 0.0000 0.0008 0.0001 0.0000 0.0001 0.0000 0.0000 H2S 0.0000 0.0000 0.0000 0.0000 0.0000 0.0000 0.0000 0.0000 0.0073 0.0045 0.0000 0.0046 0.0061 0.0061 N2 0.7732 0.7077 0.0178 0.9920 0.0178 0.0000 0.0000 0.0000 0.0070 0.0043 0.0000 0.0043 0.0058 0.0065 NH3 0.0000 0.0000 0.0000 0.0000 0.0000 0.0000 0.0003 0.0000 0.0019 0.0013 0.0000 0.0013 0.0000 0.0000 O2 0.2074 0.1349 0.9504 0.0054 0.9504 0.0000 0.0000 0.0000 0.0000 0.0000 0.0000 0.0000 0.0000 0.0000 SO2 0.0000 0.0000 0.0000 0.0000 0.0000 0.0000 0.0000 0.0000 0.0000 0.0000 0.0000 0.0000 0.0000 0.0000 Total 1.0000 1.0000 1.0000 1.0000 1.0000 0.0000 1.0000 0.0000 1.0000 1.0000 1.0000 1.0000 1.0000 1.0000 V-L Flowrate (kgmole/hr) 27,367 1,660 97 20,046 5,526 0 5,037 0 23,121 37,625 0 37,625 27,964 28,358 V-L Flowrate (kg/hr) 789,736 45,606 3,132 562,476 177,816 0 90,741 0 465,212 726,201 0 726,201 552,117 564,722 Solids Flowrate (kg/hr) 0 0 0 0 0 220,890 0 24,235 0 0 0 0 0 0
Temperature (°C) 15 18 32 93 32 15 146 1,316 1,316 227 288 249 35 35 Pressure (MPa, abs) 0.10 0.11 0.86 2.65 0.86 0.10 5.79 5.62 5.62 5.58 5.52 5.45 5.17 5.14 Steam Table Enthalpy (kJ/kg) A 30.23 35.62 26.67 92.50 26.67 --- 559.14 --- 2,635.52 1,479.99 2,918.18 1,017.28 36.94 36.25 AspenPlus Enthalpy (kJ/kg)B -97.58 -1,483.25 4.13 63.47 4.13 -2,116.95 -15,408.22 -727.24 -4,038.89 -8,545.15 -13,053.16 -8,965.22 -8,082.42 -8,084.87 Density (kg/m3) 1.2 1.5 11.0 24.4 11.0 --- 867.1 --- 8.5 25.9 25.6 24.5 41.0 41.2 V-L Molecular Weight 28.857 27.479 32.181 28.060 32.181 --- 18.015 --- 20.121 19.301 18.015 19.301 19.744 19.914
V-L Flowrate (lbmole/hr) 60,334 3,659 215 44,193 12,182 0 11,105 0 50,972 82,949 0 82,949 61,649 62,518 V-L Flowrate (lb/hr) 1,741,069 100,544 6,906 1,240,047 392,017 0 200,051 0 1,025,616 1,600,998 0 1,600,998 1,217,210 1,244,998 Solids Flowrate (lb/hr) 0 0 0 0 0 486,978 0 53,430 0 0 0 0 0 0
Temperature (°F) 59 65 90 199 90 59 295 2,400 2,400 440 550 481 95 95 Pressure (psia) 14.7 16.4 125.0 384.0 125.0 14.7 840.0 815.0 815.0 810.0 800.0 790.0 750.0 745.0 Steam Table Enthalpy (Btu/lb)A 13.0 15.3 11.5 39.8 11.5 --- 240.4 --- 1,133.1 636.3 1,254.6 437.4 15.9 15.6 AspenPlus Enthalpy (Btu/lb)B -42.0 -637.7 1.8 27.3 1.8 -910.1 -6,624.3 -312.7 -1,736.4 -3,673.8 -5,611.9 -3,854.3 -3,474.8 -3,475.9 Density (lb/ft3) 0.076 0.091 0.687 1.521 0.687 --- 54.131 --- 0.530 1.619 1.597 1.529 2.562 2.570
ASteam table reference conditions are 32.02°F & 0.089 psia BAspen thermodynamic reference state is the component’s constituent elements in an ideal gas state at 25°C and 1 atm

Cost and Performance Baseline for Fossil Energy Plants Volume 1b: Revision 2b
225
Exhibit 3-109 Case B5B-Q stream table, GEE quench-only IGCC with capture (continued) 15 16 17 18 19 20 21 22 23 24 25
V-L Mole Fraction Ar 0.0115 0.0115 0.0115 0.0002 0.0018 0.0000 0.0103 0.0092 0.0091 0.0091 0.0000 CH4 0.0015 0.0015 0.0015 0.0000 0.0004 0.0000 0.0000 0.0000 0.0000 0.0000 0.0000 CO 0.0130 0.0130 0.0130 0.0002 0.0023 0.0000 0.0061 0.0000 0.0000 0.0000 0.0000 CO2 0.0501 0.0501 0.0501 0.9948 0.5218 0.0000 0.6606 0.0003 0.0083 0.0083 0.0000 COS 0.0000 0.0000 0.0000 0.0000 0.0002 0.0000 0.0000 0.0000 0.0000 0.0000 0.0000 H2 0.9133 0.9133 0.9133 0.0048 0.1029 0.0000 0.2596 0.0000 0.0000 0.0000 0.0000 H2O 0.0001 0.0001 0.0001 0.0000 0.0225 0.0000 0.0017 0.0099 0.1222 0.1222 1.0000 HCl 0.0000 0.0000 0.0000 0.0000 0.0000 0.0000 0.0000 0.0000 0.0000 0.0000 0.0000 H2S 0.0000 0.0000 0.0000 0.0000 0.3472 0.0000 0.0043 0.0000 0.0000 0.0000 0.0000 N2 0.0105 0.0105 0.0105 0.0000 0.0008 0.0000 0.0574 0.7732 0.7541 0.7541 0.0000 NH3 0.0000 0.0000 0.0000 0.0000 0.0000 0.0000 0.0000 0.0000 0.0000 0.0000 0.0000 O2 0.0000 0.0000 0.0000 0.0000 0.0000 0.0000 0.0000 0.2074 0.1064 0.1064 0.0000 SO2 0.0000 0.0000 0.0000 0.0000 0.0000 0.0000 0.0000 0.0000 0.0000 0.0000 0.0000 Total 1.0000 1.0000 1.0000 1.0000 1.0000 0.0000 1.0000 1.0000 1.0000 1.0000 1.0000 V-L Flowrate (kgmole/hr) 17,424 17,424 17,424 10,415 496 0 394 110,253 139,653 139,653 20,013 V-L Flowrate (kg/hr) 90,438 90,438 90,438 456,223 17,655 0 12,604 3,181,557 3,834,472 3,834,472 360,534 Solids Flowrate (kg/hr) 0 0 0 0 0 5,523 0 0 0 0 0
Temperature (°C) 35 241 195 51 48 178 38 15 562 132 534 Pressure (MPa, abs) 5.14 5.10 3.17 15.27 0.16 0.12 5.51 0.10 0.10 0.10 12.51 Steam Table Enthalpy (kJ/kg) A 194.96 1,385.17 1,117.49 -162.29 74.70 --- 5.84 30.23 834.65 343.46 3,432.96 AspenPlus Enthalpy (kJ/kg)B -4,047.98 -2,857.76 -3,125.45 -9,120.15 -6,110.54 141.95 -8,192.39 -97.58 -588.07 -1,079.26 -12,537.35 Density (kg/m3) 10.2 6.1 4.2 641.8 2.2 5,280.6 77.3 1.2 0.4 0.9 36.7 V-L Molecular Weight 5.190 5.190 5.190 43.804 35.590 --- 31.966 28.857 27.457 27.457 18.015
V-L Flowrate (lbmole/hr) 38,414 38,414 38,414 22,961 1,094 0 869 243,066 307,882 307,882 44,120 V-L Flowrate (lb/hr) 199,383 199,383 199,383 1,005,800 38,923 0 27,788 7,014,133 8,453,564 8,453,564 794,842 Solids Flowrate (lb/hr) 0 0 0 0 0 12,177 0 0 0 0 0
Temperature (°F) 95 465 383 124 119 352 100 59 1,044 270 994 Pressure (psia) 745.0 740.0 460.0 2,214.7 23.7 17.3 799.5 14.7 15.2 15.2 1,814.7 Steam Table Enthalpy (Btu/lb)A 83.8 595.5 480.4 -69.8 32.1 --- 2.5 13.0 358.8 147.7 1,475.9 AspenPlus Enthalpy (Btu/lb)B -1,740.3 -1,228.6 -1,343.7 -3,921.0 -2,627.1 61.0 -3,522.1 -42.0 -252.8 -464.0 -5,390.1 Density (lb/ft3) 0.636 0.381 0.261 40.066 0.137 329.655 4.823 0.076 0.026 0.053 2.293
ASteam table reference conditions are 32.02°F & 0.089 psia BAspen thermodynamic reference state is the component’s constituent elements in an ideal gas state at 25°C and 1 atm

Cost and Performance Baseline for Fossil Energy Plants Volume 1b: Revision 2b
226
3.4.12.5 Mercury Removal and Acid Gas Removal Mercury removal and the AGR process are the same as in Case B5B.
The AGR process in Case B5B-Q is a two-stage Selexol process where H2S is removed in the first stage and CO2 in the second stage of absorption as previously described in Section 3.1.5. The process results in three product streams, the clean syngas, a CO2-rich stream and an acid gas feed to the Claus plant. The acid gas (stream 18) contains 35 percent H2S and 52 percent CO2 with the balance primarily H2.
3.4.12.6 CO2 Compression and Dehydration The CO2 compression and dehydration scheme is the same as for Case B5B.
3.4.12.7 Claus Unit The Claus plant is the same as Case B5B with the following exceptions:
• 5,523 kg/hr (12,177 lb/hr) of sulfur (stream 19) are produced • The waste heat boiler generates 12,957 kg/hr (28,564 lb/hr) of 3.0 MPa (430 psia) steam
3.4.12.8 Power Block Clean syngas from the AGR plant is heated to 241°C (465°F) first using hot water from the syngas scrubber followed by HP BFW before passing through an expansion turbine. The clean syngas (stream 16) is diluted with nitrogen (stream 4) and then enters the CT burner. There is no integration between the CT and the ASU in this case. The exhaust gas (stream 22) exits the CT at 562°C (1,044°F) and enters the HRSG where additional heat is recovered. The flue gas exits the HRSG at 132°C (270°F) (stream 23) and is discharged through the plant stack. The steam raised in the HRSG is used to power an advanced commercially available steam turbine using a nominal 12.4 MPa/538°C/538°C (1,800 psig/1,000°F/1,000°F) steam cycle.
3.4.12.9 Air Separation Unit The same elevated pressure ASU is used in Case B5B-Q and produces 4,343 tonnes/day (4,787 tpd) of 95 mol% oxygen and 14,595 tonnes/day (16,087 tpd) of nitrogen. There is no integration between the ASU and the CT in the CO2 capture cases.
3.4.13 Case B5B-Q - Performance Results The plant produces a net output of 494 MW at a net plant efficiency of 29.7 percent (HHV basis). Overall performance for the entire plant is summarized in Exhibit 3-110 and Exhibit 3-111, which includes auxiliary power requirements. The ASU accounts for 60 percent of the auxiliary load between the main air compressor, nitrogen compressor, oxygen compressor, and ASU auxiliaries. The two-stage Selexol process and CO2 compression account for an additional 26 percent of the auxiliary power load. The BFW pumps and cooling water system (CWPs and cooling tower fan) compose about 5 percent of the load, leaving 9 percent of the auxiliary load for all other systems.

Cost and Performance Baseline for Fossil Energy Plants Volume 1b: Revision 2b
227
Exhibit 3-110 Case B5B-Q plant performance summary
Performance Summary
Combustion Turbine Power, MWe 464
Sweet Gas Expander Power, MWe 7
Steam Turbine Power, MWe 214
Total Gross Power, MWe 684
Air Separation Unit Main Air Compressor, kWe 67,350
Oxygen Compressor, kWe 10,640
Nitrogen Compressors, kWe 35,630
CO₂ Compression, kWe 31,130
Acid Gas Removal, kWe 19,210
Balance of Plant, kWe 26,450
Total Auxiliaries, MWe 190
Net Power, MWe 494
HHV Net Plant Efficiency (%) 29.7%
HHV Net Plant Heat Rate, kJ/kWh (Btu/kWh) 12,138 (11,505)
HHV Cold Gas Efficiency, % 79.2%
HHV Combustion Turbine Efficiency, % 36.0%
LHV Net Plant Efficiency (%) 30.7%
LHV Net Plant Heat Rate, kJ/kWh (Btu/kWh) 11,708 (11,097)
LHV Cold Gas Efficiency, % 75.9%
LHV Combustion Turbine Efficiency, % 42.4%
Steam Turbine Cycle Efficiency, % 38.1%
Steam Turbine Heat Rate, kJ/kWh (Btu/kWh) 9,443 (8,950)
Condenser Duty, GJ/hr (MMBtu/hr) 1,452 (1,376)
As-Received Coal Feed, kg/hr (lb/hr) 220,890 (486,978)
HHV Thermal Input, kWt 1,664,962
LHV Thermal Input, kWt 1,605,876
Raw Water Withdrawal, (m3/min)/MWnet (gpm/MWnet) 0.047 (12.4)
Raw Water Consumption, (m3/min)/MWnet (gpm/MWnet) 0.038 (10.1)
O₂:Coal 0.761

Cost and Performance Baseline for Fossil Energy Plants Volume 1b: Revision 2b
228
Exhibit 3-111 Case B5B-Q plant power summary
Power Summary
Combustion Turbine Power, MWe 464
Sweet Gas Expander Power, MWe 7
Steam Turbine Power, MWe 214
Total Gross Power, MWe 684
Auxiliary Load Summary
Coal Handling, kWe 470
Coal Milling, kWe 2,270
Sour Water Recycle Slurry Pump, kWe 200
Slag Handling, kWe 1,160
Air Separation Unit Auxiliaries, kWe 1,000
Air Separation Unit Main Air Compressor, kWe 67,350
Oxygen Compressor, kWe 10,640
Nitrogen Compressors, kWe 35,630
Feedwater Pumps, kWe 2,620
Quench Water Pump, kWe 1,270
Syngas Recycle Compressor, kWe 0
CO₂ Compression, kWe 31,130
Scrubber Pumps, kWe 480
Acid Gas Removal, kWe 19,210
Combustion Turbine Auxiliaries, kWe 1,000
Steam Turbine Auxiliaries, kWe 100
Condensate Pumps, kWe 230
Circulating Water Pumps, kWe 4,830
Ground Water Pumps, kWe 560
Cooling Tower Fans, kWe 2,500
Claus Plant/TGTU Auxiliaries, kWe 250
Claus Plant TG Recycle Compressor, kWe 1,800
Miscellaneous Balance of PlantA,B, kWe 3,000
Transformer Losses, kWe 2,710
Total Auxiliaries, MWe 190
Net Power, MWe 494
AIncludes plant control systems, lighting, HVAC, and miscellaneous low voltage loads

Cost and Performance Baseline for Fossil Energy Plants Volume 1b: Revision 2b
229
3.4.13.1 Environmental Performance The environmental targets for emissions of Hg, NOx, SO2, and PM were presented in Section 2.3. A summary of the plant air emissions for Case B5B-Q is presented in Exhibit 3-112. All HCl is assumed to be removed and is, therefore, not reported.
Exhibit 3-112 Case B5B-Q air emissions
kg/GJ (lb/MMBtu) Tonne/year (ton/year)A kg/MWh (lb/MWh)B
SO2 0.001 (0.002) 39 (43) 0.008 (0.018)
NOx 0.021 (0.049) 878 (968) 0.183 (0.404)
Particulates 0.003 (0.007) 128 (141) 0.027 (0.059)
Hg 1.55E-7 (3.61E-7) 0.007 (0.007) 1.36E-6 (3.00E-6)
CO2 8 (20) 358,178 (394,824) 75 (165)
CO2C - - 104 (228)
ACalculations based on an 80 percent capacity factor BEmissions are based on gross power except where otherwise noted CCO2 emissions based on net power instead of gross power
The low level of SO2 emissions is achieved by capturing the sulfur in the gas by the two-stage Selexol AGR process. As a result of achieving the 90 percent CO2 removal target, the sulfur compounds are removed to an extent that exceeds the environmental target in Section 2.3. The clean syngas exiting the AGR process has a sulfur concentration of approximately 5 ppmv. This results in a concentration in the flue gas of less than less than 1 ppmv. The H2S-rich regeneration gas from the AGR system is fed to a Claus plant, producing elemental sulfur. The Claus plant tail gas is hydrogenated to convert all sulfur species to H2S and then recycled back to the Selexol process, thereby eliminating the need for a tail gas treatment unit.
NOx emissions are limited by nitrogen dilution to 15 ppmvd (as NO2 @15 percent O2). Ammonia in the syngas is removed with process condensate prior to the low-temperature AGR process. This helps lower NOx levels as well.
Particulate discharge to the atmosphere is limited to extremely low values by the use of the syngas quench in addition to the syngas scrubber and the gas washing effect of the AGR absorber. The particulate emissions represent filterable particulate only.
Approximately 97 percent of the mercury is captured from the syngas by dual activated carbon beds.
Ninety two percent of the CO2 from the syngas is captured in the AGR system and compressed for sequestration. Because not all CO is converted to CO2 in the shift reactors, the overall carbon removal is 90.0 percent.
The carbon balance for the plant is shown in Exhibit 3-113. The carbon input to the plant consists of carbon in the air in addition to carbon in the coal. Carbon leaves the plant as unburned carbon in the slag and as CO2 in the stack gas, ASU vent gas, and the captured CO2 product. The carbon capture efficiency is defined as one minus the amount of carbon in the stack gas relative to the total carbon in less carbon contained in the slag, represented by the following fraction:

Cost and Performance Baseline for Fossil Energy Plants Volume 1b: Revision 2b
230
𝐶𝐶𝐶𝐶𝐶𝐶𝐶𝐶𝐶𝐶𝐸𝐸 𝐴𝐴𝐸𝐸 𝑆𝑆𝐶𝐶𝐶𝐶𝑆𝑆𝑆𝑆(𝑇𝑇𝐶𝐶𝐶𝐶𝐶𝐶𝑇𝑇 𝐶𝐶𝐶𝐶𝐶𝐶𝐶𝐶𝐶𝐶𝐸𝐸 𝑅𝑅𝐸𝐸) − (𝐶𝐶𝐶𝐶𝐶𝐶𝐶𝐶𝐶𝐶𝐸𝐸 𝐴𝐴𝐸𝐸 𝑆𝑆𝑇𝑇𝐶𝐶𝑆𝑆) = �1 − �
30,752311,614 − 6,208
� ∗�100 = 90.0%
Exhibit 3-113 Case B5B-Q carbon balance
Carbon In Carbon Out
kg/hr (lb/hr) kg/hr (lb/hr)
Coal 140,805 (310,423) Stack Gas 13,949 (30,752)
Air (CO₂) 540 (1,191) CO₂ Product 124,473 (274,417)
ASU Vent 107 (237)
Slag 2,816 (6,208)
Total 141,346 (311,614) Total 141,346 (311,614)
Exhibit 3-114 shows the sulfur balance for the plant. Sulfur input comes solely from the sulfur in the coal. Sulfur output includes the sulfur recovered in the Claus plant, sulfur co-sequestered with the CO2 product, and sulfur emitted in the stack gas. Sulfur in the slag is considered to be negligible.
Exhibit 3-114 Case B5B-Q sulfur balance
Sulfur In Sulfur Out
kg/hr (lb/hr) kg/hr (lb/hr)
Coal 5,536 (12,206) Stack Gas 3 (6)
CO₂ Product 10 (23)
Elemental Sulfur 5,523 (12,177)
Total 5,536 (12,206) Total 5,536 (12,206)
Exhibit 3-115 shows the overall water balance for the plant. The exhibit is presented in an identical manner as for cases B1A-B5B.

Cost and Performance Baseline for Fossil Energy Plants Volume 1b: Revision 2b
231
Exhibit 3-115 Case B5B-Q water balance
Water Use Water Demand
Internal Recycle
Raw Water Withdrawal
Process Water
Discharge Raw Water
Consumption
m3/min (gpm)
m3/min (gpm)
m3/min (gpm) m3/min (gpm) m3/min (gpm)
Slag Handling 0.53 (139) 0.53 (139) – – –
Slurry Water 1.51 (400) 1.51 (400) – – –
Quench/Wash 6.66 (1,759) 1.86 (493) 4.79 (1,267) – 4.79 (1,267)
Humidifier – – – – –
SWS Blowdown – – – 0.04 (10.32) -0.04 (-10.32)
Condenser Makeup 0.15 (40) – 0.15 (40) – 0.15 (40)
BFW Makeup 0.15 (40) – 0.15 (40) – 0.15 (40)
Gasifier Steam – – – – –
Shift Steam – – – – –
CT Steam Dilution – – – – –
Cooling Tower 18.83 (4,974) 0.54 (143) 18.29 (4,831) 4.23 (1,119) 14.05 (3,712)
BFW Blowdown – 0.15 (40) -0.15 (-40) – -0.15 (-40)
SWS Blowdown – 0.39 (103.15)
-0.39 (-103.15)
– -0.39
(-103.15)
Total 27.68 (7,311) 4.45 (1,174) 23.23 (6,137) 4.27 (1,129) 18.96 (5,008)
3.4.13.2 Heat and Mass Balance Diagrams Heat and mass balance diagrams are shown for the following subsystems in Exhibit 3-116 through Exhibit 3-118:
• Coal gasification and ASU • Syngas cleanup, sulfur recovery, and tail gas recycle • Combined cycle power generation, steam, and FW
An overall plant energy balance is provided in tabular form in Exhibit 3-119. The power out is the combined CT, steam turbine, and expander power prior to generator losses. The power at the generator terminals (shown in Exhibit 3-118) is calculated by multiplying the power out by a combined generator efficiency of 98.5 percent.
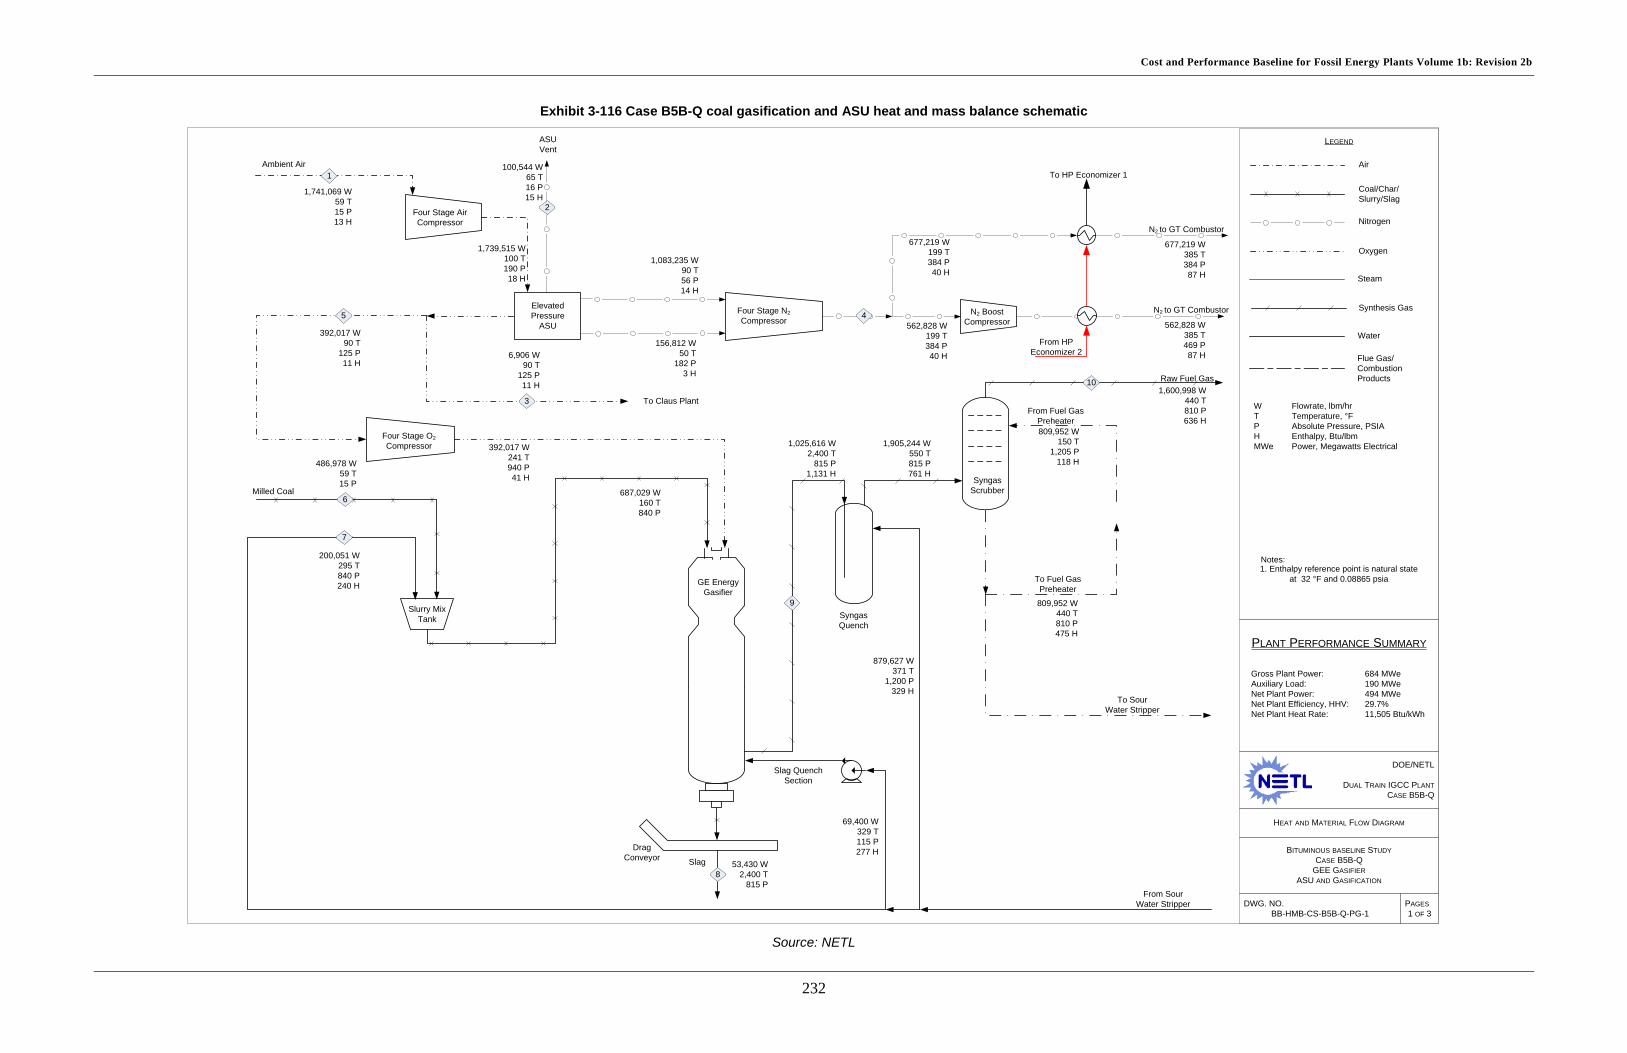
Cost and Performance Baseline for Fossil Energy Plants Volume 1b: Revision 2b
232
Exhibit 3-116 Case B5B-Q coal gasification and ASU heat and mass balance schematic
Source: NETL
DOE/NETL
DUAL TRAIN IGCC PLANTCASE B5B-Q
HEAT AND MATERIAL FLOW DIAGRAM
BITUMINOUS BASELINE STUDYCASE B5B-Q
GEE GASIFIERASU AND GASIFICATION
DWG. NO.BB-HMB-CS-B5B-Q-PG-1
PLANT PERFORMANCE SUMMARY
LEGEND
PAGES1 OF 3
Ambient Air
Four Stage AirCompressor
ElevatedPressure
ASU
Four Stage N2Compressor
Four Stage O2Compressor
ASU Vent
1,741,069 W59 T15 P13 H
392,017 W90 T
125 P11 H
392,017 W241 T940 P41 H
To Claus Plant
6,906 W90 T
125 P11 H
100,544 W65 T16 P15 H
1,083,235 W90 T56 P14 H
156,812 W50 T
182 P3 H
5
1
3
2
Slurry Mix Tank
Milled Coal
Slag
486,978 W59 T15 P
200,051 W295 T840 P240 H
53,430 W2,400 T
815 P
677,219 W385 T384 P87 H
687,029 W160 T840 P
1,739,515 W100 T190 P18 H
6
677,219 W199 T384 P40 H
N2 BoostCompressor562,828 W
199 T384 P40 H
562,828 W385 T469 P87 H
GE Energy Gasifier
Syngas Scrubber
Slag Quench Section
Drag Conveyor
4
1,025,616 W2,400 T
815 P1,131 H
1,600,998 W440 T810 P636 H
SyngasQuench
1,905,244 W550 T815 P761 H
8
9
10
879,627 W371 T
1,200 P329 H
From SourWater Stripper
To Fuel Gas Preheater
From Fuel Gas Preheater
809,952 W440 T810 P475 H
809,952 W150 T
1,205 P118 H
To SourWater Stripper
69,400 W329 T115 P277 H
7
N2 to GT Combustor
N2 to GT Combustor
Raw Fuel Gas
From HP Economizer 2
To HP Economizer 1Air
Oxygen
Nitrogen
Coal/Char/Slurry/Slag
Synthesis Gas
Water
Steam
W Flowrate, lbm/hr T Temperature, °FP Absolute Pressure, PSIAH Enthalpy, Btu/lbmMWe Power, Megawatts Electrical
Flue Gas/CombustionProducts
Gross Plant Power: 684 MWeAuxiliary Load: 190 MWeNet Plant Power: 494 MWeNet Plant Efficiency, HHV: 29.7%Net Plant Heat Rate: 11,505 Btu/kWh
Notes:1. Enthalpy reference point is natural state
at 32 °F and 0.08865 psia

Cost and Performance Baseline for Fossil Energy Plants Volume 1b: Revision 2b
233
Exhibit 3-117 Case B5B-Q syngas cleanup heat and mass balance schematic
Source: NETL
DOE/NETL
DUAL TRAIN IGCC PLANTCASE B5B-Q
HEAT AND MATERIAL FLOW DIAGRAM
BITUMINOUS BASELINE STUDYCASE B5B-Q
GEE GASIFIERGAS CLEANUP SYSTEM
DWG. NO.BB-HMB-CS-B5B-Q-PG-2
PLANT PERFORMANCE SUMMARY
LEGEND
PAGES2 OF 3
Mercury Removal
KnockOut
Drum
SourDrum
Claus Plant
Tail Gas
Furnace
CatalyticReactorBeds
Sulfur
Knock Out
SyngasCoolers
SourStripper
1,600,998 W440 T810 P636 H
1,244,998 W95 T
745 P16 H
38,923 W119 T24 P32 H
199,383 W383 T460 P480 H
12,177 W
36,695 W450 T12 P
467 H
3,043 W246 T65 P
500 H
19
1320
36,695 W550 T11 P
429 H
1,217,210 W95 T
750 P16 H
8,907 W114 T11 P40 H
27,788 W100 T800 P
3 H
15199,383 W
95 T745 P84 H
18
Fuel GasExpander
16199,383 W
465 T740 P596 H
HighTemperature
Shift #1
Low Temperature
Shift #2
121,600,998 W
450 T805 P621 H
1,600,998 W782 T800 P606 H
1,600,998 W425 T800 P440 H
1,600,998 W481 T790 P437 H
1,600,998 W471 T785 P432 H
Two-StageSelexol
Clean Gas
CO2
Acid Gas
Multistage Intercooled CO2
Compressor
Interstage Knockout
17
10
14
1,005,800 W124 T
2,215 P-70 H
Tail Gas RecycleCompressor
Hydrogenation and Tail Gas
Cooling
From IP BFW
To Reheater and Shift Steam
From IP BFW, LP BFW, and
Tail Gas Cooling
1,149,078 W
From Syngas Scrubber
To Coal Slurry, Syngas Quench, and Slag Quench
To Water Treatment
Makeup Water
Raw Syngas
COS Hydrolysis Preheater
Reboiler
From Syngas Scrubber and HP
Economizer 2
To Syngas Scrubber and HP
Economizer 1
Fuel Gas Preheater Fuel Gas to CT
36,906 W
90 T125 P11 H
6,906 W450 T125 P92 H
To Deaerator
From IP BFW
Claus Oxygen
Preheater
From Gland Steam Condenser To Syngas
Cooling111 T
CO2 Product
To LP Turbine, PreheaterWGS/Gasifier Steam
and Reheater
Air
Oxygen
Nitrogen
Coal/Char/Slurry/Slag
Synthesis Gas
Sour Water
Acid Gas
Tailgas
Carbon Dioxide
Sour Gas
Sulfur
Hydrogen
Water
W Flowrate, lbm/hr T Temperature, °FP Absolute Pressure, PSIAH Enthalpy, Btu/lbmMWe Power, Megawatts Electrical
Steam
Gross Plant Power: 684 MWeAuxiliary Load: 190 MWeNet Plant Power: 494 MWeNet Plant Efficiency, HHV: 29.7%Net Plant Heat Rate: 11,505 Btu/kWh
Notes:1. Enthalpy reference point is natural state
at 32 °F and 0.08865 psia

Cost and Performance Baseline for Fossil Energy Plants Volume 1b: Revision 2b
234
Exhibit 3-118 Case B5B-Q combined cycle power generation heat and mass balance schematic
Source: NETL
DOE/NETL
DUAL TRAIN IGCC PLANTCASE B5B-Q
HEAT AND MATERIAL FLOW DIAGRAM
BITUMINOUS BASELINE STUDYCASE B5B-Q
GEE GASIFIERPOWER BLOCK SYSTEM
DWG. NO.BB-HMB-CS-B5B-Q-PG-3
PLANT PERFORMANCE SUMMARY
LEGEND
Air
Oxygen
Nitrogen
Coal/Char/Slurry/Slag
Synthesis Gas
PAGES3 OF 3
Sour Gas
Sour Water
Water
Steam
Flue Gas
HPTurbine
IPTurbine
Air Inlet Filter
Steam Seal Regulator
Blowdown Flash
GlandSteam
Condenser
LP Turbine
Stack
ExpanderCompressor
Generator
Generator
CondensatePumpa
Steam Turbine
State-of-the-art 2008 F-Class Turbine
7,014,133 W59 T15 P13 H
1,523,777 W101 T
1 P69 H
8,453,564 W270 T15 P
148 H
199,383 W383 T460 P480 H
794,842 W994 T
1,815 P1,468 H
6,775 W298 T65 P
1,171 H
1,491,802 W441 T65 P
1,245 H
1,523,777 W103 T120 P71 H
1,400 W615 T65 P
1,331 H
1,400 W212 T15 P
180 H
21
24
16
23
Hot Well
Condenser
Make-up
19,815 W59 T15 P27 H
9,026 W661 T501 P
1,327 H
9,761 W615 T65 P
1,331 H
798 W994 T
1,815 P1,468 H
1,337 W505 T65 P
1,277 H
Preheater DeaeratorHeater
HP Economizer
1
LP Economizer
HP Economizer
2
HP Evaporator
Superheater/ Reheater
From Syngas Cooler
To ASU and Fuel Gas Preheater
Deaerator
HP Pump
IP PumpTo Claus
LP Evaporator
IP to Syngas and WGS Coolers
From Claus, Process Extraction, and 250 PSIA Header
LP Extraction Spray
LP Blowdown
LP To Syngas Coolers
Cold Reheat
Hot Reheat
8,453,564 W1,044 T
15 P359 H
22
To WWT
Process Extraction
LP Pump
LP From Syngas Coolers
W Flowrate, lbm/hr T Temperature, °FP Absolute Pressure, PSIAH Enthalpy, Btu/lbmMWe Power, Megawatts Electrical
235 T
274 T
1,525,679 W274 T45 P
242 H
813,794 W279 T
2,251 P247 H
7,628 W274 T79 P
242 H
5,928 W274 T79 P
242 H342,287 W274 T79 P
242 H 40,181 W276 T615 P244 H
367,487 W351 T
2,251 P319 H
305 T 585 T 636 T
18,961 W585 T
2,001 P585 H
550 T
766,193 W661 T501 P
1,327 H
367,487 W585 T
2,001 P585 H
332,253 W298 T65 P
266 H
170 T
252,538 W298 T65 P
1,171 H
356,041 W298 T65 P
1,171 H
296,945 W276 T820 P244 H
1,000 W994 T
1,815 P1,468 H
1,000 W212 T15 P
180 H
39,537 W500 T250 P
1,255 H
IP Extraction Steam to 250 PSIA Header
LP Extraction Spray #1
Condensate to Tail Gas Cooling
677,219 W385 T469 P87 H
Nitrogen Diluent
Fuel Gas
Ambient Air
IP From WGS and Syngas Coolers
994 T
298 T
From ASU and Fuel Gas Preheater
Nitrogen Diluent562,828 W
385 T384 P87 H
Gross Plant Power: 684 MWeAuxiliary Load: 190 MWeNet Plant Power: 494 MWeNet Plant Efficiency, HHV: 29.7%Net Plant Heat Rate: 11,505 Btu/kWh
Notes:1. Enthalpy reference point is natural state
at 32 °F and 0.08865 psia

Cost and Performance Baseline for Fossil Energy Plants Volume 1b: Revision 2b
235
This page intentionally left blank

Cost and Performance Baseline for Fossil Energy Plants Volume 1b: Revision 2b
236
Exhibit 3-119 Case B5B-Q overall energy balance
HHV Sensible + Latent Power Total
Heat In (GJ/hr) Coal 5,994
(5,681) 5.0 (4.7) – 5,999
(5,686) Air – 120.0 (113.8) – 120.0
(113.8) Raw Water Makeup – 87.4 (82.8) – 87.4 (82.8)
Auxiliary Power – – 685 (650) 685 (650) TOTAL 5,994
(5,681) 212.4 (201.3) 685 (650) 6,892
(6,532) Heat Out (GJ/hr)
ASU Vent – 1.6 (1.5) – 1.6 (1.5) Slag 92.3 (87.5) 37.8 (35.9) – 130.2
(123.4) Stack Gas – 1,317 (1,248) – 1,317
(1,248) Sulfur 51.2 (48.5) 0.6 (0.6) – 51.8 (49.1)
Motor Losses and Design Allowances
– – 57.1 (54.2) 57.1 (54.2)
Condenser – 1,452 (1,376) – 1,452 (1,376)
Non-Condenser Cooling Tower Loads
– 830 (787) – 830 (787)
CO₂ – -74.0 (-70.2) – -74.0 (-70.2) Blowdown – 50.0 (47.4) – 50.0 (47.4)
CO₂ Capture Losses – 176.2 (167.0) – 176.2 (167.0)
Ambient LossesA – 163.1 (154.6) – 163.1 (154.6)
Power – – 2,463 (2,335)
2,463 (2,335)
TOTAL 143.5 (136.0)
3,955 (3,748) 2,520 (2,389)
6,618 (6,273)
Unaccounted EnergyB – 273 (259) – 273 (259) AAmbient losses include all losses to the environment through radiation, convection, etc. Sources of these losses include the combustor, reheater, superheater, and transformers. BBy difference
3.4.14 Case B5B-Q - Major Equipment List Major equipment items for the GEE quench-only gasifier with CO2 capture are shown in the following tables. The accounts used in the equipment list correspond to the account numbers used in the cost estimates in Section 3.4.15. In general, the design conditions include a 10 percent contingency for flows and heat duties and a 21 percent contingency for heads on pumps and fans.

Cost and Performance Baseline for Fossil Energy Plants Volume 1b: Revision 2b
237
Case B5B-Q – Account 1: Coal Handling Equipment
No. Description Type Design Condition Operating Qty. Spares
1 Bottom Trestle Dumper and Receiving Hoppers N/A 181 tonne (200 ton) 2 0
2 Feeder Belt 570 tonne/hr (630 tph) 2 0 3 Conveyor No. 1 Belt 1,130 tonne/hr (1,250 tph) 1 0 4 Conveyor No. 2 Belt 1,130 tonne/hr (1,250 tph) 1 0 5 Stacker/Reclaimer Traveling, linear 1,130 tonne/hr (1,250 tph) 1 0 6 Reclaim Hopper N/A 50 tonne (50 ton) 2 1 7 Feeder Vibratory 180 tonne/hr (200 tph) 2 1 8 Conveyor No. 3 Belt w/ tripper 360 tonne/hr (400 tph) 1 0 9 Coal Surge Bin w/ Vent Filter Dual outlet 180 tonne (200 ton) 2 0
10 Crusher Impactor reduction 8 cm x 0 - 3 cm x 0 (3" x 0 - 1-1/4" x 0) 2 0
11 Conveyor No. 4 Belt w/ tripper 360 tonne/hr (400 tph) 1 0 12 Conveyor No. 5 Belt w/ tripper 360 tonne/hr (400 tph) 1 0
13 Coal Silo w/ Vent Filter and Slide Gates Field erected 800 tonne (900 ton) 3 0
Case B5B-Q – Account 2: Coal Preparation and Feed Equipment
No. Description Type Design Condition Operating Qty. Spares
1 Feeder Vibratory 80 tonne/h (90 tph) 3 0 2 Conveyor No. 6 Belt w/ tripper 240 tonne/h (270 tph) 1 0 3 Rod Mill Feed Hopper Dual Outlet 490 tonne (540 ton) 1 0 4 Weigh Feeder Belt 120 tonne/h (130 tph) 2 0 5 Rod Mill Rotary 120 tonne/h (130 tph) 2 0
6 Slurry Water Storage Tank with Agitator Field erected 299,880 liters (79,220 gal) 2 0
7 Slurry Water Pumps Centrifugal 830 lpm (220 gpm) 2 1 8 Trommel Screen Coarse 170 tonne/h (190 tph) 2 0
9 Rod Mill Discharge Tank with Agitator Field erected 392,290 liters
(103,630 gal) 2 0
10 Rod Mill Product Pumps Centrifugal 3,300 lpm (900 gpm) 2 2
11 Slurry Storage Tank with Agitator Field erected 1,176,900 liters
(310,900 gal) 2 0
12 Slurry Recycle Pumps Centrifugal 6,500 lpm (1,700 gpm) 2 2
13 Slurry Product Pumps Positive displacement 3,300 lpm (900 gpm) 2 2
Case B5B-Q – Account 3: Feedwater and Miscellaneous Systems and Equipment Equipment
No. Description Type Design Condition Operating Qty. Spares
1 Demineralized Water Storage Tank
Vertical, cylindrical, outdoor 811,000 liters (214,000 gal) 2 0
2 Condensate Pumps Vertical canned 6,380 lpm @ 90 m H₂O (1,690 gpm @ 300 ft H₂O) 2 1
3 Deaerator (integral w/ HRSG) Horizontal spray type 465,000 kg/hr (1,025,000
lb/hr) 2 0
4 Intermediate-Pressure Feedwater Pump
Horizontal centrifugal, single stage
6,600 lpm @ 30 m H₂O (1,740 gpm @ 90 ft H₂O) 2 1
5 High-Pressure Feedwater Pump No. 1
Barrel type, multi-stage, centrifugal
HP water: 3,520 lpm @ 1,800 m H₂O (930 gpm @ 6,100 ft H₂O)
2 1
6 High-Pressure Feedwater Pump No. 2
Barrel type, multi-stage, centrifugal
IP water: 1,590 lpm @ 220 m H₂O (420 gpm @ 730 ft H₂O) 2 1

Cost and Performance Baseline for Fossil Energy Plants Volume 1b: Revision 2b
238
Equipment No. Description Type Design Condition Operating
Qty. Spares
7 Auxiliary Boiler Shop fabricated, water tube
18,000 kg/hr, 2.8 MPa, 343°C (40,000 lb/hr, 400 psig, 650°F) 1 0
8 Service Air Compressors Flooded Screw 28 m3/min @ 0.7 MPa
(1,000 scfm @ 100 psig) 2 1
9 Instrument Air Dryers Duplex, regenerative 28 m3/min (1,000 scfm) 2 1
10 Closed Cycle Cooling Heat Exchangers Plate and frame 457 GJ/hr
(433 MMBtu/hr) each 2 0
11 Closed Cycle Cooling Water Pumps Horizontal centrifugal 163,800 lpm @ 20 m H₂O
(43,300 gpm @ 70 ft H₂O) 2 1
12 Engine-Driven Fire Pump
Vertical turbine, diesel engine
3,785 lpm @ 110 m H₂O (1,000 gpm @ 350 ft H₂O) 1 1
13 Fire Service Booster Pump
Two-stage horizontal centrifugal
2,650 lpm @ 80 m H₂O (700 gpm @ 250 ft H₂O) 1 1
14 Raw Water Pumps Stainless steel, single suction
6,030 lpm @ 20 m H₂O (1,590 gpm @ 60 ft H₂O) 2 1
15 Ground Water Pumps Stainless steel, single suction
3,010 lpm @ 270 m H₂O (800 gpm @ 880 ft H₂O) 4 1
16 Filtered Water Pumps Stainless steel, single suction
4,170 lpm @ 50 m H₂O (1,100 gpm @ 160 ft H₂O) 2 1
17 Filtered Water Tank Vertical, cylindrical 2,003,000 liter (529,000 gal) 2 0
18 Makeup Water Demineralizer
Anion, cation, and mixed bed 230 lpm (60 gpm) 2 0
19 Liquid Waste Treatment System N/A 10 years, 24-hour storm 1 0
Case B5B-Q – Account 4: Gasifier, ASU, and Accessories Including Low Temperature Heat Recovery and Fuel Gas Saturation Equipment
No. Description Type Design Condition Operating Qty. Spares
1 Gasifier Pressurized slurry-feed, entrained bed
2,900 tonne/day, 5.6 MPa (3,200 tpd, 815 psia) 2 0
2 Synthesis Gas Cooler
Vertical downflow radiant heat exchanger with outlet quench chamber
256,000 kg/hr (564,000 lb/hr) 2 0
3 Synthesis Gas Cyclone High efficiency 475,000 kg/hr (1,048,000 lb/hr)
Design efficiency 90% 2 0
4 Raw Gas Coolers Shell and tube with condensate drain 399,000 kg/hr (881,000 lb/hr) 8 0
5 Raw Gas Knockout Drum
Vertical with mist eliminator
304,000 kg/hr, 35°C, 5.2 MPa (671,000 lb/hr, 95°F, 755 psia) 2 0
6 Synthesis Gas Reheater Shell and Tube 50,000 kg/hr (110,000 lb/hr)
7 Flare Stack Self-supporting, carbon steel, stainless steel top, pilot ignition
475,000 kg/hr (1,048,000 lb/hr) syngas 2 0
8 ASU Main Air Compressor Centrifugal, multi-stage 6,000 m3/min @ 1.3 MPa
(210,000 scfm @ 190 psia) 2 0
9 Cold Box Vendor design 2,400 tonne/day (2,600 tpd) of 95% purity oxygen 2 0
10 Oxygen Compressor Centrifugal, multi-stage 1,000 m3/min (42,000 scfm) Suction - 1.0 MPa (130 psia)
Discharge - 6.5 MPa (940 psia) 2 0
11 Primary Nitrogen Compressor Centrifugal, multi-stage
4,000 m3/min (134,000 scfm) Suction - 0.4 MPa (60 psia)
Discharge - 2.7 MPa (390 psia) 2 0

Cost and Performance Baseline for Fossil Energy Plants Volume 1b: Revision 2b
239
Equipment No. Description Type Design Condition Operating
Qty. Spares
12 Secondary Nitrogen Compressor
Centrifugal, single-stage
550 m3/min (19,000 scfm) Suction - 1.3 MPa (180 psia)
Discharge - 2.7 MPa (390 psia) 2 0
13 Syngas Dilution Nitrogen Boost Compressor
Centrifugal, single-stage
2,000 m3/min (70,000 scfm) Suction - 2.6 MPa (380 psia)
Discharge - 3.2 MPa (470 psia) 2 0
Case B5B-Q – Account 5: Syngas Cleanup Equipment
No. Description Type Design Condition Operating Qty. Spares
1 Mercury Adsorber 1 Sulfated carbon bed 304,000 kg/hr (669,000 lb/hr), 35°C (95°F), 5.2 MPa (750 psia) 2 0
2 Mercury Adsorber 2 Sulfated carbon bed 304,000 kg/hr (669,000 lb/hr), 35°C (95°F), 5.2 MPa (750 psia) 2 0
3 Sulfur Plant Claus type 146 tonne/day (161 tpd) 1 0
4 Water Gas Shift Reactors Fixed bed, catalytic 200,000 kg/hr (440,000 lb/hr),
232°C (450°F), 5.5 MPa (800 psia) 4 0
5 Shift Reactor Heat Recovery Exchangers
Shell and Tube Exchanger 1: 154 GJ/hr (146
MMBtu/hr) Exchanger 2: 4 GJ/hr (4 MMBtu/hr)
4 0
6 Acid Gas Removal Plant Two-stage Selexol 311,000 kg/hr (685,000 lb/hr),
35°C (95°F), 5.1 MPa (745 psia) 2 0
7 Hydrogenation Reactor Fixed bed, catalytic
18,000 kg/hr (40,000 lb/hr), 232°C (450°F), 0.1 MPa (12.3
psia) 1 0
8 Tail Gas Recycle Compressor Centrifugal 14,000 kg/hr (31,000 lb/hr) each 1 0
9 CO₂ Compressor Integrally geared, multi-stage centrifugal
1,100 m3/min @ 15.3 MPa (39,900 scfm @ 2,215 psia) 4 0
Case B5B-Q – Account 6: Combustion Turbine and Auxiliaries Equipment
No. Description Type Design Condition Operating Qty. Spares
1 Combustion Turbine State-of-the-art 2008 F-class 230 MW 2 0
2 Combustion Turbine Generator TEWAC 260 MVA @ 0.9 p.f., 24 kV, 60 Hz,
3-phase 2 0
3 Syngas Expansion Turbine/Generator Turbo Expander
49,700 kg/h (109,700 lb/h) 5.1 MPa (740 psia) Inlet
3.2 MPa (460 psia) Outlet 2 0
Case B5B-Q – Account 7: HRSG, Ducting, and Stack Equipment
No. Description Type Design Condition Operating Qty. Spares
1 Stack CS plate, type 409SS liner
76 m (250 ft) high x 8.5 m (28 ft) diameter 1 0
2 Heat Recovery Steam Generator
Drum, multi-pressure with economizer section and integral deaerator
Main steam - 198,294 kg/hr, 12.4 MPa/534°C
(437,163 lb/hr, 1,800 psig/994°F) 2 0

Cost and Performance Baseline for Fossil Energy Plants Volume 1b: Revision 2b
240
Case B5B-Q – Account 8: Steam Turbine Generator and Auxiliaries Equipment
No. Description Type Design Condition Operating Qty. Spares
1 Steam Turbine
Commercially available advanced steam turbine
225 MW 12.4 MPa/534°C/534°C (1,800 psig/
994°F/994°F) 1 0
2 Steam Turbine Generator
Hydrogen cooled, static excitation
250 MVA @ 0.9 p.f., 24 kV, 60 Hz, 3-phase 1 0
3 Surface Condenser
Single pass, divided waterbox including vacuum pumps
1,600GJ/hr (1,510 MMBtu/hr), Inlet water temperature 16°C
(60°F), Water temperature rise 11°C (20°F)
1 0
4 Steam Bypass One per HRSG 50% steam flow @ design steam
conditions 2 0
Case B5B-Q – Account 9: Cooling Water System Equipment
No. Description Type Design Condition Operating Qty. Spares
1 Circulating Water Pumps Vertical, wet pit 485,000 lpm @ 30 m
(128,000 gpm @ 100 ft) 2 1
2 Cooling Tower Evaporative, mechanical draft, multi-cell
11°C (51.5°F) wet bulb / 16°C (60°F) CWT / 27°C (80°F) HWT /
2,700 GJ/hr (2,560 MMBtu/hr) heat duty
1 0
Case B5B-Q – Account 10: Slag Recovery and Handling Equipment
No. Description Type Design Condition Operating Qty. Spares
1 Slag Quench Tank Water bath 254,000 liters (67,000 gal) 2 0 2 Slag Crusher Roll 13 tonne/hr (15 tph) 2 0 3 Slag Depressurizer Lock Hopper 13 tonne/hr (15 tph) 2 0 4 Slag Receiving Tank Horizontal, weir 153,000 liters (40,000 gal) 2 0 5 Black Water Overflow Tank Shop fabricated 69,000 liters (18,000 gal) 2 0 6 Slag Conveyor Drag chain 13 tonne/hr (15 tph) 2 0 7 Slag Separation Screen Vibrating 13 tonne/hr (15 tph) 2 0 8 Coarse Slag Conveyor Belt/bucket 13 tonne/hr (15 tph) 2 0 9 Fine Ash Settling Tank Vertical, gravity 217,000 liters (57,000 gal) 2 0
10 Fine Ash Recycle Pumps Horizontal centrifugal 60 lpm @ 14 m H₂O (10 gpm @ 46 ft H₂O) 2 2
11 Grey Water Storage Tank Field erected 69,000 liters (18,000 gal) 2 0
12 Grey Water Pumps Centrifugal 250 lpm @ 560 m H₂O (60 gpm @ 1,850 ft H₂O) 2 2
13 Slag Storage Bin Vertical, field erected 1,000 tonne (1,100 tons) 2 0 14 Unloading Equipment Telescoping chute 110 tonne/hr (120 tph) 1 0

Cost and Performance Baseline for Fossil Energy Plants Volume 1b: Revision 2b
241
Case B5B-Q – Account 11: Accessory Electric Plant Equipment
No. Description Type Design Condition Operating Qty. Spares
1 CTG Transformer Oil-filled 24 kV/345 kV, 260 MVA, 3-ph, 60 Hz 2 0
2 STG Transformer Oil-filled 24 kV/345 kV, 200 MVA, 3-ph, 60 Hz 1 0
3 High Voltage Auxiliary Transformer Oil-filled 345 kV/13.8 kV, 80
MVA, 3-ph, 60 Hz 2 0
4 Medium Voltage Transformer Oil-filled 24 kV/4.16 kV, 48 MVA, 3-ph, 60 Hz 1 1
5 Low Voltage Transformer Dry ventilated 4.16 kV/480 V, 7 MVA, 3-ph, 60 Hz 1 1
6 CTG Isolated Phase Bus Duct and Tap Bus
Aluminum, self-cooled 24 kV, 3-ph, 60 Hz 2 0
7 STG Isolated Phase Bus Duct and Tap Bus
Aluminum, self-cooled 24 kV, 3-ph, 60 Hz 1 0
8 Medium Voltage Switchgear Metal clad 4.16 kV, 3-ph, 60 Hz 1 1 9 Low Voltage Switchgear Metal enclosed 480 V, 3-ph, 60 Hz 1 1
10 Emergency Diesel Generator Sized for emergency shutdown
750 kW, 480 V, 3-ph, 60 Hz 1 0
Case B5B-Q – Account 12: Instrumentation and Control Equipment
No. Description Type Design Condition Operating Qty. Spares
1 DCS - Main Control
Monitor/keyboard; Operator printer (laser color); Engineering printer (laser B&W)
Operator stations/printers and engineering stations/printers
1 0
2 DCS - Data Highway Fiber optic Fully redundant, 25% spare 1 0
3.4.15 Case B5B-Q - Cost Estimating The cost estimating methodology was described previously in Section 2.6. Exhibit 3-120 shows a detailed breakdown of the capital costs; Exhibit 3-121 shows the owner’s costs, TOC, and TASC; Exhibit 3-122 shows the initial and annual O&M costs; and Exhibit 3-123 shows the COE breakdown.
The estimated TPC of the GEE gasifier with CO2 capture in quench-only configuration is $3,405/kW. Process contingency represents 4.0 percent of the TOC and project contingency represents 13.7 percent. The COE, including CO2 T&S costs of $10.2/MWh, is $148.9/MWh. For comparison, the TPC and COE for Case B5B, GEE in radiant-only configuration with CO2 capture, are $3,387/kW and $144.7/MWh.

Cost and Performance Baseline for Fossil Energy Plants Volume 1b: Revision 2b
242
Exhibit 3-120 Case B5B-Q total plant cost details Case: B5B-Q – GEE Quench IGCC w/ CO₂ Estimate Type: Conceptual
Plant Size (MW,net): 494 Cost Base: Jun 2011 Item Description Equipment Material Labor Bare Erected Eng'g CM Contingencies Total Plant Cost No. Cost Cost Direct Indirect Cost H.O.& Fee Process Project $/1,000 $/kW
1 Coal & Sorbent Handling 1.1 Coal Receive & Unload $4,552 $0 $2,194 $0 $6,746 $675 $0 $1,484 $8,905 $18 1.2 Coal Stackout & Reclaim $5,882 $0 $1,406 $0 $7,289 $729 $0 $1,604 $9,621 $19 1.3 Coal Conveyors & Yd Crush $5,469 $0 $1,392 $0 $6,861 $686 $0 $1,509 $9,056 $18 1.4 Other Coal Handling $1,431 $0 $322 $0 $1,753 $175 $0 $386 $2,314 $5 1.9 Coal & Sorbent Hnd. Foundations $0 $3,040 $7,944 $0 $10,984 $1,098 $0 $2,416 $14,499 $29
Subtotal $17,334 $3,040 $13,258 $0 $33,632 $3,363 $0 $7,399 $44,394 $90 2 Coal & Sorbent Prep & Feed
2.1 Coal Crushing & Drying w/2.3 $0 w/2.3 $0 $0 $0 $0 $0 $0 $0 2.2 Prepared Coal Storage & Feed $1,944 $467 $301 $0 $2,712 $271 $0 $597 $3,580 $7 2.3 Slurry Prep & Feed $23,378 $0 $14,694 $0 $38,072 $3,807 $1,904 $8,757 $52,539 $106 2.4 Misc. Coal Prep & Feed $1,069 $781 $2,301 $0 $4,151 $415 $0 $913 $5,479 $11 2.9 Coal & Sorbent Feed Foundation $0 $3,922 $3,365 $0 $7,287 $729 $0 $1,603 $9,618 $19
Subtotal $26,391 $5,170 $20,660 $0 $52,221 $5,222 $1,904 $11,869 $71,217 $144 3 Feedwater & Miscellaneous BOP Systems
3.1 Feedwater System $2,281 $3,936 $2,064 $0 $8,280 $828 $0 $1,822 $10,930 $22 3.2 Water Makeup & Pretreating $908 $94 $499 $0 $1,501 $150 $0 $495 $2,146 $4 3.3 Other Feedwater Subsystems $1,282 $424 $379 $0 $2,085 $208 $0 $459 $2,752 $6 3.4 Service Water Systems $531 $1,059 $3,650 $0 $5,240 $524 $0 $1,729 $7,493 $15 3.5 Other Boiler Plant Systems $2,862 $1,069 $2,632 $0 $6,563 $656 $0 $1,444 $8,663 $18 3.6 FO Supply Sys & Nat Gas $17,720 $682 $631 $0 $19,033 $1,903 $0 $4,187 $25,124 $51 3.7 Waste Treatment Equipment $1,229 $0 $761 $0 $1,990 $199 $0 $657 $2,845 $6 3.8 Misc. Power Plant Equipment $1,273 $170 $661 $0 $2,104 $210 $0 $694 $3,009 $6
Subtotal $28,086 $7,433 $11,277 $0 $46,795 $4,680 $0 $11,487 $62,962 $128 4 Gasifier & Accessories
4.1 Quench Gasifier System $79,525 $0 $68,344 $0 $147,869 $14,787 $19,355 $28,338 $210,349 $426 4.3 ASU & Oxidant Compression $231,253 $0 w/equip. $0 $231,253 $23,125 $0 $25,438 $279,816 $567 4.4 Scrubber & LT Heat Recovery $8,555 $0 $0 $0 $8,555 $855 $0 $1,882 $11,292 $23 4.5 Black Water & Sour Gas Section w/4.1 $0 w/4.1 $0 $0 $0 $0 $0 $0 $0 4.8 Major Component Rigging w/4.1&4.2 $0 w/4.1&4.2 $0 $0 $0 $0 $0 $0 $0 4.9 Gasification Foundations $0 $3,060 $2,670 $0 $5,730 $573 $0 $1,576 $7,879 $16
Subtotal $319,333 $3,060 $71,014 $0 $393,407 $39,341 $19,355 $57,233 $509,336 $1,031 5A Gas Cleanup & Piping
5A.1 Double Stage Selexol $160,990 $0 w/equip. $0 $160,990 $16,099 $32,198 $41,857 $251,145 $509 5A.2 Elemental Sulfur Plant $12,451 $2,427 $15,954 $0 $30,831 $3,083 $0 $6,783 $40,697 $82 5A.3 Mercury Removal $1,967 $0 $1,487 $0 $3,454 $345 $173 $794 $4,767 $10 5A.4 Shift Reactors $12,108 $0 $4,841 $0 $16,949 $1,695 $0 $3,729 $22,373 $45 5A.7 Fuel Gas Piping $0 $810 $530 $0 $1,340 $134 $0 $295 $1,769 $4 5A.9 HGCU Foundations $0 $733 $494 $0 $1,227 $123 $0 $405 $1,755 $4
Subtotal $187,516 $3,970 $23,306 $0 $214,792 $21,479 $32,371 $53,863 $322,505 $653

Cost and Performance Baseline for Fossil Energy Plants Volume 1b: Revision 2b
243
Case: B5B-Q – GEE Quench IGCC w/ CO₂ Estimate Type: Conceptual Plant Size (MW,net): 494 Cost Base: Jun 2011
Item Description Equipment Material Labor Bare Erected Eng'g CM Contingencies Total Plant Cost No. Cost Cost Direct Indirect Cost H.O.& Fee Process Project $/1,000 $/kW
5B CO₂ Compression 5B.2 CO₂ Compression & Drying $40,213 $6,032 $17,419 $0 $63,663 $6,366 $0 $14,006 $84,035 $170
Subtotal $40,213 $6,032 $17,419 $0 $63,663 $6,366 $0 $14,006 $84,035 $170 6 Combustion Turbine & Accessories
6.1 Combustion Turbine Generator $111,210 $0 $7,881 $0 $119,091 $11,909 $11,909 $14,291 $157,201 $318 6.2 Syngas Expander $6,686 $0 $918 $0 $7,604 $760 $0 $1,255 $9,619 $19 6.9 Combustion Turbine Foundations $0 $1,016 $1,175 $0 $2,191 $219 $0 $723 $3,133 $6
Subtotal $117,896 $1,016 $9,974 $0 $128,886 $12,889 $11,909 $16,269 $169,953 $344 7 HRSG, Ducting, & Stack
7.1 Heat Recovery Steam Generator $29,570 $0 $5,726 $0 $35,296 $3,530 $0 $3,883 $42,708 $86 7.3 Ductwork $0 $2,109 $1,478 $0 $3,587 $359 $0 $789 $4,734 $10 7.4 Stack $4,069 $0 $1,518 $0 $5,587 $559 $0 $615 $6,761 $14 7.9 HRSG, Duct & Stack Foundations $0 $775 $778 $0 $1,552 $155 $0 $512 $2,220 $4
Subtotal $33,639 $2,883 $9,499 $0 $46,022 $4,602 $0 $5,798 $56,423 $114 8 Steam Turbine Generator
8.1 Steam TG & Accessories $35,245 $0 $4,866 $0 $40,111 $4,011 $0 $4,412 $48,535 $98 8.2 Turbine Plant Auxiliaries $206 $0 $470 $0 $676 $68 $0 $74 $818 $2 8.3 Condenser & Auxiliaries $3,200 $0 $1,812 $0 $5,012 $501 $0 $551 $6,064 $12 8.4 Steam Piping $10,865 $0 $4,712 $0 $15,577 $1,558 $0 $4,284 $21,418 $43 8.9 TG Foundations $0 $951 $1,680 $0 $2,630 $263 $0 $868 $3,761 $8
Subtotal $49,516 $951 $13,540 $0 $64,006 $6,401 $0 $10,190 $80,597 $163 9 Cooling Water System
9.1 Cooling Towers $4,640 $0 $1,400 $0 $6,040 $604 $0 $997 $7,641 $15 9.2 Circulating Water Pumps $2,236 $0 $170 $0 $2,405 $241 $0 $397 $3,043 $6 9.3 Circ. Water System Auxiliaries $194 $0 $27 $0 $221 $22 $0 $36 $280 $1 9.4 Circ. Water Piping $0 $8,587 $2,080 $0 $10,667 $1,067 $0 $2,347 $14,081 $29 9.5 Make-up Water System $499 $0 $686 $0 $1,185 $118 $0 $261 $1,564 $3 9.6 Component Cooling Water Sys $982 $1,174 $806 $0 $2,962 $296 $0 $652 $3,910 $8 9.9 Circ. Water System Foundations $0 $2,811 $4,995 $0 $7,806 $781 $0 $2,576 $11,162 $23
Subtotal $8,550 $12,572 $10,164 $0 $31,286 $3,129 $0 $7,265 $41,680 $84 10 Ash & Spent Sorbent Handling Systems
10.1 Slag Dewatering & Cooling $14,630 $8,067 $16,277 $0 $38,974 $3,897 $0 $4,287 $47,158 $96 10.2 Gasifier Ash Depressurization w/10.1 w/10.1 w/10.1 $0 $0 $0 $0 $0 $0 $0 10.3 Cleanup Ash Depressurization w/10.1 w/10.1 w/10.1 $0 $0 $0 $0 $0 $0 $0 10.6 Ash Storage Silos $710 $0 $767 $0 $1,476 $148 $0 $244 $1,868 $4 10.7 Ash Transport & Feed Equipment $977 $0 $228 $0 $1,205 $120 $0 $199 $1,524 $3 10.8 Misc. Ash Handling Equipment $1,470 $1,801 $534 $0 $3,805 $381 $0 $628 $4,814 $10 10.9 Ash/Spent Sorbent Foundation $0 $60 $78 $0 $138 $14 $0 $46 $197 $0
Subtotal $17,786 $9,928 $17,884 $0 $45,598 $4,560 $0 $5,403 $55,561 $113 11 Accessory Electric Plant
11.1 Generator Equipment $1,106 $0 $1,077 $0 $2,183 $218 $0 $240 $2,641 $5 11.2 Station Service Equipment $5,479 $0 $504 $0 $5,983 $598 $0 $658 $7,240 $15

Cost and Performance Baseline for Fossil Energy Plants Volume 1b: Revision 2b
244
Case: B5B-Q – GEE Quench IGCC w/ CO₂ Estimate Type: Conceptual Plant Size (MW,net): 494 Cost Base: Jun 2011
Item Description Equipment Material Labor Bare Erected Eng'g CM Contingencies Total Plant Cost No. Cost Cost Direct Indirect Cost H.O.& Fee Process Project $/1,000 $/kW
11.3 Switchgear & Motor Control $10,113 $0 $1,880 $0 $11,993 $1,199 $0 $1,979 $15,171 $31 11.4 Conduit & Cable Tray $0 $5,139 $15,840 $0 $20,978 $2,098 $0 $5,769 $28,845 $58 11.5 Wire & Cable $0 $9,907 $6,028 $0 $15,935 $1,594 $0 $4,382 $21,911 $44 11.6 Protective Equipment $0 $806 $2,995 $0 $3,801 $380 $0 $627 $4,808 $10 11.7 Standby Equipment $265 $0 $264 $0 $529 $53 $0 $87 $669 $1 11.8 Main Power Transformers $18,924 $0 $164 $0 $19,088 $1,909 $0 $3,149 $24,146 $49 11.9 Electrical Foundations $0 $172 $468 $0 $639 $64 $0 $211 $914 $2
Subtotal $35,887 $16,024 $29,218 $0 $81,130 $8,113 $0 $17,103 $106,346 $215 12 Instrumentation & Control
12.1 IGCC Control Equipment w/4.1 $0 w/4.1 $0 $0 $0 $0 $0 $0 $0 12.2 Combustion Turbine Control w/6.1 $0 w/6.1 $0 $0 $0 $0 $0 $0 $0 12.3 Steam Turbine Control w/8.1 $0 w/8.1 $0 $0 $0 $0 $0 $0 $0 12.4 Other Major Component Control $1,271 $0 $866 $0 $2,138 $214 $107 $369 $2,827 $6 12.5 Signal Processing Equipment w/12.7 $0 w/12.7 $0 $0 $0 $0 $0 $0 $0 12.6 Control Boards, Panels & Racks $292 $0 $191 $0 $483 $48 $24 $111 $667 $1 12.7 Computer & Accessories $6,782 $0 $222 $0 $7,004 $700 $350 $805 $8,860 $18 12.8 Instrument Wiring & Tubing $0 $2,611 $4,942 $0 $7,553 $755 $378 $2,171 $10,857 $22 12.9 Other I & C Equipment $4,534 $0 $2,246 $0 $6,780 $678 $339 $1,170 $8,966 $18
Subtotal $12,879 $2,611 $8,467 $0 $23,957 $2,396 $1,198 $4,626 $32,177 $65 13 Improvements to Site
13.1 Site Preparation $0 $119 $2,706 $0 $2,826 $283 $0 $932 $4,041 $8 13.2 Site Improvements $0 $2,117 $2,993 $0 $5,110 $511 $0 $1,686 $7,307 $15 13.3 Site Facilities $3,794 $0 $4,259 $0 $8,053 $805 $0 $2,657 $11,516 $23
Subtotal $3,794 $2,236 $9,958 $0 $15,988 $1,599 $0 $5,276 $22,864 $46 14 Buildings & Structures
14.1 Combustion Turbine Area $0 $317 $179 $0 $496 $50 $0 $109 $655 $1 14.2 Steam Turbine Building $0 $2,511 $3,575 $0 $6,086 $609 $0 $1,004 $7,698 $16 14.3 Administration Building $0 $1,033 $749 $0 $1,781 $178 $0 $294 $2,253 $5 14.4 Circulation Water Pumphouse $0 $194 $103 $0 $296 $30 $0 $49 $375 $1 14.5 Water Treatment Buildings $0 $746 $728 $0 $1,474 $147 $0 $243 $1,865 $4 14.6 Machine Shop $0 $529 $361 $0 $890 $89 $0 $147 $1,126 $2 14.7 Warehouse $0 $853 $551 $0 $1,404 $140 $0 $232 $1,776 $4 14.8 Other Buildings & Structures $0 $511 $398 $0 $909 $91 $0 $200 $1,200 $2 14.9 Waste Treating Building & Str. $0 $1,143 $2,182 $0 $3,325 $332 $0 $731 $4,389 $9
Subtotal $0 $7,836 $8,825 $0 $16,661 $1,666 $0 $3,009 $21,337 $43 Total $898,821 $84,762 $274,464 $0 $1,258,047 $125,805 $66,737 $230,797 $1,681,386 $3,405

Cost and Performance Baseline for Fossil Energy Plants Volume 1b: Revision 2b
245
Exhibit 3-121 Case B5B-Q owner’s costs
Description $/1,000 $/kW Pre-Production Costs
6 Months All Labor $14,334 $29 1 Month Maintenance Materials $3,191 $6 1 Month Non-fuel Consumables $700 $1
1 Month Waste Disposal $494 $1 25% of 1 Months Fuel Cost at 100% CF $3,046 $6
2% of TPC $33,628 $68 Total $55,393 $112
Inventory Capital 60-day supply of fuel and consumables at 100% CF $25,317 $51
0.5% of TPC (spare parts) $8,407 $17 Total $33,724 $68
Other Costs Initial Cost for Catalyst and Chemicals $16,691 $34
Land $900 $2 Other Owner's Costs $252,208 $511
Financing Costs $45,397 $92 Total Overnight Costs (TOC) $2,085,698 $4,224
TASC Multiplier (IOU, high-risk, 35 year) 1.140 Total As-Spent Cost (TASC) $2,377,696 $4,815

Cost and Performance Baseline for Fossil Energy Plants Volume 1b: Revision 2b
246
Exhibit 3-122 Case B5B-Q initial and annual operating and maintenance costs Case: B5B-Q – GEE Quench IGCC w/ CO₂ Cost Base: Jun 2011
Plant Size (MW,net): 494 Heat Rate-net (Btu/kWh): 11,505 Capacity Factor (%): 80 Operating & Maintenance Labor
Operating Labor Operating Labor Requirements per Shift Operating Labor Rate (base): 39.70 $/hour Skilled Operator: 2.0
Operating Labor Burden: 30.00 % of base Operator: 10.0 Labor O-H Charge Rate: 25.00 % of labor Foreman: 1.0
Lab Tech's, etc.: 3.0 Total: 16.0
Fixed Operating Costs Annual Cost ($) ($/kW-net)
Annual Operating Labor: $7,233,658 $14.649 Maintenance Labor: $15,699,956 $31.795
Administrative & Support Labor: $5,733,403 $11.611 Property Taxes and Insurance: $33,627,713 $68.101
Total: $62,294,730 $126.156 Variable Operating Costs
($) ($/MWh-net) Maintenance Material: $30,633,669 $8.85243
Consumables Consumption Cost ($) Initial Fill Per Day Per Unit Initial Fill
Water (/1000 gallons): 0 4,419 $1.67 $0 $2,159,895 $0.62416 Makeup and Waste Water
Treatment Chemicals (lbs): 0 26,325 $0.27 $0 $2,058,884 $0.59497
Carbon (Mercury Removal) (lb): 135,505 232 $5.50 $745,276 $372,638 $0.10768 Shift Catalyst (ft3): 6,443 4.41 $771.99 $4,973,767 $994,753 $0.28746
Selexol Solution (gal): 298,221 95 $36.79 $10,971,928 $1,019,146 $0.29451 Claus Catalyst (ft3): w/equip 2.01 $203.15 $0 $119,480 $0.03453
Subtotal: $16,690,971 $6,724,798 $1.94331 Waste Disposal
Spent Mercury Catalyst (lb.): 0 232 $0.65 $0 $44,045 $0.01273 Flyash (ton): 0 0 $0.00 $0 $0 $0.00000
Slag (ton): 0 641 $25.11 $0 $4,701,028 $1.35849 Subtotal: $0 $4,745,073 $1.37122
By-Products Sulfur (tons): 0 146 $0.00 $0 $0 $0.00000
Subtotal: $0 $0 $0.00000 Variable Operating Costs Total: $16,690,971 $42,103,540 $12.16696
Fuel Cost Illinois Number 6 (ton): 0 5,844 $68.54 $0 $116,954,695 $33.79724
Total: $0 $116,954,695 $33.79724
Exhibit 3-123 Case B5B-Q COE breakdown
Component Value, $/MWh Percentage Capital 74.7 54%
Fixed 18.0 13% Variable 12.2 9%
Fuel 33.8 24% Total (Excluding T&S) 138.7 N/A
CO2 T&S 10.2 7% Total (Including T&S) 148.9 N/A

Cost and Performance Baseline for Fossil Energy Plants Volume 1b: Revision 2b
247
3.5 IGCC Case Summary The performance results of the seven IGCC plant configurations modeled in this report are summarized in Exhibit 3-124.
Exhibit 3-124 Estimated performance and cost results for all cases Integrated Gasification Combined CycleA
Shell E-GasTM FSQ GEE R+Q Case B1A B1B B4A B4B B5A B5B B5B-Q
PERFORMANCE Nominal CO₂ Capture 0% 90% 0% 90% 0% 90% 90% Capacity Factor 80% 80% 80% 80% 80% 80% 80% Gross Power Output (MWe) 737 673 738 704 748 734 684 Auxiliary Power Requirement (MWe) 108 177 113 190 126 191 190 Net Power Output (MWe) 629 497 625 513 622 543 494 Coal Flow rate (lb/hr) 436,646 465,264 459,956 484,212 466,898 487,005 486,978 Natural Gas Flow rate (lb/hr) N/A N/A N/A N/A N/A N/A N/A HHV Thermal Input (kWt) 1,492,878 1,590,722 1,572,575 1,655,503 1,596,309 1,665,056 1,664,962 Net Plant HHV Efficiency (%) 42.1% 31.2% 39.7% 31.0% 39.0% 32.6% 29.7% Net Plant HHV Heat Rate (Btu/kWh) 8,100 10,927 8,585 11,002 8,758 10,459 11,505 Raw Water Withdrawal, gpm 4,150 5,652 4,382 5,757 4,755 5,834 6,137 Process Water Discharge, gpm 788 1,021 905 1,095 984 1,080 1,129 Raw Water Consumption, gpm 3,362 4,631 3,477 4,662 3,771 4,754 5,008 CO2 Capture Rate (%) 0 90 0 90 0 90 90 CO₂ Emissions (lb/MMBtu) 197 20 199 20 197 20 20 CO₂ Emissions (lb/MWh-gross) 1,361 161 1,448 158 1,434 152 165 CO₂ Emissions (lb/MWh-net) 1,595 218 1,711 217 1,724 206 228 SO₂ Emissions (lb/MMBtu) 0.004 0.002 0.012 0.002 0.001 0.002 0.002 SO₂ Emissions (lb/MWh-gross) 0.029 0.017 0.085 0.017 0.009 0.017 0.018 NOx Emissions (lb/MMBtu) 0.059 0.049 0.060 0.049 0.059 0.049 0.049 NOx Emissions (lb/MWh-gross) 0.409 0.396 0.434 0.396 0.430 0.376 0.404 PM Emissions (lb/MMBtu) 0.007 0.007 0.007 0.007 0.007 0.007 0.007 PM Emissions (lb/MWh-gross) 0.049 0.057 0.052 0.057 0.052 0.055 0.059 Hg Emissions (lb/TBtu) 0.434 0.372 0.413 0.374 0.412 0.388 0.361 Hg Emissions (lb/MWh-gross) 3.00E-06 3.00E-06 3.00E-06 3.00E-06 3.00E-06 3.00E-06 3.00E-06
COST Total Plant Cost (2011$/kW) 2,725 3,981 2,372 3,540 2,449 3,387 3,405 Bare Erected Cost 2,067 2,963 1,809 2,638 1,870 2,525 2,548 Home Office Expenses 207 296 181 264 187 253 255 Project Contingency 376 562 322 492 330 467 467 Process Contingency 75 160 61 147 61 143 135 Total Overnight Cost (2011$M) 2,107 2,442 1,830 2,252 1,888 2,279 2,086 Total Overnight Cost (2011$/kW) 3,351 4,917 2,929 4,386 3,036 4,195 4,224 Owner's Costs 626 936 557 846 587 807 819 Total As-Spent Cost (2011$/kW) 3,820 5,605 3,339 5,000 3,461 4,782 4,815 COE ($/MWh) (excluding T&S) 107.0 152.6 99.8 141.9 102.6 135.4 138.7 Capital Costs 59.3 87.0 51.8 77.6 53.7 74.2 74.7 Fixed Costs 14.7 20.5 13.5 19.1 13.7 18.2 18.0 Variable Costs 9.3 13.0 9.2 12.8 9.4 12.2 12.2 Fuel Costs 23.8 32.1 25.2 32.3 25.7 30.7 33.8 COE ($/MWh) (including T&S) 107.0 162.4 99.8 151.8 102.6 144.7 148.9 CO₂ T&S Costs 0.0 9.8 0.0 9.9 0.0 9.2 10.2 CO2 Captured Cost (excluding T&S), $/tonneB N/A 78.9 N/A 66.5 N/A 63.2 61.0 CO2 Avoided Cost (including T&S), $/tonneB N/A 118.7 N/A 102.9 N/A 91.7 99.3
AAll cases use high-risk financial assumptions consistent with NETL’s “QGESS: Cost Estimation Methodology for NETL Assessments of Power Plant Performance.” (2) BBoth the costs of CO2 captured and avoided were calculated based on the non-capture supercritical pulverized coal (Case B12A) data provided in the “Cost and Performance Baseline for Fossil Energy Plants, Volume 1a: Bituminous Coal (PC) and Natural Gas to Electricity, Revision 3” report. (3) Case B12A has a COE of $82.3/MWh, a CO2 emission rate of 1,618 lb/MWh-gross, a gross plant output of 579,700 kW, and a net plant output of 550,012 kW.

Cost and Performance Baseline for Fossil Energy Plants Volume 1b: Revision 2b
248
The following observations can be made regarding plant performance:
• In the non-carbon capture cases the dry fed Shell gasifier has the highest net plant efficiency (42.1 percent), followed by the two-stage E-GasTM slurry fed gasifier (39.7 percent) and the single-stage slurry fed GEE gasifier (39.0 percent). The absolute values of the GEE and E-GasTM gasifiers are close to the reported values per the vendors. (16), (51) The Shell efficiency is slightly lower than reported by the vendor in other presentations. (48)
• The energy penalty associated with adding CO2 capture is due to steam extraction for use in the SGS reaction, the auxiliary load for the CO2 separation and compression equipment, and a slight derate of the gas turbine due to the higher moisture content of the flue gas. The reduction in net plant efficiency ranges from 6 to 11 percentage points with the variability being due to the optimum gasifier designs (e.g., slurry vs. dry feed, syngas quench vs. syngas heat recovery) which may vary between the capture and non-capture plant configurations.
• The lowest energy penalty (6 percentage points) corresponds to the GEE Radiant gasifier cases primarily due to the non-capture plant design (slurry feed, water quench) which results in a high moisture content in the syngas and thus a low addition of shift steam for SGS for the capture plant design.
• The highest energy penalty (11 percentage points) corresponds to the Shell gasifier cases. The design uses a dry feed system and, in the non-capture configuration, has relatively high heat recovery in the syngas cooler with no water quench, resulting in very low moisture content in the syngas. For the capture configuration, a water quench is added which increases the moisture content of the syngas for the SGS reaction but decreases the heat recovery in the syngas cooler.
• CB&I E-GasTM has the highest SO2 emissions (0.085 lb/MWh-gross) of the seven cases because refrigerated MDEA has the lowest H2S removal efficiency of the AGR technologies.
The components of TOC and the overall TASC of the seven cases are shown in Exhibit 3-125.

Cost and Performance Baseline for Fossil Energy Plants Volume 1b: Revision 2b
249
Exhibit 3-125 Plant capital cost for all cases
Source: NETL
The following TOC observations are made with the caveat that the differences between cases are less than the estimate accuracy (-15 percent/+30 percent). However, all cases are evaluated using a common set of technical and economic assumptions allowing meaningful comparisons among the cases:
• E-GasTM has the lowest TOC cost among the non-capture cases. The E-GasTM technology has several features that lend it to being lower cost, such as:
o The firetube syngas cooler is much smaller and less expensive than a radiant section. E-GasTM can use a firetube boiler because the two-stage design reduces the gas temperature (slurry quench) into a range where a radiant cooler is not needed.
o The firetube syngas cooler sits next to the gasifier instead of above or below it, which reduces the height of the main gasifier structure. The E-GasTM proprietary slag removal system – used instead of lock hoppers below the gasifier – also contributes to the lower structure height.
• The normalized TOC of the GEE Radiant gasifier case is approximately 4 percent greater than E-GasTM, and Shell is approximately 14 percent higher.

Cost and Performance Baseline for Fossil Energy Plants Volume 1b: Revision 2b
250
• The GEE radiant gasifier (GEE quench is less than 1 percent greater than GEE radiant) is the low-cost technology in the CO2 capture cases with E-GasTM normalized TOC approximately 5 percent higher and Shell approximately 17 percent higher.
• The ASU cost represents, on average, 12 percent of the TOC (range from 10-13 percent). The ASU cost includes oxygen and nitrogen compression, and in the non-capture cases, it also includes the cost of the CT extraction air heat exchanger. With nitrogen dilution used to the maximum extent possible, nitrogen compression costs are significant.
• The normalized TOC premium for adding CO2 capture averages 43 percent ($4,430/kW versus $3,105/kW).
The COE is shown for all seven cases in Exhibit 3-126.
Exhibit 3-126 COE for all cases
Source: NETL
The following observations can be made:
• The COE is dominated by capital costs, and is at least 50 percent of the total in all cases. • In the non-capture cases the E-GasTM gasifier has the lowest COE, but the differential
with Shell is reduced (relative to the normalized TOC comparison) primarily because of the higher efficiency of the Shell gasifier. The Shell COE is 7 percent higher than E-GasTM (compared to 14 percent higher normalized TOC). The GEE gasifier COE is about 3 percent higher than E-GasTM.
• In the capture cases the variation in COE is small; however, the order of the GEE and E-GasTM gasifiers is reversed. The range is from $144.7/MWh for GEE Radiant to $162.4/MWh for Shell with GEE Quench and E-GasTM intermediate at $148.9/MWh and

Cost and Performance Baseline for Fossil Energy Plants Volume 1b: Revision 2b
251
$151.8/MWh, respectively. The COE CO2 capture premium averages 47 percent (range of 41 to 52 percent).
• The CO2 T&S COE component composes less than 7 percent of the total COE in all capture cases.
As presented in Section 2.6.4, the CO2 captured and avoided costs were calculated, and the results for the CO2 capture cases are shown in Exhibit 3-127. The cost of captured CO2 represents the minimum CO2 plant gate sales price that will incentivize carbon capture in lieu of a defined reference non-capture plant. The cost of CO2 avoided represents the minimum CO2 emissions price, when applied to both the capture and non-capture plant that will incentivize carbon capture in lieu of a defined reference non-capture plant. Both the costs of CO2 captured and avoided were calculated based on the non-capture supercritical pulverized coal (Case B12A) data provided in the “Cost and Performance Baseline for Fossil Energy Plants, Volume 1a: Bituminous Coal (PC) and Natural Gas to Electricity, Revision 3” report. (3) This case is representative of the lowest cost non-capture coal plant option. Case B12A has a COE of $82.3/MWh, a CO2 emission rate of 1,618 lb/MWh-gross, a gross plant output of 579,700 kW, and a net plant output of 550,012 kW.
Exhibit 3-127 Cost of CO2 captured and avoided in all cases
Source: NETL
The cost of CO2 captured using SC PC as the non-capture reference case averages $67/tonne ($61/ton) with a range of $61-$79/tonne ($55-$72/ton). The cost of CO2 avoided averages $103/tonne ($94/ton) with a range of $92-$119/tonne ($83-$108/ton).

Cost and Performance Baseline for Fossil Energy Plants Volume 1b: Revision 2b
252
The normalized water withdrawal, process discharge, and water consumption are presented in Exhibit 3-128.
Exhibit 3-128 Raw water withdrawal and consumption in all cases
Source: NETL
The following observations can be made:
• Raw water consumption for all cases is dominated by cooling tower makeup requirements, which account for 79-87 percent of raw water consumption in non-capture cases and 73-75 percent in CO2 capture cases.
• Normalized water consumption for the GEE non-capture case is 9 percent higher than the E-GasTM non-capture case and 13 percent higher than the Shell non-capture case primarily because of the large quench water requirement.
• While both the normalized raw water consumption and withdrawal rates are 9 percent greater in the GEE Radiant non-capture case than in the E-GasTM case, the normalized raw water withdrawal and consumption rates are 6 percent and 4 percent greater, respectively, in the E-GasTM non-capture case than the Shell case. The discrepancy between withdrawal and consumption is because very little water is available to recover for internal recycle in the dry-fed Shell system
• The normalized raw water consumption for the four CO2 capture cases varies by 9 percent from the highest to the lowest. The variation between cases is small because each technology requires approximately the same amount of water in the syngas prior to the shift reactors. The difference in technologies is where and how the water is introduced. Much of the water is introduced in the quench sections of the GEE and Shell cases while steam is added in the E-GasTM case.

Cost and Performance Baseline for Fossil Energy Plants Volume 1b: Revision 2b
253
3.5.1 Sensitivities The effect of CF and coal price on COE is shown in Exhibit 3-129 and Exhibit 3-130, respectively. The assumption implicit in Exhibit 3-129 is that each gasifier technology can achieve a CF of up to 95 percent with no additional capital equipment cost.
Exhibit 3-129 Capacity factor sensitivity of all cases
Source: NETL
The cost differential between technologies decreases as CF increases. At low CF the capital cost differential is more magnified and the spread between technologies increases slightly.

Cost and Performance Baseline for Fossil Energy Plants Volume 1b: Revision 2b
254
Exhibit 3-130 Sensitivity of COE to coal price for all cases
Source: NETL
COE is relatively insensitive to fuel costs; a tripling of coal price from $1-$3/MMBtu results in an average COE increase of about 17-20 percent for all cases.
In the event that future legislation assigns a cost to carbon emissions, all of the technologies examined in this report will become more expensive. The technologies without carbon capture will be impacted to a larger extent than those with carbon capture.
The curves in Exhibit 3-131 represent the study design conditions (capacity factor) and fuel price used; namely an 80 percent capacity factor and $2.78/GJ ($2.94/MMBtu) for coal.

Cost and Performance Baseline for Fossil Energy Plants Volume 1b: Revision 2b
255
Exhibit 3-131 Impact of carbon emissions price on study technologies
Source: NETL
The following conclusions can be drawn from the carbon emissions price graph:
• The impact of an increasing CO2 emission price has a significantly greater impact on the COE of the non-capture plants than the CO2 capture plants.
• At $60/tonne, the COEs of both the Shell and GEE Radiant cases without CO2 capture are nearly equal to the COE of the GEE Radiant case with CO2 capture.
Sale of the captured CO2 for utilization and storage in CO2 EOR has the potential to provide a revenue stream to the IGCC capture plant configurations. The plant gate CO2 sales price will ultimately depend on a number of factors including plant location and crude oil prices. The cost of CO2 captured represents the minimum CO2 plant gate sales price that will incentivize carbon capture in lieu of a defined reference non-capture plant.
The curves in Exhibit 3-132 represent the study design conditions (capacity factor) and fuel price used; namely an 80 percent capacity factor and $2.78/GJ ($2.94/MMBtu) for coal.

Cost and Performance Baseline for Fossil Energy Plants Volume 1b: Revision 2b
256
Exhibit 3-132 Impact of carbon sales price on study technologies
Source: NETL
The following conclusions can be drawn from the carbon sales price graph:
• At $51.1/tonne, the COEs of the Shell CO2 capture and non-capture cases are equal. • At $47.0/tonne, the COEs of the E-GasTM CO2 capture and non-capture cases are
equal. • At $39.1/tonne, the COEs of both the GEE Radiant and GEE Quench CO2 capture
cases are equal to the GEE Radiant only non-capture case.

Cost and Performance Baseline for Fossil Energy Plants Volume 1b: Revision 2b
257
4 Revision Control The initial issue of this report was published in May 2007, and an updated revision was published in November 2010. Subsequent to the reissue date, updates have been made to various report sections. These modifications were made for clarification and aesthetic purposes as well as to bring all costs to 2011 year dollar basis.
Exhibit 4-1 contains information that was added, changed, or deleted in successive revisions.
Exhibit 4-1 Record of revisions
Revision Number
Revision Date Description of Change Comments
1 8/23/07
Added disclaimer to Executive Summary and Introduction
Disclaimer involves clarification on extent of participation of technology vendors.
Removed reference to cases 7 and 8 in Exhibits ES-1 and 1-1 since they no longer exist.
SNG cases moved to Volume 2 of this report as explained in the Executive Summary and Section 1.
Added Section 2.8 Explains differences in IGCC TPC estimates in this report versus costs reported by other sources.
Added Exhibit ES-14 Mercury emissions are now shown in a separate exhibit from SO2, NOx, and PM because of the different y-axis scale.
Corrected PC and NGCC CO2 capture case water balances
The capture process cooling water requirement for the PC and NGCC CO2 capture cases was overstated and has been revised.
Replaced Exhibits ES-4, 3-121, 4-52, and 5-30
The old water usage figures were in gpm (absolute) and in the new figures the water numbers are normalized by net plant output.
Updated Selexol process description
Text was added to Section 3.1.5 to describe how H2 slip was handled in the models.
Revised PC and NGCC CO2 capture case energy balances (Exhibits 4-21, 4-42 and 5-21)
The earlier version of the energy balances improperly accounted for the capture process heat losses. The heat removed from the capture process is rejected to the cooling tower.
Corrected Exhibit 4-13 and Exhibit 4-27.
Sensible heat for combustion air in the two NGCC cases was for only one of the two combustion turbines – corrected to account for both turbines
2 10/27/10
Updated circulating water flow rate values in Section 3.1.8.
Revision 1 changes to capture system cooling water flow rate were not made in the text in Section 3.1.8 (Circulating Water System).
Added Supplemental Chapter 6 “Effect of Higher Natural Gas Prices and Dispatch-Based Capacity Factors”
N/A
Added Supplemental Chapter 7 “Dry and Parallel Cooling”
N/A

Cost and Performance Baseline for Fossil Energy Plants Volume 1b: Revision 2b
258
Revision Number
Revision Date Description of Change Comments
Added Supplemental Chapter 8 “GEE IGCC in Quench-Only Configuration with CO2 Capture”
N/A
Added Supplemental Chapter 9 “Sensitivity to MEA System Performance and Cost Bituminous Baseline Case B12BA”
N/A
Updated Aspen models
Major Aspen model updates included: • Converting FORTRAN code-based steam
cycles to Aspen blocks • Using the Peng-Robinson property method in
the Aspen gasifier section • Modifying the AGR used in the IGCC cases
to more closely represent commercially available technology
• Increasing the capture efficiency of the E-GasTM plant with capture to achieve 90 percent
• Correcting a steam condition error in the supercritical PC cases with capture
Updated case performance results
Major updates included: • Revising the water balances to include
withdrawal and consumption • CAD-based HMB diagrams were replaced
with Visio versions
Completed updating case economic results
Major updates included: • Adding owner’s costs to the total plant costs
to generate total overnight cost • Updating fuel costs • Revising the T&S methodology to include the
July, 2007 Handy-Whitman Index, pore space acquisition costs, and liability costs
• Re-costing of cases based on the updated performance results
• Switching to COE as the primary cost metric (as opposed to levelized COE)
Updated report tables, figures, and text to reflect the revision 2 changes
N/A
2a 9/19/2013
Section 2.7.1 was revised to clarify the text that explains the level of technology maturity reflected in the plant level cost estimates.
N/A

Cost and Performance Baseline for Fossil Energy Plants Volume 1b: Revision 2b
259
Revision Number
Revision Date Description of Change Comments
2b 7/13/2015
Volume 1 has been split into two sub volumes.
Major updates included: • IGCC cases are reported in Volume 1b with a
cost-only update (issued as an update to revision 2a)
• PC and NGCC cases are reported in Volume 1a with a cost and performance update (issued as revision 3)
• Executive summary significantly revised and shortened
• Results analysis section added Separated Supplemental Chapter 6 “Effect of Higher Natural Gas Prices and Dispatch-Based Capacity Factors” into a stand-alone report.
N/A
Separated Supplemental Chapter 7 “Impact of Dry and Parallel Cooling Systems on Cost and Performance of Fossil Fuel Power Plants” into a stand-alone report.
N/A
Incorporated the Supplemental Chapter 8 “GEE IGCC in Quench-Only Configuration with CO2 Capture” into the body of the report.
The supplemental chapter was broken down and the information regarding the case describe within it is presented similar to cases B5A and B5B in Section 3.4.12.
Removed Supplemental Chapter 9 “Sensitivity to MEA System Performance and Cost Bituminous Baseline Case 12A”
N/A
Updated the environmental targets to current limits published by the EPA and presented in Section 2.3
MATS and NSPS regulate SO2, NOx, Filterable PM, Hg, and HCl on a lb/MWh-gross basis.
Updated Section 2.4 covering Capacity Factors
Additional information has been included that supports the assumptions made regarding the capacity factors used for each technology type.
Removed portions of Section 2.6 concerning cost estimating methodology
Many QGESS documents have been published that detail information generic to a number of studies published by NETL. In an effort to reduce the size of this report, text provided in these QGESS documents has been removed and references have been inserted that provide the QGESS document title and revision notation.
Added cost of CO2 Captured methodology and results.
The Cost of CO2 avoided methodology has been moved from the executive summary and combined with the Cost of CO2 Captured methodology in Section 2.6.4.
Removed Section 2.7 N/A

Cost and Performance Baseline for Fossil Energy Plants Volume 1b: Revision 2b
260
Revision Number
Revision Date Description of Change Comments
Updated Section 3.1.4 to reflect the use of a dual carbon bed.
N/A
Updated Section 3.1.5
Superfluous information has been removed and the remaining information has been re-organized, especially concerning AGR/Gasifier pairings used in non-capture cases
Improved the BFD depiction of the HRSGs N/A
Updated all cases to a new case naming convention. Ex. Revision 2’s Case 1 is now Case B5A
Updated performance tables
Major updates include: • Table is split into two sections
o Performance summary o Plant power and auxiliary load
breakdown o O2:Coal ratio o Cold gas efficiency o Combustion turbine efficiency o Steam turbine efficiency and heat
rate o LHV basis efficiency and heat rate
Updated case performance results
Major updates included: • Added particle concentration to emissions
results • Updated Energy Balance tables by adding
Motor Losses and Design Allowances, Non-Condenser cooling tower loads, and ambient losses
Completed updating case economic results
Major updates included: • Updated to 2011 year dollars • Revised the engineering and construction
management costs • Added NG supply line • Updated the T&S costing methodology • Updated fuel prices
Updated report tables, figures, and text to reflect the Revision 2b changes
N/A

Cost and Performance Baseline for Fossil Energy Plants Volume 1b: Revision 2b
261
5 References 1. National Energy Technology Laboratory. Quality Guidelines for Energy Systems Studies: Fuel Prices for Selected Feedstocks in NETL Studies. Office of Program Planning and Analysis. Pittsburgh, Pa : U. S. Department of Energy, 2012. DOE/NETL-3041/11212.
2. —. Quality Guidelines for Energy System Studies: Cost Estimation Methodology for NETL Assessments of Power Plant Performance. Pittsburgh : Department of Energy, 2011.
3. —. Cost and Performance Baseline for Fossil Energy Plants Volume 1a: Bituminous Coal (PC) and Natural Gas to Electricity Revision 3. Pittsburgh : Department of Energy, 2015. 1723.
4. AACE International. Conducting Technical and Economic Evaluations – As Applied for the Process and Utility Industries; TCM Framework: 3.2 – Asset Planning, 3.3 Investment Decision Making. s.l. : AACE International, 2003. Recommended Practice 16R-90.
5. —. Cost Estimate Classification System – As Applied in Engineering, Procurement, and Construction for the Process Industries; TCM Framework 7.3 – Cost Estimating and Budgeting. s.l. : AACE International, 2005. Recommended Practice No. 18R-97.
6. National Energy Technology Laboratory. QGESS: Cost Estimation Methodology for NETL Assessments of Power Plant Performance. Pittsburgh, Pa : U.S. Department of Energy, April 2011. DOE/NETL-2011/145.
7. —. Quality Guidelines for Energy System Studies: Detailed Coal Specifications. Office of Program Planning and Analysis. Pittsburgh, Pa : U. S. Department of Energy, 2013. DOE/NETL-401/012111.
8. —. Quality Guidelines for Energy System Studies Specification for Selected Feedstocks. Office of Program Planning and Analysis. Pittsburgh, Pa : U. S. Department of Energy, 2013. DOE/NETL-341/011812.
9. Mining Media. 2004 Keystone Coal Industry Manual. Prairieville, LA : Mining Media publications, 2004.
10. National Energy Technology Laboratory. Major Environmental Aspects of Gasification-Based Power Generation Technologies. Pittsburgh : Department of Energy, 2002.
11. U.S. Environmental Protection Agency. Regulatory Actions: Final Mercury and Air Toxics Standards (MATS) Reconsideration. EPA.gov. [Online] 2012. [Cited: February 6, 2012.] http://www.epa.gov/mats/actions.html. 2012.
12. —. Fact Sheet: Mercury and Air Toxics Standards for Power Plants. EPA.gov. [Online] 2012. [Cited: February 6, 2012.] http://www.epa.gov/mats/pdfs/20111221MATSsummaryfs.pdf.
13. —. National Emission Standards for HAPs from Coal and Oil-Fired EGUs and Standards of Performance for Fossil-Fuel-Fired Electric Utility, Industrial-Commercial-Institutional, and Small Industrial-Commercial-Institutional Steam Generating. GPO.gov. [Online] 2012. [Cited: February 16, 2012.] http://www.gpo.gov/fdsys/pkg/FR-2012-02-16/pdf/2012-806.pdf.
14. —. Map of Counties Designated "Nonattainment" for Clean Air Act's National Ambient Air Quality Standards (NAAQS). Image. Washington DC : s.n., 2013.

Cost and Performance Baseline for Fossil Energy Plants Volume 1b: Revision 2b
262
15. —. Electronic Code of Federal Regulations. U.S. Government Printing Office. [Online] 2013. [Cited: February 6, 2013.] http://www.ecfr.gov/cgi-bin/text-idx?c=ecfr&tpl=/ecfrbrowse/Title40/40cfr63_main_02.tpl. 40 CFR63, Subpart UUUUU.
16. Thomas, G. Delivering the IGCC Solution. s.l. : GE Energy, January 2006.
17. Morehead, H. and F. Hannemann. Siemens Technology Improvements Enhance IGCC Plant Economics. San Francisco, CA : Gasification Technologies, October 2005.
18. Denton, David. Telephone communication. s.l. : Eastman Chemical Co.
19. Phillips, J. IGCC 101. Gasification Technologies Regulators' Workshop. Tampa, FL : s.n., 2011.
20. Higman, Christopher, DellaVilla, Sal, and Steele, Bob. The Reliability of Integrated Gasification Combined Cycle (IGCC) Power Generation Units. Achema 2006. May 2006.
21. Amick, Phil. ConocoPhillips Presentation at Gasification Technology Council Workshop for Environmental and Economic Regulators. Gasification Technologies Regulators' Workshop. June 2010.
22. Electric Power Research Institute. Evaluation of Alternative IGCC Plant Designs for High Availability and Near Zero Emissions: RAM Analysis and Impact of SCR. Palo Alto, CA : s.n., December 2005. 1010461.
23. —. Integrated Gasification Combined Cycle (IGCC) Design Considerations for High Availability, Volume 1: lessons from Existing Operations. Palo Alto, CA : s.n., 2005. 1012226.
24. —. Integrated Gasification Combined Cycle (IGCC) Design Considerations for High Availability, Volume 2: RAM Modeling of Standard Designs. Palo Alto, CA : s.n., 2007. 1014871.
25. —. Gasification Technology Status. December 2012. 1023864.
26. The Marley Cooling Tower Company. Cooling Tower Fundamentals. [ed.] John C. Hensley. Mission, Kansas : s.n., 1985. Vol. 2nd Edition.
27. Chemical Engineering. Chemical Engineering Plant Cost Index. [ed.] Access Intelligence LLC. Chemical Engineering. 2013.
28. Federal Reserve Bank of St. Louis. Gross Domestic Product: Chain-type Price Index (GDPCTPI). FRED Economic Data. [Online] 2013. [Cited: November 20, 2013.] http://research.stlouisfed.org/fred2/series/GDPCTPI. BEA Account Code: B191RG3.
29. National Energy Technology Laboratory. Quality Guidelines for Energy System Studies: Carbon Dioxide Transport and Storage Costs in NETL Studies. Pittsurgh, PA : Department of Energy, 2014. DOE/NETL-2013/1614.
30. Universal Industrial Gases. Overview of Cryogenic Air Separation. [Online] n. d. [Cited: August 29, 2013.] http://www.uigi.com/cryodist.html.
31. Geosits, Robert F. and Schmoe, Lee A. IGCC – The Challenges of Integration, Proceedings of GT2005 ASME Turbo Expo 2005: Power for Land, Sea, and Air,. Reno, NV : s.n., June 2005.

Cost and Performance Baseline for Fossil Energy Plants Volume 1b: Revision 2b
263
32. Jaeger, Harry. Plant Design Net Rated 644 MW and 38% HHV on Low Rank Coal. Gas Turbine World. March-April 2006.
33. Jenkins, S. Real-World Experience with IGCC – Lessons Learned in Design, Permitting, Operations and Maintenance. s.l. : URS Corporation, 2005.
34. Drnevich, Ray. Personal communication. [email protected]. s.l. : Praxair, Inc., November 2002.
35. http://www.calgoncarbon.com/bulletins/Mercury_Removal_Gas_Streams.htmn. [Online]
36. http://www.calgoncarbon.com/bulletins/HGR-P.htm. [Online]
37. http://www.calgoncarbon.com/bulletins/TYPE_HGR.htm. [Online]
38. Electric Power Research Institute. Process Screening Study of Alternative Gas Treating and Sulfur Removal Systems for IGCC Power Plant Applications. December 1987. EPRI AP-5505.
39. CB&I. E-Gas™ technology. CB&I. [Online] 2013. [Cited: November 23, 2013.] http://www.cbi.com/technologies/gasification-technology.
40. National Energy Technology Laboratory. Process Screening Analysis of Alternative Gas Treating and Sulfur Removal for Gasification, Revised Final Report. Pittsburgh, Pa : U.S. Department of Energy, December 2002.
41. Beychok, Milton. Wikimedia Commons. [Online] 2014. [Cited: June 11, 2014.] http://en.wikipedia.org/wiki/Claus_process#mediaviewer/File:Claus_Sulfur_Recovery.png.
42. GE Power Systems. The 7FB: The Next Evolution of the F Gas Turbine. [Online] 2014. [Cited: November 12, 2014.] http://site.ge-energy.com/prod_serv/products/tech_docs/en/downloads/ger4194.pdf. GER-4194.
43. Brdar, R. D. and R.M. Jones. GE IGCC Technology and Experience with Advanced Gas Turbines. Schenectady, NY, : GE Power Systems, 10/2000. GER-4207.
44. GE Power Systems. Specification for Fuel Gases for Combustion in Heavy-Duty Turbines. January 2002. GEI-41040G.
45. —. Design Considerations for Heated Gas Fuel. March 2003. GEK-4189.
46. Electric Power Research Institute. Coal Gasification Guidebook: Status, Applications, and Technologies. s.l. : EPRI, December 1993. TR-102034.
47. Holthoon, E. Van. Shell Coal Gasification – Leading Technology Across Multiple Applications. s.l. : Gasification Technologies Conference, October 6, 2009.
48. Van Der Ploeg, H.J., T. Chhoa, and P.L. Zuideveld. The Shell Coal Gasification Process for the US Industry. Washington DC : Gasification Technology Conference, October 2004.
49. Breton, D. and C. Keeler. Comparative IGCC Performance and Costs for Domestic Coals. San Francisco, CA : Gasification Technologies Council, October 2005.
50. Rigdon, R. and L. Schmoe. The IGCC Reference Plant. San Francisco, CA : Gasification Technologies Conference 2005, October 2005.

Cost and Performance Baseline for Fossil Energy Plants Volume 1b: Revision 2b
264
51. Rigdon, R. and K. Miles. The Cleaner Coal Option. Power Engineering International. July 2006.
52. National Energy Technology Laboratory. Power Systems Financial Model Version 6.6 and User's Guide. Models/Tools . Pittsburgh, Pa : U. S. Department of Energy, 2012. DOE/NETL-2011/1492 .
53. —. Updated Costs (June 2011 Basis) for Selected Bituminous baseline Cases. Pittsburgh : Department of Energy, 2012. 341/082312.
54. U.S. Environmental Protection Agency. U.S. Government Printing Office. Electronic Code of Federal Regulations. [Online] 2014. [Cited: June 11, 2014.] http://www.ecfr.gov/cgi-bin/text-idx?tpl=/ecfrbrowse/Title40/40cfr60_main_02.tpl.

www.netl.doe.gov Pittsburgh, PA • Morgantown, WV • Albany, OR • Sugar Land, TX • Anchorage, AK
(800) 553-7681
Tim Fout [email protected]
Mark Woods [email protected]