OFFICE irif MAYOR - Productivity Commission
54
OFFICE 3; irif MAYOR
Transcript of OFFICE irif MAYOR - Productivity Commission
O F F I C E 3; irif MAYOR
Future Proofing the City of Gosnells Shaping a Financially Sustainable Future
April 2007
Liability limited by a scheme approved under Professional Standards Legislation

PricewaterhouseCoopers
TABLE OF CONTENTS Executive Summary 2
1 Introduction 6
2 Population Growth Scenarios to 2027 8
3 Financial Planning Implications of Growth 11
4 Operational Efficiency and Effectiveness 16
5 Infrastructure Development and Funding 19
6 Asset Maintenance and Renewal 29
7 Other Assets and Major Projects Potentially Requiring Future Capital Expenditure 35
8 Forward Looking Reforms 37
9 Recommendations 41
Appendix I Key Performance indicators 45
Appendix II Indicative Credit Rating Data 46
Appendix III Definition of Financial Sustainability Indicators 48
Disclaimer
This Report has been prepared by PricewaterhouseCoopers (PwC) at the request of the City of Gosnells (the “City) in our capacity as advisors in accordance with the Terms of Reference and the Terms and Conditions contained in the Consultant Agreement between the City and PwC.
The information, statements, statistics and commentary (together the “Information”) contained in this report have been prepared by PwC from publicly available material, from information provided by the City and from discussions held with stakeholders. The Consultants may in their absolute discretion, but without being under any obligation to do so, update, amend or supplement this document.
PwC has based this report on information received or obtained, on the basis that such information is accurate and, where it is represented by management as such, complete. The Information contained in this report has not been subject to an Audit. The information must not be copied, reproduced, distributed, or used, in whole or in part, for any purpose other than detailed in our Consultant Agreement without the written permission of the City and PwC.
Comments and queries can be directed to:
Scott Lennon Partner – Infrastructure Government & Utilities
PricewaterhouseCoopers 201 Sussex Street Sydney NSW 2000 Phone: (02) 8266 2765 Email: [email protected]

PricewaterhouseCoopers
Executive Summary
Background
The City of Gosnells (the City) commissioned PricewaterhouseCoopers (PwC) to complete a study of the long-term financial planning implications on infrastructure development, infrastructure renewal and the operational costs of different population growth rates.
The long-term financial viability of local governments has become a key issue both in Western Australia and nationally. Evaluating and comparing the financial sustainability and relative performance of local governments is a challenge because of the diversity of management techniques and differing abilities of individual local governments to raise revenue. These variations make accurate comparisons more difficult as they depend on the level of service each local government decides to offer in assets: for example, variances in road infrastructure service levels can significantly increase or decrease the perceived backlog in a renewal program. Despite these differences, PwC and the City believe improving financial planning and expanding benchmarking programs are worthwhile projects as they stimulate further internal and external discussion and analysis about how best to manage resources. Benchmarking encourages improvements in asset management, operational performance and financial management which promotes a greater understanding of the local government sector. The proposed introduction of a new national framework for local government financial planning and asset management is an important step in the benchmarking process. Study Objectives and Scope This study provides independent advice on the likely population growth, infrastructure funding requirements and subsequent long-term financial planning implications. The study also assesses the City’s financial efficiency using comparative benchmark data from 26 Perth metropolitan local governments and discusses further options for industry reform.
PwC has assessed how population growth will impact the City’s future financial sustainability as well as the financial requirements to develop infrastructure and the impact on the City’s operating costs. Financial Management Capabilities The study shows that the City has well regarded capabilities relative to other Western Australian metropolitan local councils. Effective financial management and improved technology efficiency has also been a focus, with the recent $1m plus upgrade of the City’s financial systems in 2005/06. Whilst the City has a comparatively sound financial position, it will need to carefully manage the challenges of long-term financial sustainability to deliver the optimal quality and value for ratepayers. Population Growth A key factor driving the City’s large capital expenditure program is the forecast in population growth of between 1.5% and 2.0%, which will create a need to access funding from State and Federal sources as well as to boost internally generated sources (e.g. rates, user charges and developer charges).
Executive Summary 2
PricewaterhouseCoopers
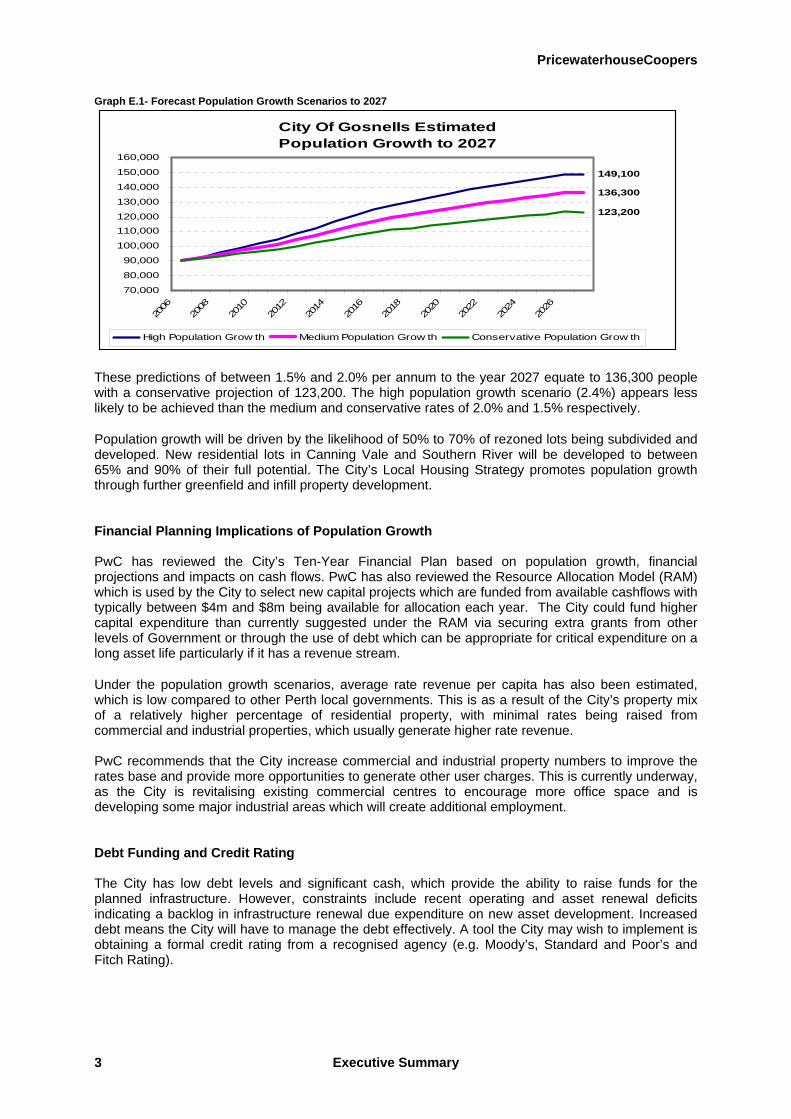
Graph E.1- Forecast Population Growth Scenarios to 2027
City Of Gosnells Estimated Population Growth to 2027
149,100
136,300
123,200
70,000
80,000
90,000
100,000
110,000120,000
130,000
140,000
150,000
160,000
2006
2008
2010
2012
2014
2016
2018
2020
2022
2024
2026
High Population Grow th Medium Population Grow th Conservative Population Grow th
These predictions of between 1.5% and 2.0% per annum to the year 2027 equate to 136,300 people with a conservative projection of 123,200. The high population growth scenario (2.4%) appears less likely to be achieved than the medium and conservative rates of 2.0% and 1.5% respectively.
Population growth will be driven by the likelihood of 50% to 70% of rezoned lots being subdivided and developed. New residential lots in Canning Vale and Southern River will be developed to between 65% and 90% of their full potential. The City’s Local Housing Strategy promotes population growth through further greenfield and infill property development. Financial Planning Implications of Population Growth PwC has reviewed the City’s Ten-Year Financial Plan based on population growth, financial projections and impacts on cash flows. PwC has also reviewed the Resource Allocation Model (RAM) which is used by the City to select new capital projects which are funded from available cashflows with typically between $4m and $8m being available for allocation each year. The City could fund higher capital expenditure than currently suggested under the RAM via securing extra grants from other levels of Government or through the use of debt which can be appropriate for critical expenditure on a long asset life particularly if it has a revenue stream.
Under the population growth scenarios, average rate revenue per capita has also been estimated, which is low compared to other Perth local governments. This is as a result of the City’s property mix of a relatively higher percentage of residential property, with minimal rates being raised from commercial and industrial properties, which usually generate higher rate revenue. PwC recommends that the City increase commercial and industrial property numbers to improve the rates base and provide more opportunities to generate other user charges. This is currently underway, as the City is revitalising existing commercial centres to encourage more office space and is developing some major industrial areas which will create additional employment. Debt Funding and Credit Rating The City has low debt levels and significant cash, which provide the ability to raise funds for the planned infrastructure. However, constraints include recent operating and asset renewal deficits indicating a backlog in infrastructure renewal due expenditure on new asset development. Increased debt means the City will have to manage the debt effectively. A tool the City may wish to implement is obtaining a formal credit rating from a recognised agency (e.g. Moody’s, Standard and Poor’s and Fitch Rating).
Executive Summary 3

PricewaterhouseCoopers
Local governments should target an Investment Grade credit ratings which covers all grades between ‘BBB’ and ‘AAA’.1 PwC financial ratio analysis of the City over this time period, suggests an Indicative Credit Rating of between A and AA over the next 20 years under the conservative and moderate population growth scenarios. The moderate population growth scenario has a slightly stronger average credit rating as incomes streams from the extra population more than offset the additional capital and operating costs. Infrastructure Development and Renewal It is estimated that across City of Gosnells approximately $358.4 million in capital expenditure on infrastructure is required over the next 20 years to ensure the community has the required new facilities for the future population under both the conservative and medium growth predictions. Funding for the required infrastructure will be obtained through a mix of Government grants, developer contributions, debt and cash reserves. The City could consider various refinements to its funding approaches, which are detailed in the Recommendations section. Asset Maintenance and Renewal PwC has identified a historic under-spend in building renewal and maintenance expenditure. The City should allocate additional funds to building maintenance to prevent the development of a backlog of renewal work.
The City should also ensure it fully analyses and reconciles the difference between spending on asset renewals and depreciation levels of existing assets before surplus funds in the RAM model are spent on expanding the City’s asset base. It is suggested the City should undertake further detailed analysis of this issue. Benchmarking Operational Efficiency and Effectiveness The City’s reformed operations to improve efficiency were assessed against 26 other local governments in the Perth metropolitan region. It was found that the City is in the top quartile for efficiency when measured in terms of residents per Council employee. Rate revenue per capita is in the lowest quartile indicating ratepayers are getting good value for money. The City should re-evaluate optimal residential rate levels and seek to increase the commercial and industrial rate base. As the City does not have any debt, it is in a strong financial position. The benchmarking results can be used to evaluate the merit of potential regional shared service / cooperation programs with nearby local governments (eg Armadale, Canning, Kalamunda etc) whereby the City could provide services to other local governments (or vice-versa) to obtain further economies of scale and improve efficiency. Forward Looking Reform Industry wide reform is needed to improve the financial efficiency of weaker WA local governments whilst providing better performing local governments with more incentive to continue and strengthen best practice. Potential reforms worth evaluating are:
• Expanded benchmarking by establishing a Perth or WA based local government benchmarking process.
1 The AAA credit rating, as held by the WA Government, is awarded only where there is an exceptionally strong capacity for timely payment of financial commitments. The ‘AA’ credit rating indicates a very high credit quality, whilst the BBB rating indicates satisfactory credit quality but there are factors that may make the entity more vulnerable in the future. Ratings of BB or below are non-investment Grade (or speculative) with a greater risk of credit default.
Executive Summary 4

PricewaterhouseCoopers
• Redefine the approach for allocating Financial Assistance Grants (FAGs) within Western Australia so a minor part of these funds could be used to reward local governments who record “top quartile” improvements in performance. The additional funding could be used for activities such as staff training in capital project appraisal, asset management planning and project management. This approach would reward relative improvement rather than just the strongest financial performers.
• Improving efficiency, effectiveness and scale by sharing services with neighbouring local
governments, outsourcing, and use of state-wide purchasing agreements. • Working with the Western Australia Government to adjust or relax legislative impediments and
improve the capacity of local government to raise revenue from its own sources.
Executive Summary 5
PricewaterhouseCoopers
1 Introduction
1.1 Background
The long-term financial viability of local government has become a key issue both in Western Australia and nationally. Increasingly, it is becoming clear that some segments of the local government sector are facing significant challenges meeting current and future financial liabilities while fulfilling their roles and responsibilities, particularly in local infrastructure provision and service delivery.
The City’s forecast population growth of between 1.5% and 2.0% is a key factor driving a large capital expenditure program, which in turn creates a need to access funding from State and Federal sources. The strong rate of population growth and the large scale of the capital expenditure program mean it is timely to reassess the financial sustainability of the City over the next 20 years. Predicted population growth is also central to the City’s infrastructure and renewal planning and development and operational growth requirements. Currently, the City has estimated that a minimum of approximately $358.4m needs to be spent on infrastructure by 2020 to maintain the level of service to the existing population. This spend is to be funded through a mix of government grants, projects funded by State government agencies, developer contributions, cash reserves and some debt.
The City has been prudent and responsible in looking towards a sustainable financial future. To do this, it is critical that the City builds upon this study to ensure it adequately plans for the financial implications of population growth and actively manages the funding process for future infrastructure projects. This will ensure the City achieves the most optimum levels of resource allocation.
1.2 Objectives and Scope of this Study
The City commissioned PricewaterhouseCoopers to complete a study titled ‘Future Proofing the City of Gosnells’ on the long-term financial planning implications of infrastructure development, infrastructure renewal and operational costs that will occur due to population growth.
To assist in the City’s planning, population growth scenarios to 2020 and 2027 have been developed based upon high, moderate and conservative growth scenarios. Projections consider the expected increases in dwellings, conversion of low density housing to medium density and the development of new low and medium density dwellings in the suburbs of Canning Vale and Southern River. The likelihood of the population scenarios being achieved will then provide further insight into financial requirements for infrastructure development and City operating costs. The outcome of this discussion will be achieved by:
• Projecting high, moderate and low population growth scenarios to 2020 and 2027. • Determining the financial impact of population growth upon the City’s operating costs under
the three population growth scenarios. • Calculating the projected cash flow available from operating activities, capital available to be
included within the Resource Allocation Model (RAM) and rates revenue under the identified population growth scenarios.
• Projecting the cost of planned infrastructure developments and identifying issues that should
be considered for each funding source.
• Assessing the City’s plans to obtain the required level of funding for planned infrastructure. • Upper level benchmarking the City’s efficiency in 2005/06 compared to 26 local governments
in the Perth metropolitan region to identify ways to improve efficiency.
• Briefly assessing the City’s current asset maintenance and renewal process.
Introduction 6

PricewaterhouseCoopers
• Discussing forward looking reforms that the City could implement itself and also advocate for change in the industry.
This study has drawn upon studies by Access Economics for the Western Australian Local Government Association as well as PwC financial analysis of other local governments in the Western Australian metropolitan region.
1.3 Study Structure
The Study has been structured as follows:
• Chapter 2 Population Growth Scenarios to 2027 • Chapter 3 Financial Planning Implications of Growth
• Chapter 4 Operational Efficiency and Effectiveness
• Chapter 5 Infrastructure Development and Funding
• Chapter 6 Asset Maintenance and Renewal
• Chapter 7 Other Assets Potentially Requiring Future Capital Expenditure
• Chapter 8 Forward Looking Industry Reforms
• Chapter 9 Recommendations
Introduction 7
PricewaterhouseCoopers
2 Population Growth Scenarios to 2027
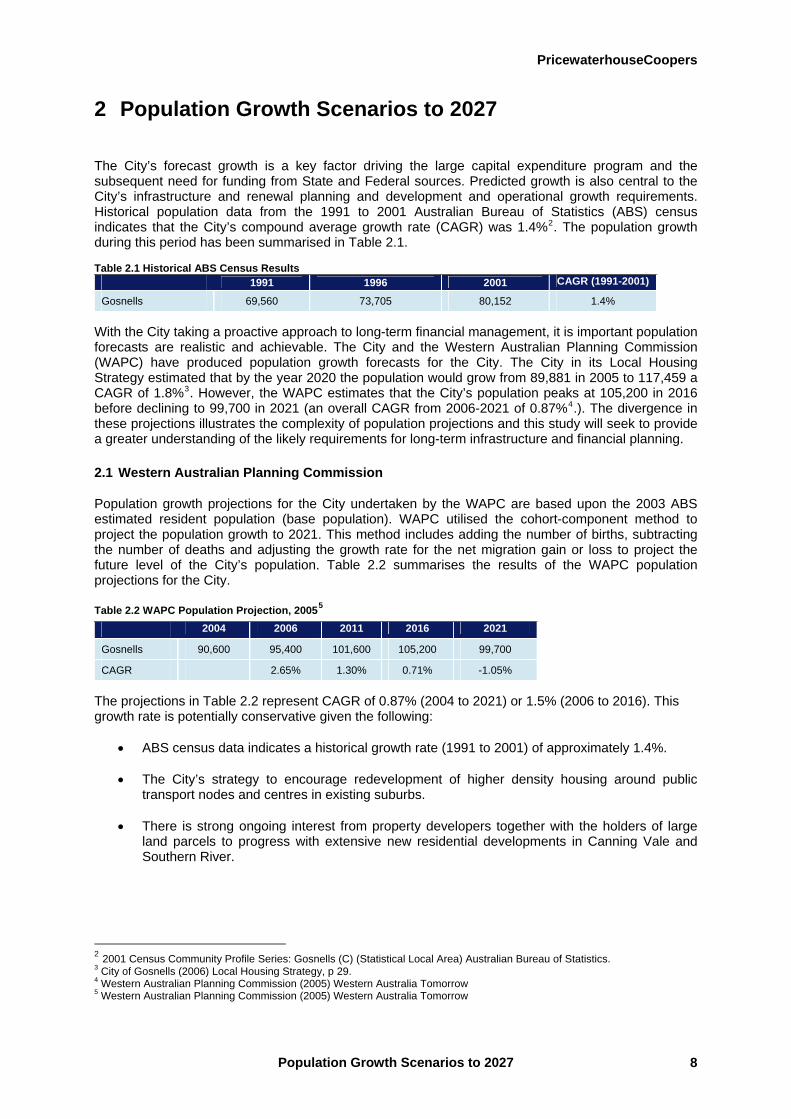
The City’s forecast growth is a key factor driving the large capital expenditure program and the subsequent need for funding from State and Federal sources. Predicted growth is also central to the City’s infrastructure and renewal planning and development and operational growth requirements. Historical population data from the 1991 to 2001 Australian Bureau of Statistics (ABS) census indicates that the City’s compound average growth rate (CAGR) was 1.4%2. The population growth during this period has been summarised in Table 2.1. Table 2.1 Historical ABS Census Results 1991 1996 2001 CAGR (1991-2001)
Gosnells 69,560 73,705 80,152 1.4% With the City taking a proactive approach to long-term financial management, it is important population forecasts are realistic and achievable. The City and the Western Australian Planning Commission (WAPC) have produced population growth forecasts for the City. The City in its Local Housing Strategy estimated that by the year 2020 the population would grow from 89,881 in 2005 to 117,459 a CAGR of 1.8%3. However, the WAPC estimates that the City’s population peaks at 105,200 in 2016 before declining to 99,700 in 2021 (an overall CAGR from 2006-2021 of 0.87%4.). The divergence in these projections illustrates the complexity of population projections and this study will seek to provide a greater understanding of the likely requirements for long-term infrastructure and financial planning. 2.1 Western Australian Planning Commission
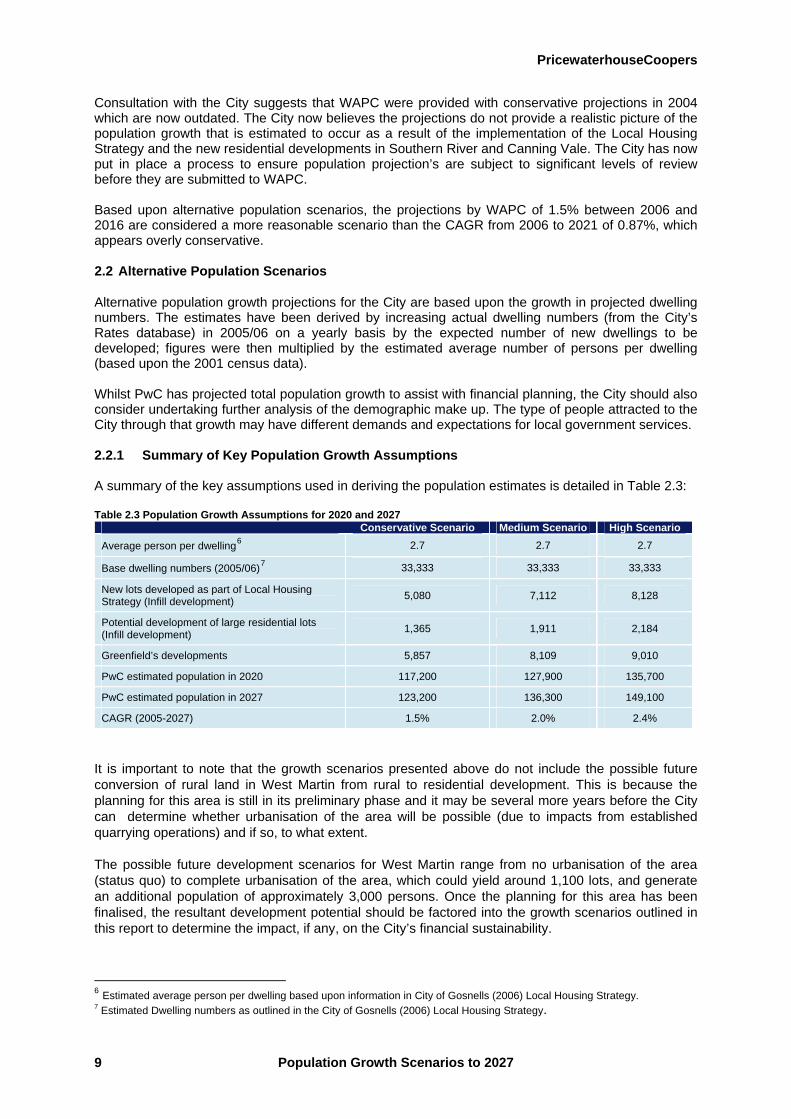
Population growth projections for the City undertaken by the WAPC are based upon the 2003 ABS estimated resident population (base population). WAPC utilised the cohort-component method to project the population growth to 2021. This method includes adding the number of births, subtracting the number of deaths and adjusting the growth rate for the net migration gain or loss to project the future level of the City’s population. Table 2.2 summarises the results of the WAPC population projections for the City. Table 2.2 WAPC Population Projection, 20055
2004 2006 2011 2016 2021
Gosnells 90,600 95,400 101,600 105,200 99,700
CAGR 2.65% 1.30% 0.71% -1.05%
The projections in Table 2.2 represent CAGR of 0.87% (2004 to 2021) or 1.5% (2006 to 2016). This growth rate is potentially conservative given the following:
• ABS census data indicates a historical growth rate (1991 to 2001) of approximately 1.4%. • The City’s strategy to encourage redevelopment of higher density housing around public
transport nodes and centres in existing suburbs. • There is strong ongoing interest from property developers together with the holders of large
land parcels to progress with extensive new residential developments in Canning Vale and Southern River.
2 2001 Census Community Profile Series: Gosnells (C) (Statistical Local Area) Australian Bureau of Statistics. 3 City of Gosnells (2006) Local Housing Strategy, p 29. 4 Western Australian Planning Commission (2005) Western Australia Tomorrow 5 Western Australian Planning Commission (2005) Western Australia Tomorrow
Population Growth Scenarios to 2027 8
PricewaterhouseCoopers
Consultation with the City suggests that WAPC were provided with conservative projections in 2004 which are now outdated. The City now believes the projections do not provide a realistic picture of the population growth that is estimated to occur as a result of the implementation of the Local Housing Strategy and the new residential developments in Southern River and Canning Vale. The City has now put in place a process to ensure population projection’s are subject to significant levels of review before they are submitted to WAPC. Based upon alternative population scenarios, the projections by WAPC of 1.5% between 2006 and 2016 are considered a more reasonable scenario than the CAGR from 2006 to 2021 of 0.87%, which appears overly conservative. 2.2 Alternative Population Scenarios
Alternative population growth projections for the City are based upon the growth in projected dwelling numbers. The estimates have been derived by increasing actual dwelling numbers (from the City’s Rates database) in 2005/06 on a yearly basis by the expected number of new dwellings to be developed; figures were then multiplied by the estimated average number of persons per dwelling (based upon the 2001 census data). Whilst PwC has projected total population growth to assist with financial planning, the City should also consider undertaking further analysis of the demographic make up. The type of people attracted to the City through that growth may have different demands and expectations for local government services. 2.2.1 Summary of Key Population Growth Assumptions
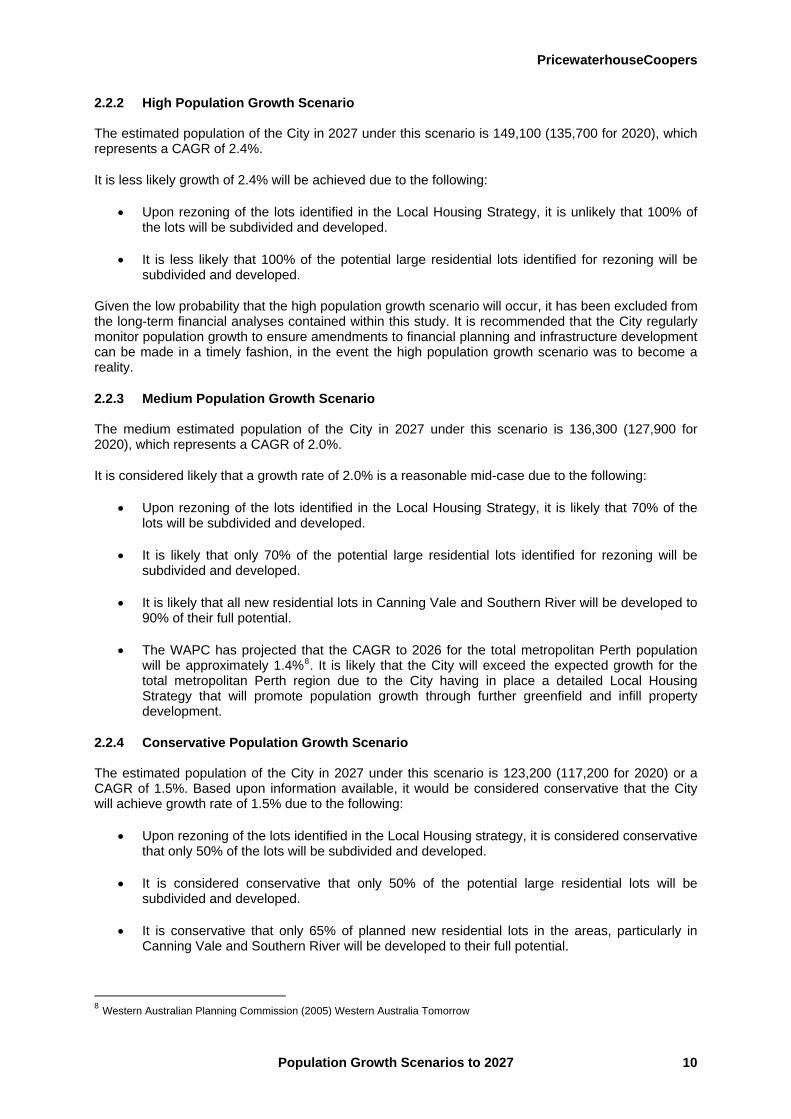
A summary of the key assumptions used in deriving the population estimates is detailed in Table 2.3: Table 2.3 Population Growth Assumptions for 2020 and 2027
Conservative Scenario Medium Scenario High Scenario Average person per dwelling6 2.7 2.7 2.7
Base dwelling numbers (2005/06)7 33,333 33,333 33,333
New lots developed as part of Local Housing Strategy (Infill development) 5,080 7,112 8,128
Potential development of large residential lots (Infill development) 1,365 1,911 2,184
Greenfield’s developments 5,857 8,109 9,010
PwC estimated population in 2020 117,200 127,900 135,700
PwC estimated population in 2027 123,200 136,300 149,100
CAGR (2005-2027) 1.5% 2.0% 2.4%
It is important to note that the growth scenarios presented above do not include the possible future conversion of rural land in West Martin from rural to residential development. This is because the planning for this area is still in its preliminary phase and it may be several more years before the City can determine whether urbanisation of the area will be possible (due to impacts from established quarrying operations) and if so, to what extent.
The possible future development scenarios for West Martin range from no urbanisation of the area (status quo) to complete urbanisation of the area, which could yield around 1,100 lots, and generate an additional population of approximately 3,000 persons. Once the planning for this area has been finalised, the resultant development potential should be factored into the growth scenarios outlined in this report to determine the impact, if any, on the City’s financial sustainability. 6 Estimated average person per dwelling based upon information in City of Gosnells (2006) Local Housing Strategy. 7 Estimated Dwelling numbers as outlined in the City of Gosnells (2006) Local Housing Strategy.
Population Growth Scenarios to 2027 9
PricewaterhouseCoopers
2.2.2 High Population Growth Scenario
The estimated population of the City in 2027 under this scenario is 149,100 (135,700 for 2020), which represents a CAGR of 2.4%.
It is less likely growth of 2.4% will be achieved due to the following:
• Upon rezoning of the lots identified in the Local Housing Strategy, it is unlikely that 100% of the lots will be subdivided and developed.
• It is less likely that 100% of the potential large residential lots identified for rezoning will be subdivided and developed.
Given the low probability that the high population growth scenario will occur, it has been excluded from the long-term financial analyses contained within this study. It is recommended that the City regularly monitor population growth to ensure amendments to financial planning and infrastructure development can be made in a timely fashion, in the event the high population growth scenario was to become a reality.
2.2.3 Medium Population Growth Scenario
The medium estimated population of the City in 2027 under this scenario is 136,300 (127,900 for 2020), which represents a CAGR of 2.0%.
It is considered likely that a growth rate of 2.0% is a reasonable mid-case due to the following:
• Upon rezoning of the lots identified in the Local Housing Strategy, it is likely that 70% of the lots will be subdivided and developed.
• It is likely that only 70% of the potential large residential lots identified for rezoning will be subdivided and developed.
• It is likely that all new residential lots in Canning Vale and Southern River will be developed to 90% of their full potential.
• The WAPC has projected that the CAGR to 2026 for the total metropolitan Perth population will be approximately 1.4%8. It is likely that the City will exceed the expected growth for the total metropolitan Perth region due to the City having in place a detailed Local Housing Strategy that will promote population growth through further greenfield and infill property development.
2.2.4 Conservative Population Growth Scenario
The estimated population of the City in 2027 under this scenario is 123,200 (117,200 for 2020) or a CAGR of 1.5%. Based upon information available, it would be considered conservative that the City will achieve growth rate of 1.5% due to the following:
• Upon rezoning of the lots identified in the Local Housing strategy, it is considered conservative that only 50% of the lots will be subdivided and developed.
• It is considered conservative that only 50% of the potential large residential lots will be subdivided and developed.
• It is conservative that only 65% of planned new residential lots in the areas, particularly in Canning Vale and Southern River will be developed to their full potential.
8 Western Australian Planning Commission (2005) Western Australia Tomorrow
Population Growth Scenarios to 2027 10
PricewaterhouseCoopers
3 Financial Planning Implications of Growth
The City has recently finalised a Ten-Year Financial Plan to assist in planning for operational growth and resource allocation. Through undertaking a review of the financial plan in the light of the expected growth in the City’s population and adjusting for additional spend in asset renewal and development, PwC has provided further analysis of the expected operating performance of the City to the year 2020. Financial projections have been calculated based upon the medium and conservative population growth scenarios identified in Chapter 2. Projections have not been calculated for the high scenario due to the absence of a detailed City capital and operating expenditure program and the limited likelihood of this growth level being achieved. A summary of the key assumptions used in the projections is detailed in Table 3.1. Table 3.1 Financial Projection Assumptions
Conservative Population Growth Scenario
Medium Population Growth Scenario
CPI 9 3.5%pa 3.5%pa
Population growth10 1.5% pa 2.0% pa
PwC’s estimated average rates increase to 2011 8.05% pa 8.40% pa
PwC’s estimated average rates increase from 2012 to 2020 4.55% pa 4.90% pa
PwC’s estimated commencement date of the resource recovery facility.
Commence 2015 Commence 2012
PwC’s estimated average increase in employee costs (inc new staff)11
5.0% pa 5.5% pa
3.1 Financial Projections – Conservative Growth Scenario
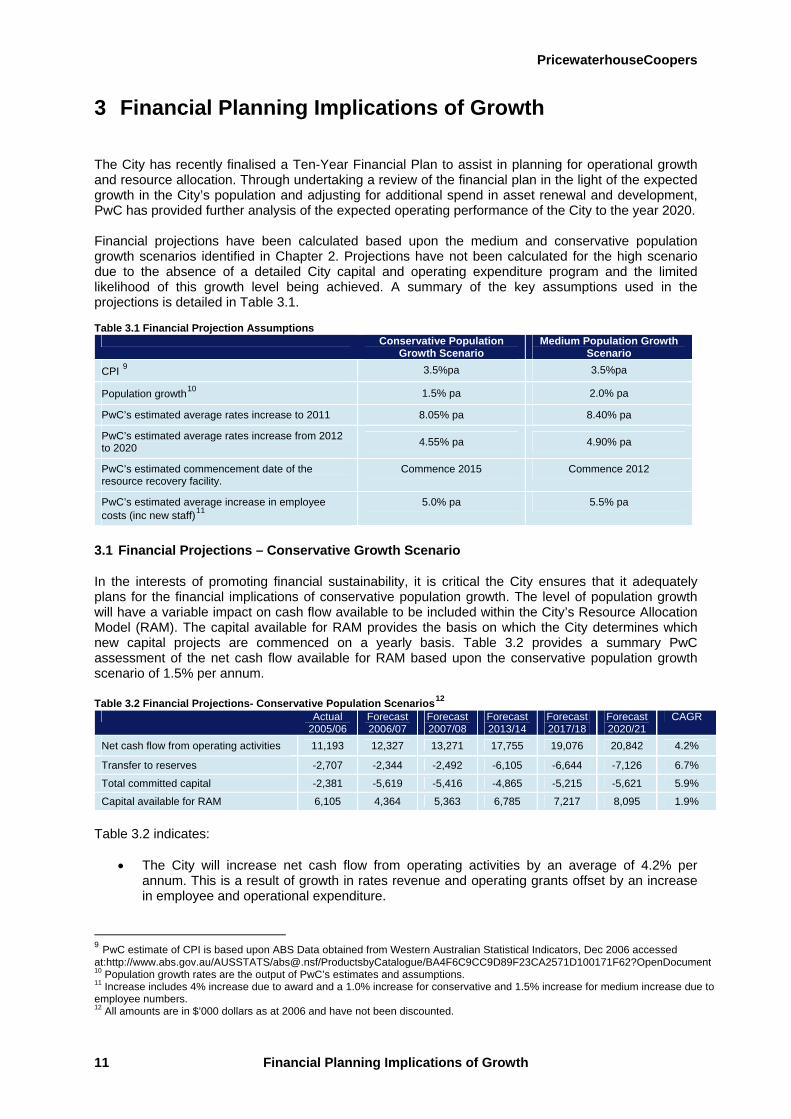
In the interests of promoting financial sustainability, it is critical the City ensures that it adequately plans for the financial implications of conservative population growth. The level of population growth will have a variable impact on cash flow available to be included within the City’s Resource Allocation Model (RAM). The capital available for RAM provides the basis on which the City determines which new capital projects are commenced on a yearly basis. Table 3.2 provides a summary PwC assessment of the net cash flow available for RAM based upon the conservative population growth scenario of 1.5% per annum. Table 3.2 Financial Projections- Conservative Population Scenarios12
Actual 2005/06
Forecast 2006/07
Forecast 2007/08
Forecast 2013/14
Forecast 2017/18
Forecast 2020/21
CAGR
Net cash flow from operating activities 11,193 12,327 13,271 17,755 19,076 20,842 4.2%
Transfer to reserves -2,707 -2,344 -2,492 -6,105 -6,644 -7,126 6.7%
Total committed capital -2,381 -5,619 -5,416 -4,865 -5,215 -5,621 5.9%
Capital available for RAM 6,105 4,364 5,363 6,785 7,217 8,095 1.9%
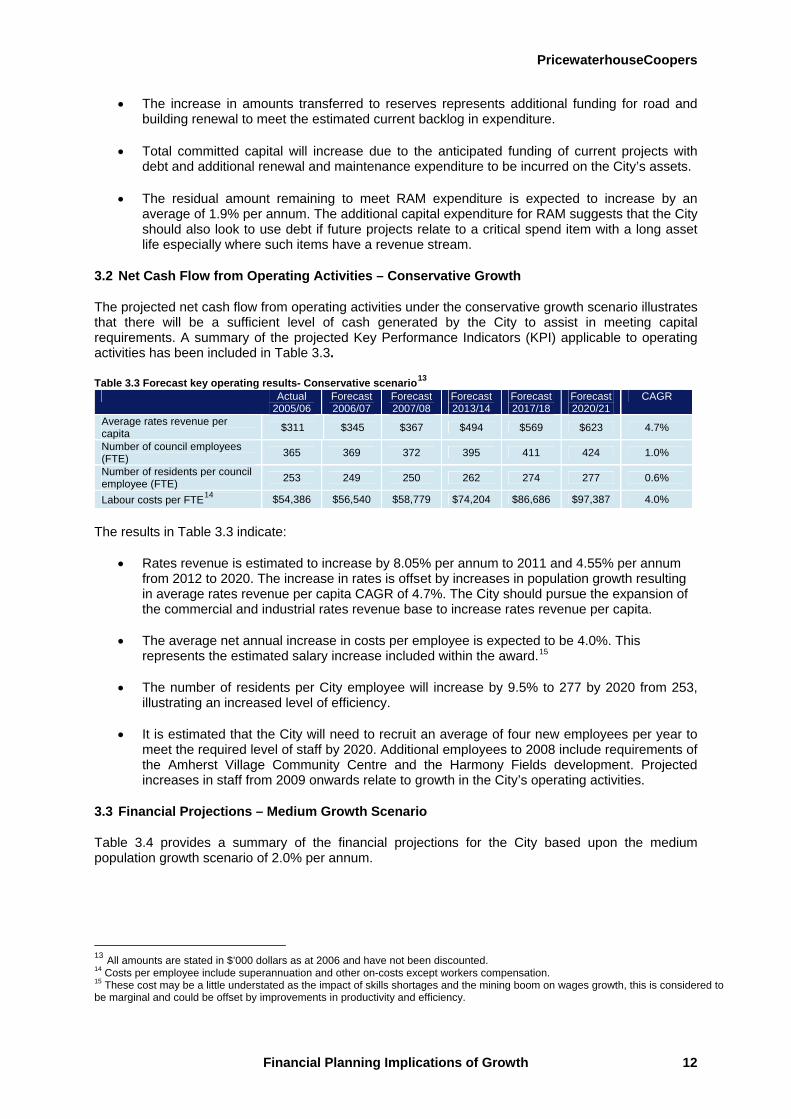
Table 3.2 indicates:
• The City will increase net cash flow from operating activities by an average of 4.2% per annum. This is a result of growth in rates revenue and operating grants offset by an increase in employee and operational expenditure.
9 PwC estimate of CPI is based upon ABS Data obtained from Western Australian Statistical Indicators, Dec 2006 accessed at:http://www.abs.gov.au/AUSSTATS/[email protected]/ProductsbyCatalogue/BA4F6C9CC9D89F23CA2571D100171F62?OpenDocument 10 Population growth rates are the output of PwC’s estimates and assumptions. 11 Increase includes 4% increase due to award and a 1.0% increase for conservative and 1.5% increase for medium increase due to employee numbers. 12 All amounts are in $’000 dollars as at 2006 and have not been discounted.
Financial Planning Implications of Growth 11
PricewaterhouseCoopers
• The increase in amounts transferred to reserves represents additional funding for road and building renewal to meet the estimated current backlog in expenditure.
• Total committed capital will increase due to the anticipated funding of current projects with debt and additional renewal and maintenance expenditure to be incurred on the City’s assets.
• The residual amount remaining to meet RAM expenditure is expected to increase by an average of 1.9% per annum. The additional capital expenditure for RAM suggests that the City should also look to use debt if future projects relate to a critical spend item with a long asset life especially where such items have a revenue stream.
3.2 Net Cash Flow from Operating Activities – Conservative Growth
The projected net cash flow from operating activities under the conservative growth scenario illustrates that there will be a sufficient level of cash generated by the City to assist in meeting capital requirements. A summary of the projected Key Performance Indicators (KPI) applicable to operating activities has been included in Table 3.3. Table 3.3 Forecast key operating results- Conservative scenario13
Actual 2005/06
Forecast 2006/07
Forecast 2007/08
Forecast 2013/14
Forecast 2017/18
Forecast 2020/21
CAGR
Average rates revenue per capita $311 $345 $367 $494 $569 $623 4.7%
Number of council employees (FTE) 365 369 372 395 411 424 1.0%
Number of residents per council employee (FTE) 253 249 250 262 274 277 0.6%
Labour costs per FTE14 $54,386 $56,540 $58,779 $74,204 $86,686 $97,387 4.0%
The results in Table 3.3 indicate:
• Rates revenue is estimated to increase by 8.05% per annum to 2011 and 4.55% per annum from 2012 to 2020. The increase in rates is offset by increases in population growth resulting in average rates revenue per capita CAGR of 4.7%. The City should pursue the expansion of the commercial and industrial rates revenue base to increase rates revenue per capita.
• The average net annual increase in costs per employee is expected to be 4.0%. This
represents the estimated salary increase included within the award.15
• The number of residents per City employee will increase by 9.5% to 277 by 2020 from 253, illustrating an increased level of efficiency.
• It is estimated that the City will need to recruit an average of four new employees per year to
meet the required level of staff by 2020. Additional employees to 2008 include requirements of the Amherst Village Community Centre and the Harmony Fields development. Projected increases in staff from 2009 onwards relate to growth in the City’s operating activities.
3.3 Financial Projections – Medium Growth Scenario
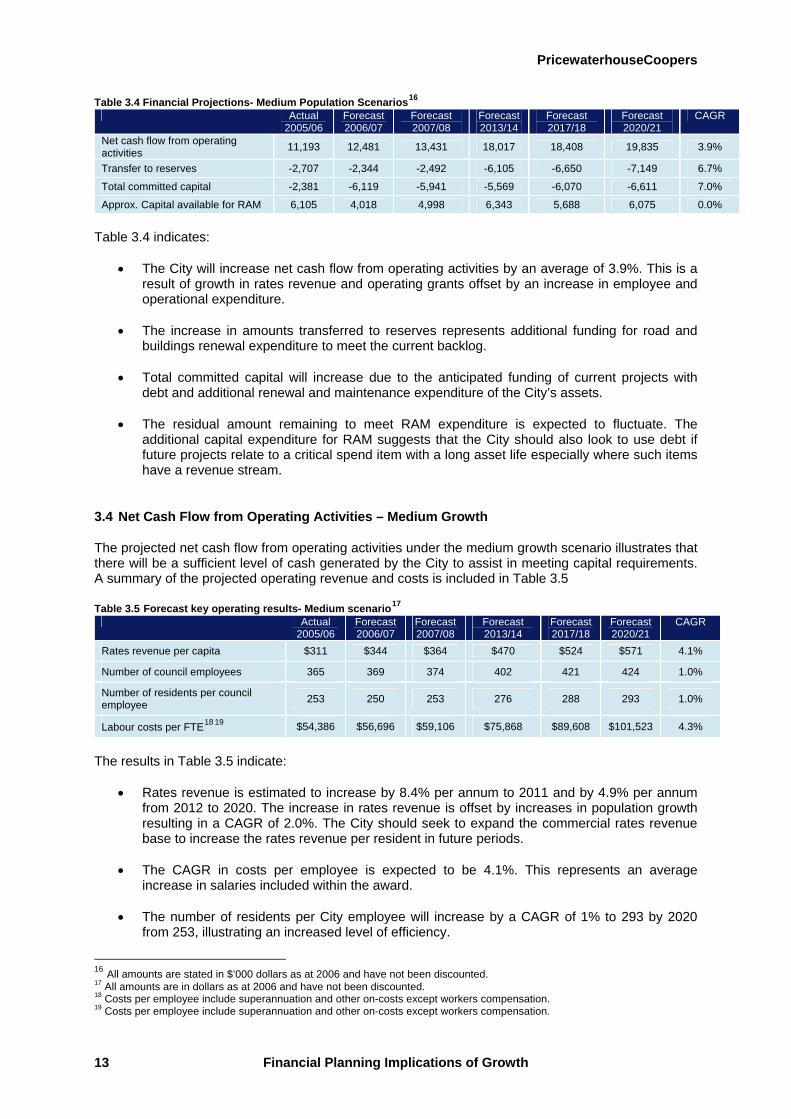
Table 3.4 provides a summary of the financial projections for the City based upon the medium population growth scenario of 2.0% per annum.
13 All amounts are stated in $’000 dollars as at 2006 and have not been discounted. 14 Costs per employee include superannuation and other on-costs except workers compensation. 15 These cost may be a little understated as the impact of skills shortages and the mining boom on wages growth, this is considered to be marginal and could be offset by improvements in productivity and efficiency.
Financial Planning Implications of Growth 12
PricewaterhouseCoopers
Table 3.4 Financial Projections- Medium Population Scenarios16
Actual 2005/06
Forecast 2006/07
Forecast 2007/08
Forecast 2013/14
Forecast 2017/18
Forecast 2020/21
CAGR
Net cash flow from operating activities 11,193 12,481 13,431 18,017 18,408 19,835 3.9%
Transfer to reserves -2,707 -2,344 -2,492 -6,105 -6,650 -7,149 6.7%
Total committed capital -2,381 -6,119 -5,941 -5,569 -6,070 -6,611 7.0%
Approx. Capital available for RAM 6,105 4,018 4,998 6,343 5,688 6,075 0.0%
Table 3.4 indicates:
• The City will increase net cash flow from operating activities by an average of 3.9%. This is a result of growth in rates revenue and operating grants offset by an increase in employee and operational expenditure.
• The increase in amounts transferred to reserves represents additional funding for road and
buildings renewal expenditure to meet the current backlog.
• Total committed capital will increase due to the anticipated funding of current projects with debt and additional renewal and maintenance expenditure of the City’s assets.
• The residual amount remaining to meet RAM expenditure is expected to fluctuate. The
additional capital expenditure for RAM suggests that the City should also look to use debt if future projects relate to a critical spend item with a long asset life especially where such items have a revenue stream.
3.4 Net Cash Flow from Operating Activities – Medium Growth
The projected net cash flow from operating activities under the medium growth scenario illustrates that there will be a sufficient level of cash generated by the City to assist in meeting capital requirements. A summary of the projected operating revenue and costs is included in Table 3.5 Table 3.5 Forecast key operating results- Medium scenario17
Actual 2005/06
Forecast 2006/07
Forecast 2007/08
Forecast 2013/14
Forecast 2017/18
Forecast 2020/21
CAGR
Rates revenue per capita $311 $344 $364 $470 $524 $571 4.1%
Number of council employees 365 369 374 402 421 424 1.0%
Number of residents per council employee 253 250 253 276 288 293 1.0%
Labour costs per FTE18 19 $54,386 $56,696 $59,106 $75,868 $89,608 $101,523 4.3%
The results in Table 3.5 indicate:
• Rates revenue is estimated to increase by 8.4% per annum to 2011 and by 4.9% per annum from 2012 to 2020. The increase in rates revenue is offset by increases in population growth resulting in a CAGR of 2.0%. The City should seek to expand the commercial rates revenue base to increase the rates revenue per resident in future periods.
• The CAGR in costs per employee is expected to be 4.1%. This represents an average
increase in salaries included within the award.
• The number of residents per City employee will increase by a CAGR of 1% to 293 by 2020 from 253, illustrating an increased level of efficiency.
16 All amounts are stated in $’000 dollars as at 2006 and have not been discounted. 17 All amounts are in dollars as at 2006 and have not been discounted. 18 Costs per employee include superannuation and other on-costs except workers compensation. 19 Costs per employee include superannuation and other on-costs except workers compensation.
Financial Planning Implications of Growth 13

PricewaterhouseCoopers
• It is estimated that the City will need to recruit an average of eight new employees per year to
meet the required level of staff by 2020. Additional employees to 2008 include requirements of the Amherst Village Community Centre and the Harmony Fields developments. Projected increases in staff from 2009 onwards relate to growth in the City’s operating activities.
• Increased costs per employee will occur due to an expected increase in outsourcing of
activities under the medium growth scenario.
3.5 Rates Revenue
In the interests of promoting financial sustainability, it is critical that the City ensures that it raises rate revenue to an adequate level. Table 3.6 provides a breakdown of the increases included within PwC’s projections. Table 3.6 Drivers of Rates Revenue Growth
Conservative Population Growth Scenario
Medium Population Growth Scenario
Forecast CPI (Western Australia) 20 3.50% pa 3.50% pa
Estimated rates growth from increase in residential properties21 1.05% pa 1.40% pa
Rates increase to supplement funding for infrastructure renewals (2007-2011) 2.50% pa 2.50% pa
Total rates increase to 2011 7.05 % pa 7.40% pa
Total rates increase 2011- 2021 (CPI + Estimated growth in residential properties) 4.55% pa 4.90% pa
These projections include a fixed increase of 2.5% per annum to 2011 recognising that the residential rates will need to increase in the short term to supplement funding for planned infrastructure developments and the current renewals backlog. As a result, subsequent rates increases from 2011 to 2021 will be limited due to short-term increases being considered adequate and further increases would be difficult to achieve. It is evident that there is significant divergence in the calculation of residential rates between Perth metropolitan local governments. Therefore, a comparison of the City’s rates revenue per residential rates property has not been performed. A major issue is the differences in treatment of rubbish charges as the City excludes rubbish charges from its rates valuation and other Perth local governments include the charge in their valuations resulting in difficulties in performing a like-by-like benchmarking exercise.22
The City’s average annual rates revenue per capita has been considered the most appropriate method to benchmark the level of rates revenue. PwC has compared these rates to 26 local governments in the Perth metropolitan region; refer to the results included in Appendix I. The results indicate that the City’s average rate revenue per capita was $311 in 2005/06 compared to an average of $465 and was the second lowest, indicating that the City is currently servicing its existing population with a lower per head rates revenue than other Perth metropolitan local governments. PwC notes that rates revenue per capita is low due to the City’s property mix being weighted towards a residential base, with minimal rates being received from commercial and industrial properties, which usually generate higher rates revenue. PwC has prepared a projection in Table 3.7 of the City’s average rates revenue per capita to the year 2020 under both the medium and conservative growth scenarios. This has then been compared to the average of 26 surveyed local governments in the Perth metropolitan region identified in Appendix I.
20 PwC estimate of CPI is based upon ABS Data obtained from Western Australian Statistical Indicators, Dec 2006 accessed at:http://www.abs.gov.au/AUSSTATS/[email protected]/ProductsbyCatalogue/BA4F6C9CC9D89F23CA2571D100171F62?OpenDocument 21 Increased rates growth from increased residential residencies is based upon 70% of population growth CAGR. 22 Western Australian Local Government Rates Comparison, 2005/06. Ray Hadlow.
Financial Planning Implications of Growth 14

PricewaterhouseCoopers
Table 3.7 Projected Average Rates Revenue per Capita23
Actual 2005/06
Forecast 2006/07
Forecast 2007/08
Forecast 2013/14
Forecast 2017/18
Forecast 2020/21
CAGR
Average rates revenue per capita (conservative growth) $311 $345 $367 $494 $569 $623 3.9%
Average rates revenue per capita (medium growth) $311 $344 $364 $470 $524 $571 4.1%
Average rates revenue per capita (26 metropolitan local governments)
$474 $488 $500 $600 $676 $738 3.2%
Table 3.7 illustrates that the City’s average rates revenue per capita will remain low compared to the average of the projected rates revenue of 26 local governments in the Perth metropolitan region. Whilst the City should pursue the current strategy to increase overall rates revenue, PwC notes that an increase in residential rates charges will be difficult to achieve and should not be the only strategy the City pursues. Rather PwC recommends that the City should look to increase commercial and industrial rates revenue to improve the rates revenue per capita. The City is currently in the process of revitalising existing commercial centres to encourage office space development and major industrial areas. This strategy will improve the “dormitory” nature of the suburbs by increasing the commercial rates revenue base and raising the rates revenue per capita to a sustainable level.
3.6 Capital Available for Resource Allocation
The capital available to be included in the Resource Allocation Model (RAM) forms the basis of the City’s budgeted spend on capital expenditure for potential new projects. A summary of the expected RAM expenditure under the conservative and medium growth scenarios compared to the City’s current Ten-Year Financial Plan has been included in Table 3.8. Table 3.8 Estimated Capital available for RAM
Scenario Average Highest Lowest Amount available for RAM under Gosnells ten-year financial plan $7.7m $9.2m $5.6m
Amount available for RAM under conservative growth scenario $6.5m $8.0m $4.4m
Amount available for RAM under medium growth scenario $5.7m $6.5m $4.0m
The City would be able to fund additional capital expenditure, other than suggested under the RAM budget allocation through the use of debt if the expenditure relates to a critical spend item with a long asset life especially where such items have a revenue stream.
23 All amounts are in $’000 dollars as at 2006 and have not been discounted.
Financial Planning Implications of Growth 15
PricewaterhouseCoopers
4 Operational Efficiency and Effectiveness
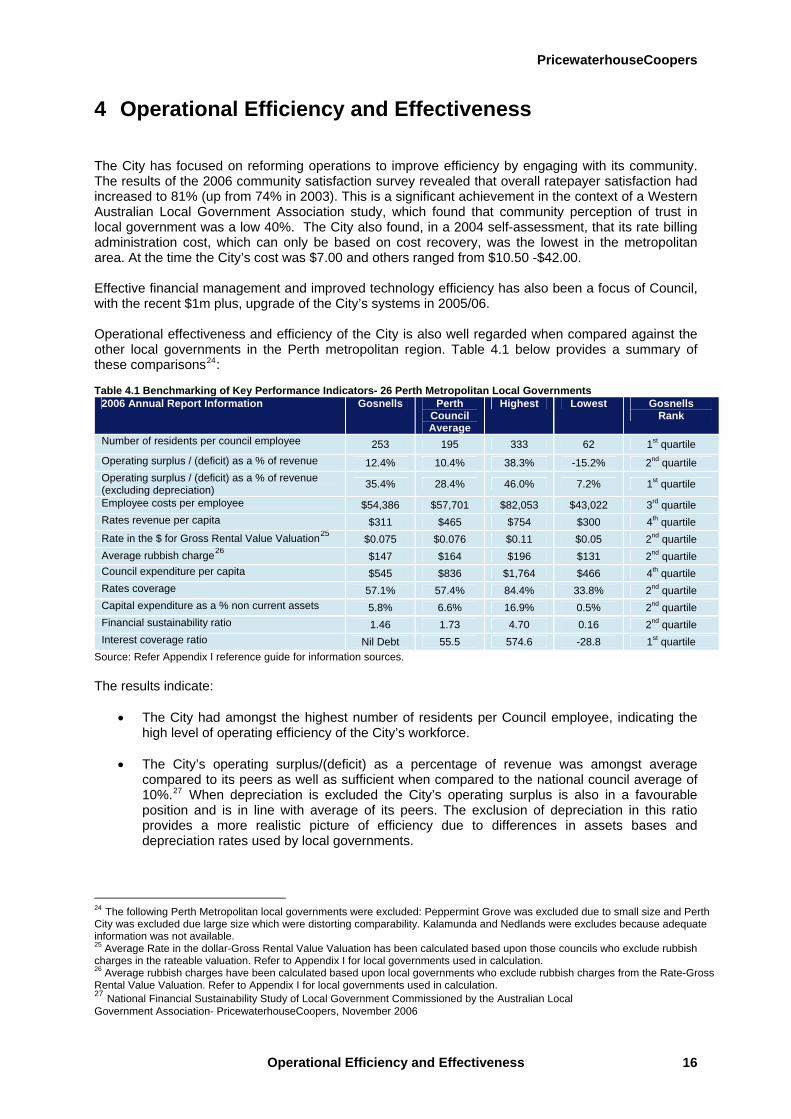
The City has focused on reforming operations to improve efficiency by engaging with its community. The results of the 2006 community satisfaction survey revealed that overall ratepayer satisfaction had increased to 81% (up from 74% in 2003). This is a significant achievement in the context of a Western Australian Local Government Association study, which found that community perception of trust in local government was a low 40%. The City also found, in a 2004 self-assessment, that its rate billing administration cost, which can only be based on cost recovery, was the lowest in the metropolitan area. At the time the City’s cost was $7.00 and others ranged from $10.50 -$42.00. Effective financial management and improved technology efficiency has also been a focus of Council, with the recent $1m plus, upgrade of the City’s systems in 2005/06. Operational effectiveness and efficiency of the City is also well regarded when compared against the other local governments in the Perth metropolitan region. Table 4.1 below provides a summary of these comparisons24: Table 4.1 Benchmarking of Key Performance Indicators- 26 Perth Metropolitan Local Governments
2006 Annual Report Information Gosnells Perth Council Average
Highest Lowest Gosnells Rank
Number of residents per council employee 253 195 333 62 1st quartile Operating surplus / (deficit) as a % of revenue 12.4% 10.4% 38.3% -15.2% 2nd quartile Operating surplus / (deficit) as a % of revenue (excluding depreciation) 35.4% 28.4% 46.0% 7.2% 1st quartile
Employee costs per employee $54,386 $57,701 $82,053 $43,022 3rd quartile Rates revenue per capita $311 $465 $754 $300 4th quartile Rate in the $ for Gross Rental Value Valuation25 $0.075 $0.076 $0.11 $0.05 2nd quartile Average rubbish charge26 $147 $164 $196 $131 2nd quartile Council expenditure per capita $545 $836 $1,764 $466 4th quartile Rates coverage 57.1% 57.4% 84.4% 33.8% 2nd quartile Capital expenditure as a % non current assets 5.8% 6.6% 16.9% 0.5% 2nd quartile Financial sustainability ratio 1.46 1.73 4.70 0.16 2nd quartile Interest coverage ratio Nil Debt 55.5 574.6 -28.8 1st quartile
Source: Refer Appendix I reference guide for information sources. The results indicate:
• The City had amongst the highest number of residents per Council employee, indicating the high level of operating efficiency of the City’s workforce.
• The City’s operating surplus/(deficit) as a percentage of revenue was amongst average
compared to its peers as well as sufficient when compared to the national council average of 10%.27 When depreciation is excluded the City’s operating surplus is also in a favourable position and is in line with average of its peers. The exclusion of depreciation in this ratio provides a more realistic picture of efficiency due to differences in assets bases and depreciation rates used by local governments.
24 The following Perth Metropolitan local governments were excluded: Peppermint Grove was excluded due to small size and Perth City was excluded due large size which were distorting comparability. Kalamunda and Nedlands were excludes because adequate information was not available. 25 Average Rate in the dollar-Gross Rental Value Valuation has been calculated based upon those councils who exclude rubbish charges in the rateable valuation. Refer to Appendix I for local governments used in calculation. 26 Average rubbish charges have been calculated based upon local governments who exclude rubbish charges from the Rate-Gross Rental Value Valuation. Refer to Appendix I for local governments used in calculation. 27 National Financial Sustainability Study of Local Government Commissioned by the Australian Local Government Association- PricewaterhouseCoopers, November 2006
Operational Efficiency and Effectiveness 16
PricewaterhouseCoopers
• Costs per employee were around the average and most likely due to a large percentage of City operations being performed in house. This reflects the City’s approach of using a relatively larger maintenance division rather than outsourcing. Those local governments with higher costs per employee often make more use of outsourcing resulting in relatively fewer employees (but a higher cost per employee).28
• Rate revenue per capita was the second lowest, indicating the City ratepayers are obtaining
strong value for money. There is a considerable difference in the level of rates between the City and surrounding local governments. The City’s lower average rates revenue per capita illustrates the minimal commercial and industrial rates revenue that currently makes up the City’s rate base. An increase in commercial and industrial rates revenue will increase the rate revenue per capita and improve the ability of the City to service its existing population.
• The City’s rates coverage ratio is slightly below the Perth metropolitan council average.
However, when compared to national data the City is performing well as it is estimated that nationally 40.4% of councils have a rates coverage ratio of less then 40%.29
• Capital expenditure as a percentage of non-current assets is slightly below average.
• The City’s sustainability ratio is below average. However, the ratio is greater than one
indicating that capital consumed is less then the capital being replaced into the asset base, resulting in a positive growth in the City’s asset base. It is estimated that median national sustainability ratio is 1.8 and that approximately 8% of all councils nationally have a sustainability ratio of less than 1.30
• At present the City has $nil debt funding. An interest coverage level of three generally
represents a threshold where credit risk begins to be more significant and a large unexpected event with adverse cash flow implications can place pressure on the ability to meet interest payments. It is estimated that nationally approximately 86.8% of councils have an interest coverage ratio of less than 3.31
Refer to Appendix I for detail of the KPI’s calculated for the Perth Metropolitan councils used in PwC’s benchmarking analysis. Additional KPI’s including the current ratio, debt service ratio and gross debt to revenue ratio have been calculated and included in Appendix I, however, no further analysis has been performed. 4.1 Interfacing with Neighbouring Councils and Efficiency Regional cooperation describes the situation where a particular local government service is provided to a number of councils in a region or area either through:
• Collaboration of the resources of the cooperating local governments, or • One local government being the lead service provider for the area.
Many local governments have been actively engaged in improving the efficiency of their operations through regional cooperation and service delivery. The City is already engaged in this type of activity through the South East Metropolitan Regional Council for waste management, pooling resources across three local governments. The City could build on this and identify further areas where it could work more with neighbouring local governments. Potential neighbours that the City could pursue
28 It is noted that some local governments use in-house team works on some capital projects (eg new roads) and in this case the employee costs can be capitalised which provides a modest reduction to the labour cost charged to the profit and loss statement. 29 National Financial Sustainability Study of Local Government Commissioned by the Australian Local Government Association- PricewaterhouseCoopers, November 2006 30 National Financial Sustainability Study of Local Government Commissioned by the Australian Local Government Association- PricewaterhouseCoopers, November 2006 31 National Financial Sustainability Study of Local Government Commissioned by the Australian Local Government Association- PricewaterhouseCoopers, November 2006
Operational Efficiency and Effectiveness 17
PricewaterhouseCoopers
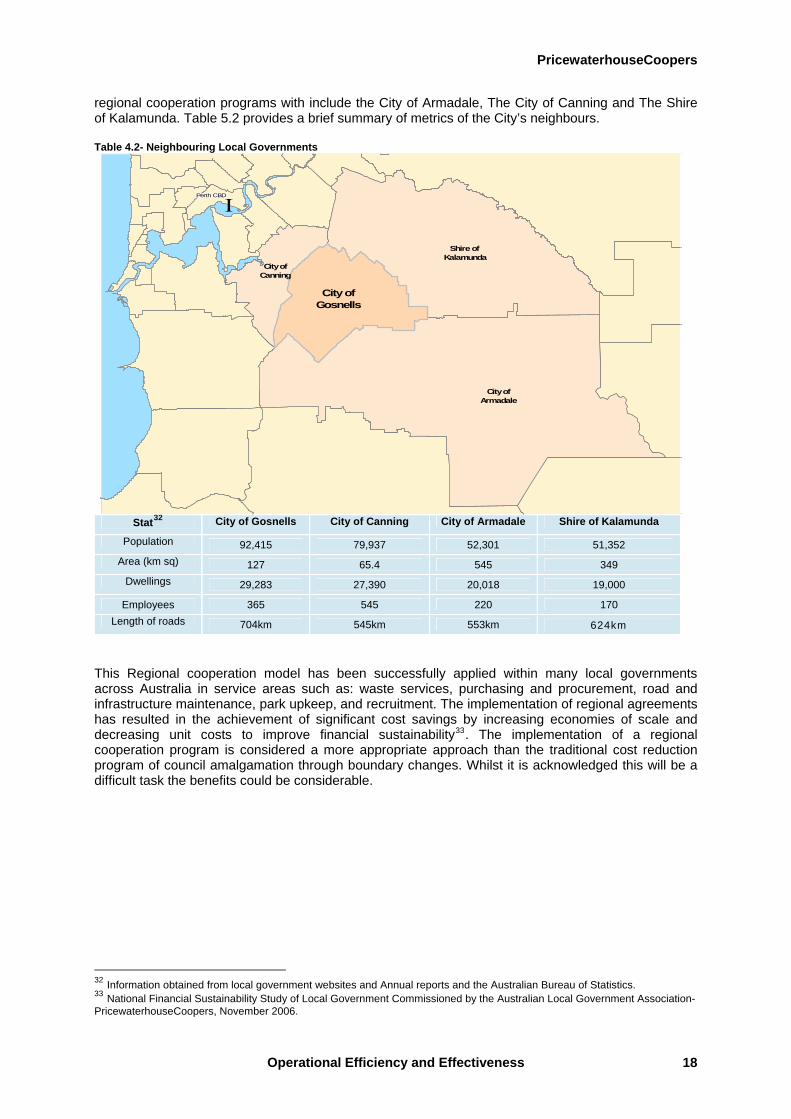
regional cooperation programs with include the City of Armadale, The City of Canning and The Shire of Kalamunda. Table 5.2 provides a brief summary of metrics of the City’s neighbours. Table 4.2- Neighbouring Local Governments
ΙPerth CBDPerth CBDPerth CBDPerth CBDPerth CBDPerth CBDPerth CBDPerth CBDPerth CBD
City ofArmadale
Shire of Kalamunda
City ofCanning
City ofGosnells
Stat32 City of Gosnells City of Canning City of Armadale Shire of Kalamunda
Population 92,415 79,937 52,301 51,352 Area (km sq) 127 65.4 545 349
Dwellings 29,283 27,390 20,018 19,000
Employees 365 545 220 170 Length of roads 704km 545km 553km 624km
This Regional cooperation model has been successfully applied within many local governments across Australia in service areas such as: waste services, purchasing and procurement, road and infrastructure maintenance, park upkeep, and recruitment. The implementation of regional agreements has resulted in the achievement of significant cost savings by increasing economies of scale and decreasing unit costs to improve financial sustainability33. The implementation of a regional cooperation program is considered a more appropriate approach than the traditional cost reduction program of council amalgamation through boundary changes. Whilst it is acknowledged this will be a difficult task the benefits could be considerable.
32 Information obtained from local government websites and Annual reports and the Australian Bureau of Statistics. 33 National Financial Sustainability Study of Local Government Commissioned by the Australian Local Government Association- PricewaterhouseCoopers, November 2006.
Operational Efficiency and Effectiveness 18
PricewaterhouseCoopers
Infrastructure Development and Funding 19
5 Infrastructure Development and Funding
Infrastructure development is recognised as a significant challenge faced by the City as the funding of new infrastructure will be essential in meeting rising community expectations and projected population growth over the next 20 years. The requirement to develop and maintain the City’s infrastructure has been strongly emphasised in the City’s Strategic Plan for the Future 2007-2010. Whilst it is critical that the City allocates financial resources to the renewal of older suburbs, it is the provision of new infrastructure and services to areas of potential greenfield developments that will provide the greatest challenge and require long-term infrastructure planning. 5.1 Population Growth and New Infrastructure development
The City has estimated that a minimum of $358.4m is required to be spent on infrastructure to ensure that new and existing infrastructure can sustain the future population. The City has broadly matched this infrastructure spend to meet the medium population growth of 2.0% per annum. Under the conservative population growth scenario of 1.5% per annum there may be scope for parts of the infrastructure spend to be potentially delayed by approximately two years to realign infrastructure developments with the requirements of the population. A delay of two years will result in a potential saving of $24.5m in the Net Present Value (NPV) of the projects. Additionally, if the population meets the high growth scenario of 2.5%, the City would need to re-evaluate its total infrastructure requirement. An indicative guide is that a 20% rise in capital expenditure would be required to service the high population growth scenario of 2.5% per annum (for illustrative purposes the additional expenditure would bring the total costs to around $437.1m or increase the NPV by $21.6m). Table 5.1 provides a summary of the new infrastructure developments that will be required under all three population growth scenarios. It is suggested that the City undertakes further scenario planning to evaluate the exact nature of the extra capital expenditure required in the event population growth is 2.5% or higher.
I
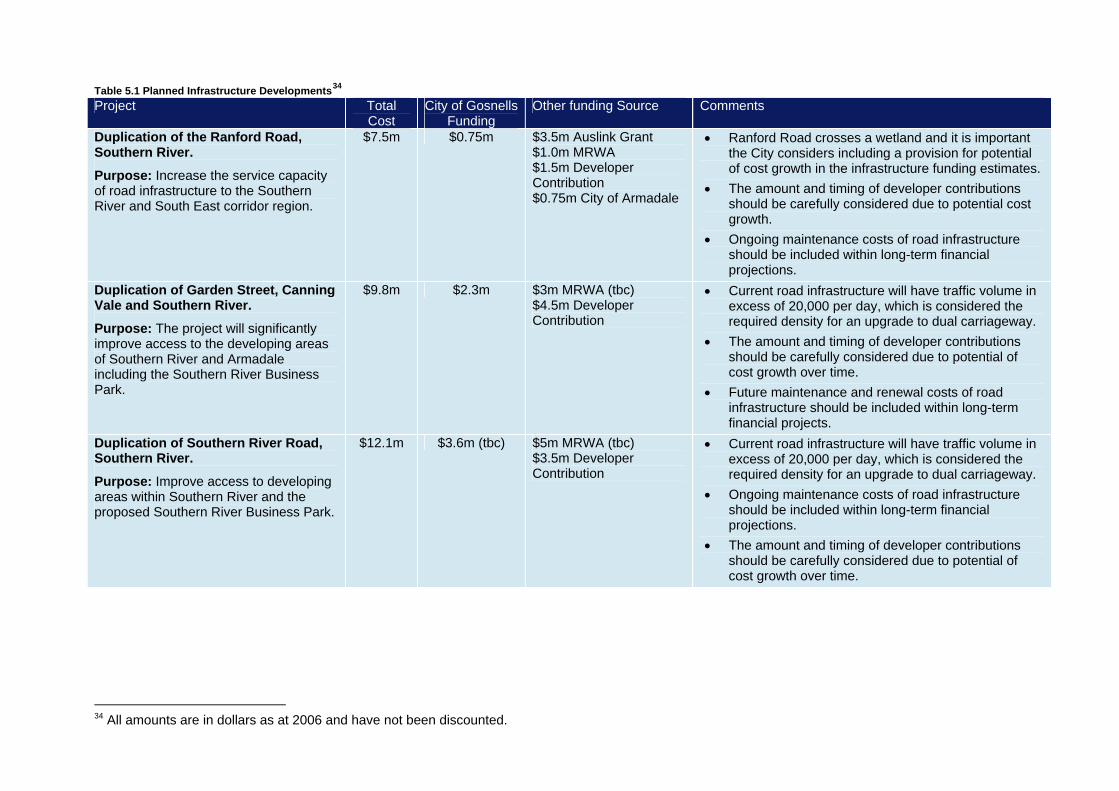
Table 5.1 Planned Infrastructure Developments34
Project Total Cost
City of Gosnells Funding
Other funding Source Comments
Duplication of the Ranford Road, Southern River.
Purpose: Increase the service capacity of road infrastructure to the Southern River and South East corridor region.
$7.5m $0.75m $3.5m Auslink Grant $1.0m MRWA $1.5m Developer Contribution $0.75m City of Armadale
• Ranford Road crosses a wetland and it is important the City considers including a provision for potential of cost growth in the infrastructure funding estimates.
• The amount and timing of developer contributions should be carefully considered due to potential cost growth.
• Ongoing maintenance costs of road infrastructure should be included within long-term financial projections.
Duplication of Garden Street, Canning Vale and Southern River.
Purpose: The project will significantly improve access to the developing areas of Southern River and Armadale including the Southern River Business Park.
$9.8m $2.3m $3m MRWA (tbc) $4.5m Developer Contribution
• Current road infrastructure will have traffic volume in excess of 20,000 per day, which is considered the required density for an upgrade to dual carriageway.
• The amount and timing of developer contributions should be carefully considered due to potential of cost growth over time.
• Future maintenance and renewal costs of road infrastructure should be included within long-term financial projects.
Duplication of Southern River Road, Southern River.
Purpose: Improve access to developing areas within Southern River and the proposed Southern River Business Park.
$12.1m $3.6m (tbc) $5m MRWA (tbc) $3.5m Developer Contribution
• Current road infrastructure will have traffic volume in excess of 20,000 per day, which is considered the required density for an upgrade to dual carriageway.
• Ongoing maintenance costs of road infrastructure should be included within long-term financial projections.
• The amount and timing of developer contributions should be carefully considered due to potential of cost growth over time.
34 All amounts are in dollars as at 2006 and have not been discounted.

Table 5.1 Planned Infrastructure Developments Project Total
Cost City of Gosnells
Funding Other funding Source Comments
New City of Gosnells Operations Centre, Southern River.
Purpose: Existing facility is inadequate and aging. The new centre will provide up to date working environment and technology required.
$6m $4.4m Debt $1.2m Budget $0.4m Reserve
Nil • Construction of building is considered appropriate, as it is a long-term specific use asset.
• The existing operations centre will be closed and the land divested. Expected proceeds of $3.5m will be used to repay debt. The sale of this asset will make a direct contribution to the regeneration of Maddington Town Centre allowing more appropriate land uses to be developed there.
• Use of debt and sale of surplus land appears to be an appropriate funding approach.
• Logistically the Southern River facility will be well placed to accommodate work activity in the western part of the City.
New South Eastern Metropolitan Regional Council Resource Recovery Facility.
Purpose: This facility will process waste and recyclable products from the cities of South Perth, Gosnells, Armadale and other participating partners removing large volumes of material from the waster stream.
$70m Nil $70m Developer Contributions
• Current landfill facility has estimated nine years remaining useful life. It is projected that the useful life can be extended to 15 years if capital expenditure is undertaken.
• Decision to extend useful life of current land fill facility should be based upon “Triple Bottom Line” but also taking into account that technology in Resource Recovery Facilities will increase significantly in 15 years time.
• Project is conceptual with location currently not determined.
• Funding of new facility potentially through private sector build/own/operate contract. Private sector levies assumed to be funded through a ratepayer waste levy.
• Additional costs may be incurred due to the potential requirement to provide a Transfer Station depending on where the facility is located.
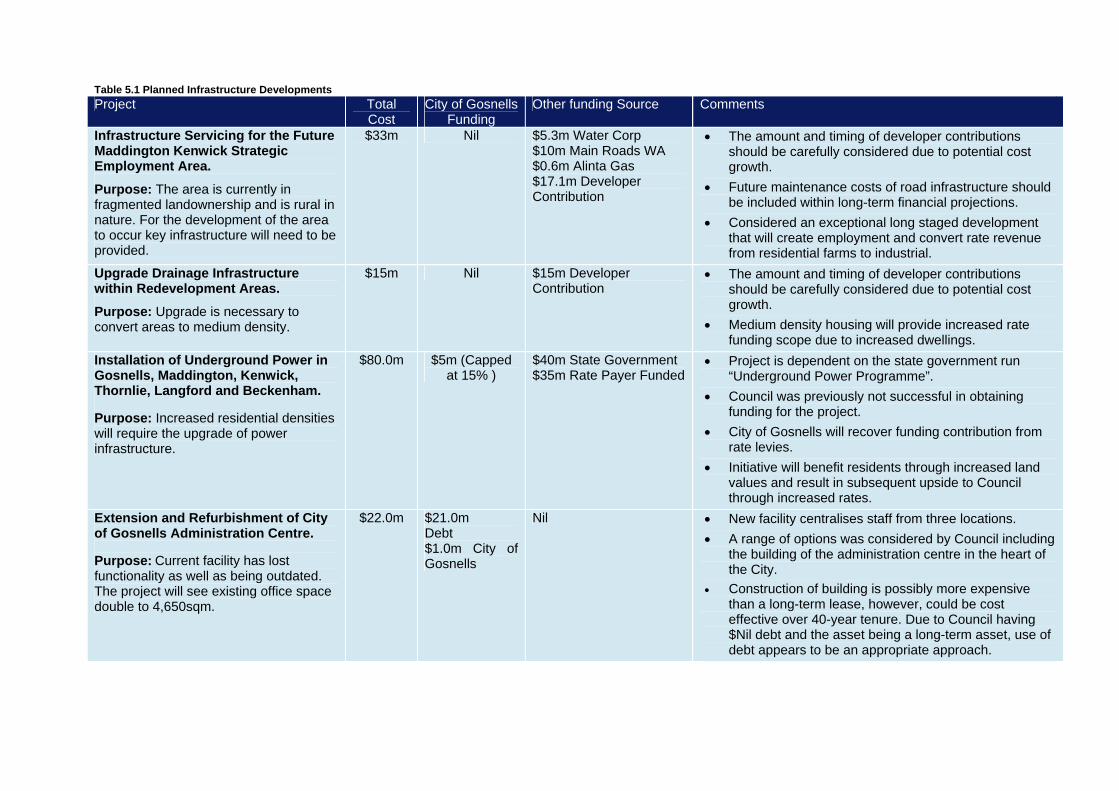
Table 5.1 Planned Infrastructure Developments Project Total
Cost City of Gosnells
Funding Other funding Source Comments
Infrastructure Servicing for the Future Maddington Kenwick Strategic Employment Area.
Purpose: The area is currently in fragmented landownership and is rural in nature. For the development of the area to occur key infrastructure will need to be provided.
$33m Nil $5.3m Water Corp $10m Main Roads WA $0.6m Alinta Gas $17.1m Developer Contribution
• The amount and timing of developer contributions should be carefully considered due to potential cost growth.
• Future maintenance costs of road infrastructure should be included within long-term financial projections.
• Considered an exceptional long staged development that will create employment and convert rate revenue from residential farms to industrial.
Upgrade Drainage Infrastructure within Redevelopment Areas.
Purpose: Upgrade is necessary to convert areas to medium density.
$15m Nil $15m Developer Contribution
• The amount and timing of developer contributions should be carefully considered due to potential cost growth.
• Medium density housing will provide increased rate funding scope due to increased dwellings.
Installation of Underground Power in Gosnells, Maddington, Kenwick, Thornlie, Langford and Beckenham. Purpose: Increased residential densities will require the upgrade of power infrastructure.
$80.0m $5m (Capped at 15% )
$40m State Government $35m Rate Payer Funded
• Project is dependent on the state government run “Underground Power Programme”.
• Council was previously not successful in obtaining funding for the project.
• City of Gosnells will recover funding contribution from rate levies.
• Initiative will benefit residents through increased land values and result in subsequent upside to Council through increased rates.
Extension and Refurbishment of City of Gosnells Administration Centre. Purpose: Current facility has lost functionality as well as being outdated. The project will see existing office space double to 4,650sqm.
$22.0m $21.0m Debt $1.0m City of Gosnells
Nil • New facility centralises staff from three locations. • A range of options was considered by Council including
the building of the administration centre in the heart of the City.
• Construction of building is possibly more expensive than a long-term lease, however, could be cost effective over 40-year tenure. Due to Council having $Nil debt and the asset being a long-term asset, use of debt appears to be an appropriate approach.
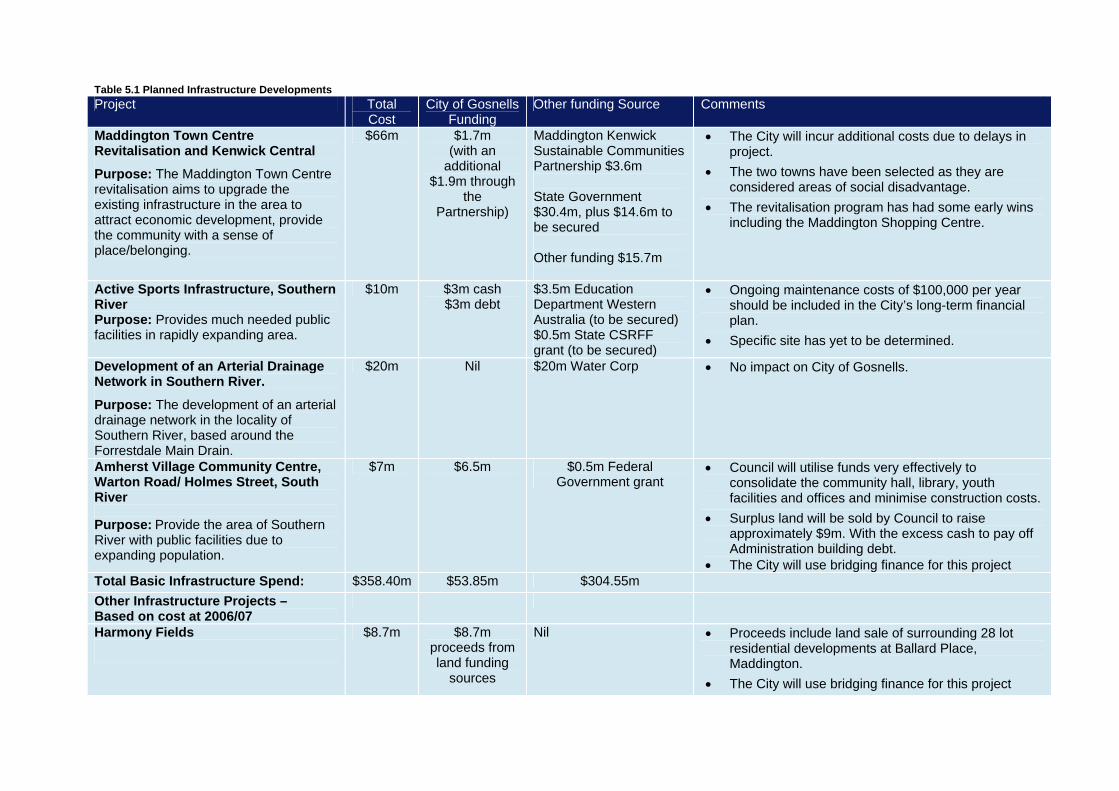
23
Table 5.1 Planned Infrastructure Developments Project Total
Cost City of Gosnells
Funding Other funding Source Comments
Maddington Town Centre Revitalisation and Kenwick Central
Purpose: The Maddington Town Centre revitalisation aims to upgrade the existing infrastructure in the area to attract economic development, provide the community with a sense of place/belonging.
$66m $1.7m (with an
additional $1.9m through
the Partnership)
Maddington Kenwick Sustainable Communities Partnership $3.6m State Government $30.4m, plus $14.6m to be secured Other funding $15.7m
• The City will incur additional costs due to delays in project.
• The two towns have been selected as they are considered areas of social disadvantage.
• The revitalisation program has had some early wins including the Maddington Shopping Centre.
Active Sports Infrastructure, Southern River Purpose: Provides much needed public facilities in rapidly expanding area.
$10m $3m cash $3m debt
$3.5m Education Department Western Australia (to be secured) $0.5m State CSRFF grant (to be secured)
• Ongoing maintenance costs of $100,000 per year should be included in the City’s long-term financial plan.
• Specific site has yet to be determined.
Development of an Arterial Drainage Network in Southern River.
Purpose: The development of an arterial drainage network in the locality of Southern River, based around the Forrestdale Main Drain.
$20m Nil $20m Water Corp • No impact on City of Gosnells.
Amherst Village Community Centre, Warton Road/ Holmes Street, South River Purpose: Provide the area of Southern River with public facilities due to expanding population.
$7m $6.5m $0.5m Federal Government grant
• Council will utilise funds very effectively to consolidate the community hall, library, youth facilities and offices and minimise construction costs.
• Surplus land will be sold by Council to raise approximately $9m. With the excess cash to pay off Administration building debt.
• The City will use bridging finance for this project Total Basic Infrastructure Spend: $358.40m $53.85m $304.55m Other Infrastructure Projects – Based on cost at 2006/07
Harmony Fields
$8.7m $8.7m proceeds from land funding
sources
Nil • Proceeds include land sale of surrounding 28 lot residential developments at Ballard Place, Maddington.
• The City will use bridging finance for this project
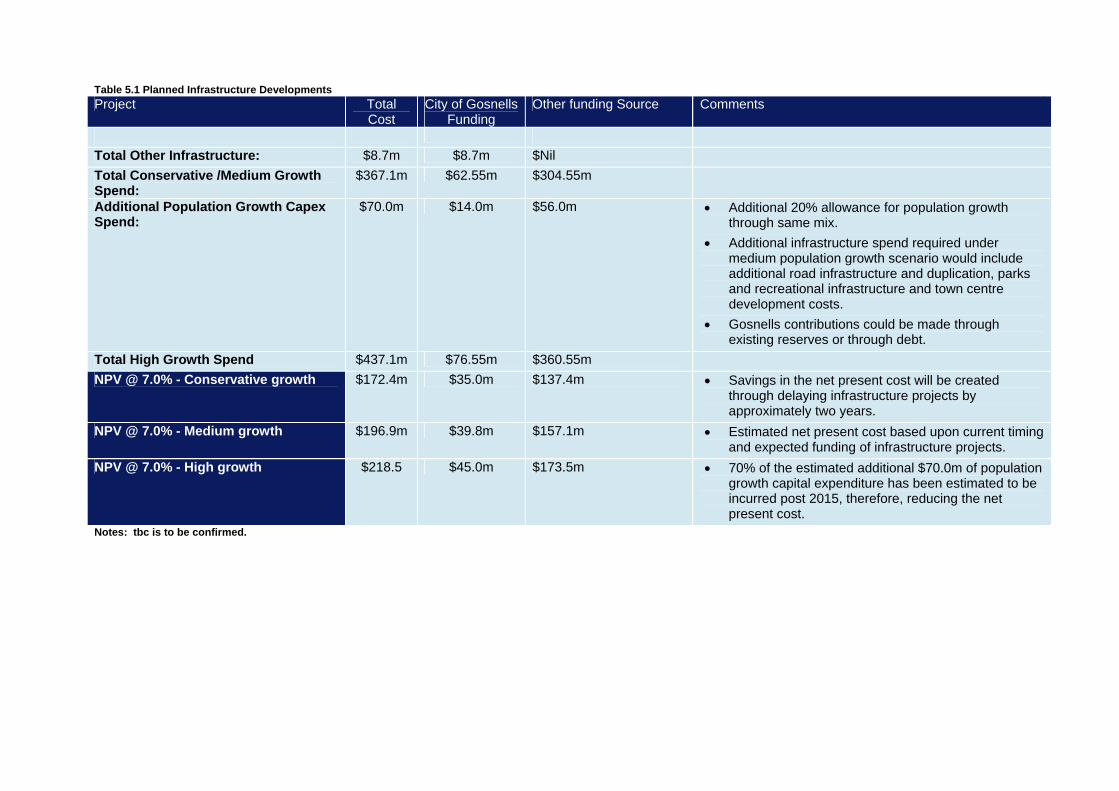
Table 5.1 Planned Infrastructure Developments Project Total
Cost City of Gosnells
Funding Other funding Source Comments
Total Other Infrastructure: $8.7m $8.7m $Nil Total Conservative /Medium Growth Spend:
$367.1m $62.55m $304.55m
Additional Population Growth Capex Spend:
$70.0m $14.0m $56.0m • Additional 20% allowance for population growth through same mix.
• Additional infrastructure spend required under medium population growth scenario would include additional road infrastructure and duplication, parks and recreational infrastructure and town centre development costs.
• Gosnells contributions could be made through existing reserves or through debt.
Total High Growth Spend $437.1m $76.55m $360.55m NPV @ 7.0% - Conservative growth $172.4m $35.0m $137.4m • Savings in the net present cost will be created
through delaying infrastructure projects by approximately two years.
NPV @ 7.0% - Medium growth $196.9m $39.8m $157.1m • Estimated net present cost based upon current timing and expected funding of infrastructure projects.
NPV @ 7.0% - High growth $218.5 $45.0m $173.5m • 70% of the estimated additional $70.0m of population growth capital expenditure has been estimated to be incurred post 2015, therefore, reducing the net present cost.
Notes: tbc is to be confirmed.
PricewaterhouseCoopers
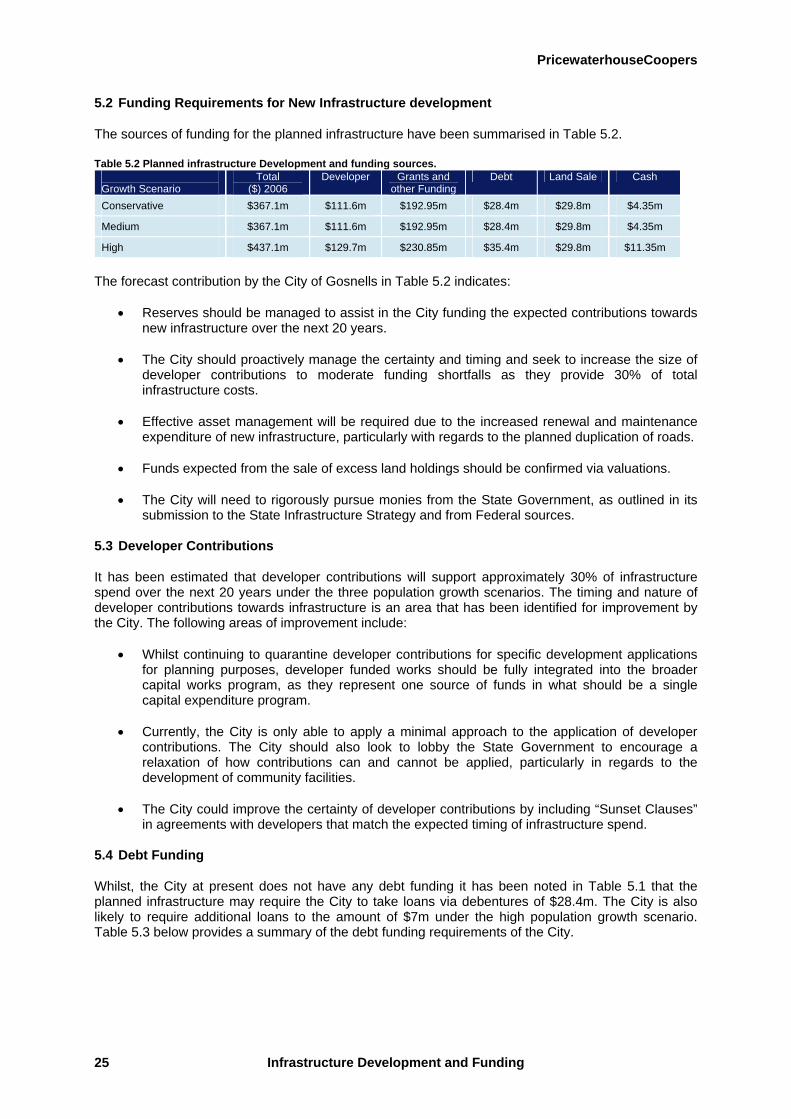
5.2 Funding Requirements for New Infrastructure development
The sources of funding for the planned infrastructure have been summarised in Table 5.2.
Table 5.2 Planned infrastructure Development and funding sources. Growth Scenario
Total ($) 2006
Developer Grants and other Funding
Debt Land Sale Cash
Conservative $367.1m $111.6m $192.95m $28.4m $29.8m $4.35m
Medium $367.1m $111.6m $192.95m $28.4m $29.8m $4.35m
High $437.1m $129.7m $230.85m $35.4m $29.8m $11.35m
The forecast contribution by the City of Gosnells in Table 5.2 indicates:
• Reserves should be managed to assist in the City funding the expected contributions towards
new infrastructure over the next 20 years.
• The City should proactively manage the certainty and timing and seek to increase the size of developer contributions to moderate funding shortfalls as they provide 30% of total infrastructure costs.
• Effective asset management will be required due to the increased renewal and maintenance
expenditure of new infrastructure, particularly with regards to the planned duplication of roads.
• Funds expected from the sale of excess land holdings should be confirmed via valuations.
• The City will need to rigorously pursue monies from the State Government, as outlined in its submission to the State Infrastructure Strategy and from Federal sources.
5.3 Developer Contributions
It has been estimated that developer contributions will support approximately 30% of infrastructure spend over the next 20 years under the three population growth scenarios. The timing and nature of developer contributions towards infrastructure is an area that has been identified for improvement by the City. The following areas of improvement include:
• Whilst continuing to quarantine developer contributions for specific development applications for planning purposes, developer funded works should be fully integrated into the broader capital works program, as they represent one source of funds in what should be a single capital expenditure program.
• Currently, the City is only able to apply a minimal approach to the application of developer
contributions. The City should also look to lobby the State Government to encourage a relaxation of how contributions can and cannot be applied, particularly in regards to the development of community facilities.
• The City could improve the certainty of developer contributions by including “Sunset Clauses”
in agreements with developers that match the expected timing of infrastructure spend. 5.4 Debt Funding
Whilst, the City at present does not have any debt funding it has been noted in Table 5.1 that the planned infrastructure may require the City to take loans via debentures of $28.4m. The City is also likely to require additional loans to the amount of $7m under the high population growth scenario. Table 5.3 below provides a summary of the debt funding requirements of the City.
Infrastructure Development and Funding 25

PricewaterhouseCoopers
Table 5.3 Projected Debt Funding Requirements under the Medium and Conservative Population Growth Scenarios.
Project Start Date Debt Amount Term Est. Rate Type New Administration Building 2007 $21.0m 20 years 6.32% Debenture
New Operations Centre 2007 $4.4m 20 years 6.32% Debenture
Active Sports Infrastructure (Southern River)
2009 $3.0m 20 years 6.32% Debenture
The City’s relative ability to obtain the required debt funding for the planned infrastructure includes its current low levels of debt and significant cash holdings. is excluded, a deficit in operating and asset renewals becomes evident. What this indicates is that the City is spending funds on new assets at the expense of service provision and asset renewal requirements. This indicates an asset renewal backlog which could cause problems in debt management and adequate service provision in the medium to long term if not addressed. The increased levels of debt will require the City to apply further management resources to ensure a cost effective management of the debt. A useful credit management tool the City may wish to implement may include obtaining a formal credit rating from an agency such as Moody’s, Standard and Poor’s and Fitch Rating. These independent assessments provide an insight into the ability of an organisation to meet their obligations of repayment of interest and principal of borrowings. An indicative estimate of the City’s projected credit rating has been calculated based upon Published Infrastructure & Industrial Company Medians (S&P) under both the moderate and conservative population growth scenarios and included in Table 5.4. Refer to a summary of the projected financial ratios that form the basis of the indicative credit ratings, which have been included in Appendix II. Table 5.4- Indicative Credit Rating under the Conservative and Medium Growth Scenarios
Indicative Credit Rating- Estimate2005/06 Forecast 2008/9
Forecast 2013/14
Forecast 2017/18
Forecast 2020/21
Indicative Credit Rating- Conservative AA AA A AA AA
Indicative Credit Rating- Moderate AA AA A AA AA
The indicative credit ratings show the following:
• They reflect the expectation that the City will maintain its robust balance sheet and extremely strong liquidity levels.
• The downgrade from the existing credit rating of AA is a reflection of the expectation that the
Council will continue to record accrual-operating and asset renewal deficits over the medium to long-term.
• Expected operating and asset renewal deficits are attributing to a substantial depreciation
cost. This is an early warning of inadequate maintenance of infrastructure assets and could constrain the City’s credit quality.
• It is estimated that the City could increase the level of borrowings moderately without
threatening its current estimated credit rating profile. In PwC’s experience, a AA credit rating is considered an excellent outcome, with a AAA credit rating being very unusual for a local government to achieve. 5.5 Ability to Attract State and Federal Funding and to Use Those Funds Effectively
It has been estimated that the City will require $192.95m of government grants and other funding to assist in funding the planned infrastructure spend over the next 20 years. This would increase to $230.85m under the high population growth scenario.
Infrastructure Development and Funding 26
PricewaterhouseCoopers
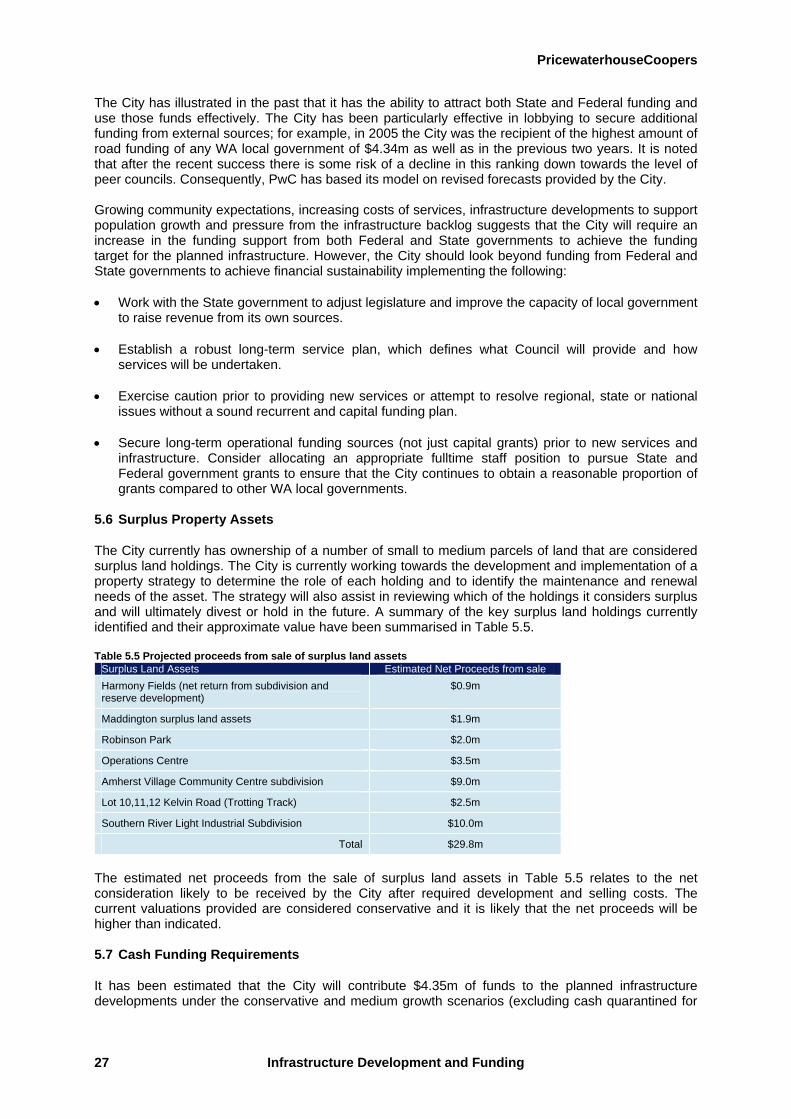
The City has illustrated in the past that it has the ability to attract both State and Federal funding and use those funds effectively. The City has been particularly effective in lobbying to secure additional funding from external sources; for example, in 2005 the City was the recipient of the highest amount of road funding of any WA local government of $4.34m as well as in the previous two years. It is noted that after the recent success there is some risk of a decline in this ranking down towards the level of peer councils. Consequently, PwC has based its model on revised forecasts provided by the City. Growing community expectations, increasing costs of services, infrastructure developments to support population growth and pressure from the infrastructure backlog suggests that the City will require an increase in the funding support from both Federal and State governments to achieve the funding target for the planned infrastructure. However, the City should look beyond funding from Federal and State governments to achieve financial sustainability implementing the following: • Work with the State government to adjust legislature and improve the capacity of local government
to raise revenue from its own sources.
• Establish a robust long-term service plan, which defines what Council will provide and how services will be undertaken.
• Exercise caution prior to providing new services or attempt to resolve regional, state or national issues without a sound recurrent and capital funding plan.
• Secure long-term operational funding sources (not just capital grants) prior to new services and infrastructure. Consider allocating an appropriate fulltime staff position to pursue State and Federal government grants to ensure that the City continues to obtain a reasonable proportion of grants compared to other WA local governments.
5.6 Surplus Property Assets
The City currently has ownership of a number of small to medium parcels of land that are considered surplus land holdings. The City is currently working towards the development and implementation of a property strategy to determine the role of each holding and to identify the maintenance and renewal needs of the asset. The strategy will also assist in reviewing which of the holdings it considers surplus and will ultimately divest or hold in the future. A summary of the key surplus land holdings currently identified and their approximate value have been summarised in Table 5.5. Table 5.5 Projected proceeds from sale of surplus land assets
Surplus Land Assets Estimated Net Proceeds from sale Harmony Fields (net return from subdivision and reserve development)
$0.9m
Maddington surplus land assets $1.9m
Robinson Park $2.0m
Operations Centre $3.5m
Amherst Village Community Centre subdivision $9.0m
Lot 10,11,12 Kelvin Road (Trotting Track) $2.5m
Southern River Light Industrial Subdivision $10.0m
Total $29.8m
The estimated net proceeds from the sale of surplus land assets in Table 5.5 relates to the net consideration likely to be received by the City after required development and selling costs. The current valuations provided are considered conservative and it is likely that the net proceeds will be higher than indicated. 5.7 Cash Funding Requirements
It has been estimated that the City will contribute $4.35m of funds to the planned infrastructure developments under the conservative and medium growth scenarios (excluding cash quarantined for
Infrastructure Development and Funding 27
PricewaterhouseCoopers
future projects funded by developer contributions). The funds will be obtained from existing and future cash reserves. Table 5.6 provides a summary of the current and estimated cash reserves under both the conservative and medium growth scenarios. Table 5.6 Projected Cash Reserves35
Whilst it is estimated that the City will have sufficient cash reserves to fund future infrastructure requirements, it is essential that an ongoing monitoring and forecasting process is in place to ensure that any funding gaps are managed.
Estimated Cash Reserves Actual 2005/06
Forecast 2008/9
Forecast 2013/14
Forecast 2017/18
Forecast 2020/21
Conservative Growth $22.5m $19.8m $53.8m $63.5m $66.3m
Medium Growth $22.5m $23.1m $56.6m $67.3m $70.1m
35 All amounts are in $’000 dollars as at 2006 and have not been discounted.
Infrastructure Development and Funding 28
PricewaterhouseCoopers
6 Asset Maintenance and Renewal
6.1 The Current Infrastructure Base
The City has an asset maintenance policy for undertaking asset management in a structured and co-ordinated way enabling full lifecycle costing of facilities and assessing the feasibility and cost of their future replacement. The policy complements and builds upon the City’s Strategic Plan for the Future 2007-2010 and provides a more formalised approach to asset management, principles and methodology. It also provides the City with the ability to plan for present and future generations, an essential ingredient to achieving the City’s vision for asset management. Table 6.1 provides a snapshot of the assets being managed by the City: Table 6.1 City of Gosnells- Assets under Management
1 Administrative Centre 1 Operation Centre
6km Gravel Roads 1 Cemetery (closed)
698km Sealed Roads Stormwater Drainage (Pipes/Pits)
390,000 m2 Footpaths Catchments
761km Kerbing 9,200 Street Lights
13 Road Bridges Street Signs
45 Footbridges/Boardwalks Street Furniture
24 Major Culverts Bus Shelters
140 Buildings/Amenities Plant & Equipment
346 Parks & Recreation Reserves Light Fleet
Vacant Land Furniture & Fittings
Road Reserves IT Equipment
The results of an Access Economics sustainability study conducted at 30 June 2005 stated the total value of the City’s non-financial or physical assets was valued at $326.3m. The City is currently embarking on a period of strong population growth and the expected level of assets under management is estimated to double over the next 20 years. As a result, the City will need to ensure that it has adequate financial resources to fund future maintenance and renewal costs in the future. 6.2 Available Funds for Resource Model Allocation
At present, the City has a well-structured process in place to allocate funds to potential capital expenditure each year. The process is included within the yearly budget setting process and involves the assessment and ranking of each potential project taking into account the following factors:
• Relevance to the Strategic Plan for the Future
• Business efficiency and improvement
• Community benefit An audit panel consisting of City staff assesses the ranking assigned to each project. Once the audit panel is satisfied, the projects are then placed into the RAM, which weights the projects on a cost/benefit basis and provides an order of buy. The capital budget considered available for RAM identified in the ten-year financial model is then allocated to the projects with the highest ranking until all resources are utilised. Overall the RAM allocation process is considered amongst better practice approaches but has some scope for refinements. The strengths, weaknesses, opportunities and threats (SWOT) of the RAM process have been summarised in Table 6.2.
Asset Maintenance and Renewal 29
PricewaterhouseCoopers
Table 6.2 SWOT analysis of RAM Allocation Strengths
• Renewals expenditure is separated so existing assets are kept fit for purpose.
• The process is self-regulating so it ensures that the amount spent is affordable by capping it at free cash flow.
• Ensures that committed projects get finished.
Weaknesses • Could be biased against large projects. • Ranking system has some subjectivity. • No system to ensure that the amount of capital
committed for RAM is appropriate/prudent. • Amount spent on renewals may not be
adequate.
Opportunities • Debt could be considered more regularly as a
potential funding source. • Review RAM to ensure the necessary and prudent
amount of capital required to sustain assets is made available (rather than providing a tool to contain new capex to free cash flow after approved projects).
Threats • Risk that critical spend is deferred if free cash
flow inadequate. • As a large percent of free cash flow is sourced
from depreciation there is a risk that depreciation from existing assets is spent on new services, which will in turn further increase the City’s asset base and therefore require additional long-term renewals expenditure.
6.3 Current Approach and Renewals Expenditure
One of the major financial problems facing local governments throughout Australia is the infrastructure renewals backlog. This is often driven by the difference in growth rates between operating expenditure and operating income. According to the results of the Access Economics sustainability study conducted at 30 June 200536, the City’s infrastructure backlog is one of the lowest compared to its peers. The results of the sustainability study estimated that the total value of the City’s past shortfalls in renewals expenditure on existing assets relative to the required expenditure to keep the assets in optimum condition was $17.2m or 5% of non-financial assets. This is a considerably strong performance given that close to 75% of all WA councils have an infrastructure backlog that was greater then 10% of their non-financial assets37. To optimise the life of infrastructure, the City is in the process of undertaking a detailed review of the maintenance and renewal costs over extended timeframes so that the financial resources will be available to fund the required renewal costs. This project is part of the City’s wider program of improved asset management and financial sustainability. Nationally, local governments are recognising the severity of years of under-investment in asset renewal. The City has been proactive in tackling this issue by participating in the pilot asset management initiative the ‘Western Asset Management Improvement’ program and by commissioning this study. PwC in its national study on the financial sustainability of local governments, commissioned by the Australian Local Government Association (ALGA), identified a strong role for the Federal Government to help address this issue through the development of a ‘Local Community Infrastructure Renewals Fund’38. This fund would, if adopted by the Federal Government, assist in:
• Addressing the growing backlog in existing community infrastructure in order to support community activities and life on a local scale
• Leveraging off improvements to Asset Management Plans and increasing the capacity of
councils to effectively manage their asset base
• Communities gaining more value and use of the existing infrastructure
36 Access Economics (2006) Financial Sustainability Tables and Charts, The City of Gosnells. 37 Access Economics (2006) Local Government Finances in Western Australia. 38 National Financial Sustainability Study of Local Government Commissioned by the Australian Local Government Association- PricewaterhouseCoopers, November 2006
Asset Maintenance and Renewal 30
PricewaterhouseCoopers
• Creating a new income stream to support the renewal of community infrastructure (and complement R2R funding support for roads renewals and the support from water user charges in funding water and sewerage renewal activity)
• Enabling local government to lift the state of its entire asset base, to broaden the focus on
asset renewals
• Building on the success of R2R, and
• Providing a significant boost to the long-term sustainability of the local government sector. The City should consider lobbying the Federal government to develop this fund and to seek to secure financial assistance from it to fast track addressing the City’s backlog in the renewal of community buildings. PwC notes that the City should also ensure that it continues to focus on infrastructure renewal to assist in minimising the infrastructure backlog as well as monitoring key sustainability issues such as:
• Avoiding material (underlying) operating deficits • Ensuring a relatively high rate effort
• Retaining prudent interest cover ratio, and
• Encouraging business and population growth to stimulate increased rates and user charges.
6.4 Roads Maintenance
Of the infrastructure maintenance requirements placed upon the City, the development and maintenance of local roads is one of the most capital intensive. The City currently has approximately 1700 roads, which are approximately 704km in length. This City is being proactive in ensuring that a robust renewals process is in place to assist in the reduction of the infrastructure backlog. The City is in the process of undertaking a modelling exercise to assist in determining the level of renewals spend that is required to prevent an accelerated deterioration of asset condition. Whilst the modelling exercise is still in the preliminary stages, historic and budgeted infrastructure spend in Table 6.3 illustrates an under-investment in roads renewal expenditure. Table 6.3 City of Gosnells Road Renewals Spend39
Average Spend 2001-2005
2005/06 Actual Renewal
Expense
2006/07 Budgeted Renewal Expense
Councils Estimated required additional spend required per
year
PwC estimated required annual
Renewal Expenditure
(steady state) Roads $1,508 $2,292 $1,405 $1,500 $3,108
PwC’s estimated required annual renewal spend in Table 6.3 is based upon periodic renewals expenditure of the City’s 704km road network. The estimate has been based upon resealing sealed roads, which costs around $20,000/km every 20 years and renewal of pavements along sealed roads, which costs around $160,000/km and would be required every 50 years. The estimated annual spend of $3.1m represents what the City’s average steady state expenditure and reserve requirements is estimated to be for the life of the existing road network. Current expenditure is less than the steady state level as most of the City’s roads are at an average age of 10-20 years. The City under its current asset management improvement process will be able to more accurately establish the life cycle of road assets and predict renewal requirements based on different rehabilitation techniques for different road classifications in the short to medium term.
39 All amounts are in $’000 dollars and have not been discounted.
Asset Maintenance and Renewal 31

PricewaterhouseCoopers
Through review of the City’s Ten-Year Financial Plan, additional reserves have been included for road renewals expenditure as the City recognises this will need to be increased from the current level towards PwC’s estimated level. Factors that will influence the renewal expenditure in the future will include:
• Projected population growth, which will increase road infrastructure usage resulting in the accelerated deterioration of asset condition.
• Infrastructure plans include the duplication of major roads. Therefore, road renewal
expenditure will become increasingly important as the road network expands. In addition to increasing roads renewal expenditure, Table 6.3 also illustrates that historical spending has been subject to ad-hoc fluctuations. In recognition of this, the City has initiated an asset renewal modelling process to prevent ad-hoc spending and ensure that road renewal expenditure is increased to a sustainable level. Through undertaking the review of the gap in renewal funding, the City has recognised the importance of implementing a uniform approach to renewals expenditure and is in the process of putting in place a strategic renewal strategy to avoid serious escalation of maintenance costs and serious degradation in the level of infrastructure service over the next 20 years. The City’s focus on renewal and routine maintenance of infrastructure assets is a reflection of the strong and robust asset management plan that has been put in place by City management. The plan is continually being updated on an asset-by-asset basis to ensure it meets best practice standards. A recent study by Austroads recognises that there are opportunities to improve the practice of road infrastructure asset management40. Some of the steps towards best practice identified in the publication that the City may seek to implement include:
• A more detailed understanding of the needs and expectations of road users, and the ability to correlate user aspirations with road and bridge construction and maintenance standards.
• The study of road user costs, and the development of tools to develop cost effective
construction and maintenance standards that take road user costs into account. • Developing deterioration models for a range of pavement types for different scenarios such as
changes in traffic volumes, increases in axle limits, a range of climatic conditions. • Collecting and recording quality affordable road and bridge inventory and condition data. • The development and use of tools to confidently predict the remaining service life of the major
components of a road asset, particularly road pavements and bridges. • The ability to demonstrate future actions and budgets that are required to maintain the road
network to a standard that will provide a satisfactory level of service to road users. • Conducting internal and external performance measurement and benchmarking.
6.5 Buildings Renewal Expenditure
The City currently owns approximately 140 building assets with responsibility for their maintenance and operations. The City is comprehensively reviewing its building portfolio as it has a large number of properties that have low occupancy levels and are under utilised as well as a number of buildings that currently do not meet community service levels. In addition, many of the buildings are at the end of their useful life cycle.
40 Austroads publication "Integrated Asset Management Guidelines for Road Networks", AP-R202/02 accessed at http://austroads.com.au.tmp.anchor.net.au/asset/pdf/AM_Process_Flow_Diagram.pdf
Asset Maintenance and Renewal 32

PricewaterhouseCoopers
As a part of this review process, the City has commenced a program to demolish those buildings that do not fit into the City’s long-term strategy and replace these with buildings that provide contemporary services and are well utilised and efficient to operate. This is likely to involve co-locating community and sporting groups to reduce the total number of buildings operated by the City, improving their utilisation rates. It is envisaged that the buildings that are retained will be renewed and revitalised. As part of this renewal process it is expected that properties will be redeveloped to incorporate environmental and sustainability design enhancements (e.g. energy efficiency improvements, water recycling and universal design). This will help to ensure that the buildings remain relevant in the longer term and reduce energy costs. The City has estimated that the current replacement value of its property portfolio is approximately $117m. The City is developing a defined building renewal expenditure strategy, which identifies the level of maintenance and renewal expenditure needs of each property. Currently, there is a shortfall in building renewal expenditure as outlined in Table 6.4. Table6.4 City of Gosnells Buildings Maintenance and Renewals Spend41
Average Annual Renewal &
Maintenance Spend
Total Estimated Replacement Value
Required Average Building Spend at 2.5%
(steady state)
Buildings $1,250 $117,000 $2,925
The table illustrates a historic under-spend in building renewal and maintenance expenditure. The estimated annual spend of $2.9m represents what the City’s average steady state expenditure and reserve requirements should be for the existing portfolio of buildings with an estimated useful life of 40 years. The City should ensure that buildings renewal expenditure and reserves for future renewals are incorporated within the current review of building ownership and any future redevelopment programs. 6.6 Plant and Equipment and Other Assets Renewal Expenditure
The City currently owns plant and equipment and other assets (PE&O) that are used in the day-to-day operations of the organisation. The City’s PE&O includes engineering, waste, construction, parks, fleet vehicle and information technology assets. The City has a detailed PE&O renewal expenditure strategy which allocates maintenance and renewal expenditure during the yearly budget allocation process. The estimated renewal expenditure has been outlined in Table 6.5. Table 6.5 City of Gosnells PE&O maintenance and Renewals Spend42
06/07 budget 05/06 Budget Plant Maintenance 1,827,967 1,607,503
Capital expenditure on plant 2,833,100 2,884,370
Furniture and Equipment 640,711 1,314,280
Other PE&O nil 488,000
Total 5,301,778 6,294,153
Table 6.5 illustrates the recent spend on PE&O maintenance and renewals expenditure. The table also contains the capital expenditure as these assets typically have a shorter life and the City regularly replaces equipment preferring for most equipment to be ‘in warranty’ which minimises maintenance costs and provides better reliability. The annual capital spend on plant has been $2.8m over the past two years which is slightly above the City’s average steady state expenditure and reserve requirements should be for the existing PE&O with an estimated useful life of four years. For the purpose of the City’s 20 year financial model, an allocation of $1.5m from 2005/06 (growing by 5% pa) has been made as a reserve allowance for future PE&O maintenance and renewal expenditure into forward looking financial RAM projections over an above existing PE&O expenditure. This reserve allowance should fund the bulk of the City’s current PE&O projections.
41 All amounts are in $’000 dollars as at 2006 and have not been discounted. 42 All amounts are in $’000 dollars as at 2006 and have not been discounted.
Asset Maintenance and Renewal 33
PricewaterhouseCoopers
6.7 Depreciation and Renewals Expenditure
Depreciation is a major cost to the City as it represents 26% of all operating costs. The accuracy of the reported depreciation costs is an area that the City should continually seek to improve. The $11m depreciation on an asset base of $326m indicates an average straight-line rate of 3.33% (equating to an average life of 30 years). Depreciation expense can be under or overstated due to the asset values being above or below fair value or due to depreciation rates also being low or high. Depreciation rates accuracy issues are often indicated through differences between the level of asset renewals expenditure and the level of depreciation expense. The historic and projected depreciation and renewals expenditure of the City have been summarised in Table 6.6. Table 6.6 Depreciation compared to Renewals Expenditure.43
Actual 2004/05
Actual 2005/06
Budget 2006/7
Forecast 2007/08
Forecast 2017/18
Forecast 2020/21
Deprecation expense (10,946) (13,161) (13,170) (14,520) (21,453) (27,381)
Road renewals expenditure 878 2,292 1,900 1,244 3,975 4,286
Plant and equipment renewals expenditure
1,111 1,527 3,064 3,126 4,465 4,915
Building renewals expenditure 1,250 1,250 1,250 1,250 2,801 3,135
Variance (7,707) (8,092) (6,956) (8,900) (10,212) (15,045)
This table illustrates that the City’s asset renewals spend is considerably less than the depreciation expense. This gap illustrates that additional renewals spend should be incurred to ensure that existing assets are being maintained in conjunction with their relative decline in value. Alternatively, the gap could indicate that the depreciation rate does not accurately reflect the actual decline in value of the asset. The City should undertake a further analysis of this gap. The City should ensure that renewals expenditure and reserves for future renewals are adequate and accurate before surplus funds in the RAM model are spent on expanding the City’s asset base. Spending surplus funds on new services before meeting depreciation expense will further increase the asset base of the City. This increase will require additional long-term renewals expenditure without recognising the decline in value of the City’s current assets. The City is being proactive in improving data for asset management plans, depreciation, and renewals estimates to ensure that the renewals expenditure is more robust, uniform, and accurate. Due to this, the City is advised to appraise the extent of funding gaps, optimal renewals spend, and quantify any backlogs, which may be present. The City should develop a plan to improve performance in this area over the medium term.
43 All amounts are in $’000 dollars as at 2006 and have not been discounted.
Asset Maintenance and Renewal 34
PricewaterhouseCoopers
7 Other Assets and Major Projects Potentially Requiring Future Capital Expenditure
The City currently has assets that will require further asset maintenance in future periods. The City is currently undertaking an assessment of the requirements for future capital expenditure and undertaking a systematic process of reviewing the requirements of each asset and how they complement and build upon the City’s Strategic Plan for the Future 2007-2010. 7.1 Leisure World
The City is currently undertaking a strategic review of the most appropriate way to refurbish and reform operations of the Leisure World’s gymnasium and fitness facility. The facility was opened in 1993 contains a 25 metre indoor pool (including swim school), a spa/sauna/steam room, a fully equipped fitness centre (including aerobic room, creche and café). The provision of an affordable local swimming pool has strong public interest and community benefits. Many local governments provide a swimming pool, as it is unusual for such facilities to be provided by the private sector without government funding support with broadly open community access. However, there are potential roles that could be viable for a private operator in managing a swimming pool on behalf of a local government. However, the private sector market for fitness centres (with aerobics, creches and cafés) is far deeper and more competitive. In Perth’s south east metropolitan region there are a variety of private sector companies that operate gymnasium and fitness facilities. The Leisure World fitness facility when compared with leading Perth private sector fitness centre operations is not as financially viable or well patronised. PwC recommends that the City could consider introducing private sector management across the whole Leisure World facility. Such an arrangement could still retain strong public interest and community benefits of a local pool by specifying future maximum price levels for pool entry and minimum community access arrangements for the pool. Additionally, the private sector could take maintenance and refurbishment accountability for both the gym and pool facilities. It is recommended that this option be included in the forthcoming Leisure World review. 7.2 Protection of Regionally Significant Conservation Areas in Southern River
Approximately 270 hectares of regionally significant vegetation, including various wetland areas, have been identified by the Western Australian Government through the Bush Forever Program as needing to be set aside for conservation purposes in the context of new urban development. The protection and enhancement of Bush Forever Sites is consistent with the Western Australian Planning Commission’s Draft Statement of Planning Policy 2.8 – Bushland Policy for the Perth Metropolitan Area. Capital investment will be required to ensure the protection and appropriate management of these regionally significant conservation areas and to enable proper integration into the surrounding urban form. The sources of funding have not yet been determined, however, given that the program is a State government initiative, the expected financial impact on the City should be largely mitigated by State government support. 7.3 Nicholson Road Railway Station, Canning Vale
Whilst the eastern sector of the City is well serviced by passenger rail with stations at Beckenham, Kenwick, Maddington and Thornlie, the City is keen to see the service extended to Nicholson Road to cater for the growing suburbs of Canning Vale and Southern River. These localities are experiencing rapid growth and are now at the development front of the south east corridor of the Perth Metropolitan Region. The City has undertaken a significant amount of prior planning to ensure that when the Nicholson Road station is constructed, it will be appropriately integrated with higher density development and a mix of appropriate land uses in a transit oriented design.
Other Assets and Major Projects Potentially Requiring Future Capital Expenditure 35
PricewaterhouseCoopers
The Nicholson Road railway station will provide an attractive and viable alternative transport mode to Canning Vale, which is currently dominated by unsustainable private vehicle use. The approximate cost of constructing the Nicholson Road railway station and extending the Thornlie spur line to the station is $25m to $35m. The State government could fund this project using similar approaches to those used for the New Metro Rail project and capital costs to the City are not expected to be significant. Given the considerable benefits to the City arising from the proposed new railway station, it is recommended that as a high priority, further analysis of the benefits of this extension be undertaken and presented to the State government. 7.4 Additional Urban Regeneration Project
Part of the City’s Strategic Plan for the Future 2007-2010 is to regenerate the City’s older suburbs. It is generally understood that the City will, upon completion of the Maddington Kenwick Sustainable Communities Partnership, undertake a third regeneration project of the City’s older suburbs. This project is still to be scoped and considered by the Council. It is estimated that seed funding of around $5m from Council (2007 dollars) would probably be required.
Other Assets and Major Projects Potentially Requiring Future Capital Expenditure 36
PricewaterhouseCoopers
8 Forward Looking Reforms
The City should continue to seek to improve its efficiency and effectiveness as an individual local government. Whilst this is the case, the City should also advocate for change in the industry, without this the City will be limited in how far it can improve. This section calls for a range of reforms in State and Federal government management and the funding of the local government industry, as outlined in PwC’s study of the National Financial Sustainability Study of Local Government Commissioned by the Australian Local Government Association. 44 This approach is also broadly consistent with the views of the WA Systemic Sustainability Study Taskforce members.
“The industry needs to recognise sooner rather than later that changes must be made” Ricky Burges Systemic Sustainability Study Taskforce Member45
Over the past decade, there has been a growing awareness and some progress across the sector about the need to improve the efficiency and sustainability of local government. Some larger local governments have stronger financial positions to fund new services whilst others are stretching themselves beyond their financial capacity to deliver a growing number of services and infrastructure. Local governments in a stretched financial position that have diversified into non-traditional services with the subsequent additional costs, are often partly funding the new services by deferring maintenance and renewals on community infrastructure. This has benefits to users of these new services but create a risk of developing a significant renewals backlog. The requirement to undertake industry and individual local government reform is necessary to enhance and improve financial efficiency and effectiveness of the weaker councils whilst providing well performing councils with additional incentives to continue and strengthen best practice. 8.1 Benchmarking Financial Performance
The full merit of a benchmarking process is much more than obtaining a one-off view on performance against peers. There is a significant amount of research from a range of entities including the Certified Institute Public Finance and Accountancy (CIPFA) which emphasise that the true merit comes from obtaining a deep understanding of the factors behind the results and then undertaking a process to identify and achieve better levels of performance. ‘Benchmarking is the process of searching for, and achieving, excellent levels of performance. This is achieved through a systematic comparison of performance and processes in different organisations, or between different parts of a single organisation, to learn how to do things better. Its purpose is continuous improvement in levels of performance, by identifying where changes can be made in what is done, or the way in which things are done.’
Benchmarking to improve performance, CIPFA
The differences in the financial strength and the diversity in service levels of local councils in Western Australia demonstrate the importance of improving the transparency of local government information so that there is an improved system to benchmark council performance. Benchmarking can provide an effective tool to enable local governments to promote continuous service improvement through a rigorous comparison of their performance with other local governments. It should involve setting standards of best practice, and identifying best performances, in order to be able to place the performances of WA local governments in context. One of the objectives of formally introducing benchmarking is to identify best practices of organisations with a reputation for excellence. Given the constraints facing WA local governments it is suggested that a core group of indicators could be developed then expanded over time (e.g. The WALGA road benchmarking report could be expanded to further include other council operating KPIs).
44 National Financial Sustainability Study of Local Government Commissioned by the Australian Local Government Association- PricewaterhouseCoopers, November 2006. 45 SSS Taskforce Bulletin – Issue No. 3, Western Australian Local Government Association.
Forward Looking Reforms 37
PricewaterhouseCoopers
It is also suggested to keep benchmarking achievable and relevant in its early development stages of becoming demonstrable and measurable that quartile ranking of local government performance should be used. Remote and rural shires could be encouraged to self-assess against relevant peer councils. The ability to compare the operating performance of local governments through benchmarking could be significantly improved through the establishment of a Perth or WA based local government benchmarking process. The introduction of this process could stimulate greater analysis and a better understanding of performance and to assist in the implementation of best practice. NSW is one example of a state that has already successfully implemented a similar benchmarking process called Local Government Reform – Promoting Better Practice” which acts as a ‘health check’, giving a council confidence about what is being done and helping to focus attention on key priorities46. The process has a number of objectives: • To generate momentum for a culture of continuous improvement and greater compliance across
local government • To provide an ‘early intervention’ option for councils experiencing operating problems • To promote good governance and ethical conduct principles • To identify and share innovation and good practice in local government • To enable the Department of Local Government and Regional Development to use review
information to feed back into its work in identifying necessary legislative and policy work for the local government sector.
In addition to the Promoting Better Practice program, the NSW Department of Local Government also produces an annual report that provides comparative information on the performance of all local councils. It is designed to assist both the community and councils to assess the performance of their local government across a broad range of activities and compare its performance with others. This enhanced transparency and public accountability would assist WA councils to develop performance benchmarks and industry best practice models. The Local Government Advisory Board could also use benchmarking performance in the assessment of boundary change when it assesses a proposal in relation to the ‘Effective Delivery of Local Government Services’. PwC acknowledges that evaluating local government financial sustainability and relative performance is challenging. This is primarily due to a diversity in management techniques and ability to raise own source revenue by virtue of factors such as location, the existence or otherwise of regional centres and industrial areas. Examples of this include differences in:
• Ability to raise appropriate levels of rate revenue and issue service charges
• Rate assessment methodologies
• Asset depreciation rates
• Accounting for costs such as staff
• Predicting asset maintenance and renewal costs
• Capacity to attract competitive state and federal grants
These differences mean that comparing performance between local governments is not an exact science. It is also not easy to prepare long term financial plans because of this diversity and a rapidly evolving understanding of how best to maintain assets. For example the level of service that a local
46 Local Government Reform – Promoting Better Practice accessed at http://www.dlg.nsw.gov.au/dlg/dlghome/dlg_LGR_PBP.asp
Forward Looking Reforms 38
PricewaterhouseCoopers
government decides to maintain its road infrastructure at can significantly increase or decrease the perceived backlog. Overtime, asset managers and the industry will be able to more accurately predict maintenance and renewal spends, however, in the meantime there remains a degree of uncertainty in the numbers.
Despite the existence of these issues, PwC and the City strongly contend that benchmarking is critically important as it promotes discussion within and outside an organisation about how best to manage its resources. From an industry wide perspective in the longer term it will:
• Promote greater consistency in critical accounting and asset management methodologies
• Encourage improvements in performance
• Develop a greater understanding of the industry
There is merit in addressing the absence in Western Australia of detailed industry wide benchmarking and methodologies in key areas of accounting and asset management. This remains the case even though in the medium term some local government performance may be significantly influenced by their accounting and asset management methodologies rather than actual good or poor performance. Overtime, by committing to the process, the industry will improve indicators and management methods to develop more accurate and meaningful measures by size of council. This process can provide benefits for local governments and more importantly local communities.
“Benchmarking provides an effective tool to enable local authorities to promote continuous service improvement through a rigorous comparison of their performance with that of other providers. These can be service providers in similar public sector bodies, within the private sector, or within the voluntary sector.”
Join the Club? Benchmarking for Best Value I&DeA improvement and development agency
8.2 Financial Assistance Grants
The process used by the State government to allocate funding could also assist in improving the efficiency and sustainability of local governments. An option worth considering is to improve the Financial Assistance Grants (FAGs) allocation process by the WA Government Grants Commission. This process has remained largely unchanged for decades. A suggested improvement could be to allocate a minor part of the WA FAGs allocation to reward local governments who record “top quartile” improvements in performance, the additional funding could then be used for activities such as staff training in capital project appraisal, asset management planning and project management. This approach would reward relative improvement rather than just the strongest financial performers. 8.3 Potential Reform Areas
A sizeable proportion of councils, including the vast majority of the larger ones, have made significant progress in recent years in making themselves more efficient. Efficiency reforms can be further achieved through the following approaches:
• Improving efficiency, effectiveness and scale via approaches such as regional or shared service provision, outsourcing, use of state wide purchasing agreements. The City is already considering reforms via activities such as reviewing the provision of waste management through the South East Metropolitan Regional Council. The City could have greater collaboration with neighbouring councils to pool resources in road and park maintenance. Through working with neighbouring councils it would be possible to achieve further economies of scale through the implementation of cost and facility sharing initiatives.
Forward Looking Reforms 39
PricewaterhouseCoopers
• Expanding own-source revenue by working with the State government to remove or relax legislative impediments and improve the capacity of local government to raise revenue from its own sources. The City could apply commercial principles to increase and broaden the user charges base.
• Set clear and appropriate priorities through establishing a robust long-term service plan, which
defines what Council will provide and how services will be undertaken. • Exercise caution prior to stepping in to attempt to resolve regional, state or national issues
without a sound funding plan (which includes potential for cost shifting). The City can achieve this through securing long-term funding (not just capital grants) prior to new services and infrastructure.
• Assess merit of reforms to developer contributions as outlined in section 5.3.
• Progressively increase rates towards the average levels, on a per capita basis, for Perth
Metropolitan local governments. • Deepen asset management and financial capacity. Achieve this through working with other
spheres of government to facilitate improved asset management and financial skills through government-funding programs, to lift the overall technical skills in local governments to a reasonable base level. Use total asset management plans and systems to better manage asset renewals and replacement, and integrate into broader long-term council objectives. Undertake more regular asset condition reporting for key infrastructure. Develop nationally consistent local government financial and asset management data.
Forward Looking Reforms 40

PricewaterhouseCoopers
9 Recommendations
The key Recommendations from this report are summarised and listed under each chapter heading.
Chapter 2 Population Growth Scenarios to 2027
• Whilst PwC has projected total population growth to assist with financial planning, the City should also consider undertaking further analysis of the demographic make up of that population. The type of people attracted to the City would have different demands and expectations for local government services.
• It is recommended that the City regularly monitor population growth to ensure amendments to financial planning and infrastructure development can be made in a timely fashion, in the event that the high population growth scenario was to become a reality.
Chapter 3 Financial Planning Implications of Growth
• The City should be able to periodically fund higher capital expenditure than suggested under the RAM. This could be achieved through the use of special levies, or debt, with the later especially relevant if the expenditure relates to a critical long life assets which have a revenue stream.
• A tool the City may wish to implement is obtaining a formal credit rating from an agency such as Moody’s, Standard and Poor’s and Fitch Rating.
• Funding of the required infrastructure will be obtained through a mix of government grants, developer contributions, debt and cash reserves. The City could consider the following approaches:
- Strategies to increase commercial and industrial property numbers and subsequent rates base. The City is currently in the process of revitalising existing commercial centres to encourage office space development and the development of a major industrial area in Maddington and Kenwick. This will also create much-needed local jobs, particularly for young people.
- Undertaking further scenario planning to further evaluate the exact nature of the extra capital expenditure required in the event of population growth is 2.5% or higher.
- Reserves should be managed to assist in the City funding the expected contributions towards new infrastructure over the next 20 years.
- Improving the certainty of developer contributions by including “Sunset Clauses” in development approvals so it is possible to match the expected timing of developer contributions and infrastructure spend.
- Consider allocating an appropriate fulltime staff position to pursue further State and Federal government grants to ensure that the City continues to obtain a reasonable proportion of grants compared to other WA councils.
- Maintaining a robust balance sheet and liquidity levels to strengthen the City’s strong credit rating.
Recommendations 41

PricewaterhouseCoopers
• PwC has also identified a historic under-spend in building renewal and maintenance expenditure. The City should allocate additional reserves and expenditure to building maintenance to prevent the development of a backlog of renewals work.
• The City should also ensure that it fully analyses and reconciles the difference between asset renewals spend and depreciation levels of existing assets before surplus funds in the RAM model are spent on expanding the City’s asset base.
• The City should re-evaluate optimal residential rate levels as well as seek to increase the commercial and industrial rate base.
Chapter 5 Infrastructure Development and Funding
• The City should proactively manage the certainty and timing and seek to increase the size of developer contributions to moderate funding shortfalls as they provide 30% of total infrastructure costs.
• Effective asset management will be required due to the increased renewal and maintenance
expenditure of new infrastructure, particularly with regards to the planned duplication of roads. • Funds expected from the sale of excess land holdings should be confirmed via valuations. • The City will need to rigorously pursue monies from the State Government, as outlined in their
submission to the State Infrastructure Strategy and from Federal sources. • Whilst continuing to quarantine developer contributions for specific development applications for
planning purposes, developer funded works should be fully integrated into the broader capital works program, as they represent one source of funds in what should be a single capital expenditure program.
• Currently, the City is only able to apply a minimal approach to the application of developer
contributions. The City should also look to lobby State government to encourage a relaxation of how contributions can and cannot be applied, particularly regarding the development of community facilities.
• The City could improve the certainty of developer contributions by including “Sunset Clauses” in
agreements with developers that match the expected timing of infrastructure spend.
Chapter 6 Asset Maintenance and Renewal
• The accuracy of the reported depreciation costs is an area that the City should continually seek to improve.
Chapter 7 Other Assets and Major Projects Potentially Requiring Future Capital Expenditure
• PwC recommends that the City should consider private sector management of the Leisure World facility but this would be subject to maximum prices for pool entry and minimum community access arrangements. Additionally, the private sector could take maintenance and refurbishment accountability for the facility. It is recommended that this option be included in the forthcoming Leisure World strategic review.
• The approximate cost of constructing the Nicholson Road railway station and extending the Thornlie spur line to the station is $25m to $35m. The State government could fund this project using similar approaches to those used for the New Metro Rail project and capital costs to the City
Recommendations 42

PricewaterhouseCoopers
are not expected to be significant. Given the considerable benefits to the City arising from the proposed new railway station, it is recommended that as a high priority, further analysis of the benefits of this extension be undertaken and presented to the State government.
Chapter 8 Forward Looking Reforms • It is suggested to keep benchmarking achievable and relevant in its early development stages of
becoming demonstrable and measurable that quartile ranking of local government performance should be used.
• The City could also investigate greater collaboration with neighbouring councils to pool resources
in road and park maintenance.
• The City could apply commercial principles to increase and broaden the user charges base. • Set clear and appropriate priorities through establishing a robust long-term service plan, which
defines what Council will provide and how services will be undertaken.
• Exercise caution prior to stepping in to attempt to resolve regional, state or national issues without a sound funding plan (which includes potential for cost shifting).
• Assess merit of reforms to developer contributions as outlined in section 4.3. • Progressively increase rates towards the average levels, on a per capita basis, for Perth
Metropolitan local governments.
• Achieve this through working with other spheres of government to facilitate improved asset management and financial skills through government-funding programs, to lift the overall technical skills in local governments to a reasonable base level.
Recommendations 43
PricewaterhouseCoopers
Recommendations 44
Bibliography
Access Economics (2005), Local government Finances in Western Australia- Systemic Sustainability Study. Access Economics (2006) Financial Sustainability Tables and Charts, The City of Gosnells. Australian Bureau of Statistics 2001 Census Community Profile Series- Gosnells (C) (Statistical Local Area). Austroads publication "Integrated Asset Management Guidelines for Road Networks", AP-R202/02 accessed at http://austroads.com.au.tmp.anchor.net.au/asset/pdf/AM_Process_Flow_Diagram.pdf Certified Institute Public Finance and Accountancy (CIPFA) - Benchmarking to improve performance (1996). City of Gosnells, Local Housing Strategy (2006). Improvement and development agency (I&DeA) - Join the Club? Benchmarking for Best Value, 2002. Access at: http://www.idea.gov.uk/idk/aio/1709635 MAV Life Cycle Asset Management Database, accessed at http://www.algin.net/mav/Public%20Section/background.htm NSW Department of Local Government; Local Government Reform – Promoting Better Practice accessed at http://www.dlg.nsw.gov.au/dlg/dlghome/dlg_LGR_PBP.asp PricewaterhouseCoopers - National Financial Sustainability Study of Local Government Commissioned by the Australian Local Government Association, November 2006. Ray Hadlow; Western Australian Local Government Rates Comparison, 2005/06. Western Australian Local Government Association; Systemic Sustainability Study Taskforce Bulletin – Issue No. 3 (2006). Western Australian Planning Commission (2005) Western Australia Tomorrow.


PricewaterhouseCoopers
Appendix I Key Performance Indicators
Disclaimer: This analysis has been prepared to provide an indicative assessment of the City of Gosnells relative to other Perth Metropolitan local governments. In the absence of an industry wide and independently coordinated benchmarking system the best available data has been used but has not been verified with the individual local governments used for comparison. Key data sources for the benchmarking included: 2005/2006 local government reports; Rates Values and Rubbish charges obtained from Ray Hadlow Western Australian Local Government Rates Comparison2005/06; Australian Bureau of Statistics population estimates for June 2005.
In
tere
st
Cov
era g
e R
a tio
Ope
r atin
g Su
r plu
s/
(def
icit)
as
a %
of
Rev
e nue
Su s
tain
abili
ty
Ra t
io
Cur
r ent
r atio
Rat
es
Cov
erag
e
Num
ber o
f C
o unc
il E
mpl
oyee
s (F
TE'S
)
No.
of
Re s
iden
ts p
er
Cou
n cil
Em
plo y
ee
Em
ploy
e e
Cos
t s p
er
e mpl
oye e
( F
TE)
Rat
es
Rev
enue
per
C
itize
n
Co u
ncil
Exp
endi
ture
pe
r Citi
zen
Cap
ital
Exp
e ndi
tur e
as
a %
Non
C
urr e
nt A
sset
s
Ra t
e-G
ross
R
enta
l Val
ue
Va l
u atio
n
Rat
e -G
ross
R
enta
l Val
u e
Min
imum
Ru b
bish
C
harg
e
Ope
ratin
g Su
rplu
s/
(de f
icit)
as
a %
of
Re v
enue
( e
xcl D
epr n
)
gros
s de
b t to
r e
venu
e ra
t io
d ebt
ser
vice
r a
tio
Armadale 59.7 14.1% 1.60 2.35 62.4% 220 238 $67,838 $370 $593 6.6% 10.5000 $600 $156 36.8% 0.05 0.01Bassendean 1.1 0.1% 2.57 1.80 55.3% 103 136 $47,960 $455 $823 8.2% 10.2250 $645 na 11.2% 0.16 0.01Bayswater 19.7 1.4% 1.15 2.97 47.5% 220 255 $82,063 $391 $824 6.5% 7.6163 $505 $196 21.9% 0.02 0.00Belmont 54.0 14.7% 2.39 2.16 76.5% 171 182 $57,766 $680 $888 5.8% 7.8276 $550 $175 29.3% 0.09 0.01Cambridge -20.7 -15.2% 1.75 3.30 45.4% 154 161 $54,954 $498 $1,097 7.3% 7.6560 $582 na 7.2% 0.40 0.02Canning -28.8 -2.8% 1.00 3.88 42.3% 567 141 $44,015 $378 $893 8.6% 5.4300 $402 $171 37.1% 0.02 0.00Claremont 0.0 10.6% 2.96 2.80 74.4% 63 145 $55,298 $657 $883 7.4% 6.7500 $708 na 18.2% 0.00 0.00Cockburn 0.0 22.7% 2.49 8.89 49.6% 308 249 $63,804 $300 $605 5.1% 5.8500 $456 $189 32.7% 0.00 0.00Cottesloe 59.0 17.3% 2.15 2.24 73.0% 37 205 $65,784 $664 $911 16.9% 7.2730 $656 na 31.3% 0.04 0.01East Fremantle 8.5 10.5% 1.89 1.46 69.4% 37 184 $52,168 $514 $740 6.9% 8.4050 $552 na 21.8% 0.21 0.04Fremantle 22.8 13.5% 0.93 2.25 42.7% 421 62 $55,823 $754 $1,764 2.4% 7.8110 $604 na 29.2% 0.18 0.02Gosnells 0.0 12.4% 1.46 4.46 57.1% 365 253 $54,386 $311 $545 5.8% 7.4900 $536 $147 35.4% 0.00 0.00Joondalup 74.8 15.9% 0.16 3.56 67.9% 472 333 $57,380 $316 $466 0.5% 6.9420 $505 $155 33.3% 0.01 0.00Kwinana -24.5 -10.6% 0.80 3.39 33.8% 240 98 $55,935 $459 $1,355 5.2% 8.7259 $516 $155 12.9% 0.09 0.01Melville 26.1 14.2% 1.83 3.33 55.0% 454 215 $56,913 $334 $607 6.3% 5.7300 $444 $170 29.0% 0.08 0.01Mosman Park 6.8 7.5% 0.73 2.32 69.2% 45 194 $56,820 $542 $783 1.8% 7.1960 $632 na 15.1% 0.23 0.04Mundaring 329.1 16.0% 2.17 10.29 59.0% 161 222 $43,022 $369 $625 8.2% 9.4710 $550 $131 33.4% 0.01 0.00Rockingham 6.7 13.8% 1.70 3.61 53.8% 302 282 $54,283 $345 $641 9.5% 7.2961 $515 $163 41.5% 0.36 0.07Serpentine-Jarrahdale -0.5 -3.1% 0.97 1.88 42.9% 62 208 $56,913 $385 $897 4.1% 8.0600 $563 $170 23.1% 0.33 0.04South Perth 8.2 4.1% 1.49 4.55 57.2% 210 183 $58,062 $454 $794 5.0% 6.8250 $550 $142 22.5% 0.17 0.01Stirling 182.3 16.2% 1.62 3.33 62.1% 742 245 $58,871 $381 $614 5.5% 6.4400 $521 $165 35.5% 0.01 0.00Subiaco 63.9 38.3% 3.67 4.35 51.6% 135 122 $66,848 $661 $1,282 13.6% 6.7345 $420 $195 46.0% 0.08 0.04Swan 4.7 2.8% 0.91 2.01 57.9% 464 202 $61,115 $426 $735 3.5% 8.8100 $520 $160 32.2% 0.12 0.02Victoria Park 13.0 24.4% 4.70 1.81 84.4% 128 225 $61,214 $561 $665 12.7% 7.8500 $543 na 36.6% 0.47 0.13Vincent 2.7 3.9% 0.87 3.46 53.2% 192 139 $64,359 $537 $1,010 4.1% 7.8000 $480 na 23.1% 0.39 0.03Wanneroo 574.6 26.5% 1.01 5.75 49.1% 594 181 $46,637 $347 $706 3.0% 6.9910 $497 $150 43.4% 0.00 0.00
kbarr
Rectangle
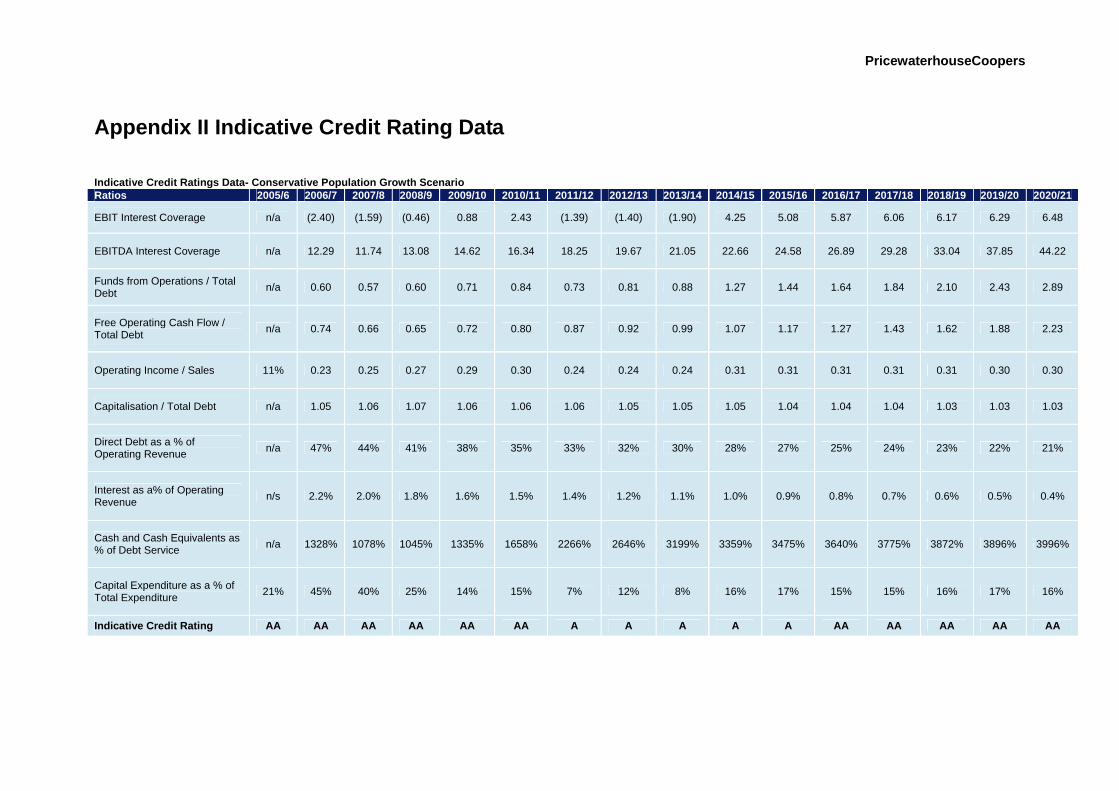
PricewaterhouseCoopers
Appendix II Indicative Credit Rating Data
Indicative Credit Ratings Data- Conservative Population Growth Scenario Ratios 2005/6 2006/7 2007/8 2008/9 2009/10 2010/11 2011/12 2012/13 2013/14 2014/15 2015/16 2016/17 2017/18 2018/19 2019/20 2020/21
EBIT Interest Coverage n/a (2.40) (1.59) (0.46) 0.88 2.43 (1.39) (1.40) (1.90) 4.25 5.08 5.87 6.06 6.17 6.29 6.48
EBITDA Interest Coverage n/a 12.29 11.74 13.08 14.62 16.34 18.25 19.67 21.05 22.66 24.58 26.89 29.28 33.04 37.85 44.22
Funds from Operations / Total Debt n/a 0.60 0.57 0.60 0.71 0.84 0.73 0.81 0.88 1.27 1.44 1.64 1.84 2.10 2.43 2.89
Free Operating Cash Flow / Total Debt n/a 0.74 0.66 0.65 0.72 0.80 0.87 0.92 0.99 1.07 1.17 1.27 1.43 1.62 1.88 2.23
Operating Income / Sales 11% 0.23 0.25 0.27 0.29 0.30 0.24 0.24 0.24 0.31 0.31 0.31 0.31 0.31 0.30 0.30
Capitalisation / Total Debt n/a 1.05 1.06 1.07 1.06 1.06 1.06 1.05 1.05 1.05 1.04 1.04 1.04 1.03 1.03 1.03
Direct Debt as a % of Operating Revenue n/a 47% 44% 41% 38% 35% 33% 32% 30% 28% 27% 25% 24% 23% 22% 21%
Interest as a% of Operating Revenue n/s 2.2% 2.0% 1.8% 1.6% 1.5% 1.4% 1.2% 1.1% 1.0% 0.9% 0.8% 0.7% 0.6% 0.5% 0.4%
Cash and Cash Equivalents as % of Debt Service n/a 1328% 1078% 1045% 1335% 1658% 2266% 2646% 3199% 3359% 3475% 3640% 3775% 3872% 3896% 3996%
Capital Expenditure as a % of Total Expenditure 21% 45% 40% 25% 14% 15% 7% 12% 8% 16% 17% 15% 15% 16% 17% 16%
Indicative Credit Rating AA AA AA AA AA AA A A A A A AA AA AA AA AA
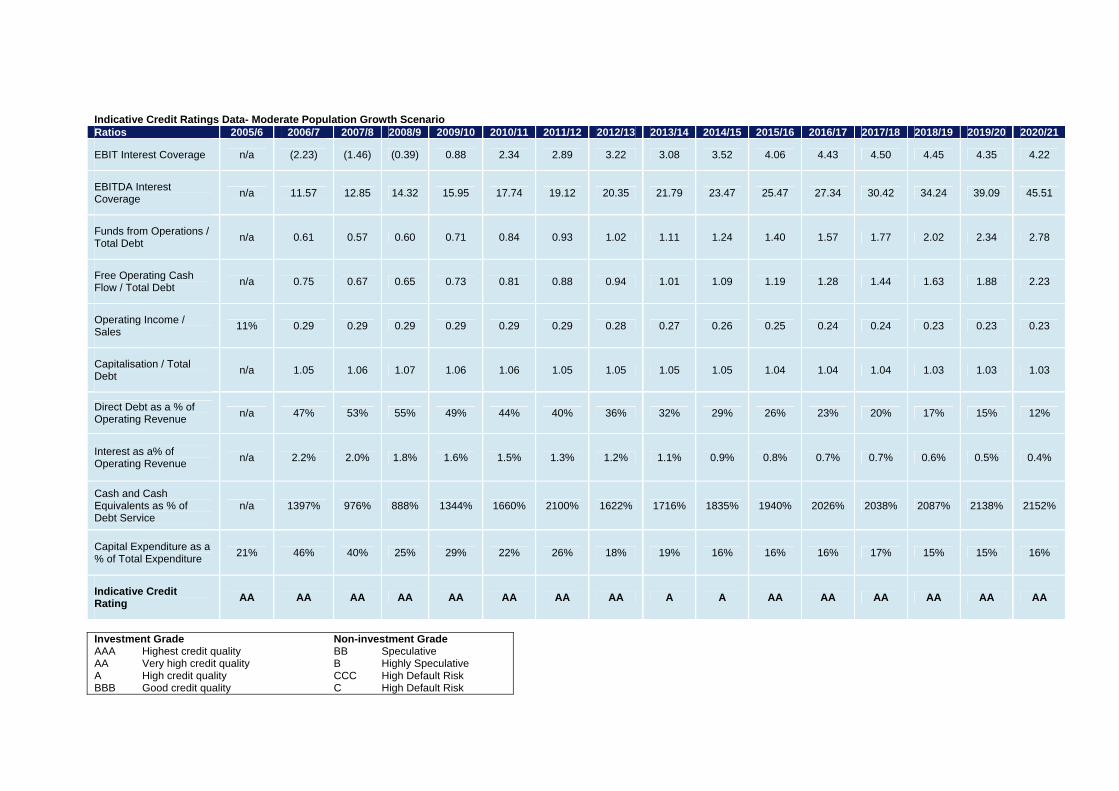
Indicative Credit Ratings Data- Moderate Population Growth Scenario Ratios 2005/6 2006/7 2007/8 2008/9 2009/10 2010/11 2011/12 2012/13 2013/14 2014/15 2015/16 2016/17 2017/18 2018/19 2019/20 2020/21
EBIT Interest Coverage n/a (2.23) (1.46) (0.39) 0.88 2.34 2.89 3.22 3.08 3.52 4.06 4.43 4.50 4.45 4.35 4.22
EBITDA Interest Coverage n/a 11.57 12.85 14.32 15.95 17.74 19.12 20.35 21.79 23.47 25.47 27.34 30.42 34.24 39.09 45.51
Funds from Operations / Total Debt n/a 0.61 0.57 0.60 0.71 0.84 0.93 1.02 1.11 1.24 1.40 1.57 1.77 2.02 2.34 2.78
Free Operating Cash Flow / Total Debt n/a 0.75 0.67 0.65 0.73 0.81 0.88 0.94 1.01 1.09 1.19 1.28 1.44 1.63 1.88 2.23
Operating Income / Sales 11% 0.29 0.29 0.29 0.29 0.29 0.29 0.28 0.27 0.26 0.25 0.24 0.24 0.23 0.23 0.23
Capitalisation / Total Debt n/a 1.05 1.06 1.07 1.06 1.06 1.05 1.05 1.05 1.05 1.04 1.04 1.04 1.03 1.03 1.03
Direct Debt as a % of Operating Revenue n/a 47% 53% 55% 49% 44% 40% 36% 32% 29% 26% 23% 20% 17% 15% 12%
Interest as a% of Operating Revenue n/a 2.2% 2.0% 1.8% 1.6% 1.5% 1.3% 1.2% 1.1% 0.9% 0.8% 0.7% 0.7% 0.6% 0.5% 0.4%
Cash and Cash Equivalents as % of Debt Service
n/a 1397% 976% 888% 1344% 1660% 2100% 1622% 1716% 1835% 1940% 2026% 2038% 2087% 2138% 2152%
Capital Expenditure as a % of Total Expenditure 21% 46% 40% 25% 29% 22% 26% 18% 19% 16% 16% 16% 17% 15% 15% 16%
Indicative Credit Rating AA AA AA AA AA AA AA AA A A AA AA AA AA AA AA
Investment Grade Non-investment Grade AAA Highest credit quality BB Speculative AA Very high credit quality B Highly Speculative A High credit quality CCC High Default Risk BBB Good credit quality C High Default Risk


PricewaterhouseCoopers
Appendix III Definition of Financial Sustainability Indicators
Operating surplus (deficit) – total operating revenue less total operating expenses Operating surplus (deficit) is total operating revenue less total operating expenses. It is an indicator of a council’s ability to meet its operating expenses with its operating revenue stream. Interest coverage – EBIT divided by borrowing costs For the purposes of our analysis, EBIT is the operating surplus (deficit) to which we have added back borrowing costs; and borrowing costs are the reported borrowing costs or, in the absence of such costs being reported, the imputed borrowing costs. Accordingly, interest coverage measures a council’s ability to pay interest on its outstanding debt. An interest coverage value below 3 indicates that a council may have problems in repaying debt and associated interest. Sustainability ratio (capex/depreciation) –capital expenditure divided by depreciation. The sustainability ratio is a measure of the net increase or decrease in a council’s asset base. Where a council records a value higher than 1 this indicates that its overall asset base is increasing, or being replenished, at a rate equal to, or higher than, the council’s consumption of assets. Conversely, a value less than 1 indicates a declining asset base, and may indicate financial unsustainability. Current ratio – current assets divided by current liabilities It is an indication of a council’s ability to meet short-term debt obligations. A council that records a value less than 1 may face potential problems in meeting short-term obligations. Rates coverage –total rates revenue as a proportion of total expenses It indicates a council’s ability to cover its costs through its own tax revenue. A rates coverage result of 40% or higher may indicate a sustainable return from rates ie with rates providing an adequate revenue stream to meet incurred costs. Conversely, a result of less than 40% may indicate that rates cover an inadequate proportion of expenses, and that this could indicate potential financial unsustainability.