OF THE UNITED STATES GOVERNMENT - whitehouse.gov · CHAPTER 1 ... 17 Bureau of Labor ... Department...
89
EXECUTIVE OFFICE OF THE PRESIDENT OFFICE OF MANAGEMENT AND BUDGET STATISTICAL PROGRAMS OF THE UNITED STATES GOVERNMENT FISCAL YEAR 2018
Transcript of OF THE UNITED STATES GOVERNMENT - whitehouse.gov · CHAPTER 1 ... 17 Bureau of Labor ... Department...

EXECUTIVE OFFICE OF THE PRESIDENT
OFFICE OF MANAGEMENT AND BUDGET
STATISTICAL PROGRAMS
OF THE UNITED STATES GOVERNMENT
FISCAL YEAR
2018

EXECUTIVE OFFICE OF THE PRESIDENT
OFFICE OF MANAGEMENT AND BUDGET
STATISTICAL PROGRAMS
OF THE UNITED STATES GOVERNMENT
FISCAL YEAR
2018


The Honorable Paul D. Ryan Speaker of the House of Representatives Washington, D.C. 20515 Dear Mr. Speaker:
I am writing to transmit the Statistical Programs of the United States Government: Fiscal Year 2018 report, which is required by the Paperwork Reduction Act of 1995. The report can be found at https://www.whitehouse.gov/wp-content/uploads/2018/05/statistical-programs-2018.pdf.
The Federal Government’s statistical agencies and programs play a vital role in generating the data that the public, businesses, and governments need to make informed decisions. Timely, accurate, and relevant statistical data are the foundation of evidence-based decision-making.
• The public uses statistical information in their daily lives, including information on education, commuting, health, crime, or aging in their communities. Often these data appear at the top of the results in search engines, are incorporated into popular resources such as real estate applications, or are downloaded from agency websites to support in-depth research on relevant policy topics.
• Businesses depend on reliable statistical information that is nationally consistent to grow their businesses, better serve customers, and create jobs in our Nation’s communities, including data on current and potential markets, international trade, the labor force, and changing economic conditions. Federal statistical data inform critical business decisions on new products, locations for new production facilities and retail outlets, marketing strategies, workforce characteristics and hiring strategies, and more.
• Federal, State, and local governments use statistical information to inform and evaluate how effectively taxpayer dollars are spent on government programs and to better direct public services. Policy makers need data-based evidence in order to successfully address high priority issues.
An effective and efficient Federal Government requires evidence about where needs are
greatest, what works and what does not, where and how programs could be improved, and how programs of yesterday may no longer be suited for today or prepare us for tomorrow. Having access to timely, accurate, and reliable statistical data enables the Federal Government to make reasoned, disciplined decisions about where to target resources to get the largest possible return for the American taxpayer. The Federal Statistical System continues to strengthen the Federal evidence base to meet increasing demands while reducing costs and burden for the American

people. By exploring the use of new data sources, including reusing data the Government has already collected as part of administering programs, Federal statistical agencies are striving to supplement or replace surveys that are more burdensome, counter falling levels of cooperation from the public on survey response, increase accuracy and relevance, and save money. The share of budgetary resources spent on supporting the 107 non-Decennial Census statistical programs described in this report is modest, and that funding is leveraged to inform crucial decisions in a wide variety of spheres affecting hundreds of billions of dollars across the economy. To accommodate increasing costs while preserving core information products, these programs continued to trim or postpone statistical activities in FY 2018, and have cut staff hiring and training.
The Office of Management and Budget looks forward to working closely with the Congress to build a 21st Century system of statistical measurement for our Nation and to preserve the availability of relevant, accurate, and objective data on which Americans depend to inform their decisions.
Sincerely,
Mick Mulvaney Director
Identical Letter Sent to The President of the Senate 2

Table of Contents
INTRODUCTION......................................................................................................................... 1 STATISTICAL PROGRAMS AT A GLANCE ......................................................................... 2 CHAPTER 1 .................................................................................................................................. 3
Value of Federal Statistics .......................................................................................................... 3 Structure of the Federal Statistical System ................................................................................. 6
CHAPTER 2 .................................................................................................................................. 9 Bureau of the Census ................................................................................................................ 10 Bureau of Economic Analysis .................................................................................................. 15 Bureau of Justice Statistics ....................................................................................................... 17 Bureau of Labor Statistics ......................................................................................................... 20 Bureau of Transportation Statistics ........................................................................................... 22 Economic Research Service ...................................................................................................... 24 Energy Information Agency ..................................................................................................... 27 National Agricultural Statistics Service .................................................................................... 30 National Center for Education Statistics ................................................................................... 33 National Center for Health Statistics ........................................................................................ 35 National Center for Science and Engineering Statistics .......................................................... 38 Office of Research, Evaluation, and Statistics ......................................................................... 40 Statistics of Income ................................................................................................................... 42
CHAPTER 3 ................................................................................................................................ 45 Department of Agriculture ........................................................................................................ 46 Department of Commerce ......................................................................................................... 47 Department of Defense ............................................................................................................. 48 Department of Education .......................................................................................................... 49 Department of Energy ............................................................................................................... 50 Department of Health and Human Services .............................................................................. 51 Department of Homeland Security ........................................................................................... 54 Department of Housing and Urban Development ................................................................... 55 Department of the Interior ........................................................................................................ 56 Department of Justice ............................................................................................................... 57 Department of Labor ................................................................................................................. 58 Department of State .................................................................................................................. 59 Department of Transportation ................................................................................................... 60 Department of Veterans Affairs ................................................................................................ 61 Statistical Programs of .............................................................................................................. 62 Other Federal Agencies............................................................................................................. 62
APPENDIX A .............................................................................................................................. 64 APPENDIX B .............................................................................................................................. 69 APPENDIX C .............................................................................................................................. 75 APPENDIX D .............................................................................................................................. 79

1
I N T R O D U C T I O N
Statistical Programs of the United States Government: Fiscal Year 2018 outlines the funding proposed for Federal statistical activities in the President’s Budget. This report, along with the chapter "Strengthening Federal Statistics" in the Analytical Perspectives volume of the President’s Budget, fulfills the responsibility of the Office of Management and Budget (OMB) to prepare an annual report on statistical program funding under the Paperwork Reduction Act of 1995 (PRA, 44 U.S.C. 3504(e)(2)). This annual report provides the U.S. Congress with a consolidated source for key budgetary and programmatic information about the Federal Statistical System. This report begins with an “At-A-Glance” overview, followed by three chapters and a set of appendices.
• Chapter 1 provides an overview of the Federal Statistical System. • Chapter 2 provides details about principal statistical agency programs, highlights the
congressional budget allocation for FY 2017, and identifies major program changes planned for FY 2018.
• Chapter 3 describes other significant statistical programs of Federal agencies and identifies major program changes anticipated in FY 2018.
• Appendices include information on direct funding, reimbursable and purchase programs, staffing levels for principal statistical agencies, and agency websites and acronyms.
This report is available on the OMB website at: www.whitehouse.gov/sites/whitehouse.gov/files/omb/assets/information_and_regulatory_affairs/statistical-programs-2018.pdf. Suggestions to improve this report may be sent to [email protected]. Please direct any inquiries regarding report content or policy to Nancy A. Potok, Chief Statistician, Office of Information and Regulatory Affairs, Office of Management and Budget, Washington, D.C. 20503.

2
Principal Statistical Agencies Total funding for Statistical agencies, excluding the Decennial Census, decreased 1.6 percent between Fiscal Year (FY) 2016 and FY 2018. Four of the 13 principal statistical agencies had funding increases during this period. Direct Funding ($ millions)
Agency FY 2016 FY 2017 FY 2018 Bureau of Labor Statistics 609 609 608
Bureau of the Census* 511 457 481 National Center for Education Statistics 328 316 330 National Agricultural Statistics Service 168 171 186
National Center for Health Statistics 160 160 155 Energy Information Administration 122 122 118
Bureau of Economic Analysis 105 104 97 Economic Research Service 85 87 77
National Center for Science and Engineering Statistics 58 60 57 Bureau of Justice Statistics 50 50 50
Statistics of Income 38 34 34 Office of Research, Evaluation, and Statistics 26 27 33
Bureau of Transportation Statistics 26 26 26 Total 2,286 2,257 2,250
* Excludes funding for the Decennial Census FY 2016 and 2017 reflects actual funding received; FY 2018 reflects the President’s Budget request, including any adjustments Other Statistical Programs Of the 94 other statistical programs, approximately the same number had direct funding increases as had decreases between FY 2016 and FY 2018.
-89.9-57.1
-30.9-30.3
5.66.0
11.622.0
-120 -70 -20 30
United States Geological SurveyNational Heart, Lung, and Blood Institute (NIH)
Nat. Institute of Allergy and Infectious Diseases (NIH)U.S. Agency for International DevelopmentOffice of Innovation and Improvement (ED)
National Institute of Mental Health (NIH)Veterans Health Administration (VA)
Office of People Analytics (DOD)
Difference in Funding ($ millions)
Programs with the Largest Differences in Funding between FY 2016 and FY 2018
STATISTICAL PROGRAMS AT A GLANCE Statistical Programs of the United States Government: Fiscal Year 2018

3
C H A P T E R 1
Overview of the Federal Statistical System This chapter describes the value of Federal statistics and the structure of the Federal Statistical System. Value of Federal Statistics The Federal government’s statistical agencies and programs play a vital role in generating the data that the public, businesses, and governments need to make informed decisions. Timely, accurate, and relevant statistical data are the foundation of evidence-based decision-making. As such, the Federal Statistical System engages in a wide variety of evidence-building functions, including the collection, compilation, processing, analysis, and dissemination of data to create general purpose, policy- and program-specific, or research oriented statistics and datasets. Also included are program evaluation, performance measurement, and public health surveillance.1
• The Public uses statistical information in their daily lives, including information on education, commuting, health, crime, or aging in their communities. In searching online for this information, often Federal statistical data are the first results that appear. In addition, Federal statistics provide great value to the private sector and its customers – for example, they are incorporated into popular resources, including real estate applications that provide homebuyers and renters with data on neighborhood characteristics. To support information needs ranging from in-depth research on relevant policy topics to educational materials for school children, Federal statistics are downloaded from agency websites.
• Businesses depend on reliable statistical information that is nationally consistent to grow
their businesses, better serve customers, and create jobs in our Nation’s communities, including data on current and potential markets, international trade, the labor force, and changing economic conditions. Federal statistical data inform critical business decisions on new products, locations for new production facilities and retail outlets, marketing strategies, workforce characteristics and hiring strategies, and more.
• Federal, State, and local governments use statistical information to inform and evaluate
how effectively taxpayer dollars are spent on government programs and to better direct public services. An effective and efficient Federal government requires evidence about
1 Evidence-building functions described in this report also include the following statistical activities: the planning of statistical surveys and studies, including project design, sample design and selection, and design of questionnaires, forms, or other techniques of observation and data collection; training of statisticians, interviewers, or data processing personnel; publication or dissemination of statistical data and studies; methodological testing or statistical research; data analysis; forecasts or projections that are published or otherwise made available for government-wide or public use; statistical tabulation, dissemination, or publication of data collected by others; construction of secondary data series or development of models that are an integral part of generating statistical series or forecasts; management or coordination of statistical operations; and statistical consulting.

4
where needs are greatest, what works and what does not, where and how programs could be improved, and how programs of yesterday may no longer be suited for today or prepare us for tomorrow. Having access to timely, accurate, reliable statistical data enables the Federal government to make reasoned, disciplined decisions about where to target resources to get the biggest possible return for the American taxpayer. Policymakers need data-based evidence in order to effectively address high priority issues, and agencies across government rely heavily on Federal statistics to guide key trade and fiscal policies.
The largest Federal statistical data collection, the Decennial Census, is mandated by the Constitution and is the basis for our democracy. This enumeration every 10 years of all residents in the Nation is used to allocate the number of congressional representatives among the states, and is then used by states to form congressional districts. Each year, based on these and other important data collected by the Bureau of the Census, hundreds of billions of dollars are distributed to states and communities. The share of budgetary resources spent on supporting the 107 non-Decennial Census statistical programs described in this report is modest —about 0.04 percent of the Gross Domestic Product (GDP). The share roughly doubles to 0.08 percent for the year every decade that hosts the Decennial Census. That funding is leveraged to inform crucial decisions in a wide variety of spheres affecting hundreds of billions of dollars across the economy. To accommodate increasing costs while preserving core information products, these programs continued to eliminate or postpone statistical activities in FY 2018, and have cut staff hiring and training. At the same time, the Federal Statistical System continues to work to strengthen the Federal evidence base to meet increasing demands while working collaboratively to reduce costs and burden to the American people. As data science has advanced and statistical agencies increasingly gather, process, and disseminate data from multiple sources, agencies have looked for ways to attract and retain people with new skills, partner with the private sector and academia, and obtain access to modern, high speed, high capacity, highly secure computing environments. Agencies have made it a priority to bring together data scientists, statisticians, subject matter experts, and Information Technology experts to modernize the ways in which Federal statistics are produced and disseminated while maintaining the core values of providing objective, accurate, timely, and relevant information. Part of the approach is researching and exploring the use of new data sources, including reusing data the government has already collected as part of administering programs, to provide, for example, data faster and at smaller geographic levels without sacrificing quality. These new sources include satellite data, aerial photography, commercial records, and more administrative data held by states and the Federal government. In using these new data sources, Federal statistical agencies are striving to:
• supplement or replace surveys that are more burdensome, • counter falling levels of cooperation from the public on survey response, • increase accuracy and relevance, • meet growing user needs, and • save money.

5
Drug Poisoning Deaths have been on the Rise: A Case Study on Value Deaths from drug overdose are an increasing public health burden in the United States.2 Data from the National Vital Statistics System within the National Center for Health Statistics (NCHS) measures drug overdose deaths, and NCHS reports on trends, demographic and geographic patterns, and shifts in the types of drugs involved in drug overdoses. In 2016, the age-adjusted rate of drug overdose deaths in the U.S. was more than three times the rate in 1999. Data also show that the age-adjusted rate of drug overdose deaths involving synthetic opioids other than methadone doubled from 2015 to 2016. The chart below shows the trends in age-adjusted drug overdose death rates by opioid category in the U.S. from 1999 to 2016.3
Age-adjusted drug overdose death rates, by opioid category: U.S., 1999-2016
In October 2017, the President announced a Public Health Emergency associated with drug addiction and the opioid crisis. The Administration is committed addressing the opioid epidemic. NCHS provides timely and accurate data on drug overdose deaths, which informs the discussion and planning on how best to confront the issue. 2 Hedegaard H, Warner M, Miniño AM. Drug overdose deaths in the United States, 1999–2016. NCHS Data Brief, no 294. Hyattsville, MD: National Center for Health Statistics. 2017. 3 See ibid.

6
Structure of the Federal Statistical System The U.S. has a highly decentralized statistical system, spanning 107 agencies4,5 spread across the Government, all of which are engaged, to some degree, in conducting statistical activities. Principal Statistical Agencies A Federal principal statistical agency is an agency or organizational unit of the Executive Branch whose activities are predominantly the collection, compilation, processing, or analysis of information for statistical purposes.6 The 13 principal statistical agencies produce a substantial portion of U.S. official statistics. Excluding funding for the Decennial Census7 ($1,200.7 million requested for the Decennial Census for FY 20188), approximately 40 percent ($2,249.9 million of the $5,662.4 million total proposed for FY 2018 in the President's Budget request) of overall funding for Federal statistical activities provides resources for these 13 agencies. 13 Principal Statistical Agencies: • Bureau of the Census (Census) • Bureau of Economic Analysis (BEA) • Bureau of Justice Statistics (BJS) • Bureau of Labor Statistics (BLS) • Bureau of Transportation Statistics (BTS) • Economic Research Service (ERS) • Energy Information Administration (EIA) • National Agricultural Statistics Service
(NASS)
• National Center for Education Statistics (NCES)
• National Center for Health Statistics (NCHS)
• National Center for Science and Engineering Statistics (NCSES)
• Office of Research, Evaluation and Statistics (ORES)
• Statistics of Income (SOI)
4 This count is based on data collected in July 2017, and may not reflect newly emerging statistical programs that meet inclusion criteria described in this section or statistical programs of which we are not yet aware. 5 This year, the inclusion criteria of $3 million in estimated or direct funding for statistical activities in the forthcoming or either of the past two fiscal years was used. Compared to the FY 2017 report, this volume omits 22 Federal agencies that do not meet the new inclusion criteria. One additional agency, Food and Drug Administration, has been added. 6 Title V of the E-Government Act of 2002. Confidential Information Protection and Statistical Efficiency Act (CIPSEA), PL 107-347, Section 502(7). 7 Because funding for the Decennial Census is cyclical and large compared to other statistical programs, it is typically considered separately from the Census Bureau budget in order to facilitate more meaningful analysis of trends. 8 This figure includes an adjustment of $187 million to the FY 2018 President’s Budget. Following an extensive process to reestimate the cost of the 2020 Census during the summer of 2017, the Census Bureau requested an adjustment of $187 million to the FY 2018 President’s Budget in September 2017 to continue support of the program's critical path activities.

7
Other Statistical Programs of Federal Agencies The remaining 60 percent of total resources allocated to statistical work in the U.S. government supports some 94 programs in a broad set of centers, institutes, and organizations in the Executive Branch. These statistical programs are components within Federal departments or other agencies that conduct a variety of evidence-building functions, including program evaluation, research, data collection, policy and program analysis, and the provision of external funding and other support. Many other Federal agencies conduct statistical activities within the Executive Branch, however, their direct funding for these activities does not meet the inclusion criteria for this report. In addition, there are numerous other Federal agencies whose statistical activities are excluded from this annual compilation because they are not part of the Executive Branch. Among others, these agencies include the Congressional Budget Office, which develops and applies projection models for the budgetary impact of current and proposed Federal programs; the Federal Reserve Board, which compiles the widely used Flow of Funds report and other statistical series, and periodically conducts the Survey of Consumer Finances; and the Government Accountability Office, which uses statistical data in evaluations of government programs. The Office of Management and Budget The Office of Information and Regulatory Affairs (OIRA) within the Office of Management and Budget (OMB) coordinates the Nation's decentralized Federal Statistical System. OIRA's Statistical and Science Policy (SSP) Office, headed by the U.S. Chief Statistician, promotes the quality and efficiency of Federal statistical and scientific information that facilitates evidence-based policies and programs. SSP accomplishes this by establishing statistical policies and standards, identifying priorities for improving programs, evaluating statistical agency budgets, reviewing and approving Federal agency information collections, and coordinating U.S. participation in international statistical activities. Information on SSP’s coordinating activities, including statistical standards and interagency groups, can be found on the SSP website. The U.S. Chief Statistician promotes integration across the Federal Statistical System by chairing the Interagency Council on Statistical Policy (ICSP), whose members include the heads of the 13 principal statistical agencies listed above, as well as a rotating member from one of the statistical programs described in Chapter 3.9 In 2017, the ICSP identified six strategic priority areas for moving the Federal Statistical System forward:
1. Data: Measuring and communicating the quality of blended data sets created by combining survey data with administrative data or other non-survey data.
2. Access: Improving secure research access to confidential data through the Federal Statistical Research Data Centers.
9 Currently the National Center for Veterans’ Analysis and Statistics within the Department of Veterans Affairs..

8
3. Communication: Improving storytelling and creating brand awareness within and outside of the Federal government.
4. Employee development: Identifying skills needed to take advantage of emerging opportunities and hiring people with those skills.
5. Intergovernmental: Improving relationships with non-statistical agencies and state and local governments.
6. Response rates: Improving response rates to increase efficiency, improve accuracy, and decrease bias.
ICSP members and their agencies have committed to lead these collaborative efforts to address these six strategic goals. Statistical Confidentiality
The Confidential Information Protection and Statistical Efficiency Act of 2002 (CIPSEA) establishes a uniform set of safeguards to protect the confidentiality of individually identifiable information acquired from the public for statistical purposes, and imposes strong criminal penalties for inappropriate disclosure of such information. The legislation reaffirms that pledges of confidentiality will be honored and gives additional weight and stature to policies that statistical agencies have pursued for decades, assuring respondents who provide statistical information that their responses will be held in confidence and will not be used against them in any government action. CIPSEA also authorizes the sharing of business data among BEA, BLS, and the Bureau of the Census for exclusively statistical purposes. Thus, CIPSEA provides a framework to enhance the efficiency of the Federal Statistical System by reducing reporting burden on the public and strengthening the quality and usefulness of the Nation's Federal statistics. The Commission on Evidence-Based Policymaking (CEP) was established by the bipartisan Evidence-Based Policymaking Commission Act of 2016 (P.L. 114-140), jointly sponsored by Speaker Paul Ryan (R-WI) and Senator Patty Murray (D-WA), and signed into law on March 30, 2016. The mission of the Commission was to develop a strategy for increasing the availability and use of data in order to build evidence about government programs, while protecting privacy and confidentiality. That strategy is described in the Commission’s final report, The Promise of Evidence-Based Policymaking, published in September 2017. The report recognizes the importance of CIPSEA, along with the Privacy Act and the Paperwork Reduction Act, in forming the legal foundation for coordinating information policy and for protecting data used in evidence-building. The report recommends building on the existing CIPSEA framework to foster the increased use and sharing of confidential information for statistical purposes, including research and evaluation.

9
C H A P T E R 2
Principal Statistical Agencies This chapter presents the following information for each of the 13 principal statistical agencies:
• Description of the agency • Congressional appropriations for FY 2017 • Highlights of the FY 2018 budget request and major program changes • An agency data highlight
The budgets shown here reflect the enacted appropriations for FY 2016 and FY 2017 and direct funds requested in the Amended FY 2018 President’s Budget for principal statistical agencies to meet their responsibilities to provide accurate, objective, relevant, and timely information. Complying with these responsibilities requires continuous modernization of data systems to take advantage of opportunities to incorporate new sources of data and improve access while ensuring confidentiality of statistical data. To ensure the credibility and accuracy of their statistics, agencies must hire, develop, and retain staff with a high level of expertise. For both staff development and information dissemination, time and funding must be devoted for staff to engage with colleagues in other Federal agencies, academic centers, and the private sector to discuss available statistics, including their strengths and limitations, and to pursue methodological improvements. Ensuring objectivity and protecting confidentiality, such as by maintaining a statistical publication schedule and review process independent from policy interests, need not be costly. However, other means to promote these responsibilities, such as retaining statistical agency authority to manage confidential data on secure servers, can be expensive, especially for smaller statistical agencies and units. Additional information on direct funding, reimbursable and purchase programs, and staffing can be found in Appendices A, B, and C.

10
Bureau of the Census Census, within the Department of Commerce (DOC), is a principal source of Federal current and periodic demographic and economic statistics. Census measures and disseminates information about the Nation's ever-changing economy, society, and institutions. The statistical products provided by Census foster economic growth, advance scientific understanding, and facilitate informed decisions. Census' major demographic programs include:
• 2020 Decennial Census o Having identified the major cost drivers of the Decennial Census and developed
new, innovative methodologies to re-engineer census operations, Census in FY 2018 continues implementing the 2020 Census Operational Plan, first released in 2015.
• American Community Survey (ACS) o ACS is an ongoing survey providing updated demographic, social, economic, and
housing data for every U.S. community on an annual basis. ACS is a key source of data available to Federal agencies, States, and localities that need accurate and reliable information on a wide range of topics, including, but not limited to, the needs of veterans, state and local emergency managers, businesses deciding where to locate new establishments, retirees, and families with school-age children. ACS is especially important to Americans who live in small towns and rural areas, as this survey often provides the only consistent source of information about these communities.
• Current Demographic Statistics programs, including the Intercensal Demographic Estimates program
o The Intercensal Demographic Estimates program develops updated population estimates in years between Decennial Censuses for areas, such as States, counties, metropolitan statistical areas, and governmental units. These estimates are used in funding and planning, including the distribution of Federal program funds, as
10 This figure includes an adjustment of $187 million to the FY 2018 President’s Budget. Following an extensive process to reestimate the cost of the 2020 Census during the summer of 2017, the Census Bureau requested an adjustment of $187 million to the FY 2018 President’s Budget in September 2017 to continue support of the program's critical path activities.
FY 16 FY 17 FY 18 Direct funding
(millions $) 1,368.4 1,467.4 1,681.410
Full-time permanent
staff 5,808 7,265 6,543

11
denominators for various Federal time series, population controls for major household surveys, and for planning local transportation and health care services.
o Other Current Demographic Statistics Programs include household surveys and population and housing analyses, which provide reliable social and economic data and historical perspectives on many current issues.
Census' economic statistics include: • Two periodic censuses conducted every five years, covering the years ending in two and
seven: o The Economic Census is integral to BEA estimates of Gross Domestic Product
(GDP) and industry inputs and outputs. It provides core information on virtually all non-farm businesses and related data on business expenditures, commodity flows, minority- and women-owned businesses, and other topics.
o The Census of Governments collects State and local data on public finance, public employment, and governmental organization. It is the only source of comprehensive and uniformly categorized data on the economic activities of approximately 90,000 State and local governments, which account for about 12 percent of GDP and 15 percent of the U.S. civilian workforce.
• Current Economic Statistics (CES) programs o The CES programs provides public and private data users with relevant, accurate,
and timely national statistical profiles for most sectors of the U.S. economy, including manufacturing, mineral industries, construction industries, retail and wholesale trade, service industries, and transportation industries. This program significantly influences financial markets and is an input to many of the Nation’s principal economic indicators, including measures of GDP.

12
Congressional Appropriations for FY 2017
| Appropriation: $1,467.4 million | The FY 2017 appropriation for Census was $1,467.4 million. In addition to supporting the production of monthly, quarterly, and annual economic and demographic statistics and geographic data, the appropriation supported key activities for major cyclical demographic and economic programs that are foundational to the Federal Statistical System. Highlights of the FY 2018 Budget Request and Major Program Changes The FY 2018 President’s Budget requests $1,681.4 million, an increase of $214 million over the FY 2017 appropriation. This figure includes an adjustment of $187 million to the FY 2018 President’s Budget. 11 In FY 2018, the program will implement the 2018 End-to-End Census Test. This test will mirror the flow of operations and systems planned for the 2020 Census and will give the Census Bureau an opportunity to reaffirm that the reengineered census will function according to the design. Additionally, several operations, including the Redistricting Data Program, the Local Update of Census Addresses, many of the geographic programs and field and information technology infrastructure operations will be well underway. This will include opening Regional Census Centers that will serve as the hub of field operations during the 2020 Census and begin the acquisition, leasing, and build-out processes for the 250 Area Census Offices planned for the census. To motivate self-response in the 2018 End-to-End Census Test and the 2020 Census itself, the program will continue development and implementation of the Integrated Communications and Partnerships Program for the 2020 Census. The Census Bureau also will deliver the questions proposed for the 2020 Decennial Census (and ACS) to Congress and finalize the Residence Criteria and Residence Situations for the 2020 Census in FY 2018. Finally, the program will continue the development of production systems needed to conduct a successful decennial census in 2020. A key piece of enabling technology that underpins the 2020 Census is the Census Enterprise Data Collection and Process (CEDCaP) program. With CEDCaP, the Census Bureau is creating an integrated and standardized suite of systems that offers shared data collection and processing services across the enterprise. In FY 2018, CEDCaP will continue to finalize capabilities, including delivery of several into production to support the 2018 End-to-End Census Test. The Economic Census and the Census of Governments are cornerstones of the United States' system of economic statistics. Their data products provide the foundation for other key measures of economic performance. The National Income and Product Accounts, and practically all major Federal government economic statistical series, are directly or indirectly dependent on the Economic census. In addition, the Census of Governments is the only source of comprehensive 11 Following an extensive process to reestimate the cost of the 2020 Census during the summer of 2017, the Census Bureau requested an adjustment of $187 million to the FY 2018 President’s Budget in September 2017 to continue support of the program's critical path activities.

13
and uniformly classified data on the economic activities of state and local governments that are used, in part, in providing information to Congress and Federal agencies. Funding in FY 2018 will support the fourth year of the six-year 2017 Economic Census cycle and third year of the five-year cycle for the 2017 Census of Governments. Efforts in FY 2018 shift from preparatory activities, such as designing the operations and determining the content, to collection and processing of the data. Census will finalize the collection instrument, sampling methodology, mail lists, and conduct the initial mail-out for the 2017 Economic Census, Census of Island Areas, and the Census of Governments. Other planned activities include the following: Geographic Support will conduct MAF/TIGER System updates in FY 2018 to support activities that will provide the most complete address list and maps in support of the 2020 Census operations; ACS will make changes to the data collection process to improve the efficiency of the survey, including reduced efforts in the Telephone Nonresponse Follow-up operation, planned research, and field training, while increasing the number of households included in Personal Visit Nonresponse Follow-up operation; the CES programs will reengineer survey operations, scale-back planned research, and make operational and methodological changes to surveys, while preserving the data that businesses use to make investment decisions that drive economic growth; Current Demographic Statistics programs funding levels will allow for Current Population Survey data collection, the first wave of the new FY 2018 Survey of Income and Program Participation panel to include approximately 31,900 households, and national population estimates and projections; and the FY 2018 request consolidates funding for enterprise data dissemination and includes continued support for the Administrative Records Clearinghouse.

14
Percentage of Veterans Among the Adult Population America’s veterans are spread across the country, representing 9.5 percent or more of the population in states such as Idaho, Maine, Montana, Nevada, New Hampshire, New Mexico, Oklahoma, South Carolina, Virginia, Washington, and Wyoming.
ACS asks questions about a person’s Military Service and Service-Connected Disability Rating to create estimates of veterans and their needs at the community level. Data about veterans are used in planning and funding government programs that provide funds or services for veterans and in evaluating other government programs and policies to ensure they fairly and equitably serve the needs of veterans. These statistics are also used to enforce laws, policies, and regulations against discrimination in society. Though the Department of Veterans Affairs (VA) maintains veterans’ records, those records do not provide Federal program planners, policymakers, and researchers with additional statistics about all veterans, regardless of whether they use VA services. A veteran is a person 18 years old or over who has served (even for a short time), but is not now serving, on active duty in the U.S. Army, Navy, Air Force, Marine Corps, or the Coast Guard, or who served in the U.S. Merchant Marine during World War II. People who served in the National Guard or military Reserves are classified as veterans only if they were ever called or ordered to active duty, not counting the 4-6 months for initial training or yearly summer camps. All other civilians 16 years old and over are classified as nonveterans.

15
Bureau of Economic Analysis
BEA, of the Department of Commerce (DOC), is a principal source of Federal economic statistics. BEA is responsible for the preparation, development, and interpretation of the Nation’s economic accounts. National economic accounts cover GDP and related accounts. International economic accounts involve balance-of-payments data critical to monetary, trade, investment, exchange rate, and financial policies. BEA’s direct investment programs (foreign and domestic) are required by law and are critical to understanding the impact of U.S. and foreign multinational companies on the U.S. and world economies. Other BEA programs include the regional economic accounts, the basis for virtually all States’ spending and revenue forecasts, and industry economic accounts, which provide the infrastructure for other BEA accounts and many other key government statistics, such as BLS’ Producer Price Index. Congressional Appropriations for FY 2017
| Appropriation: $103.8 million | The FY 2017 appropriation for BEA was $103.8 million. This appropriation enabled BEA to maintain core programs that produce statistics that feed into the estimation of GDP and related statistics, are required by law, or are required for the administration of Federal programs. Highlights of the FY 2018 Budget Request and Major Program Changes The FY 2018 President’s Budget requests $97.0 million for BEA, a reduction of $6.8 million from the FY 2017 appropriation. This request incorporates necessary reductions while preserving the timeliness, relevance, and accuracy of economic statistics. The budget proposes three programmatic reductions which include efforts to separately measure the impact of small businesses on the U.S. economy, the incorporation of enhanced healthcare measures into the core GDP accounts, and trade in services data for dynamic industries of the U.S. economy, including R&D; intellectual property; and financial, health, and IT services. Careful consideration was given to which initiatives could be reduced with minimal impact to BEA’s core programs.
FY 16 FY 17 FY 18 Direct funding
($ millions) 105.1 103.8 97.0
Full-time permanent staff 499 488 480

16
Service Industries Account for an Increasing Share of the Economy Goods-producing and services-producing industries made up around 40 and 50 percent respectively of the U.S. economy back in the early Post World War II era. Measured by value added as a percentage of GDP, goods-producing industries, predominately manufacturing but also including construction, mining, and farming, peaked at 41.1 percent of the U.S. economy in 1948 and then steadily declined. Goods producing industries accounted for 18.2 percent of GDP in 2016. Services-producing industries, including business services, finance and insurance, real estate, and education and healthcare, meanwhile, experienced a consistently upward trajectory since the Post World War II period and accounted for 68.9 percent of GDP in 2016, its biggest portion on record.
Value added is the value of the goods and services produced by the U.S. economy less the value of the goods and services used up in production. Value added by industry is published both quarterly and annually, and covers industries defined by the 2007 North American Industry Classification System. Value added statistics are used by businesses, national and local policymakers, analysts, and academics to understand industry trends and the changing structure of the U.S. economy.

17
Bureau of Justice Statistics
BJS, of the Department of Justice (DOJ), is a principal source of Federal crime and justice statistics. BJS collects, analyzes, publishes, and disseminates statistical information on all aspects of the criminal justice system; assists State, Tribal, and local governments in gathering and analyzing justice statistics; and disseminates high value information and statistics to inform policymakers, researchers, criminal justice practitioners and the general public. BJS’ current statistical portfolio contains about fifty separate data collections composed of ongoing annual and periodic collections. Additionally, the statistical operations are complemented or supported by nearly two dozen ongoing research and development projects or activities. The suite of collections and other projects form an ongoing statistical information infrastructure that supports the production of timely, relevant national statistics. These statistics provide an evidence base for informing critical criminal justice decision making at all levels of government. Congressional Appropriations for FY 2017
| Appropriation: $49.9 million | The FY 2017 appropriation for BJS was $49.9 million, including $41.0 million for BJS’s CJSP. The appropriation allowed the Attorney General to set aside 2.0 percent of Office of Justice Program (OJP) funds made available for grant or reimbursement programs for use by the National Institute of Justice (NIJ) and BJS for research, evaluation, or statistical purposes, without regard to the original authorizations for the grant or reimbursement programs. The appropriation together with the set-aside enabled BJS to continue to its core mission. Highlights of the FY 2018 Budget Request and Major Program Changes The FY 2018 President’s Budget request includes $41.0 million to support BJS’s CJSP, plus an estimated $8.9 million for salaries and expenses. The requested funding would enable BJS to maintain its core collections and programs that produce key statistical trends, for example the:
• Annual Jail Survey; • Annual Probation and Parole Census;
FY 16 FY 17 FY 18 Direct funding
($ millions) 50.0 49.9 49.9
Full-time permanent staff 57 56 56

18
• Capital Punishment Statistics; • Federal Justice Statistics Program; • Jails in Indian Country; • National Corrections Reporting Program; • National Crime Victimization Survey (NCVS) and its supplements; • National Prisoner Statistics; • National Study of Youth in Custody; and • Survey of Sexual Victimization.
Additionally, BJS would complete special products such as using criminal history data to examine OJP program outcomes, using criminal history records to generate national and state recidivism estimates, and reporting on criminal justice employment and expenditures. BJS would also use funds to participate with local, state, national, and international organizations to recommend and develop standards for justice statistics and for dissemination and publication activities. The requested FY 2018 funds would support new or ongoing major initiatives that would enable BJS to, for example:
• adopt new technology to extract and transmit data from existing Federal, state, and local administrative data systems to improve the timeliness and accuracy of data;
• expand the NCVS to include additional states and increase coverage to include identify theft, fraud, stalking, and help-seeking behaviors; and
• reestablish the National Judicial Reporting Program and the State Courts Processing Statistics program to improve the collection of data on felony defendants and sentencing.
The President’s FY 2018 Budget also requests an increase to 3.0 percent of the OJP set-aside for BJS and NIJ, which will be used to support several ongoing projects, including data collection and analysis activities to support BJS’s Survey of Inmates in Local Jails and data collection activities and methodological enhancements to the NCVS. The set-aside funds will also support new projects, including the development of imputation and estimation procedures to use National Incident-Based Reporting Statistics data to produce national estimates of crimes known to law enforcement and efforts to expand the collection and analysis of Tribal justice statistics.

19
The Adult Correctional Population has been Declining At yearend 2015, an estimated 6,741,400 persons were under the supervision of adult correctional systems, about 1 in 37 adults, in the United States. This was a decrease of almost 2 percent from 2014. The U.S. correctional population is down 8 percent from its peak of 7,339,600 in 2007. Persons on probation made up the largest share (3,789,800 people) under correctional supervision in the U.S. in 2015, followed by those in state or Federal prison (1,526,800), on parole (870,500), and those incarcerated in local jails (728,200).
In addition to the 6.7 million persons under correctional supervision at yearend 2015, approximately 11 million people were admitted to and released from local jails during 2015, more than 600,000 admitted and released from state and Federal prisons, 2 million people entered and exited from probation, and about 470,000 persons entered and exited parole. These data come from 6 collections of administrative data that BJS conducts on an annual basis: the Annual Survey of Jails, Annual Surveys of Probation and Parole, Deaths in Custody Reporting Program, National Prisoner Statistics program, and National Corrections Reporting Program.

20
Bureau of Labor Statistics
BLS, of the Department of Labor (DOL), is a principal source of Federal labor and price statistics to support public and private decision making and is responsible for measuring labor market activity, working conditions, and price changes in the economy. BLS collects, processes, analyzes, and disseminates data on: employment and unemployment; projections of the labor force and employment by industry and occupation; prices and inflation at various levels of the economy; consumer expenditures; wages and employee benefits; occupational injuries and illnesses; and productivity and technological change in U.S. industries. Congressional Appropriations for FY 2017
| Appropriation: $609.0 million | The FY 2017 appropriation of $609.0 million kept BLS funding flat at the FY 2016 enacted level. In order to maintain current production and core programs at this funding level, BLS is curtailing spending on data improvements and development and research projects. In addition, BLS cancelled particular training, including program-wide training of staff and state partners. Highlights of the FY 2018 Budget Request and Major Program Changes The FY 2018 President’s Budget proposes $607.8 million in funding for BLS. In FY 2018, BLS would continue the production of core data series. In addition, the Current Employment Statistics (CES) and Producer Price Index (PPI) programs would implement industry reclassifications associated with 2017 revision to the North American Industry Classification System. The Consumer Price Index (CPI) program would continue to introduce an updated geographic-area sample based on the 2010 Decennial Census. The Survey of Occupational Injuries and Illnesses would further expand the use of computer-assisted coding to automatically classify detailed circumstances of workplace injuries and illnesses for additional circumstance types and occupations. The Industry Productivity Studies would expand industry coverage of labor productivity measures in the transportation sector. However, BLS would also implement non-permanent programmatic reductions to account for the FY 2018 request. These may temporarily affect the quality and quantity of select BLS products. BLS may need to delay or defer spending on implementation of certain data improvements, development and research projects, and stakeholder outreach efforts. In addition to considering
FY 16 FY 17 FY 18 Direct funding
(millions $) 609.0 609.0 607.8
Full-time permanent staff 2,036 2,035 2,035

21
efficiencies and changes in BLS operations, the plan for FY 2018 includes changes to some programs that may be necessary in order to reallocate funding to the production of core data series. A Look at Price Changes over the Past 20 Years The CPI all items index has increased at an average rate of 2.1 percent over the past 20 years. Excluding the more volatile food and energy categories, the average annual rate has been similar, 2.0 percent. However, the energy index in particular has been quite volatile, with the 12-month change peaking at over 29 percent in July 2008 (the era of $4.00 gasoline) and pulling the all items 12 month change over 5 percent. The energy index subsequently plunged, declining 28.1 percent in the 12-months ending July 2009, creating a negative all items change. Note that the index excluding food and energy remained between 1 and 3 percent for almost the whole 20-year span.
The CPI measures price change, and is often used as a cost-of-living measure. Specifically, the CPI measures the change in price over time of a market basket of consumer goods and services. The CPI is the most widely used measure of inflation and is utilized in many important official contexts, including to adjust Social Security payments and tax bracket thresholds. It provides information about price changes in the Nation's economy to government, business, labor, and the public, and is used by them as a guide to making economic decisions. In addition, the President, Congress, and the Federal Reserve Board use trends in the CPI to aid in formulating fiscal and monetary policies.

22
Bureau of Transportation Statistics
BTS, of the Department of Transportation (DOT), is a principal source of Federal transportation statistics. BTS compiles, analyzes, and disseminates information about the Nation’s transportation systems, including the extent, use, condition, performance, and consequences of those systems. Programs address topics such as freight and travel statistics, transportation economics, geospatial information systems, and airline transportation statistics. BTS administers the National Transportation Library, which maintains and facilitates access to statistical and other information needed for transportation decision making. BTS enhances the quality and effectiveness of DOT’s statistical programs research, development of guidelines, and promotion of improvements in data acquisition and use. Congressional Appropriations for FY 2017
| Appropriation: $26.0 million | The FY 2017 appropriation for BTS was $26.0 million, which reflects the authorized funding level in the Fixing America's Surface Transportation (FAST) Act, sec. 6002 (a)(6). As a result of this appropriation BTS was unable to establish the Travel Data Initiative to fill data gaps in passenger travel and vehicle fleets. At this funding level, BTS supported critical travel, freight, economic, and safety statistics programs, as well as work important in geospatial analysis, transportation economics, and the information preservation and dissemination services of the National Transportation Library. Highlights of the FY 2018 Budget Request and Major Program Changes The FY 2018 President's Budget request is $26.0 million. At this level, BTS would maintain its priority core programs mandated by the Congress and pursue efforts to improve efficiency and effectiveness of the agency, while incorporating more current information from alternative and non-traditional data sources into BTS products. In FY 2018, BTS would expand its Close Calls Reporting Program through reimbursable agreements with agency partners who seek better statistics and analysis on conditions that contribute to operational safety risks. BTS would also initiate a railroad tank car modification reporting program under the FAST Act (sec. 7308) with reimbursable funding from the Pipeline and Hazardous Materials Safety Administration.
FY 16 FY 17 FY 18 Direct funding
(millions $) 26.0 26.0 26.0
Full-time permanent staff 66 68 75
23
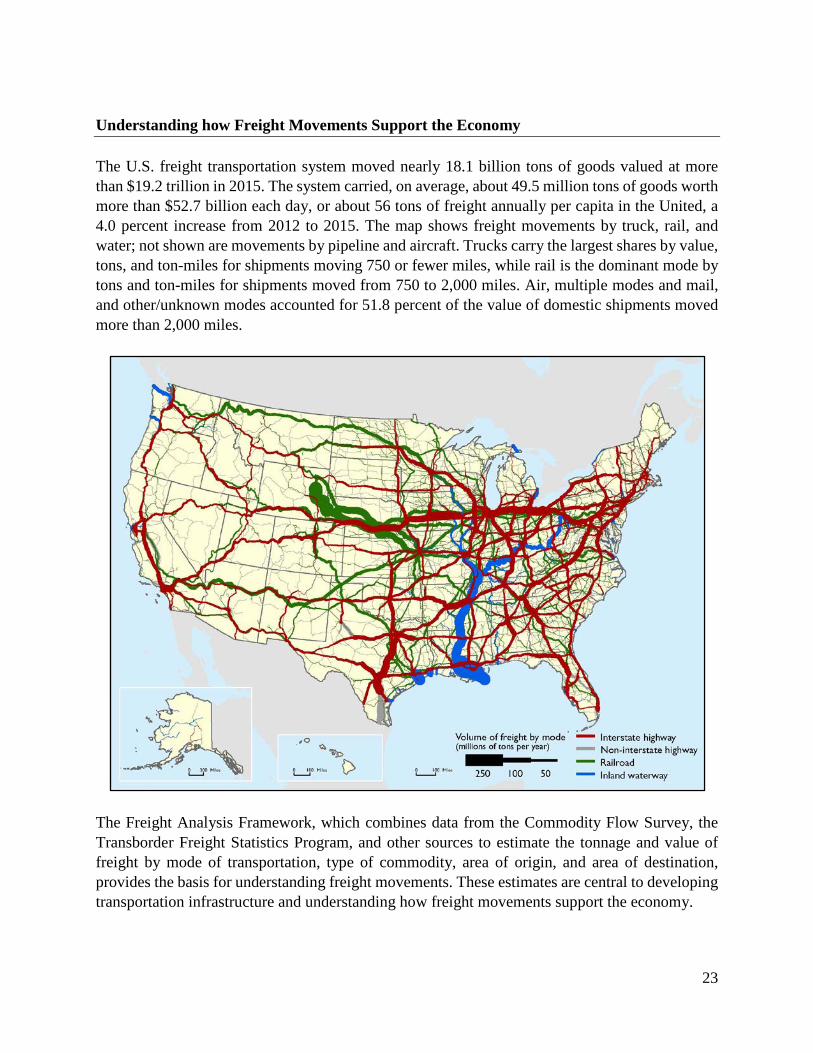
Understanding how Freight Movements Support the Economy The U.S. freight transportation system moved nearly 18.1 billion tons of goods valued at more than $19.2 trillion in 2015. The system carried, on average, about 49.5 million tons of goods worth more than $52.7 billion each day, or about 56 tons of freight annually per capita in the United, a 4.0 percent increase from 2012 to 2015. The map shows freight movements by truck, rail, and water; not shown are movements by pipeline and aircraft. Trucks carry the largest shares by value, tons, and ton-miles for shipments moving 750 or fewer miles, while rail is the dominant mode by tons and ton-miles for shipments moved from 750 to 2,000 miles. Air, multiple modes and mail, and other/unknown modes accounted for 51.8 percent of the value of domestic shipments moved more than 2,000 miles.
The Freight Analysis Framework, which combines data from the Commodity Flow Survey, the Transborder Freight Statistics Program, and other sources to estimate the tonnage and value of freight by mode of transportation, type of commodity, area of origin, and area of destination, provides the basis for understanding freight movements. These estimates are central to developing transportation infrastructure and understanding how freight movements support the economy.

24
Economic Research Service
ERS, of the Department of Agriculture (USDA), is a principal source of Federal agriculture statistics. ERS provides economic and other social science research and analysis to inform public and private decision making on agriculture, food, natural resources, and rural America. ERS is a primary source of statistical indicators that gauge the health of the farm sector (including farm income estimates and projections), assess the current and expected performance of the agricultural sector (including trade), and provide measures of food security here and abroad. ERS provides evidence-based policy-relevant findings through its statistics, indicators, and research that inform USDA decision making. Congressional Appropriations for FY 2017
| Appropriation: $86.8 million | The FY 2017 appropriation for ERS was $86.8 million , slightly higher than the FY 2016 appropriation. As with the FY 2016 appropriation, ERS fully funded the GSA rent and DHS security costs that were decentralized and transferred to the Agency, while maintaining its highest priority core programs of research, data, and market outlook. In addition to continuing ERS’ core program of research, the omnibus appropriation funded $626 thousand for cooperative agreements on groundwater modeling and drought resilience, which is part of ERS’ initiative to analyze linkages between shifting water supplies, farming practices, and food production using enhanced agricultural-environmental models for more precise measures of key relationships and integrated data from survey and administrative sources. ERS will expand the analysis to examine interactions with groundwater resources, as well as provide more regionally specific results accounting for local variation in conditions and the institutions that govern farmers' access to water. ERS continues work on a second initiative analyzing barriers to entry for beginning farmers and ranchers. A key analysis focus is identification of the extent to which USDA programs may help reduce those barriers. Highlights of the FY 2018 Budget Request and Major Program Changes The President’s Budget requests $76.7 million for FY 2018 and represents a net decrease of $10.1 million or 11.6 percent from ERS’ FY 2017 appropriation, which includes a reduction of 18 staff years. This level of funding would be dedicated to core programs of research, data analysis, and market outlook that provide expertise in the analysis of farming, commodity markets and trade,
FY 16 FY 17 FY 18 Direct funding
(millions $) 85.4 86.8 76.7
Full-time permanent staff 346 348 330

25
natural resources and the environment, rural communities, food safety, food markets and nutrition, and will reflect the Secretary of Agriculture’s priorities. In order to meet its mission while implementing the 11.6 percent budget reduction, ERS has requested the following:
(1) A decrease of $2.3 million for the Consumer Data Information Program that funds data purchases and research to develop new data sources that support research by ERS and the academic community on the food system beyond the farm gate.
(2) A decrease of $1.5 million and two staff years for Research Innovation for Improving Policy Effectiveness. At the proposed funding level, ERS would investigate alternative program structures that have potential to better target benefits and other strategies to improve program effectiveness.
(3) A decrease of $1.5 million and two staff years for Bioenergy/Renewable Energy Research and Data. ERS has invested in new data and expanded modeling capacity to understand the implications of bioenergy and renewable energy for power and fuels on the farm sector and land use. ERS would capitalize on existing tools and improve the focus of the program to meet the Agency’s core responsibilities for market and policy analysis.
(4) A decrease of $1.0 million and six staff years for International Activities. ERS would continue to provide annual estimates of international food security for low- and middle-income countries and prioritize research on international development to support this activity.
(5) A decrease of $1.0 million and one staff year for Increasing Drought Resilience. To sharpen the focus of the program, FY 2018 research on drought would analyze existing USDA programs such as implications for crop insurance and conservation program incentives to adopt practices that build resilience to mitigate the effects of drought.

26
A Small Share of Farms Contribute Most of the Value of Production According to the Agricultural Resource Management Survey (ARMS), 99 percent of the 2.1 million U.S. farms are family farms, where the principal operator and his or her relatives own the majority of the business. Small family farms – those with annual gross revenue less than $350,000 – account for about 90 percent of U.S. farms, half of all farmland, and a quarter of production. The 126,300 midsize and 59,000 large-scale family farms make up only 9 percent of U.S. farms, but contribute most of the value of production (65 percent). Over the past 25 years, production has shifted to midsize and large-scale farms. Nevertheless, small family farms produce a relative majority of two commodities: broilers and turkeys (57 percent) and hay (52 percent).
ARMS is USDA's primary source of information on the finances, production practices, and organization of America's farm businesses and the economic well-being of America's farm households. ARMS is a nationally representative annual survey targeting about 5,000 fields and 30,000 farms each year. ARMS data support official statistics and policy-relevant research that help decision makers weighing alternative policies and programs. ERS and NASS share funding and management responsibilities for ARMS.

27
Energy Information Agency
EIA, of the Department of Energy (DOE), is a principal source of Federal energy statistics. EIA collects, analyzes, and disseminates independent and impartial energy information to promote sound policymaking, efficient markets, and public understanding of energy and its interaction with the economy and the environment. EIA conducts a wide range of data collection, analysis, forecasting, and dissemination activities to ensure that its customers, including Congress, Federal and state government, the private sector, the broader public, and the media, have ready access to timely, reliable, and relevant energy information. This information is essential to inform a wide range of energy-related decisions and policy development. Congressional Appropriations for FY 2017
| Appropriation: $122.0 million | The FY 2017 appropriation for EIA of $122.0 million was equal to the FY 2016 appropriation. Recent budgets enabled EIA to deliver significant value by expanding program coverage. For example, EIA has:
(1) published near real-time hourly electricity operating data for the Lower 48 states; (2) released preliminary data from the 2015 Residential Energy Consumption Survey; (3) delivered analyses of complex issues like crude oil and LNG export scenarios; (4) published a daily Southern California Energy Report to monitor potential market effects
of regional natural gas restrictions; (5) launched a Coal Markets product with weekly production, price, and export data; (6) published statistical variances for the Weekly Natural Gas Storage Report, a Principal
Federal Economic Indicator; (7) provided estimates of the number of drilled but uncompleted wells in the seven key oil
and natural gas producing regions; (8) launched, in collaboration with the states of the Groundwater Protection Council, the first
publicly available national database of well level oil and gas data - the National Oil and Gas Gateway;
(9) published a review of EIA's data and projections for wind and solar technologies and began collection and publication of densified biomass data;
(10) led development of a North American energy information website, www.nacei.org, as part of a collaboration between the United States, Mexico, and Canada; and
FY 16 FY 17 FY 18 Direct funding
(millions $) 122.0 122.0 118.0
Full-time permanent staff 326 341 368

28
(11) developed state-of-the-art dissemination tools that have greatly increased 24/7 information accessibility.
While pursuing these enhancements, EIA maintained and strengthened its core program of statistical and analytical releases, including advances such as new streamlined presentations for all of EIA’s energy outlook products and the use of near real-time export data shared by U.S. Customs and Border Protection to improve EIA’s closely-watched weekly petroleum balances. Highlights of the FY 2018 Budget Request and Major Program Changes The FY 2018 President’s Budget request of $118.0 million represents a decrease of $4.0 million from the FY 2017 appropriation. EIA’s ability to adapt to a changing industry landscape in recent years has been essential to supporting the nation’s ongoing dialogue on important energy issues. The FY 2018 budget request enables EIA to maintain recent program enhancements, continue most core statistical and analysis activities, and follow through on planned cybersecurity initiatives. The FY 2018 request does not fully support efforts to address emerging issues, including:
(1) data and analysis important to U.S. regions, such as electricity transmission infrastructure and modernization, the economics of existing nuclear power, and more granular petroleum supply data;
(2) more timely and relevant energy consumption information using innovative collection modes to increase efficiency and integrate new data, including “behind the meter” measurement of electricity use by individual devices and appliances from a representative sample of homes and businesses; and
(3) enhanced models for global hydrocarbon supply and international electricity markets to account for the growing importance of foreign markets, including export markets for natural gas, in determining U.S. energy market conditions.

29
U.S. Crude Oil Production Expected to Reach Record High in 2018
In its Short-Term Energy Outlook (July 2017), EIA forecasts that total U.S. crude oil production will average 9.3 million barrels per day (b/d) in 2017, up 0.5 million b/d from 2016. In 2018, EIA expects crude oil production to reach an average of 9.9 million b/d, which would surpass the previous annual record of 9.6 million b/d set in 1970. EIA forecasts that most of the growth in U.S. crude oil production through the end of 2018 will come from tight rock formations within the Permian region in Texas and from the Federal Gulf of Mexico.
EIA collects crude oil production data directly from operators on one of its newest forms, the EIA-914 (Monthly Crude Oil, Lease Condensate, and Natural Gas Production Report), which started in 2015. EIA uses its Drilling Productivity Report, real-time data on drilling well completions and the productivity of new wells, with an econometric equation to arrive at the short-term forecast.

30
National Agricultural Statistics Service NASS, of the Department of Agriculture (USDA), is a principal source of Federal agricultural statistics. NASS collects, summarizes, analyzes, and publishes data on the number of farms and land in farms; acreage, yield, production, and stocks of crops; inventories and production of livestock, including eggs and dairy products; prices received by farmers for products and related indexes; prices paid indexes for commodities and services, and related indexes; agriculture production and marketing data; cold storage supplies; agricultural chemical use; and other related areas of the agricultural economy. On a reimbursable basis with DOL funds, NASS conducts the Farm Labor Survey, which provides estimates of the number of hired workers; average hours worked, and wage rates at national, regional, and selected State levels. NASS conducts the Census of Agriculture every five years. The census provides comprehensive data on the agricultural economy, including farm size, characteristics of farm operators, current agricultural industrial reports, land ownership, aquaculture, horticulture, organics, local foods, and farm irrigation practices at the national, State, and county levels. Congressional Appropriations for FY 2017
| Appropriation: $171.2 million | The FY 2017 appropriation represented an increase of $2.8 million over the FY 2016 appropriation. The appropriation reflected an overall increase for the Agricultural Estimates program, which enabled NASS to continue chemical use and floriculture programs. This funding expanded current feed cost component surveys nationally. In addition, the FY 2017 appropriation remained the same for the Census of Agriculture (COA) program base associated with the customary, cyclical nature of the 5-year COA program. NASS continues the cyclical work of the five general categories of the COA base: direction and planning, content determination and design, mail list development and mail out, collection and processing, and publication and dissemination. NASS continued the annual Current Agriculture Industrial Reports (CAIR) and published results from the Local Foods Special Study to provide comprehensive geographically represented State-level data.
FY 16 FY 17 FY 18 Direct funding
(millions $) 168.4 171.2 185.7
Full-time permanent staff 1,038 1,037 1,022

31
Highlights of the FY 2018 Budget Request and Major Program Changes The FY 2018 President's Budget request of $185.7 million reflects a net increase of $14.4 million over the FY 2017 appropriation. At this level of funding, NASS would:
(1) conduct essential Federal Principal Economic Indicator surveys; (2) streamline the Agricultural Estimates program by reducing the sample sizes, which will
reduce the data published at the state level for the following programs: crop progress, agricultural prices, acreage, crop production, grain stocks & prospective plantings, cattle on feed, hogs & pigs reports, county estimates, January cattle, January sheep and goats, cotton ginnings estimates, cold storage estimates, milk production estimates, and dairy product estimates; and
(3) maintain the in-season production of the Cropland Data Layer for use by the Agricultural Statistics Board, continue production of Cropscape and Vegscape, and continue the development of remotely-sensed estimates of crop acreage (nationally) and yield for the Agricultural Statistics Board.
This funding also enables continuation of the annual COA. The entire COA Program consists of the COA conducted every five years; the Current Agricultural Industrial Report (CAIR) program; and Special Studies, for example, Census of Horticulture, Farm and Ranch Survey, and Census of Aquaculture. FY 2018 marks the fourth year in the five-year funding cycle for conducting the 2017 COA. The largest portion of the funding would be used for outsourcing all necessary functions associated with mailing and processing the COA. Due to the approximately 3 million forms mailed and processed only once every five years, NASS contracts with the National Processing Center (NPC) in Jeffersonville, Indiana, the same center responsible for the Census Bureau’s handling of the Decennial Census. Included in the funding increase request are expenses for outgoing and return postage. In order to achieve an acceptable level of response for every county, or county equivalent, in the United States, NASS will conduct extensive phone follow-up to mail and web non-respondents. In addition, NASS will conduct personal interviews for a small group of farmers and ranchers, and will use field enumeration to collect information from minority and disadvantaged populations such as American Indians, including reservation level data, and Hispanic producers.

32
Total Farm Expenditures Declined in 2015 and 2016 In 2016, both total and per farm production expenditures in the United States were lower than in the previous two years, according to ARMS data. Expenditures were down in every region, in every economic class, and in 12 of the 17 spending categories. Both crop farm and livestock farm production expenditures were down. Total expenditures by U.S. farms (not including Alaska and Hawaii) were $346.9 billion in 2016, down 4.4 percent from $362.8 billion in 2015. At $55.6 billion, feed was the largest expense item, accounting for 16 percent of farm expenditures. Of 15 large agricultural states, Nebraska had the highest per farm expenditures at $448,760, and Texas had the lowest at $98,965.
U.S. farm production expenditure data are collected as part of ARMS. NASS and ERS jointly conduct ARMS in the 48 contiguous states. ARMS provides annual data on the financial health of the farm sector and farm household finances. The resulting data are a major information source for farm bills and agriculture policy; the agricultural component of GDP; formulas to allocate tax dollars; decisions by lenders, manufacturers, suppliers, and retailers; and analysis and advocacy by farm commodity groups.

33
National Center for Education Statistics
NCES, of the Department of Education (ED), is a principal source of Federal education statistics. NCES collects, analyzes, and disseminates education statistics at all levels, from preschool through postsecondary and adult education, including statistics on international education. NCES collections include the Common Core of Data, the Integrated Postsecondary Education Data System, the National Postsecondary Student Aid Survey, the Early Childhood Longitudinal Study, the Trends in International Mathematics and Science Study, and the Program for International Student Assessment. The National Assessment of Educational Progress (NAEP) is NCES’ primary tool for assessing what American elementary and secondary students know and can do in academic subjects. NCES also administers the Statewide Longitudinal Data Systems (SLDS) program, which provides grants to the States for the management and analysis of individual student data to improve student academic performance and close achievement gaps. Congressional Appropriations for FY 2017
| Appropriation: $315.8 million | The FY 2017 appropriation of $315.8 million included $290.8 million for the Statistics, Assessment, and SLDS programs. This funding level allowed NCES to conduct comprehensive data collection on public elementary and secondary schools and districts; a survey of private elementary and secondary schools; the Integrated Postsecondary Education Data System, a comprehensive collection system that collects information on postsecondary institutions; the National Postsecondary Student Aid Survey; the Early Childhood Longitudinal Study: Kindergarten Class of 2010–2011; and work on international assessments, including the Trends in International Mathematics and Science Study and the Program for International Student Assessment. FY 2017 funding also provided support for NAEP reading, mathematics, and science assessments in 4th, 8th, and 12th grades. Funds from this appropriation also support the SLDS program in improving student achievement.
FY 16 FY 17 FY 18 Direct funding
(millions $) 327.5 315.8 330.1
Full-time permanent staff 93 95 95

34
Highlights of the FY 2018 Budget Request and Major Program Changes The FY 2018 President’s Budget request of $330.1 million is $14.3 million more than the FY 2017 appropriation. The majority of the budget request ($302.9 million) is to fund the Statistics, Assessment, and SLDS programs. Funding for the Statistics program would allow NCES to maintain its data collection and analyses activities. The request for the Assessment program would provide support for the NAEP. The request for SLDS includes funding for grant continuations and for activities to improve data coordination, quality, and use for all States. Using Process Data to Improve our Understanding of Student Performance NCES has moved the NAEP away from paper-and-pencil to a digitally-based assessment (DBA). In addition to students’ responses to test items, DBA allows for the collection of data on student actions and behaviors while participating in an assessment, referred to as process data. It can inform item development, help to monitor administration, enrich reporting, and contribute to innovation in assessments. Process data include: keystrokes, pauses, changing answers, time spent on an item, and use of a drop-down menu and tool, such as a calculators or the thesaurus. Although not considered in assessment scores, this data can then be aggregated and analyzed to achieve much richer understandings of students’ performances. The data can also be used to create detailed models of student performance, investigate differences in subgroup performance and enhance reporting to better illustrate and explain achievement gaps and other differences in performance. Using this process data, this chart illustrates how eight fourth grade students spent their time during the reading assessment. Shades of blue indicate the student is reading a page of the assessment. Brown and green segments represent each item on the assessment. With time on the horizontal axis, this chart displays both the order of students’ actions and how long they engaged in each action. This type of process data advances our ability to better understand student performance.

35
National Center for Health Statistics NCHS, of the Department of Health and Human Services (HHS), is a principal source of Federal health statistics. NCHS is responsible for the collection, maintenance, analysis, and dissemination of statistics on the nature and extent of the health, illness, and disability of the U.S. population; the impact of illness and disability on the economy; the effects of environmental, social, and other health hazards; health care costs and financing; family formation, growth, and dissolution; and vital events (births and deaths). NCHS has also placed emphasis on improving health and health care data systems and enhancing internationally comparable measures of disability. Congressional Appropriations for FY 2017
| Appropriation: $160.4 million | The FY 2017 appropriation of $160.4 million represents level funding with FY 2016 actual funding received. This amount included funds for the CDC Working Capital Fund for business services; in the past, these services were funded centrally at CDC. In FY 2016 about $17.0 million of the appropriation went to the Working Capital Fund. The funded level allowed NCHS to:
(1) conduct the National Health Interview Survey (NHIS) to provide data for monitoring trends in illness and disability and to track progress toward achieving national health objectives;
(2) maintain full field operations for the National Health and Nutrition Examination Survey (NHANES) to provide nationally representative data on the health and nutritional status of adults and children, including prevalence of diagnosed and undiagnosed conditions;
(3) conduct the National Survey of Family Growth (NSFG) to provide data on reproductive health, fertility, and family life that can be used to plan health services and health education programs;
(4) collect a full 12 months of birth and death records from States and territories to provide the Nation’s official vital statistics;
(5) conduct selected components of the National Health Care Surveys to reflect changing patterns of health care delivery;
(6) research and evaluate statistical methods for use by NCHS and the broader scientific community; and
(7) enhance the quality and usability of tools available to the public to access and analyze data.
FY 16 FY 17 FY 18 Direct funding
(millions $) 160.4 160.4 155.0
Full-time permanent staff 508 503 443

36
Highlights of the FY 2018 Budget Request and Major Program Changes The FY 2018 President’s Budget request of $155.0 million is a $5.4 million decrease from the FY 2017 appropriation. With this decrease, NCHS would maintain major data collection systems but would defer development of new enhancements or new initiatives. The FY 2018 Budget request would maintain the capacity of NCHS to monitor key health indicators by supporting its ongoing health and healthcare surveys and data collection systems, using personal interviews, healthcare records, physical examinations, diagnostic procedures, lab tests, and vital event registrations. The request would maintain full field operations for the NHANES and the NHIS. NCHS would continue to integrate data collected from its hospital and facility surveys into one survey called the National Hospital Care Survey (NHCS). This includes NHCS emergency department and outpatient department data including ambulatory surgery, collected by the National Hospital Ambulatory Medical Survey; and data on substance-involved emergency department visits formerly collected by SAMHSA’s Drug Abuse Warning Network. NCHS would continue transitioning from manual data collection to electronic data collection for the NHCS, which is expected to improve both timeliness and quality of data. NCHS would continue to investigate ways to incorporate administrative data and electronic health record information into the family of health care provider surveys. This funding would maintain support for electronic reporting of deaths by the States to provide information on deaths of public health importance, including prescription drug overdose-related deaths. This support has played a critical role in dramatically improving the timeliness of mortality reporting. With the requested budget, NCHS would explore ways to improve data collection efficiencies while preserving data quality and utility.
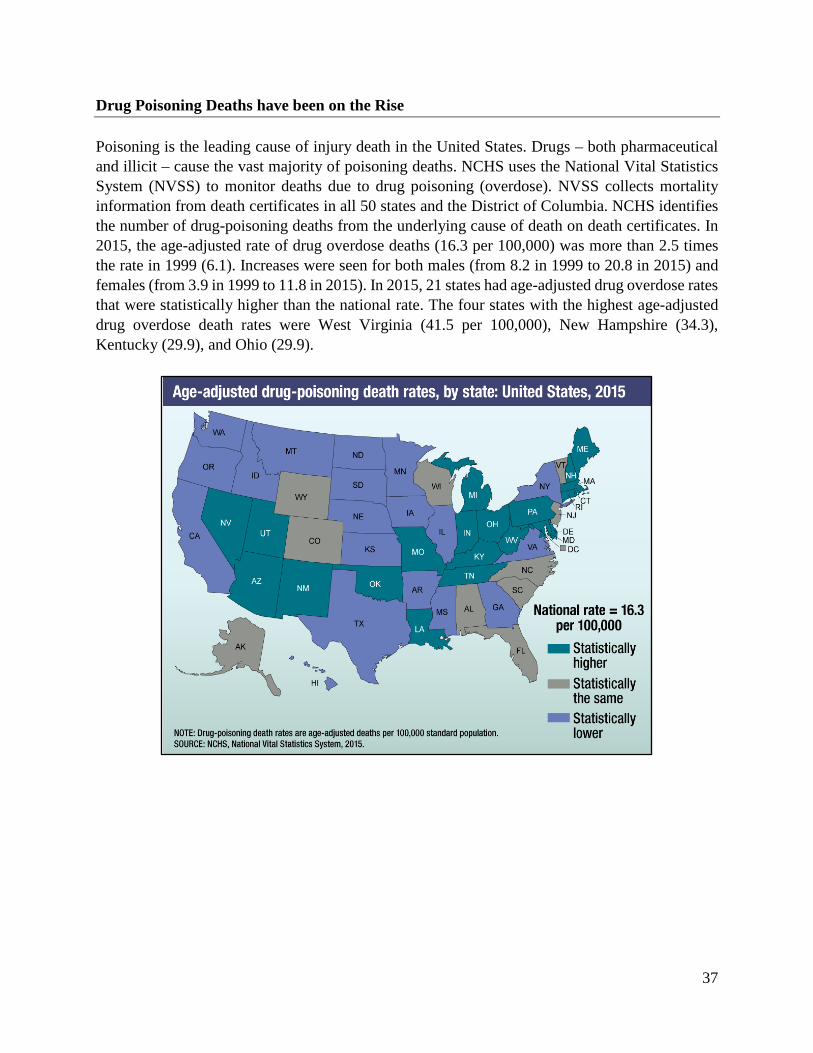
37
Drug Poisoning Deaths have been on the Rise Poisoning is the leading cause of injury death in the United States. Drugs – both pharmaceutical and illicit – cause the vast majority of poisoning deaths. NCHS uses the National Vital Statistics System (NVSS) to monitor deaths due to drug poisoning (overdose). NVSS collects mortality information from death certificates in all 50 states and the District of Columbia. NCHS identifies the number of drug-poisoning deaths from the underlying cause of death on death certificates. In 2015, the age-adjusted rate of drug overdose deaths (16.3 per 100,000) was more than 2.5 times the rate in 1999 (6.1). Increases were seen for both males (from 8.2 in 1999 to 20.8 in 2015) and females (from 3.9 in 1999 to 11.8 in 2015). In 2015, 21 states had age-adjusted drug overdose rates that were statistically higher than the national rate. The four states with the highest age-adjusted drug overdose death rates were West Virginia (41.5 per 100,000), New Hampshire (34.3), Kentucky (29.9), and Ohio (29.9).

38
National Center for Science and Engineering Statistics
NCSES, of the National Science Foundation (NSF), is a principal source of Federal statistics about the science and engineering enterprise and serves as the central Federal clearinghouse for the collection, interpretation, analysis, and dissemination of objective data on science, engineering, technology, and research and development. NCSES is called on to support the collection of statistical data on research and development trends, the science and engineering workforce, U.S. competitiveness, and the condition and progress of the Nation’s science, technology, engineering, and mathematics (STEM) education; to support research using the data it collects and on methodologies in areas related to the work of the Center; and to support the education and training of researchers in the use of its own and other large-scale, nationally representative data sets. NCSES designs, supports, and directs a coordinated collection of periodic national surveys and performs a variety of other data collections and research, providing policymakers, researchers, and other decision makers with high quality data and analysis on research and development, innovation, the education of scientists and engineers, and the science and engineering workforce. Congressional Appropriations for FY 2017
| Appropriation: $60.0 million | The FY 2017 appropriation for NCSES was $60.0 million. The FY 2017 appropriation increased NCSES program funding by about $0.8 million with respect to actual FY 2016 program funding received and also included an increase of approximately $1.0 million for salaries and expenses over FY 2016 actual. At the FY 2017 appropriation funding level, NCSES maintained ongoing programs that provide the science policy community and researchers relevant, accurate, and timely information on the science and engineering enterprise. Specific survey enhancement projects related to questionnaire redesign and survey improvements are ongoing and support emerging data needs in the areas of career pathways for scientists and engineers and measures of product and process innovation. Highlights of the FY 2018 Budget Request and Major Program Changes The FY 2018 President’s Budget request of $56.9 million represents a decrease of $3.2 million below the FY 2017 appropriation estimate. With the FY 2018 requested funding, NCSES would maintain its core ongoing programmatic activities to measure research and development trends, the science and engineering workforce, U.S. competitiveness, and the condition and progress of
FY 16 FY 17 FY 18 Direct funding
(millions $) 58.3 60.0 56.9
Full-time permanent staff 50 52 56

39
STEM education. Efficiencies and cost savings (through advancements in data collection techniques) are anticipated for the National Survey of College Graduates and the Survey of Doctorate Recipients and will be implemented on an expedited schedule to ensure cost savings are captured in FY 2018. NCSES will achieve further cost savings by reducing expenses for the acquisition of external, open market data sets and by reducing planned efforts to modernize the functionality and usability of its online data systems and tools. The Share of Research Doctorate Degrees Awarded to Women has Increased Broadly The percentage of research doctorate degrees awarded to women grew over the past two decades in all broad fields of study. In 2015, women earned the majority of research doctorates awarded in every broad field of study except physical and earth sciences, mathematics and computer sciences, and engineering. Overall, 46.2 percent of all research doctorate recipients in 2015 were women, an increase of 6.7 percentage points since 1995.
Doctoral education develops human resources that are critical to a nation’s progress – scientists, engineers, researchers, and scholars who create and share new knowledge and new ways of thinking that lead, directly and indirectly, to innovative products, services, and works of art. Statistics on research doctorate recipients come from the Survey of Earned Doctorates, and are widely used by university administrators, businesses, advocacy organizations, academic researchers, and policymakers to inform decisions that shape educational and economic programs and policies.

40
Office of Research, Evaluation, and Statistics
ORES, of the Social Security Administration (SSA), is a principal source of Federal labor, health, economic, and current demographic statistics. ORES performs demographic and socioeconomic research to assess the impact of program changes or alternatives. SSA also collects, tabulates, and publishes data on the Old-Age, Survivors, and Disability Insurance program; the Supplemental Security Income programs and their beneficiary populations; and earnings for people in employment covered under Social Security and Medicare. Congressional Appropriations for FY 2017
| Appropriation: $26.7 million | The FY 2017 appropriation for ORES was $26.7 million. ORES continued to fund two Disability Research Centers through the Disability Research Consortium and to conduct disability-related research focusing on collaborative efforts with other government agencies and interagency groups. The agency also continues to fund retirement-related research through the Retirement Research Consortium. ORES funds the design, development, testing, and data collection for an SSA-funded supplement to the re-engineered Survey of Income and Program Participation (SIPP). Highlights of the FY 2018 Budget Request and Major Program Changes The FY 2018 request for $32.5 million is an increase of $5.8 million compared to the FY 2017 appropriation, and would enable ORES to continue its core extramural research functions, including the fourth year of an initiative to develop and implement a business intelligence platform for research and data development. This increase results from the two-year funding of SIPP. Otherwise, ORES would continue its core extramural research functions in FY 2018, including research and training through the Disability Research and Retirement Research Consortia; supporting the Health and Retirement Study; collecting and coding data for the re-engineered SIPP; and publishing Social Security Programs throughout the World as part of a cooperative effort between ORES and the International Social Security Association.
FY 16 FY 17 FY 18 Direct funding
(millions $) 25.5 26.7 32.5
Full-time permanent staff 67 64 64

41
Women with Dual Entitlement, 1960-2015 The proportion of women aged 62 or older who are receiving benefits as dependents (that is, on the basis of their husbands’ earnings record only) declined from 57 percent in 1960 to 22 percent in 2015. At the same time, the proportion of women with dual entitlement (that is, paid on the basis of both their own earnings records and those of their husbands) increased from 5 percent in 1960 to 26 percent in 2015.

42
Statistics of Income
SOI, of the Internal Revenue Service (IRS), which resides in the Treasury Department, is a principal source of Federal income statistics. SOI collects, analyzes, and disseminates information on the Federal tax system. In support of this mission, SOI annually conducts more than 100 different projects that involve data from tax returns and information documents. Three of SOI’s largest projects produce annual income, financial, and tax data collected from individual, corporate, and partnership returns. Tax data reflecting U.S. and international economic activities are also collected annually from a number of other tax returns with smaller filing populations, including estate, gift, and excise tax returns. In addition, data are collected from information returns filed by tax-exempt organizations, issuers of tax-exempt government bonds, and from a wide range of information documents, such as Forms W-2 and 1099. The statistical data gathered, analyzed, and published by SOI are used by other Federal agencies, the White House, Congress, academics, researchers, and the general public to analyze tax policy, project tax revenues, and estimate the overall impact of tax law changes on the economy and the U.S. budget. Congressional Appropriations for FY 2017
| Appropriation: $34.3 million | The FY 2017 appropriation for SOI was $34.3 million. With the appropriated funds, SOI continued to support its critical base program requirements and provided all data files and other outputs to its primary customers. In a challenging budget environment, SOI has identified and pursued areas of significant resource savings. Specifically, SOI realized efficiencies by replacing or supplementing several statistical studies with data obtained from administrative files. In addition, SOI made substantial improvements to its IT infrastructure and has successfully transitioned all of its data applications to a modernized programming environment. Further, SOI began work on several new projects under its Joint Statistical Research Program, which partners external experts with SOI staff on projects related to tax administration. SOI also began redesigning its corporate products to comply with new IRS disclosure requirements, continued modernizing its Web content, expanded its percentile data for individual taxpayers, and continued its efforts to substantially improve its individual public-use files, which provide anonymized information on individual taxpayers.
FY 16 FY 17 FY 18 Direct funding
(millions $) 37.8 34.3 33.6
Full-time permanent staff 117 140 136

43
Highlights of the FY 2018 Budget Request and Major Program Changes The FY 2018 President’s Budget request of $33.6 million is a decrease from the FY 2017 appropriation. At this level of funding, maintaining current levels of service and supporting expanded statistical program requirements resulting from changes in the tax laws would be challenging. This decrease will likely lead to delays in releases of data relative to recent practice, reductions in published analyses of data, and slower than hoped modernization of its websites and electronic products. SOI would continue to pursue administrative data sources to replace or supplement sample-based datasets, pursue improvements to its public website and data visualizations to improve the user experience, and continue its efforts to use social media to provide information to the increasingly technology-savvy public. To foster research with the potential to impact tax administration, SOI would continue to sponsor a robust research program, working with experts within and outside government. SOI would use a portion of its budget to complete the redesign of its corporate publications to meet new IRS disclosure guidelines. Finally, SOI would continue to invest in critical data security features designed to ensure protection of confidential data.

44
Nearly all Income Tax is Paid by the Top 50 Percent of Earners For Tax Year 2014, individual taxpayers in the top 1 percent of adjusted gross income (AGI) reported 20.6 percent of total AGI and 39.5 percent of total income tax. Taxpayers included in the top 1 percent reported AGI of $465,626 or more. Taxpayers in the top 50 percent, who had AGI of $38,173 or more, reported the majority of all income tax, 97.3 percent. In all, taxpayers in this category reported 88.7 percent of AGI. For all returns, the average tax rate reported for Tax Year 2014 was 14.2 percent.12 Percentage of Adjusted Gross Income (AGI) and Income Tax, by Percentile Thresholds of AGI, Tax Year 2014
AGI is calculated based on a taxpayer’s total gross income, less deductions. To be included in the SOI income shares calculations, taxpayers must have reported positive AGI for Tax Year 2014. SOI published income tax and AGI calculations in the spring 2017 SOI Bulletin article, “Individual Income Tax Shares, 2014.” Income tax statistics are used by Federal agencies to evaluate tax policy and complete revenue estimation, researchers to study tax administration, and the public to gain insight into the tax system.
12 The average tax rate was computed by dividing total income tax by adjusted gross income

45
C H A P T E R 3
Statistical Programs of Other Agencies In addition to the 13 principal statistical agencies, there are approximately 94 other programs throughout the Federal government that were engaged in statistical activities of at least $3,000,000 in fiscal year (FY) 2016, or had estimated annual budgets of that amount in either FY 2017 or FY 2018.13 This chapter presents brief descriptions of these other statistical programs and a summary of major FY 2018 programmatic changes, organized by department or independent agency. In this chapter, FY 2016 numbers reflect actual funding received, FY 2017 reflect the appropriation estimate, and FY 2018 reflects the President’s Budget request. Additional information on direct funding and reimbursable and purchase programs can be found in Appendices A and B.
13 Compared to the FY 2017 report, this volume omits 22 Federal agencies that do not meet the new inclusion criteria of $3 million in estimated or direct funding for statistical activities in the forthcoming or either of the past two fiscal years. One additional agency, Food and Drug Administration, has been added.
Veterans Affairs: A Data-Driven Approach to Policy Planning and Budgeting For Veterans and their families, VA provides a broad range of benefits and services. The Veteran Population Projection Model 2016 (VetPop2016) provides the latest official Veteran population projection from the Department of Veterans Affairs (VA). VetPop2016 is used for strategic, policy planning and budgeting within VA and by external organizations such as other Federal agencies, Congress, state governments and other organizations.
The total Veteran population is predicted to decline from 20.0 million in 2017 to 13.6 million in 2037. While the total annual change is -1.9 percent, there is a higher rate of decline in the men Veteran population (-2.3 percent) due to the decrease in the predominantly male WWI, Korean, and Vietnam populations. The women Veteran population is slightly increasing, at an annual rate of +.07 percent.

46
Department of Agriculture
In addition to two principal statistical agencies (ERS and NASS, discussed in Chapter 2), the Department of Agriculture (USDA) has seven other agencies that maintain statistical programs. USDA produces current demographic; soil, forest, fish, wildlife, and public lands; agriculture; and labor statistics.
Major Program Changes for FY 2018 In response to the 2014 Farm Bill (PL113-79, Sec. 8301), FS would continue to instruct the Forest Inventory and Analysis program to revise its Strategic Plan and to address several new issues including an inventory of interior Alaska, improve forest carbon accounting, improve land use and land cover monitoring, and add an urban forest monitoring.
Agencies that maintain statistical programs: Direct Funding ($ millions)
FY 16 FY 17 FY 18 Agricultural Research Service (ARS) 7.2 7.2 7.2 Food and Nutrition Service (FNS) 39.9 39.9 41.2 Foreign Agricultural Services (FAS) 24.0 24.0 24.0 Forest Service (FS) 75.0 77.0 77.0 Natural Resources Conservation Service (NRCS) 142.0 134.1 131.6 Risk Management Agency (RMA) 4.0 4.0 4.0 World Agricultural Outlook Board (WAOB) 4.6 4.7 4.9

47
Department of Commerce
In addition to two principal statistical agencies (BEA and Census, discussed in Chapter 2), the Department of Commerce (DOC) has four other agencies that maintain statistical programs. DOC provides current and periodic economic; national accounts; current and periodic demographic; environment; soil, forest, fish, wildlife, and public lands statistics.
Major Program Changes for FY 2018 ESA would cease operations as a Bureau within the Department of Commerce. ESA functions would be consolidated between the Office of the Secretary, BEA, and the Census Bureau. The decrease for NESDIS includes termination of the Big Earth Data Initiative and a reduction to the Regional Climate Centers. NMFS would continue development and implementation of electronic monitoring and reporting applications to improve the timeliness, quality, integration, and accessibility fishery-dependent data and statistics for fishery managers, stock assessment scientists, the fishing industry, and other key stakeholders. NMFS is utilizing this funding to deliver cost-effective and sustainable electronic data collection solutions that enhance monitoring of fishing effort and catch in all U.S. fisheries. Electronic technologies are being employed in applications designed to increase the quantity of data collected, lower the costs and reduce the time for the entry of data, improve the quality of data available for statistical analysis, and lower the economic and time burden on fishermen for compliance with record keeping and reporting regulations.
Agencies that maintain statistical programs: Direct Funding ($ millions)
FY 16 FY 17 FY 18 Economics and Statistics Administration (ESA) 4.0 3.5 0.0 International Trade Administration (ITA) 7.4 7.0 7.3 National Environmental Satellite, Data, and Information Services (NESDIS)
52.7 53.0 50.6
National Marine Fisheries Service (NMFS) 65.6 66.2 66.2

48
Department of Defense
The Department of Defense (DOD) has two agencies that maintain statistical programs. DOD is a source of Federal current demographic, economic, health, and transportation statistics.
Major Program Changes for FY 2018 ACE would enhance its information systems to accept real time domestic electronic data in order to improve accuracy of domestic and foreign transportation statistics. ACE would also expand its water transportation data connection with landslide movements, and improve navigation information architecture to support national multimodal freight policy. ACE would collaborate with Customs and Border Protection to improve data communications systems to better target delinquent shippers for Harbor Maintenance Tax audits. OPA's increase is due to program growth, directed program increases, and organizational changes which would reduce the number of cuts being applied to OPA's statistical programs.
Agencies that maintain statistical programs: Direct Funding ($ millions)
FY 16 FY 17 FY 18 Army Corps of Engineers (ACE) 5.5 5.5 5.5 Office of People Analytics (OPA) 21.0 34.5 43.0

49
Department of Education
In addition to one principal agency (NCES, discussed in Chapter 2), the Department of Education (ED) has eight other agencies that maintain statistical programs and provide education and health statistics.
Major Program Changes for FY 2018 IES’s request reflects a reduction in funding for research on statistical and research methodology in education under the Research, Development, and Dissemination program. OCR’s request reflects an increase in funding which would be used to cover what was not funded in FY 2017 and to complete activities in FY 2018 in support of reestablishing planned data collection and analysis schedules for the Civil Rights Data Collection. The decrease in funding for OESE would terminate the Supporting Effective Instruction State Grants program in FY 2018. OII’s request includes additional funding under the Education, Innovation, and Research Program. Funding for OPE’s Fund for the Improvement of Postsecondary Education program and international programs would not be available in FY 2018.
Agencies that maintain statistical programs: Direct Funding ($ millions)
FY 16 FY 17 FY 18 Institute of Education Sciences, excluding NCES (IES) 18.5 16.1 15.7 Office of Career, Technical, and Adult Education (OCTAE) 2.9 3.6 2.9 Office for Civil Rights (OCR) 1.2 1.7 4.4 Office of Elementary and Secondary Education (OESE) 23.9 20.5 12.9 Office of Innovation and Improvement (OII) 4.7 3.2 10.4 Office of Planning, Evaluation, and Policy Development (OPEPD)
1.8 3.6 3.3
Office of Postsecondary Education (OPE) 7.4 9.5 8.6 Office of Special Education and Rehabilitative Services (OSERS)
21.9 24.0 24.0

50
Department of Energy
In addition to one principal agency (EIA, discussed in Chapter 2), the Department of Energy (DOE) has one additional agency that maintains statistical programs. DOE is a source for energy, minerals, and health statistics.
Major Program Changes for FY 2018 No major program changes are expected.
Agencies that maintain statistical programs: Direct Funding ($ millions)
FY 16 FY 17 FY 18 Office of Environment, Health, Safety, and Security (OEHSS)
12.8 12.8 13.0

51
Department of Health and Human Services
In addition to one principal agency (NCHS, discussed in Chapter 2), the Department of Health and Human Services (HHS) has 12 additional agencies that maintain statistical programs. These agencies include CDC and its 9 centers and offices and NIH and its 13 institutes, offices, and centers. HHS is a source for health and current demographic statistics.
Agencies that maintain statistical programs: Direct Funding ($ millions)
FY 16 FY 17
FY Administration for Children and Families (ACF) 112.6 115.9 86.3
Administration for Community Living (ACL) 15.3 9.5 6.9 Agency for Healthcare Research and Quality (AHRQ) 165.8 165.8 165.8
Center for Disease Control (CDC):
Center for Global Health 3.5 3.5 3.5 National Center on Birth Defects and Developmental Disabilities (NCBDDD)
4.0 4.0 4.0
National Center for Chronic Disease Prevention and Health Promotion (NCCDPHP)
62.0 57.4 59.0
National Center for Emerging Zoonotic and Infectious Diseases (NCEZID)
12.9 13.5 12.4
National Center for Environmental Health (NCEH) 21.0 21.0 21.0 National Center for HIV/AIDS, Viral Hepatitis, Sexually Transmitted Disease and Tuberculosis Prevention (NCHHSTP)
17.8 19.1 16.514
National Center for Immunization and Respiratory Diseases (NCIRD)
21.3 21.5 21.5
National Institute for Occupational Safety and Health (NIOSH)
23.8 25.1 25.1
Office of Public Health Scientific Services (PHSS) 19.4 17.7 17.7
Centers for Medicare and Medical Services (CMS) 51.1 50.0 50.0
Food and Drug Administration (FDA) 11.8 15.5 12.3 Health Resources and Services Administration (HRSA) 25.6 35.7 30.5
Indian Health Service (IHS) 5.5 5.5 5.5
14 In past submissions found in previous editions of this report, NCHHSTP reported their entire program budget. The revised amounts reflect applying the guidance to report only NCHHSTP’s statistical activities.

52
Agencies that maintain statistical programs: Direct Funding ($ millions)
FY 16 FY 17
FY National Institute of Health (NIH):
National Cancer Institute (NCI) 107.6 107.6 107.6 National Center for Complementary and Integrative Health (NCCIH)
8.5 7.8 6.9
National Heart, Lung, and Blood Institute (NHLBI) 190.8 164.1 133.8 National Human Genome Research Institute (NHGRI) 6.5 6.6 5.3 National Institute on Aging (NIA) 3.7 4.0 3.9 National Institute on Alcohol Abuse and Alcoholism (NIAAA)
7.1 7.1 7.1
National Institute of Allergy and Infectious Diseases (NIAID)
208.7 217.0 177.7
National Institute of Biomedical Imaging and Bioengineering (NIBIB)
5.1 5.1 5.1
National Institute of Child Health and Human Development (NICHD)
176.5 181.5 181.5
National Institute of Deafness and Other Communication Disorders (NIDCD)
7.5 7.3 5.4
National Institute of Diabetes and Digestive and Kidney Diseases (NIDDK)
24.1 24.9 24.0
National Institute on Drug Abuse (NIDA) 100.2 101.8 81.4 National Institute of Mental Health (NIMH) 2.6 2.9 8.6 Office of the Director (NIH/OD) 10.2 5.6 3.3
Office of the Assistant Secretary for Planning and Evaluation (ASPE)
18.9 18.8 18.8
Office of Population Affairs (OPA) 4.1 3.1 3.1 Substance Abuse and Mental Health Services Administration (SAMHSA)
153.4 153.2 128.0

53
Major Program Changes for FY 2018 ACF’s request reflects a decrease due to expected fluctuations in timing of data collection efforts for various major projects across program years. One-time program evaluations and the elimination of the State Health Insurance Assistance Program account for the decrease for ACL. Reductions in funding for CDC’s NCCDPHP are due to community programs entering the final year of investment. CDC’s NCEZID plans to terminate the Chronic Fatigue Syndrome and Prion funding lines in FY 2018 and has also completed projects with Ebola supplemental funds. Reduction in funding for CDC’s NCHHSTP reflects the completion of a major Health Department project that ended in FY 2017. HRSA’s Maternal and Child Health Bureau’s request reflects a decrease due to several activities that will no longer be performed in FY 2018. This includes the Child Trends activity, the Healthcare Systems Bureau’s national survey of donation attitudes and practices, and the Bureau of Primary Care’s national patient survey. NIH’s NIDCD anticipates a decrease due to typical grant cycling. NIH’s NIMH is working to develop a project designed that will create and test an algorithm to represent treatment strategies that can be used as alternatives to antipsychotic medications for children and adolescents who suffer from mood and/or behavioral disturbances OPA would continue development and implementation of an electronic health records-based system to collect utilization and performance data on the Title X family planning program.

54
Department of Homeland Security
The Department of Homeland Security (DHS) has three agencies that maintain statistical programs. DHS is a source of Federal safety, crime and justice, current demographic, and current economic statistics.
Agencies that maintain statistical programs: Direct Funding ($ millions)
FY 16 FY 17 FY 18 Customs and Border Protection (CBP) 21.2 21.7 22.6 Federal Emergency Management Agency (FEMA) 6.8 7.0 7.1 Office of Immigration Statistics (OIS) 2.6 3.1 3.3
Major Program Changes for FY 2018 CBP’s request reflects additional anticipated hiring.

55
Department of Housing and Urban Development
The Department of Housing and Urban Development (HUD) has three agencies that maintain statistical programs. HUD is a source of current Federal economic statistics.
Agencies that maintain statistical programs: Direct Funding ($ millions)
FY 16 FY 17 FY 18 Office of Housing (Housing) 12.9 14.1 12.7 Office of Policy Development and Research (PD&R) 44.5 45.9 45.6 Office of Public and Indian Housing (PIH) 10.0 11.8 14.1
Major Program Changes for FY 2018 PIH’s anticipated increase in funding for FY 2018 is attributable to:
• The Office of Real Estate Assessment Center contract for business management consulting, analyses, and implementation of a new physical inspection and oversight process mandate;
• Technical assistance in statistical and analytical support to aid in planning and development with respect to program implementation, quality assurance, data integrity and matching data from Veteran Administration to Housing and Urban Development data to support housing assistance for veterans;
• Procurement of about 9,000 physical inspections per year for public housing authorities, in which contractors bid for inspections on the auction website and the winners use HUD-REAC certified inspectors to conduct inspections.

56
Department of the Interior
The Department of the Interior (DOI) has five agencies that maintain statistical programs. DOI is a source of Federal energy and minerals; environment; and soil, forest, fish, wildlife, and public lands statistics.
Agencies that maintain statistical programs: Direct Funding ($ millions)
FY 16 FY 17 FY 18 Bureau of Ocean Energy Management (BOEM) 3.1 3.2 2.2 Bureau of Reclamation (BoR) 12.9 13.2 12.3 Fish and Wildlife Service (FWS) 8.1 8.3 5.8 Geological Survey (GS) 512.4 514.4 422.5 Office of Natural Resources Revenue (ONRR) 4.6 4.7 4.8
Major Program Changes for FY 2018 No major program changes are expected.

57
Department of Justice
In addition to one principal statistical agency (BJS, discussed in Chapter 2), the Department of Justice (DOJ) has four agencies that maintain statistical programs. DOJ is a source of Federal crime and justice statistics.
Agencies that maintain statistical programs: Direct Funding ($ millions)
FY 16 FY 17 FY 18 Bureau of Prisons (BOP) 10.5 9.3 9.6 Drug Enforcement Administration (DEA) 3.3 3.0 3.1 Federal Bureau of Investigation (FBI) 17.8 17.4 18.5 Office of Juvenile Justice and Delinquency Prevention (OJJDP)
5.0 5.0 5.0
Major Program Changes for FY 2018 Consolidation of units and functions within DEA has reduced total costs. In addition, DEA is decommissioning one costly reporting tool, and the costs to implement, maintain, and update the replacement system are decreasing. FBI plans to begin the National Use-of-Force data collection. It also plans a technical refresh of Uniform Crime Reporting (UCR) to improve the UCR Program data and improve the mechanism to prepare the UCR data for publishing with minimal manual intervention. The UCR Program will be able to accept and process data via XML and web services. FBI’s Crime Data Explorer will make UCR data more accessible to law enforcement and the general public. It will do this by providing high-level visualizations that inform and orient users to the data available, while making more granular details available via downloadable datasets and an application program interface. The UCR Program will begin releasing Animal Cruelty statistical information to the public in December 2017.

58
Department of Labor
In addition to one principal statistical agency (BLS, discussed in Chapter 2), the Department of Labor (DOL) has four agencies that maintain statistical programs. DOL is a source of Federal labor and safety statistics.
Agencies that maintain statistical programs: Direct Funding ($ millions)
FY 16 FY 17 FY 18 Chief Evaluation Office (CEO)15 30.7 30.6 8.0 Employment and Training Administration (ETA) 52.1 50.7 50.7 Occupational Safety and Health Administration (OSHA) 34.3 32.9 34.3 Wage and Hour Division (WHD) 5.1 5.8 5.8
Major Program Changes for FY 2018 No major program changes are expected.
15 The FY 2017 Appropriation Estimate includes a transfer of $22.6 million in addition to CEO’s direct appropriation. The FY 2018 Budget request reflects the direct appropriation as shown in the FY 2018 President’s Budget.

59
Department of State
The Department of State (State) has one agency that maintains statistical programs. It is a source of Federal health statistics.
Agencies that maintain statistical programs: Direct Funding ($ millions)
FY 16 FY 17 FY 18 Office of the U.S. Global AIDS Coordinator (OGAC) 6.8 6.9 7.0
Major Program Changes for FY 2018 No major program changes are expected.

60
Department of Transportation
In addition to one principal statistical agency (BTS, discussed in Chapter 2), the Department of Transportation (DOT) has seven other agencies that maintain statistical programs. DOT is a source of Federal transportation statistics.
Agencies that maintain statistical programs: Direct Funding ($ millions)
FY 16 FY 17 FY 18 Federal Aviation Administration (FAA) 8.8 8.8 9.4 Federal Highway Administration (FHWA) 12.9 15.4 16.3 Federal Motor Carrier Safety Administration (FMCSA) 5.9 4.1 3.4 Federal Railroad Administration (FRA) 5.9 6.8 7.1 Federal Transit Administration (FTA) 6.4 5.8 5.8 National Highway Traffic Safety Administration (NHTSA) 41.2 41.3 42.1 Pipeline and Hazardous Materials Safety Administration (PHMSA)
8.7 8.7 8.7
Major Program Changes for FY 2018 FHWA’s request reflects the new National Performance Management Research Data Set (NPMRDS) contract and an option year for the new UCR contract. NHTSA's request would allow the agency to continue the tasks related to the Data Modernization Project. These tasks include the addition of sample sites in the Crash Investigation Sampling System and dissemination of data collected from the modernized system.

61
Department of Veterans Affairs
The Department of Veterans Affairs (VA) has three agencies that maintain statistical programs. The VA is a source of Federal current demographic and health statistics.
Agencies that maintain statistical programs: Direct Funding ($ millions)
FY 16 FY 17 FY 18 National Center for Veterans Analysis and Statistics (NCVAS)16
4.2 5.3 5.3
Veterans Benefits Administration (VBA) 13.3 13.2 14.3 Veterans Health Administration (VHA) 99.4 104.6 111.0
Major Program Changes for FY 2018 VBA’s increased funding for statistical activities relates to contracts to model Veteran beneficiaries and analyze attributes of benefits usage. The VHA FY 2018 budget will be used to increase actuarial services, expand the Survey of Healthcare Experience of Patients program and hire statisticians to support the Veterans’ Choice program, capacity modeling and data queries. VHA plans to establish and maintain a TBI Veterans Health Registry with the intent of analyzing health care needs of Veterans with TBI, poly-traumatic injuries or major illnesses. There are also plans to update the Women’s Health Evaluation Initiative Database, review utilization of Medicare and Medicaid services and analyze national quality improvement data.
16 NCVAS is currently the rotating member agency on the ICSP.

62
Statistical Programs of
Other Federal Agencies Another eight agencies maintain statistical programs outside of the departments already listed.
Agencies that maintain statistical programs: Direct Funding ($ millions)
FY 16 FY 17 FY 18 Broadcasting Board of Governors (BBG) 6.5 8.4 7.6 Consumer Product Safety Commission (CPSC) 17.4 18.1 18.0 Corporation for National and Community Service (CNCS) 11.9 8.7 0.0 Environmental Protection Agency (EPA) 40.9 33.0 22.4 National Aeronautics and Space Administration (NASA) 11.0 10.4 10.4 National Science Foundation, excluding NCSES (NSF) 122.3 115.1 95.9
Social Security Administration (SSA):
Office of Research, Demonstration, and Employment Support (ORDES)
115.1 62.9 112.0
Office of Retirement Policy (ORP) 7.5 7.5 8.6 U.S. Agency for International Development (USAID) 109.5 111.7 79.2
Major Program Changes for FY 2018 BBG’s request includes initiatives for increasing research for critical areas such as Russian digital and video content; and interactive media for regions impacted by ISIL and violent extremism. The FY 2018 budget request proposes the elimination of CNCS. At EPA, funding for the second year of the national rivers and streams survey is reduced from $8.5 million to $5.9 million in the FY2018 President’s Budget request. The number of sites sampled in FY2018 will be reduced. The margin of error for condition estimates will likely increase for some regions of the country, though it is not anticipated that there will be a significant increase in the margins of error for the nation overall. The Safe Drinking Water Act requires that the Federal capitalization grants for the Drinking Water State Revolving Funds (DWSRF) be allocated to states based on the infrastructure needs of public water systems that are eligible to receive DWSRF. The EPA determines state needs through the Drinking Water Infrastructure Needs Survey and Assessment (DWINSA or Assessment), conducted every four years. Funding for the DWINSA will be reduced from $250K to $155K reflecting plans to conduct the sixth survey and assessment of water system infrastructure needs in-house without contractor support.

63
EEOC would conduct the annual EEO-1 Survey of Private Industrial Sectors and the biennial EEO-4 Survey of State and Local Government. EEOC would also make needed system changes, develop edit checks and reports, and hire additional staff for possible collection of pay data for the 2017 EEO-1 Survey of Private Industrial Sectors. NSF’s Long Term Ecological Research (LTER) Network Office, the Genealogy of Life program, and the Assembling, and Visualizing and Analyzing the Tree of Life program supported research databases have ended resulting in decreased funding in LTER and Systematics Biology research databases. The Program and Project Evaluation (PPE) program's funding is reduced as a result of the planned reduction of PPE. PPE will not call for proposals through the Promoting Research and Innovation in Methodologies for Evaluation solicitation. PPE will continue to support research projects to improve Science Technology Engineering and Mathematics (STEM) education evaluation, data privacy in research and evaluation, use of administrative data in evaluation, instrument development for metrics relevant to effective STEM education and continue to support monitoring and data collection efforts for Education and Human Resources programs. The reduced amount for the Social and Economic Sciences (SES) Division within the Social, Behavioral, and Economic Sciences Directorate is based on final or near final current year funding requirements for awards and contracts. SES support also includes multi-million dollar survey awards. SSA’s ORDES would increase funding for a new demonstration project that focuses on musculoskeletal impairments. The new project focuses on populations that may be at risk of ending up on disability benefits and seeks to prevent or delay the receipt of DI and SSI benefits by providing services and support to maintain or strengthen attachment to the labor market. The increased funding support would be used to test the potential of certain interventions to (1) increase labor force participation of people with disabilities, and (2) reduce or delay application for DI and SSI benefits. Funding for this new initiative also includes funds that SSA would provide to DOL to fund the implementation and technical assistance grants, and the remaining amount would be reserved for conducting the rigorous evaluation of the demonstration. The FY2018 request also reflects an increase in Section 1110 for continued work on the Occupational Information System (OIS) and the NIH IAA for Data Analytics/FAB Development. SSA’s ORP expanded the Understanding America Study (UAS) internet panel from 2,000 to 6,000 respondents. The increased panel size will allow for the survey results to be broken down by the 10 Social Security regions, the specific age groups that our Office of Communications focuses their outreach (i.e. 25-34, 25-54, and 55 and older), and other demographic characteristics such as income, race, or gender. Because the surveys are taken by the same respondents every two years, we can also track program knowledge and preferences over time.
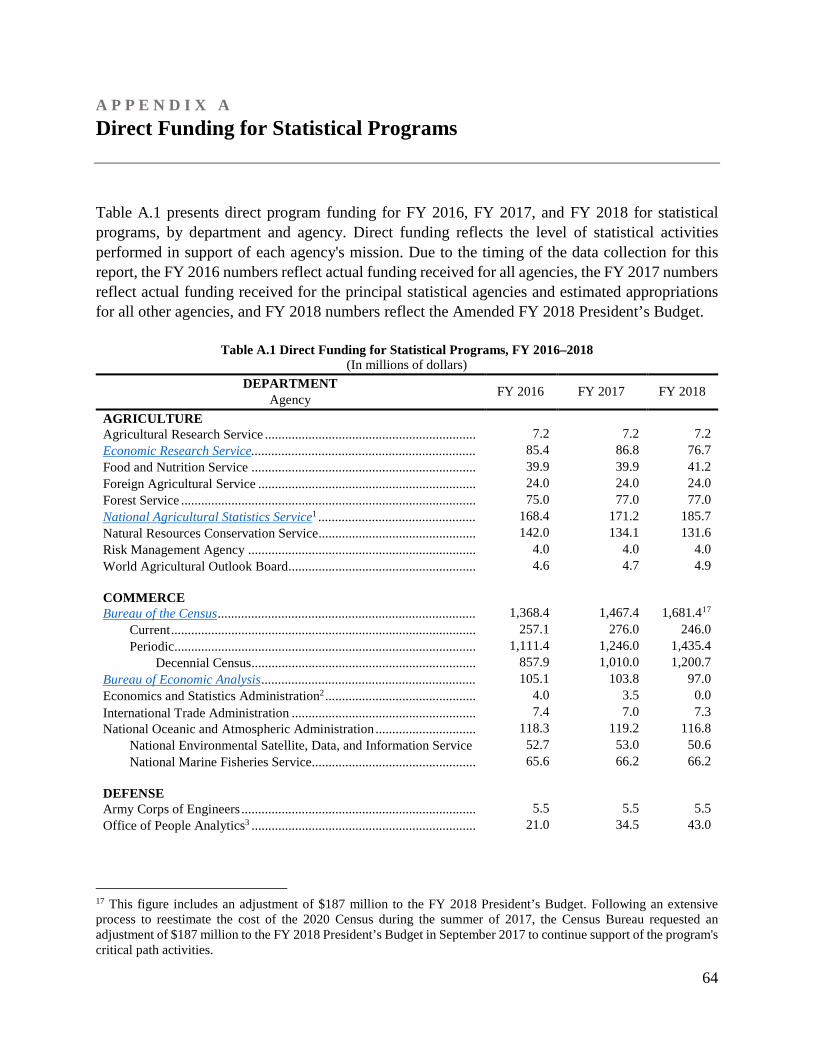
64
A P P E N D I X A Direct Funding for Statistical Programs Table A.1 presents direct program funding for FY 2016, FY 2017, and FY 2018 for statistical programs, by department and agency. Direct funding reflects the level of statistical activities performed in support of each agency's mission. Due to the timing of the data collection for this report, the FY 2016 numbers reflect actual funding received for all agencies, the FY 2017 numbers reflect actual funding received for the principal statistical agencies and estimated appropriations for all other agencies, and FY 2018 numbers reflect the Amended FY 2018 President’s Budget.
Table A.1 Direct Funding for Statistical Programs, FY 2016–2018 (In millions of dollars)
DEPARTMENT Agency FY 2016 FY 2017 FY 2018
AGRICULTURE Agricultural Research Service ............................................................... 7.2 7.2 7.2 Economic Research Service................................................................... 85.4 86.8 76.7 Food and Nutrition Service ................................................................... 39.9 39.9 41.2 Foreign Agricultural Service ................................................................. 24.0 24.0 24.0 Forest Service ........................................................................................ 75.0 77.0 77.0 National Agricultural Statistics Service1 ............................................... 168.4 171.2 185.7 Natural Resources Conservation Service ............................................... 142.0 134.1 131.6 Risk Management Agency .................................................................... 4.0 4.0 4.0 World Agricultural Outlook Board ........................................................ 4.6 4.7 4.9 COMMERCE Bureau of the Census ............................................................................. 1,368.4 1,467.4 1,681.417
Current ........................................................................................... 257.1 276.0 246.0 Periodic .......................................................................................... 1,111.4 1,246.0 1,435.4
Decennial Census ................................................................... 857.9 1,010.0 1,200.7 Bureau of Economic Analysis ................................................................ 105.1 103.8 97.0 Economics and Statistics Administration2 ............................................. 4.0 3.5 0.0 International Trade Administration ....................................................... 7.4 7.0 7.3 National Oceanic and Atmospheric Administration .............................. 118.3 119.2 116.8
National Environmental Satellite, Data, and Information Service 52.7 53.0 50.6 National Marine Fisheries Service................................................. 65.6 66.2 66.2
DEFENSE Army Corps of Engineers ...................................................................... 5.5 5.5 5.5 Office of People Analytics3 ................................................................... 21.0 34.5 43.0
17 This figure includes an adjustment of $187 million to the FY 2018 President’s Budget. Following an extensive process to reestimate the cost of the 2020 Census during the summer of 2017, the Census Bureau requested an adjustment of $187 million to the FY 2018 President’s Budget in September 2017 to continue support of the program's critical path activities.

65
Table A.1 Direct Funding for Statistical Programs, FY 2016–2018 (In millions of dollars)
DEPARTMENT Agency FY 2016 FY 2017 FY 2018
EDUCATION Institute of Education Sciences .............................................................. 346.0 331.9 345.8
National Center for Education Statistics (NCES) ......................... 327.5 315.8 330.1 Institute of Education Sciences (excluding NCES) ....................... 18.5 16.1 15.7
Office of Career, Technical, and Adult Education ................................ 2.9 3.6 2.9 Office for Civil Rights ........................................................................... 1.2 1.7 4.4 Office of Elementary and Secondary Education .................................... 23.9 20.5 12.9 Office of Innovation and Improvement ................................................. 4.7 3.2 10.4 Office of Planning, Evaluation, and Policy Development ..................... 1.8 3.6 3.3 Office of Postsecondary Education ....................................................... 7.4 9.5 8.6 Office of Special Education and Rehabilitative Services ...................... 21.9 24.0 24.0 ENERGY Energy Information Administration ....................................................... 122.0 122.0 118.0 Office of Environment, Health, Safety, and Security ............................ 12.8 12.8 13.0 HEALTH AND HUMAN SERVICES Administration for Children and Families ............................................. 112.6 115.9 86.3 Administration for Community Living .................................................. 15.3 9.5 6.9 Agency for Healthcare Research and Quality........................................ 165.8 165.8 165.8 Centers for Disease Control and Prevention (CDC) .............................. 508.5 494.2 478.3
National Center for Health Statistics (NCHS) .............................. 160.4 160.4 155.0 CDC (Excluding NCHS) ............................................................... 348.2 333.8 323.3
Center for Global Health ...................................................... 3.5 3.5 3.5 National Center on Birth Defects and Developmental
Disabilities4 ..................................................................... 4.0 4.0 4.0
National Center for Chronic Disease Prevention and Health Promotion ........................................................................
62.0 57.4 59.0
National Center for Emerging Zoonotic and Infectious Diseases5 .........................................................................
12.9 13.5 12.4
National Center for Environmental Health ........................... 21.0 21.0 21.0 National Center for HIV/AIDS, Viral Hepatitis, Sexually
Transmitted Disease, and Tuberculosis Prevention ........ 180.2 170.1 159.1
National Center for Immunization and Respiratory Diseases ........................................................................................
21.3 21.5 21.5
National Institute for Occupational Safety and Health ......... 23.8 25.1 25.1 Office of Public Health Scientific Services .......................... 19.4 17.7 17.7
Centers for Medicare and Medicaid Services ........................................ 51.1 50.0 50.0 Food and Drug Administration .............................................................. 11.8 15.5 12.3 Health Resources and Services Administration ..................................... 25.6 35.7 30.5 Indian Health Service ............................................................................ 5.5 5.5 5.5 National Institutes of Health .................................................................. 859.3 843.5 751.8
National Cancer Institute .............................................................. 107.6 107.6 107.6 National Center for Complementary and Integrative Health ........ 8.5 7.8 6.9 National Heart, Lung, and Blood Institute ................................... 190.8 164.1 133.8 National Human Genome Research Institute ............................... 6.5 6.6 5.3 National Institute on Aging .......................................................... 3.7 4.0 3.9 National Institute on Alcohol Abuse and Alcoholism .................. 7.1 7.1 7.1

66
Table A.1 Direct Funding for Statistical Programs, FY 2016–2018 (In millions of dollars)
DEPARTMENT Agency FY 2016 FY 2017 FY 2018
National Institute of Allergy and Infectious Diseases .................. 208.7 217.0 177.7 National Institute of Biomedical Imaging and Bioengineering .... 5.1 5.1 5.1 National Institute of Child Health and Human Development ...... 176.5 181.5 181.5 National Institute on Deafness and Other Communication
Disorders ................................................................................. 7.5 7.3 5.4
National Institute of Diabetes and Digestive and Kidney Diseases6 .................................................................................
24.1 24.9 24.0
National Institute on Drug Abuse ................................................. 100.2 101.8 81.4 National Institute of Mental Health .............................................. 2.6 2.9 8.6 Office of the Director ................................................................... 10.2 5.6 3.3
Office of the Assistant Secretary for Planning and Evaluation ............. 18.9 18.8 18.8 Office of Population Affairs .................................................................. 4.1 3.1 3.1 Substance Abuse and Mental Health Services Administration .............. 153.4 153.2 128.0 HOMELAND SECURITY Customs and Border Protection ............................................................. 21.2 21.7 22.6 Federal Emergency Management Agency ............................................. 6.8 7.0 7.1 Office of Immigration Statistics ............................................................ 2.6 3.1 3.3 HOUSING AND URBAN DEVELOPMENT Office of Housing7 ................................................................................. 12.9 14.1 12.7 Office of Policy Development and Research ......................................... 44.5 45.9 45.6 Office of Public and Indian Housing ..................................................... 10.0 11.8 14.1 INTERIOR Bureau of Ocean Energy Management .................................................. 3.1 3.2 2.2 Bureau of Reclamation .......................................................................... 12.9 13.2 12.3 Fish and Wildlife Service ...................................................................... 8.1 8.3 5.8 Geological Survey ................................................................................. 512.4 514.4 422.5 Office of Natural Resources Revenue ................................................... 4.6 4.7 4.8 JUSTICE Bureau of Justice Statistics .................................................................... 50.0 49.9 49.9 Bureau of Prisons .................................................................................. 10.5 9.3 9.6 Drug Enforcement Administration ........................................................ 3.3 3.0 3.1 Federal Bureau of Investigation ............................................................ 17.8 17.4 18.5 Office of Juvenile Justice and Delinquency Prevention ........................ 5.0 5.0 5.0 LABOR Bureau of Labor Statistics ..................................................................... 609.0 609.0 607.8 Chief Evaluation Office8 ....................................................................... 30.7 30.6 8.0 Employment and Training Administration ............................................ 52.1 50.7 50.7 Occupational Safety and Health Administration ................................... 34.3 32.9 34.3 Wage and Hour Division ....................................................................... 5.1 5.8 5.8 STATE Office of the U.S. Global AIDS Coordinator ........................................ 6.8 6.9 7.0 TRANSPORTATION

67
Table A.1 Direct Funding for Statistical Programs, FY 2016–2018 (In millions of dollars)
DEPARTMENT Agency FY 2016 FY 2017 FY 2018
Bureau of Transportation Statistics ....................................................... 26.0 26.0 26.0 Federal Aviation Administration ........................................................... 8.8 8.8 9.4 Federal Highway Administration .......................................................... 12.9 15.4 16.3 Federal Motor Carrier Safety Administration ........................................ 5.9 4.1 3.4 Federal Railroad Administration ........................................................... 5.9 6.8 7.1 Federal Transit Administration .............................................................. 6.4 5.8 5.8 National Highway Traffic Safety Administration ................................. 41.2 41.3 42.1 Pipeline and Hazardous Materials Safety Administration ..................... 8.7 8.7 8.7 TREASURY Statistics of Income (Internal Revenue Service) .................................... 37.8 34.3 33.6 VETERANS AFFAIRS National Center for Veterans Analysis and Statistics ............................ 4.2 5.3 5.3 Veterans Benefits Administration ......................................................... 13.3 13.2 14.3 Veterans Health Administration ............................................................ 99.4 104.6 111.0 OTHER AGENCIES Broadcasting Board of Governors ......................................................... 6.5 8.4 7.6 Consumer Product Safety Commission ................................................. 17.4 18.1 18.0 Corporation for National and Community Service9 .............................. 11.9 8.7 0.0 Environmental Protection Agency ......................................................... 40.9 33.0 22.4 National Aeronautics and Space Administration ................................... 11.0 10.4 10.4 National Science Foundation ................................................................. 180.6 175.2 152.8
National Center for Science and Engineering Statistics (NCSES) 58.3 60.0 56.9 National Science Foundation (Excluding NCSES) ....................... 122.3 115.1 95.9
Social Security Administration .............................................................. 148.1 97.2 153.1 Office of Research, Demonstration, and Employment Support..... 115.1 62.9 112.0 Office of Research, Evaluation, and Statistics .............................. 25.5 26.7 32.5 Office of Retirement Policy ........................................................... 7.5 7.5 8.6
U.S. Agency for International Development ......................................... 109.5 111.7 79.2 TOTAL ................................................................................................. 6,917.0 6,938.2 6,863.1
Total minus Decennial Census ...................................................... 6,059.1 5,928.2 5,662.4 NOTE: Figures shown in Table 1 have been provided by the agencies and are derived from “total budget authority”
shown in the program and financing schedule for these agencies in the FY 2018 President’s Budget. The names of certain agencies are indented in the table to indicate that the agency is a component of the larger organizational unit listed above it; its budget figures are included in the figures reported for the larger unit. Principal statistical agencies appear in underlined italics for ease of reference. Component amounts may not sum to the larger organizational unit amount because of rounding.
1 NASS totals include $42.2, $42.2 and $63.9 million in FY 2016, FY 2017, and FY 2018, respectively for conducting the periodic Census of Agriculture.
2 The FY 2018 President’s Budget request proposes the elimination of the agency. ESA functions will be consolidated between the Office of the Secretary, BEA, and the Census Bureau.
3 This new agency performs statistical activities that were formerly completed by the Defense Manpower Data Center. 4 The difference between NCBDDD estimates in last year’s report and the current report reflects a correction in the
coverage of activities included.

68
5 The difference between NCEZID FY 2016 estimates in last year’s report and the current report reflects a correction in the coverage of activities included.
6 The difference between NIDDK estimates in last year’s report and the current report reflects a correction in the coverage of activities included.
7 The difference between Housing estimates in last year’s report and the current report reflects a correction in the coverage of activities included.
8 The FY 2017 Appropriation Estimate includes a transfer of $22.6 million in addition to CEO’s direct appropriation. The FY 2018 Budget Request estimate reflects the direct appropriation as shown in the FY 2018 President’s Request.
9 The President’s FY 2018 Budget request proposes the elimination of the agency.

69
A P P E N D I X B Reimbursable and Purchase Programs Table B.1 presents total reimbursements and purchases funding for FY 2016, FY 2017, and FY 2018 for statistical programs, by department and agency Reimbursements Agencies whose missions are primarily or entirely statistical often perform statistical work for others on a reimbursable basis. These reimbursements may come from other agencies within the same department or from other Federal agencies, State, Tribal, territorial, local governments, and occasionally the private sector or foreign governments. Sometimes data collected by one agency for its programmatic purposes can be used for a different programmatic purpose in another agency. Further, some agencies, like the Administration for Children and Families of the Department of Health and Human Services (HHS), have reimbursable programs but do not necessarily perform all the statistical work. Rather, they use part of the reimbursable program money to purchase statistical work from other Federal agencies. Purchases Agencies may also contract for statistical services with other Federal agencies; State, Tribal, territorial, and local governments; or private sector organizations. In certain cases, some agencies may purchase more than their direct funding for statistics allows because they receive the difference from other Federal agencies under their reimbursable programs.
Table B.1 Reimbursable and Purchase Programs, FY 2018 (In millions of dollars)
DEPARTMENT Agency
Reimbursements Purchases
TOTA
L
Stat
e/Lo
cal/T
ribal
G
over
nmen
ts
Priv
ate
Sect
or
Oth
er F
eder
al
Age
ncie
s
TOTA
L
Stat
e/Lo
cal/T
ribal
G
over
nmen
ts
Priv
ate
Sect
or
Oth
er F
eder
al
Age
ncie
s
AGRICULTURE Agricultural Research Service ........................... 0.0 0.0 0.0 0.0 2.8 0.0 0.0 2.8 Economic Research Service .............................. 5.0 0.0 0.0 5.0 9.8 0.2 2.0 7.6 Food and Nutrition Service ............................... 0.0 0.0 0.0 0.0 0.0 0.0 0.0 0.0 Foreign Agricultural Service ............................. 0.0 0.0 0.0 0.0 0.0 0.0 0.0 0.0 Forest Service .................................................... 9.3 6.2 1.4 1.6 17.4 8.4 7.2 1.8 National Agricultural Statistics Service ............ 10.5 2.5 0.0 8.0 52.9 48.5 0.0 4.4 Natural Resources Conservation Service .......... 2.6 0.0 0.0 2.6 4.4 3.6 0.6 0.2 Risk Management Agency ................................ 0.0 0.0 0.0 0.0 4.0 0.0 4.0 0.0

70
Table B.1 Reimbursable and Purchase Programs, FY 2018 (In millions of dollars)
DEPARTMENT Agency
Reimbursements Purchases
TOTA
L
Stat
e/Lo
cal/T
ribal
G
over
nmen
ts
Priv
ate
Sect
or
Oth
er F
eder
al
Age
ncie
s
TOTA
L
Stat
e/Lo
cal/T
ribal
G
over
nmen
ts
Priv
ate
Sect
or
Oth
er F
eder
al
Age
ncie
s
World Agricultural Outlook Board ................... 0.0 0.0 0.0 0.0 0.0 0.0 0.0 0.0 COMMERCE Bureau of the Census ........................................ 319.2 0.0 5.0 314.1 577.2 0.0 575.8 1.5 Bureau of Economic Analysis ........................... 3.8 0.0 0.4 3.4 1.7 0.0 0.0 1.7 Economics and Statistics Administration .......... 0.0 0.0 0.0 0.0 0.0 0.0 0.0 0.0 International Trade Administration ................... 0.1 0.0 0.0 0.1 3.8 0.0 3.5 0.3 National Oceanic and Atmospheric
Administration ........................................... 3.4 0.0 0.0 3.4 45.8 37.1 8.7 0.0
National Environmental Satellite, Data, and Information Service .....................
3.4 0.0 0.0 3.4 0.0 0.0 0.0 0.0
National Marine Fisheries Service ............. 0.0 0.0 0.0 0.0 45.8 37.1 8.7 0.0
DEFENSE Army Corps of Engineers .................................. 0.0 0.0 0.0 0.0 0.9 0.0 0.4 0.5 Office of People Analytics ................................ 0.0 0.0 0.0 0.0 0.0 0.0 0.0 0.0 EDUCATION Institute of Education Sciences ......................... 21.7 0.0 0.0 21.7 309.0 36.3 257.4 15.3
National Center for Education Statistics (NCES) ...............................................
6.0 0.0 0.0 6.0 280.9 36.3 229.3 15.3
Institute of Education Sciences (excluding NCES) ................................................
15.7 0.0 0.0 15.7 28.1 0.0 28.1 0.0
Office of Career, Technical, and Adult Education (OCTAE) ..................................
0.0 0.0 0.0 0.0 3.4 0.0 3.4
Office for Civil Rights ...................................... 0.0 0.0 0.0 0.0 3.6 0.0 3.6 0.0 Office of Elementary and Secondary Education 0.0 0.0 0.0 0.0 12.7 0.0 5.7 7.0 Office of Innovation and Improvement ............. 0.0 0.0 0.0 0.0 10.4 0.0 0.4 10.0 Office of Planning, Evaluation, and Policy
Development .............................................. 0.0 0.0 0.0 0.0 0.1 0.0 0.1 0.0
Office of Postsecondary Education ................... 0.0 0.0 0.0 0.0 9.5 0.0 6.8 2.7 Office of Special Education and Rehabilitative
Services ...................................................... 0.0 0.0 0.0 0.0 22.9 0.0 22.9 0.0
ENERGY Energy Information Administration .................. 1.1 0.0 0.0 1.1 1.6 0.2 0.1 1.3 Office of Environment, Health, Safety, and
Security ...................................................... 0.0 0.0 0.0 0.0 0.0 0.0 0.0 0.0
HEALTH AND HUMAN SERVICES Administration for Children and Families ......... 11.3 0.0 0.0 11.3 64.6 6.1 57.7 0.8 Administration for Community Living ............. 0.4 0.0 0.0 0.4 6.6 0.0 6.5 0.1 Agency for Healthcare Research and Quality ... 0.0 0.0 0.0 0.0 69.9 0.0 59.9 10.0

71
Table B.1 Reimbursable and Purchase Programs, FY 2018 (In millions of dollars)
DEPARTMENT Agency
Reimbursements Purchases
TOTA
L
Stat
e/Lo
cal/T
ribal
G
over
nmen
ts
Priv
ate
Sect
or
Oth
er F
eder
al
Age
ncie
s
TOTA
L
Stat
e/Lo
cal/T
ribal
G
over
nmen
ts
Priv
ate
Sect
or
Oth
er F
eder
al
Age
ncie
s
Centers for Disease Control and Prevention (CDC) ........................................................
68.7 0.0 3.4 65.2 353.1 197.3 120.0 35.9
National Center for Health Statistics (NCHS) .............................................
68.3 0.0 3.3 64.9 119.3 27.7 60.3 31.3
CDC (Excluding NCHS) ........................... 0.4 0.0 0.1 0.3 233.8 169.6 59.7 4.5 Center for Global Health .................... 0.0 0.0 0.0 0.0 0.0 0.0 0.0 0.0 National Center on Birth Defects and
Developmental Disabilities ......... 0.0 0.0 0.0 0.0 0.0 0.0 0.0 0.0
National Center for Chronic Disease Prevention and Health Promotion
0.3 0.0 0.0 0.3 59.0 46.1 11.8 1.1
National Center for Emerging Zoonotic and Infectious Diseases
0.0 0.0 0.0 0.0 0.0 0.0 0.0 0.0
National Center for Environmental Health ..........................................
0.0 0.0 0.0 0.0 0.0 0.0 0.0 0.0
National Center for HIV/AIDS, Viral Hepatitis, Sexually Transmitted Disease, and Tuberculosis Prevention ....................................
0.0 0.0 0.0 0.0 139.5 110.5 25.9 3.1
National Center for Immunization and Respiratory Diseases ...................
0.0 0.0 0.0 0.0 18.7 0.0 18.4 0.3
National Institute for Occupational Safety and Health ........................
0.1 0.0 0.1 0.0 0.4 0.0 0.4 0.0
Office of Public Health Scientific Services .......................................
0.0 0.0 0.0 0.0 16.2 13.0 3.2 0.0
Centers for Medicare and Medicaid Services .... 0.0 0.0 0.0 0.0 49.5 0.0 49.4 0.1 Food and Drug Administration ......................... 0.0 0.0 0.0 0.0 0.0 0.0 0.0 0.0 Health Resources and Services Administration 0.2 0.0 0.0 0.2 1.6 0.0 1.4 0.2 Indian Health Service ........................................ 0.0 0.0 0.0 0.0 0.0 0.0 0.0 0.0 National Institutes of Health ............................. 63.4 0.0 0.0 63.4 50.1 0.2 28.4 21.5
National Cancer Institute ............................. 0.0 0.0 0.0 0.0 0.5 0.0 0.0 0.5 National Center for Complementary and
Integrative Health ............................... 0.0 0.0 0.0 0.0 0.0 0.0 0.0 0.0
National Heart, Lung, and Blood Institute ... 0.0 0.0 0.0 0.0 3.8 0.0 0.0 3.8 National Human Genome Research Institute
............................................................ 0.0 0.0 0.0 0.0 0.4 0.2 0.2 0.0
National Institute on Aging ......................... 0.0 0.0 0.0 0.0 2.3 0.0 1.1 1.2 National Institute on Alcohol Abuse and
Alcoholism ......................................... 0.0 0.0 0.0 0.0 3.2 0.0 2.9 0.3
National Institute of Allergy and Infectious Diseases ..............................................
0.0 0.0 0.0 0.0 3.8 0.0 0.0 3.8
National Institute of Biomedical Imaging and Bioengineering .............................
0.0 0.0 0.0 0.0 0.0 0.0 0.0 0.0

72
Table B.1 Reimbursable and Purchase Programs, FY 2018 (In millions of dollars)
DEPARTMENT Agency
Reimbursements Purchases
TOTA
L
Stat
e/Lo
cal/T
ribal
G
over
nmen
ts
Priv
ate
Sect
or
Oth
er F
eder
al
Age
ncie
s
TOTA
L
Stat
e/Lo
cal/T
ribal
G
over
nmen
ts
Priv
ate
Sect
or
Oth
er F
eder
al
Age
ncie
s
National Institute of Child Health and Human Development ..........................
0.2 0.0 0.0 0.2 17.2 0.0 14.7 2.5
National Institute on Deafness and Other Communication Disorders ..................
0.0 0.0 0.0 0.0 5.3 0.0 3.8 1.5
National Institute of Diabetes and Digestive and Kidney Diseases ...........................
0.0 0.0 0.0 0.0 10.2 0.0 4.3 5.9
National Institute on Drug Abuse ................ 62.2 0.0 0.0 62.2 1.5 0.0 1.4 0.1 National Institute of Mental Health ............. 0.0 0.0 0.0 0.0 0.0 0.0 0.0 0.0 Office of the Director .................................. 1.0 0.0 0.0 1.0 2.0 0.0 0.0 2.0
Office of the Assistant Secretary for Planning and Evaluation .............................................
1.9 0.0 0.0 1.9 4.7 0.0 1.0 3.7
Office of Population Affairs .............................. 0.0 0.0 0.0 0.0 1.1 0.0 0.0 1.1 Substance Abuse and Mental Health Services
Administration ............................................. 0.0 0.0 0.0 0.0 0.0 0.0 0.0 0.0
HOMELAND SECURITY Customs and Border Protection ......................... 0.0 0.0 0.0 0.0 0.0 0.0 0.0 0.0 Federal Emergency Management Agency......... 0.0 0.0 0.0 0.0 0.2 0.0 0.2 0.0 Office of Immigration Statistics ........................ 0.0 0.0 0.0 0.0 1.0 0.0 1.0 0.0 HOUSING AND URBAN DEVELOPMENT Office of Housing .............................................. 0.0 0.0 0.0 0.0 9.0 0.0 9.0 0.0 Office of Policy Development and Research .... 0.0 0.0 0.0 0.0 45.6 0.0 3.1 42.6 Office of Public and Indian Housing ................. 0.0 0.0 0.0 0.0 14.1 0.0 14.1 0.0 INTERIOR Bureau of Ocean Energy Management ............. 0.0 0.0 0.0 0.0 0.0 0.0 0.0 0.0 Bureau of Reclamation ...................................... 0.0 0.0 0.0 0.0 4.9 0.3 0.0 4.7 Fish and Wildlife Service .................................. 0.0 0.0 0.0 0.0 0.0 0.0 0.0 0.0 Geological Survey ............................................. 223.5 69.4 20.9 133.1 20.1 0.0 20.1 0.0 Office of Natural Resources Revenue ............... 0.0 0.0 0.0 0.0 0.0 0.0 0.0 0.0 JUSTICE Bureau of Justice Statistics ............................... 44.6 0.0 0.0 44.6 79.6 3.8 26.2 49.6 Bureau of Prisons .............................................. 0.0 0.0 0.0 0.0 6.3 6.3 0.0 0.0 Drug Enforcement Administration .................... 0.0 0.0 0.0 0.0 0.0 0.0 0.0 0.0 Federal Bureau of Investigation ........................ 0.0 0.0 0.0 0.0 0.0 0.0 0.0 0.0 Office of Juvenile Justice and Delinquency
Prevention .................................................... 0.0 0.0 0.0 0.0 5.0 0.0 3.0 1.9
LABOR Bureau of Labor Statistics ................................. 31.9 0.0 0.5 31.4 177.4 79.0 8.0 90.4 Chief Evaluation Office .................................... 0.0 0.0 0.0 0.0 0.0 0.0 0.0 0.0

73
Table B.1 Reimbursable and Purchase Programs, FY 2018 (In millions of dollars)
DEPARTMENT Agency
Reimbursements Purchases
TOTA
L
Stat
e/Lo
cal/T
ribal
G
over
nmen
ts
Priv
ate
Sect
or
Oth
er F
eder
al
Age
ncie
s
TOTA
L
Stat
e/Lo
cal/T
ribal
G
over
nmen
ts
Priv
ate
Sect
or
Oth
er F
eder
al
Age
ncie
s
Employment and Training Administration ........ 0.6 0.0 0.0 0.6 45.2 44.6 0.6 0.0 Occupational Safety and Health Administration 0.0 0.0 0.0 0.0 0.8 0.0 0.8 0.0 Wage and Hour Division ................................... 0.0 0.0 0.0 0.0 2.5 2.0 0.5 0.0 STATE Office of the U.S. Global AIDS Coordinator .... 0.0 0.0 0.0 0.0 7.0 0.0 7.0 0.0 TRANSPORTATION Bureau of Transportation Statistics .................. 9.8 0.0 0.0 9.8 7.3 0.0 0.0 7.3 Federal Aviation Administration ....................... 0.0 0.0 0.0 0.0 0.0 0.0 0.0 0.0 Federal Highway Administration ...................... 0.0 0.0 0.0 0.0 3.1 0.0 3.1 0.0 Federal Motor Carrier Safety Administration ... 0.0 0.0 0.0 0.0 3.4 0.5 0.5 2.4 Federal Railroad Administration ....................... 0.2 0.0 0.0 0.2 3.9 0.0 3.9 0.0 Federal Transit Administration ......................... 0.0 0.0 0.0 0.0 5.2 0.0 3.9 1.2 National Highway Traffic Safety
Administration ............................................. 0.0 0.0 0.0 0.0 34.2 0.0 34.2 0.0
Pipeline and Hazardous Materials Safety Administration .............................................
1.0 0.0 0.0 1.0 0.0 0.0 0.0 0.0
TREASURY Statistics of Income (Internal Revenue Service) 2.2 0.0 0.0 2.2 0.0 0.0 0.0 0.0 VETERANS AFFAIRS National Center for Veterans Analysis and Statistics ............................................................
2.0 0.0 0.0 2.0 0.2 0.0 0.0 0.2
Veterans Benefits Administration ..................... 0.0 0.0 0.0 0.0 14.3 0.0 14.3 0.0 Veterans Health Administration ........................ 0.0 0.0 0.0 0.0 11.0 0.0 10.4 0.6 OTHER AGENCIES Broadcasting Board of Governors ..................... 0.0 0.0 0.0 0.0 0.0 0.0 0.0 0.0 Consumer Product Safety Commission ............. 3.5 0.0 0.0 3.5 6.1 0.2 5.9 0.0 Corporation for National and Community
Service ......................................................... 0.0 0.0 0.0 0.0 0.0 0.0 0.0 0.0
Environmental Protection Agency .................... 0.1 0.0 0.0 0.1 2.2 0.0 1.5 0.7 National Aeronautics and Space Administration...........................................................................
0.0 0.0 0.0 0.0 0.0 0.0 0.0 0.0
National Science Foundation ............................ 5.2 0.0 0.0 5.2 145.3 0.0 126.5 18.9 National Center for Science and
Engineering Statistics (NCSES) .......... 2.1 0.0 0.0 2.1 46.3 0.0 27.5 18.9
National Science Foundation (Excluding NCSES) ..............................................
3.1 0.0 0.0 3.1 99.0 0.0 99.0 0.0
Social Security Administration ......................... 1.1 0.0 0.4 0.7 122.9 0.0 76.4 46.5

74
Table B.1 Reimbursable and Purchase Programs, FY 2018 (In millions of dollars)
DEPARTMENT Agency
Reimbursements Purchases
TOTA
L
Stat
e/Lo
cal/T
ribal
G
over
nmen
ts
Priv
ate
Sect
or
Oth
er F
eder
al
Age
ncie
s
TOTA
L
Stat
e/Lo
cal/T
ribal
G
over
nmen
ts
Priv
ate
Sect
or
Oth
er F
eder
al
Age
ncie
s
Office of Research, Demonstration, and Employment Support ..........................
0.1 0.0 0.1 0.0 96.0 0.0 60.7 35.4
Office of Research, Evaluation, and Statistics ..............................................
1.1 0.0 0.4 0.7 21.6 0.0 15.7 5.9
Office of Retirement Policy ......................... 0.0 0.0 0.0 0.0 5.2 0.0 0.0 5.2 U.S. Agency for International Development ..... 0.0 0.0 0.0 0.0 79.2 0.3 57.3 21.6 TOTAL ............................................................. 848.2 78.2 32.1 738.0 2,551.8 474.8 1,658.0 419.0
NOTE: The names of certain agencies are indented in the table to indicate that the agency is a component of the larger organizational unit listed above it; its figures are included in the figures reported for the larger unit. Principal statistical agencies appear in underlined italics for ease of reference. Component amounts may not sum to total amounts due to rounding.

75
A P P E N D I X C Principal Statistical Agency Staffing Levels This report focuses on the budgetary resources devoted to statistical activities by Federal agencies. For additional perspective, Table C.1 provides information on the staffing levels of the principal statistical agencies. Staff engaged in statistical activities span a range of professional backgrounds. In addition to statisticians and mathematical statisticians, professionals such as economists and research scientists (e.g., health scientists, epidemiologists, and educational research scientists), also engage in significant statistical work. In Table C.1, for each principal statistical agency, counts of the agency’s Federal staff or appointments are available for the following categories in addition to the presented total:
• Full-time permanent staff • Other than full-time permanent staff • Statisticians (includes statisticians and mathematical statisticians, position series 1529 and
1530, respectively) • Economists (position series 0110) • Research scientists (includes health scientists, epidemiologists, and educational research
scientists, position series 0601, 0605, and 1730, respectively) • Other statistical personnel (includes social science analysts, economic assistants, spatial
data analysts, accountants, general engineers, geographers, cartographers, librarians, operations research analysts, statistical assistants, transportation specialists, and transportation industry analysts, position series 0101, 0119, 0301, 0510, 0801, 0150, 1370, 1410, 1515, 1531, 2101, and 2110, respectively)
Table C.1 Staffing Levels by Principal Statistical Agency
Principal Statistical Agency FY 2016 FY 2017 FY 2018 Bureau of the Census
Total ................................................................................. 12,996 16,521 14,755 Full-time permanent ..................................................... 5,808 7,265 6,543 Other than full-time permanent .................................... 7,188 9,256 8,212 Statisticians................................................................... 2,127 2,455 2,282 Economists ................................................................... 88 76 69 Research Scientists ....................................................... 0 0 0 Other Statistical Personnel ........................................... 0 0 0

76
Table C.1 Staffing Levels by Principal Statistical Agency Principal Statistical Agency FY 2016 FY 2017 FY 2018
Bureau of Economic Analysis Total ................................................................................. 517 506 494
Full-time permanent ..................................................... 499 488 480 Other than full-time permanent .................................... 18 18 14 Statisticians................................................................... 12 12 12 Economists ................................................................... 291 291 291 Research Scientists ....................................................... 0 0 0 Other Statistical Personnel ........................................... 53 53 53
Bureau of Justice Statistics
Total ................................................................................. 58 57 57 Full-time permanent ..................................................... 57 56 56 Other than full-time permanent .................................... 1 1 1 Statisticians................................................................... 38 36 36 Economists ................................................................... 0 0 0 Research Scientists ....................................................... 0 0 0 Other Statistical Personnel ........................................... 0 0 0
Bureau of Labor Statistics
Total ................................................................................. 2,430 2,410 2,410 Full-time permanent ..................................................... 2,036 2,035 2,035 Other than full-time permanent .................................... 394 375 375 Statisticians................................................................... 155 148 148 Economists ................................................................... 1,185 1,188 1,188 Research Scientists ....................................................... 5 6 6 Other Statistical Personnel ........................................... 408 387 387
Bureau of Transportation Statistics
Total ................................................................................. 66 71 80 Full-time permanent ..................................................... 66 68 75 Other than full-time permanent .................................... 0 3 5 Statisticians................................................................... 12 12 17 Economists ................................................................... 6 6 6 Research Scientists ....................................................... 0 0 0 Other Statistical Personnel ........................................... 37 35 35
Economic Research Service
Total ................................................................................. 352 355 337 Full-time permanent ..................................................... 346 348 330 Other than full-time permanent .................................... 6 7 7 Statisticians................................................................... 1 1 1 Economists ................................................................... 211 191 181 Research Scientists ....................................................... 0 0 0 Other Statistical Personnel ........................................... 8 8 8

77
Table C.1 Staffing Levels by Principal Statistical Agency Principal Statistical Agency FY 2016 FY 2017 FY 2018
Energy Information Administration Total ................................................................................. 329 343 370
Full-time permanent ..................................................... 326 341 368 Other than full-time permanent .................................... 3 2 2 Statisticians................................................................... 66 66 65 Economists ................................................................... 67 71 71 Research Scientists ....................................................... 63 75 75 Other Statistical Personnel ........................................... 11 11 9
National Agricultural Statistics Service
Total ................................................................................. 1,118 1,062 1,041 Full-time permanent ..................................................... 1,038 1,037 1,022 Other than full-time permanent .................................... 80 25 19 Statisticians................................................................... 634 634 660 Economists ................................................................... 0 0 0 Research Scientists ....................................................... 3 3 3 Other Statistical Personnel ........................................... 0 0 0
National Center for Education Statistics
Total ................................................................................. 120 112 115 Full-time permanent ..................................................... 93 95 95 Other than full-time permanent .................................... 27 17 20 Statisticians................................................................... 71 71 74 Economists ................................................................... 1 1 1 Research Scientists ....................................................... 0 0 0 Other Statistical Personnel ........................................... 0 0 0
National Center for Health Statistics
Total ................................................................................. 554 554 500 Full-time permanent ..................................................... 508 503 443 Other than full-time permanent .................................... 46 51 57 Statisticians................................................................... 166 164 158 Economists ................................................................... 4 4 0 Research Scientists ....................................................... 96 96 89 Other Statistical Personnel ........................................... 0 0 0
National Center for Science and Engineering Statistics (National Science Foundation)
Total ................................................................................. 52 53 57 Full-time permanent ..................................................... 50 52 56 Other than full-time permanent .................................... 2 1 1 Statisticians................................................................... 25 25 26 Economists ................................................................... 10 10 14 Research Scientists ....................................................... 5 5 5 Other Statistical Personnel ........................................... 0 0 0

78
Table C.1 Staffing Levels by Principal Statistical Agency Principal Statistical Agency FY 2016 FY 2017 FY 2018
Office of Research, Evaluation, and Statistics (Social Security Administration) Total ................................................................................. 69 65 65
Full-time permanent ..................................................... 67 64 64 Other than full-time permanent .................................... 2 1 1 Statisticians................................................................... 2 2 2 Economists ................................................................... 16 15 15 Research Scientists ....................................................... 16 13 13 Other Statistical Personnel ........................................... 35 35 35
Statistics of Income (Internal Revenue Service)
Total ................................................................................. 122 144 140 Full-time permanent ..................................................... 117 140 136 Other than full-time permanent .................................... 5 4 4 Statisticians................................................................... 25 26 26 Economists ................................................................... 39 38 38 Research Scientists ....................................................... 0 0 0 Other Statistical Personnel ........................................... 0 0 0

79
A P P E N D I X D Glossary Organizational acronyms used throughout this report are presented in this appendix table with their corresponding full name, website, and higher-level functional unit. Departments are presented first, with agencies following. Entries within each subsection are sorted alphabetically by their acronym. Agencies with no higher-level functional unit are footnoted.
Table D.1 Acronyms and Websites for Departments and Agencies
Acronym Full Name Website Department or Independent Agency
Departments DHS Department of Homeland Security www.dhs.gov Not applicable DOC Department of Commerce www.commerce.gov Not applicable DOD Department of Defense www.defense.gov Not applicable DOE Department of Energy energy.gov Not applicable DOI Department of the Interior www.doi.gov Not applicable DOJ Department of Justice www.justice.gov Not applicable DOL Department of Labor www.dol.gov Not applicable DOT Department of Transportation www.transportation.gov Not applicable ED Department of Education www.ed.gov Not applicable HHS Department of Health and Human Services www.hhs.gov Not applicable
HUD Department of Housing and Urban Development www.hud.gov Not applicable
State Department of State www.state.gov Not applicable Treasury Department of the Treasury www.treasury.gov Not applicable USDA Department of Agriculture www.usda.gov Not applicable VA Department of Veterans Affairs www.va.gov Not applicable Agencies ACE Army Corps of Engineers www.usace.army.mil DOD ACF Administration for Children and Families www.acf.hhs.gov HHS ACL Administration for Community Living www.acl.gov HHS
AHRQ Agency for Healthcare Research and Quality www.ahrq.gov HHS
ARS Agricultural Research Service www.ars.usda.gov/main/main.htm
USDA
ASPE Office of the Assistant Secretary for Planning and Evaluation aspe.hhs.gov HHS
BBG Broadcasting Board of Governors www.bbg.gov
1 BEA Bureau of Economic Analysis www.bea.gov DOC BJS Bureau of Justice Statistics www.bjs.gov DOJ BLS Bureau of Labor Statistics www.bls.gov DOL BOEM Bureau of Ocean Energy Management www.boem.gov DOI BoP Bureau of Prisons www.bop.gov DOJ BoR Bureau of Reclamation www.usbr.gov DOI BTS Bureau of Transportation Statistics www.rita.dot.gov/bts DOT CBP Customs and Border Protection www.cbp.gov DHS CDC Centers for Disease Control and Prevention www.cdc.gov/ HHS

80
Table D.1 Acronyms and Websites for Departments and Agencies
Acronym Full Name Website Department or Independent Agency
Census Bureau of the Census www.census.gov DOC
CEO Chief Evaluation Office www.dol.gov/asp/evaluation
DOL
CMS Centers for Medicare and Medicaid Services www.cms.gov HHS
CNCS Corporation for National and Community Service
www.volunteeringinamerica.gov;www.nationalservice.gov/impact-our-nation/evidence-exchange
1
CPSC Consumer Product Safety Commission www.cpsc.gov
1
DEA Drug Enforcement Administration www.justice.gov/dea/index.shtml
DOJ
EIA Energy Information Administration www.eia.gov DOE
EOP Executive Office of the President www.WhiteHouse.gov/administration/eop
1
EPA Environmental Protection Agency www.epa.gov
1 ERS Economic Research Service www.ers.usda.gov USDA ESA Economics and Statistics Administration www.esa.doc.gov DOC ETA Employment and Training Administration www.doleta.gov DOL FAA Federal Aviation Administration www.faa.gov DOT FAS Foreign Agricultural Service www.fas.usda.gov USDA FBI Federal Bureau of Investigation www.fbi.gov DOJ FEMA Federal Emergency Management Agency www.fema.gov DHS FHWA Federal Highway Administration www.fhwa.dot.gov DOT
FMCSA Federal Motor Carrier Safety Administration www.fmcsa.dot.gov DOT
FNS Food and Nutrition Service www.fns.usda.gov USDA
FRA Federal Railroad Administration www.fra.dot.gov/Page/P0001
DOT
FS Forest Service www.fs.fed.us USDA FTA Federal Transit Administration www.fta.dot.gov DOT FWS Fish and Wildlife Service www.fws.gov DOI GS Geological Survey www.usgs.gov DOI
Housing Office of Housing portal.hud.gov/hudportal/HUD?src=/program_offices/housing
HUD
HRSA Health Resources and Services Administration www.hrsa.gov/index.html HHS
IES Institute of Education Sciences ies.ed.gov ED IHS Indian Health Service www.ihs.gov/dps HHS IRS Internal Revenue Service www.irs.gov Treasury ITA International Trade Administration trade.gov DOC
NASA National Aeronautics and Space Administration www.nasa.gov
1
NASS National Agricultural Statistics Service www.nass.usda.gov USDA
NCBDDD National Center on Birth Defects and Developmental Disabilities
www.cdc.gov/ncbddd/index.html
HHS
NCCDPHP National Center for Chronic Disease Prevention and Health Promotion
www.cdc.gov/chronicdisease/index.htm
HHS
NCCIH National Center for Complementary and Integrative Health nccih.nih.gov HHS

81
Table D.1 Acronyms and Websites for Departments and Agencies
Acronym Full Name Website Department or Independent Agency
NCEH National Center for Environmental Health www.cdc.gov/nceh HHS NCES National Center for Education Statistics nces.ed.gov ED
NCEZID National Center for Emerging Zoonotic and Infectious Diseases www.cdc.gov/ncezid HHS
NCHHSTP National Center for HIV/AIDS, Viral Hepatitis, Sexually Transmitted Disease, and Tuberculosis Prevention
www.cdc.gov/nchhstp HHS
NCHS National Center for Health Statistics www.cdc.gov/nchs HHS NCI National Cancer Institute www.cancer.gov HHS
NCIRD National Center for Immunization and Respiratory Diseases www.cdc.gov/ncird HHS
NCSES National Center for Science and Engineering Statistics www.nsf.gov/statistics NSF
NCVAS National Center for Veterans Analysis and Statistics www.va.gov/vetdata VA
NESDIS National Environmental Satellite, Data, and Information Service www.nesdis.noaa.gov DOC
NHGRI National Human Genome Research Institute www.genome.gov HHS
NHLBI National Heart, Lung, and Blood Institute www.nhlbi.nih.gov HHS
NHTSA National Highway Traffic Safety Administration www.nhtsa.gov DOT
NIA National Institute on Aging www.nia.nih.gov HHS
NIAAA National Institute on Alcohol Abuse and Alcoholism www.niaaa.nih.gov HHS
NIAID National Institute of Allergy and Infectious Diseases www.niaid.nih.gov/ HHS
NIBIB National Institute of Biomedical Imaging and Bioengineering www.nibib.nih.gov HHS
NICHD National Institute of Child Health and Human Development
www.nichd.nih.gov/Pages/index.aspx
HHS
NIDA National Institute on Drug Abuse www.drugabuse.gov HHS
NIDCD National Institute on Deafness and Other Communication Disorders www.nidcd.nih.gov HHS
NIDDK National Institute of Diabetes and Digestive and Kidney Diseases www.niddk.nih.gov HHS
NIH National Institutes of Health www.nih.gov HHS
NIH/OD Office of the Director www.nih.gov/institutes-nih/nih-office-director
HHS
NIMH National Institute of Mental Health www.nimh.nih.gov/index.shtml
HHS
NIOSH National Institute for Occupational Safety and Health www.cdc.gov/niosh HHS
NMFS National Marine Fisheries Service www.nmfs.noaa.gov DOC
NOAA National Oceanic and Atmospheric Administration www.noaa.gov DOC
NRCS Natural Resources Conservation Service www.nrcs.usda.gov/wps/portal/nrcs/site/national/home
USDA
NSF National Science Foundation www.nsf.gov
1

82
Table D.1 Acronyms and Websites for Departments and Agencies
Acronym Full Name Website Department or Independent Agency
OCR Office for Civil Rights www2.ed.gov/about/offices/list/ocr/data.html?src=rt
ED
OCTAE Office of Career, Technical, and Adult Education
www2.ed.gov/about/offices/list/ovae/?src=oc
ED
OEHSS Office of Environment, Health, Safety and Security
energy.gov/ehss/environment-health-safety-security
DOE
OESE Office of Elementary and Secondary Education
www2.ed.gov/about/offices/list/oese/index.html?src=oc
ED
OGAC Office of the U.S. Global AIDS Coordinator www.state.gov/s/gac State
OII Office of Innovation and Improvement innovation.ed.gov/?src=oc ED
OIS Office of Immigration Statistics www.dhs.gov/immigration-statistics
DHS
OJJDP Office of Juvenile Justice and Delinquency Prevention www.ojjdp.gov DOJ
OMB Office of Management and Budget www.WhiteHouse.gov/omb
EOP
ONDCP Office of National Drug Control Policy www.WhiteHouse.gov/ondcp
EOP
ONRR Office of Natural Resources Revenue www.onrr.gov DOI OPA Office of People Analytics www.opa.defense.gov DOD OPA Office of Population Affairs www.hhs.gov/opa HHS
OPE Office of Postsecondary Education www2.ed.gov/about/offices/list/ope/index.html?src=oc
ED
OPEPD Office of Planning, Evaluation, and Policy Development
www2.ed.gov/about/offices/list/opepd/index.html?src=oc
ED
ORDES Office of Research, Demonstration, and Employment Support
www.socialsecurity.gov/disabilityresearch
SSA
ORES Office of Research, Evaluation, and Statistics
www.ssa.gov/policy/about/ORES.html
SSA
ORP Office of Retirement Policy www.socialsecurity.gov/retirementpolicy/index.html
SSA
OSERS Office of Special Education and Rehabilitative Services
www2.ed.gov/about/offices/list/osers/index.html?src=oc
ED
OSHA Occupational Safety and Health Administration www.osha.gov DOL
PD&R Office of Policy Development and Research
www.huduser.gov/portal/home.html
HUD
PHMSA Pipeline and Hazardous Materials Safety Administration www.phmsa.dot.gov DOT
PHSS Office of Public Health Scientific Services www.cdc.gov/phpr HHS
PIH Office of Public and Indian Housing portal.hud.gov/hudportal/HUD?src=/program_offices/public_indian_housing
HUD
RMA Risk Management Agency www.rma.usda.gov USDA
SAMHSA Substance Abuse and Mental Health Services Administration www.samhsa.gov HHS

83
Table D.1 Acronyms and Websites for Departments and Agencies
Acronym Full Name Website Department or Independent Agency
SOI Statistics of Income Division www.irs.gov/uac/SOI-Tax-Stats-About-SOI
IRS
SSA Social Security Administration www.ssa.gov
1 USAID U.S. Agency for International Development www.usaid.gov
1 VBA Veterans Benefits Administration benefits.va.gov/benefits VA
VHA Veterans Health Administration www1.va.gov/health/index.asp
VA
WAOB World Agricultural Outlook Board www.usda.gov/oce/commodity/index.htm
USDA
WHD Wage and Hour Division www.dol.gov/whd DOL 1 This agency is independent of a department or another higher-level functional unit.