Detecting and Quantifying Reductive Dechlorination During ...
Upload
nguyenphucCategory
view
216download
0
AL/EO-TRA-09~-026 AD-A283 236()
BIOLOGICAL DEGRADATION OF TETRACHLOROETHYLENE INMETHANOGENIC CONDITIONS
AM James M. Gossett, Thomas D. DiStefano, Michael A. Stover
SR Cornell University
R School of Civil and Environmental Engineering0 Hollister HallN Ithaca NY 14853-3501
ENVIRONICS DIRECTORATE k Q AU 12 '1294;L 13 Banes riv, Sute 4
L Tyndall AFB FL 32403-5323 ~~AB0 June 1994
RA Final Technical Report for Period July 1991 - January 1993
0K't pr'iyed forpublic'iekise;-distribution' unlimted. -
94-25298
L - AIR FORCE MATERIEL COMMANDTY14DALL AIR FORCE BASE, FLORIDA 32403-5323
94 8 11 020

NOTICESThis report was prepared as an account of work sponsored by an agency of the
United States Government. Neither the United States Government nor any agencythereof, nor any employees, nor any of their contractors, subcontractors, nor theiremployees make any warranty, expressed or implied, or assume any legal liability orresponsibility for the accuracy, completeness, or usefulness or any privately ownedrights. Reference herein to any specific commercial process, or service by tradename, trademark, manufacturer, or otherwise does not necessarily constitute or implyits endorsement, recommendation, or favoring by the United States Government or anyagency, contractor, or subcontractor thereof. The views and opinions of the authorsexpressed herein do not necessarily st&te or reflect those of the United StatesGovernment or any agency, contractor, or subcontractor thereof.
When Government drawings, specificaticns, or other data are used for any purposeother than in connection with a definitely Government-related procurement, the UnitedStates Government incurs no responsibility or any obligations, whatsoever. The factthat the Government may have formulated or in any way supplied the said drawings,specifications, or other data, is not to be regarded by implication, or otherwise inany manner construed, as licensing the holder or any other person or corporation; oras conveying any rights or permission to manufacture, use, or sell any patentedinvention that may in any way be related thereto.
This technical report has been reviewed by the Public Affairs Office (PA) and isreleasable to the National Technical Information Service, where it will be availableto the general public, including foreign nationals.
This report has been reviewed and is approved for publication.
CATHERINE M. VOGEL MICHAEL G. KATONAProject Officer Chief Scientist
ROBERT G. LA POE, Major, USAF, BSC NEIL Col, USAF, BSCChief, Site Remediation R&D Director, Environics Directorate

REPORT DOCUMENTATION PAGE -IA Npo 0-06Pubir ep~orting burtdef r this ~ 0 1iio inrvaflliog i. lirumare to A.Ig i hour per 'qIon, 11 4N t t ~r lime lofrc-r- insliirco.,. war~h-9 vltt'~ dot.,I touf tgrlridjn mairlai9t.rrhe dat needed, adticitoJeing AMs 1-0-9.,r. lh* CoItectriol informaion Stind commeynt%, "Atd~n 9 thhbutdlen lest,,',e 0' an~y other cof' hiswat~ C n it~~j~ . Nfvdng iU qIol lot reducing tht Wclier. t0 W shingior t4ilsa ei .ar efrnce Laeqdo,strto, Ifltrinsof Opetaton and Rewr%.-rl IS 1q15Davit Hihw.ay. liv,to 1204 AlItyjtOn=1VA 2flh)J3 2. and to th' ("1- -11 %4i~ge rt A"l Budget. No*'.ok ftedur , Nor e(t (070-.0 l8s)W&h, to,, tIC 2010)
1. AGENCY USE ONLY (Leave blank) 2. REPORT DATE 3. REPORT TYPE AND DATES COVERED
4. ITL AD SBTILEJune 1994 Final 12 Jul 91 - 11 Jan 93
Biological Degradation of Tetrachioroethylenein M'ethanogenic Conditions C ;F08635-86-C-0181
6. AUTHOR(S)
James M. Gossett, Thomas D. DiStefano, M'ichael A. Stover
7. PERFORMING ORGANIZATION NAME(S) AND ADDRESS(ES) 8. PERFORMING ORGANIZATIONREPORT NUMBER
Cornell UniversitySchool of Civil and Environmental Engineering
41 Ho-llister HallIthaca, NTY 14853-3501
9. SPONSORING /MOINITORING AGENCY NAME(S) AND ADDRESS(ES) 10. SPONSORING/ MONITORINGAGENCY REPORT NUMBER
AL/EQW139 Barnes Drive, Suite 2 AL/EQ-TR-1993-002bTyndall AFB FLi 32403-5319
11. SUPPLEMENTARY NOTES
Availability of This Report Is Specifi-li on Reverse of Front CoverCathy Vogel AL/EQW-OL Conrn 904-283--6035 AUTOVON 523--6035
12a. DISTRIBUTION I AVAILABIUTY STA iEMENT 12b. DISTRIBUTION CODE
Approved For Public ReleaseDistribution Unlimited
13. ABSTRACT (MaoimurnO00wonfs)
Research objective: investigate anaerobic biodegradation of perchloroethylene(PCE). Specific objectives: (1) determine if the presence of PCE is necessary tosustain dechlorination of vinyl chloride (VC)., (2) delineate the role of hydrogen(H2) in PCE reductive dechlorination, (3) investigate the ability of the high-
* level PCE/methanol (MeOH) culture to utilize low levels of PCE, and (4) determinethe applicability of an Anaerobic Attached-film Expanded-bed (AAFEB) reactor toachieve PCE dechlorination. The investigators determined: (1) by using a VC-fed
* culture unable to sustain ETH production, that the presence of PCE is required tosustain VC dechlorination, (2) H2 acts as the electron donor directly used forthe reductive dechlorination of PCE to ethene, (3) the PCE/MeOH culture was ableto use ppb levels of PCE due to the small requirement for electron donor (H2) bythe culture, and (4) that the loss of the dechlorinating biomass from the suportmatrix, and/or the inability of the culture to support PCE dechlorination at lowconcentrat4ons, led to the failure of the AAFEB reactor system.
of
14. SUBJ TERMS 15. NUMBER OF PAGES
Biodegradation, Tetrachloroethylene, Methanogenesis, Fixed- __________
film Reactors, Biological Treatment, Chlorinated Hydrocarbons 16. PRICE CODE
17. SECURITY CLASSIFICATION 18. SECURITY CLASSIFICATION 19. SECURITY CLASSIFICATION 20. LIMITATION OF ABSTRACTUnd assiied . Uniccass e~T Uncas~sSrid UL
NSN 7540-01180.55U0 Standard Form 299 (Rev. 2-89)New'. bed by ANl tld L~(The reverse of this page is blank.) M 2~8

PREFACE
This report was prepared by James M. Gossett, Cornell University, School of Civil
and Environmental Engineering, Hollister Hall, Ithaca, NY 14853-3501, underContract Number F08635-91-C-0181 for the US Air Force Civil Engineering SupportAgency (AFCESA/EQW), Tyndall AFB FL 32403-5319.
This report summarizes work completed between 12 Jul 91 and 11 Jan 93. The HQAFCESA/EQW project officer was Catherine M. Vogel.
....... op_
J ." .. . -
iii(The reverse of this page is blank).

EXECUTIVE SUMMARY
A. OBJECTIVETetrachloroethene (also known as perchloroethylene, or PCE) and the less-chlorinated
ethenes produced from it via reductive dehalogenation - trichloroethene (TCE), dichloroethene
(DCE) isomers and vinyl chloride (VC) - have become common groundwater pollutants
throughout the United States, including USAF IRP sites. PCE can be reductively dechlorinated to
ethene (ETH) by anaerobic microorganisms; however, the promise of anaerobic bicremediation
for chlorinated ethenes has not been realized, largely due to a lack of understanding of
microbiological fundamentals.
Specific objectives of this research were:
" To determine if PCE's presence is necessary to sustain dechlorination of VC;" To delineate the role of hydrogen (H2) in reductive dechlorination of PCE;
" To investigate the ability of our high-level PCE/methanol (MeOH) culture to
utilize low levels of PCE - a critical factor in determining success or failure of
our proposed bioremediation system;
" To investigate the potential of an Anaerobic Attached-Film Expanded-Bed
(AAFEB) reactor to achieve continuous-flow dechlorination of PCE.
B. BACKGROUND
Under anaerobic conditions, PCE can be completely dechlorinated to ETH by a stepwise,
reductive dehalogenation process; however, the final reduction step is apparently rate-limiting,
with significant levels of the intermediate VC typically observed. Our first experimental objective
derives from our repeated observation that VC dechlorination and ETH production are readily
sustained in PCE-fed systems, whereas we have experienced difficulty with VC as the sole
chlorinated specie. PCE's presence may be necessary to induce a ielatively nonspecific
dechlorination activity capable of acting upon many other chlorinated species - including VC.Dechlorination via a rcductive mechanism requires an electron donor. Since several
alternate donors appear to serve the dechlorination process, our hypothesis is that the simplest -
H2 - may be the donor directly involved. This hypothesis was addressed in our second
experimental objective.
In recent, unsponsored studies, we developed an anaerobic MeOH/PCE enrichment culture
which dechlorinates PCE at unprecedented, high rates with efficient use of MeOH as the electron
donor for reductive dechlorination. The MeOH/PCE culture produced little or no methane (CH4)
when high PCE doses were added, presumably because of inhibition of methanogenesis by PCE.
"w' ml m :nn mu • •V

What remains to be determined is whether the subsequent use of this high-level culture at lower,
noninhibitory concentrations of PCE will spark a rise in methanogenic activity, consuming an ever-increasing fraction of MeOH equivalents, necessitating ever-greater additions of MeOH to allow
sustenance of dechlorination. These issues were addressed in our third experimental objective.
Our earlier efforts to achieve continuous-flow dechlorination of PCE met with only limitedsuccess; quantitative conversion of PCE to VC resulted, with only minor amounts of ETH
produced. The AAFEB reactor offers essentially the complete-mix conditions of a suspended-
growth system (i.e., a system where we have met with significant success), while providing amean-cell residence time (or "solids retention time", SRT) greatly in excess of the hydraulicretention time (HRT). The AAFEB system was evaluated as part of our fourth experimentalobjective.
C. SCOPE
Early experiments concerning the sustenance of dechlorination of VC in the absence ofPCE were completed using a methanogenic culture which had demonstrated capability in
dechlorinating PCE at low concentrations (0.5 nig/L) to VC and ETH. Experiments w , Iecompleted at 35'C, in either batch or semicontinuous mode with the suspended mixed culture in160-mL serum bott!es. Batch doses of PCE and/or VC were delivered to the cultures and theresultant transformations were monitored using a headspace gas chromatographic technique. In
some studies, repetitive additions of PCE and/or VC were administered on a regular basis, overmany months - along with MeOH which served as electron donor. The resultant ETHproductions of VC-fed systems were compared with those of PCE-fed cultures to determine theneed for PCE to sustain complete dechlorination.
Increasing doses of PCE were given to selected cultures to encourage development of a
culture in which dechlorination was a major activity. An anaerobic culture (termed "high-PCE/MeOH") with superior PCE reduction capability was developed from this action. Selectiveinhibitors were applied to this culture to elucidate the role of the PCE dechlorinating organism(s) of
this culture. H2 and MeOH were employed as electron donors during inhibitor studies to facilitatea more thorough understanding of the roles of major classes of organisms, and to delineate the role
of H2 in dechlorination.
The ability of the high-PCE/MeOH culture to sustain dechlorination at low PCE levels wasinvestigated in semicontinuous, serum-bottle studies at 35"C. Two different levels of PCE and
three different MeOH:PCE ratios were employed. Over a 34- to 42-day period, the patterns of VC
and ETH production following repeated additions of PCE and MeOH were observed and
compared.
vi

An AAI-EB reactor was designed, constructed and operated over a 200-day period at 35"C.
The liquid volume was 1.56 liters; the bed media consisted of 100-pm diatomaceous earth
particles. PCE dissolved in a prereduced basal medium was continuously pumped to the reactor
from a feed reservoir; a concentrated MeOH/water mixture was continuously injected directly into
the bed via a syringe pump. Performance was monitored by headspace gas chromatography and
by removal of liquid samples for analysis of nonvolatiles. Several different influent PCE
concentrations, MeOH:PCE ratios, and HRTs were explored.
D. RESULTS
Fairly constant conversion of PCE to ETH was sustainable by a MeOH-enriched, PCE-fed
culture. When VC additions were substituted for PCE, an ever-decreasing ET- production rate
was observed. The decrease in ETI-production rate could be somewhat reversed if PCE additions
were resumed.
H2 served as electron donor in the reductive dechlorination of PCE to VC and ETH for
periods up to 40 days in anaerobic enrichment cultures; however, sustained dechlorination for
more extended periods required the addition of filtered supematant from a MeOH-fed culture. This
suggests a nutritional dependency of H2-using dechlorinators upon the metabolic products of other
organisms in the more diverse, MeOH-fed system. Vancomycin, an inhibitor of cell-wall synthesis
in eubacteria, was found to inhibit acetogenesis when added at 100 mg/liter to both MeOH-fed and
H2-fed cultures. The effect of vancomycin on dechlorination was more complex. MeOH could
not sustain dechlorination when vancomycin inhibited acetogenesis, while H2 could.
With repetitive additions of MeOH and PCE at a 2:1 ratio (eq/eq), using noninhibitory
levels of PCE (ca. 9 mg/L), methanogenesis consumed an ever-increasing fraction of MeOH
equivalents, decreasing the extent of dechlorination. Dechlorination of PCE at such concentrations
was sustained only if higher ratios of MeOH:PCE were employed. However, even then, the
production of ETH gradually decreased as an increasing fraction of the added PCE remained as VC
after two-day intervals.The AAFEB reactor failed to sustain dechlorination of PCE. Residual PCE was routinely
present in the effluent. Methanogenesis and acetogenesis were the dominant activities within the
reactor. The addition of inhibitory levels of ETH (to suppress methanogenesis) did not resurrect
the reactor's performance.
E. CONCLUSIONSVC concentration alone does not determine ETH production rates. At similar VC
concentrations, PCE-fed bottles produced and sustained ETH production while VC-fed bottles
vii

could not. This suggests that the presence of PCE (and /or TCE, DCEs) is (are) required to sustain
VC dechlorination.Results from H2 studies are consistent with a model in which H2 is the electron donor
directly used for dechlorination by organisms resistant to va:ncomycin, and that the role ofacetogens in MeOH cultures is to metabolize a portion of the MeOH to H2. MeOH and other
substrates shown to support dechlorination in pure and mixed cultures may merely serve asprecursors for the formation of an intermediate H2 pool.
The efficiency of our high-PCE/MeOH culture apparently results from the inhibition ofMeOH-using methanogens by high PCE (or dechlorination product) coincentrations, thus lessening
competition for MeOH. When non-inhibitory concentrations (i.e., 9 mg/L) of PCE are employedwith the high-PCE/MeOH culture, methanogenic activity rises and consumes an ever-increasingfraction of MeOH equivalents, necessitating ever-greater additions of MeOH to allow sustenance of
dechlorination. However, this tactic is a spiral to failure, as ever-greater additions of MeOHsupport ever-larger methanogenic populations. This same phenomenon may have contributed tothe failure of our continuous-flow bioreactors. An additional hypothesis toexplain failure of theAAFEB system was loss of dechlorinating biomass from the diatomaceous earth support matrix,due to shear induced by bed expansion.
F. RECOMMENDATIONSA potential solution to the problem posed by methanogenic competition would be the use of
nonmethanogenic substrates that can act as sources of H2. Ethanol, lactate, and butyrate would begood substrates for investigation; H2 is a direct product of their fermentation to acetic acid (HAc).
Since they are not direct methanogenic substrates (ethanol can be used by some methanogens butpoorly and not as a direct methane precursor), they may prove to be more efficient suppliers ofreducing equivalents for dechlorination, and they are less toxic to humans than MeOH. It remains
to be seen with what efficiency our culture might operate on them, and what nutrient deficienciestheir use might either cause or eliminate.
Alternative, nonmethanogenic substrates might eliminate direct methanogenic competition
for the supplied form of the reductant; however, methanogenic competition for the resulting H2must still be reckoned with. Possible differences in H2-use thresholds between methanogens and
dechlorinators may be exploited to advantage in this context. Possible differences in environmentalpreferences (e.g., pH) might also be advantageously exploited. Thus, the H2-consumption
kinetics of methanogens and dechlorinators should be investigated - including studies of the
nutritional and environmental requirements of the organisms. In this manner, strategies may be
developed to make optimal use of supplied reductant while minimizing undesirable competing
reactions.
viii

In addition to exploring alternative electron donors, investigators should explore alternative
reactor support matrices and alternative configurations which may offer superior organism
retention in continuous-flow bioreactors.
I
ix(The reverse of this page is blank.)
i~~~ i -I M j ' "

TABLE OF CONTENTS
Section Title Page
I. INTRODUCTION .1.........................................
A. OBJECTIVE...................................................................1I
B. BACKGROUND...............................................................1I
C. SCOPE ........................................................................ 3
II. LITERATURE REVIEW........................................................... 4
A. ANAEROBIC B!O'0'RANS FORMATION OF PCE............................. 4
1. In Vivo Studi..................................................... ........ 4
2. In Vitro Studies .......................................................... 5B. RECENT CONTINUOUS -FLOW, FIXED-FILM STUDIES.................... 6
Ill. MATERIALS AND METHODS......................................................8
A. PROGRAM OF STUDY....................................................... 8
B. CHEMICALS AND STOCK SOLUTIONS ..................................... 9
C. CULTURES AND ENRICHMENT PROCEDURES............................ 10
1. General Procedures ....................................................... 10
2. Low-Level (Methanogenic) PCE Stock Culture..............................103. High-Level (Norimethanogenic) PCE Stock Culture......................... 13
D. ANALYTICAL METHODS .................................................... 14
1. Gas Chromatography (GC).................................... ........... 14
a. Headspace Analysis of Volafile Organics and Hydrogen ........... 14
b. GC Analysis of Methanol and Acetate ......................... 16
2. Acetate and Fominate via High Performance Liquid Chromatography
(HPLC) .................................................................. 17
IV. TRANSFORMATION OF VC TO ETh IN METHANOGENIC CULTURES......... 18
A. CONTEXT ................................................................... 18
B. PROCEDURES ............................................................... 19
C. RESULTS .................................................................... 21
D. DISCUSSION................................ ............................. 26
xi

TABLE OF CONTENTS(Concluded)
Section Title Page
V. THE ROLE OF H2 IN REDUCTIVE DECIHLDORINATION OF PCE .................... 28
A. CONTEXT .................................................................................. 28
B . PR O CED U R ES ................................................................................ 28
1. Studies with H2 as Electron Donor ................................................ 28
2. 1,reparation of Filtered Culture Supernatant ...................................... 29
3. Inhibitor Studies ..................................................................... 29
C . RE SU LT S ................................................................................... 30
1. H2 as an Electron Donor for PCE Reduction .............................. 30
2. Application of Inhibitors to MeOH- and H2-Fed Cultures ...................... 33
D . D ISC U SSIO N ................................................................................. 40
VI. PERFORMANCE OF THE HIGH-PCE/MeOH ENRICHMENT CULTURE AT
LOW PCE CONCENTRATIONS ............................................................ 43
A . C O NT EX T ................................................................................. 43
B . PR O CE D U RES ................................................................................ 43
C . R E SU L T S ................................................................................... 45
D. DISCUSSION ............................................................................. 59
VII. CONTINUOUS-FLOW REACTOR STUDIES ............................................ 64
A . CO NT EXT .................................................................... ........... 64
B. REACTOR DESCRIPTION .............................................................. 64
C. AAFEB LIQUID AND GASEOUS VOLUME MEASUREMENTS ............... 68
D. AAFEB SYSTEM TESTS ................................................................ 68
E. INOCULATION AND PERFORMANCE OF THE AAFEB REACTOR .............. 70
VIII. CONCLUSIONS AND RECOMMENDATIONS ........................................... 78
R EFE R E N C E S ............................................................................................ 81
xii

LIST OF FIGURES
Figure Title Page
1. Schematic of 6-Liter Reactor (Exploded View) ...................................... 12
2. Schematic of Gas Chronatographic System for Headspace Analysis of
Voladle Organics (H2 Analysis via Reduction Gas Detector Was Optional) ........ 153. PCE Transformation to VC and ETH in a MeOH-Enrichment Culture .............. 18
4. ETH Production in Cultures Fed (a) PCE or (b) VC .............................. 22
5. ETH Production Rates in (a) PCE-Fed and (b) VC-Fed Bottles .................. 23
6. ETH Production With PCE Resumed ............................................... 24
7. ETH Production With PCE Withheld ................................................. 25
8. ETH Production Rates With (a) PCE Resumed and (b) PCE Withheld ............ 27
9. Short-Term Results Demonstrating the Ability of H2 to Support Dechlorin-
ation of 55 4,mol Repetitive Additions of PCE to ETH ............................. 31
10. Comparison of PCE Reduction in (a) a H2-Fed Bottle and (b) a MeOH-Fed
B o ttle ................................................................................... . . 32
11. (a) PCE Reduction and (b) MeOH Metabolism in a MeOH-Fed Culture ............ 34
12. (a) PCE Reduction and (b) H2 Metabolism in a H2-FeU Culture .................. 36
13. (a) PCE Reduction and (b) MeOH Metabolism in a MeOH-Fed Culture
Am ended W ith V ancom ycin .............................................................. 37
14. (a) PCE Reduction and (b) H2 Metabolism in a H2-Fed Culture Amended
W ith V ancom ycin ....................................................................... 39
15. Hypothetical Roles of Methanogens and Acetogens in H2- and MeOH-Fed
PCE-Dechlorinating System s ......................................................... 42
16. (a) Distribution of Ethenes, (b) VC Levels, (c) ETH Level i, (d) CH4
Levels, (e) pH, (f) HAc Levels, and (g) Distribution of Reduced Products
from Bottle IA ........................................................................... 46
17. (a) Distribution of Ethenes, (b) VC Levels, (c) ETH Levels, (d) CH4
Levels, (e) pH, () HAc Levels, and (g) Distribution of Reduced Products
from B ottle lB ........................................................................... 48
18. (a) Distribution of Ethenes, (b) VC Levels, (c) ETH Levels, (d) CH4
Levels, (e) pH, (f) HAc Levels, and (g) Distribution of Reduced Products
from B ottle 2A ........................................................................... 5 1
xiti

LIST OF FIGURES(Concluded)
Figure Title Page19. (a) Distribution of Ethenes, (b) VC Levels, (c) ETH Levels, (d) CH4
Levels, (e) pH, (f) HAc Levels, and (g) Distribution of Reduced Products
from Botde 2B ......................................................................... .5320. (a) Distribution of Ethenes, (b) VC Levels, (c) ETH Levels, (d) CI4
Levels, (e) pH, (f) ltAc Levels, and (g) Distribution of Reduced Products
from Bottle 3A ......................................................................... .5521. (a) Distribution of Ethenes, (b) VC Levels, (c) ETH Levels, (d) CH4
Levels, (e) pH, (f) HAc Levels, and (g) Distribution of Reduced Products
from B ottle 3B .......................................................................... 5722. (a) Distribution of Ethenes, (b' VC Levels, (c) ETH Levels, (d) CR4
Levels, (e) pH, (f) HAc Levels, and (g) Distribution of Reduced Productsfrom Bottle 4A .................................... . . ........................ .60
23. (a) Distribution of Ethenes, (b) VC Levels, (c) ETH Levels, (d) CH.:,Levels, (e) pH, (f) HAc Levels, and (g) Distribution of ReducedProducts from Bottle 4B .............................................................. 62
24. AAFEB Reactor System .............................................................. 6525. System Tests Conducted on AAFEB System ....................................... 6926. (a) Influent and Effluent Aqueous Concentrations of Ethenes, (b) Rate of
Reduction Product Formation, and (c) Effluent Aqueous CR 4 Concen-
tration During Days 0-75 of AAFEB Operation in Continuous-Flow Mode ........ 7227. (a) Influent and Effluent Aqueous Concertrations of Ethenes, (b) Rate of
Reduction Product Formation Over Time, and (c) Effluent Aqu, ous CH4Concentration During Days 92- 119 of AAFEB Operation in Continuous-Flow M ode ............................................................................... 74
28. (a) Aqueous Concentrations of Ethenes, (b) Reduction Product Formation,and (c) Inhibited Methanogenesis During Days 119-145 of AAFEBOperation in Recycle Mode With a High Background of ETH ................... 75
29. (a) Influent and Effluent Concentrations of Ethenes, and (b) EffluentAqueous CF14 Concentration During Days 169-200 of AAFEB Operation inContinuous-Flow Mode with a High Background of ETH ....................... 77
xiv

LIST OF TABLES
Table itePage1. BASAL MEDIUM FOR ENRICHMENT CULTURES ....................... 11
2. LEVELS OF SUBSTRATE EMPLOYED IN BOT[LE-EXPER[MI2NT I ...... 44
xv(The reverse of this page is blank)

SECTION I
INTRODUCTION
A. OBJECTIVETetrachloroethene (also known as perchloroethylene, or PCE) and the less-chlorinated
ethenes produced from t via reductive dehalogenation - trichloroethene (TCE), dichloroethene
(DCE) isomers and vinyl chloride (VC) - have become common groundwater pollutants
throughout the United States, including USAF IRP sites. PCE, unlike less chlorinated ethenes, isnot degraded by aerobes; however, reductive dechlorination of PCE by anaerobes has been
observed by numerous investigators to varying degrees, sparking interest ii developing
remediation technologies based upon anaerobic microbial systems.
The promise of r-naerobic bioremediation for chlorinated ethenes has not been realized,
largely due to a lack of uiderstanding of microbiological fundamentals. Despite nearly a decade ofstudy, we still do not know the rolc played by general categories of microorganisms inhabiting
mixed-culture, dechlorinating enrichments (methanogens, sulfate reducers, acetogens, etc.). Weknow little about nutritional and process requirements for dechlorination. Consequently, we
cannot explain the observed variability in extent of transformation among many field and laboratory
studies.
Specific objectives of this research were:
* To determine if PCE's presence is necessary to sustain dechlorinatioi; of VC;
9 To delineate the role of hydrogen (H2) in reductive dechlorination of PCE;
9 To investigate the ability of our high-level PCE/methanol (MeOH) culture to
utilize low levels of PCE - a critical factor in determining success or failure of
our proposed bioremediation system;
* To investigate the potential of an Anaerobic Attached-Film Expanded-Bed(AAFEB) reactor to achieve continuous-flow dechlorination of PCE.
B. BACKGROUND
Under anaerobic conditions, PCE can be completely dechlorinated to ETH by a stepwise,reductive dehaiogenation process; however, the final reduction step is apparently rate-limiting,
with significant levels of the intermediate VC typically observed. Our first experimental objective
derives from our repeated observation that VC dechlorination and ETH production are readily
sustained in PCE-fed systems, whereas we have experienced difficulty with VC as the sole
I

chlorinated specie. PCE's presence may be necessary to induce what is a relatively nonspecific
dechlorination activity capable of acting upon many other chlorinated species - including VC.
Dechlorination via a reductive mechanism requires an electron donor. In previous studies
conducted under USAF sponsorship (1), we observed that several substrates - glucose, MeOH,
acetate (HAc), formate, and H2 - could sustain the reductive dechlorination of PCE. However,
the identity of the electron donor directly involved in doechlorination was undetermined. Since
several alternate donors appear to serve the dechlorination process, our hypothesis is that the
simplest - H2 - may be the donor directly involved. This hypothesis is addressed in our second
experimental objective.
In recent, unsponsored studies (2), we developed anaerobic MeOH/PCE enrichment
cultures which proved capable of dechlorinating high concentrations of PCE to ETH. Added
concentrations of PCE as high as 550 g.M (91 mg/liter nominal concentration, or approximately 55mg/liter actual aqueous concentration) were routinely dechlorinated to 80 percent ETH and 20
percent VC within 2 days at 35C. This culture dechlorinates PCE at unprecedented, high rates
with efficient use of MeOH as the electron donor for reductive dechlorination. The MeO-/PCE
ctilture produced little or no methane (C-4) when high PCE doses were added, presumably
because of inhibition of methanogenesis by PCE. What remains to be determined is whether the
subsequent use of this high-level culture at lower, noninhibitory concentrations of PCE wiil spark
a rise in methanogenic activity, consuming an ever-increasing fraction of MeOH equivalents,
necessitating ever-greater additions of MeOH to allow sustenance of dechlorination. These issues
are addressed in our third experimental objective.
Our earlier efforts (3) to achieve contiruous-flow dechlorination of PCE met with only
limited success; quantitative conversion of PCE to VC resulted, with only minor amounts of ETH
produced. We believe that the plug-flow regime associated with our earlier, static-bed reactor does
not provide adequate conditions to promote the conversion of VC to ETH. In essence, the
auxiliary substrate (in this case, MeOH) is consumed so much more rapidly than is VC, that none
of the MeOH reaches the upper zones of the column where it is needed to promote dechlorination
of VC. An alternative hypothesis is that PCE (or one of its lesser-chlorinated daughter products,
such as TCE or DCE) is needed to induce dechlorinating activity - that VC dechlorination is only
a serendipitous occurrence. If so, the plug-flow regime may be inferior because the organisms in
the upper zones of the column never "see" PCE or TCE. The AAFEB reactor offers essentially the
complete-mix conditions of a suspended-growth system (i.e., a system where we have met with
significant success), while providing a mean-cell residence time (or "solids retention time", SRT)
greatly in excess of the hydraulic retention time (HRT). The AAFEB system was evaluated as part
of our fourth experimental objective.
2

C. SCOPEEarly experiments concerning the sustenance of dechlorination of VC in the absence of
PCE were completed using a methanogenic culture which had demonstrated capability in
dechlorinating PCE at low concentrations (0.5 mg/L) to VC and ETH (1). Experiments were
completed at 35"C, in either batch or semicontinuous mode with the suspended mixed culture in
160-mL serum bottles. Batch doses of PCE and/or VC were delivered to the cultures and the
resultant transformations were monitored using a headspace gas chromatographic technique. In
some studies, repetitive additions of PCE and/or VC were administered on a regular basis, over
many months - along with MeOH which served as electron donor. The resultant ETH
productions of VC-fed systems were compared with those of PCE-fed cultures to determine theneed for PCE to sustain complete dechlorination.
Increasing doses of PCE were given to selected cultures to encourage development of a
culture in which dechlorination was a major activity. An anaerobic culture (termed "high-
PCE/MeOH") with superior PCE reduction capability was developed from this action (2).
Selective inhibitors were applied to this culture to elucidate the role of the PCE dechlorinating
organism(s) of this culture. H2 and MeOH were employed as electron donors during inhibitor
studies to facilitate a more thorough understanding of the roles of major classes of organisms, and
to delineate the role of H2 in dechlorination.
The ability of the high-PCE/MeOH culture to sustain dechlorination at low PCE levels wasinvestigated in semicontinuous, serum-bottle studies at 35"C. Two different levels of PCE and
three different MeOH:PCE ratios were employed. Over a 34- to 42-day period, the patterns of VC
and ETH production following repeated additions of PCE and MeOH were observed and
compared.An AAFEB reactor was designed, construcwd and operated over a 200-day period at 35C.
The liquid volume was 1.56 liters; the bed media consisted of 100-1pm diatomaceous earth
particles. PCE dissolved in a prereduced basal medium was continuously pumped to the reactor
from a feed reservoir; a concentrated MeOH/water mixture was continuously injected directly intothe bed via a syringe pump. Performance was monitored by headspace gas chromatography and
by removal of liquid samples for analysis of nonvolatilcs. Several different influent PCE
concentrations, MeOH:PCE ratios, and HRTs were explored.
3

SECTION II
LITERATURE REVIEW
A. ANAEROBIC BIOTRANSFORMATION OF PCE
1. In Vivo Studies
Biotransformation of PCE and TCE under anaerobic conditions has been observed
in field studies (4), fixed-film reactors (5, 6, 7, 8, 9, 10), soil (11), sediment (12, 13, 14, 15, 16,
17), aquifer microcosms (18, 19), and to a limited degree in pure cultures (20, 21, 22, 23). A
comprehensive review of such studies was prepared for an earlier USAF technical report (3) and
will not be repeated here. This piesent review focuses on results of more recent studies.
Our laboratory was the first to report complete dechlorination of PCE to ETH, a
process involving sequential reduction steps with TCE, DCE isomers, and VC as intermediates (1):
2[H] HCI 2[H] HCI 2[14 HCI 2[H 140
PCE k.2_) TCE ._1 ,2-DCEs ._- -- vc '_. so ETH
Though complete, stepwise, reductive dechlorination of PCE to ETH is possible, the final
dechlorination step (VC to ETH) appears to be rate-limiting, with significant levels of VC typically
persisting (1). Recent reports demonstrate that further reduction to ethane is possible (10, 24, 25).
Dechlorination by a reductive mechanism requires an electron donor. Glucose,
HAc, formate, MeOH, and H2 have each been shown capable of sustaining the reductive
dechlorination of PCE (1), as have lactate, propionate, crotonate, butyrate, and ethanol (10, 26).
More exotic reductants, such as toluene (27) and dichloromethane (28), have also been observed to
support dechlorination of PCE. However, the identities of the electron donors directly involved in
dechlorination were not clear from these previous studies, since large excesses of electron donor
were typically provided, with only a minute fraction needed for reductive dechlorination.
For example, our early studies employed 0.5 to 1.0 mg/L PCE concentrations, with
100-fold excesses of electr.n donor (1). Consequently, the relatively insignificant demand of
dechlorination for reducing equivalents could conceivably be satisfied from intermediates and
products of the provided electron donor - or even from endogenous sources. Less than 1 percent
of the supplied-donor equivalents were used in dechlorination; the remainder appeared as CI-H4,
though the role of methanogens in dechlorination was far from clear or certain. The consequent
low fraction of the total microbial activity that could be attributed to dechlorinating activity in these
4
previous studies also made it impossible to determine the identities of the dechlorinating
organisms.
In our early research, MeOH yielded the most complete conversion to ETH;
consequently, we focused subsequent studies on this electron donor and succeeded in developing a
PCE/MeOH enrichment capable of rapidly dechlorinating high concentrations of PCE to ETH (2).
Added PCE concentrations of 550 IM were routinely dechlorinated to 80 percent ETH and 20
percent VC within 2 days at 35'C. The observed transformations occurred in the absence ofmethanogenesis, which was apparently inhibited by the high concentrations of PCE. An electron
balance demonstrated that MeOH consumption was completely accounted for by dechlorination (31
percent) and HAc production (69 percent), The high rates of PCE dechlorination - up to 1.24 mg
PCE per mg volatile suspended solids per day (29) - and the relatively large fraction (ca. one-
third) of the supplied electron donor used for dechlorination, suggest that reductive dechlorination
could be exploited for bioremediation of sites contaminated by chlorinated ethenes.
The promise of anaerobic bioremediation for chlorinated ethenes has not yet been
realized, largely due to a lack of understanding of microbiological fundamentals. Despite nearly a
decade of study, we still do not know the roles played by general categories of microorganisms
inhabiting mixed-culture, dechlorinating enrichments (methanogens, acetogens, etc.). We krow
little about nutritional and process requirements, including the identities of the immediate reductants
in the dechlorination processes. Consequently, we cannot explain the observed variability in extent
of transformation among many field and laboratory studies. PCE transformation somel!n'es stops
at TCE (22, 29, 30); in other instances, at DCEs (22, 27) or VC (8, 22); while some field and
laboratory studies have demonstrated complete dechlorination to ETH (1, 2, 22, 25). Clearly,process reliability awaits a better understanding of process fundamentals. A better fundamental
understanding would also facilitate modeling of the in-situ fate of chlorinated ethenes.2. In Vitro Studies
Biochemical studies have been performed by various investigators in an attempt to
elucidate the roles of varicus microorganisms in dechlorination (31, 32). Gantzer and Wackett
investigated the ability of several metallocofactors to mediate biological reduction of chlorinated
ethenes, and concluded that vitamin B1 2 and coenzyme F4 30 were able to mediate the
dechlorination of PCE to ETH, while hematin was capable of dechlorinating PCE only to VC (31).
Furthermore, it was observed that the rates of dechlorination mediated by these enzymes
significantly decreased as the compounds were transformed into lesser chlorinated ethenes.The results of these investigations, however, cannot be used to identify the
dechlorinating microorganisms within our high-PCE culture, since virtually all of the candidate
microorganisms within the mixed culture - methanogens and acetogens, whether MeOH-, HAc-
5

or H2-users - have many metal porphyrin cofactors in common. Furthermore, the investigations
by Gantzer and Wackett infer cometabolism as the mechanism involved in dechlorination, and
rates of dechlorination measured in their study were similar to those of two pure strains of
methanogenic bacteia observed by Fathepure et al. (21). However, in studies involving our high-
PCE/MeOH culture, the high specific rate of dcchlorination and the zero-order conversion of PCE
to VC suggest a metabolic rather than a cometabolic mechanism. Also, the high rate of PCE
dechlorination by the high-PCE culture is presumably a result of the exposure of the culture to PCE
over a relatively long period of time and an acquired capability of the culture to dechlorinate PCE
during its development.
B. RECENT CONTINUOUS-FLOW, FIXED-FILM STUDIES
Bruin et al. (10) achieved reductive dechlorination of PCE in a continuous-flow, fixed-bed
column at 20"C (and later IO'C), inoculated with a mixture of anaerobic sediment from the Rhine
River and an anaerobic granular sludge. Lactate (1 mM) was the electron donor; and PCE (8 4iM)
was completely dechlorinated to ETH and ethane at 10'C, with an HRT of 6 h. Note that the ratio
of lactate to PCE employed by Bruin et al. exceeded 50:1 on an electron equivalent basis (assuming
lactate -4 HAc + 2H 2 and PCE -4 ETH). Bruin et al. hypothesized that several different
microorganisms are needed to achieve complete dechlorination of PCE. This hypothesis was
based upon their development of two different enrichment cultures from the column - one that
converted PCE to cis-1,2-DCE; and another that converted cis- 1,2-DCE and VC to ETH.
Chu (33) observed partial dechlorination of PCE in a continuous-flow AAFEB reactor at
35"C. The major dechlorination products were cis-,2-DCE and, presumptively, VC (which was
not quantified). HRTs ranged from 1 to 11 hours. Large excesses of sucrose (typically 500 mg/L
as COD) were used as elcctron donor, with influent PCE typically 10 to 20 mg/L. These
conditions represent sucrose:PCE equivalent ratios from 130:1 to 65:1, respectively.
Carter and Jewell (34) extended the AAFEB reactor work of Chu to a temperature of 15°C.
Influent PCE concentrations were 8 to 12 mg/L; influent sucrose concentration was typically 250
mg/L (as COD) - representing a 65-fold excess of sucrose. Using HRTs of 2 to 4 hours, Carter
and Jewell observed ca. 99 percent PCE removal, but 40-50 percent remained as VC in the effluent
(with lesser, though significant, concentrations of cis- 1,2-DCE).
DiStefano explored the ability of a MeOH-fed low-PCE culture to dechlorinate PCE in a
continuous-flow, fixed-bed, fixed-film column (3, 29). Influent PCE was 3 mg/L; influent MeOH
was 50 mg/L; and an HRT of 2 days was employed at 35"C. PCE was detected in the first 15
percent of the column's length. Thereafter, VC was the only chlorinated species detected. He
observed incomplete conversion of PCE to ETH in the column and suggested that the reason for
6

failure may have been the plug-flow operation of the column; since organisms in the downstream
portion of the column, where VC persisted, were never exposed to PCE, DiStefano conjectured
that the presence of PCE might be necessary to stimulate dechlorination. Alternatively, the electron
donor, MeOH, could have been consumed completely in the upstream section of the column,thereby leaving the downstream organisms with no donor available to convert VC to ETH.Therefore, a completely mixed attached-film reactor system was suggested for future research to
expose the entire microbe population to PCE and the electron donor supplied.
I -

SECTION III
MATERIALS AND METHODS
This sertion describes materiais and methods common to many of the indil/idual studieswhich constituted this research project. Procedures unique to particular studies are described in
subsequent sections of this report.
A. PROGRAM OF STUDYInitial experiments focused on the final transformation step of dechlorination, VC
conversion to ET H. The "low-level" PCEIMeOH culture originally developed by Freedman waserriployed (1, 28) at nominal PCE concentrations of 0.5-0.6 mg1L. MeOH served as the electrondonor, and various serum bottles were prepared to observe production of ETH in the presence of
PCE and VC, and VC alone. Such experimentation was undertaken to determine if PCE'spresence was required to achieve dech!orination of VC to ETH.
Subsequent experiments were conducted with the "high-level" PCE/tMeOH culture
developed by DiStefano (2, 29) using nomninal PCE concentrations of 550 )iM (91 mgIL). Akinetics experiment was c impleted to determine maximum specific rates of PCE transformation
and to observe the production and decline of intermediates. H2 was applied as an alternate electrondonor to facilitate an understanding of its possible role as the direct electron donor for PCEreduction. Selective inhibitors (vancomycin and bromoethanesulfonic acid) were employed to
examine the roles of the major classes of organisms in H2- and MeOH-fed systems degrading high
PCE concentrations.
Since many contaminated groundwaters contain concentrations of PCE which aresignificantly lower than 550 4M, it was desired to undertake studies which explored the capabilityof this high PCE culture to sustain dechlorination of lower levels of PCE. Two goals wereidentified: (1) To determine the ability of the high-PCE einichment culture to sustain
dechlorination of low concentrations of PCE through a long-term bottle study, where MeOH wasemployed as an electron donor at varying McOH:PCE ratios; and (2) To design, construct, andmaintain a continuous-flow AAFEB reactor and observe the ability of the high-PCE enrichmentculture to dechlorinate PCE at low concentrations, if supplied with MeOH at an optimalMeOH:PCE ratio. The basic experimental approach involved inoculation of serum bottles and acolumn reactor with the high-PCE enrichment culture, followed by a feeding of appropriateamounts of PCE, electron donor, and nutrient source to each culture on a regular basis. PCE
transformation and CH4 formation were measured from headspace samples which were analyzed
8

with a gas chromatographic technique, and either a liquid chronatographic method or an enzymatic
method involving spectrophotometry was employed to measure non-volatile, soluble compounds.
Bottles were maintained semicontinuously, and the column reactor was operated in batch,
semicontinuous, and continuous modes throughout the course of the experiments. All experiments
were conducted at 35'C.
B. CHEMICALS AND STOCK SOLUTIONS
PCE, TCE, trans-1,2-DCE, cis-l,2-DCE, and 1,1-DCE were obtained in neat liquidform (1- or 5-gram ampoules; Supelco, Inc.) for use as analytical standards. High-performance-
liquid-chromatography (HPLC)-grade PCE (99.9+ percent; Aldrich Chemical Co.) and HPLC-
grade MeOH (99.9 percent; Fisher Scientific) were used as culture substrates. H2 (99.95 percent
minimum purity) also served as a culture substrate and was purchased from Linde Specialty Gases
and Equipment. VC, ETH, and CH4 were obtained as gases in lecture bottles (99+ percent; Scott
Specialty Gases). H2 (1 percent in N2) was purchased from Airco, Inc. for use as a low-
concentration standard with the Re6 )n Gas Detector. Dimethyl sulfide (DMS, 99+ perceni)was obtained from Aldrich Chemical Co. Vancomycin hydrochloride (963 lIg/mg) and 2-
mercaptoethanesulfonic acid (Coenzyme M or 'CoM') were purchased from Sigma Chemical
Company. 2-Bromoethanesulfonic acid (BES) was obtained from Aldrich Chemical Co.
Experiments often employed a 25-percent aqueous stock solution of MeOH and a yeast
extract (YE, 50 g/L) stock solution. The stocks were added to serum bottles and gassed with 70
percen: N2-30 percent C02 via cannula prior to application of a butyl-rubber stopper and aluminum
crimp cap. For experiments in which a low level of electron donor was required, the stock
solution of YE was inoculated with 10 mL of the high-PCE culture and incubated for ten days at35°C in order to ferment much of the organic content of the YE. This fermentation process created
a stock solution containing necessary nutrients but relatively little organic matter which might
provide electron equivalents when added to cultures. Low levels of PCE were delivered from a
distilled-water stock which was saturated with PCE. In studies with high levels of PCE, neat PCE
was added by syringe to the cultures; the stock of neat PCE was not purged with N2-C0 2.
Alcohol oxidase (from Pichia pasrori, phosphate-buffered 60 percent sucrose solution),
peroxidase (Type I from horseradish) and 2,2'-azino-di-(3-ethyl)-benzthiazoline-6-sulfonic acid
(ABTS, 98 percent, diammonium salt) were used in the preparation of an enzymatic reagent for the
analysis of MeOH (all chemicals from Sigma Chemical Co.).
A reducing solution containing titanous chloride (20 percent, Fisher Scientific), sodium
bicarbonate (Fisher Scientific) and citric acid, trisodium salt dihydrate (99 percent, Aldrich
9
Mimi

Chemical Co.) was used as a scrubbing agent to remove trace levels of oxygen in the 30 percentCOJ70 percent N2 purge-gas mixture described for use in various procedures of this research.
C. CULTURES AND ENRICHMENT PROCEDURES1. General Procedures
All experiments were conducted using 100-mL culture volumes in 160-mL serumbottles. As discussed later in this chapter, two 6-liter stock cultures were maintained to serve assources of organisms. In preparation for experiments, 100-mL mixed-liquor aliquots wereanaerobically transferred directly from the reactor of choice to serum bottles via a Unispense IIpump. At least 2 minutes before dispensing culture, serum bottles were made anaerobic by addinga cannula flowing with 70 percent N2-30 percent C02z. Upstream from the cannula, the N2-CO2mixture was continuously bubbled through a titanium-chloride solution to remove trace levels ofoxygen. Maintenance of serum-bottle cultures was dependent on objectives of individualexperiments. Therefore, details concerning culture maintenance accompany descriptions ofrespective experiments.
Experiments involving low-level (methanogenic) PCE cultures utilized Teflon®-
lined natural rubber septa (Supelco) held in place by aluminum crimp caps. Later, Teflon®-lined,butyl-rubber septa (Wheaton) were judged superior in withstanding multiple needle punctures.
Therefore, the butyl-rubber septa were used for subsequent experiments involving high-level (non-methanogenic) anaerobic cultures. In all cases, the bottles were maintained at 35°C in an invertedposition to miaimize loss of volatile compounds. Unless otherwise noted, bottles which receivedMeON were incubated quiescently, whereas H2-fed bottles were incubated in an orbital shaker bathto facilitate transfer of H2 to the liquid phase. Cultures were grown in a basal salts medium with amodified (1, 28) composition from that of Zeikus (35). The basal medium recipe is shown in
Table 1.2. Low-Level (Methanogenic) PCE Stock Culture
Methanogenic mixed cultures were obtained from those developed by DavidFreedman (1, 28). Freedman's culture was added to basal medium in a 9.6-liter bottle (Fisher
Scientific) to develop a large-quantity source of organisms for future experiments. A 6-liter liquidvolume was chosen to result in an identical liquid volume/total volume ratio as in the 160-mL
serum bottles. Headspace conversion factors from the 160-mL serum bottles were thus applicableto .he 9.6-liter bottle during routine analysis of volatile components. Figure 1 is a schematic of the
6-liter reactor.
10

TABLE 1. BASAL MEDIUM FOR ENRICHMENT CULTURES
Co mpoun* outatt
N -hC 0.20 g
K2HP0 4 .3H20 0.10 gKH2PO4 0.055 g
MgCI2.6H20 0.20 gResazurin 1 mg
Trace Metals Solution** 10 mL
FeCI24H20 0.10 g
Na2S.9H2 0 0.50 g
NaJHC03 6.0 gDistilled-deionized water 1000 mL
* First seven items were added, N2 purge was maintained until solution changed from blue to
pink, remaining items were added, and then purge gas was switched to 30% CO270% N2 . HClwas added as needed to achieve pH 7.
**0.1 g/L MnCI2 .4H20; 0.17 g/L COC2-6H 20; 0.10 g/L ZnCI2; 0.20 g/L CaC 2; 0.019 g/L
H3BO4; 0.05 g/L NiC 2.6H20; 0.02 g/L Na 2M04.2H2 0. Adjust to pH 7 with NaOH or HC1.
PCE and VC retention in the 9.6-liter bottle was examined prior to addition of
culture and basal medium. 21 tmol PCE and 18 pmol VC were added to 6 liters ')f distilled water,
and the bottle was sealed and maintained at 35°C on its side. After 4 days, essentially all the added
PCE was measured and 85 percent of the added VC remained. The design was deemed acceptable,
since the biological transformation of PCE to VC occurred at a much faster rate than the observedVC loss rate; furthermore, the 9.6-liter bottle was only intended as a reservoir of organisms. All
experiments would be conducted with organisms in 160-mL serum bottles.
Every second day, the culture was fed (via syringe), 16 mmol MeOH (87 mg/L),
18 pmol PCE (0.5 mg/L nominal liquid concentration, ignoring partitioning to the headspace) and
12 mg YE (2 mg/L). A PCE/MeOH stock was prepared by dissolving neat PCE in MeOH. The
YE stock in distilled water was prepared in a serum bottle and purged thoroughly with 70 percent
N2-30 percent C02 prior to crimp-sealing with a butyl-rubber septum. Because of the relatively
low PCE dose, this methanogenic master culture was termed the "low-PCE culture." Before
feeding, headspace analysis was completed, and gas production was measured and vented. Gas
production was measured by connecting tubing between the reactor and a calibrated gas
11

displacement bottle filled with distilled water. Following gas volume measurement, 800 mL of
basal medium was added, the bottle was vigorously mixed, and 800 mL was then wasted from the
9.6-liter bottle. Basal medium was added by connecting, with Tygon ® tubing, the reactor to areservoir of basal medium; the reservoir was pressurized with 70 percent N2 -30 percent C0 2 , and
basal medium was transferred to the reactor. The reactor was shaken vigorously, and then mixed
liquor was wasted through the stainless-steel valve to a graduated cylinder. The feeding and
wasting procedure occurred every second day, thus resulting in a nominal HRT of 15 days.
Teflon'7 (FEP) disc 9-literserum bottle
rubber gasket
three-way hosestainless-steel n clampball valve nut
brass stainless- (I -
hose steel spinbarb nipple bar
~gray--
stainless- butylsteel plate stopper
aluminum
Tygon® tubing collar eyebolt
Figure 1. Schematic of 6-Liter Reactor (Exploded View).
12

3. High-Level (Nonmethanogenic) PCE Stock CultureTwo 160-mL serum bottles containing methanogenic (low-PCE) culture were fed
ever-increasing PCE doses to investigate tolerance to PCE. When the PCE dose reached about 25.mol/100 mL (33 mg/L), CH4 production declined and eventually ceased; improved conversion of
PCE to ETH was also observed. Eventually, the nominal PCE dose reached 55 pgmol1O0 mL (91mg/L) and was routinely restored to 55 lpmol following consumption. Details concerning thetransformation of this culture are given elsewhere (2). This transformation was consideredsignificant; w(, therefore proceeded to piepare a large-volume source of this culture for subsequent
experiments. A second 9.6-liter bottle, identical to that depicted in Figure 1, was constructed and
seeded from the two serum bottles which had routinely received 55 4imol PCE/100 mL. Basalmedium (5.8 liters, Table 1) was prepared in the 9.6-liter bottle and culture from the two serum
bottles was transferred via gas-tight syringe to the large bottle. The resultant liquid volume of thereactor was 6 liters.
This anaerobic (essentially nonmethanogenic) 6-liter master culture became known
as the "high-PCE" culture. It was maintained as follows: every second day, a headspace sampletaken from the reactor was analyzed using gas chromatography in order to measure the productionof volatiles, and gas production was vented. The culture was then fed individually, via syringe, thefollowing: 9.4 mmol neat MeOH (50 mg/L), 3.3 mmol neat PCE (91 mg/L), and 120 mg YE (20mg/L). On every fourth day, after gas production of volatile compounds was measured and vented,the reactor was purged of volatile products with a 70 percent N2 -30 percent CO2 gaseous mixturewhich was passed through a titanous chloride scrubbing solution in order to remove trace levels of
oxygen. The annxic purge gas was delivered to the reactor via two cannula which were insertedinto a, port located on the side of the reactor. After the purging of the reactor, 600 mL of fresh basal
salts medium was anexically added to the bottle; then the entire reactor was shaken vigorously andwas wasted of 600 mL of culture medium, resulting in a nominal HRT of 40 days. The mixed
liquor was wasted from the reactor through a three-way stainless-steel valve into a 1000-liter
graduated cylinder. Basal medium was transferred to the reactor from a 15-liter reservoir via aconnection of Tygon® tuHing leading from the reservoir to the reactor. A N21C0 2 anoxic gaseousmixture delivered to the basal medium reservoir provided the driving force necessary to transfer themedium into the 6-icer reactor. Feeding of the reactor was then completed as on the second day of
the 4-day cycle.
13

D. ANALYTICAL METHODS
1. Gas Chromatography (GC)P. Headspace Analysis of Volatile Organics and Hydrogen.
The total mass of each volatile organic (PCE, TCE, DCE isomers, VC,ETH, CH4 , and DMS) and H2 within a serum-bottle culture was determined by a methodinvolving a single 0.5-mL headsace gas injection into a complex network involving simultaneous
use of two gas chromatographs (Perkin Elmer-Model 8500), two analytical columns, two n,u!ti-
port air-actuated switching valves (Valco, Inc.), two flame-ionization detectors (FIDs), and one
reduction-gas detector (Trace Analytical RGD). Figure 2 is a schematic of the GC system.One GC, where injection was made, was equipped with one FID and two
columns - a 3.2-mm x 2.44-meter stainless-steel column packed with 1 percent SP-1000 on
60/80 Carbopack®-B, in series with a 3.2-mm x 3.2-meter stainless-steel column packed with100/120 Carbosieve® G (Supelco, Inc.), with the two switching valves situated upstream and
downstream of the Carbosieve® column. For 1.5 minutes after sample injection, flow was routed
from the injector through the Carbopack® column to the Carbosieve® column. Within that 1.5-
minute period, H2, Cl-H4 , and ETH passed through the Carbopack® column, relatively unretained,
and into the Carbosieve® column, where they could be resolved. At 1.5 minutes, the Carbopack®
column effluent was redirected via switching valve 1 tv the FID for eventual detection of VC,
DCEs, TCE, PCE, and DMS. For the first 2 minutes following injection, effluent from the
Carbosieve® column was routed via switching valve 2 to the RGD for eventual H2 detection. At 2
minutes - just after H2 was detected, but before CH 4 eluted - the effluent from the Carbosieve®column was redirected to the FID of the second gas chromatograph for eventual detection of CH4and ETH. Output from each FID was sent to separate calculating integrators and printers (Perkin
Elmer GP-100). Output from the RGD was sent to a calculating integrator (Perkin Elmer LCI
100). N2 served as the carrier gas (30 mL/min through each branch of the network at all times).
The columns were in a single oven, which was temperature-programmed as follows: 100°C for 4
minutes; ramped at 20C/rin to 200'C; and held for 8 minutes.
This GC method was used in its entirety when detection of low levels of H2was desired (i.e., less than about 1,000 nmoles per serum bottle). When RGD measurement of H2
was either not possible (i.e., at H2 > 1,000 nmol/bottle) - or not desired - diversion to the RGD
was omitted. In such cases, Carboxieve® flow was constantly routed via valve 2 to FID 2 for
detection of C-H4 and ETH.
14

Gas Chromatograph
Carbopack® B Carbosieve® G
0.5 mLheadspacesample
Flame aux. carrier
FlameIonizationDetector 1 DCEs,TCE, PCE
valve 2
to Reduction -MGas Detector H2(optional) aux. carrier
to FlameIonizationDetector 2 CH4 , ETH
Figure 2. Schematic of Gas Chromatographic System for Headspace Analysis of VolatileOrganics (H2 Analysis via Rediuction Gas Detector Was Optional).
Initial identification and confirmation of volatile organics was presented
previously (1). Subsequent idtntification was confirmed by injection of standards into the GC
system described. GC calibration factors, resulting from a 0.5-mL headspace injection, were
related to the total mass of compound present in a serum bottle. Each neat compound was
transferred to a known quantity of MeOH in a sealed, 14-mL vial. Quantities of compound aid
15

MeOH were determined gravimetrically. A known mass of compound (in MeOH) was determined
gravimetrically and delivered by syringe to a 160-mL serum bottle. The serum bottle contained
100 mL distilled, deionized (DDI) water and was sealed with a Teflon®-lined natural rubber
septum or Teflons-lined butyl-rubber septum and aluminum crimp cap. The bottle was
equilibrated at 35'C then analyzed via 0.5-mL headspace injection to the GC.Since VC, ETH, H2, and CH4 were obtained as gases, volumetric additions
were made directly to the 160-mL serum bottles filled with 100 mL DDI water. Standard mass
additions to the serum bottles were determined from the ideal gas law. The standards prepared forthe calibration of low levels of H2 for analysis by the RGD needed to be purged of even trace
levels of H2 before low-level standards (less than 3 nanomoles per 0.5-mL injection) were
prepared. Therefore, these standards were purged with prepurified nitrogen (Linde Specialty Gases
and Equipment) which was sent through a catalytic combustion filter (Trace Analytical) and then
through a molecular sieve (Supelco, Inc.) before entering the calibration-standard bottles through
small glass dispersion spargers (Ace Glass, Inc.). H2 (1 percent in a N2 gas mixture) was then
added via gas-tight syringes to the bottles.Higher levels of H2 (i.e., > 1,000 nmol/bottle) were routinely measured by
a GC technique involving injection of a 0.5-mL headspace sample into a 3.2-mm x 3.05-meterstainless-steel column packed with 100/120 Carbosieve® S II coupled with a thermal conductivity
detector. N2 served as the carrier gas. The GC oven was held at 150"C for 1.5 minutes for thisanalysis. Standards were prepared as described previously.
The coefficient of variation was used as the measure of precision forstandards analysis. Coefficients of variation (standard deviation/mean* 100) for calibration factors
(relating total mass of each volatile in a bottile to GC peak-area response) ranged from 0.59 percent
to 2.8 percent.
b. GC Analysis of Methanol and Acetate.
MeOH and HAc analyses we:re completed by GC using a Perkin-Elmer
8500 GC. A 0.5-p.L aqueous injection was made to a 0.53-mm x 15-m,:ter Nukol® fused-silicacapillary column (Supelco, Inc.) connected to the FIm, The oven temperature was programmed as
follows: 100C for 3 minutes; ramp at 20'C/min to 160°C.
Samples (100-200 p.L) were filtered through a 0.45-pim syringe filter
(Gelman Sciences) and acidified with 5 l.L 2N HCI prior to injection. Samples were sometimes
stored in the refrigerator for up io 4 days prior to analysis. To examine the suitability of this
storage method, standards were prepared, acidified, analyzed, placed in the refrigerator for 2
weeks, and analyzed again. There was no significant difference between pre- and post-storage
analysis. Standard calibration curves were developed for MeOH and HAc. Peak-area responses
16
Im

from subsequent samples were compared to the standard curves to obtain MeOH and HAc
concentrations.2. Acetate and Formate via High Performance Liquid Chromatography
(HPLC)HAc and formate analyses were performed using a Hewlett Packard 1090 HPLC,
coupled with a 300-mm HPX-87H ion-exchange column (Bio-Rad Laboratories). When onlyHAc was to be quantified, a 100-mm x 7.8-mm Fast-Acid (Bio-Rad Laboratories) column was
substituted. The Fast-Acid column, though incapable of resolving formate and HAc, waspreferred due its shorter run time when HAc was the only organic acid to be measured. Flow from
the column in use was directed to a Refractive Index Detector (Perkin-Elmer LC-25) whoseresponse was processed by a calculating integrator (Perkin-Elmer LCI-100). 100-IlL sampleswere used for all HPLC analyses. H2SO4 ('.013 N) served as the mobile phase and was pumped
through the 300-mm column at 0.7 mL/min and through the Fast-Acid column at 0.8 mL/min. The300-mm column was fitted with a water jacket which held the temperature at 65'C while the Fast-
Acid column was used at ambient temperature.
Sample preparation included filtration of a 0.5-mL aliquot (using a GelmanScience's 0.45-p.m filter disk), acidification (with 10 jitL of 2N HCI), and refrigeration. Standard
calibration curves were developed for foimate and HAc. Peak-area responses from subsequent
samples were compared to the standard curves to obtain formate and HAc concentrations.
17

SECTION IV
TRANSFORMATION OF VC TO ETH IN METHANOGENICCULTURES
A. CONTEXTFigure 3 presents results from a typical "low-PCE/MeOH" enrichment culture (29) - a
culture which received noninhibitory levels of PCE, large excesses of MeOH, and in which
methanogenesis was therefore the dominant fate of equivalents provided from MeOH. It depicts
performance of a 160-mL serum-botde culture (100-mL liquid volume) operated semicontinuously
as follows: Every fourth day, 4 mL mixed liquor was drawn (via syringe) and wasted, and 3.7
mL basal medium was added, plus 0.3 mL (0.3-0.35 p.tmol or 0.5-0.6 mg/L nominal dose)
distilled-deionized water saturated with PCE. The HRT in these bottles was therefore maintained
at 100 days. After wasting, basal medium iddition, and PCE addition, 156 .tmol (50 mg/L)
MeOH and 5 mg (50 mg/L) YE were added.
4.0-
3.5 - VCETH
3.0- 17 2.5
E0 2.0
. 1.5
1.0,
0.5
0.00 10 20 30 40 50 60 70 80 90 100
DAYS
Figure 3. PCE Transformation to VC and ETH in a MeOH-Enrichment Culture.
18

The performance depicted in Figure 3 is typical in that PCE was completely transformed to
VC and ETH during each 4-day incubation period. Each PCE dose was transformed to primarily
VC and lesser amounts of ETH. This pattern continued, in that VC persisted and was not
completely transformed to ETH. TCE and DCE isomtrs were rarely detected. Routine C-I 4
production per feeding ranged from 100 to 120 l.imol, Actual CH4 yield was therefore essentially
equal to theoretical yield according to the reaction:
CH 3OH - 1CO2+!CH4+iH2O.
Little MeOH was used in PCE reduction since MeOH was provided in amounts (936 p.eq) far in
excess of that needed for complete PCE transformation to ETH (2.8 ieq). This master culture was
clearly dominated by methanogenic organisms.
Results shown in Figure 3 and presented by Freedman (1, 28) make it clear that
considerable levels of VC persist during PCE dechlorination. As discussed in Section II, VC also
persisted in a fixed-film plug-flow reactor, possibly because organisms in the mid- and end-
sections of the reactor were never exposed to PCE. Therefore, an experiment was performed to
determine if PCE was needed to sustain VC conversion to ETH.
B. PROCEDURESSix 160-ni serum bottles were prepared from the methanogenic "low-PCE/MeOH" 6-liter
master culture; 100 mL mixed-liquor culture was anaerobically transferred to each serum bottle
using a Unispense-lI pump. Initially, bottles were operated identically to ensure uniform PCE-
dechlorinating capability. For 25 days, all bottles were performing similarly; nearly identical
amounts of VC and ETH had been produced per PCE addition. At 25 days, four bottles were
switched to VC and two bottles continued to receive PCE. Throughout the experiment, a large,
common background level of VC (3 to 5 j.mol) was maintained in all bottles. Therefore, potential
differences in VC transformation to ETH could not be explained by differences in VC among
bottles.
Headspace analyses and wasting/feeding operations were completed every 2nd day. Two
milliliters of mixed liquor was wasted, 1.7 mL of basal-salts medium (spiked with MeOH and YE)
was added, and then followed by 0.3 mL distilled-deionized water saturated with PCE. This
represented a PCE dose of 0.35 1Amol (0.6 mg/L nominal concentration). MeOH and YE were
added to the stock basal medium so that a 1.7-mL aliquot would provide doses of 31 gtmol (10
mg/L) MeOH and 0.2 mg (2 mg/L) YE. The nominal retention time in the bottles was 100 days.
19

From Days 0 to 25, all bottles were maintained in this manner, and each performed similarly. ByDay 25, cumulative PCE added was about 4.5 p.mol, cumulative VC was approximately 3 4Imol
and the balance was ETH. Also, near-stoichiometric conversion of MeOH to Cl-14 was observedduring each incubation interval; 20 to 25 pmol Cl-H was produced per feeding event,
Throughout this entire experiment (Day 0 to Day 160), regardless of the treatment, all
bottles exhibited near-stoichiometric conversion of MeOH to CH 4 . CH4 production is not
presented graphically. Although the MeOH dose was reduced 5-fold compared to previous
operations, it was still provided (187 ieq) in excess of that needed for complete PCE reduction to
ETH (2.8 geq).
From Day 25, four bottles were designated to receive routine VC additions instead of PCE
during the feeding operation. The remaining two bottles were to continue receiving PCE. Theretention time (100 days), MeOH (10 mg/L), and YE (2 mg/L) doses were identical in all bottles.
On Day 25, all bottles were purged with 70 percent N2 -30 percent C02, the septa were changed,and about 3.1 pimol VC (gaseous) was added to each bottle. VC was taken from a lecture bottle
and delivered to the serum bottles via gas-tight syringe. Two of the six bottles were designated tocontinue receiving routine PCE doses of 0.35 pmol. The VC-only bottles received about 0.35timol VC instead of PCE. VC was added in gaseous form; to maintain the 100-day IIRT in theVC-fed bottles, the wasted mixed liquor volume (2 mL) was replaced with 2 mL basal medium.
Routine VC additions were delivered as 0.2-mL pulses from a locking gas-tight syringe(Dynatech Precision Instruments). To facilitate delivery of such a small volume, a stock dilutionwas prepared by adding 14 mL VC from a lecture bottle to a 160-mL serum bottle containing 100
mL basal medium; the headspace was composed of 70 percent N2-30 percent CO 2. Use of basalmedium was desirable since it contained resazurin; an increase in reduction/oxidation potentialwould eventually be detected by a color change from clear to pink, thereby imparting some degree
of safety against injection of oxygen to the experimental bottles. This stock VC bottle was kept at35°C which resulted in a VC headspace concentration of 0.35 p.mol per 0.2 mL. The stock VC
bottle was also occasionally used to maintain similar background levels of VC in all bottles.After PCE addition, the bottles were placed inverted in a 35°C water bath and equilibrated
for 20 minutes (PCE transformation to TCE was observed when 20 minutes was exceeded). The
headspace was then sampled for verification of the quantity of PCE added. Since VC was nottansformed as rapidly as PCE, VC-spiked bottles were shaken vigorously and placed in the water
bath for 60 minutes before headspace sampling.
20

C. RESULTS
Throughout the experiment, replicate bottles performed similarly, therefore, an exemplary
bottle from each replicate pair is presented. FigLre 4 shows performances of PCE-fed and VC-fed
bottles. The Figure includes PCE, VC, and ETH levels; TCE was never observed during routine
sampling and DCEs were observed on occasion at insignificant levels. Cumulative PCE added is
also included.
Since it was not detected after 2 days' incubation, 0.35 pmol PCE was added to the PCE-
fed bottles every 2nd day. These repetitive additions arc represented by the "sawtooth" line on the
upper graph of Figure 4. Septa were repeatedly punctured for about 30 days before changing, at
which point the bottles were purged, and VC was restored. Such purging and septum-changing
:.vents are noted in the Figure. The lower graph includes measured VC and ETH levels and
cumulative VC added. Initially, 0.35 pamol VC was added as necessary to maintain VC levels at 3
p.mol. However, as the experiment progressed, VC in the PCE-fed bottles began to decline. In
order to maintain similar levels in all bottles, VC additions to the VC-fed bottles were then stopped,
as represented by the horizontal "cumulative VC fed" line from Days 61 to 83.
In PCE-fed bottles, ETH production was fairly constant throughout each operating-purging
cycle, and this level of operation appeared sustainable. In contrast, VC-fed bottles (lower graph of
Figure 4) exhibited a declining ETH production over successive operating-purging cycles. Figure
5 provides a comparison of ETH production rates in the PCE-fed and VC-fed bottles. VC levels
are included for both bottle-types to demonstrate that VC was similar both. Figure 5 shows that
the PCE-fed bottles produced about 0.1 to 0.12 Lmol ETH per day. Further, this rate of ETH
production was fairly constant and apparently sustainable. In comparison, the Figure shows the
decreasing ETH production rate in the VC-fed bottles. The rate decreased from 0.1 to about 0.02
gmol ETH per day over the 75-day sampling interval. Apparently, the presence of PCE and/or its
lesser chlorinated product(s) (TCE, DCEs) is (are) needed to sustain transformation of VC to ETH.
To examine this further, the four VC-fed bottles were paired so that two individual
operating procedures could be compared. One pair was designated to resume routine PCE
additions while the remaining pair would continue to receive only routine VC additions. The intent
was to see if VC transformation to ETH could be restored by PCE.
Figures 6 and 7 are presented in similar format to that of Figure 4. Figure 6 depicts results
from a bottle in which routine PCE additions were resumed from Day 67 to Day 123. An initial lag
in PCE transformation is evident in the "sawtooth" line from Days 67 to 83. Thereafter, the routine
PCE spikes were completely transformed in 2 days. A decline in ETH production is evident in the
second operating/purging cycle. However, an increase in ETH production is observed from Days
85 to 125. PCE additions stopped after Day 125 and a decline in ETH production is noticed.
21

--- Cumulative PCE added O- ETH-'--vc-U- PCE
7.
6 V purge, add6 VC. add PCE T 1
0
3
....*- Cumulative VC -i--VC -0- ETH7-
b *.(purge,
4) 'T.**@~*E0
3. A
2
025 35 45 55 65 75 85 95
DAYSFigure 4. ETH Production in Cultures Fed (a) PCE or (b) VC.
22

4.5 >
4.0 VCa -0.24 'a
3.5 0.20 c0 . 0~
o 300.16E
0 2.5 0
.2 2.00.12
1.5 0.08100
> ETH-)O 0.04 CL-.00.5
0.0 0025 35 45 55 65 75 85 95
4.0
(fl 3.5 -0.20 CD M
S 3.0 00.16 E>
0 2.5-0-1
*~2.0
E 1.5m
C., 10
0.5=
25 35 45 55 65 75 85 95
DAYS
Figure 5. ETH Production Rates in (a) PCE-Fed and (b) VC-Fed Bottles.
23

LIJ -oJ() :3 0)>
E .
let.
t L_ U,0)0 .co
It)
S~lO U OJ~ IA
(D (324

o. CI
C:):>0
IL
Cl,ID LOc m0
-C-) 4:iol
Q-c~25

For comparison, Figure 7 shows the progress of a VC-fed bottle. Ever-decreasing rates of
ETH are obvious with each operating/purging cycle in the VC-fed bottles in which PCE additionswere not resumed. ETH production rates are compared more easily in Figure 8. The upper
graph indicates, in the absence of PCE, a decline in ETH production from 0.1 to 0.03 pmol per
day. However, resumption of PCE additions after Day 65 seems linked to an increase in ETH
production to 0.09 gmol per day on Day 124. ETH production increased after Day 85; routine
PCE reduction had resumed at this time as shown in Figure 6. PCE was once again withheld and
ETH production declined to less than 0.06 .imol per day by Day 145. By comparison, bottles in
which PCE was permanently withheld (lower graph of Figure 8) exhibited a continuously
declining ETH production rate from 0.1 gmol per day to less than 0.02 pLmol per day.
It must be noted that although ETH production rates varied depending on treatments, CH4
production remained similar in all bottles; near stoichiometric conversion of MeOH to CR4
occurred routinely. This indicates that the observed decline in ETH production was not due to a
decline in activity of methanogenic organisms in the culture.
D. DISCUSSION
Observations indicate that once initiated, fairly constant conversion of PCE to ETH is
sustainable by a MeOH-enriched, PCE-fed culture. When VC additions are substituted for PCE,
an ever-decreasing ETH production rate was demonstrated. It is also clear that VC concentration
alone does not determine ETH production rates; although VC was similar in all bottles, PCE-fed
bottles produced and sustained ETH pr-'duction while VC-fed bottles could not. This suggests that
the presence of PCE (and /or TCE, DCEs) is (are) required to sustain VC dechlorination.
Examination of Figure 3 indicates that appreciable ETH production did not occur until VC reached
2.5 lVmol, a trend which was observed numerous times in other PCE-fed bottles. This lends
support to the hypothesis that PCE and high levels of VC are required before ETH production is
substantial.The presence of PCE may be necessary to stimulate production of a nonspecific enzyme
capable of mediating dechlorination. Recall that when PCE was withheld, and then reintroduced, a
lag in dechlorination was noticed (Figure 6). Such a lag may . an that the organism is
dechlorinating PCE for a purpose; for some reason, dechlorinatio...f PCE may be worth the
effort of enzyme synthesis. Indeed, the observation that PCE dechlorination seems to be
inducible, and therefore serves a purpose, was noted previously (30).
26

5.5.50 a 0.24
_ 4.5 (j)-
-. 00
0 305
2.5 0.12
2.0S 1.5U 1.0 c
0.5
25 45 65 85 105 125 145
5.0 -~ ~0.24-% 4.5 . - Vc C C
(I)0.20 _
0) 4.0 -6C
E 0.16 =0 3.0
o 2.50.2 0E 2.0
> 1.5 L1.00.04 CL
0.5M
0025 45 65 85 105 125 145 L
DAYS
Figure 8. ETH Production R~ates With (a) PCE Resumed and (h) PCE Withheld.
2 7

SECTION V
THE ROLE OF H2 IN REDUCTIVE DECHLORINATION OF PCE
A. CONTEXT
Glucose, HAc, formate, MeOH, and H2 have each been shown capable of sustaining the
reductive dechlorination of PCE (1), as have lactate, propionate, crotcnate, butyrate, and ethanol
(26, More exotic reductants, such as toluene (27) and dichlor,-methane (28), have also been
observed to support dechlorination of PCE. The fact that such a wide variety of electron donors
sustains dechlorination suggests that it may be the simplest - H2 - which serves as the direct
electron donor to the process; the other, more complex donors may merely serve as precursors for
H2 formation via fermentative metabolism (26).In this Chapter, we present further characterization of our high-PCE enrichment culture
specifically, results from comparative studies with MeOH- and H 2-fed mixed anaerobic culturesamended with selective inhibitors (vancomycin, a eubacterial inhibitor, and 2-bromoethanesulfonic
acid, an inhibitor of methanogenesis). Results provide additional evidence that H2 is the direct
electron donor for PCE reduction. We also report on the probable roles of major classes of
organisms with respect to 'CE dechlorination.
B. PROCEDURES
1. Studies with H2 as Electron Donor
The ability of H2 to sustain dechlorination of PCE was investigated using four 160-
mL serum bottles (100 mL liquid volume), each prepared by inoculating 90 mL basal medium with
10 mL of high-PCE/MeOH culture from the 6-liter reactor. H2 (11.5 mL = 469 Lmol) was added
via a locking, gas-tight syringe every 2nd day to two bottles. For comparison purposes, the other
two bottles received MeOH (5 mg from a 25 percent aqueous stock) every 2nd day as the electron
donor. On a reducing-equivalent basis, H2 (11.5 mL = 938 peq) and MeOH (5 mg = 938 4eq)
were provided in identical doses. The four bottles also received (every 2 days) neat PCE (55
pgmol) and YE (0.2 mg from an anoxic, aqueous stock). Bottles were purged via cannula with 70
percent N2/30 percert C02 prior to each feeding. By Day 6, each bottle had transformed its initial
PCE dose; sernicontinvous operation commenced at this point. Semicontinuous operation
consisted of (every 2 days) gas-purging, wasting (via syriige) 10 mL mixed culture, and adding
10 niL basal medium. PCE, YE, and H2 or MeOH were then added. Declining ETH production
was observed in all bottles from Days 0 to 15 (see resuits); a micronutrient limitation was
suspected; consequently, the YE dose was increased to 2 mg after Day 15. From Days 20 to 34,
28

culture wasting was suspended because ETH production had declined in all bottles; batch additions
of PCE, YE, and H2 or MeOH continued. After Day 34, ETH production had increased to over 20
pLmoles per feeding in the MeOH bottles, and semi-continuous operation (every 2nd day) was
resumed in all bottles.
2. Preparation of Filtered Culture SupernatantFor extended studies involving demonstration of H2 as an electron donor, cultures
were sometimes amended with filtered culture supernatant as a source of growth factors.
Preparation of filtered culture supernatant included the following steps: (1) 600 mL PCE/MeOH
culture was anaerobically transferred from the 6-liter high-PCE/MeOH stock culture to a 2-liter
batch, anaerobic reactor; (2) a small volume (ca. 10 percent) of an aceticlastic methanogenic
enrichment culture was added to consume HAc (normally present at high concentrations in the
high-PCE/MeOH enrichment reactor; its removal was necessary to increase the precision of later
results from electron-balance determinations); (3) when measurements indicated < 0.5 mM HAc
remained (usually 5 to 8 days after inoculation), the culture was anaerobically transferred to
centrifuge tubes while inside a glove box, centrifuged (4080 x g) outside the glove box, with the
resulting centrate subsequently filtered (0.45 gm) inside the anaerobic glove box, to remove
organisms; and (4) since the resulting filtrate obviously contained none of the black, iron-sulfide
precipitate which normally helped maintain a low redox potential in our cultures, precipitate from
basal medium was added to the filtrate.
3. Inhibitor Studies
The inhibitors vancomycin and BES were applied to high-PCE/MeOH and high-
PCE/H 2 cultures to investigate the roles of acetogens and methanogens in PCE reduction. In an
anaerobic glove box, PCE/MeOH inoculum from the high-PCE, 6-liter reactor was transferred to
six 400-mL polypropylene bottles, which were then capped and centrifuged outside the glove box.
The bottles were returned to the glove oox, supernatant was wasted, and filtered culture
supernatant was added to resuspend the pellet. (Treatment with filtered culture supernatant in this
manner reduced the HAc concentration of the culture, facilitating the monitoring of subsequent,
small changes in HAc levels during experimental runs.) Contents from all six were combined, and
100-niL aliqu' s of suspension were transferred to sixteen, 160-mL serum bottles. Teflon®-lined
butyl-rubber septa and aluminum crimp caps were applied to the bottles, as usual.
The bottles were removed from the glove box and purged for 5 minutes with 70
percent N2/30 percent C02. (The glove-box atmosphere was a N2-H2 composition; bottle purging
was completed to replace the N2 -H2 headspace with N2-CO 2 .) During purging, 10 mg (100
mg/liter) vancomycin was added to some bottles. After purging, 2 mg YE (20 mg/liter), and 156
p.mol MeOH (50 mg/liter) or 469 ltmol H2 (11.5 mL) were deli vered to the bottles. 55 lamol PCE
29

k9 l mg/liter) was added to some bottles; others received no PCE, and served as controls. Later in
the study, some bottles received 0.025 mmol BES (0,25 mM). Bottles were maintained in batch
mode; every 2nd day, purging and additions of PCE, YE, MeOH, or H2 were completed.
C. RESULTS1. H2 as an Electron Donor for PCE Reduction
We first tested whether H2 can serve as an electron donor for PCE dechlorination
in short-term studies. PCE/MeOH cultures in 160-mL serum bottles were switched from MeOH to
H2 as the electron donor, and were incubated in a shaking water bath. The dose of H2 employed
was two-fold in excess of the stoichiometric requiremett for complete dechlorination of PCE to
ETH (as had been true of the MeOH dosages preceding the switch). As shown in Figure 9, such
cultures immediately were able to use H2 to convert PCE to ETH and small amounts of VC.
Controls to which H2 was not added did not dechlorinate PCE (data not presented).
These initial studies demonstrated that 1-12 could serve as electron donor for PCE
dechloriiation - at least over the short term - in bottles started wi(h 100 percent inoculurn from
the PCE/MeOH culture. We next prepared a more rigorous test of H2, this time starting with 10
percent PCE/MeOH inoculum, and extending the study over 90 days to investigate possible
nutritional deficiencies which might arise with use of H2 in place of MeOH.
Figure 10 shows the performances of H2-fed and MeOH-fed bottles. VC and ETH
productions by the H2-fed and MeOH-fed bottles were similar for the first 10 days. ETH
production .n the H2-fed bottles diminished to insignificant levels by Day 10. VC production
continued; however, residual PCE was routinely detected. By contrast, the MeOH-fed bottles
transformed each PCE dose (after Day 20) to VC and ETH. TCE was rarely detected and
insignificant levels of DCEs were produced. As the study progr'.ssed, the H2-fed bottles
experienced a progressively diminishing ability to dechlorinate. Figure 10 shows the dramatic
increase of TCE beginning after Day 35. It seemed that H2 could serve as an ciectron donor, but
could not sustain PCE reduction.
The inability to suztain dechlorinatioi, ) VC and ETH could have been due to a lack
of growth factors in the H2-fed bottles - factors which m,.y have been produced in the MeOH-fed
systems. Serum bottles were prepared with filtered culture supernatant from MeOH enrichments to
test this hypothesis, The 6-liter PCE/MeOH culture provided seed organisms for this experiment.
PCE/MeOH culture (100 mL) was centrifuged and the resultant supernatant was removed. The
inoculum pellet was th(-n suspended in sufficient filtered culture supernatant to restore the 100-mL
liquid volume. A batch mode of operation was adopted to avoid dilution of the presumed growth
30

factors contributed by the supernatant diluent. Every 2nd day, after headspace analysis, a purgingand feeding procedure was completed as before.
400PCE added-- ETH produced
E 300 - VC produced
200
•~ 100
E oU 2 4 6 8 10 12 14
3000"H2 added
E 2500 CH 4 producedS2000-
1500-
1000 r7S 500
ol -I--c -- r- - r0 2 4 6 8 10 12 14
Time (days)
Figure 9. Short-Term Results Demonstrating the Ability of H2 to Support
Dechlorination of 55 lpmol Repetitive Additions of PCE to ETH; BottlesWere 160-mL in Total Volume, Containing 100 mL of Liquid.
31

400-'-U cumulative VC
cumulative TOE300- 0 cumulative ETH
0) ____
0E 200
0a
100"
00 10 20 30 40 50 60
600' J ~- cumulative VC500- -c3 cumulative ETH
I PCEM~ 400-
0 300.
U bS 2001
1001
0oilN+i\NMI0 0 20 30 40 50 60
Time (days)
Figure 10. Comparison of PCE Reduction in (a) a I-2-Fed Bottle and Wb a MeOH-Fed
Bottle.
32

Results (not shown) indicated that H2-fed systems could sustain dechlonnation if
elutriated with filtered culture supernatant approximately every 30 days (29). To demoi. ,trate that
H2 (as opposed to filtered culture supernatant) was supplying reducing equivalents for
dechlorination of PCE to ETH, H2 was withheld from the bottle on an every-other-feeding basis
from Day 96 onward. The purging procedure and PCE and YE additions were completed during
every feeding. Incubation intervals with H2 resulted in conversion of all added PCE to VC and
ETH, with more ETH formed than VC. During intervals in which H2 was withheld, 20 to 30
pmoles residual PCE was detected, and ETH production was insignificant.
2. Application of Inhibitors to MeOH- and H2-Fed Cultures
Inhibitors were applied to the PCE/MeOH or PCE/H2 cultures to investigate the
roles of different microbial populations in PCE reduction. Vancomycin is an inhibitor of cell wall
synthesis in eubacteria to which methanogens are usually insensitive (36). Although CH4production was slight in the high-PCE culture, this alone does not rule out a role for methanogens
in PCE reduction. BES - considered a selective inhibitor of methyl-coenzyme-M reductase, the
enzyme which catalyzes the final step in methanogenesis (37) - was therefore used to inhibit
methanogenesis in the PCE culture.
The performance of a MeOH-fed bottle receiving no inhibitors is shown in Figure
11. VC and ETH productions were steady up to Day 14; afterwards, VC declined slightly as
ETH production increased. Insignificant levels of TCE and DCEs sometimes occurred, and
residual PCE was never detected. MeOH metabolism and resultant products are shown in Figure
11, as well as the summation of dechlorination products, to allow comparison to the usage of
MeOH, the presumed electron donor. Residual MeOH was never detected, so MeOH consumed is
essentially equal to MeOH added. Acetogenesis accounted for almost 60 percent of electron-donor
use, and reduced products from PCE dechlorination represented over 40 percent. CI-14 productionwas insigni" -t. These results are similar to an earlier-reported distribution of MeOH use (2).
33

050
S20
E 44

PCE reduction and H2 metabolism by a bottle receiving no inhibitors are shown in
Figure 12. PCE reduction to VC and ETH occurred during every incubation interval. Insignificant
levels of DCEs sometimes occurred; TCE or residual PCE was never detected. VC production was
greater than that of ETH up to Day 15; VC and ETH productions were similar thereafter. (The
superior dechlorination in this H2-fed system, compared with that of the system depicted in Figure
10, is doubtless due to the ten-fold greater inoculum level employed - and the consequent ten-fold
greater supply of suspected growth factors from the PCE/MeOH inoculum.) 'H2 Ilctabolism and
resultant products are shown in Figure 12. Added H2 was used completely during each incubation
period. Acetogenesis accounted for 54 percent of electron-donor use, and reduced products from
PCE dechlorination represented nearly 45 percent. CH4 productioi, was slight, "CE apparentlyinhibited methanogenesis from H2-CO 2, as well as from HAc.
Vancomycin was added to two MeOH-fed and two H2 -fed bottles to observe
potential effects on PCE reduction. Results from the vancomycin-amended, MeOH-fed bottle are
shown in Figure 13. Vancomycin had a profound effect on PCE reduction. Essentially equal
amounts of VC and ETH were produced up to Day 8. Thereafter, ETH l, Juction ceased and VCproduction declined. Increasing amounts of residual PCE were observed beginning on Day 10.
Figure 13 shows only slight HAc production after Day 8, thus demonstrating the inhibitory effect
of vancomycin on a.xetogens (a smaller vertical scale is used than that of Figure I tbr clarity).
From Days 8 to 14, nearly all MeOH utilization can be accounted for in the products of PCEreduction. However, only slight increases in dechlorination products are evident after Day 14.
C-14 production from MeOH became significant between Days 14 to 18, when we allowed a 4-day
interval between successive PCE doses. Residual PCE was probably insufficient to suppress
methanogenesis over this prolonged interval. This confirms that vancomycin, at the dose
employed, did not severely inhibit methanogenesis. Note that CH4 production decreased over
ensuing, 2-day intervals between feedings. Residual MeOH was routinely detected. The MeOH
level was adjusted to 156 kmol per bottle (50 mg/liter) during each feeding to validate the
comparison between vancornycin-amended bottles and those with no vancomycin.
35

(004* 400 -V
0 T
250 A
0200-S150
100-E
S 50
00 4 8 12 16 20 24 28 32
0 1614 H2 consumed
0) 14 HAc b
*~12 -- 0- DCEs, VC, ETH
0 0 6H
4,
2
00 4 8 12 16 20 24 28 32
Time (days)
Figure 12. (a) PCE Reduction and (b) H2 Metabolism in a H2-Fed Culture.
36

450
2 -- U ETHao 350- Ai- POE remainingE
250' C
6% 200- add 10mg
-'150- vancomycin
S100-
2 50-U 0
0 2 4 6 8 10 12 14 16 18 20 22 24
0 5MeOH consumedb
0 -0-TOE, DOEs, VC, ETH>~ HAc
-4- OH 4
add 10 mgvancomycin
0 2 4 6 8 10 12 14 16 18 20 22 24
Time (days)
Figure 13. (a) PCE Reduction and (b) MeOH Metabolism in a MeOH-Fed Culture
Amended With Vancamycin.
37

PCE reduction and H2 metabolism by a vancomycin-amended bottle are shown inFigure 14. PCE reduction by this H2 enrichment continued in the presence of vancomycin. VC
production was similar to that of H2-fed bottles with no vancomycin (Figure 12) throughout thestudy. ETH production was similar up to Day 16, but declined to low levels by Day 27. TCE and
DCEs were detected on Day 34; residual PCE was never obsc.,ved. Inhibition of acetogenesis by
vancomycin was apparent from the low HAc production shown in Figure 14 (a smaller vertical
scale is used than that of Figure 12 for clarity). Since it is possible that the low HAc detected invancomycin-amended bottles was due to consumption by aceticlastic methanogens rather than
inhibition of acetogenesis, bottles containing H2 and vancomycin were later dosed with BES and
did not accumulate HAc (results not shown), making it unlikely that aceticlastic methanogens wereconsuming HAc being produced in these cultures. Products of PCE reduction accounted for nearly
60 percent of H2 use in vancomycin-amended bottles. CHl- production represented a significant
fraction of the remainder of H2 use, primarily from Days 0 to 20. CH4 production declined after
Day 19, however, PCE reduction products (primarily VC) continued to increase. Residual H2 was
routinely detected in the varicomycin-amended bottles. H2 did not accumulate since it was
removed during purging. All H2-fed bottles began each incubation interval with an equivalent H2
dose. Thus, the dechlorinating performance of the vancomycin treated PCE/H 2 cultures was
similar to cultures withoi't vancomycin, while acetogenesis was strongly inhibited, and
methanogenesis was stimulated.
The decline of ETH production and detection of TCE and DCEs indicated that the
H2 -fed bottles with vancomycin were slowly losing the capability to dechlorinate PCE. An
elutriation procedure with filtered culture supematant (as described earlier) plus vancomycin was
twice completed (Days 36 and 64) on the vancomycin-amended culture with the expectation that
growth factors would stimulate PCE reduction. Batch feeding and purging were maintained every2nd day throughout this study. After the first elutriation, from Days 36 to 64, VC production was
steady and accounted for most of the dechlorinated PCE. Only low levels of ETH were detected
throughout this cycle. Small amounts of TCE and DCEs were routinely detected. Improved
dechlorination was evident after the second elutriation on Day 64. Increased ETH production
occurred up to Day 79; TCE and DCEs increased thereafter. VC production remained consistent
throughout each cycle. Elutriation successfully restored ETI- production, although to a lesser rate
than observed from Days 0 to 15.
38

0450-
400 - - DCESE C0 50
300S 250 . d 0 m00
200 varicomycin-150 0
E 1001C.) 50
00 4 8 12 16 20 24 28 32
(0 10' _
H2 consum'edb0 -0 TOE, DCEs, VC, ETH
M 8- - CH 4A~ HAo
formate0 6-
0vancomycin -
20-- 1-0 - -0
o 00
0 4 8 12 16 20 24 28 32
Time (days)
Figure 14. (a) PCE Reduction and (b) H2 Metabolism in a H2-Fed Culture Amended
39

The effects of BES on dechlorination of PCE in MeOH- and H2-fed systems were
examined, Earlier results (Figures 11 and 12) indicated CH4 production was negligible in PCE-fed
MeOH and H2 enrichments, suggesting that methanogens play no significant role in
dechlorination. Surprisingly, 0.25 mM BES inhibited PCE dechlorination in a MeOH-fed system
(data not shown), with no apparent effect on acetogenesis. Up to Day 27, this bottle performed
similarly to its replicate (Figure 11), as expected. However, after BES addition on Day 27, VC
and ETH productions were slight. Accumulations of TCE and DCEs were observed, but residual
PCE was not. Similar inhibition of dechlorination was observed with H2-fed cultures.
D. DISCUSSION
H2 served as the electron donor in the reductive dechlorination of PCE to VC and ETH for
periods up to 40 days; however, sustained dechlorination for more extended periods required the
addition of filtered culture supernatant from a presumably more diverse, MeOH-fed system. This
suggests a nutritional dependency of H2-using dechlorinators upon the activities of other
organisms.
MeOHPCE and H2/PCE systems without vancomycin or BES performed similarly with
respect to electron-donor use; HAc production accounted for a majority of reducing equivalentswith the remainder going to PCE reduction. The predominance of acetogens in the inoculum was
also evident from the MeOH- and H2 -fed bottles in which PCE was withheld (data not shown) -
MeOH-using methanogens were apparently in much lower numbers than MeOH-using acetogens;
HAc-using methanogens were virtually absent.
Vancomycin effectively inhibited acetogenesis in MeOH- and H2-fed bottles of all types.
Vancomycin is a eubacterial peptidoglycan synthesis inhibitor, is bacteriocidal, and is more
effective against Gram-positive than Gram-negative eubacteria (36, 38). It is unlikely thatvancomycin directly inhibited acetogenesis in the cultures, but rather the inhibition was due to the
bacteriocidal effects of vancomycin on acetogens, most of which are Gram-positive (39). The
major MeOH-utilizing acetogen detected in the culture was a Gram-positive coccus which was
present in numbers exceeding 107/mL (40).
The effects of vancomycin on PCE dechlorination were mixed. PCE reduction by MeOH
enrichments was inhibited within a week, similar to acetogenesis. In contrast to MeOH-fed bottles,
dechlorination by H2-fed bottles continued well after inhibition of acetogenesis, and could be
sustained for long periods of time by supplementation with filtered culture medium, similar to H2-
fed bottles lacking vancomycin. The difference in response to vancomycin by H2- and MeOH-fed
bottles may be explained if H2 was the actual electron donor for dechlorination in both systems. It
is feasible that acetogens in the MeOH-fed culture were the major users of MeOH and served two
40

purposes to the PCE dechlorinators - production of reducing equivalents in the form of H2, and
production of unknown nutritional factors apparently required by H2-using dechlorinators.
Reductive dechlorination is considerably more thermodynamically favorable than acetogenesis (2),
and use of acetogen-produced H2 by other organisms carrying out more thermodynamically
favorable reactions has been observed previously (41). Moreover, interspecies nutritional co-
dependencies are well-known among anaerobes. That the PCE dechlorinators are resistant to 100
mg/L vancomycin, suggests that they are resistant eubacteria, perhaps Gram-negative, ormethanogenic archaebacteria.
The methanogenesis inhibitor BES inhibited dechlorination beyond TCE in MeOH- and
H2-fed systems. This provides circumstantial evidence for the involvement of methanogens in
reduztive dechlorination - in the absexce of appreciable methanogenesis itself. Fathepure et al.
(21, 22, 23) reported transformation of PCE to TCE by pure methanogenic cultures, but observed
a stoichiometric rehtionship between methanogrnesis and dcchlorination, and noted that BESinhibited dechlorination. They proposed that electrons transferred during methanogenesis are
diverted to FCE by a reduced electron ctrrier involved in CR4 production for us to corclude a
dechlorinating role for methanogens in our cultures, based solely upon observations that BES
inhibits dechlorination, presumes that BES-induced inhibition is specific to methanogens due to its
xtructuri similarity to CoM, which is unique to methanogens. Howevei, BES is a brominated
alkane and bears structural similarity to PCE and its reduced products. It is conceivable that BES
would inhibit reductve dechlorination, regardless of whether or not the dechlorinating organism
was a methanogen.Taken together, our vancomycin and BES results with MeOHIPCE- and H2/PCE-fed
systems support a hypchesis that the dechlorinating organisms were 12-users, possibly (though
not necessarily) methanogens. Sustained dechlorination in the presence of vancomycin (Vhich
demonstrably inhibited acetogenesis), suggests that acetogens were probably not the
dechlorinators.
Figure 15 shows the hypothetical roles of methanogens and acetogens in our high-PCE/MeOH enrichments; high levels of PCE inhibited methanogenesis from MeOH, HAc, and 112.
\Vancomycin inhibited acetogens, thereby stopping the source of reducing equivalents for PCE
reduction. We suggest that dechlorinaticn continued in H2 -fed systems amended it!:vancomycin, since the proposed electron donor, H2, was always available. ini this study, PCE-
iecuction products accounted for 60 percent of H2 use in vancomycin-amznded bottle-.
41

CH3 OH - hgen H 4
~-vancomycin C
BES or high PCE PCE
H2 - - - - - - - - - - - - - - -
BES
U BES or~Ihigh PCE
C0 2 / ETH
CH 3COOH methan ns OH4
BES or hign PCEC02
Figure 15. Hypothetical Roles of Methanogens and Acetogens ir H2- and MeOH-Fed
PCE-Dechlorinating Systems.
If boine out by subsequent studies, our hypothesis that H2 is the actual electron donor for
PCE dechiorination has practical consequences for bioremediation. It explains why a wide varicty
of electron donors has been observed to support PCE dechlorination in mixed-culture systems:glucose, HAc, formate, and MeOH (1); sucrose (33, 34); lactate, propionate, crotonate, butyrate,
and ethanol (26); and even co-contaminants such as toluene (27) or dichloromethane (28). Alllikely produce at least a small pool of H,; and a small pool wot d be sufficient to transform ppb-
levels of PCE. For bioremediation of relatively high PCE levels, electron donors should be
selected which cause production of a large H2 pool - or methods may be explored which would
employ H2 directly. One caveat is the apparent nutritional dependency we observed of H2-using
dechlorinators in our culture upon other organisms. If dechlorinating organisms in other systems
have the same or sirmilar nutritional requirements, the required nutriional factor(s) must be
identified and abiotically supplied, or it may be impossible to exclusively target electron donor
solely to the dechlorinators.
42

SECTION VI
PERFORMANCE OF THE HIGH-PCE/MeOH ENRICHMENTCULTURE AT LOV, PCE CONCENTRATIONS
A. CONTEXTThrough previous research conducted at Cornell University's Environmental Engineering
Laboratory, an anaerobic, MeOH-fed PCE enrichment culture was developed that proved capable
of dechlorinating high concentrations of PCE (550 .tM) to VC and ETH (2). This "high-
PCE/MeOH" enrichment culture was developed from a methanogenic system which originally
sustained dechlorination of a low level of PCE (3.5 IIM) (1); the major product of dechlorination
was VC, and conversion of VC to ETH was not a:-preciable in this low-PCE culture. AE this
methanogenic culture was exposed to increasing doses of PCE, methanogenesis became inhibited,
and the "high-PCE" culture evolved which demonstrated an ability to sustain dechlorination of high
levels of PCE at relatively low levels of MeOH. MeOH was supplied as an electron donor at a
lcvel which was approximately twice the amount needed 'or the complete transformation of PCE to
ETH. The efficient use of the MeOH equivalents supplied for reductive dechlorination in this
culture appeared to result from the inhibition of methanogenesis, which was apparently caused by
exposure of methanogenic bacteria to high concentrations of PCE.
Since many contaminated groundwaters contain concentrations of PCE which are
significantly lower than 550 pM. it was desired to undertak~e studies which exploied tne capability
of this high PCE culture to sustain dechlorination of lower levels of PCE. Could dechlorination be
sustained at reasonable MeOHIPCE ratios ot noninhibitory levels of PCE; or would methanogens
rise in dominance and consume an ever-increasing fraction of the supplied MeOH?
B. PROCEDURESThis first experiment studied the ability of the high-PCE enrichment culture to sustain
dechlorination of varying levels of PCE and ratios of MeOli to PCE. Four feeding strategies wereanalyzed, and each condition was replicated in two bottles. Table 2 summarizes the conditions
employed.
43

TABLE 2. LEVELS OF SUBSTRATE EMPLOYED IN BOTrLE-EXPERIMENT 1
Bottle Nominal MeOH MeOH:PCE Yeast Extract
Set PCE (rag/L) (mg/L) (equiv. basis) (mg/L)
1 91 50 2:1 20
2 9.1 50 20:1 20
3 9.1 5 2:1 2
4 9.1 25 10:1 10
Bottle Set I was maintained in a manner sirrilar to that of the high-PCE culture in the 6-liter
inoculum reservoir. A nominal concentration of 91 mg/L was achieved by injecting 9.1 mg (55
jimol) neat PCE into the 160-ml. bottles with a 10-jiL syringe. MeOH was added to Bottle Set I
in neat form with a similar 10-s.L syringe to achieve a concentration of 50 mg/L (156 gimol), an
amount which corresponded to approximately : 2:1 MeOH:PCE ratio (equivalent basis). YE was
delivered to the bottles via syringe at the same concentration fed to the high-PCE enrichment
culture. This amount was 20 mg/L, or 2 mg YE per bottle. Preparation of the YE stock solution
was described previously in Section Ii. The remainder of the bottles employed PCE at a level
which was an order of magnitude less than that maintained in Bottle Set 1. This amount, 5 5 Imol
PCE per bottle (or nominally 9.1 mg/L), was also delivered in neat form using a 1-4tL syringe.
MeOH was delivered in neat form as well, according to Table 2 above, and 1-gIL or 10-pEL
syringes were employed as appropriate. YE was delivered at an amount which equaled the same
ratio of YE:MeOH (mass basis) employed in the 6-liter culture (0.416 mg YE:mg MeOH., using
either 10- or 100-tL syringes.
The eight cultures were prepared as follows: all bottles were 'urged iniiially to create
anoxic conditions as described in Section 1II. The high-PCE culture provided the necessary
inoculum. A volume of 100 mL of 100 percent inoculum was delivered anaerobically to each of
the bottles with a Unispen;e II pump (Wheaton industries). The eight bottles were immediately fedafter inoculation and thereafter maintained similarly to the 6-liter culture for two 4-day cycles at a
high level of PCE (nominally 91 mgiL) and MeOH (50 rg/L), to assure that transfers had gone
well and that all bottles performed comparably at start-up. On the 2nd and 4th day, each bottle was
fed appropriate amounts of PCE, MeOH and YE. On the 4th day of the cycle, the bottles were
purged for 5 minutes with anl oxygen-scrubbed mixture of 70 percent N2/30 percent C02 to
remove inhibitory levels of ETH and VC. Also, an aliquot of 10 mL was removed from each
bottle on every 4th cay, and replaced with 10 niL fresh basal salts medium via syringe; therefore,
44

the HRT of the bottles was maintained at 40 days. After purging, wasting and feeding, the bottles
were provided with fresh septa, and were fed appropriate amounts of MeOH, PCE, and YE.
Measurements of pH made on the wasted 10 mL of culture on every 4th day. The bottles were
maintained at high PCE levels for two cycles of 4 days before the feeding protocol outlined in
Table 2 was followed. Appropriate headspace measurements of PCE, TCE, DCEs, VC, ETH and
CH4 and liquid measurements of HAc were made during the course of the experiment, as
described in Section III. The bottles were maintained in an inverted position in an orbital shaker
bath which was isothermally controlled at 35°C. The duration of the bottle experiment varied with
each bottle set, and ranged from 34 to 42 days.
C. RESULTS
The culture replicates behaved similarly, and the general trend of each culture is described
as follows: Figures 16 and 17 indicate the performance of Bottle Set 1, which was similar to the
behavior of the 6-liter high PCE culture in that methanogenesis was not a major activity, and after
every 2-day interval, nearly all of the PCE delivered to the cultures was transformed to
approximately 30 percent VC and 70 percent ETH, as indicated by the distribution of ethenes in the
Figures. Measurements every 2nd day indicate product levels resulting from the feeding which
occurred 2 days prior; measurements taken every 4th day represent product formation resulting
from two previous feedings. After product measurement on the 4th day of the cycle, all volatiles
were purged and the cycle repeated itself; this pattern is evident in the "saw-tooth" plots in
subsequent figures. After every 2 days, there was little or no TCE or DCEs remaining in the
cultures. Inhibition of methanogenesis was evident, caused by the high level of PCE employed in
the cultures. In Figures 16 and 17, an accounting of the products formed during each 2-day
feeding interval on an electron equivalent basis indicated that dechlorination and methanogenesis
accounted for approximately 47 percent and 7 percent, respectively, of the electron equivalents
provided to the cultures by the addition of MeOH, HAc production accounted for the remaining 46
percent of the electron equivalents supplied, since HAc levels remained steady at approximately
600 mg/L (0.01 M); therefore the removal of 10 mL of culture medium (which contained 800 4eq
HAc) every 4 days must have been balanced by the production of 800 peq HAc every 4 days.
This production of HAc would account for the difference of approximately 400 pieq between the
addition of MeOH and the sum of ETH and CH4 productions shown. Throughout the experiment,
VC, ETH and CH 4 formation remained relatively steady. Bottle I B indicated a small amount ofresidual PCE on Days 4 and 8, but thereafter converted all of the added PCE into ETH and VC.
Circumneutral pH was measured throughout the experiment.

cc C uc
.00 00=4 C4
(N aIo
u>T0
s-2
e,4
V r46

000
ooT.
0
'0(dN
C-N co .. 0
.00
(N -L.-
(N .
Hd-
(NCW 47

NN
QN
'C '0
A rN
C-4 to-
00S t
r44 '
(I~wi) su341 (IoulN
48~

C14
£00
(T~4) WH
-E 4
'0
49'

Bottle Set 2 (Figures 18 and 19) was fed one order of magnitude less PCE than Bottle Set I
and was provided with MeOH at a 20:1 ratio, on an electron-equivalent basis. Since
methanogenesis was no longer inhibited by a high level of PCE, and also a relatively large amount
of MeOH was provided, the culture gradually shifted from one in which dechlorination was a
major activity to one in which methanogenesis proliferated. C-I formation surged after Day 12,
and from this point CH4 accounted for most of the electron equivalents provided by the donor.
The measured CH4 yield after this time was nearly equal to the theoretical yield according to
CH 3OH --4 1/4 CO 2 + 3/4 CH4 + 1/2 H2 0.
Aftei Day 12, ETH production declined, and the levels of VC in the bottles increased for
the remainder of the experiment. Although Bottle 2A indicated no residual PCE after each 2-day
feeding interval, Bottle 2B3 was not able to transform all of the PCE into reduced products duringthree 2-day intervals throughout the course of the study. It is apparent on Day 26 that this culture
was adversely affected, as nearly half of the supplied PCE remained as residual, but on the next
feeding day, the culture appeared to recover, as no residual PCE was left. The large amount of
CH4 produced between Days 26-28 indicated that the MeOH which was fed on the first part of the
4-day cycle was not used until the latter 2 days of the cycle. It is assumed that acetogenesis and
biomass formation account for the imbalance of equivalents of reduced products presented in
Figures 18 and 19. A high background level of HAc was present in the cultures initially since the
inoculum for the cultures originated from the high-PCE level culture which produced quantities of
HAc much larger than levels of HAc produced by a predominantly methanogenic culture. Hence,
accurate measurements of incremental HAc production were not feasible in the transformed
metharogenic cultures of Bottle Set 2. Circumneutral pH was measured throughout the
experiment.
In Bottle Set 3, a feeding protocol incorporating a low level of PCE, along with MeOH
provided at a 2:1 ratio (electron-equivalent basis), also resulted in a gradual transformation of the
cultures to predominantly methanogenic ones, as indicated in Figures 20 and 21 by a surge in a
CH4 formation after Day 12, a simultaneous decline in ETH production, a rise followed by a
decline in VC levels, and residual PCE remaining after 2-day intervals. As with Bottle Set 2,
actual CI-14 formation was nearly equal to the theoretical yield after Day 16. Again, the large
background of HAc from the inoculum did not allow for accurate measurements of HAc
production over time. For most of the time during the experiment, the amount of equivalents of
reduced products formed _,xceeded the amount of equivalents provided by the MeOH; this
imbalance ight have been caused by the addition of reducing equivalents which were supplied by
the digestion of organic material contained in the YE solution, or by endogenous sources. (in
previous studies conducted by DiStefano (29), YE was found to provide 42 microequivalents of
reductant per milligram of YE supplied.]
50

IC-4
aoo
100
'0
V 'C
a0' LL.w0 r4' 0 . l : 0' r r
r4 - -
ODEil sa'0l -10u-i H13
51 _

C,'E,0
C.,4
000
oCNr
____ ____ ____ IU
N~ ~~ %~zz~~ %
000
00 10 Of 4
go r- r- r- r- t-- 10 1
Hd
52. e'. C

'00
NN
0
.. 2.
00 00 7; k,
__________ 'C0'
(IOLUT 3A (ILULWH
U
00 E c
o .>0
I r
-V..
CD_ __ _ 00 \O\!- -0
53

(1.4
F--
00 r- -1-1 e C
(~'1 01
00 0
C4 - !-
CD.
00 %0%0J N
Hd
54

C-4
0 0
-41
8U
e4-0 - -o
* 00 00 -
'00'
w~ C.
* 00
oIU1i 003)3(O")H
55.
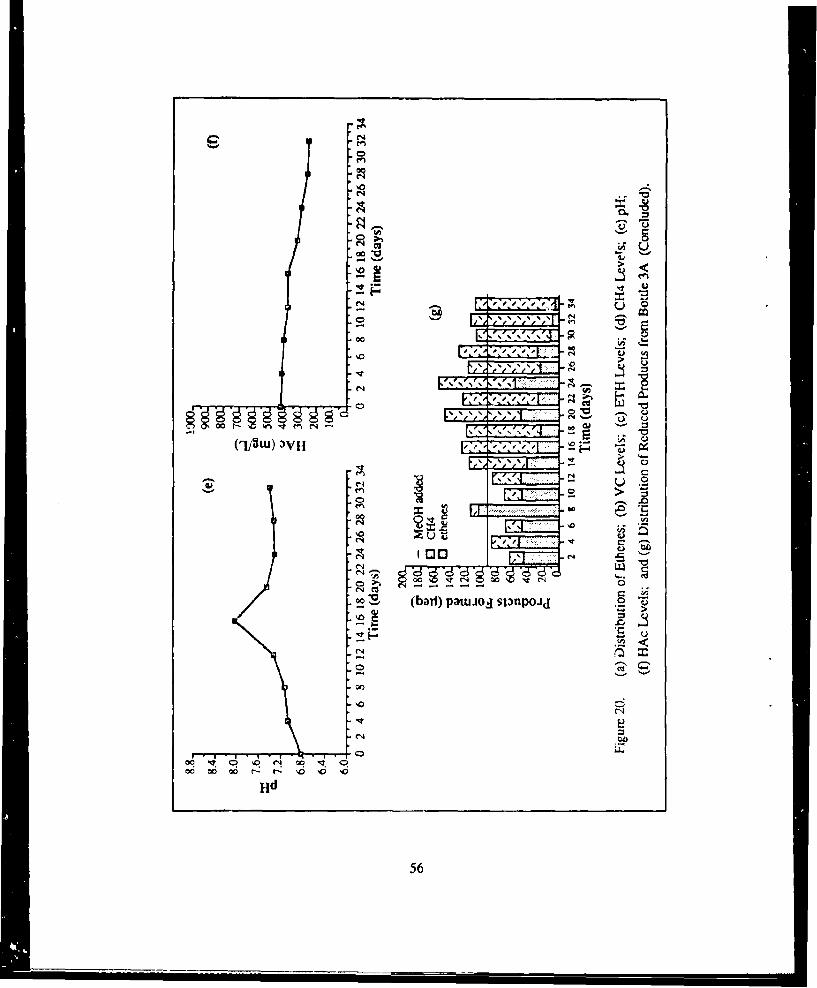
(C6
ci0>
0' 00 t-- 'n C)0l
IUD.
z' C4
CC HdU
56J

N N10
r4j
0
000
-. Z~-j -, .47
0-4 0
r-4
0~o- Ct(, .
0.)0
(-4,
000
CNE
(uOu~ Sa313 ".,l JL
57

GJ U
C
%~ %
(-O1u 3VH,/t 4
- --- ------
00 00.% % ca* .
C4 0~
(baI)pa - sim oid.2
0 -, it>
E~S~
2- :
Hd- ~ ~ 0
58. ''

On Day 16, a high pH reading of about 8.1 was observed in both replicates of Bottle Set 3,possibly causing the residual PCE indicated on this day. This mishap was probably due to an
improper purging mix of N2/C02 on Day 12. The pH during the remainder of the study
maintained circum; eutral values. A final anomaly is to be noted; on Day 6 of Bottle 3A, an
apparent incorrect feeding of PCE resulted in a high accounting of ethenes on Day 8.
Bottle Set 4, which incorporated a low level of PCE and an amount of MeOH which
corresponded to a 10:1 electron equivalent ratio of MeOH:PCE, behaved in a manner sihifilar to that
of Bottle Set 2 (20:1 MeOH:PCE ratio) in that gradually ETH production declined and VC levels
rose over time, as indicated in Figures 22 and 23; methanogenesis did not surge, however, until
Day 24, after which the actual Ct4 yield equaled the theoretical yield, and the culture was
transformed into one whose major activity was CR 4 formation. As in Bottle Sets 2 and 3, a high
measurement of pH on Day 16 was indicative of a purging mishap on Day 12. This resulted in
residual PCE measurements on Day 16. The amount of YE supplied to the system proviced
approximately an additional 44 microequivalents of reductant every 2 days in this bottle set. This
could partially explain the accounting of products in excess of the amount of equivalents supplied
to the system by the electron donor, MeOH.
D. DISCUSSION
From the results of this experiment, it is evident that at the low level of PCE suppiied to the
cultures (9.1 mg/L), dechlorination of PCE was sustained only if higher ratios of MeOH:PCE were
employed. However, even then, the production of ETH gradually decreased as an increasing
fraction of the added PCE remained as VC after 2-day intervals. It seemed evident that the high-
PCE culture cannot both sustain dechlorination of low levels of PCE and maintain consistently
high ETH production, if MeOH is erployed as an electron donor and methanogeresis is not
inhibited. Bottle Set 1 indicated sustainable dechlorination and high HAc production, since the
inhibition of the conversion of MeOH directly to CH4 , presumably due to the high level of PCE
employed, allowed for the fermentation of the MeOH to HAc, thereby creating an intermediate pool
of H2 accessible to dechlorinating bacteria. however, in Bottle Sets 2. 3, and 4, the low level of
PCE supplied did not inhibit the direct conversion of MeOH to CH 4 , and acetogenesis and
dechlorination became minor activities of the cultures as methanogenesis proliferated. It is
apparent that if a low level of FCE is to be dechlorinated by the high-PCE culture, then the addition
of an inhibitor of methanogenesis, but not dechlorination, might be desirable in order to prevent
methanogenic bacteria from dominating within the culture. Alternatively, a nonmethanogenic
source of H2 might be usefully employed, lessening competition for the supplied electron donor.
Still, however, methanogenic competition for H2 must be reckoned with - a factor not addressed
by these experiments.
59

'C ' S
00 00
(N5 "a, -
00 IT 0
(iOwlri) JA (IOW11) IH2
> '
1'0fn0
(N4.
(0 LL) -
LL)-
(N
60

S. 7
0A
00 t- 6n 1 M r
00
C- - NO %0 \
*161
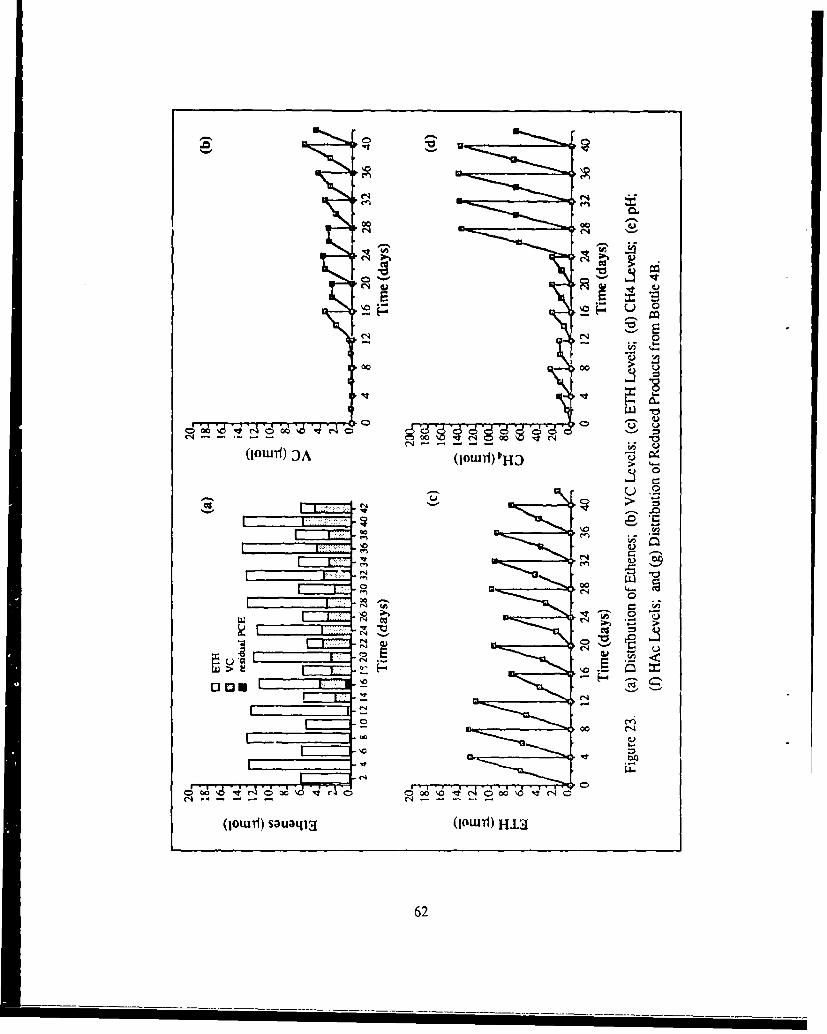
00 00
0000
00
c- l a 0 0
*0
@0 ' V
Z_ __ _ 7 'AC4'
001ui) su34) (IOU~i)HJw
62U

(.44
10 Mlo0
> 0
;,% 00
.E
.44r~
000
~. (an) aw~o SI ~r,4~
LL
63

SECTION VII
CONTINUOUS-FLOW REACTOR STUDIES
A. CONTEXT
Previous column studies conducted by DiStefano involved a laboratory scale, fixed-bed
attached-growth column which was maintained in a plug-flow fashion (29). The conversion of
PCE to VC and ETH was routinely observed. Although PCE was not detected after the first
sampling port on the column, VC was routinely observed throughout the entire length of the
column. DiStefano speculated that the presence of PCE may be necessary to stimulate
dechlorination of VC to ETH, since VC was persistent in the downstream section of the column
where PCE was not detected. It was suggested that a column reactor operated in a completely-
mixed upward-flow fashion might facilitate better dechlorination since all of the organisms would
be equally exposed to PCE and the electron donor. This reactor could be maintained as an AAFEB
column reactor (42), wherein the biomass would be attached to the support medium, diatomaceous
earth. The advantages of such a reactor are that relatively short HRTs and high mean cell residence
times could be achieved since the biomass would be contained within the reactor and attached to the
support medium.
B. REACTOR DESCRIPTION
The AAFEB reactor system employed in thee studies is depicted in Figure 24. The
column body was constructed fiom 51-mam ID x 60-mm OD x 914-mm conical glass pipe (Coming
Glass Works), All of the components of the column consisted of either stainless- steel, glass, or
Teflon®, with five PTFE® 0-rings. The top of the column incorporated a stainless-steel plate,
bolted to the column by way of an aluminum flange, Teflon® gasket and a soft conical insert
(Coming Glass Works). The top plate also contained a stainless-,teel valve (Nupro Co.) and gao-
sampling septum. Column gases only contacted the septum when the valve was opened for gas
sampling via syringe and a 4.5-inch needle, which was long enough to penetrate through the
septum and opened valve, directly into the column headspace. The bottom of the column consisted
of a custom-machined, stainless-steel flanged cone, which was sealed and bolted to the column in a
manner similar to that of the top plate previously described. All tubing and valves shown in Figure
24 were stainless-steel, with the exception of an 11 -inch section of Viton® tubing (Cole-Pa-nier
Co.; 0.8-mm ID), used in conjunction with the peristaltic feed-pump (Cole-Parmer Masterflex
64

Tedlar® gas-
gas- collection bag
sIt hoodliquid- ?
samplin
siphon septum .
bra
.. . . .. . . .I-.
in lu nS
* Sl
purg
* uI,~1gas
gas-samplingchkseptum vav
Tedlarpu :gas bag 2Ocm of MO
Viton®tubing
10 0
peisali
diaphragm solidsrecycle trap _______
basal salts pm
~ medium+ PCE effluent
collection
Figure 24. AAFEB Reactor System.
65

Model #7520-35), and short lengths of Viton® tubing which connected Tedlar® bag fittings to
stainless-steel tubing. The peristaltic pump delivered influent basal medium containing dissolvedPCE.
Five ports were located on the column, spaced every 152 mm (6 inches) from the base.
Each port was constructed from a 14-mm ID x 22-mm OD threaded glass connector tube (AceGlass Inc.), fused by a glassblower in such a way that it protruded approximately 48 mm from the
outside wall of the column. Inside the bottom two connectors were custom-fabricated stainless-steel sampling/feeding tubes (2.0-mm ID x 12.7-mm OD x 102-mm) which extended into thecenter of the column, thereby minimizing wall effects during feed introduction from the syringe
pump. The outside end of the sampling tubes were machined to fit an 1 1-mm Teflon®-faced
rubber septum and aluminum crimp cap (Supelco, Inc.); the outside diameters of the samplingtubes were stepped down from 12.7 mm to 2.5 mm for the length of tubing extending from thewall of the column to the center of the column. Teflon® bushings and FETFE® O-rings (Ace
Glass Inc.) secured the sampling tubes inside the connectors, and created a leak-tight seal.The top three ports contained stainless-steel tubing which was secured with similar
bushings and O-rings described above. The top port served to connect the column headspace witha Tedlar® 3.8-liter gas-collection bag (Cole-Parmer Co.); the second port from the top served as aconduit for comb-ned effluent/recycle flow and included a septum for liquid sampling; the third
port allowed for the introduction of anoxic N2/C0 2 purge gas, which was necessary for column
start-up and for purging of accumulated VC and ETH when the column was operated at highloading rates of PCE.
Dissolved PCE in an anaerobic basal-salts medium was delivered to the column via a
peristaltic pump, as described previously. A 20.3-liter Tedlar® bag (Cole-Parmer Co.) was
employed in conjunction with a 15-liter liquid feed reservoir (Fisher Scientific), to maintain a
constant headspace volume in the feed reservoir at all times. The reservoir vessel was sealed with
a Teflon®-lined stainless steel plate which was secured to the mouth of the reservoir with an
aluminum flange. A one-inch section of Viton® tubing joined the gas bag with stainless-steel
tubing, which protruded through the top plate and into the ;eadspace of the reservoir. When thereservoir was refilled (approximately twice monthly) with fresh PCE and basal medium, the
reservoir headspace was displaced into the gas bag. As the feed reservoir liquid volume dropped
slowly over the 2-week feeding period, the PCE-laden headspace was transferred back into thebottle. This system was intended to prevent loss of PCE concentration in the feed reservoir via
partitioning to an otherwise expanding headspace. The reservoir system therefore attained a
steady-state condition in which the headspace concentration, Cg, remained relatively constant ( =HcC, in which Cw is the steady-state aqueous concentration of PCE in the feed, and H: is
Henry's constant for PCE).
66

MeOH was dissolved in water at a 1:30 MeOH:H20 ratio (mass basis) and delivered to the
reactor via a syringe infusion pump (Harvard Apparatus, Model #22). The 5-mL syringe used for
delivery was replenished with the MeOH/water mixture each week. A 24-inch length of
Neoprene® tubing was employed to deliver the MeOH/water mixture from the syringe to a 4.5-
inch needle which protruded from the bottom port into the center of the reactor body.
The bed medium consisted of diatomaceous earth particles (Celite 560, Monarch Chemical)
of a 100-tim average diameter. The Lnexpanded voluMe originally measured approximately 500
mL, but because of an accumulation of solids within the bed, the unexpanded bed volume
measured 600 mL at the end of the column study. The expanded bed volume measured 700 mL
throughout the operation of the column. The expansion of the bed varied, therefore, from
approximately 17 percent to 30 percent during the course of the study. The recycle pump which
caused the bed expansion incorporated a Teflon®-diaphram pump head (Cole-Parmer Masterflex
Model #7520-25). A solids trap, located upstream from the diaphragm pump, prevented solids
from entering the pump and causing failure of the check-valves and diaphragm. The trap consisted
of a glass vessel capped with a stainless-steel plate which was secured s;nilarly to the plates on the
top and bottom of the column. The recycle fluid entered the trap through the top plate, and exited
the trap via a protruding port similar to the top three ports of the column body. The recycle flow
then passed through the diaphragm pump and directly into the column.
The basal medium/PCE mixture was delivered to the column through an influent "el" and
into the recycle flow. This "el" was connected to the reactor's recycle line at a point which was
located a few inches below the point of exit of the recycle flow from the supernatant zone of the
reactor. Since the recycle flow was much greater than the effluent flow, the basal medium/PCE
feed introduced at this point in the recycle was completely swept downward, with no short-
circuiting to the effluent. The headspace of the drip-feed zone was connected to the headspace of
the feed reservoir, providing a siphon break; this design ensured that the level of influent fluid in
the "el" equaled that of the supernatant in the reactor, regardless of flow or loss of peristaltic seal.
Effluent passed through a gas trap, then past a check valve consisting of a section of glass
tubing which was beveled on the inside, thereby allowing a Teflon® bead (1/4-inch) to act as a seal
against the diffusion of oxygen into the system. Effluent then flowed into a collection reservoir,
which was vented to a fume hood. Constant pressure was initially maintained in the reactor since
the headspace was connected to the gas collection bag; however, the gas bag was later isolated
from the system since it was suspected that oxygen was diffusing into the reactor through the bag.
Reactor conduits consisted of either 1/2-, I/4-, or I/8-inch stainless steel tubing, connected with
Swagelok® fittings, except otherwise noted, and various stainless-steel valves (Nupro Co.,
Whitey Co.) were located throughout the reactor body, as indicated in Figure 24, for maintenance
and operation purposes.
67

C. AAFEB LIQUID AND GASEOUS VOLUME MEASUREMENTS
The liquid volume of the column reactor was determined by a measurement (via atomic
absorption spectroscopy with air/acetylen flame) of potassium concentrations before and after a
known amount of potassium was injected into the column. The column initially contained a low
concentration of potassium since the test was performed when the reactor was already inoculated
with culture medium containing basal salts medium which included approximately 50 mg/L K+.A
highly concentrated slurry of potassium chloride (KCI) was injected into the reactor after an initial
potassium concentration measurement was made. The volume of this concentrated slurry of KCI
resulted in a concentration in the reactor of potassium of approximately one order of magnitude
greater than the initial potassium concentration. With knowledge of the difference in concentration
of potassium in the reactor - that is, initial minus final concentration - along with knowledge of
the amount of potassium injected into the column, the liquid volume of the reactor was calculated.
The gaseous volume of the reactor was simply measured via a displacement method, in which the
reactor headspace was filled with basal medium (anoxically, since the reactor was inoculated at this
time) with the gas bag isolated from the system, and then allowed to drain to the normal liquid
equilibrium level. The effluent which drained from th filled reactor was measured and therefore
the gaseous volume was determined. Results of these determinations were as follows: liquid
volume = 1,56 liters; gas volume = 0.49 liters.
D. AAFEB SYSTEM TESTS
The top graph of Figure 25 indicates the results of a PCE-loss test from the reactor system
while the reactor, containing only PCE and water, was operated in recycle mode. Initially, an
amount of PCE was added to the reactor which resulted in an initial concentration of approximately
1.6 mg/L PCE. Measurements of the aqueous concentration of PCE over the next 8 days indicated
an aver age loss of PCE of 5.4 percent per day.
The middle graph of Figure 25 shows the results of PCE loss tests conducted on the feed-
reservoir system. PCE '10 mg/L nominal concentration) was added to 15 liters of distilled water in
the reservoir. After approximately one week of equilibration between the liquid and gaseous
phases of the feed-reservoir system, a headspace analysis indicated that an aqueous concentration
of 6.5 mg/L was achieved. The subsequent change in this concentration was monitored over a 2-
week period. During the initial 7 days, no liquid was pumped from the reservoir; Ouing the final
7 days, the peristaltic pump began to remove approximately 1 liter per day from the reservoir,
forcing gas-volume from the Tediar® bag back into the glass carboy. The results shown in Figure
25 indicate no significant difference in loss rate between the initial 7 days (in which no pumping
occurred) and the final 7 days (in which pumping occurred). In addition, the resuits indicated
68

2.0~1.8 (a)
S1.4.A.~ 1.2.
1.0A~,0.8.S0.6'
U 0.4. PCE (mg/L.) =1.6423 - 088 L (days)W 0.2. RA2 u0.92
S0.01
0 2 4 6 8 10Time (days)
(b
403 feed pump of' -4oj.- feed puip on -0'-3
PCL (m&I/L) - 635-O.168i(ys
U
Q LA::0 2 4 6 8 10 12 14
Time (days)
4 3
2 AAA
A Reactor Concentration
*Feed ConcentrationU 01
Ow 0 1 2 3 4 5Y, Volume ,umped (L)
Figure 25. System Tests Conductcd on AAFEB system: (a) PCE LossFrom Colaryn Rtcaclor; (b) PCE Loss Fvom Feed Rcscrvoir;and Mc PCE Reactor Test With Pumped Inluent.
69

a loss rate of less thaa 2.7 percent per day, which was deemed acceptable for a 14-day planned
operation interval between reservoir replenishments.The final graph of Figure 25 illustrates the results obtained from a third system test in
which PCE losses from the column and peristaltic pump were evaluated. The aqueous PCE
concentiation in the reactor was calculated from column headspace analysis by invoking Henry'sconstant for PCE. At time zeco, (he reactor concentration was 1.2 mg/L PCE (remaining fromsome previous loss studies). The peristaltic pump was then started, pumping approximately 'I L/dof distilled water from the feed reservoir which contained an aqueous concentration of PCE of 3.4
mgfL. The recycle (diaphragm) pumnp was operated throughout the study. Over a period ofseveral days, the aqueous concentration of PCE was monitored from headspace samples. Figure25 indicates that the reactor concentration was building towards the influent concentration,
suggesting an acceptably low rate of PCE loss in both the peristaltic pump and reactor system.
E. INOCULATION AND PERFORMANCE OF THE AAFEB REACTOR
Once the design and operation of the reactor system were deemed acceptable, the reactorwas inoculated with approximately 500 mL of the MeOH-fed high-PCE enrichment culture
contain,-d within the 6-liter, stirred reactor, described in Section III. Initially, the reactor systemwas operated in batch-fed recycle mode at 35°C so that the bacteria would become acclimated to the
column environment. During this time, the recycle pump ran continuously to expand the bed,PCE, MeOH and YE were fed in concentrations similar to those supplied to the high-PCE/MeOH
inoculum source. Every 2 days, the reactor supernatant zone was purged for 30 minutes with ananoxic gaseous mixture of N2/CO2 to remove VC and ETH; MeOH and neat PCE were injectedwith separate syringes to achieve a 2:1 stoichiometric MeOI:PCE ratio on an electron equivalent
basis. YE was delivered by syringe to achieve a concentration of 20 mg/L in the reactor. During
this batch-fed mode, all feed was delivered through 4.5-inch needles and injected through theI'.. ;om port of the column body, into the center of the expanded bed.
After a period of instability and reactor modifications, the system began to dechlorinate
quite well; that is, nearly all of the injected PCE was converted to VC and ETH, with little PCE
left. Measurements of gaseous and aqueous concentrations of volatile compounds were made fromheadspace analyses with knowledge of Henry's constants for each compound (43), and the liquidand gaseous volumes of the reactor. After 3 weeks of batch-fed operation, the reactor supernatantwas displaced with fresh basal medium which was delivered via the peristaltic pump from the feed
reservoir. This introduction of fresh basal medium was not performed continuously, but rather at
relatively high rates for short periods of time every other day, so as to simulate as closely as
possible the operation of the 6-liter inoculum-sourcc reactor.
70

After 2 weeks of operation in this semicontinuous mode, the reactor was prepared tocommence in a continuous-flow mode. Initially, a MeOH, YE, and water mixture was delivered to
the reactor with a syringe pump; however, because growth was evident in the feed line, indicating
probable consumption of MeOH and spoilage of YE, this method was abandoned. Instead, amixture of only MeOH aad water was delivered with a syringe infusion pump; thereafter, YE waseither dissolved in the basal medium/PCE reservoir or delivered directly to the reactor by syringeevery 2 days. Basal medium containing dissolved PCE at 100 mg/L was delivered to the reactor ata rate of 0.4 L/day, resulting in a PCE loading rate of 40 mg/day. The resulting ratio ofMeOH:PCE supplied to the system was 2:1, on an electron equivalent basis. The HRT, whichwas calculated using the volume of the expanded bed and the PCE pumping rate, was therefore 1.8
days.
Once continuous flow commenced, the reactor was operated for 200 days. Four stages ofcolumn reactor performance during this period of time were analyzed; the stages are summarized asfollows. Initially, the culture failed to sustain dechlorination when the column was operatedcontinuously, and an apparent channeling of reducing equivalents toward acetogenesis wasobserved, Second, as dechlorination worsened, a shift toward methanogenesis became apparentwhile continuous flow resumed in the column reactor system. Third, while the column wasoperated in recycle mode (to attempt recovery), the application of a methanogenic-inhibitingconcentration of ETH appeared to spur HAc production. Finally, during a fourth stage of column
performance, methanogenesis continued to be inhibited, but dechlorination worsened as thecolumn reactor was operated once more in a continuous-flow fashion with a high background
concentration of ETH.
Figure 26, depicts reactor performance for the first 75 days of operation. Values ofaqueous concentrations of influent PCE and of PCE, VC and ETH in the effluent are plotted
against time. Increasing concentrations of effluent PCE and corresponding decliningconcentrations of VC and ETH in the effluent indicate the difficulty experienced by the culturewhile the column was operated in a continuous-flow mode. A mishap on Day 38 resulted in theinfiltration of air into the system; the reactor was subsequently purged with an anoxic gaseous
mixture of N21CO 2, causing a decrease of volatiles in the effluent, and a lack of agreement betweenthe influent PCE concentration and the sum of the concentrations of ethenes in the effluent. Thereactor was reinoculated on Day 53, yet through Day 75, the PCE in the effluent continued to rise.
During this time, VC production increased slightly but ETH concentrations remained low in the
effluent. Since it became evident that reducing equivalents were not being utilized formethanogenesis or dechlorination to any significant degree, liquid samples for measurements ofllAc were rernoved from the reactor, beginning on Day 28.
71

rA 1000. irluenLPCE 03 effUCTt ETH ()0 effluent VCU efflucrn PCE
6 00 A,
0 10 20 30 40 50 60 70Time (days)
(b) 60- McOH fed L3 HAcEaCH4
S 5000- [3 0 LW4000 C
2000. ~ S
W 1000 .~ . S .SSS.
030 40 50 60 70
Time (da1ys)25
(c)20-
E 15-
10-
0 10 20) 3(0 40 50 60 70
Timie (days)
Figure 26. (a) Influenit and Effluent Aqueous Concentrations of Ethenms NbRate of Reduction Product Formnation; and (c) Effluent AqueousCH4 Concentration During Days 0-75 of AAFEB Operation inContinuous-Flow Moule.
72

The second plot (i.e., rate of product formation versus time) in Figure 26 indicates that
acetogenesis accounted for a major fraction of the consumption of MeOH during the first 75 days
of operation. Over defined time intervals, product formation rates were computed by noting
average effluent concentrations and the change in product inventory within the gas and liquid
volumes of the reactor system. Again, the imbalance between the rate of product formation and
MeOH delivery after Day 38 was probably due to the purging of the reactor on this day. The rate
of MeOH supplied to the reactor, represented in this plot and in subsequent figures, is a
theoretical rate; MeOH was not measured in the influent, and the rate plotted in the figures was
calculated from the rate at which the syringe pump was operated. The apparent surge of HAc on
Day 53 was probably due to the reinoculation of the column, since the inoculuin from the 6-liter
high-PCE reactor contained a high concentration of HAc. Though the second plot of Figure 26
suggests that methanogenesis was not a major activity during this initial 75-day period of
operation, the third plot of Figure 26 indicates that methanogenic activity was definitely on the
increase.
A second stage of column performance from Days 92-119 is illustrated in Figure 27.
During this period of continuous flow, PCE in the effluent remained high, and production of VC
and ETH worsened over time. The rate of reduced product formation over time indicates that
methanogenesis acco,'nted for an increasing fraction of the donor supplied during this period, and
this rise in methanogenesis is confirmed by the plot of increasing CH4 concentration in the effluent
over time, possibly due to the absence of a high background concentration of ETH [a known
inhibitor of methanogens (44)]. The equivalents released from endogenous sources and
consumption of organic material in the YE supplied to the system might partially account for the
imbalance in the higher rate of reduced product formation in comparison to the rate of MeOH fed to
the reactor. Alternatively, a proliferation of HAc-consuming methanogenic bacteria could have
been responsible for the high CH4 levels measured within this period. The reactor was purged on
Day 95 in order to clear a clogged portion of the recycle tubing; the observed loss of volatiles was
due to this purging.
Figure 28 illustrates the performance of the column reactor while it was operated in recycle
mode during Days 119-145. Additions of PCE were not made during this time, but MeOH was
continuously fed as before, and YE was supplied every 2 days. A high level of ETH was
maintained in the column headspace during this time, as noted in the Figure, and the resulting
inhibition of methanogenesis was evident by the declining rate of CH4 production within the
column. Inhibition of methanogenesis was desired since the channeling of reducing equivalents
toward methanogenesis during the previous period of continuous flow resulted in a decreasingfraction of MeOl- available for dechlorination, A plot of the accumulation of reduced products
73

"r influent PCE 0 effluent ETH800. E3 effluent VC (a
U effluent PCE
~400.,
-Il 0 ,
92 96 100 104 108 112 116Time (days)
92 96 100 14 (0b12) 1
200
180,160140.120. (c)
S100.=L 80.
60.40200 -192 96 100 1 4' 108 '1;2 116'
Time (days)
Figure 27. (a) Influent and Effluent Aqucous Concentrations of Ethcnes;(b) Rate of Reduction Product Formation Over Time, and (c)Effluent Aqueous CI-4 Concentration During Days 92-119of AAFEB Operation iii Continuous-Flow Mode.
74

3000.
0500
119 123 127 131 135 139 143Time (days)
120000-McOH fcd (b)
100000. ETH80000- CH4 -
6,0000- ~ ~
S40000-
20000 .
V °°- .......- "oo
119 123 127 131 135 139 143Time (days)
100.90.80: (c)
70-. 60
50.40' ao"aU,. 30 "'
20"1 0 -1 - -00-
119 123 127 131 135 139 143Time (days)
Figure 28. (a) Aqueous Concentrations of Ethenes; (b) Reduction ProductFormation; and (c) Inhibited Methanogcnesis During Days119-145 of AAFEB Operation in Recycle Mode With a HighBackground Concentration of ETH.
75

during this time indicates that acetogenic bacteria consumed a major fraction of the MeOH supplied
to the system.The lack of agreement between the theoretical amount of equivalents supplied to the system
and the sum of reduced products could be due to losses in the delivery of MeOH, loss of MeOH to
the effluent, or consumption of MeOH (or H2) by organisms other than methanogens, acetogens or
dechlorinators, such as sulfate-reducing bacteria. It was observed that the basal medium within the
feed-reservoir appeared to lighten in color after 2-week periods, indicating that the sulfide within
the medium was oxidized to sulfate or thiosulfate by an unidentified oxidizing agent, thereby
possibly creating an electron acc,.tor for sulfate-reducing bacteria. Since sulfate-reducing bacteria
have, been identified within the high-PCE culture which served as the inoculum for the column
reactor (40), it is possible that these sulfate-reducers consumed a portion of the 1-12 formed. The
medium contained within the column reactor might have experienced this very transformation,
although no experimental tests were undertaken to verify this hypothesis.
The column reactor was operated in continuous-flow mode with a high background
concentration of ETH from Day 169 to the conclusion of the column analysis on Day 200. Basal
medium containing dissolved PCE was delivered to the reactor at the same rate as before, at 0.4
L/day. Figure 29 indicates that although methanogenesis continued to be inhibited by the high
level of ETH employed, dechlorination worsened with time.
The results from the column study seem to indicate that although the high-PCE culture was
able to sustain dechlorination of high levels of PCE while maintained in the column reactor during
semicontinuous operation, once truly continuous flow commenced, dechlorination performanceworsened over time, even when methanogenesis was inhibited. Acetogenic bacteria, however, did
not appear to be adversely affected by the continuous-flow operation; methanogenic bacteria
seemed to proliferate during continuous-flow only in the absence of high background
concentrations of ETH. It is plausible that the dechlorinating population of bacteria experienced an
inability to adhere effectively to the support medium, whereas other populations of bacteria mignt
have adhered to the diatomite without difficulty. Shear created by the expansion of the bed might
have caused "washout" of the dechlorinating bacteria, thereby decreasing the population of thesc
bacteria, and resulting in decreasing dechlorination over time.
76

2000 influent PCE 03 effluent ETH
14 0
1200'9o 0 ow.800
400 40
200
0 1 1 1 1 1 1 1 1 1
169 173 177 181 185 18 193 197
7077

SECTION VIII
CONCLUSIONS AND RECOMMENDATIONS
Results from these current studies strongly suggest that H2 is the electron donor directly
used for the reductive dechlorination of PCE to ETH by organisms in our MeOH/PCE enrichment
culture. A model (Figure 15) is presented, depicting hypothetical roles for methanogens and
acetogens as producers of an intermediate pool of H2 in the culture. If borne out by subsequent
studies, our hypothesis that H2 is the actual electron donor for PCE dechlorination has practical
consequences for bioremediation. It explains why a wide variety of electron donors has been
observed to support PCE dchlorination in mixed-culture systems. All likely produce at least a
small pool of H2; and a small pool would be sufficient to transform ppb-levels of PCE. For
bioremediation of relatively high PCE levels, electron donors should be selected which cause
production of a large H2 pool - or methods may be explored which would employ H2 directly.
One caveat is the apparent nutritional dependency we observed of H2-using dechlorinators in our
culture upon other organisms. If dechlorinating organisms in other systems have the same or
similar nutritional requirements, the required nutritional factor(s) must be identified and abiotically
supplied, or it may be impossible to exclusively target electron donor solely to the dechlorinators.
Our high-PCE/MeOH culture makes relatively efficient use of MeOH in dechlorination -
sustained dechlorination was achieved at MeOH/PCE ratios on the order of 2:1 (eq/eq). This
efficiency was not observed in our initial studies with a low-PCE/MeOH enrichment culture (1),
where rapid, uninhibited methanogenesis out-competed acetogenesis for MeOH. The interspecies
H2 pool developed by methanogenic use of MeOH is thought to be considerably lower than that
developed by acetogenic use of MeOH. At low PCE levels (i.e., ca. 1-10 mg/L), where methano-
genesis from MeOH is uninhibited, results from our studies indicate a required MeOH/PCE (eq/eq)
ratio approaching 100:1. Furthermore, methanogenesis from MeOH is so rapid that in many
instances, MeOH is depleted before dechlorination is complete.
The efficiency of our high-PCE/MeOH culhure apparently results from the inhibition of
MeOH-using methanogens by high PCE (or dechlorination product) concentrations, thus lessening
competition for MeOli. When non-inhibitory concentrations (i.e., 9 mg/L) of PCE are employed
with the high-PCE/MeOll culture. methanogenic activity rises and consumes an ever-increasing
fraction of MeOH equivalents (Figures 18-21), necessitating ever-greater additions of MeOH to
allow sustenance of dechlorination. However, this tactic is a spiral to failure, as ever-greater
additions of MeOH support ever-larger methanogenic populations. This same phenomenon may
have contributed to the failure of our continuous-flow bioreactors (Figures 26 and 27).
78

In essence, we have observed that PCE dechlorination is relatively easily accomplished at
extremes of concentration: At very high concentrations (> 20 mg/L), PCE (or its dechlorination
products, such as ETH) inhibits competition by methanogens for MeOH and H2 ; at very low
concentrations (ppb levels), competition causes little concern because only a minute fraction of the
donor is required for dechlorination, and this requirement is easily met. But intermediate PCE
levels are problematic, as are high influent levels to continuous-flow reactor configurations in
which the reactor biomass is exposed only to low, effluent PCE levels. Here, the dechlorination
requirement for reducing equivalents is high, and methanogenic competition is intolerable.One potential solution to the dilemma posed by methanogenic competition would be the use
of nonmethanogenic substrates that can act as sources of H2. Ethanol, lactate, and butyrate wouldbe good substrates for investigation; H2 is a direct product of their fermentation to H-Ac. Since
they are not direct methanogenic substrates (ethanol can be used by some methanogens but poorly
and not as a direct Cl-Li precursor), they may prove to be more efficient suppliers of reducing
equivalents for dechlorination, and they are less toxic to humans than MeOH. It remains to be seen
with what efficiency our culture might operate on them. Of particular interest is whether such
alternative substrates might eliminate nutrient deficiencies observed when our high-PCE culture
was fed H2 directly.
Alternative, nonmethanogenic substrates might eliminate direct methanogenic competition
for the supplied form of the reductant; however, methanogenic competition for the resulting H2would still have to be reckoned with. Possible differences in H2-use thresholds between
methanogens and dechlorinators may be exploited to advantage in this context. Possible
differences in environmental preferences (e.g., pH) might also he advantageously exploited.
Thus, the H2-consur-ption kinetics of methanogens and dechlorinators should be investigated -
including studies of the nutritional and environmental requiremIents of the organisms. In this
manner, strategies may be developed to make optimal use of supplied reductant while minimizing
undesirable competing reactions.
Results from studies with low-PCE/MeOH enrichment cultures (Section IV) suggest that
the presence of PCE (and /or TCE, DCEs) is (are) required to sustain VC dechlorination.
Examination of Figure 3 indicates that appreciable ETH production did not occur until VC reached
2.5 .tmol, a trend which was observed numerous times in other PCE-fed bottles. This lends
support to the hypothesis that PCE and high levels of VC are required before ETH production is
substantial. The presence of PCE may be necessary to stimulate production of a non-specific
enzyme capable of mediating dechlorination. Recall that when PCE was withheld, and then
reintroduced, a lag in dechlorination was noticed (Figure 6). Such a lag may mean that the
organism is dechlorinating PCE for a benefit. Indeed, the observation that PCE dechlorination
seems to be inducible, and therefore confers a benefit to the mediating organism, was noted
79

previously (30). The comparatively rapid conversion of PCE to VC also suggests metabolism;whereas the relatively slow conversion of VC to ETH suggests this last step might be a
cometabolism (i.e., a serendipitous, coincidental transformation.) It is not obvious whether both
transformations are mediated by the same enzyme system - or even by the same organism.
These determinations await the outcome of more fundamental, microbial studies.
The results from our column studies seem to indicate that although the high-PCE culturewas able to sustain dechlorination of high levels of PCE while maintained in the column reactor
during semi-continuous operation, once truly continuous flow commenced, dechlorination
performance worsened over time. Failure may have resulted from methanogenic competition
(discussed above). However, resurrection of performance was not achieved, even when
methanogenesis was inhibited by high levels of supplied ETH. Shear created by the expansion of
the bed might have caused "washout" of the dechlorinating bacteria, thereby decreasing the
population of these bacteria, and resulting in decreasing dechlorination over time. (However, itmust be noted that methanogens and acetogens experienced no apparent difficulty maintaining their
populations in the reactor system.) In addition to exploring alternative electron donors,investigators should explore alternative reactor support matrices and alternative configurationswhich may offer superior organism retention.
Development of successful anaerobic biological treatment technologies - and development
of groundwater contaminant transport models which accurately incorporate anaerobic transforma-tion mechanisms - demand that the requirements and capabilities of the microorganismsresponsible for observed biodegradation be defined, as well as their interactions with symbiotic
and competing microbes. Our recent failure to achieve sustained dechlorination at "moderate" (but
not inhibitory) levels of PCE using MeOH demonstrates the folly of conducting "black-box"
bioreactor studies. While much can be learned from empirical studies, they can be likened to the
studies of wine-making before Pasteur. If we had not discovered the importance of interspecies
H2 transfer to the dechlorination process - and discovered it through relatively fundamental,bench-scale studies - we would have no c!ue as to the reason for failure (methanogeniccompetition), nor would we have reasonable, fundamentally based remedies to propose (i.e.,
alternative electron donors). Insights fron, our results may be useful to researchers designing
bioremediation strategies and modeling the ,ate of these compounds in situ. An understanding of
the microbiology of reductive dechiorination of PCE can only enhance our ability to understand
and control the processes that may remove it and other chlorinated ethenes from the environment.
80

REFERENCES
1. Freedman, D. L. and J. M. Gossett, "Biological reductive dechlorination oftetrachloroethylene and trichloroethylene to ethylene under methanogenic conditions,"Apple. Environ. Microbiol. (55) 2144-2151, 1989.
2. DiStefano, T. D., J. M. Gossett and S. H. Zinder, "Reductive dechlorination of highconcentrations of tetrachloroethene to ethene by an anaerobic enrichment culture in theabsence of methanogenesis," Appl. Environ. Microbiol. (57) 2287-2292, 1991.
3. Gossett, J. M., D. L. Freedman, T. D. DiStefano and T. B. Gainer, Anaerobic biologicaltreatment for remediation of sites contaminated by Ci and C2 chlorinated hydrocarbons,Report No. (in press), Engineering & Services Laboratory, U. S. Air Force Engineering andServices Center: Tyndall AFB, FL., Contract No. F08635-85-R-0128, 1990.
4. Roberts, P. V., J. Schreiner and G. D. Hopkins, "Field study of organic water qualitychanges during groundwater recharge in the Palo Alto Baylands," Water Res. (16) 1025-1035, 1982.
5. Bouwer, E. J. and P. L. McCarty, "Transformations of 1- and 2-carbon halogenatedaliphatic organic compounds under methanogenic conditions," Appl. Environ. Microbiol.(45) 1286-1294, 1983.
6. Bouwer, E. J. aid J. P. Wright, "Transformations of trace halogenated aliphatics in anoxicbiofilm columns," J. Contain. Hydrol. (2) 155-169, 1988.
7. McCarty, P. L., B. E. Rittmann and E. J. Bouwer, "Microbiological processes affectingchemical transformations in groundwater," 89-116. In G. Bitton and C. P. Gerba (ed.),Groundwater Pollution Microbiology, John Wiley & Sons, New York, 1984.
8. Vogel, T. M. and P. L. McCarty, "Biotransfornation of tetrachloroethylene totrichloroethylene, dichloroethylene, vinyl chloride, and car ion dioxide under methanogenicconditions," Appl. Environ. Alicrobiol. (49) 1080-1083, 1985.
9. Vogel, T. M. and P. L. McCarty, "Abiotic and biotic transformaiions of 1,1,1-trichloroethane under methanogenic conditions," Environ. Sci. Technol. (21) 1208-1213,1987.
10. Bruin, W. P. d., M. J. J. Kotterman, M. A. Posthumus, G. Schraa and A. J. B. Zehnder,"Complete biological reductive transformation of tetrachloroethene to ethane," Appl.Environ. Microbiol. (58) 1996-2000, 1992.
11. Kleopfer, R. D., D. M. Easley, B. B. Haas Jr., T. G. Delhi, D. E. Jackson and C. I.Wurrey, "Anaerobic degradation of trichloroethylene in soil," Environ. Sci. Technol. (19)277-280, 1985.
12. Barrio-Lage, G., F. Z. Parsons, R. S. Nassar and P. A. Lorenzo, "Sequentialdehalogenation of chlorinated ethenes," Erviron. Sci. Technol. (20) 96-99, 1986.
81

13. Barrio-Lage, G., F. Z. Parsons and R. S. Nassar, "Kinetics of the depletion oftrichloroethylene," Environ. Sci. Technol. (21) 366-370, 1987.
14. Barrio-Lage, G. A., F. Z. Parsons, R. S. Nassar and P. A. Lorenzo, "Biotransformation oftrichloroethylene in ik variety of subsurface materials," Environ. Toxicol. Chem. (6) 571-578, 1987.
15. Parsons, F., G. 3. Lage and R. Rice, "Biotransformation of chlorinated organic solvents instatic microcosms," Environ. Toxicol. Chem. (4) 739-742, 1985.
16. Parsons, F. and G. B. Lage, "Chlorinated organics in simulated groundwaterenvironments," J. Am. Water Works Assoc. (77) 52-59, 1985.
17. Parsons, F., P. R. Wood and J. DeMarco, "Transformations of tetrachloroethene andtrichloroethene in microcosms and groundwater," J. Am. Water Works Assoc. (76) 56-59,1984.
18. Wilson, J. T., J. F. McNabb, B. H. Wilson and M. J. Noonan, "Biotransformation ofselected organic pollutants in ground water," Dev. Ind. Microbiol. (24) 225-233, 1983.
19. Wilson, B. H., G. B. Smith and J. F. Rees, "Biotransformations of selected alkylbenzenesand halogenated aliphatic hydrocarbons in methanogenic aquifer material: a microcosmstudy," Environ. Sci. Technol. (2C) 997-1002, 1986.
20. Egli, C., R. Scholtz, A. M. Cook and T. Leisinger, "Anaerobic dechlorination oftetrachloromethane and 1,2-dichloroethane to degradable products by pure cultures ofDesulfobacterium sp. and Methanobacterium sp.," FEMS Microbiol. Lett. (43) 257-261, 1987.
21. Fathepure, B. Z., J. P. ,engu and S. A. Boyd, "Anaerobic bacteria that dechlorinateperchloroethene," Appl. Environ. Microbiol. (53) 2671-2674, 1987.
22. Fathepure, B. Z. and S. A. Boyd, "Reductive dechlorination of perchloroethylene ano therole of methanogens," FEMS Microbiol. Lett. (49) 149-156, 1988.
23. Fathepure, B. Z. and S. A. Boyd, "Dependence of tetrachluroethylene dechlorination onmethanogenic substrate consumption by Methanosarcina sp. Strain DCM," Appl. Environ,Microbiol. (54) 2976-298k,, 1988.
24. Holliger, C., "Reductive dehalogenation by anaerobic bacteria," PhD Dissertation,Agricultural University, Wageningen, the Netherlands, 1992.
25. Major, D. W., E. W. Hodgins and B. J. Butler, "Field and laboratory evidence of in situbiotransformation of tetrachloroethene to ethene and ethane at a chemical transfer facility innorth Toronto," 113-133. In R. E. Hinchee and R. F. Olfenbuttel (ed.), On-SiteBioreclamation - Processes for Xenobiotic and Hydrocarbon Treatment, Butterworth-Heinemann, Boston, 1991.
26. Gibson, S. A. and G. W. Sewell, "Stimulation of reductive dechlorination oftetrachlorocthene in anaerobic aquifer microcosms by addition of short-chain organic acids oralcohols," Appl. Environ. Microbiol. (58) 1392-1393, 1992.
82

27. Sewell, G. W. and S. A. Gibson, "Stimulation of the reductive dechlorination oftetrachloroethene in anaerobic aquifer microcosms by the addition of toluene," Envir. Sci.Technol. (25) 982-984, 1991.
28. Freedman, D. L., "Biodegradation of dichloriniethane, trichloroethylene, andtetrachlorocthylene under methanogenic conditions," PhD Dissertation, Cornell University,1990.
29. DiStefano, T. D., "Biological dechlorination of tetrachloroethene under anaerobicconditions," PhD Dissertation, Cornell University, 1992.
30. Gossett, J. M., Anaerobic degradation of C1 and C2 chlorinated hydrocarbons, ReportNo. ESL-TR-8.-38, Engineering & Services Laboratory, U. S. Air Force Engineering andServices Center: Tyndall AFB, FL., NTIS Azcession No. AD-A 165 005i'O, 1985.
31. Gantzer, C. J. and L. P. Wackett, "Reductive dechlorination catalyzed by bacterialtransition-metal coenzymes," Envir. Sci. Technol. (25) 715-722, 1991.
32. Schanke, C. A. and L. P. Wackett, "Environmental reductive elimination reactions ofpolychlorinated ethanes mimicked by transition metal coenzymes.," Envir. Sci. Technol.(26) 830-833, 1992.
33. Chu, K. H., "Treatment of tetrachloroethylene and trichloroethylene with an anaerobicattached film process." M. S. Thesis, Cornell University, 1991.
34. Carter, S. R. and W. J. Jewell, "Biotransformation of tetrachloroethylene by anaerobicattached-films at low temperatures," Woter Research (27) 607-615, 1993.
35. Zeikus, 1. G., "The biology of methanogenic bacteria," Bacteriological Reviews (41) 514-541, 1977.
36. Bock, A. and 0. Kandler, "Antibiotic sensitivity of Archaebacteria," 525-544. In C. R.Woese and R. S. Wolfe (ed.), The Bacteria: A Treatise on Structure and Function,Volume VIII, ARCHAEBACTERIA, Academic Press, New York, 1985.
37. Gunsalus, R. P., J. A. Romesser and R. S. Wolfe, "Preparation of Coenzyme M analoguesand their activity in the Methyl Coenzyme M Reductase system of Methanobacteriumtheroautotrophicum," Biochem. (17) 2374-2377, 1978.
38. Joklik, W. K., H. P. Willett and D. B. Amos, Zinsser Microbiology, Appleton-Century-Crofts, East Norwalk, Conn., 1984.
39. Ljungdahl, L. G., "The autotrophic pathway of acetate synthesis in acetogenic bacteria,"Ann. Rev. Microbiol. (40) 415-450, 1986.
4(j. ier, S. H., T. Distefano, J. Gossett, Y.-L. Juang, R. Vazoller and T. Anguish.,. Aiminary microbiological characterization of an anaerobic enrichment culture which
converts tetrachloroethylene to ethylene, abstr. Q- 114, p 295.," Abstr.91st Annu. Meet.Ame. Soc. Microbiol. 1991. 1991.
41. Cord-Ruwisch, R., H.-J. Steitz and R. Conrad, "The capacity of hydrogenotrophicanaerobic bacteria to compete for traces of hydrogen depends on the redox potential of theterminal electron acceptor," Arch. Microbiol. (149) 350-357, 1988.
83

42. Jewell, W. J., M. S. Switzenbaum and J. W. Morris, "Municipal wastwater treatment withthe anaerobic attached microbial film expanded bed process," Jour. Water Poll. ControlFed. (53) 482-490, 1981.
43. Gossett, J. M., "Measurement of Henry's Law constants for C1 and C2 chlorinatedhydrocarbons," Environ. Sci. Technol. (21) 202-208, 1987.
44. Schink, B., "Inhibition of methanogenesis by ethylene and other unsaturatedhydrocarbons," FEMS Microbiol. Ecol. (31) 63-68, 1985.
84


![TETRACHLOROETHYLENE (PCE) · Tetrachloroethylene (PCE) ... bKd = [(Koc) × (fraction organic matter)], a site and soil zone specific parameter eestimated parameter value iii.](https://static.fdocuments.us/doc/165x107/5ae720597f8b9acc268e36af/tetrachloroethylene-pce-pce-bkd-koc-fraction-organic-matter-a-site.jpg)