OEl Gas LatAm
76
Fallen angels, rising stars October 2013 Published by Edison Investment Research © iStockphoto/alexeys Oil & gas sector Old LatAm basins creating fresh opportunities
description
sector view
Transcript of OEl Gas LatAm
Fallen angels, rising stars
October 2013
Published by Edison Investment Research
© iStockphoto/alexeys
Oil & gas sector
Old LatAm basins creating fresh opportunities

10 October 2013 A new production trend has been emerging in Latin America. Smaller independent E&P companies have significantly contributed to increased production levels in Colombia, with similar results possible in Argentina, Peru, Paraguay and Trinidad. In this report we introduce three valuation screens based on cash flow, market value and risk, from which we segment our universe of 18 independent oil companies. Our top picks for the region are GeoPark, Americas Petrogas, Madalena, Canacol, Petroamerica and Suroco. Also seen as high potential but slightly higher risk are Crown Point, President, Touchstone and Range.
Cash flow dependence and LatAm independents Our analysis of markets lead us to four conclusions: 1) near-term cash flow generation is currently the main driver of market value, with investors ascribing a disproportionate emphasis to cash flow over exploration upside; 2) development capital over the past year has largely focused on lower-risk regimes/ plays (eg Llanos over the Southern Cone); 3) risk rankings and perception favour larger and more established oils; and 4) the producer/developer model is likely to dominate in the near term although there are signs that this could change with divestments, and new entrants are likely with the return of a bull market.
Are Colombia’s larger independents all priced in? Colombia’s larger independents (EV>$500m) dominate trading volumes and lead valuations based on 2P reserves. Currently trading at EV/boe of US$28 per boe on a 2P basis, we see limited upside from current levels to their NPV10 average of US$29 per boe, signalling that growth will require new, powerful and unexpected catalysts. Featured companies that fall into this large, low risk, but lacking significant catalysts category are Pacific Rubiales, Gran Tierra and Parex.
The Southern Cone is becoming more attractive In contrast to Colombia’s larger independents, we find Southern Cone oils smaller and, in general, delivering much lower netbacks. This said, impressive below-ground fundamentals and the region’s growing need for energy production are both expected to drive change over the medium term. We find a combination of conventional and unconventional assets, as well as what we expect will be improved realised pricing over the medium term, bodes well for this subset. Featured companies that fall into this Southern Cone independent group are GeoPark, Americas Petrogas, Crown Point, President and Madalena.
Mid-tier shows us more potential to reveal value Finally, we also like Colombian mid-tiered independents currently trading at EV/boe of US$21 per boe on average, below their NPV10 of US$26 per boe. While riskier than their larger Colombian peers, we see upside in this subgroup based on their potential to grow production and prove up reserves over the medium term. Companies that fall into this category are Canacol, Petroamerica and Suroco.
Fallen angels, rising stars
Old LatAm basins creating fresh opportunities
Companies profiled in this report
Americas Petrogas (BOE) Amerisur Resources (AMER) Canacol Energy (CNE) Crown Point Energy (CWV) GeoPark (GPK) Gran Tierra Energy (GTE) Ivanhoe Energy (IE) Madalena Energy (MVN) Pacific Rubiales (PRE) Parex Resources (PXT) Petroamerica Oil Corp (PTA) Petrodorado Energy (PDQ) Petrominerales (PMG) Platino Energy (PZE) President Energy* (PPC) Range Resources* (RRS) Suroco Energy (SRN) Touchstone Exploration* (TAB) *Edison Investment Research clients
Analysts
Xavier M Grunauer +1 416 533 8223
Ian McLelland +44 (0)20 3077 5756
Will Forbes +44 (0)20 3077 5749
Peter Dupont +44 (0)20 3077 5741
Elaine Reynolds +44 (0)20 3077 5713
Angus McPhail +44 (0)20 3077 5231
John Kidd +64 (0)4 8948 555
For institutional enquiries contact:
Gareth Jones +44 (0)20 3077 5704
www.edisoninvestmentresearch.com/research/team/resources-oil-gas
Fallen angels, rising stars | 10 October 2013 2
Contents
Investment summary: Independents to lead growth 4 Challenging the status quo 4 Implications of our analysis and stock picks 4 Cash flow as the main driver of market value 5 Risk ranking favours larger oil companies 6 Lower-risk oils have outperformed (sort of) 6
LatAm oil and gas: A lay of the land 7 Access to LatAm reserves: Quite varied across the region 7
Value screen 1: Markets and 2P reserves 9 Cash is king in Latin America 9
Value screen 2: Quantifying risk 13 Risk takeaways 14
Value screen 3: Size and market performance 16 The US$500m and greater club 16 Emerging Latin American oil companies (less than US$500m, but greater than US$100m) 17 Proof of concept and exploration subset 17
Conclusions of our analysis 18 Near-term cash flow is a main driver of market value 18 Risk ranking favours Latin America’s larger oil companies 19 Subset of low-risk oils have outperformed (sort of) 20
Investment conclusions and stock picks 20 Are Colombia’s larger independents all priced in? 21 The Southern Cone is becoming more attractive 21 Mid-tier to show more potential to reveal value 21
LatAm country round-up 23 Colombia: Attractive fiscal terms 23 Argentina: Gas Plus programme a potential catalyst 24 Brazil: Leading the way, some mistakes along the way 25 Peru: Pushing beyond Camisea 26 Chile: A changing landscape 27 Trinidad: Encouraging further investment 28 Ecuador: A fixed fee structure 29 Paraguay: A new beginning 30 Venezuela: Moving beyond Chavez 31 Mexico: Potentially a net importer of oil 32
Appendix A: Risk ranking based on five criteria 33 Risk criteria 1: Management at the helm 33 Risk criteria 2: Country risk 33 Risk criteria 3: Financing/dilution risks 33
Fallen angels, rising stars | 10 October 2013 3
Risk criteria 4: Profitability of production 34 Risk criteria 5: Reserve replacement risk 35
Company profiles 36 Americas Petrogas 37 Amerisur Resources 39 Canacol Energy 41 Crown Point Energy 43 GeoPark 45 Gran Tierra Energy 47 Ivanhoe Energy 49 Madalena Energy 51 Pacific Rubiales 53 Parex Resources 55 Petroamerica Oil Corp 57 Petrodorado Energy 59 Petrominerales 61 Platino Energy 63 President Energy 65 Range Resources 67 Suroco Energy 69 Touchstone Exploration 71
Fallen angels, rising stars | 10 October 2013 4
Investment summary: Independents to lead growth
Challenging the status quo While historically Latin American oil and gas production has been in the hands of national oil companies (NOCs) and large multinational oil and gas companies, a new production trend has been emerging. This new trend involves smaller independent E&P companies, which have brought capital and global experience to LatAm’s oil and gas basins resulting in what we expect will be mutual and sustainable advantages to all parties. These include:
The ability to work smaller and marginal fields, some of which are not economic to larger oil companies or domestic NOCs with larger overheads.
A higher tolerance for exploration risk and, as proven in North American unconventional basins, smaller independent E&P companies are much more likely to innovate and develop in situ technology.
The accumulation of global conventional and unconventional operating experience, leading to a transfer of technology.
Implications of our analysis and stock picks Our analysis of 18 independent LatAm oils concludes that the main driver of market value has been the ability to generate near-term cash flow. Ranking our universe on an EV/2P, we find the top half populated by Colombian oils, which is well correlated with our netback and cash flow ranking. In this report we introduce three valuation screens, based on cash flow, market value and risk, from which we segment our universe of 18 independent oil companies. Our top picks for the region are GeoPark, Americas Petrogas, Madalena, Canacol, Petroamerica and Suroco. Also seen as high potential but slightly higher risk are Crown Point, President, Touchstone and Range. Making use of risk, and cash flow screens, this report comes to the following five key macro conclusions:
Colombian larger independents (EV>$500m) are currently trading at EV/boe of US$28 per boe on a 2P basis, near their NPV10 valuation average of US$29 per boe, potentially signalling markets that material upside from current levels will require significant catalysts. Featured companies that fall into this category are: Pacific Rubiales, Gran Tierra, Parex, Amerisur and Petrominerales, which has recently agreed to be purchased by Pacific Rubiales.
Colombian smaller producing independents (EV<$500m) are currently trading at EV/boe of US$21 per boe on average, below their NPV10 of US$26 per boe and, while of higher volatility and risk profile, we see material upside in this this subgroup, based on their potential to prove-up operations and reserves over the medium term. Companies that fall into this category are: Canacol, Petroamerica and Suroco.
Southern Cone independents in our universe are smaller in size than their Colombian peers, have lower netbacks, and in turn, lower EV on a 2P basis. But all these factors have a potential to change. Currently trading at EV/boe of US$18/boe as a group, a combination of conventional and unconventional reserves as well as what we expect will be improved realised pricing over the medium term all bode well for this subset. Featured companies that fall into this Southern Cone independent group are GeoPark, Americas Petrogas, Crown Point, President and Madalena.
In Trinidad, we find a combination of proven and producing oil basins, low country risk, and the likelihood of further allowances in the current tax regime, to present an attractive combination. Currently realising EV/boe of US$6 per boe, and trading well below NPV10 of US$11 per boe, we see upside in this subgroup, which includes Touchstone and Range Resources.
Fallen angels, rising stars | 10 October 2013 5
Finally, despite each carrying respectively attractive underlying acreage and upside potential, we are very cautious about Ivanhoe and Petrodorado, due to the uncertainties that each currently faces. However, we recognise that if and when the adequate funding (Petrodorado) and regulatory approval (Ivanhoe) situations of these companies become favourable, significant value uplift is likely.
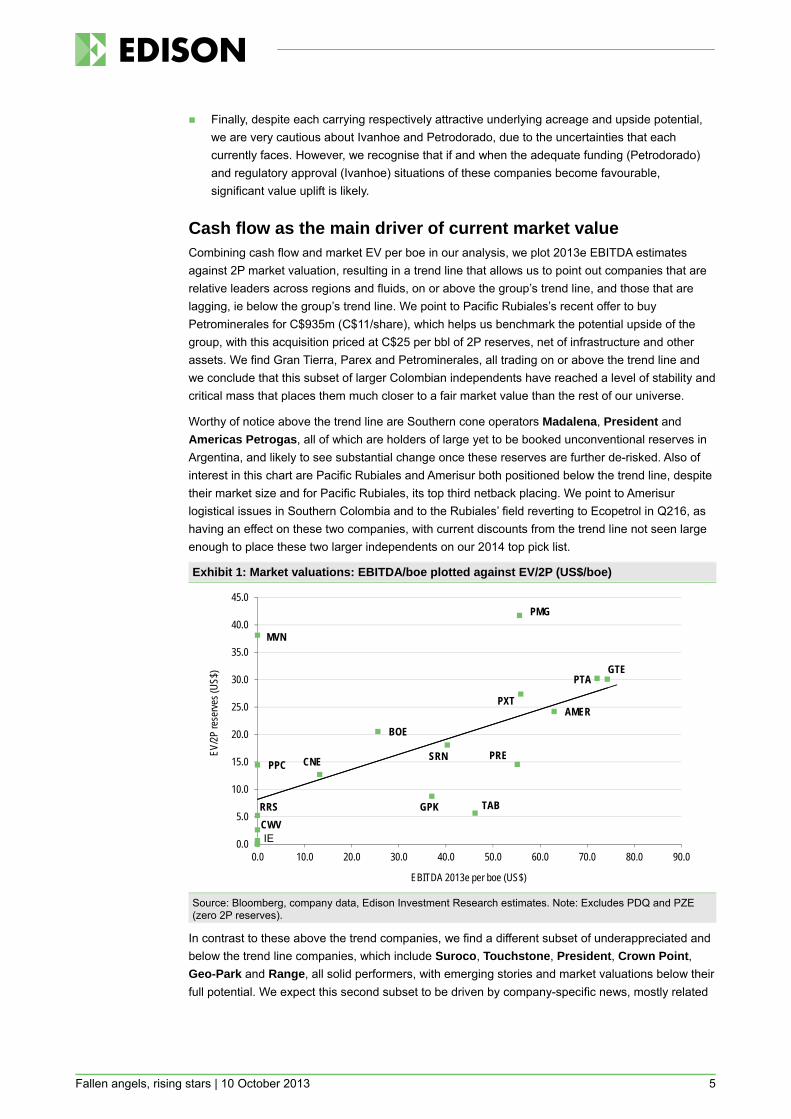
Cash flow as the main driver of current market value Combining cash flow and market EV per boe in our analysis, we plot 2013e EBITDA estimates against 2P market valuation, resulting in a trend line that allows us to point out companies that are relative leaders across regions and fluids, on or above the group’s trend line, and those that are lagging, ie below the group’s trend line. We point to Pacific Rubiales’s recent offer to buy Petrominerales for C$935m (C$11/share), which helps us benchmark the potential upside of the group, with this acquisition priced at C$25 per bbl of 2P reserves, net of infrastructure and other assets. We find Gran Tierra, Parex and Petrominerales, all trading on or above the trend line and we conclude that this subset of larger Colombian independents have reached a level of stability and critical mass that places them much closer to a fair market value than the rest of our universe.
Worthy of notice above the trend line are Southern cone operators Madalena, President and Americas Petrogas, all of which are holders of large yet to be booked unconventional reserves in Argentina, and likely to see substantial change once these reserves are further de-risked. Also of interest in this chart are Pacific Rubiales and Amerisur both positioned below the trend line, despite their market size and for Pacific Rubiales, its top third netback placing. We point to Amerisur logistical issues in Southern Colombia and to the Rubiales’ field reverting to Ecopetrol in Q216, as having an effect on these two companies, with current discounts from the trend line not seen large enough to place these two larger independents on our 2014 top pick list.
Exhibit 1: Market valuations: EBITDA/boe plotted against EV/2P (US$/boe)
Source: Bloomberg, company data, Edison Investment Research estimates. Note: Excludes PDQ and PZE (zero 2P reserves).
In contrast to these above the trend companies, we find a different subset of underappreciated and below the trend line companies, which include Suroco, Touchstone, President, Crown Point, Geo-Park and Range, all solid performers, with emerging stories and market valuations below their full potential. We expect this second subset to be driven by company-specific news, mostly related
BOE
CNE
GPK
GTE
CWV
AMER
MVN
PMG
PPCPRE
PTA
PXT
RRS
SRN
TAB
0.0
5.0
10.0
15.0
20.0
25.0
30.0
35.0
40.0
45.0
0.0 10.0 20.0 30.0 40.0 50.0 60.0 70.0 80.0 90.0
EV/2P
rese
rves (
US$)
EBITDA 2013e per boe (US$)
IE
Fallen angels, rising stars | 10 October 2013 6
to production and the ability to generate future cash, with this valuation screen key in identifying this subset of below the trend line underappreciated subgroup.
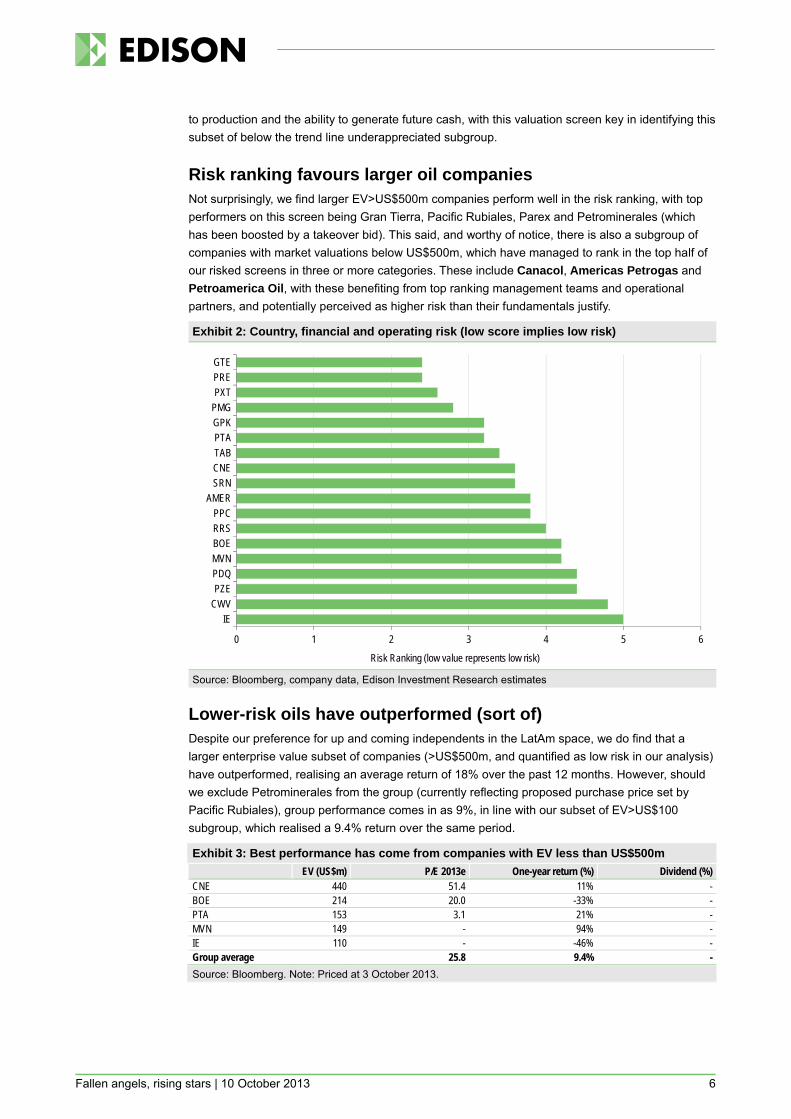
Risk ranking favours larger oil companies Not surprisingly, we find larger EV>US$500m companies perform well in the risk ranking, with top performers on this screen being Gran Tierra, Pacific Rubiales, Parex and Petrominerales (which has been boosted by a takeover bid). This said, and worthy of notice, there is also a subgroup of companies with market valuations below US$500m, which have managed to rank in the top half of our risked screens in three or more categories. These include Canacol, Americas Petrogas and Petroamerica Oil, with these benefiting from top ranking management teams and operational partners, and potentially perceived as higher risk than their fundamentals justify.
Exhibit 2: Country, financial and operating risk (low score implies low risk)
Source: Bloomberg, company data, Edison Investment Research estimates
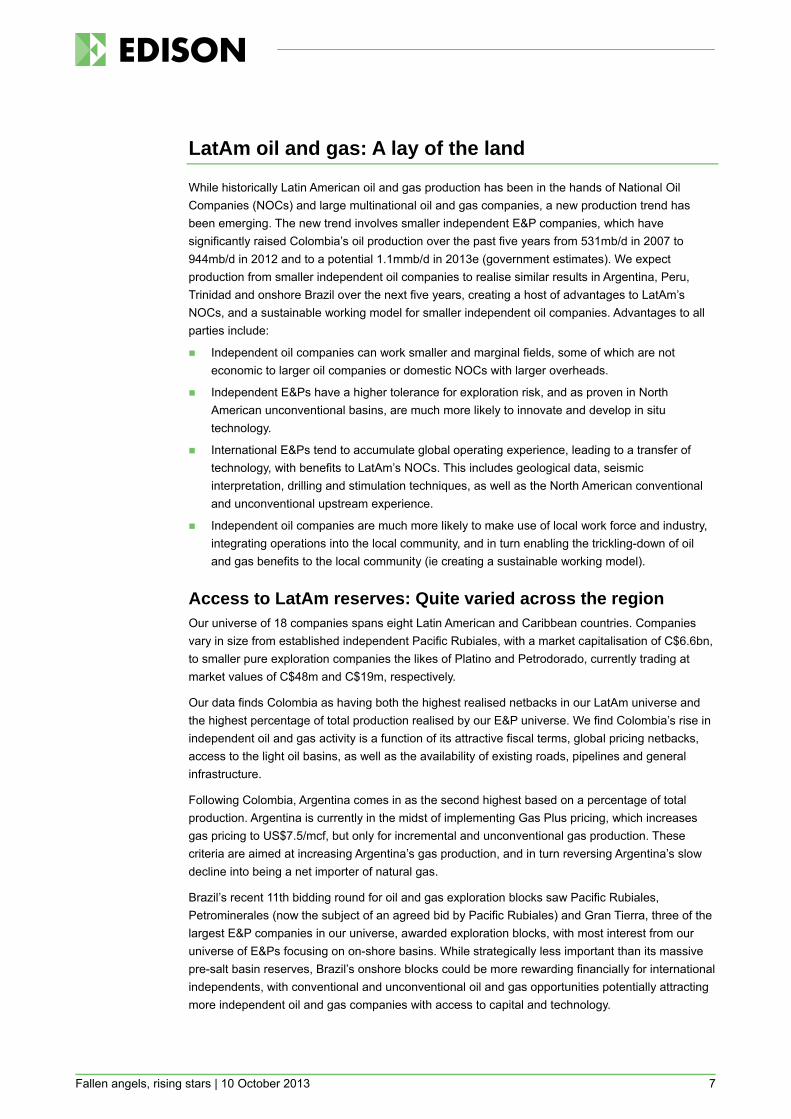
Lower-risk oils have outperformed (sort of) Despite our preference for up and coming independents in the LatAm space, we do find that a larger enterprise value subset of companies (>US$500m, and quantified as low risk in our analysis) have outperformed, realising an average return of 18% over the past 12 months. However, should we exclude Petrominerales from the group (currently reflecting proposed purchase price set by Pacific Rubiales), group performance comes in as 9%, in line with our subset of EV>US$100 subgroup, which realised a 9.4% return over the same period.
Exhibit 3: Best performance has come from companies with EV less than US$500m EV (US$m) P/E 2013e One-year return (%) Dividend (%) CNE 440 51.4 11% - BOE 214 20.0 -33% - PTA 153 3.1 21% - MVN 149 - 94% - IE 110 - -46% - Group average 25.8 9.4% -
Source: Bloomberg. Note: Priced at 3 October 2013.
0 1 2 3 4 5 6
IECWVPZEPDQMVNBOERRSPPC
AMERSRNCNETABPTAGPKPMGPXTPREGTE
Risk Ranking (low value represents low risk)
Fallen angels, rising stars | 10 October 2013 7
LatAm oil and gas: A lay of the land
While historically Latin American oil and gas production has been in the hands of National Oil Companies (NOCs) and large multinational oil and gas companies, a new production trend has been emerging. The new trend involves smaller independent E&P companies, which have significantly raised Colombia’s oil production over the past five years from 531mb/d in 2007 to 944mb/d in 2012 and to a potential 1.1mmb/d in 2013e (government estimates). We expect production from smaller independent oil companies to realise similar results in Argentina, Peru, Trinidad and onshore Brazil over the next five years, creating a host of advantages to LatAm’s NOCs, and a sustainable working model for smaller independent oil companies. Advantages to all parties include:
Independent oil companies can work smaller and marginal fields, some of which are not economic to larger oil companies or domestic NOCs with larger overheads.
Independent E&Ps have a higher tolerance for exploration risk, and as proven in North American unconventional basins, are much more likely to innovate and develop in situ technology.
International E&Ps tend to accumulate global operating experience, leading to a transfer of technology, with benefits to LatAm’s NOCs. This includes geological data, seismic interpretation, drilling and stimulation techniques, as well as the North American conventional and unconventional upstream experience.
Independent oil companies are much more likely to make use of local work force and industry, integrating operations into the local community, and in turn enabling the trickling-down of oil and gas benefits to the local community (ie creating a sustainable working model).
Access to LatAm reserves: Quite varied across the region Our universe of 18 companies spans eight Latin American and Caribbean countries. Companies vary in size from established independent Pacific Rubiales, with a market capitalisation of C$6.6bn, to smaller pure exploration companies the likes of Platino and Petrodorado, currently trading at market values of C$48m and C$19m, respectively.
Our data finds Colombia as having both the highest realised netbacks in our LatAm universe and the highest percentage of total production realised by our E&P universe. We find Colombia’s rise in independent oil and gas activity is a function of its attractive fiscal terms, global pricing netbacks, access to the light oil basins, as well as the availability of existing roads, pipelines and general infrastructure.
Following Colombia, Argentina comes in as the second highest based on a percentage of total production. Argentina is currently in the midst of implementing Gas Plus pricing, which increases gas pricing to US$7.5/mcf, but only for incremental and unconventional gas production. These criteria are aimed at increasing Argentina’s gas production, and in turn reversing Argentina’s slow decline into being a net importer of natural gas.
Brazil’s recent 11th bidding round for oil and gas exploration blocks saw Pacific Rubiales, Petrominerales (now the subject of an agreed bid by Pacific Rubiales) and Gran Tierra, three of the largest E&P companies in our universe, awarded exploration blocks, with most interest from our universe of E&Ps focusing on on-shore basins. While strategically less important than its massive pre-salt basin reserves, Brazil’s onshore blocks could be more rewarding financially for international independents, with conventional and unconventional oil and gas opportunities potentially attracting more independent oil and gas companies with access to capital and technology.
Fallen angels, rising stars | 10 October 2013 8
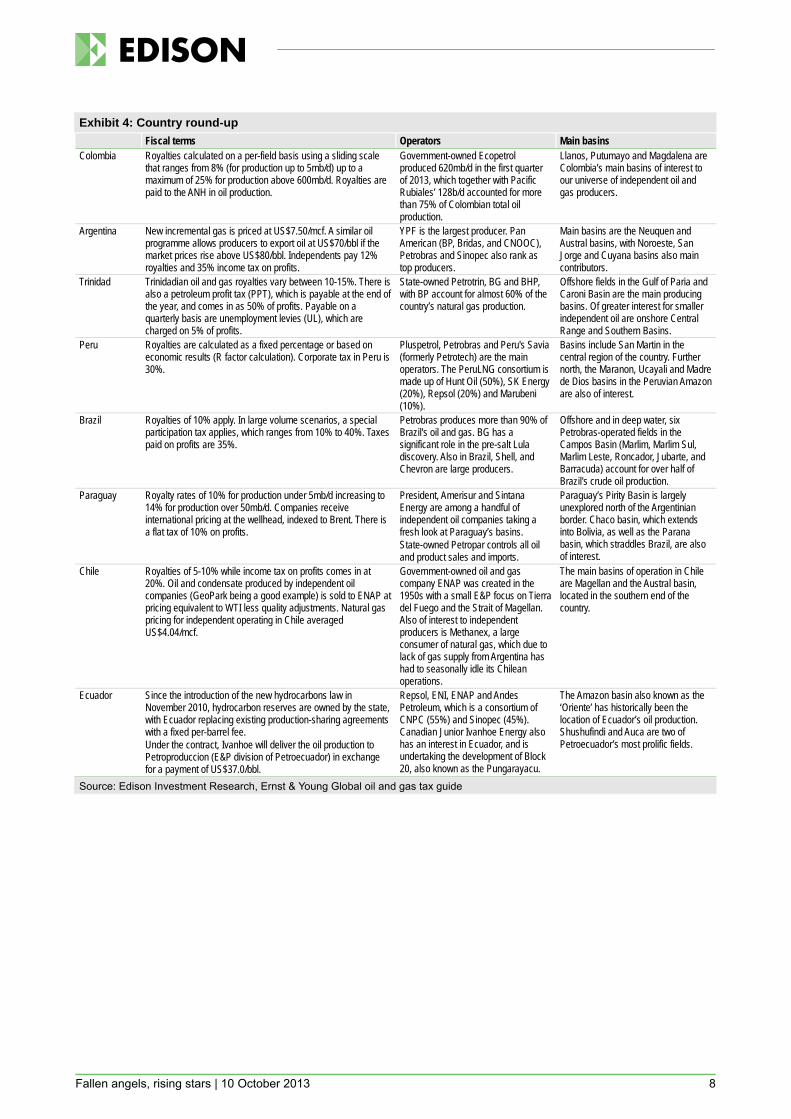
Exhibit 4: Country round-up Fiscal terms Operators Main basins Colombia Royalties calculated on a per-field basis using a sliding scale
that ranges from 8% (for production up to 5mb/d) up to a maximum of 25% for production above 600mb/d. Royalties are paid to the ANH in oil production.
Government-owned Ecopetrol produced 620mb/d in the first quarter of 2013, which together with Pacific Rubiales’ 128b/d accounted for more than 75% of Colombian total oil production.
Llanos, Putumayo and Magdalena are Colombia’s main basins of interest to our universe of independent oil and gas producers.
Argentina New incremental gas is priced at US$7.50/mcf. A similar oil programme allows producers to export oil at US$70/bbl if the market prices rise above US$80/bbl. Independents pay 12% royalties and 35% income tax on profits.
YPF is the largest producer. Pan American (BP, Bridas, and CNOOC), Petrobras and Sinopec also rank as top producers.
Main basins are the Neuquen and Austral basins, with Noroeste, San Jorge and Cuyana basins also main contributors.
Trinidad Trinidadian oil and gas royalties vary between 10-15%. There is also a petroleum profit tax (PPT), which is payable at the end of the year, and comes in as 50% of profits. Payable on a quarterly basis are unemployment levies (UL), which are charged on 5% of profits.
State-owned Petrotrin, BG and BHP, with BP account for almost 60% of the country’s natural gas production.
Offshore fields in the Gulf of Paria and Caroni Basin are the main producing basins. Of greater interest for smaller independent oil are onshore Central Range and Southern Basins.
Peru Royalties are calculated as a fixed percentage or based on economic results (R factor calculation). Corporate tax in Peru is 30%.
Pluspetrol, Petrobras and Peru's Savia (formerly Petrotech) are the main operators. The PeruLNG consortium is made up of Hunt Oil (50%), SK Energy (20%), Repsol (20%) and Marubeni (10%).
Basins include San Martin in the central region of the country. Further north, the Maranon, Ucayali and Madre de Dios basins in the Peruvian Amazon are also of interest.
Brazil Royalties of 10% apply. In large volume scenarios, a special participation tax applies, which ranges from 10% to 40%. Taxes paid on profits are 35%.
Petrobras produces more than 90% of Brazil's oil and gas. BG has a significant role in the pre-salt Lula discovery. Also in Brazil, Shell, and Chevron are large producers.
Offshore and in deep water, six Petrobras-operated fields in the Campos Basin (Marlim, Marlim Sul, Marlim Leste, Roncador, Jubarte, and Barracuda) account for over half of Brazil's crude oil production.
Paraguay Royalty rates of 10% for production under 5mb/d increasing to 14% for production over 50mb/d. Companies receive international pricing at the wellhead, indexed to Brent. There is a flat tax of 10% on profits.
President, Amerisur and Sintana Energy are among a handful of independent oil companies taking a fresh look at Paraguay’s basins. State-owned Petropar controls all oil and product sales and imports.
Paraguay’s Pirity Basin is largely unexplored north of the Argentinian border. Chaco basin, which extends into Bolivia, as well as the Parana basin, which straddles Brazil, are also of interest.
Chile Royalties of 5-10% while income tax on profits comes in at 20%. Oil and condensate produced by independent oil companies (GeoPark being a good example) is sold to ENAP at pricing equivalent to WTI less quality adjustments. Natural gas pricing for independent operating in Chile averaged US$4.04/mcf.
Government-owned oil and gas company ENAP was created in the 1950s with a small E&P focus on Tierra del Fuego and the Strait of Magellan. Also of interest to independent producers is Methanex, a large consumer of natural gas, which due to lack of gas supply from Argentina has had to seasonally idle its Chilean operations.
The main basins of operation in Chile are Magellan and the Austral basin, located in the southern end of the country.
Ecuador Since the introduction of the new hydrocarbons law in November 2010, hydrocarbon reserves are owned by the state, with Ecuador replacing existing production-sharing agreements with a fixed per-barrel fee. Under the contract, Ivanhoe will deliver the oil production to Petroproduccion (E&P division of Petroecuador) in exchange for a payment of US$37.0/bbl.
Repsol, ENI, ENAP and Andes Petroleum, which is a consortium of CNPC (55%) and Sinopec (45%). Canadian Junior Ivanhoe Energy also has an interest in Ecuador, and is undertaking the development of Block 20, also known as the Pungarayacu.
The Amazon basin also known as the ‘Oriente’ has historically been the location of Ecuador’s oil production. Shushufindi and Auca are two of Petroecuador’s most prolific fields.
Source: Edison Investment Research, Ernst & Young Global oil and gas tax guide
Fallen angels, rising stars | 10 October 2013 9
Value screen 1: Markets and 2P reserves
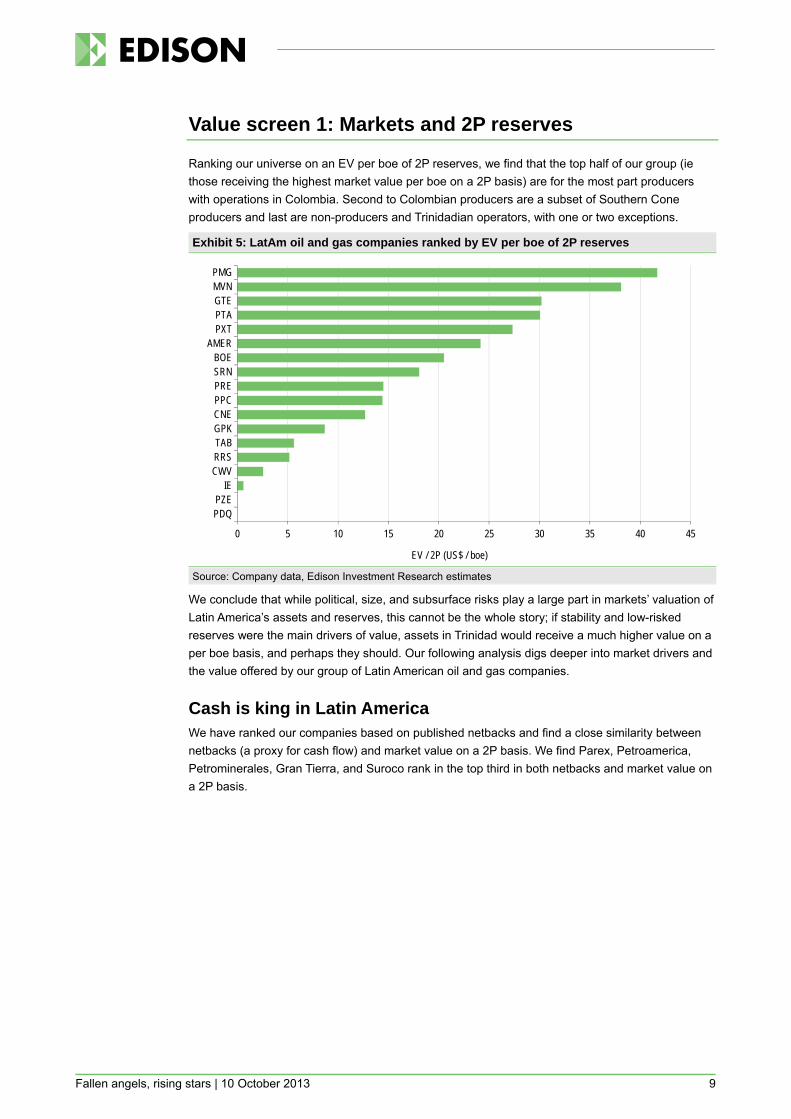
Ranking our universe on an EV per boe of 2P reserves, we find that the top half of our group (ie those receiving the highest market value per boe on a 2P basis) are for the most part producers with operations in Colombia. Second to Colombian producers are a subset of Southern Cone producers and last are non-producers and Trinidadian operators, with one or two exceptions.
Exhibit 5: LatAm oil and gas companies ranked by EV per boe of 2P reserves
Source: Company data, Edison Investment Research estimates
We conclude that while political, size, and subsurface risks play a large part in markets’ valuation of Latin America’s assets and reserves, this cannot be the whole story; if stability and low-risked reserves were the main drivers of value, assets in Trinidad would receive a much higher value on a per boe basis, and perhaps they should. Our following analysis digs deeper into market drivers and the value offered by our group of Latin American oil and gas companies.
Cash is king in Latin America We have ranked our companies based on published netbacks and find a close similarity between netbacks (a proxy for cash flow) and market value on a 2P basis. We find Parex, Petroamerica, Petrominerales, Gran Tierra, and Suroco rank in the top third in both netbacks and market value on a 2P basis.
0 5 10 15 20 25 30 35 40 45
PDQPZE
IECWVRRSTABGPKCNEPPCPRESRNBOE
AMERPXTPTAGTEMVNPMG
EV / 2P (US$ / boe)
Fallen angels, rising stars | 10 October 2013 10
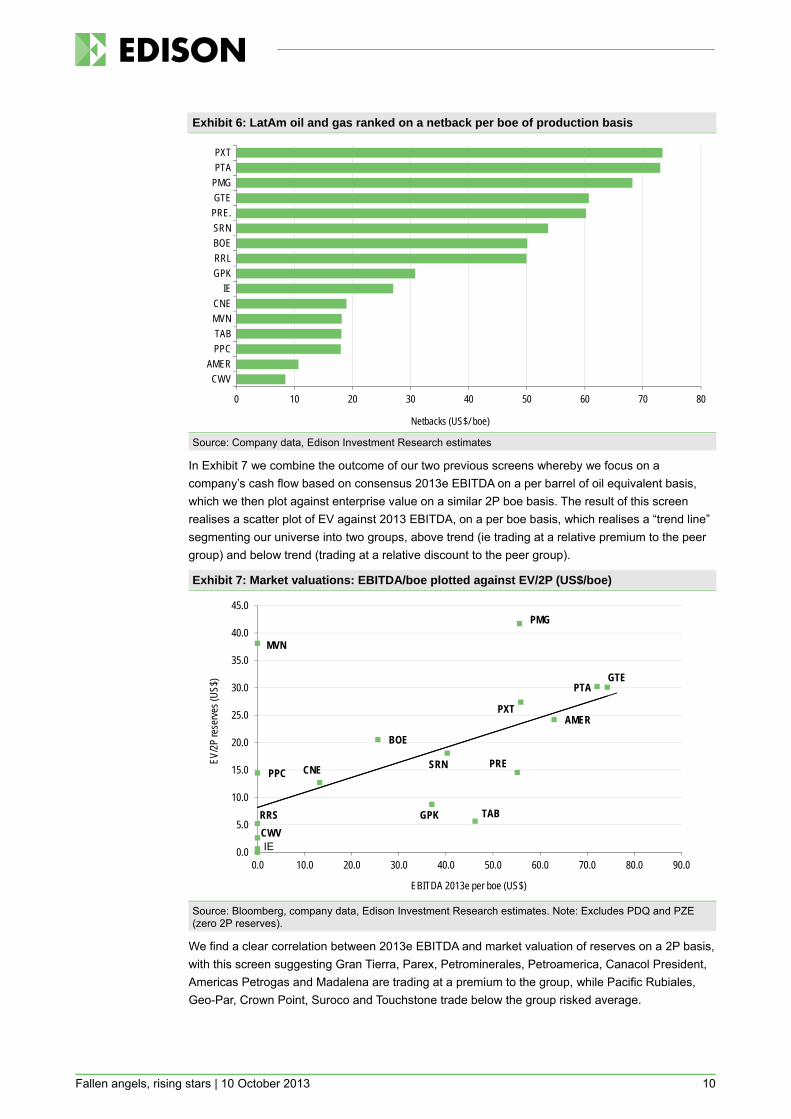
Exhibit 6: LatAm oil and gas ranked on a netback per boe of production basis
Source: Company data, Edison Investment Research estimates
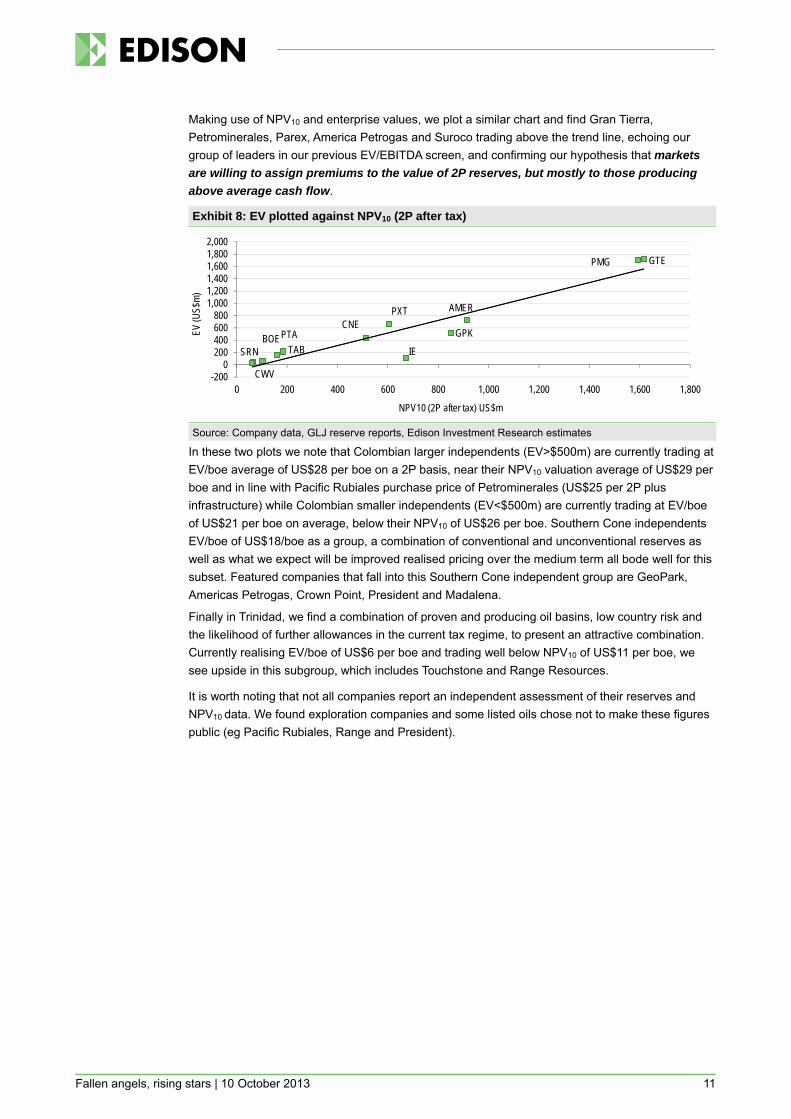
In Exhibit 7 we combine the outcome of our two previous screens whereby we focus on a company’s cash flow based on consensus 2013e EBITDA on a per barrel of oil equivalent basis, which we then plot against enterprise value on a similar 2P boe basis. The result of this screen realises a scatter plot of EV against 2013 EBITDA, on a per boe basis, which realises a “trend line” segmenting our universe into two groups, above trend (ie trading at a relative premium to the peer group) and below trend (trading at a relative discount to the peer group).
Exhibit 7: Market valuations: EBITDA/boe plotted against EV/2P (US$/boe)
Source: Bloomberg, company data, Edison Investment Research estimates. Note: Excludes PDQ and PZE (zero 2P reserves).
We find a clear correlation between 2013e EBITDA and market valuation of reserves on a 2P basis, with this screen suggesting Gran Tierra, Parex, Petrominerales, Petroamerica, Canacol President, Americas Petrogas and Madalena are trading at a premium to the group, while Pacific Rubiales, Geo-Par, Crown Point, Suroco and Touchstone trade below the group risked average.
0 10 20 30 40 50 60 70 80
CWVAMER
PPCTAB
MVNCNE
IEGPKRRLBOESRNPRE.GTEPMGPTAPXT
Netbacks (US$/ boe)
BOE
CNE
GPK
GTE
CWV
AMER
MVN
PMG
PPCPRE
PTA
PXT
RRS
SRN
TAB
0.0
5.0
10.0
15.0
20.0
25.0
30.0
35.0
40.0
45.0
0.0 10.0 20.0 30.0 40.0 50.0 60.0 70.0 80.0 90.0
EV/2P
rese
rves (
US$)
EBITDA 2013e per boe (US$)
IE
Fallen angels, rising stars | 10 October 2013 11
Making use of NPV10 and enterprise values, we plot a similar chart and find Gran Tierra, Petrominerales, Parex, America Petrogas and Suroco trading above the trend line, echoing our group of leaders in our previous EV/EBITDA screen, and confirming our hypothesis that markets
are willing to assign premiums to the value of 2P reserves, but mostly to those producing
above average cash flow.
Exhibit 8: EV plotted against NPV10 (2P after tax)
Source: Company data, GLJ reserve reports, Edison Investment Research estimates
In these two plots we note that Colombian larger independents (EV>$500m) are currently trading at EV/boe average of US$28 per boe on a 2P basis, near their NPV10 valuation average of US$29 per boe and in line with Pacific Rubiales purchase price of Petrominerales (US$25 per 2P plus infrastructure) while Colombian smaller independents (EV<$500m) are currently trading at EV/boe of US$21 per boe on average, below their NPV10 of US$26 per boe. Southern Cone independents EV/boe of US$18/boe as a group, a combination of conventional and unconventional reserves as well as what we expect will be improved realised pricing over the medium term all bode well for this subset. Featured companies that fall into this Southern Cone independent group are GeoPark, Americas Petrogas, Crown Point, President and Madalena.
Finally in Trinidad, we find a combination of proven and producing oil basins, low country risk and the likelihood of further allowances in the current tax regime, to present an attractive combination. Currently realising EV/boe of US$6 per boe and trading well below NPV10 of US$11 per boe, we see upside in this subgroup, which includes Touchstone and Range Resources.
It is worth noting that not all companies report an independent assessment of their reserves and NPV10 data. We found exploration companies and some listed oils chose not to make these figures public (eg Pacific Rubiales, Range and President).
GTEPMG
AMERPXTCNE
BOEIE
PTA GPK
SRN TAB
CWV-2000
200400600800
1,0001,2001,4001,6001,8002,000
0 200 400 600 800 1,000 1,200 1,400 1,600 1,800
EV (U
S$m)
NPV10 (2P after tax) US$m
Fallen angels, rising stars | 10 October 2013 12
Exhibit 9: Universe of LatAm oils – production and financial data Net (debt)/
cash (US$m)
Mkt cap (US$m)
EV (US$m)
2P (mmboe)
EV/2P (US$/boe)
EBITDA 12a
(US$m)
EBITDA 13e
(US$m)
boe/d 12a (US$/boe)
boe/d 13e (US$/boe)
Netback 2012a
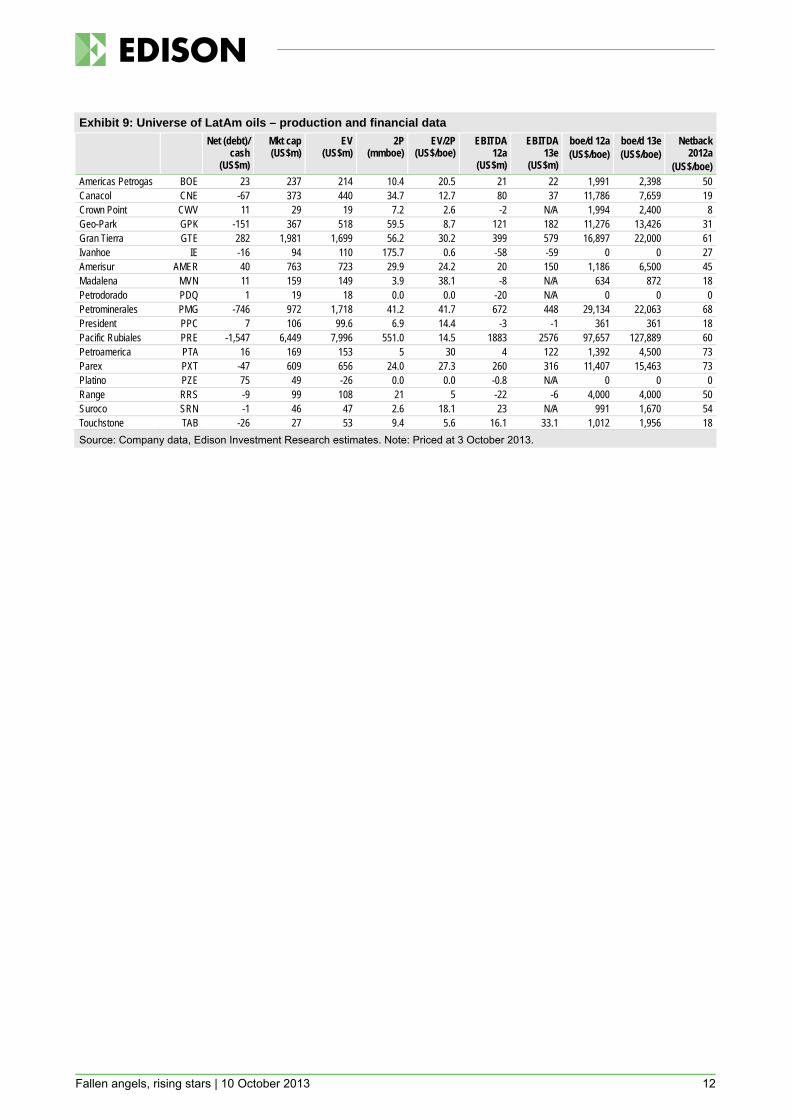
(US$/boe) Americas Petrogas BOE 23 237 214 10.4 20.5 21 22 1,991 2,398 50 Canacol CNE -67 373 440 34.7 12.7 80 37 11,786 7,659 19 Crown Point CWV 11 29 19 7.2 2.6 -2 N/A 1,994 2,400 8 Geo-Park GPK -151 367 518 59.5 8.7 121 182 11,276 13,426 31 Gran Tierra GTE 282 1,981 1,699 56.2 30.2 399 579 16,897 22,000 61 Ivanhoe IE -16 94 110 175.7 0.6 -58 -59 0 0 27 Amerisur AMER 40 763 723 29.9 24.2 20 150 1,186 6,500 45 Madalena MVN 11 159 149 3.9 38.1 -8 N/A 634 872 18 Petrodorado PDQ 1 19 18 0.0 0.0 -20 N/A 0 0 0 Petrominerales PMG -746 972 1,718 41.2 41.7 672 448 29,134 22,063 68 President PPC 7 106 99.6 6.9 14.4 -3 -1 361 361 18 Pacific Rubiales PRE -1,547 6,449 7,996 551.0 14.5 1883 2576 97,657 127,889 60 Petroamerica PTA 16 169 153 5 30 4 122 1,392 4,500 73 Parex PXT -47 609 656 24.0 27.3 260 316 11,407 15,463 73 Platino PZE 75 49 -26 0.0 0.0 -0.8 N/A 0 0 0 Range RRS -9 99 108 21 5 -22 -6 4,000 4,000 50 Suroco SRN -1 46 47 2.6 18.1 23 N/A 991 1,670 54 Touchstone TAB -26 27 53 9.4 5.6 16.1 33.1 1,012 1,956 18 Source: Company data, Edison Investment Research estimates. Note: Priced at 3 October 2013.
Fallen angels, rising stars | 10 October 2013 13
Value screen 2: Quantifying risk
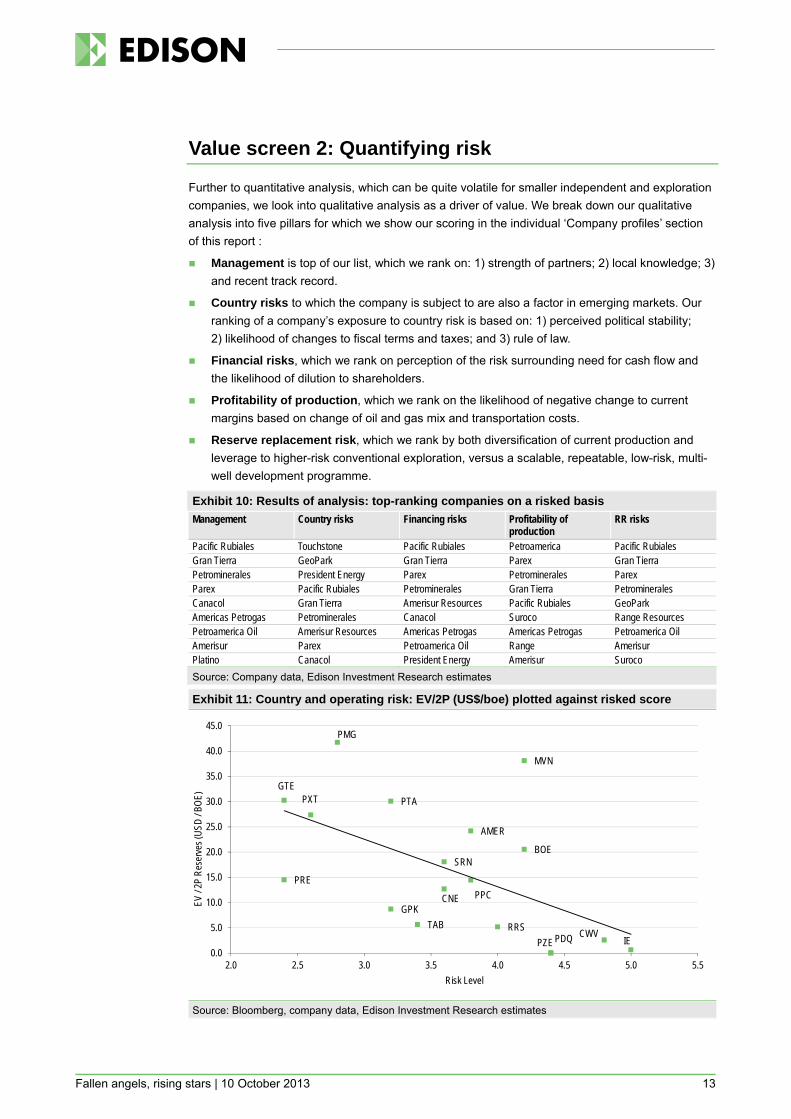
Further to quantitative analysis, which can be quite volatile for smaller independent and exploration companies, we look into qualitative analysis as a driver of value. We break down our qualitative analysis into five pillars for which we show our scoring in the individual ‘Company profiles’ section of this report :
Management is top of our list, which we rank on: 1) strength of partners; 2) local knowledge; 3) and recent track record.
Country risks to which the company is subject to are also a factor in emerging markets. Our ranking of a company’s exposure to country risk is based on: 1) perceived political stability; 2) likelihood of changes to fiscal terms and taxes; and 3) rule of law.
Financial risks, which we rank on perception of the risk surrounding need for cash flow and the likelihood of dilution to shareholders.
Profitability of production, which we rank on the likelihood of negative change to current margins based on change of oil and gas mix and transportation costs.
Reserve replacement risk, which we rank by both diversification of current production and leverage to higher-risk conventional exploration, versus a scalable, repeatable, low-risk, multi-well development programme.
Exhibit 10: Results of analysis: top-ranking companies on a risked basis Management Country risks Financing risks Profitability of
production RR risks
Pacific Rubiales Touchstone Pacific Rubiales Petroamerica Pacific Rubiales Gran Tierra GeoPark Gran Tierra Parex Gran Tierra Petrominerales President Energy Parex Petrominerales Parex Parex Pacific Rubiales Petrominerales Gran Tierra Petrominerales Canacol Gran Tierra Amerisur Resources Pacific Rubiales GeoPark Americas Petrogas Petrominerales Canacol Suroco Range Resources Petroamerica Oil Amerisur Resources Americas Petrogas Americas Petrogas Petroamerica Oil Amerisur Parex Petroamerica Oil Range Amerisur Platino Canacol President Energy Amerisur Suroco Source: Company data, Edison Investment Research estimates
Exhibit 11: Country and operating risk: EV/2P (US$/boe) plotted against risked score
Source: Bloomberg, company data, Edison Investment Research estimates
PRE
GTE
PMG
PXT
CNE
BOE
PTA
AMER
PDQ
SRN
TABGPK
PZE
PPC
MVN
RRS CWVIE
0.0
5.0
10.0
15.0
20.0
25.0
30.0
35.0
40.0
45.0
2.0 2.5 3.0 3.5 4.0 4.5 5.0 5.5
EV / 2
P Re
serve
s (US
D / B
OE)
Risk Level
Fallen angels, rising stars | 10 October 2013 14
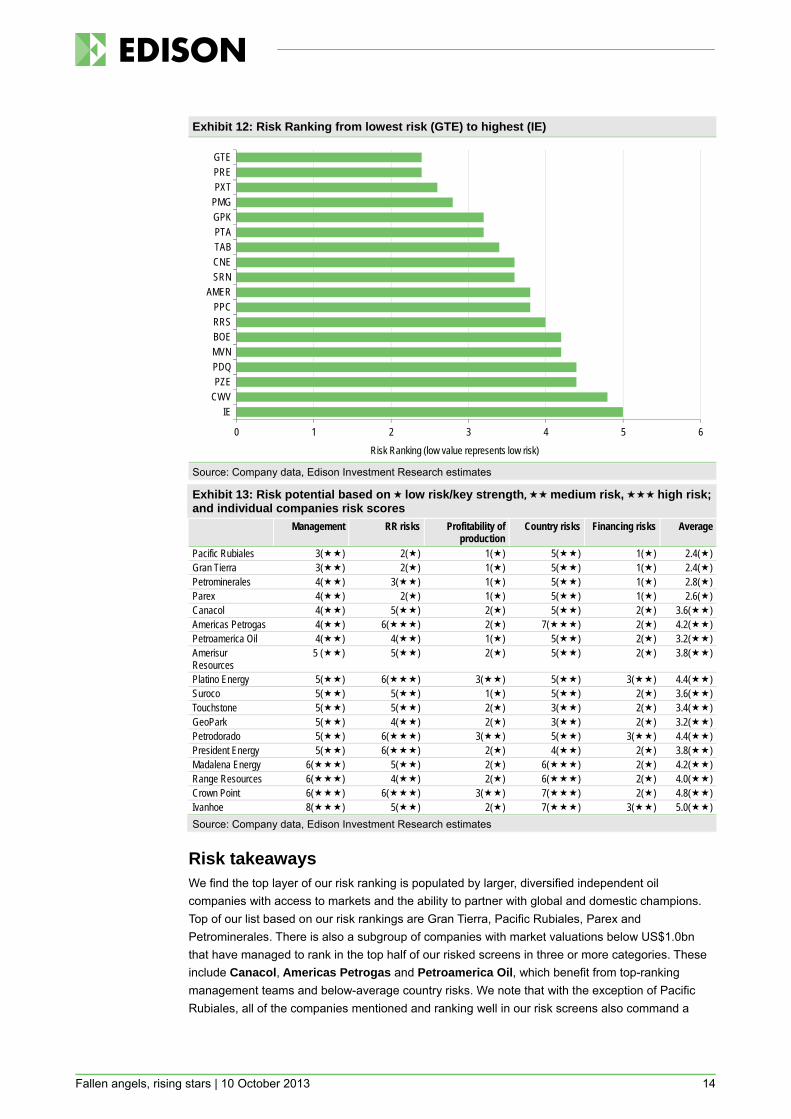
Exhibit 12: Risk Ranking from lowest risk (GTE) to highest (IE)
Source: Company data, Edison Investment Research estimates
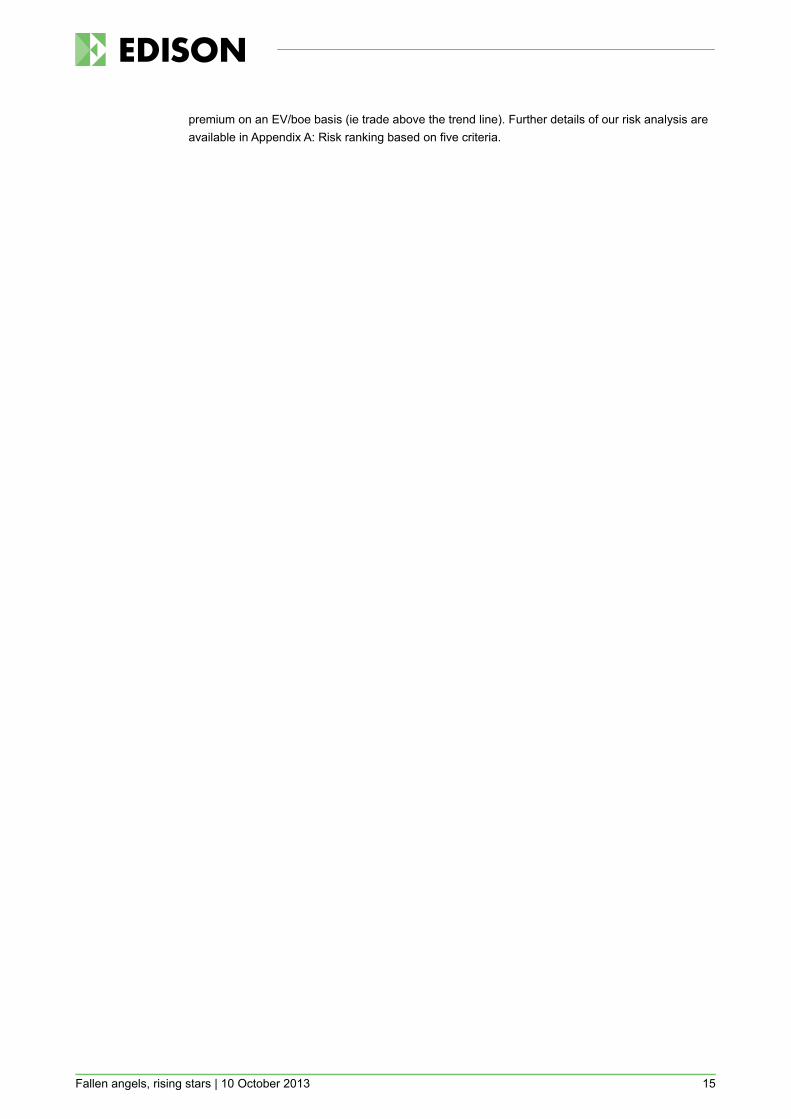
Exhibit 13: Risk potential based on low risk/key strength, medium risk, high risk; and individual companies risk scores Management RR risks Profitability of
production Country risks Financing risks Average
Pacific Rubiales 3() 2() 1() 5() 1() 2.4() Gran Tierra 3() 2() 1() 5() 1() 2.4() Petrominerales 4() 3() 1() 5() 1() 2.8() Parex 4() 2() 1() 5() 1() 2.6() Canacol 4() 5() 2() 5() 2() 3.6() Americas Petrogas 4() 6() 2() 7() 2() 4.2() Petroamerica Oil 4() 4() 1() 5() 2() 3.2() Amerisur Resources
5 () 5() 2() 5() 2() 3.8()
Platino Energy 5() 6() 3() 5() 3() 4.4() Suroco 5() 5() 1() 5() 2() 3.6() Touchstone 5() 5() 2() 3() 2() 3.4() GeoPark 5() 4() 2() 3() 2() 3.2() Petrodorado 5() 6() 3() 5() 3() 4.4() President Energy 5() 6() 2() 4() 2() 3.8() Madalena Energy 6() 5() 2() 6() 2() 4.2() Range Resources 6() 4() 2() 6() 2() 4.0() Crown Point 6() 6() 3() 7() 2() 4.8() Ivanhoe 8() 5() 2() 7() 3() 5.0() Source: Company data, Edison Investment Research estimates
Risk takeaways We find the top layer of our risk ranking is populated by larger, diversified independent oil companies with access to markets and the ability to partner with global and domestic champions. Top of our list based on our risk rankings are Gran Tierra, Pacific Rubiales, Parex and Petrominerales. There is also a subgroup of companies with market valuations below US$1.0bn that have managed to rank in the top half of our risked screens in three or more categories. These include Canacol, Americas Petrogas and Petroamerica Oil, which benefit from top-ranking management teams and below-average country risks. We note that with the exception of Pacific Rubiales, all of the companies mentioned and ranking well in our risk screens also command a
0 1 2 3 4 5 6
IECWVPZEPDQMVNBOERRSPPC
AMERSRNCNETABPTAGPKPMGPXTPREGTE
Risk Ranking (low value represents low risk)
Fallen angels, rising stars | 10 October 2013 15
premium on an EV/boe basis (ie trade above the trend line). Further details of our risk analysis are available in Appendix A: Risk ranking based on five criteria.
Fallen angels, rising stars | 10 October 2013 16
Value screen 3: Size and market performance
To compare the performance of our subset of 18 Latin American oil and gas companies, we have segmented our universe into three subgroups: 1) larger and established producers with an enterprise value greater than US$500m; 2) emerging producers with enterprise values greater than US$100m but less than US$500m; and 3) pure exploration and companies in a “proof of concept” stage of development with an EV less than US$100m.
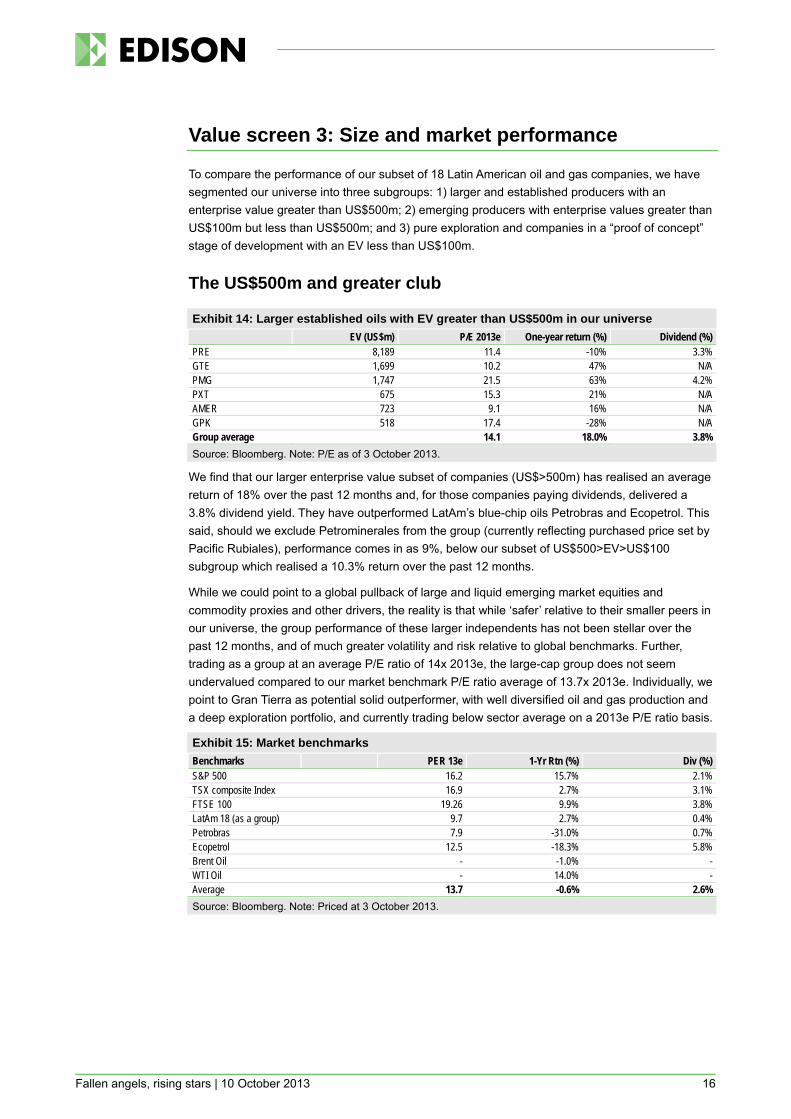
The US$500m and greater club
Exhibit 14: Larger established oils with EV greater than US$500m in our universe EV (US$m) P/E 2013e One-year return (%) Dividend (%) PRE 8,189 11.4 -10% 3.3% GTE 1,699 10.2 47% N/A PMG 1,747 21.5 63% 4.2% PXT 675 15.3 21% N/A AMER 723 9.1 16% N/A GPK 518 17.4 -28% N/A Group average 14.1 18.0% 3.8%
Source: Bloomberg. Note: P/E as of 3 October 2013.
We find that our larger enterprise value subset of companies (US$>500m) has realised an average return of 18% over the past 12 months and, for those companies paying dividends, delivered a 3.8% dividend yield. They have outperformed LatAm’s blue-chip oils Petrobras and Ecopetrol. This said, should we exclude Petrominerales from the group (currently reflecting purchased price set by Pacific Rubiales), performance comes in as 9%, below our subset of US$500>EV>US$100 subgroup which realised a 10.3% return over the past 12 months.
While we could point to a global pullback of large and liquid emerging market equities and commodity proxies and other drivers, the reality is that while ‘safer’ relative to their smaller peers in our universe, the group performance of these larger independents has not been stellar over the past 12 months, and of much greater volatility and risk relative to global benchmarks. Further, trading as a group at an average P/E ratio of 14x 2013e, the large-cap group does not seem undervalued compared to our market benchmark P/E ratio average of 13.7x 2013e. Individually, we point to Gran Tierra as potential solid outperformer, with well diversified oil and gas production and a deep exploration portfolio, and currently trading below sector average on a 2013e P/E ratio basis.
Exhibit 15: Market benchmarks Benchmarks PER 13e 1-Yr Rtn (%) Div (%) S&P 500 16.2 15.7% 2.1% TSX composite Index 16.9 2.7% 3.1% FTSE 100 19.26 9.9% 3.8% LatAm 18 (as a group) 9.7 2.7% 0.4% Petrobras 7.9 -31.0% 0.7% Ecopetrol 12.5 -18.3% 5.8% Brent Oil - -1.0% - WTI Oil - 14.0% - Average 13.7 -0.6% 2.6%
Source: Bloomberg. Note: Priced at 3 October 2013.
Fallen angels, rising stars | 10 October 2013 17
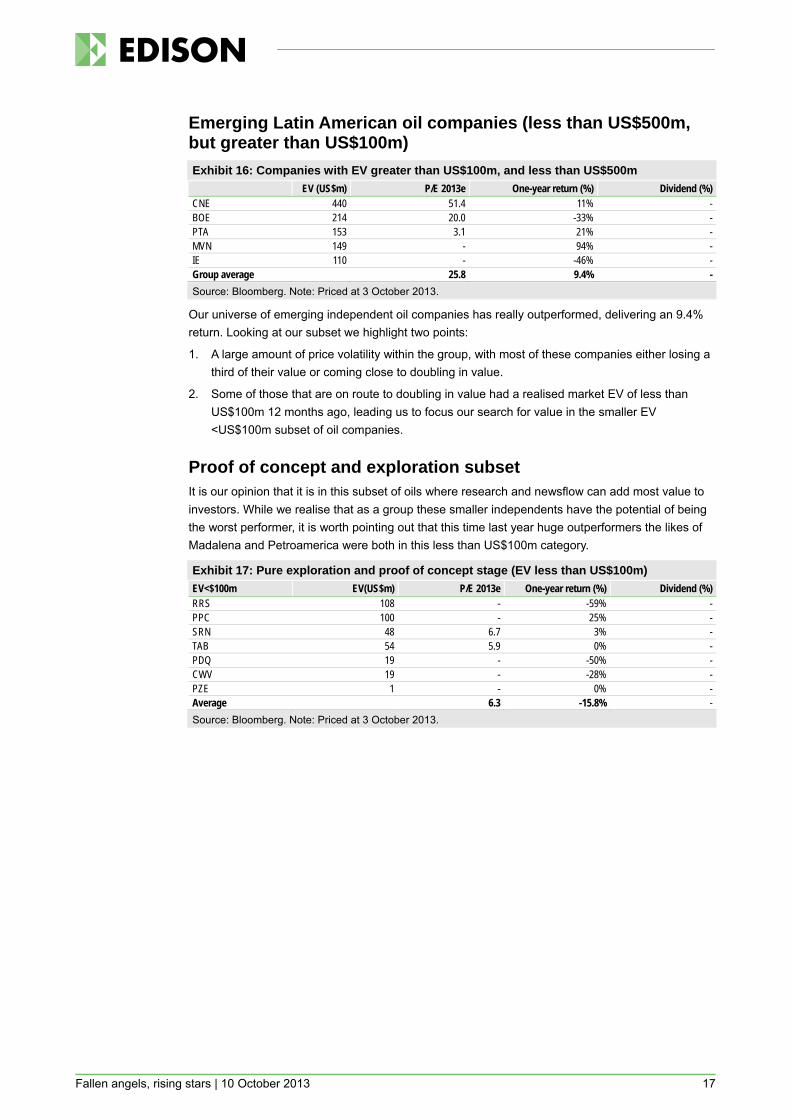
Emerging Latin American oil companies (less than US$500m, but greater than US$100m) Exhibit 16: Companies with EV greater than US$100m, and less than US$500m EV (US$m) P/E 2013e One-year return (%) Dividend (%) CNE 440 51.4 11% - BOE 214 20.0 -33% - PTA 153 3.1 21% - MVN 149 - 94% - IE 110 - -46% - Group average 25.8 9.4% -
Source: Bloomberg. Note: Priced at 3 October 2013.
Our universe of emerging independent oil companies has really outperformed, delivering an 9.4% return. Looking at our subset we highlight two points:
1. A large amount of price volatility within the group, with most of these companies either losing a third of their value or coming close to doubling in value.
2. Some of those that are on route to doubling in value had a realised market EV of less than US$100m 12 months ago, leading us to focus our search for value in the smaller EV <US$100m subset of oil companies.
Proof of concept and exploration subset It is our opinion that it is in this subset of oils where research and newsflow can add most value to investors. While we realise that as a group these smaller independents have the potential of being the worst performer, it is worth pointing out that this time last year huge outperformers the likes of Madalena and Petroamerica were both in this less than US$100m category.
Exhibit 17: Pure exploration and proof of concept stage (EV less than US$100m) EV<$100m EV(US$m) P/E 2013e One-year return (%) Dividend (%) RRS 108 - -59% - PPC 100 - 25% - SRN 48 6.7 3% - TAB 54 5.9 0% - PDQ 19 - -50% - CWV 19 - -28% - PZE 1 - 0% - Average 6.3 -15.8% - Source: Bloomberg. Note: Priced at 3 October 2013.
Fallen angels, rising stars | 10 October 2013 18
Conclusions of our analysis
In the preceding pages we have run through a series of screens based on netbacks, market value and risks. In this section we combine our screens and come to three observations followed by a set of conclusions. Our observations are as follows:
1. near-term cash flow generation has been main driver of market value, showing that investors are potentially risk adverse, preferring short duration investments versus the possibility of greater returns further out in the future;
2. risk rankings favour larger, more established oil companies, creating a ‘Catch 22’ for smaller companies; and
3. contrary to common sense, larger and lower-risked oil companies do not always outperform.
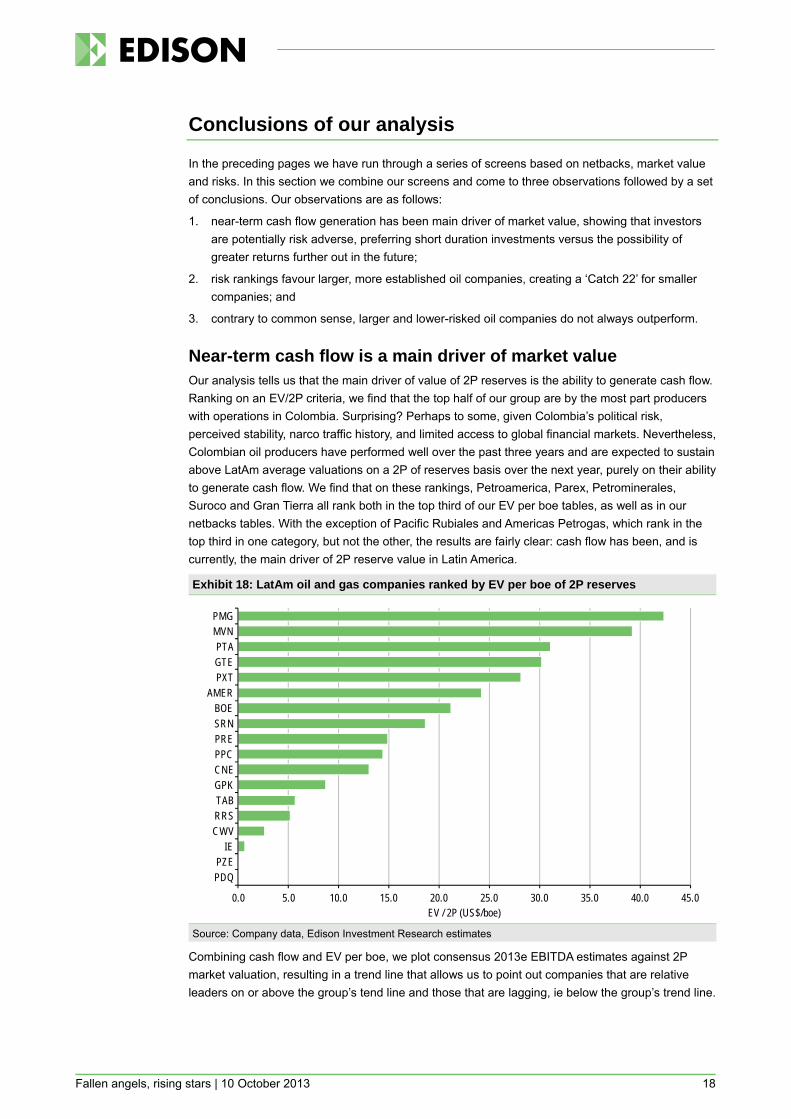
Near-term cash flow is a main driver of market value Our analysis tells us that the main driver of value of 2P reserves is the ability to generate cash flow. Ranking on an EV/2P criteria, we find that the top half of our group are by the most part producers with operations in Colombia. Surprising? Perhaps to some, given Colombia’s political risk, perceived stability, narco traffic history, and limited access to global financial markets. Nevertheless, Colombian oil producers have performed well over the past three years and are expected to sustain above LatAm average valuations on a 2P of reserves basis over the next year, purely on their ability to generate cash flow. We find that on these rankings, Petroamerica, Parex, Petrominerales, Suroco and Gran Tierra all rank both in the top third of our EV per boe tables, as well as in our netbacks tables. With the exception of Pacific Rubiales and Americas Petrogas, which rank in the top third in one category, but not the other, the results are fairly clear: cash flow has been, and is currently, the main driver of 2P reserve value in Latin America.
Exhibit 18: LatAm oil and gas companies ranked by EV per boe of 2P reserves
Source: Company data, Edison Investment Research estimates
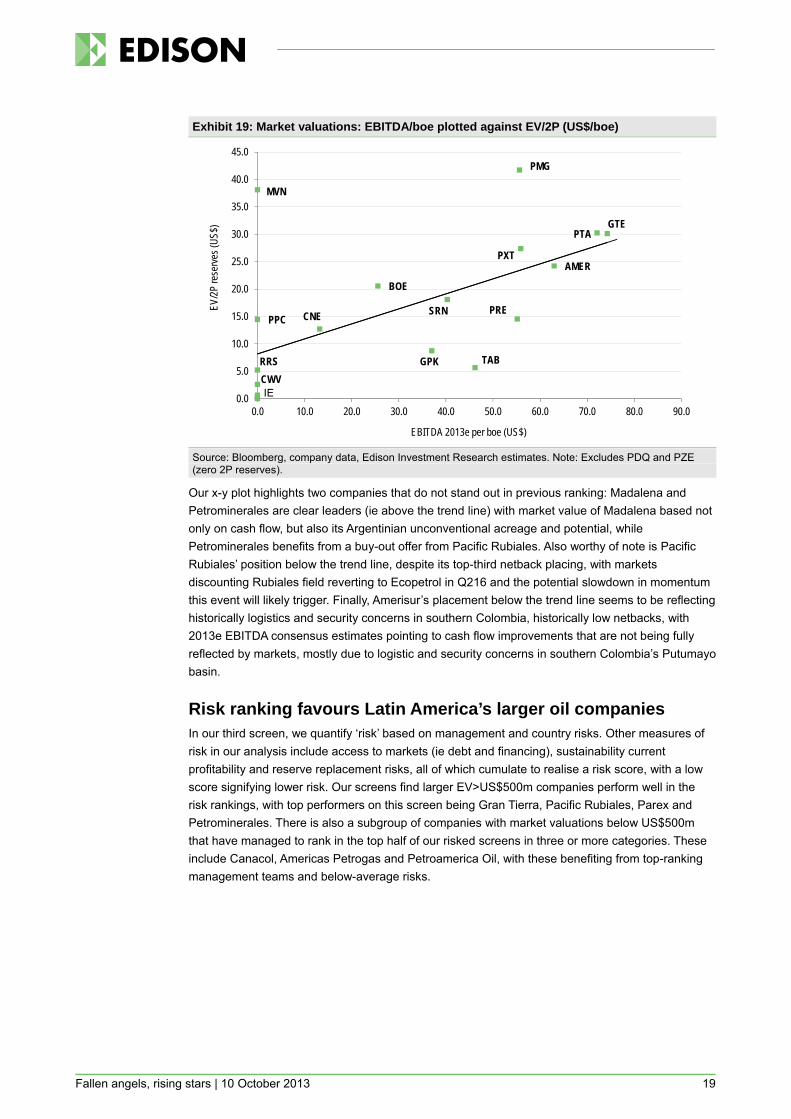
Combining cash flow and EV per boe, we plot consensus 2013e EBITDA estimates against 2P market valuation, resulting in a trend line that allows us to point out companies that are relative leaders on or above the group’s tend line and those that are lagging, ie below the group’s trend line.
0.0 5.0 10.0 15.0 20.0 25.0 30.0 35.0 40.0 45.0
PDQPZE
IECWVRRSTABGPKCNEPPCPRESRNBOE
AMERPXTGTEPTA
MVNPMG
EV / 2P (US$/boe)
Fallen angels, rising stars | 10 October 2013 19
Exhibit 19: Market valuations: EBITDA/boe plotted against EV/2P (US$/boe)
Source: Bloomberg, company data, Edison Investment Research estimates. Note: Excludes PDQ and PZE (zero 2P reserves).
Our x-y plot highlights two companies that do not stand out in previous ranking: Madalena and Petrominerales are clear leaders (ie above the trend line) with market value of Madalena based not only on cash flow, but also its Argentinian unconventional acreage and potential, while Petrominerales benefits from a buy-out offer from Pacific Rubiales. Also worthy of note is Pacific Rubiales’ position below the trend line, despite its top-third netback placing, with markets discounting Rubiales field reverting to Ecopetrol in Q216 and the potential slowdown in momentum this event will likely trigger. Finally, Amerisur’s placement below the trend line seems to be reflecting historically logistics and security concerns in southern Colombia, historically low netbacks, with 2013e EBITDA consensus estimates pointing to cash flow improvements that are not being fully reflected by markets, mostly due to logistic and security concerns in southern Colombia’s Putumayo basin.
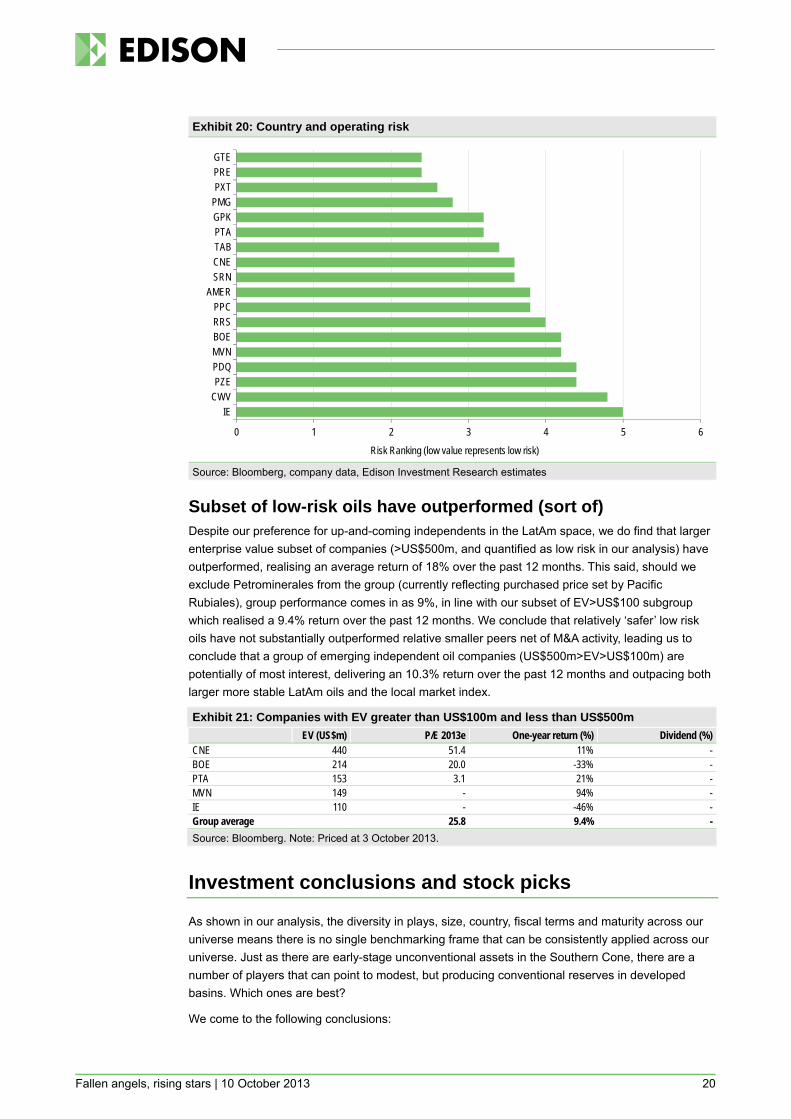
Risk ranking favours Latin America’s larger oil companies In our third screen, we quantify ‘risk’ based on management and country risks. Other measures of risk in our analysis include access to markets (ie debt and financing), sustainability current profitability and reserve replacement risks, all of which cumulate to realise a risk score, with a low score signifying lower risk. Our screens find larger EV>US$500m companies perform well in the risk rankings, with top performers on this screen being Gran Tierra, Pacific Rubiales, Parex and Petrominerales. There is also a subgroup of companies with market valuations below US$500m that have managed to rank in the top half of our risked screens in three or more categories. These include Canacol, Americas Petrogas and Petroamerica Oil, with these benefiting from top-ranking management teams and below-average risks.
BOE
CNE
GPK
GTE
CWV
AMER
MVN
PMG
PPCPRE
PTA
PXT
RRS
SRN
TAB
0.0
5.0
10.0
15.0
20.0
25.0
30.0
35.0
40.0
45.0
0.0 10.0 20.0 30.0 40.0 50.0 60.0 70.0 80.0 90.0
EV/2P
rese
rves (
US$)
EBITDA 2013e per boe (US$)
IE
Fallen angels, rising stars | 10 October 2013 20
Exhibit 20: Country and operating risk
Source: Bloomberg, company data, Edison Investment Research estimates
Subset of low-risk oils have outperformed (sort of) Despite our preference for up-and-coming independents in the LatAm space, we do find that larger enterprise value subset of companies (>US$500m, and quantified as low risk in our analysis) have outperformed, realising an average return of 18% over the past 12 months. This said, should we exclude Petrominerales from the group (currently reflecting purchased price set by Pacific Rubiales), group performance comes in as 9%, in line with our subset of EV>US$100 subgroup which realised a 9.4% return over the past 12 months. We conclude that relatively ‘safer’ low risk oils have not substantially outperformed relative smaller peers net of M&A activity, leading us to conclude that a group of emerging independent oil companies (US$500m>EV>US$100m) are potentially of most interest, delivering an 10.3% return over the past 12 months and outpacing both larger more stable LatAm oils and the local market index.
Exhibit 21: Companies with EV greater than US$100m and less than US$500m EV (US$m) P/E 2013e One-year return (%) Dividend (%) CNE 440 51.4 11% - BOE 214 20.0 -33% - PTA 153 3.1 21% - MVN 149 - 94% - IE 110 - -46% - Group average 25.8 9.4% -
Source: Bloomberg. Note: Priced at 3 October 2013.
Investment conclusions and stock picks
As shown in our analysis, the diversity in plays, size, country, fiscal terms and maturity across our universe means there is no single benchmarking frame that can be consistently applied across our universe. Just as there are early-stage unconventional assets in the Southern Cone, there are a number of players that can point to modest, but producing conventional reserves in developed basins. Which ones are best?
We come to the following conclusions:
0 1 2 3 4 5 6
IECWVPZEPDQMVNBOERRSPPC
AMERSRNCNETABPTAGPKPMGPXTPREGTE
Risk Ranking (low value represents low risk)
Fallen angels, rising stars | 10 October 2013 21
Are Colombia’s larger independents all priced in? Colombia’s larger independents (EV>$500m) currently dominate trading volumes and lead valuations based on 2P reserves. Currently trading at EV/boe of US$28 per boe on a 2P basis, we see limited upside from current levels to their NPV10 average of US$29 per boe, signalling that growth will require new, powerful, and unexpected catalysts. Featured companies that fall into this large, low-risk but lacking significant catalysts category are Pacific Rubiales, Gran Tierra and Parex.
The Southern Cone is becoming more attractive In contrast to Colombia’s independents, we find Southern Cone oils delivering lower netbacks and averaging lower EV on a 2P basis. This said, impressive below-ground fundamentals and the region’s growing need for energy production are both expected to drive change over the medium term. We find a combination of conventional and unconventional assets, as well as what we expect will be improved realised pricing over the medium term, to all bode well for this subset. Featured companies that fall into this Southern Cone independent group are GeoPark, Americas Petrogas, Crown Point, President and Madalena.
Mid-tier to show more potential to reveal value Finally, we also like Colombian mid-tiered independents currently trading at EV/boe of US$21 per boe on average, below their NPV10 of US$26 per boe, and while riskier than their larger Colombian peers, we see upside in this subgroup based on their potential to grow production and prove-up reserves over the medium term. Companies that fall into this category are Canacol, Petroamerica and Suroco.
Fallen angels, rising stars | 10 October 2013 22
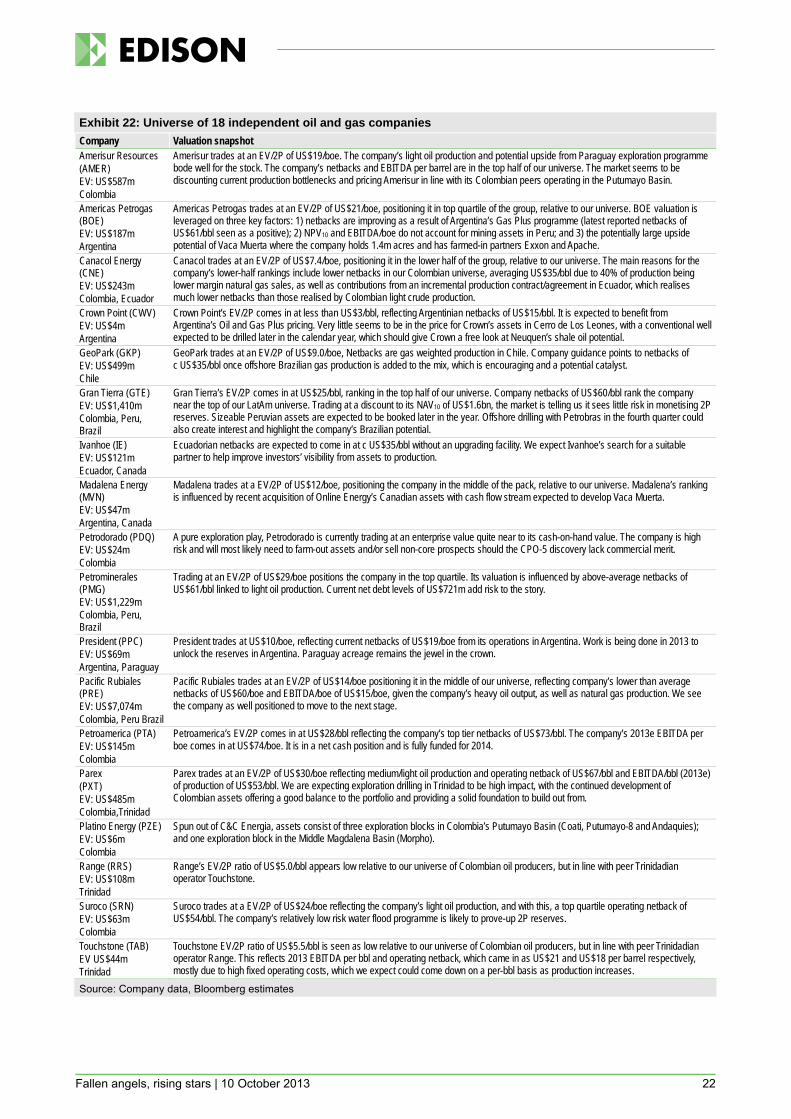
Exhibit 22: Universe of 18 independent oil and gas companies Company Valuation snapshot Amerisur Resources (AMER) EV: US$587m Colombia
Amerisur trades at an EV/2P of US$19/boe. The company’s light oil production and potential upside from Paraguay exploration programme bode well for the stock. The company’s netbacks and EBITDA per barrel are in the top half of our universe. The market seems to be discounting current production bottlenecks and pricing Amerisur in line with its Colombian peers operating in the Putumayo Basin.
Americas Petrogas (BOE) EV: US$187m Argentina
Americas Petrogas trades at an EV/2P of US$21/boe, positioning it in top quartile of the group, relative to our universe. BOE valuation is leveraged on three key factors: 1) netbacks are improving as a result of Argentina’s Gas Plus programme (latest reported netbacks of US$61/bbl seen as a positive); 2) NPV10 and EBITDA/boe do not account for mining assets in Peru; and 3) the potentially large upside potential of Vaca Muerta where the company holds 1.4m acres and has farmed-in partners Exxon and Apache.
Canacol Energy (CNE) EV: US$243m Colombia, Ecuador
Canacol trades at an EV/2P of US$7.4/boe, positioning it in the lower half of the group, relative to our universe. The main reasons for the company’s lower-half rankings include lower netbacks in our Colombian universe, averaging US$35/bbl due to 40% of production being lower margin natural gas sales, as well as contributions from an incremental production contract/agreement in Ecuador, which realises much lower netbacks than those realised by Colombian light crude production.
Crown Point (CWV) EV: US$4m Argentina
Crown Point’s EV/2P comes in at less than US$3/bbl, reflecting Argentinian netbacks of US$15/bbl. It is expected to benefit from Argentina’s Oil and Gas Plus pricing. Very little seems to be in the price for Crown’s assets in Cerro de Los Leones, with a conventional well expected to be drilled later in the calendar year, which should give Crown a free look at Neuquen’s shale oil potential.
GeoPark (GKP) EV: US$499m Chile
GeoPark trades at an EV/2P of US$9.0/boe, Netbacks are gas weighted production in Chile. Company guidance points to netbacks of c US$35/bbl once offshore Brazilian gas production is added to the mix, which is encouraging and a potential catalyst.
Gran Tierra (GTE) EV: US$1,410m Colombia, Peru, Brazil
Gran Tierra’s EV/2P comes in at US$25/bbl, ranking in the top half of our universe. Company netbacks of US$60/bbl rank the company near the top of our LatAm universe. Trading at a discount to its NAV10 of US$1.6bn, the market is telling us it sees little risk in monetising 2P reserves. Sizeable Peruvian assets are expected to be booked later in the year. Offshore drilling with Petrobras in the fourth quarter could also create interest and highlight the company’s Brazilian potential.
Ivanhoe (IE) EV: US$121m Ecuador, Canada
Ecuadorian netbacks are expected to come in at c US$35/bbl without an upgrading facility. We expect Ivanhoe’s search for a suitable partner to help improve investors’ visibility from assets to production.
Madalena Energy (MVN) EV: US$47m Argentina, Canada
Madalena trades at a EV/2P of US$12/boe, positioning the company in the middle of the pack, relative to our universe. Madalena’s ranking is influenced by recent acquisition of Online Energy’s Canadian assets with cash flow stream expected to develop Vaca Muerta.
Petrodorado (PDQ) EV: US$24m Colombia
A pure exploration play, Petrodorado is currently trading at an enterprise value quite near to its cash-on-hand value. The company is high risk and will most likely need to farm-out assets and/or sell non-core prospects should the CPO-5 discovery lack commercial merit.
Petrominerales (PMG) EV: US$1,229m Colombia, Peru, Brazil
Trading at an EV/2P of US$29/boe positions the company in the top quartile. Its valuation is influenced by above-average netbacks of US$61/bbl linked to light oil production. Current net debt levels of US$721m add risk to the story.
President (PPC) EV: US$69m Argentina, Paraguay
President trades at US$10/boe, reflecting current netbacks of US$19/boe from its operations in Argentina. Work is being done in 2013 to unlock the reserves in Argentina. Paraguay acreage remains the jewel in the crown.
Pacific Rubiales (PRE) EV: US$7,074m Colombia, Peru Brazil
Pacific Rubiales trades at an EV/2P of US$14/boe positioning it in the middle of our universe, reflecting company’s lower than average netbacks of US$60/boe and EBITDA/boe of US$15/boe, given the company’s heavy oil output, as well as natural gas production. We see the company as well positioned to move to the next stage.
Petroamerica (PTA) EV: US$145m Colombia
Petroamerica’s EV/2P comes in at US$28/bbl reflecting the company’s top tier netbacks of US$73/bbl. The company’s 2013e EBITDA per boe comes in at US$74/boe. It is in a net cash position and is fully funded for 2014.
Parex (PXT) EV: US$485m Colombia,Trinidad
Parex trades at an EV/2P of US$30/boe reflecting medium/light oil production and operating netback of US$67/bbl and EBITDA/bbl (2013e) of production of US$53/bbl. We are expecting exploration drilling in Trinidad to be high impact, with the continued development of Colombian assets offering a good balance to the portfolio and providing a solid foundation to build out from.
Platino Energy (PZE) EV: US$6m Colombia
Spun out of C&C Energia, assets consist of three exploration blocks in Colombia’s Putumayo Basin (Coati, Putumayo-8 and Andaquies); and one exploration block in the Middle Magdalena Basin (Morpho).
Range (RRS) EV: US$108m Trinidad
Range’s EV/2P ratio of US$5.0/bbl appears low relative to our universe of Colombian oil producers, but in line with peer Trinidadian operator Touchstone.
Suroco (SRN) EV: US$63m Colombia
Suroco trades at a EV/2P of US$24/boe reflecting the company’s light oil production, and with this, a top quartile operating netback of US$54/bbl. The company’s relatively low risk water flood programme is likely to prove-up 2P reserves.
Touchstone (TAB) EV US$44m Trinidad
Touchstone EV/2P ratio of US$5.5/bbl is seen as low relative to our universe of Colombian oil producers, but in line with peer Trinidadian operator Range. This reflects 2013 EBITDA per bbl and operating netback, which came in as US$21 and US$18 per barrel respectively, mostly due to high fixed operating costs, which we expect could come down on a per-bbl basis as production increases.
Source: Company data, Bloomberg estimates
Fallen angels, rising stars | 10 October 2013 23
LatAm country round-up
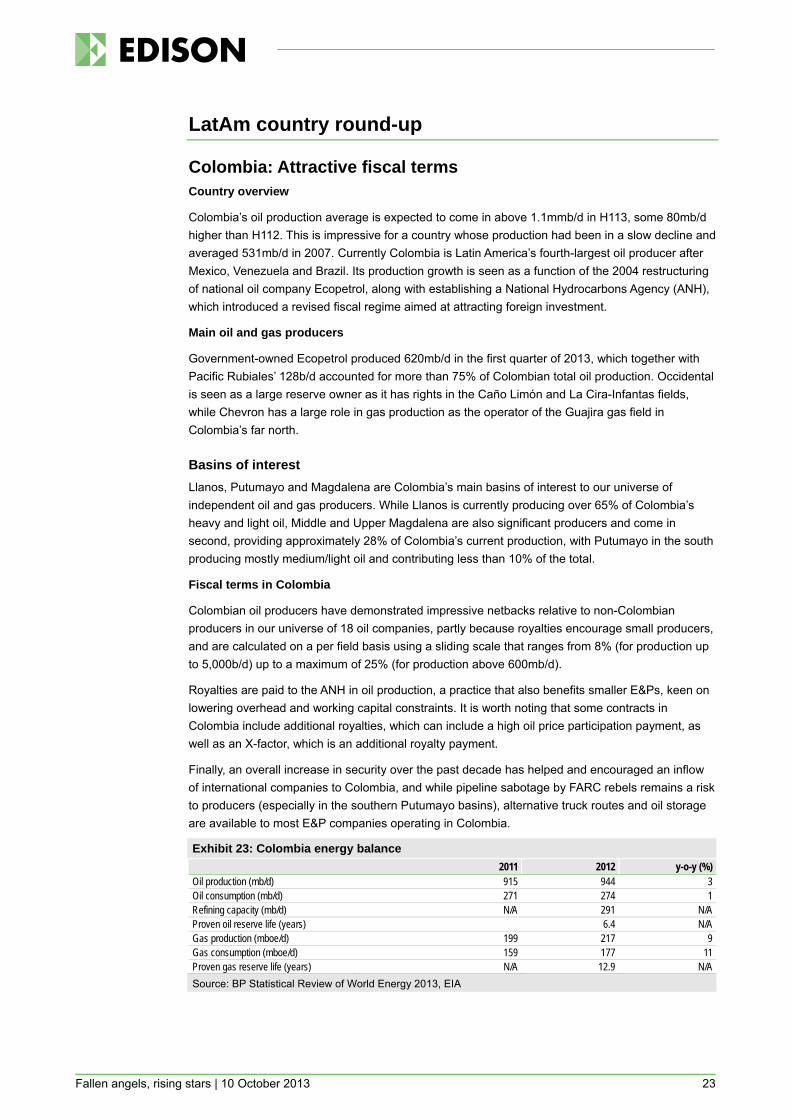
Colombia: Attractive fiscal terms Country overview
Colombia’s oil production average is expected to come in above 1.1mmb/d in H113, some 80mb/d higher than H112. This is impressive for a country whose production had been in a slow decline and averaged 531mb/d in 2007. Currently Colombia is Latin America’s fourth-largest oil producer after Mexico, Venezuela and Brazil. Its production growth is seen as a function of the 2004 restructuring of national oil company Ecopetrol, along with establishing a National Hydrocarbons Agency (ANH), which introduced a revised fiscal regime aimed at attracting foreign investment.
Main oil and gas producers
Government-owned Ecopetrol produced 620mb/d in the first quarter of 2013, which together with Pacific Rubiales’ 128b/d accounted for more than 75% of Colombian total oil production. Occidental is seen as a large reserve owner as it has rights in the Caño Limón and La Cira-Infantas fields, while Chevron has a large role in gas production as the operator of the Guajira gas field in Colombia’s far north.
Basins of interest Llanos, Putumayo and Magdalena are Colombia’s main basins of interest to our universe of independent oil and gas producers. While Llanos is currently producing over 65% of Colombia’s heavy and light oil, Middle and Upper Magdalena are also significant producers and come in second, providing approximately 28% of Colombia’s current production, with Putumayo in the south producing mostly medium/light oil and contributing less than 10% of the total.
Fiscal terms in Colombia
Colombian oil producers have demonstrated impressive netbacks relative to non-Colombian producers in our universe of 18 oil companies, partly because royalties encourage small producers, and are calculated on a per field basis using a sliding scale that ranges from 8% (for production up to 5,000b/d) up to a maximum of 25% (for production above 600mb/d).
Royalties are paid to the ANH in oil production, a practice that also benefits smaller E&Ps, keen on lowering overhead and working capital constraints. It is worth noting that some contracts in Colombia include additional royalties, which can include a high oil price participation payment, as well as an X-factor, which is an additional royalty payment.
Finally, an overall increase in security over the past decade has helped and encouraged an inflow of international companies to Colombia, and while pipeline sabotage by FARC rebels remains a risk to producers (especially in the southern Putumayo basins), alternative truck routes and oil storage are available to most E&P companies operating in Colombia.
Exhibit 23: Colombia energy balance 2011 2012 y-o-y (%)
Oil production (mb/d) 915 944 3 Oil consumption (mb/d) 271 274 1 Refining capacity (mb/d) N/A 291 N/A Proven oil reserve life (years) 6.4 N/A Gas production (mboe/d) 199 217 9 Gas consumption (mboe/d) 159 177 11 Proven gas reserve life (years) N/A 12.9 N/A Source: BP Statistical Review of World Energy 2013, EIA
Fallen angels, rising stars | 10 October 2013 24
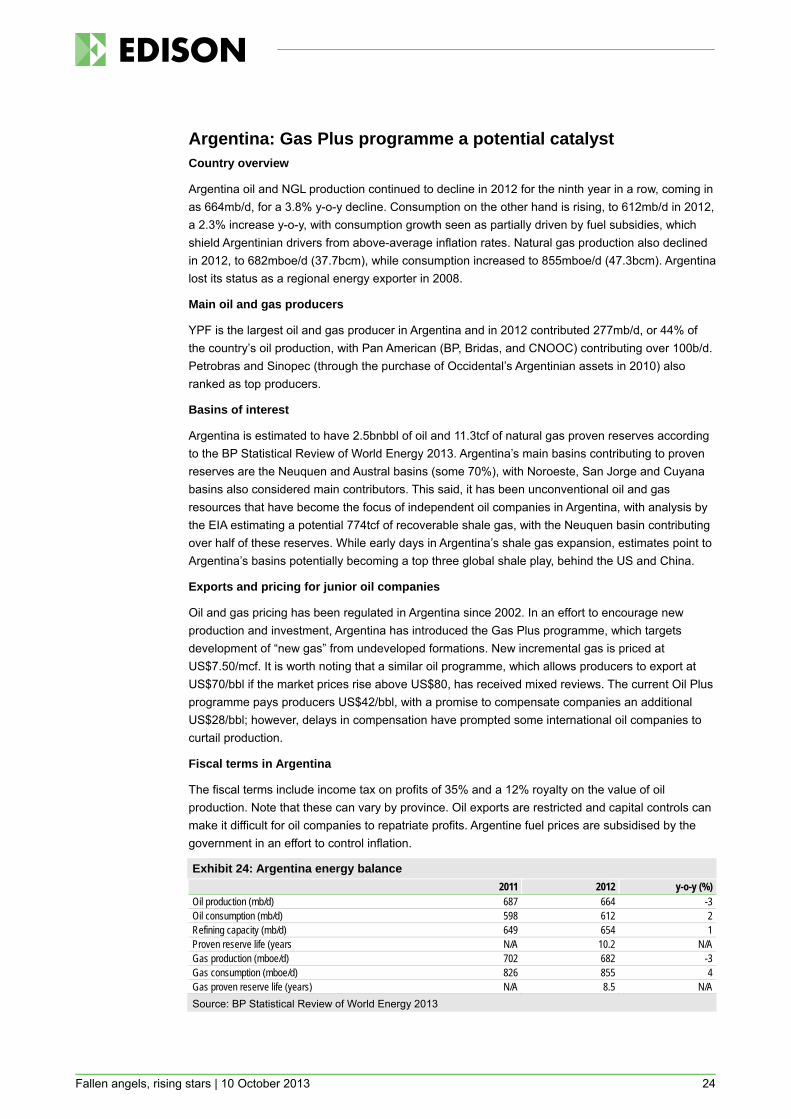
Argentina: Gas Plus programme a potential catalyst Country overview
Argentina oil and NGL production continued to decline in 2012 for the ninth year in a row, coming in as 664mb/d, for a 3.8% y-o-y decline. Consumption on the other hand is rising, to 612mb/d in 2012, a 2.3% increase y-o-y, with consumption growth seen as partially driven by fuel subsidies, which shield Argentinian drivers from above-average inflation rates. Natural gas production also declined in 2012, to 682mboe/d (37.7bcm), while consumption increased to 855mboe/d (47.3bcm). Argentina lost its status as a regional energy exporter in 2008.
Main oil and gas producers
YPF is the largest oil and gas producer in Argentina and in 2012 contributed 277mb/d, or 44% of the country’s oil production, with Pan American (BP, Bridas, and CNOOC) contributing over 100b/d. Petrobras and Sinopec (through the purchase of Occidental’s Argentinian assets in 2010) also ranked as top producers.
Basins of interest
Argentina is estimated to have 2.5bnbbl of oil and 11.3tcf of natural gas proven reserves according to the BP Statistical Review of World Energy 2013. Argentina’s main basins contributing to proven reserves are the Neuquen and Austral basins (some 70%), with Noroeste, San Jorge and Cuyana basins also considered main contributors. This said, it has been unconventional oil and gas resources that have become the focus of independent oil companies in Argentina, with analysis by the EIA estimating a potential 774tcf of recoverable shale gas, with the Neuquen basin contributing over half of these reserves. While early days in Argentina’s shale gas expansion, estimates point to Argentina’s basins potentially becoming a top three global shale play, behind the US and China.
Exports and pricing for junior oil companies
Oil and gas pricing has been regulated in Argentina since 2002. In an effort to encourage new production and investment, Argentina has introduced the Gas Plus programme, which targets development of “new gas” from undeveloped formations. New incremental gas is priced at US$7.50/mcf. It is worth noting that a similar oil programme, which allows producers to export at US$70/bbl if the market prices rise above US$80, has received mixed reviews. The current Oil Plus programme pays producers US$42/bbl, with a promise to compensate companies an additional US$28/bbl; however, delays in compensation have prompted some international oil companies to curtail production.
Fiscal terms in Argentina
The fiscal terms include income tax on profits of 35% and a 12% royalty on the value of oil production. Note that these can vary by province. Oil exports are restricted and capital controls can make it difficult for oil companies to repatriate profits. Argentine fuel prices are subsidised by the government in an effort to control inflation.
Exhibit 24: Argentina energy balance 2011 2012 y-o-y (%)
Oil production (mb/d) 687 664 -3 Oil consumption (mb/d) 598 612 2 Refining capacity (mb/d) 649 654 1 Proven reserve life (years N/A 10.2 N/A Gas production (mboe/d) 702 682 -3 Gas consumption (mboe/d) 826 855 4 Gas proven reserve life (years) N/A 8.5 N/A Source: BP Statistical Review of World Energy 2013
Fallen angels, rising stars | 10 October 2013 25
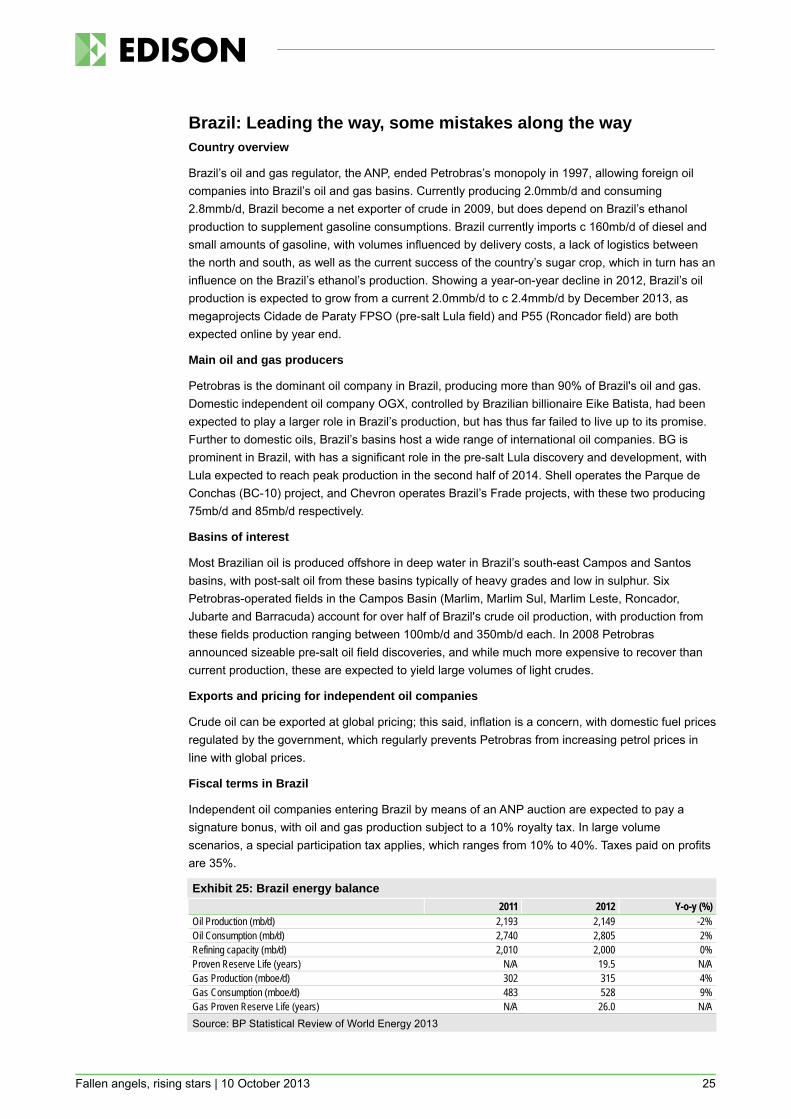
Brazil: Leading the way, some mistakes along the way Country overview
Brazil’s oil and gas regulator, the ANP, ended Petrobras’s monopoly in 1997, allowing foreign oil companies into Brazil’s oil and gas basins. Currently producing 2.0mmb/d and consuming 2.8mmb/d, Brazil become a net exporter of crude in 2009, but does depend on Brazil’s ethanol production to supplement gasoline consumptions. Brazil currently imports c 160mb/d of diesel and small amounts of gasoline, with volumes influenced by delivery costs, a lack of logistics between the north and south, as well as the current success of the country’s sugar crop, which in turn has an influence on the Brazil’s ethanol’s production. Showing a year-on-year decline in 2012, Brazil’s oil production is expected to grow from a current 2.0mmb/d to c 2.4mmb/d by December 2013, as megaprojects Cidade de Paraty FPSO (pre-salt Lula field) and P55 (Roncador field) are both expected online by year end.
Main oil and gas producers
Petrobras is the dominant oil company in Brazil, producing more than 90% of Brazil's oil and gas. Domestic independent oil company OGX, controlled by Brazilian billionaire Eike Batista, had been expected to play a larger role in Brazil’s production, but has thus far failed to live up to its promise. Further to domestic oils, Brazil’s basins host a wide range of international oil companies. BG is prominent in Brazil, with has a significant role in the pre-salt Lula discovery and development, with Lula expected to reach peak production in the second half of 2014. Shell operates the Parque de Conchas (BC-10) project, and Chevron operates Brazil’s Frade projects, with these two producing 75mb/d and 85mb/d respectively.
Basins of interest
Most Brazilian oil is produced offshore in deep water in Brazil’s south-east Campos and Santos basins, with post-salt oil from these basins typically of heavy grades and low in sulphur. Six Petrobras-operated fields in the Campos Basin (Marlim, Marlim Sul, Marlim Leste, Roncador, Jubarte and Barracuda) account for over half of Brazil's crude oil production, with production from these fields production ranging between 100mb/d and 350mb/d each. In 2008 Petrobras announced sizeable pre-salt oil field discoveries, and while much more expensive to recover than current production, these are expected to yield large volumes of light crudes.
Exports and pricing for independent oil companies
Crude oil can be exported at global pricing; this said, inflation is a concern, with domestic fuel prices regulated by the government, which regularly prevents Petrobras from increasing petrol prices in line with global prices.
Fiscal terms in Brazil
Independent oil companies entering Brazil by means of an ANP auction are expected to pay a signature bonus, with oil and gas production subject to a 10% royalty tax. In large volume scenarios, a special participation tax applies, which ranges from 10% to 40%. Taxes paid on profits are 35%.
Exhibit 25: Brazil energy balance 2011 2012 Y-o-y (%) Oil Production (mb/d) 2,193 2,149 -2% Oil Consumption (mb/d) 2,740 2,805 2% Refining capacity (mb/d) 2,010 2,000 0% Proven Reserve Life (years) N/A 19.5 N/A Gas Production (mboe/d) 302 315 4% Gas Consumption (mboe/d) 483 528 9% Gas Proven Reserve Life (years) N/A 26.0 N/A Source: BP Statistical Review of World Energy 2013
Fallen angels, rising stars | 10 October 2013 26
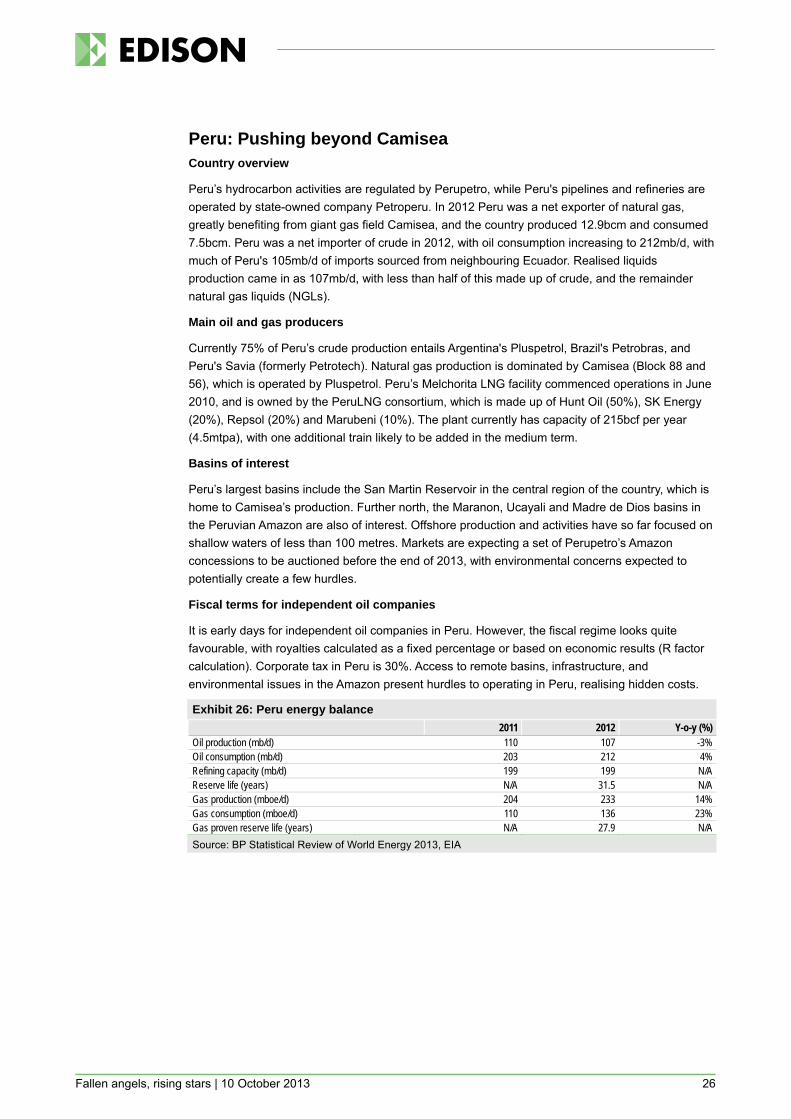
Peru: Pushing beyond Camisea Country overview
Peru’s hydrocarbon activities are regulated by Perupetro, while Peru's pipelines and refineries are operated by state-owned company Petroperu. In 2012 Peru was a net exporter of natural gas, greatly benefiting from giant gas field Camisea, and the country produced 12.9bcm and consumed 7.5bcm. Peru was a net importer of crude in 2012, with oil consumption increasing to 212mb/d, with much of Peru's 105mb/d of imports sourced from neighbouring Ecuador. Realised liquids production came in as 107mb/d, with less than half of this made up of crude, and the remainder natural gas liquids (NGLs).
Main oil and gas producers
Currently 75% of Peru’s crude production entails Argentina's Pluspetrol, Brazil's Petrobras, and Peru's Savia (formerly Petrotech). Natural gas production is dominated by Camisea (Block 88 and 56), which is operated by Pluspetrol. Peru’s Melchorita LNG facility commenced operations in June 2010, and is owned by the PeruLNG consortium, which is made up of Hunt Oil (50%), SK Energy (20%), Repsol (20%) and Marubeni (10%). The plant currently has capacity of 215bcf per year (4.5mtpa), with one additional train likely to be added in the medium term.
Basins of interest
Peru’s largest basins include the San Martin Reservoir in the central region of the country, which is home to Camisea’s production. Further north, the Maranon, Ucayali and Madre de Dios basins in the Peruvian Amazon are also of interest. Offshore production and activities have so far focused on shallow waters of less than 100 metres. Markets are expecting a set of Perupetro’s Amazon concessions to be auctioned before the end of 2013, with environmental concerns expected to potentially create a few hurdles.
Fiscal terms for independent oil companies
It is early days for independent oil companies in Peru. However, the fiscal regime looks quite favourable, with royalties calculated as a fixed percentage or based on economic results (R factor calculation). Corporate tax in Peru is 30%. Access to remote basins, infrastructure, and environmental issues in the Amazon present hurdles to operating in Peru, realising hidden costs.
Exhibit 26: Peru energy balance 2011 2012 Y-o-y (%) Oil production (mb/d) 110 107 -3% Oil consumption (mb/d) 203 212 4% Refining capacity (mb/d) 199 199 N/A Reserve life (years) N/A 31.5 N/A Gas production (mboe/d) 204 233 14% Gas consumption (mboe/d) 110 136 23% Gas proven reserve life (years) N/A 27.9 N/A Source: BP Statistical Review of World Energy 2013, EIA
Fallen angels, rising stars | 10 October 2013 27
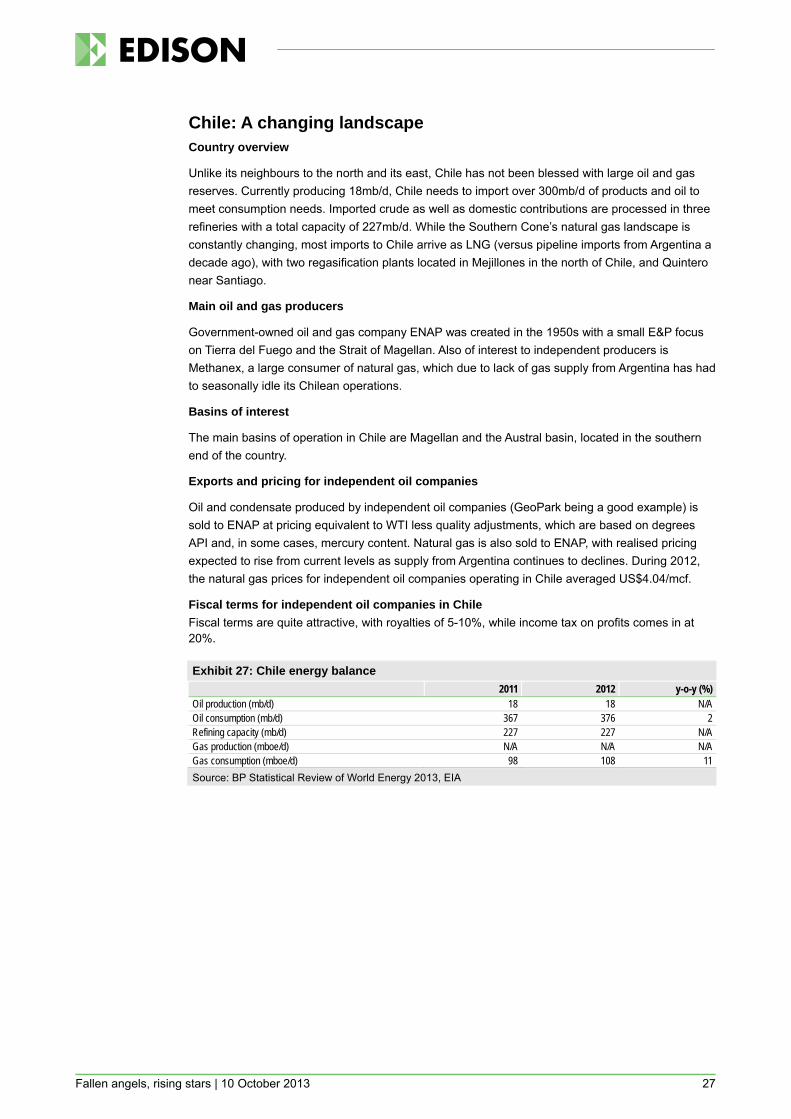
Chile: A changing landscape Country overview
Unlike its neighbours to the north and its east, Chile has not been blessed with large oil and gas reserves. Currently producing 18mb/d, Chile needs to import over 300mb/d of products and oil to meet consumption needs. Imported crude as well as domestic contributions are processed in three refineries with a total capacity of 227mb/d. While the Southern Cone’s natural gas landscape is constantly changing, most imports to Chile arrive as LNG (versus pipeline imports from Argentina a decade ago), with two regasification plants located in Mejillones in the north of Chile, and Quintero near Santiago.
Main oil and gas producers
Government-owned oil and gas company ENAP was created in the 1950s with a small E&P focus on Tierra del Fuego and the Strait of Magellan. Also of interest to independent producers is Methanex, a large consumer of natural gas, which due to lack of gas supply from Argentina has had to seasonally idle its Chilean operations.
Basins of interest
The main basins of operation in Chile are Magellan and the Austral basin, located in the southern end of the country.
Exports and pricing for independent oil companies
Oil and condensate produced by independent oil companies (GeoPark being a good example) is sold to ENAP at pricing equivalent to WTI less quality adjustments, which are based on degrees API and, in some cases, mercury content. Natural gas is also sold to ENAP, with realised pricing expected to rise from current levels as supply from Argentina continues to declines. During 2012, the natural gas prices for independent oil companies operating in Chile averaged US$4.04/mcf.
Fiscal terms for independent oil companies in Chile Fiscal terms are quite attractive, with royalties of 5-10%, while income tax on profits comes in at 20%.
Exhibit 27: Chile energy balance 2011 2012 y-o-y (%) Oil production (mb/d) 18 18 N/A Oil consumption (mb/d) 367 376 2 Refining capacity (mb/d) 227 227 N/A Gas production (mboe/d) N/A N/A N/A Gas consumption (mboe/d) 98 108 11 Source: BP Statistical Review of World Energy 2013, EIA
Fallen angels, rising stars | 10 October 2013 28
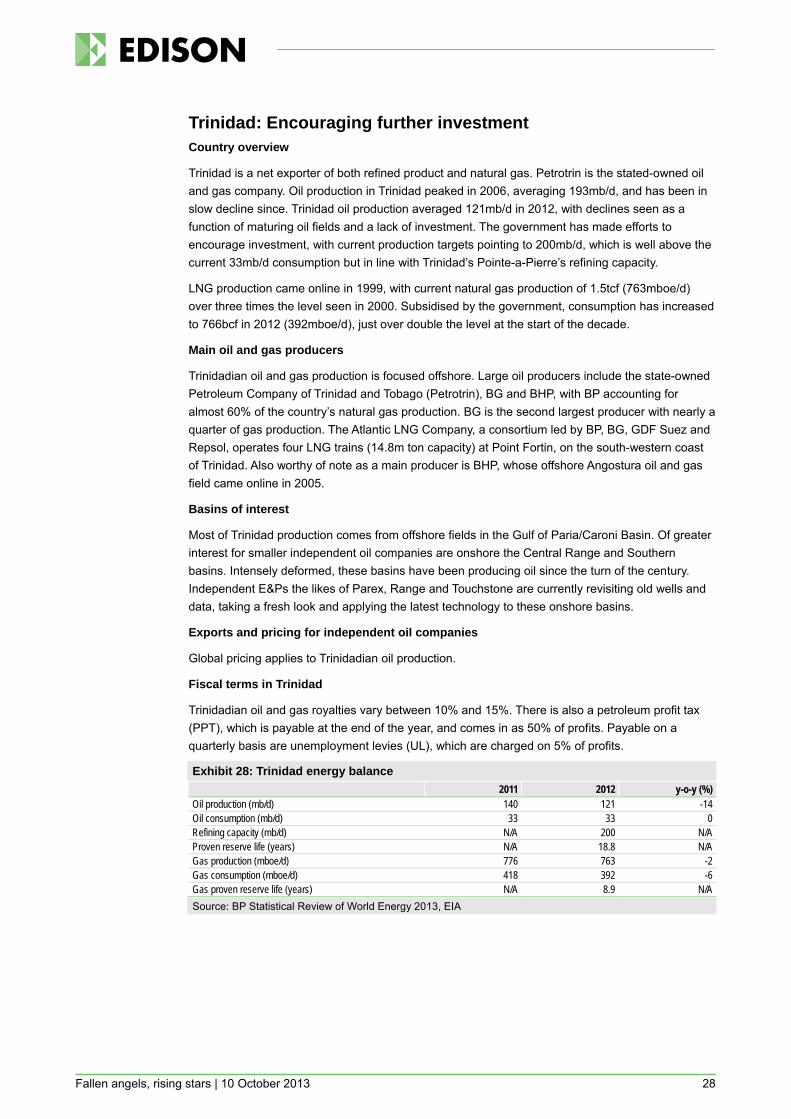
Trinidad: Encouraging further investment Country overview
Trinidad is a net exporter of both refined product and natural gas. Petrotrin is the stated-owned oil and gas company. Oil production in Trinidad peaked in 2006, averaging 193mb/d, and has been in slow decline since. Trinidad oil production averaged 121mb/d in 2012, with declines seen as a function of maturing oil fields and a lack of investment. The government has made efforts to encourage investment, with current production targets pointing to 200mb/d, which is well above the current 33mb/d consumption but in line with Trinidad’s Pointe-a-Pierre’s refining capacity.
LNG production came online in 1999, with current natural gas production of 1.5tcf (763mboe/d) over three times the level seen in 2000. Subsidised by the government, consumption has increased to 766bcf in 2012 (392mboe/d), just over double the level at the start of the decade.
Main oil and gas producers
Trinidadian oil and gas production is focused offshore. Large oil producers include the state-owned Petroleum Company of Trinidad and Tobago (Petrotrin), BG and BHP, with BP accounting for almost 60% of the country’s natural gas production. BG is the second largest producer with nearly a quarter of gas production. The Atlantic LNG Company, a consortium led by BP, BG, GDF Suez and Repsol, operates four LNG trains (14.8m ton capacity) at Point Fortin, on the south-western coast of Trinidad. Also worthy of note as a main producer is BHP, whose offshore Angostura oil and gas field came online in 2005.
Basins of interest
Most of Trinidad production comes from offshore fields in the Gulf of Paria/Caroni Basin. Of greater interest for smaller independent oil companies are onshore the Central Range and Southern basins. Intensely deformed, these basins have been producing oil since the turn of the century. Independent E&Ps the likes of Parex, Range and Touchstone are currently revisiting old wells and data, taking a fresh look and applying the latest technology to these onshore basins.
Exports and pricing for independent oil companies
Global pricing applies to Trinidadian oil production.
Fiscal terms in Trinidad
Trinidadian oil and gas royalties vary between 10% and 15%. There is also a petroleum profit tax (PPT), which is payable at the end of the year, and comes in as 50% of profits. Payable on a quarterly basis are unemployment levies (UL), which are charged on 5% of profits.
Exhibit 28: Trinidad energy balance 2011 2012 y-o-y (%) Oil production (mb/d) 140 121 -14 Oil consumption (mb/d) 33 33 0 Refining capacity (mb/d) N/A 200 N/A Proven reserve life (years) N/A 18.8 N/A Gas production (mboe/d) 776 763 -2 Gas consumption (mboe/d) 418 392 -6 Gas proven reserve life (years) N/A 8.9 N/A Source: BP Statistical Review of World Energy 2013, EIA
Fallen angels, rising stars | 10 October 2013 29
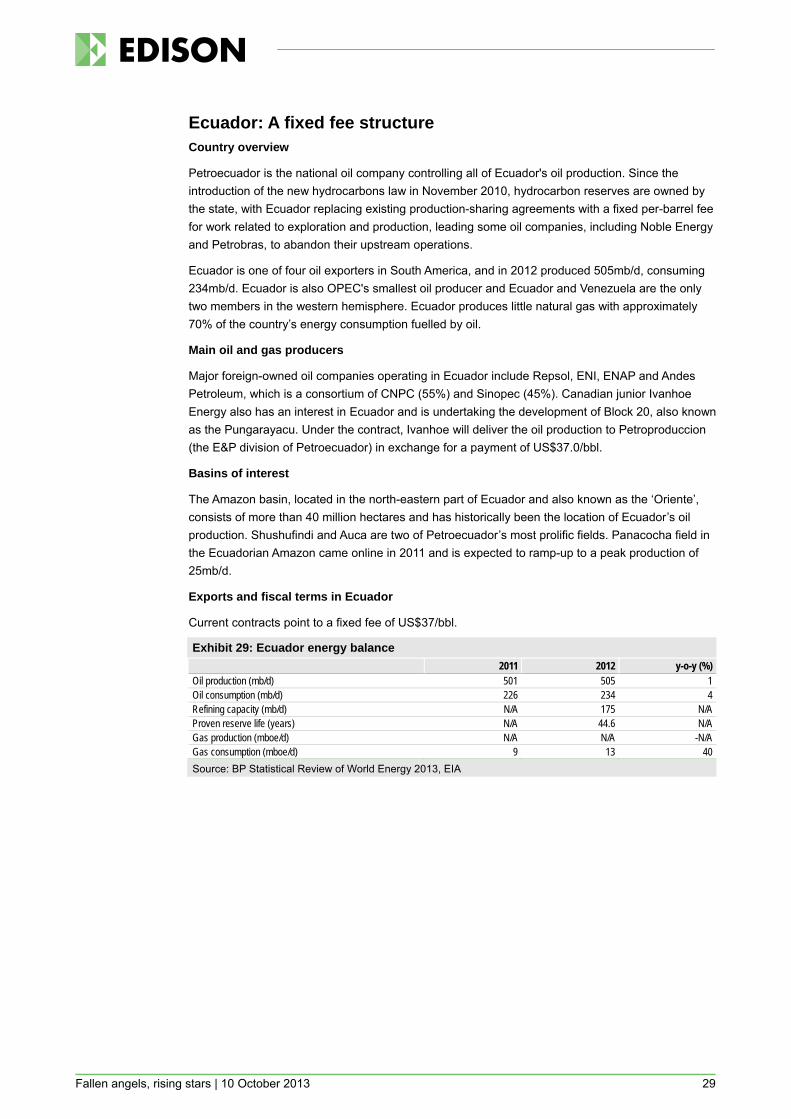
Ecuador: A fixed fee structure Country overview
Petroecuador is the national oil company controlling all of Ecuador's oil production. Since the introduction of the new hydrocarbons law in November 2010, hydrocarbon reserves are owned by the state, with Ecuador replacing existing production-sharing agreements with a fixed per-barrel fee for work related to exploration and production, leading some oil companies, including Noble Energy and Petrobras, to abandon their upstream operations.
Ecuador is one of four oil exporters in South America, and in 2012 produced 505mb/d, consuming 234mb/d. Ecuador is also OPEC's smallest oil producer and Ecuador and Venezuela are the only two members in the western hemisphere. Ecuador produces little natural gas with approximately 70% of the country’s energy consumption fuelled by oil.
Main oil and gas producers
Major foreign-owned oil companies operating in Ecuador include Repsol, ENI, ENAP and Andes Petroleum, which is a consortium of CNPC (55%) and Sinopec (45%). Canadian junior Ivanhoe Energy also has an interest in Ecuador and is undertaking the development of Block 20, also known as the Pungarayacu. Under the contract, Ivanhoe will deliver the oil production to Petroproduccion (the E&P division of Petroecuador) in exchange for a payment of US$37.0/bbl.
Basins of interest
The Amazon basin, located in the north-eastern part of Ecuador and also known as the ‘Oriente’, consists of more than 40 million hectares and has historically been the location of Ecuador’s oil production. Shushufindi and Auca are two of Petroecuador’s most prolific fields. Panacocha field in the Ecuadorian Amazon came online in 2011 and is expected to ramp-up to a peak production of 25mb/d.
Exports and fiscal terms in Ecuador
Current contracts point to a fixed fee of US$37/bbl.
Exhibit 29: Ecuador energy balance 2011 2012 y-o-y (%) Oil production (mb/d) 501 505 1 Oil consumption (mb/d) 226 234 4 Refining capacity (mb/d) N/A 175 N/A Proven reserve life (years) N/A 44.6 N/A Gas production (mboe/d) N/A N/A -N/A Gas consumption (mboe/d) 9 13 40 Source: BP Statistical Review of World Energy 2013, EIA
Fallen angels, rising stars | 10 October 2013 30
Paraguay: A new beginning Country overview
A large producer and exporter of hydroelectric energy, Paraguay has had little success with oil and gas production, which is unusual given the fortunes of its immediate neighbours Argentina to the south and Bolivia to the west. Currently lacking booked oil and gas reserves and with few wells drilled over the past 25 years President, Amerisur and Sintana Energy are among a handful of independent oil companies taking a fresh look at the potential of Paraguay’s basins.
Paraguay’s current liquid consumption comes in as 28mb/d. State-owned Petropar controls all oil and product sales and imports and is the operator of Paraguay's 7.5mb/d refinery Villa Elisa, near the capital, Asuncion.
Basins of interest
Paraguay’s portion of the Pirity Basin, which extends into Argentina to the south, is largely unexplored north of the Argentinian border, with production well established south of the border in Argentina, and potentially of most interest. Seen as a direct extension of Argentina’s Olmedo Sub-Basin, independent estimates of Pirity point to a potential of over 4bnboe.
Chaco basin, which extends into Bolivia, and the Parana basin, which straddles the border of Brazil and Paraguay, are also of interest, with the unconventional oil and gas potential of these basins being explored.
Exports and pricing for independent oil companies
Little export infrastructure currently exists in Paraguay, which is expected to be a challenge should oil and gas production be successful. Argentina’s decline in production and increased consumption is seen as a large opportunity for independent oil companies, with nearby Argentina seen as a lucrative export market for both oil and gas.
Fiscal terms in Paraguay
Paraguay can boast attractive royalty rates of 10% for production under 5mb/d increasing to 14% for production over 50mb/d. Companies receive international pricing at the wellhead, indexed to Brent, and a flat tax of 10% exists on profits.
Fallen angels, rising stars | 10 October 2013 31
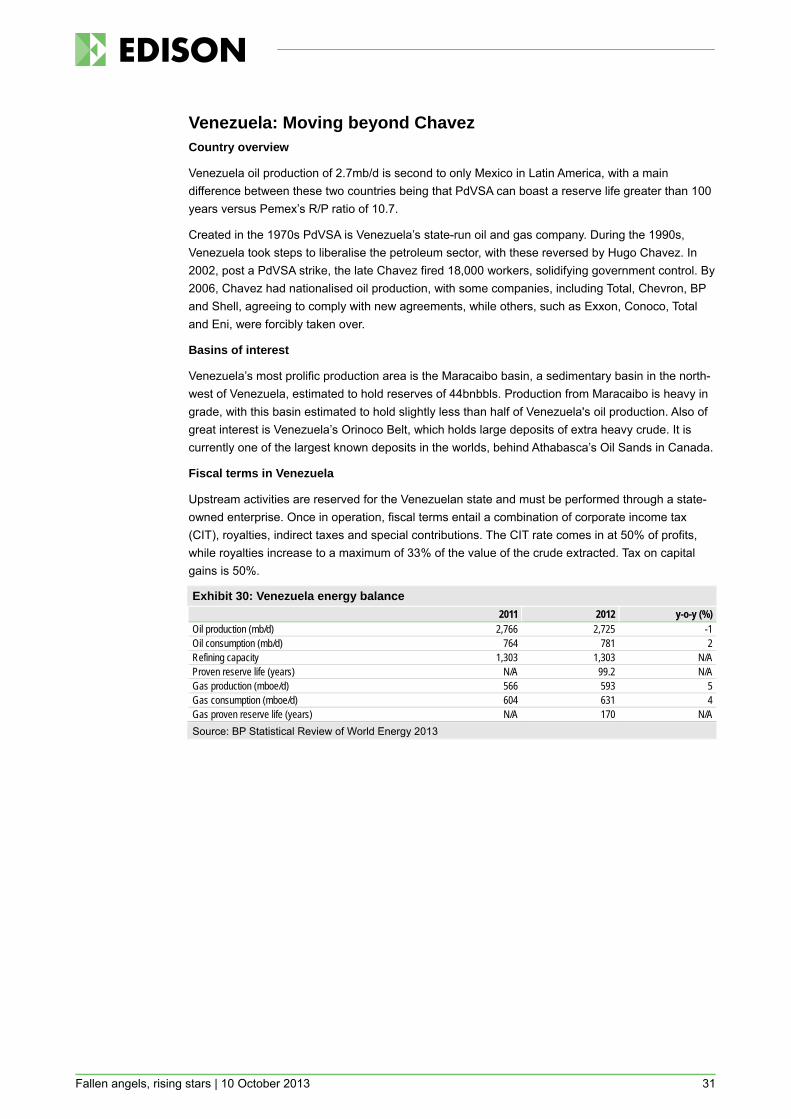
Venezuela: Moving beyond Chavez Country overview
Venezuela oil production of 2.7mb/d is second to only Mexico in Latin America, with a main difference between these two countries being that PdVSA can boast a reserve life greater than 100 years versus Pemex’s R/P ratio of 10.7.
Created in the 1970s PdVSA is Venezuela’s state-run oil and gas company. During the 1990s, Venezuela took steps to liberalise the petroleum sector, with these reversed by Hugo Chavez. In 2002, post a PdVSA strike, the late Chavez fired 18,000 workers, solidifying government control. By 2006, Chavez had nationalised oil production, with some companies, including Total, Chevron, BP and Shell, agreeing to comply with new agreements, while others, such as Exxon, Conoco, Total and Eni, were forcibly taken over.
Basins of interest
Venezuela’s most prolific production area is the Maracaibo basin, a sedimentary basin in the north-west of Venezuela, estimated to hold reserves of 44bnbbls. Production from Maracaibo is heavy in grade, with this basin estimated to hold slightly less than half of Venezuela's oil production. Also of great interest is Venezuela’s Orinoco Belt, which holds large deposits of extra heavy crude. It is currently one of the largest known deposits in the worlds, behind Athabasca’s Oil Sands in Canada.
Fiscal terms in Venezuela
Upstream activities are reserved for the Venezuelan state and must be performed through a state-owned enterprise. Once in operation, fiscal terms entail a combination of corporate income tax (CIT), royalties, indirect taxes and special contributions. The CIT rate comes in at 50% of profits, while royalties increase to a maximum of 33% of the value of the crude extracted. Tax on capital gains is 50%.
Exhibit 30: Venezuela energy balance 2011 2012 y-o-y (%)
Oil production (mb/d) 2,766 2,725 -1 Oil consumption (mb/d) 764 781 2 Refining capacity 1,303 1,303 N/A Proven reserve life (years) N/A 99.2 N/A Gas production (mboe/d) 566 593 5 Gas consumption (mboe/d) 604 631 4 Gas proven reserve life (years) N/A 170 N/A Source: BP Statistical Review of World Energy 2013
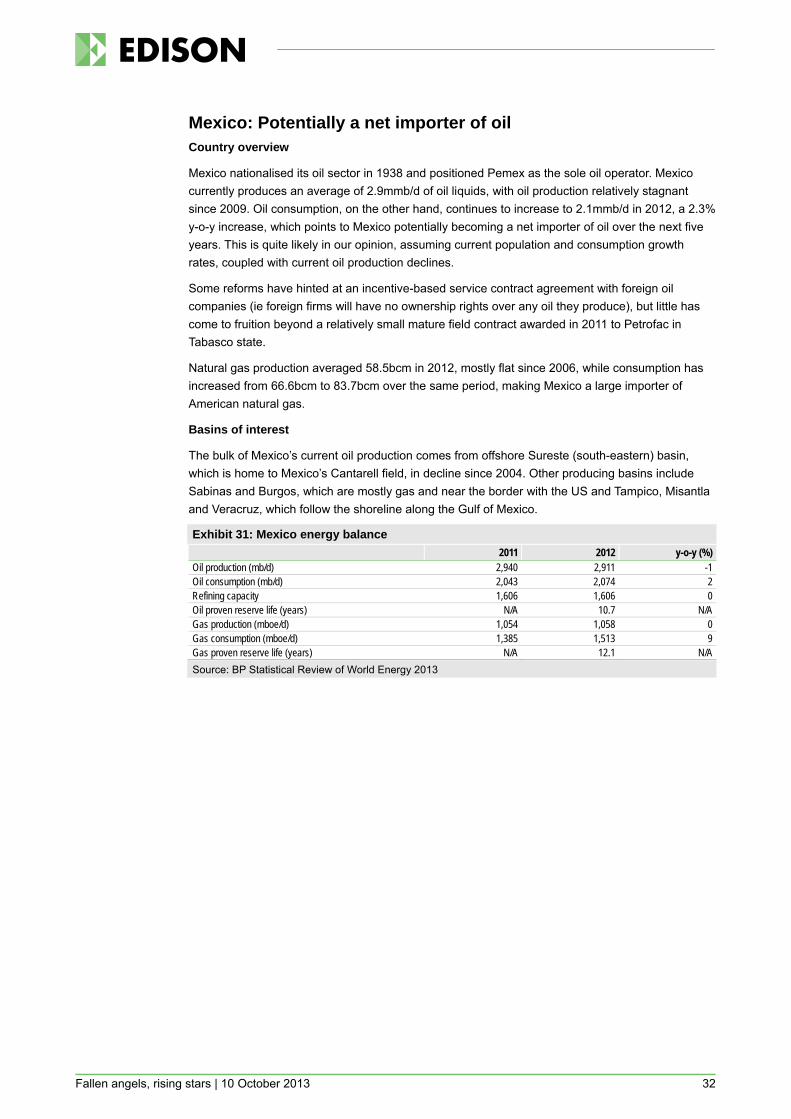
Fallen angels, rising stars | 10 October 2013 32
Mexico: Potentially a net importer of oil Country overview
Mexico nationalised its oil sector in 1938 and positioned Pemex as the sole oil operator. Mexico currently produces an average of 2.9mmb/d of oil liquids, with oil production relatively stagnant since 2009. Oil consumption, on the other hand, continues to increase to 2.1mmb/d in 2012, a 2.3% y-o-y increase, which points to Mexico potentially becoming a net importer of oil over the next five years. This is quite likely in our opinion, assuming current population and consumption growth rates, coupled with current oil production declines.
Some reforms have hinted at an incentive-based service contract agreement with foreign oil companies (ie foreign firms will have no ownership rights over any oil they produce), but little has come to fruition beyond a relatively small mature field contract awarded in 2011 to Petrofac in Tabasco state.
Natural gas production averaged 58.5bcm in 2012, mostly flat since 2006, while consumption has increased from 66.6bcm to 83.7bcm over the same period, making Mexico a large importer of American natural gas.
Basins of interest
The bulk of Mexico’s current oil production comes from offshore Sureste (south-eastern) basin, which is home to Mexico’s Cantarell field, in decline since 2004. Other producing basins include Sabinas and Burgos, which are mostly gas and near the border with the US and Tampico, Misantla and Veracruz, which follow the shoreline along the Gulf of Mexico.
Exhibit 31: Mexico energy balance 2011 2012 y-o-y (%) Oil production (mb/d) 2,940 2,911 -1 Oil consumption (mb/d) 2,043 2,074 2 Refining capacity 1,606 1,606 0 Oil proven reserve life (years) N/A 10.7 N/A Gas production (mboe/d) 1,054 1,058 0 Gas consumption (mboe/d) 1,385 1,513 9 Gas proven reserve life (years) N/A 12.1 N/A Source: BP Statistical Review of World Energy 2013
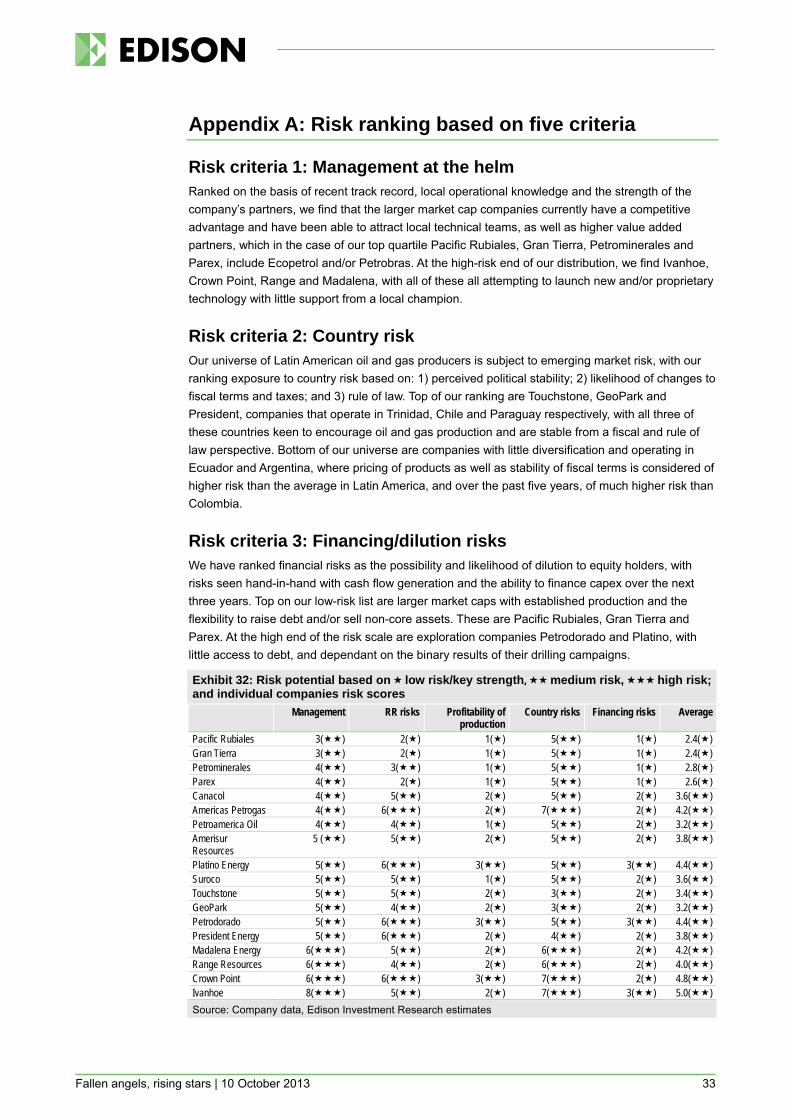
Fallen angels, rising stars | 10 October 2013 33
Appendix A: Risk ranking based on five criteria
Risk criteria 1: Management at the helm Ranked on the basis of recent track record, local operational knowledge and the strength of the company’s partners, we find that the larger market cap companies currently have a competitive advantage and have been able to attract local technical teams, as well as higher value added partners, which in the case of our top quartile Pacific Rubiales, Gran Tierra, Petrominerales and Parex, include Ecopetrol and/or Petrobras. At the high-risk end of our distribution, we find Ivanhoe, Crown Point, Range and Madalena, with all of these all attempting to launch new and/or proprietary technology with little support from a local champion.
Risk criteria 2: Country risk Our universe of Latin American oil and gas producers is subject to emerging market risk, with our ranking exposure to country risk based on: 1) perceived political stability; 2) likelihood of changes to fiscal terms and taxes; and 3) rule of law. Top of our ranking are Touchstone, GeoPark and President, companies that operate in Trinidad, Chile and Paraguay respectively, with all three of these countries keen to encourage oil and gas production and are stable from a fiscal and rule of law perspective. Bottom of our universe are companies with little diversification and operating in Ecuador and Argentina, where pricing of products as well as stability of fiscal terms is considered of higher risk than the average in Latin America, and over the past five years, of much higher risk than Colombia.
Risk criteria 3: Financing/dilution risks We have ranked financial risks as the possibility and likelihood of dilution to equity holders, with risks seen hand-in-hand with cash flow generation and the ability to finance capex over the next three years. Top on our low-risk list are larger market caps with established production and the flexibility to raise debt and/or sell non-core assets. These are Pacific Rubiales, Gran Tierra and Parex. At the high end of the risk scale are exploration companies Petrodorado and Platino, with little access to debt, and dependant on the binary results of their drilling campaigns.
Exhibit 32: Risk potential based on low risk/key strength, medium risk, high risk; and individual companies risk scores Management RR risks Profitability of
production Country risks Financing risks Average
Pacific Rubiales 3() 2() 1() 5() 1() 2.4() Gran Tierra 3() 2() 1() 5() 1() 2.4() Petrominerales 4() 3() 1() 5() 1() 2.8() Parex 4() 2() 1() 5() 1() 2.6() Canacol 4() 5() 2() 5() 2() 3.6() Americas Petrogas 4() 6() 2() 7() 2() 4.2() Petroamerica Oil 4() 4() 1() 5() 2() 3.2() Amerisur Resources
5 () 5() 2() 5() 2() 3.8()
Platino Energy 5() 6() 3() 5() 3() 4.4() Suroco 5() 5() 1() 5() 2() 3.6() Touchstone 5() 5() 2() 3() 2() 3.4() GeoPark 5() 4() 2() 3() 2() 3.2() Petrodorado 5() 6() 3() 5() 3() 4.4() President Energy 5() 6() 2() 4() 2() 3.8() Madalena Energy 6() 5() 2() 6() 2() 4.2() Range Resources 6() 4() 2() 6() 2() 4.0() Crown Point 6() 6() 3() 7() 2() 4.8() Ivanhoe 8() 5() 2() 7() 3() 5.0() Source: Company data, Edison Investment Research estimates
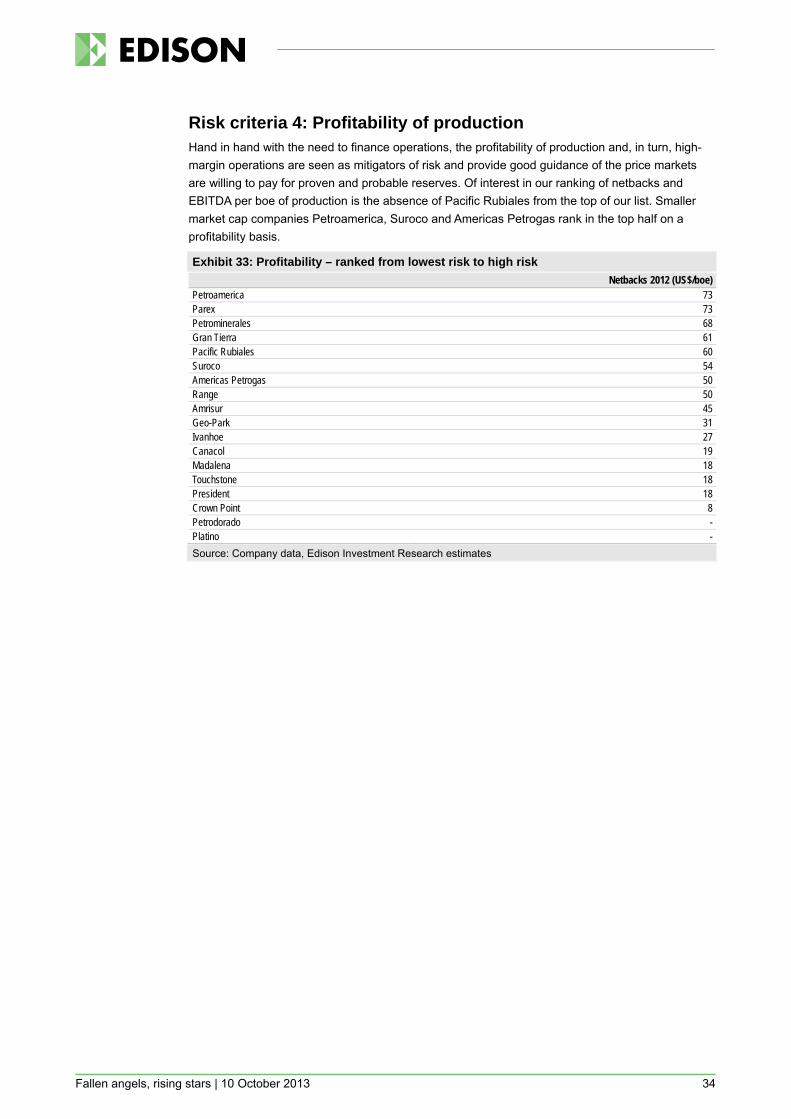
Fallen angels, rising stars | 10 October 2013 34
Risk criteria 4: Profitability of production Hand in hand with the need to finance operations, the profitability of production and, in turn, high-margin operations are seen as mitigators of risk and provide good guidance of the price markets are willing to pay for proven and probable reserves. Of interest in our ranking of netbacks and EBITDA per boe of production is the absence of Pacific Rubiales from the top of our list. Smaller market cap companies Petroamerica, Suroco and Americas Petrogas rank in the top half on a profitability basis.
Exhibit 33: Profitability – ranked from lowest risk to high risk Netbacks 2012 (US$/boe)
Petroamerica 73 Parex 73 Petrominerales 68 Gran Tierra 61 Pacific Rubiales 60 Suroco 54 Americas Petrogas 50 Range 50 Amrisur 45 Geo-Park 31 Ivanhoe 27 Canacol 19 Madalena 18 Touchstone 18 President 18 Crown Point 8 Petrodorado - Platino - Source: Company data, Edison Investment Research estimates
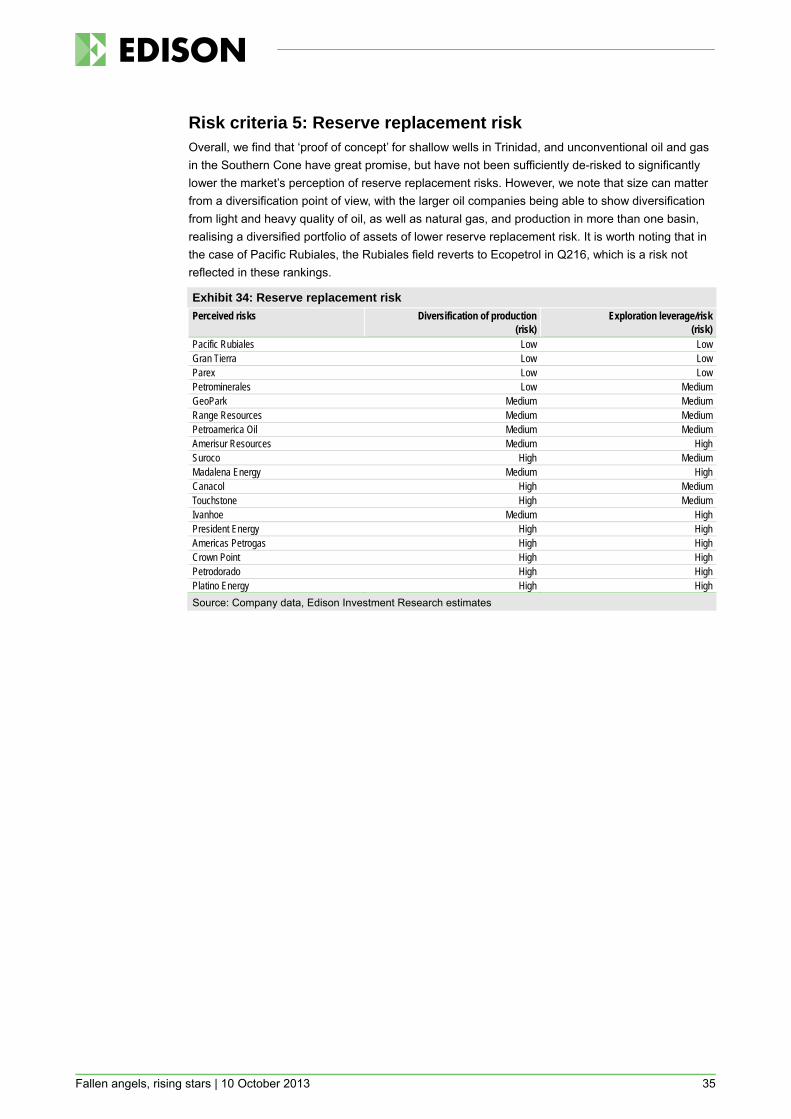
Fallen angels, rising stars | 10 October 2013 35
Risk criteria 5: Reserve replacement risk Overall, we find that ‘proof of concept’ for shallow wells in Trinidad, and unconventional oil and gas in the Southern Cone have great promise, but have not been sufficiently de-risked to significantly lower the market’s perception of reserve replacement risks. However, we note that size can matter from a diversification point of view, with the larger oil companies being able to show diversification from light and heavy quality of oil, as well as natural gas, and production in more than one basin, realising a diversified portfolio of assets of lower reserve replacement risk. It is worth noting that in the case of Pacific Rubiales, the Rubiales field reverts to Ecopetrol in Q216, which is a risk not reflected in these rankings.
Exhibit 34: Reserve replacement risk Perceived risks Diversification of production
(risk) Exploration leverage/risk
(risk) Pacific Rubiales Low Low Gran Tierra Low Low Parex Low Low Petrominerales Low Medium GeoPark Medium Medium Range Resources Medium Medium Petroamerica Oil Medium Medium Amerisur Resources Medium High Suroco High Medium Madalena Energy Medium High Canacol High Medium Touchstone High Medium Ivanhoe Medium High President Energy High High Americas Petrogas High High Crown Point High High Petrodorado High High Platino Energy High High Source: Company data, Edison Investment Research estimates
Fallen angels, rising stars | 10 October 2013 36
Company profiles
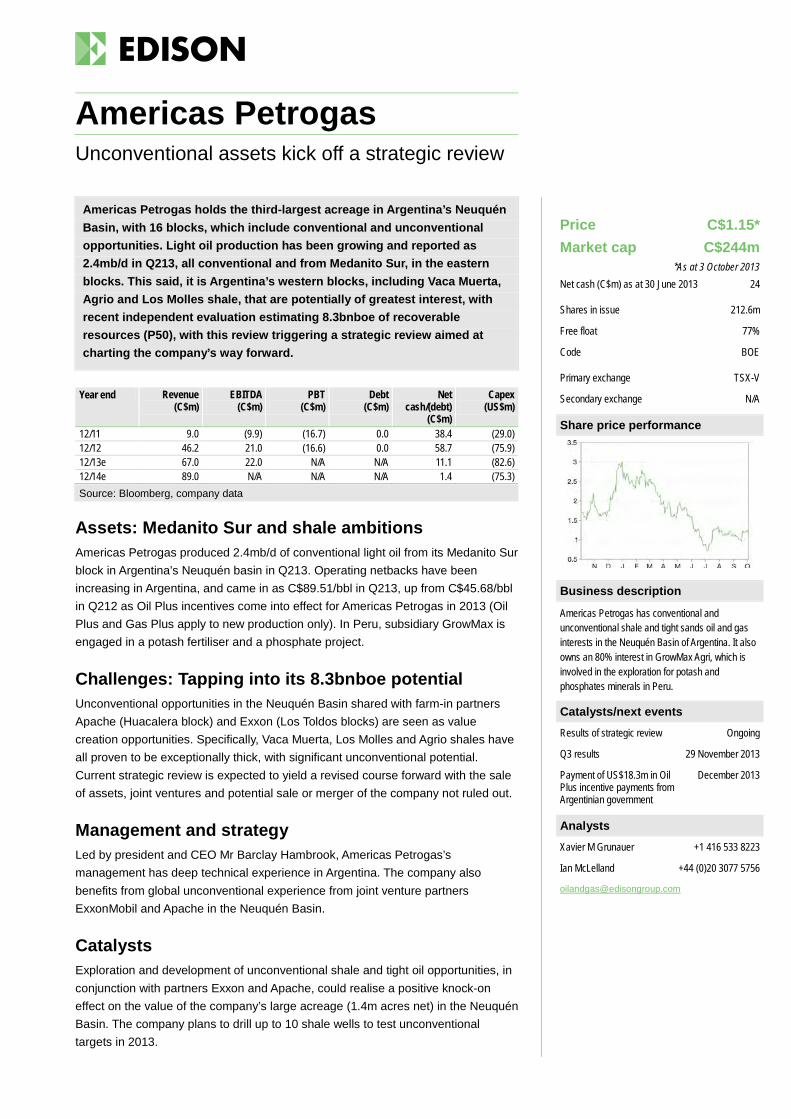
Americas Petrogas holds the third-largest acreage in Argentina’s Neuquén Basin, with 16 blocks, which include conventional and unconventional opportunities. Light oil production has been growing and reported as 2.4mb/d in Q213, all conventional and from Medanito Sur, in the eastern blocks. This said, it is Argentina’s western blocks, including Vaca Muerta, Agrio and Los Molles shale, that are potentially of greatest interest, with recent independent evaluation estimating 8.3bnboe of recoverable resources (P50), with this review triggering a strategic review aimed at charting the company’s way forward.
Year end Revenue (C$m)
EBITDA (C$m)
PBT (C$m)
Debt (C$m)
Net cash/(debt)
(C$m)
Capex (US$m)
12/11 9.0 (9.9) (16.7) 0.0 38.4 (29.0) 12/12 46.2 21.0 (16.6) 0.0 58.7 (75.9) 12/13e 67.0 22.0 N/A N/A 11.1 (82.6) 12/14e 89.0 N/A N/A N/A 1.4 (75.3) Source: Bloomberg, company data
Assets: Medanito Sur and shale ambitions Americas Petrogas produced 2.4mb/d of conventional light oil from its Medanito Sur block in Argentina’s Neuquén basin in Q213. Operating netbacks have been increasing in Argentina, and came in as C$89.51/bbl in Q213, up from C$45.68/bbl in Q212 as Oil Plus incentives come into effect for Americas Petrogas in 2013 (Oil Plus and Gas Plus apply to new production only). In Peru, subsidiary GrowMax is engaged in a potash fertiliser and a phosphate project.
Challenges: Tapping into its 8.3bnboe potential Unconventional opportunities in the Neuquén Basin shared with farm-in partners Apache (Huacalera block) and Exxon (Los Toldos blocks) are seen as value creation opportunities. Specifically, Vaca Muerta, Los Molles and Agrio shales have all proven to be exceptionally thick, with significant unconventional potential. Current strategic review is expected to yield a revised course forward with the sale of assets, joint ventures and potential sale or merger of the company not ruled out.
Management and strategy Led by president and CEO Mr Barclay Hambrook, Americas Petrogas’s management has deep technical experience in Argentina. The company also benefits from global unconventional experience from joint venture partners ExxonMobil and Apache in the Neuquén Basin.
Catalysts Exploration and development of unconventional shale and tight oil opportunities, in conjunction with partners Exxon and Apache, could realise a positive knock-on effect on the value of the company’s large acreage (1.4m acres net) in the Neuquén Basin. The company plans to drill up to 10 shale wells to test unconventional targets in 2013.
Americas Petrogas Unconventional assets kick off a strategic review
Price C$1.15* Market cap C$244m
*As at 3 October 2013 Net cash (C$m) as at 30 June 2013 24
Shares in issue 212.6m
Free float 77%
Code BOE
Primary exchange TSX-V
Secondary exchange N/A
Share price performance
Business description
Americas Petrogas has conventional and unconventional shale and tight sands oil and gas interests in the Neuquén Basin of Argentina. It also owns an 80% interest in GrowMax Agri, which is involved in the exploration for potash and phosphates minerals in Peru.
Catalysts/next events
Results of strategic review Ongoing
Q3 results 29 November 2013
Payment of US$18.3m in Oil Plus incentive payments from Argentinian government
December 2013
Analysts
Xavier M Grunauer +1 416 533 8223
Ian McLelland +44 (0)20 3077 5756
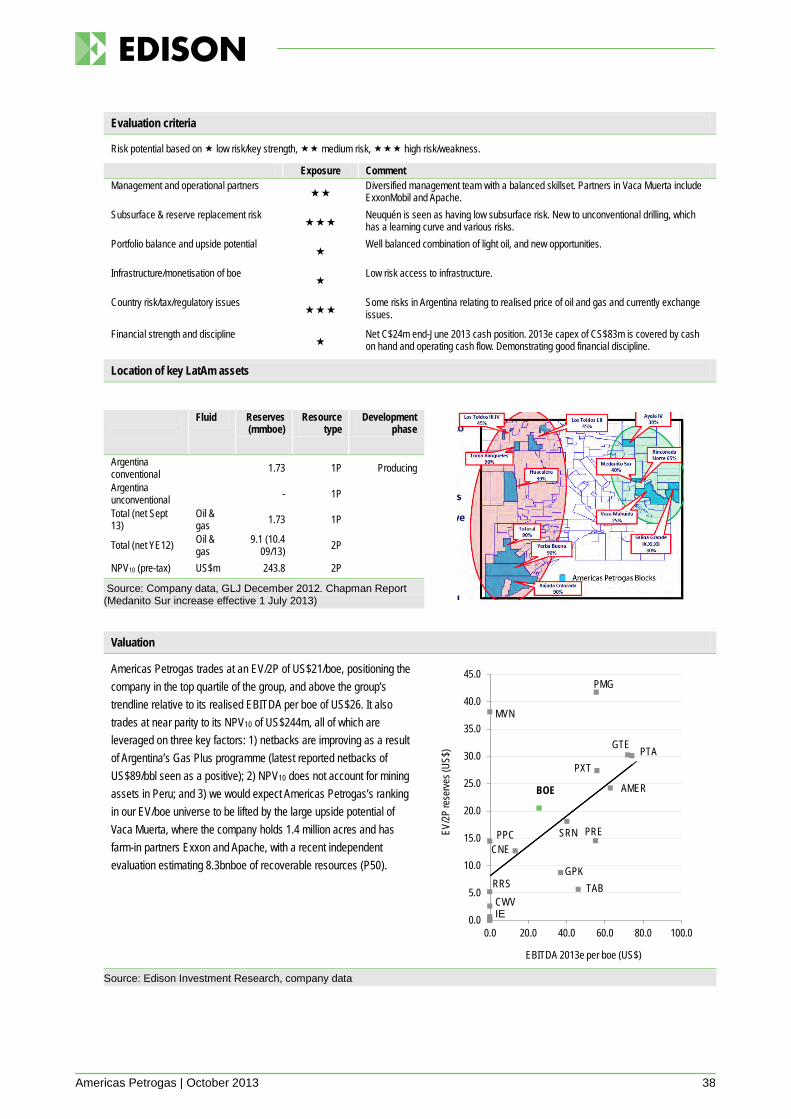
Americas Petrogas | October 2013 38
Evaluation criteria
Risk potential based on low risk/key strength, medium risk, high risk/weakness.
Exposure Comment Management and operational partners
Diversified management team with a balanced skillset. Partners in Vaca Muerta include ExxonMobil and Apache.
Subsurface & reserve replacement risk
Neuquén is seen as having low subsurface risk. New to unconventional drilling, which has a learning curve and various risks.
Portfolio balance and upside potential
Well balanced combination of light oil, and new opportunities.
Infrastructure/monetisation of boe
Low risk access to infrastructure.
Country risk/tax/regulatory issues
Some risks in Argentina relating to realised price of oil and gas and currently exchange issues.
Financial strength and discipline
Net C$24m end-June 2013 cash position. 2013e capex of CS$83m is covered by cash on hand and operating cash flow. Demonstrating good financial discipline.
Location of key LatAm assets
Source: Company data, GLJ December 2012. Chapman Report (Medanito Sur increase effective 1 July 2013)
Fluid Reserves (mmboe)
Resource type
Development phase
Argentina conventional 1.73 1P Producing
Argentina unconventional - 1P Total (net Sept 13)
Oil & gas 1.73 1P
Total (net YE12) Oil & gas
9.1 (10.4 09/13) 2P
NPV10 (pre-tax) US$m 243.8 2P
Valuation
Americas Petrogas trades at an EV/2P of US$21/boe, positioning the company in the top quartile of the group, and above the group’s trendline relative to its realised EBITDA per boe of US$26. It also trades at near parity to its NPV10 of US$244m, all of which are leveraged on three key factors: 1) netbacks are improving as a result of Argentina’s Gas Plus programme (latest reported netbacks of US$89/bbl seen as a positive); 2) NPV10 does not account for mining assets in Peru; and 3) we would expect Americas Petrogas’s ranking in our EV/boe universe to be lifted by the large upside potential of Vaca Muerta, where the company holds 1.4 million acres and has farm-in partners Exxon and Apache, with a recent independent evaluation estimating 8.3bnboe of recoverable resources (P50).
Source: Edison Investment Research, company data
BOE
CNE
GPK
GTE
CWV
AMER
MVN
PMG
PPC PRE
PTAPXT
RRS
SRN
TAB
0.0
5.0
10.0
15.0
20.0
25.0
30.0
35.0
40.0
45.0
0.0 20.0 40.0 60.0 80.0 100.0
EV/2P
rese
rves (
US$)
EBITDA 2013e per boe (US$)
IE
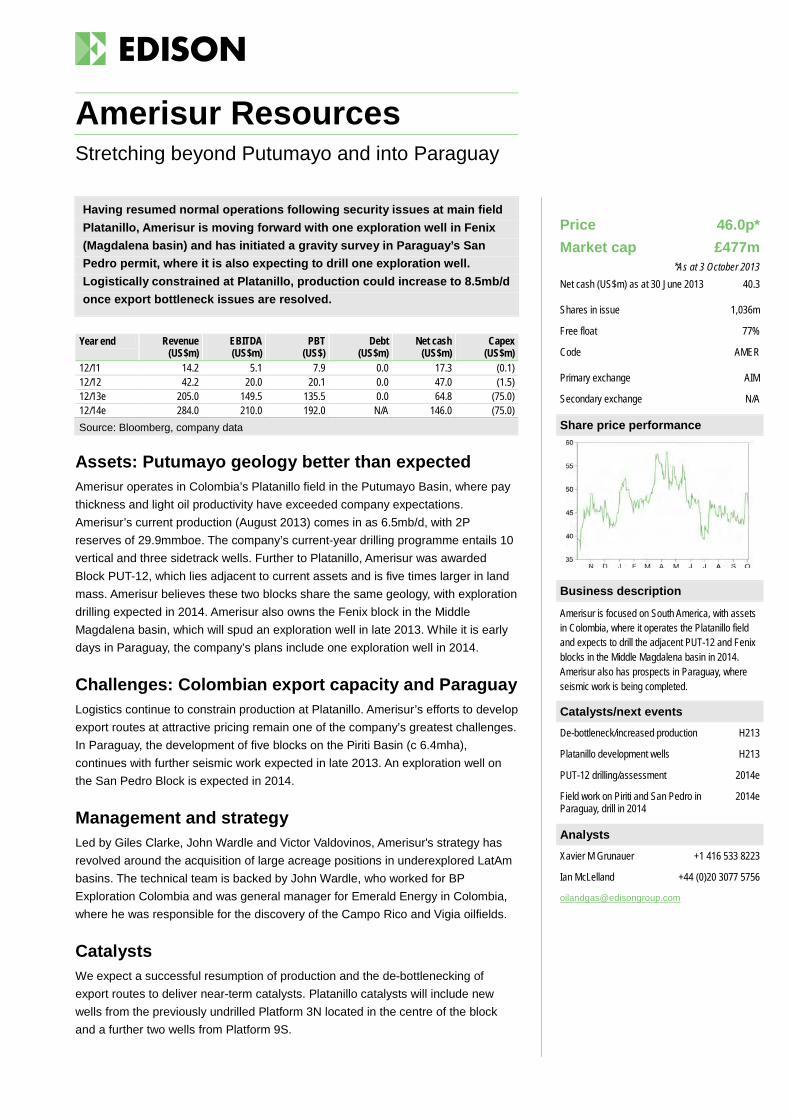
Having resumed normal operations following security issues at main field Platanillo, Amerisur is moving forward with one exploration well in Fenix (Magdalena basin) and has initiated a gravity survey in Paraguay’s San Pedro permit, where it is also expecting to drill one exploration well. Logistically constrained at Platanillo, production could increase to 8.5mb/d once export bottleneck issues are resolved.
Year end Revenue (US$m)
EBITDA (US$m)
PBT (US$)
Debt (US$m)
Net cash (US$m)
Capex (US$m)
12/11 14.2 5.1 7.9 0.0 17.3 (0.1) 12/12 42.2 20.0 20.1 0.0 47.0 (1.5) 12/13e 205.0 149.5 135.5 0.0 64.8 (75.0) 12/14e 284.0 210.0 192.0 N/A 146.0 (75.0) Source: Bloomberg, company data
Assets: Putumayo geology better than expected Amerisur operates in Colombia’s Platanillo field in the Putumayo Basin, where pay thickness and light oil productivity have exceeded company expectations. Amerisur’s current production (August 2013) comes in as 6.5mb/d, with 2P reserves of 29.9mmboe. The company’s current-year drilling programme entails 10 vertical and three sidetrack wells. Further to Platanillo, Amerisur was awarded Block PUT-12, which lies adjacent to current assets and is five times larger in land mass. Amerisur believes these two blocks share the same geology, with exploration drilling expected in 2014. Amerisur also owns the Fenix block in the Middle Magdalena basin, which will spud an exploration well in late 2013. While it is early days in Paraguay, the company’s plans include one exploration well in 2014.
Challenges: Colombian export capacity and Paraguay Logistics continue to constrain production at Platanillo. Amerisur’s efforts to develop export routes at attractive pricing remain one of the company’s greatest challenges. In Paraguay, the development of five blocks on the Piriti Basin (c 6.4mha), continues with further seismic work expected in late 2013. An exploration well on the San Pedro Block is expected in 2014.
Management and strategy Led by Giles Clarke, John Wardle and Victor Valdovinos, Amerisur's strategy has revolved around the acquisition of large acreage positions in underexplored LatAm basins. The technical team is backed by John Wardle, who worked for BP Exploration Colombia and was general manager for Emerald Energy in Colombia, where he was responsible for the discovery of the Campo Rico and Vigia oilfields.
Catalysts We expect a successful resumption of production and the de-bottlenecking of export routes to deliver near-term catalysts. Platanillo catalysts will include new wells from the previously undrilled Platform 3N located in the centre of the block and a further two wells from Platform 9S.
Amerisur Resources Stretching beyond Putumayo and into Paraguay
Price 46.0p* Market cap £477m
*As at 3 October 2013 Net cash (US$m) as at 30 June 2013 40.3
Shares in issue 1,036m
Free float 77%
Code AMER
Primary exchange AIM
Secondary exchange N/A
Share price performance
Business description
Amerisur is focused on South America, with assets in Colombia, where it operates the Platanillo field and expects to drill the adjacent PUT-12 and Fenix blocks in the Middle Magdalena basin in 2014. Amerisur also has prospects in Paraguay, where seismic work is being completed.
Catalysts/next events
De-bottleneck/increased production H213
Platanillo development wells H213
PUT-12 drilling/assessment 2014e
Field work on Piriti and San Pedro in Paraguay, drill in 2014
2014e
Analysts
Xavier M Grunauer +1 416 533 8223
Ian McLelland +44 (0)20 3077 5756
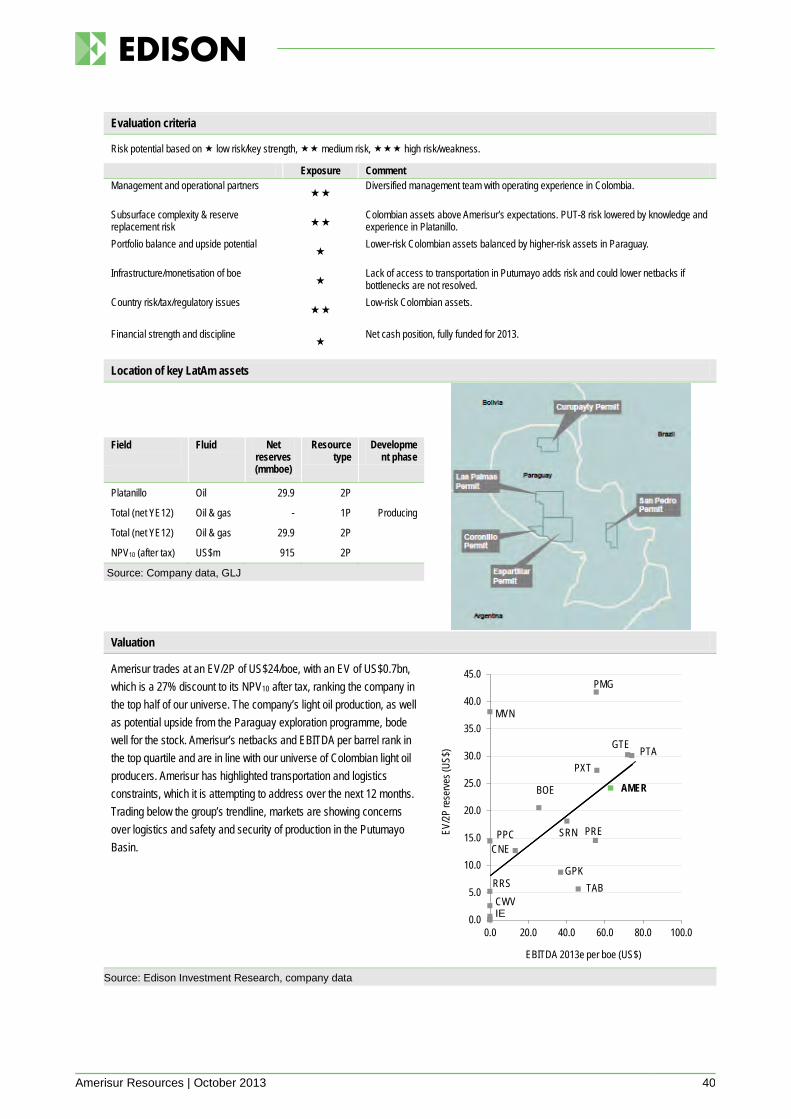
Amerisur Resources | October 2013 40
Evaluation criteria
Risk potential based on low risk/key strength, medium risk, high risk/weakness.
Exposure Comment Management and operational partners
Diversified management team with operating experience in Colombia.
Subsurface complexity & reserve replacement risk
Colombian assets above Amerisur’s expectations. PUT-8 risk lowered by knowledge and experience in Platanillo.
Portfolio balance and upside potential
Lower-risk Colombian assets balanced by higher-risk assets in Paraguay.
Infrastructure/monetisation of boe
Lack of access to transportation in Putumayo adds risk and could lower netbacks if bottlenecks are not resolved.
Country risk/tax/regulatory issues
Low-risk Colombian assets.
Financial strength and discipline
Net cash position, fully funded for 2013.
Location of key LatAm assets
Source: Company data, GLJ
Field
Fluid Net reserves (mmboe)
Resource type
Development phase
Platanillo Oil 29.9 2P
Total (net YE12) Oil & gas - 1P Producing
Total (net YE12) Oil & gas 29.9 2P NPV10 (after tax) US$m 915 2P
Valuation
Amerisur trades at an EV/2P of US$24/boe, with an EV of US$0.7bn, which is a 27% discount to its NPV10 after tax, ranking the company in the top half of our universe. The company’s light oil production, as well as potential upside from the Paraguay exploration programme, bode well for the stock. Amerisur’s netbacks and EBITDA per barrel rank in the top quartile and are in line with our universe of Colombian light oil producers. Amerisur has highlighted transportation and logistics constraints, which it is attempting to address over the next 12 months. Trading below the group’s trendline, markets are showing concerns over logistics and safety and security of production in the Putumayo Basin.
Source: Edison Investment Research, company data
BOE
CNE
GPK
GTE
CWV
AMER
MVN
PMG
PPC PRE
PTAPXT
RRS
SRN
TAB
0.0
5.0
10.0
15.0
20.0
25.0
30.0
35.0
40.0
45.0
0.0 20.0 40.0 60.0 80.0 100.0
EV/2P
rese
rves (
US$)
EBITDA 2013e per boe (US$)
IE
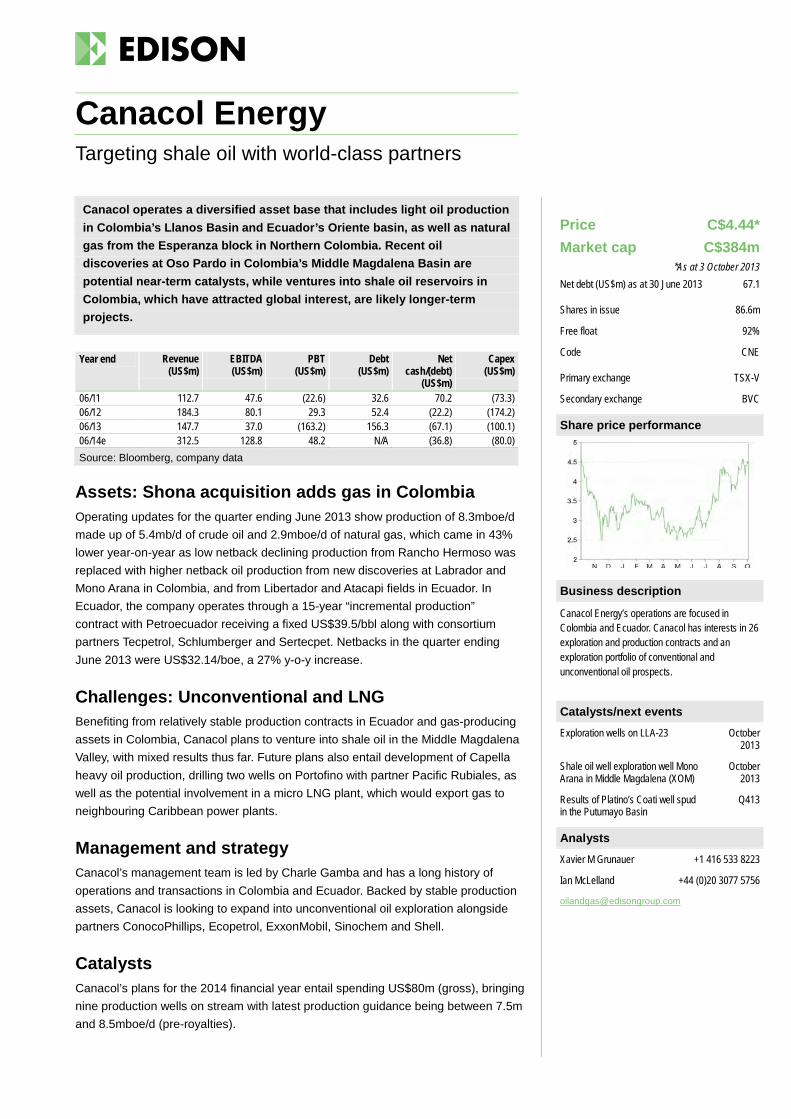
Canacol operates a diversified asset base that includes light oil production in Colombia’s Llanos Basin and Ecuador’s Oriente basin, as well as natural gas from the Esperanza block in Northern Colombia. Recent oil discoveries at Oso Pardo in Colombia’s Middle Magdalena Basin are potential near-term catalysts, while ventures into shale oil reservoirs in Colombia, which have attracted global interest, are likely longer-term projects.
Year end Revenue (US$m)
EBITDA (US$m)
PBT (US$m)
Debt (US$m)
Net cash/(debt)
(US$m)
Capex (US$m)
06/11 112.7 47.6 (22.6) 32.6 70.2 (73.3) 06/12 184.3 80.1 29.3 52.4 (22.2) (174.2) 06/13 147.7 37.0 (163.2) 156.3 (67.1) (100.1) 06/14e 312.5 128.8 48.2 N/A (36.8) (80.0) Source: Bloomberg, company data
Assets: Shona acquisition adds gas in Colombia Operating updates for the quarter ending June 2013 show production of 8.3mboe/d made up of 5.4mb/d of crude oil and 2.9mboe/d of natural gas, which came in 43% lower year-on-year as low netback declining production from Rancho Hermoso was replaced with higher netback oil production from new discoveries at Labrador and Mono Arana in Colombia, and from Libertador and Atacapi fields in Ecuador. In Ecuador, the company operates through a 15-year “incremental production” contract with Petroecuador receiving a fixed US$39.5/bbl along with consortium partners Tecpetrol, Schlumberger and Sertecpet. Netbacks in the quarter ending June 2013 were US$32.14/boe, a 27% y-o-y increase.
Challenges: Unconventional and LNG Benefiting from relatively stable production contracts in Ecuador and gas-producing assets in Colombia, Canacol plans to venture into shale oil in the Middle Magdalena Valley, with mixed results thus far. Future plans also entail development of Capella heavy oil production, drilling two wells on Portofino with partner Pacific Rubiales, as well as the potential involvement in a micro LNG plant, which would export gas to neighbouring Caribbean power plants.
Management and strategy Canacol’s management team is led by Charle Gamba and has a long history of operations and transactions in Colombia and Ecuador. Backed by stable production assets, Canacol is looking to expand into unconventional oil exploration alongside partners ConocoPhillips, Ecopetrol, ExxonMobil, Sinochem and Shell.
Catalysts Canacol’s plans for the 2014 financial year entail spending US$80m (gross), bringing nine production wells on stream with latest production guidance being between 7.5m and 8.5mboe/d (pre-royalties).
Canacol Energy Targeting shale oil with world-class partners
Price C$4.44* Market cap C$384m
*As at 3 October 2013 Net debt (US$m) as at 30 June 2013 67.1
Shares in issue 86.6m
Free float 92%
Code CNE
Primary exchange TSX-V
Secondary exchange BVC
Share price performance
Business description
Canacol Energy’s operations are focused in Colombia and Ecuador. Canacol has interests in 26 exploration and production contracts and an exploration portfolio of conventional and unconventional oil prospects.
Catalysts/next events
Exploration wells on LLA-23 October 2013
Shale oil well exploration well Mono Arana in Middle Magdalena (XOM)
October 2013
Results of Platino’s Coati well spud in the Putumayo Basin
Q413
Analysts
Xavier M Grunauer +1 416 533 8223
Ian McLelland +44 (0)20 3077 5756
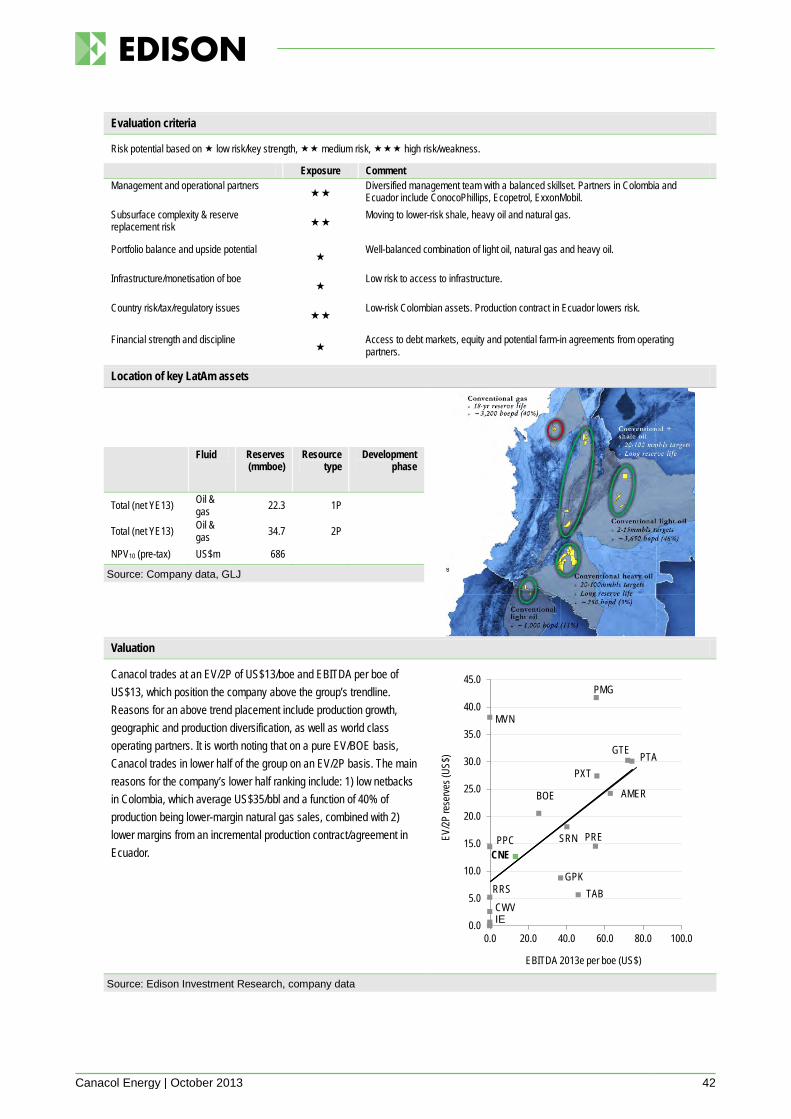
Canacol Energy | October 2013 42
Evaluation criteria
Risk potential based on low risk/key strength, medium risk, high risk/weakness.
Exposure Comment Management and operational partners
Diversified management team with a balanced skillset. Partners in Colombia and Ecuador include ConocoPhillips, Ecopetrol, ExxonMobil.
Subsurface complexity & reserve replacement risk
Moving to lower-risk shale, heavy oil and natural gas.
Portfolio balance and upside potential
Well-balanced combination of light oil, natural gas and heavy oil.
Infrastructure/monetisation of boe
Low risk to access to infrastructure.
Country risk/tax/regulatory issues
Low-risk Colombian assets. Production contract in Ecuador lowers risk.
Financial strength and discipline
Access to debt markets, equity and potential farm-in agreements from operating partners.
Location of key LatAm assets
Source: Company data, GLJ
Fluid Reserves (mmboe)
Resource type
Development phase
Total (net YE13) Oil & gas 22.3 1P
Total (net YE13) Oil & gas 34.7 2P
NPV10 (pre-tax) US$m 686
Valuation
Canacol trades at an EV/2P of US$13/boe and EBITDA per boe of US$13, which position the company above the group’s trendline. Reasons for an above trend placement include production growth, geographic and production diversification, as well as world class operating partners. It is worth noting that on a pure EV/BOE basis, Canacol trades in lower half of the group on an EV/2P basis. The main reasons for the company’s lower half ranking include: 1) low netbacks in Colombia, which average US$35/bbl and a function of 40% of production being lower-margin natural gas sales, combined with 2) lower margins from an incremental production contract/agreement in Ecuador.
Source: Edison Investment Research, company data
BOE
CNE
GPK
GTE
CWV
AMER
MVN
PMG
PPC PRE
PTAPXT
RRS
SRN
TAB
0.0
5.0
10.0
15.0
20.0
25.0
30.0
35.0
40.0
45.0
0.0 20.0 40.0 60.0 80.0 100.0
EV/2P
rese
rves (
US$)
EBITDA 2013e per boe (US$)
IE
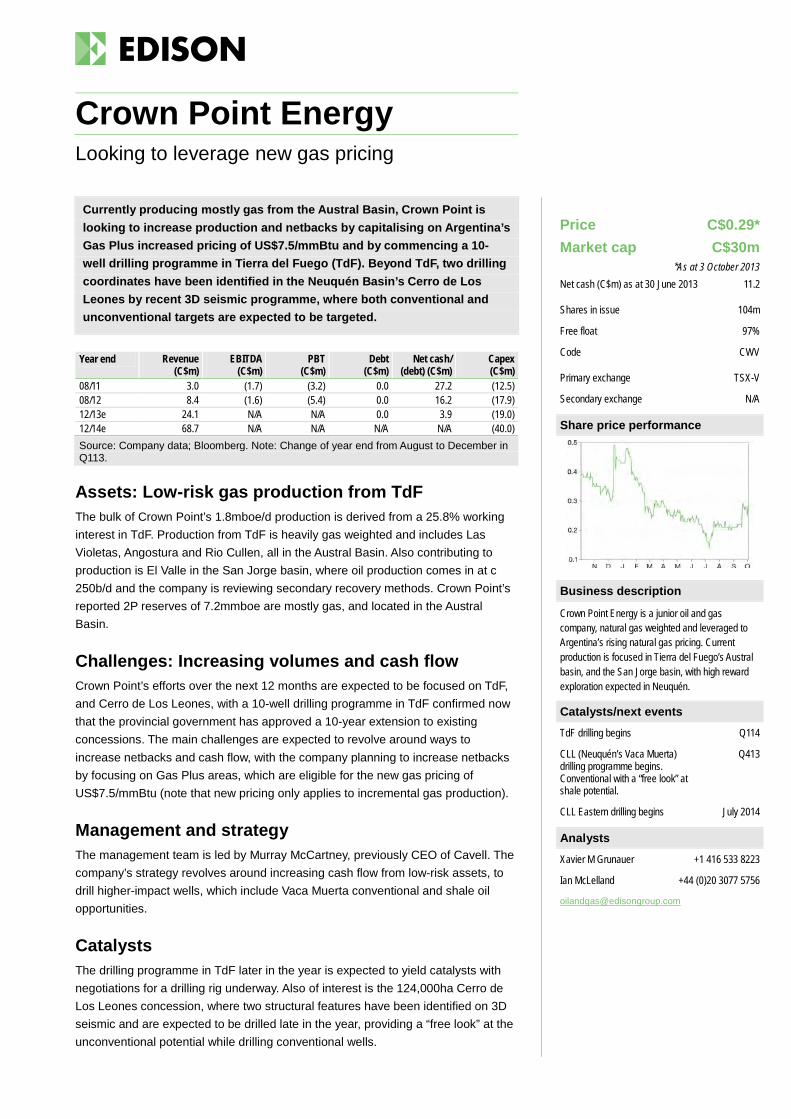
Currently producing mostly gas from the Austral Basin, Crown Point is looking to increase production and netbacks by capitalising on Argentina’s Gas Plus increased pricing of US$7.5/mmBtu and by commencing a 10-well drilling programme in Tierra del Fuego (TdF). Beyond TdF, two drilling coordinates have been identified in the Neuquén Basin’s Cerro de Los Leones by recent 3D seismic programme, where both conventional and unconventional targets are expected to be targeted.
Year end Revenue (C$m)
EBITDA (C$m)
PBT (C$m)
Debt (C$m)
Net cash/ (debt) (C$m)
Capex (C$m)
08/11 3.0 (1.7) (3.2) 0.0 27.2 (12.5) 08/12 8.4 (1.6) (5.4) 0.0 16.2 (17.9) 12/13e 24.1 N/A N/A 0.0 3.9 (19.0) 12/14e 68.7 N/A N/A N/A N/A (40.0) Source: Company data; Bloomberg. Note: Change of year end from August to December in Q113.
Assets: Low-risk gas production from TdF The bulk of Crown Point’s 1.8mboe/d production is derived from a 25.8% working interest in TdF. Production from TdF is heavily gas weighted and includes Las Violetas, Angostura and Rio Cullen, all in the Austral Basin. Also contributing to production is El Valle in the San Jorge basin, where oil production comes in at c 250b/d and the company is reviewing secondary recovery methods. Crown Point’s reported 2P reserves of 7.2mmboe are mostly gas, and located in the Austral Basin.
Challenges: Increasing volumes and cash flow Crown Point’s efforts over the next 12 months are expected to be focused on TdF, and Cerro de Los Leones, with a 10-well drilling programme in TdF confirmed now that the provincial government has approved a 10-year extension to existing concessions. The main challenges are expected to revolve around ways to increase netbacks and cash flow, with the company planning to increase netbacks by focusing on Gas Plus areas, which are eligible for the new gas pricing of US$7.5/mmBtu (note that new pricing only applies to incremental gas production).
Management and strategy The management team is led by Murray McCartney, previously CEO of Cavell. The company’s strategy revolves around increasing cash flow from low-risk assets, to drill higher-impact wells, which include Vaca Muerta conventional and shale oil opportunities.
Catalysts The drilling programme in TdF later in the year is expected to yield catalysts with negotiations for a drilling rig underway. Also of interest is the 124,000ha Cerro de Los Leones concession, where two structural features have been identified on 3D seismic and are expected to be drilled late in the year, providing a “free look” at the unconventional potential while drilling conventional wells.
Crown Point Energy Looking to leverage new gas pricing
Price C$0.29* Market cap C$30m
*As at 3 October 2013 Net cash (C$m) as at 30 June 2013 11.2
Shares in issue 104m
Free float 97%
Code CWV
Primary exchange TSX-V
Secondary exchange N/A
Share price performance
Business description
Crown Point Energy is a junior oil and gas company, natural gas weighted and leveraged to Argentina’s rising natural gas pricing. Current production is focused in Tierra del Fuego’s Austral basin, and the San Jorge basin, with high reward exploration expected in Neuquén.
Catalysts/next events
TdF drilling begins Q114
CLL (Neuquén’s Vaca Muerta) drilling programme begins. Conventional with a “free look” at shale potential.
Q413
CLL Eastern drilling begins July 2014
Analysts
Xavier M Grunauer +1 416 533 8223
Ian McLelland +44 (0)20 3077 5756
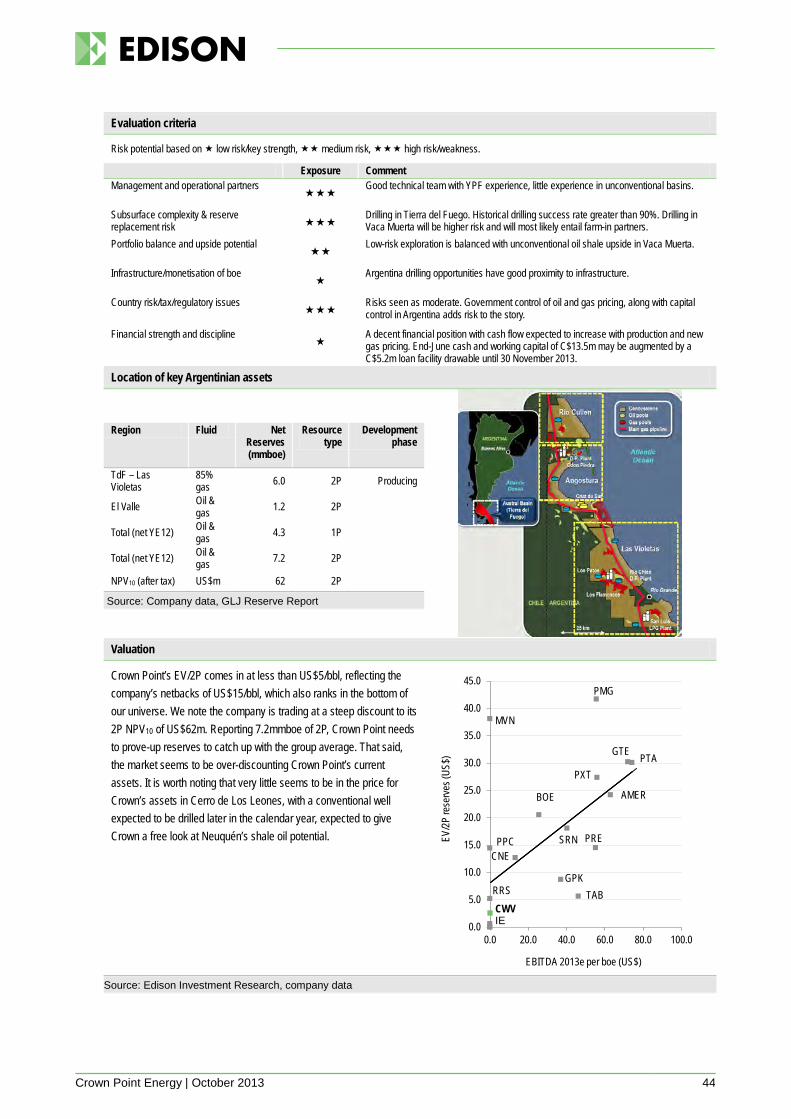
Crown Point Energy | October 2013 44
Evaluation criteria
Risk potential based on low risk/key strength, medium risk, high risk/weakness.
Exposure Comment Management and operational partners
Good technical team with YPF experience, little experience in unconventional basins.
Subsurface complexity & reserve replacement risk
Drilling in Tierra del Fuego. Historical drilling success rate greater than 90%. Drilling in Vaca Muerta will be higher risk and will most likely entail farm-in partners.
Portfolio balance and upside potential
Low-risk exploration is balanced with unconventional oil shale upside in Vaca Muerta.
Infrastructure/monetisation of boe
Argentina drilling opportunities have good proximity to infrastructure.
Country risk/tax/regulatory issues
Risks seen as moderate. Government control of oil and gas pricing, along with capital control in Argentina adds risk to the story.
Financial strength and discipline
A decent financial position with cash flow expected to increase with production and new gas pricing. End-June cash and working capital of C$13.5m may be augmented by a C$5.2m loan facility drawable until 30 November 2013.
Location of key Argentinian assets
Source: Company data, GLJ Reserve Report
Region Fluid Net Reserves (mmboe)
Resource type
Development phase
TdF – Las Violetas
85% gas 6.0 2P Producing
El Valle Oil & gas 1.2 2P
Total (net YE12) Oil & gas 4.3 1P
Total (net YE12) Oil & gas 7.2 2P
NPV10 (after tax) US$m 62 2P
Valuation
Crown Point’s EV/2P comes in at less than US$5/bbl, reflecting the company’s netbacks of US$15/bbl, which also ranks in the bottom of our universe. We note the company is trading at a steep discount to its 2P NPV10 of US$62m. Reporting 7.2mmboe of 2P, Crown Point needs to prove-up reserves to catch up with the group average. That said, the market seems to be over-discounting Crown Point’s current assets. It is worth noting that very little seems to be in the price for Crown’s assets in Cerro de Los Leones, with a conventional well expected to be drilled later in the calendar year, expected to give Crown a free look at Neuquén’s shale oil potential.
Source: Edison Investment Research, company data
BOE
CNE
GPK
GTE
CWV
AMER
MVN
PMG
PPC PRE
PTAPXT
RRS
SRN
TAB
0.0
5.0
10.0
15.0
20.0
25.0
30.0
35.0
40.0
45.0
0.0 20.0 40.0 60.0 80.0 100.0
EV/2P
rese
rves (
US$)
EBITDA 2013e per boe (US$)
IE
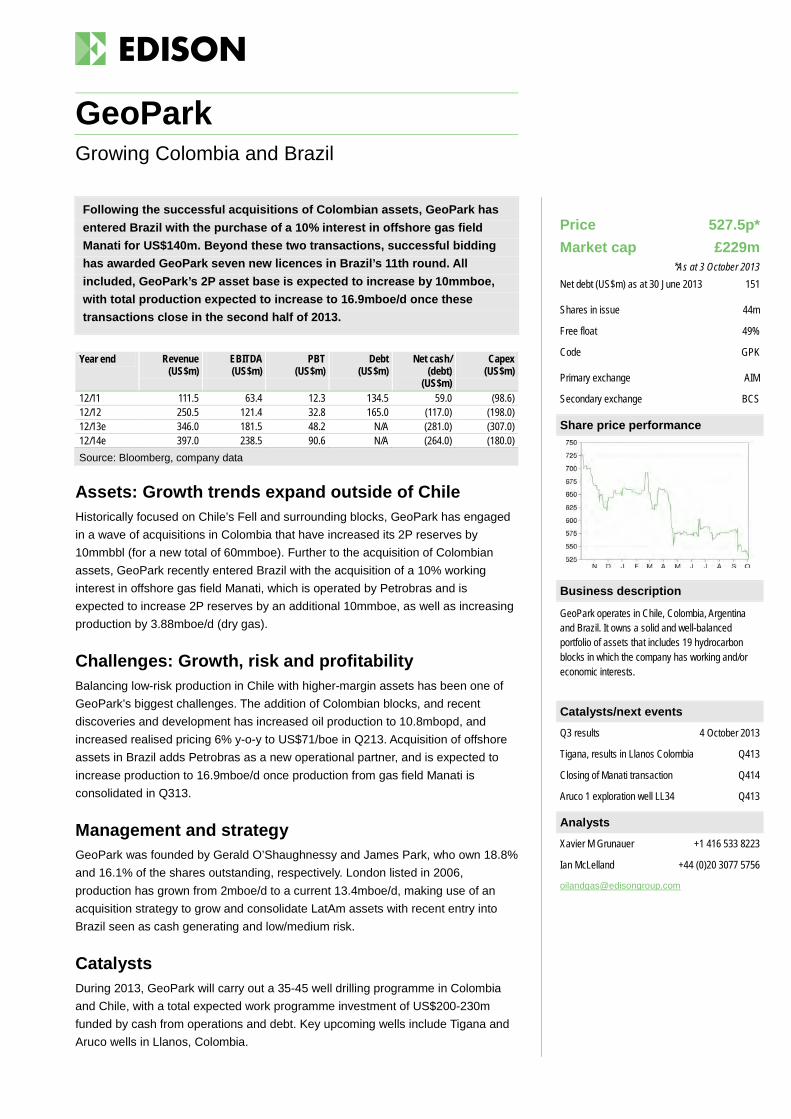
Following the successful acquisitions of Colombian assets, GeoPark has entered Brazil with the purchase of a 10% interest in offshore gas field Manati for US$140m. Beyond these two transactions, successful bidding has awarded GeoPark seven new licences in Brazil’s 11th round. All included, GeoPark’s 2P asset base is expected to increase by 10mmboe, with total production expected to increase to 16.9mboe/d once these transactions close in the second half of 2013.
Year end Revenue (US$m)
EBITDA (US$m)
PBT (US$m)
Debt (US$m)
Net cash/ (debt)
(US$m)
Capex (US$m)
12/11 111.5 63.4 12.3 134.5 59.0 (98.6) 12/12 250.5 121.4 32.8 165.0 (117.0) (198.0) 12/13e 346.0 181.5 48.2 N/A (281.0) (307.0) 12/14e 397.0 238.5 90.6 N/A (264.0) (180.0) Source: Bloomberg, company data
Assets: Growth trends expand outside of Chile Historically focused on Chile’s Fell and surrounding blocks, GeoPark has engaged in a wave of acquisitions in Colombia that have increased its 2P reserves by 10mmbbl (for a new total of 60mmboe). Further to the acquisition of Colombian assets, GeoPark recently entered Brazil with the acquisition of a 10% working interest in offshore gas field Manati, which is operated by Petrobras and is expected to increase 2P reserves by an additional 10mmboe, as well as increasing production by 3.88mboe/d (dry gas).
Challenges: Growth, risk and profitability Balancing low-risk production in Chile with higher-margin assets has been one of GeoPark’s biggest challenges. The addition of Colombian blocks, and recent discoveries and development has increased oil production to 10.8mbopd, and increased realised pricing 6% y-o-y to US$71/boe in Q213. Acquisition of offshore assets in Brazil adds Petrobras as a new operational partner, and is expected to increase production to 16.9mboe/d once production from gas field Manati is consolidated in Q313.
Management and strategy GeoPark was founded by Gerald O’Shaughnessy and James Park, who own 18.8% and 16.1% of the shares outstanding, respectively. London listed in 2006, production has grown from 2mboe/d to a current 13.4mboe/d, making use of an acquisition strategy to grow and consolidate LatAm assets with recent entry into Brazil seen as cash generating and low/medium risk.
Catalysts During 2013, GeoPark will carry out a 35-45 well drilling programme in Colombia and Chile, with a total expected work programme investment of US$200-230m funded by cash from operations and debt. Key upcoming wells include Tigana and Aruco wells in Llanos, Colombia.
GeoPark Growing Colombia and Brazil
Price 527.5p* Market cap £229m
*As at 3 October 2013 Net debt (US$m) as at 30 June 2013 151
Shares in issue 44m
Free float 49%
Code GPK
Primary exchange AIM
Secondary exchange BCS
Share price performance
Business description
GeoPark operates in Chile, Colombia, Argentina and Brazil. It owns a solid and well-balanced portfolio of assets that includes 19 hydrocarbon blocks in which the company has working and/or economic interests.
Catalysts/next events
Q3 results 4 October 2013
Tigana, results in Llanos Colombia Q413
Closing of Manati transaction Q414
Aruco 1 exploration well LL34 Q413
Analysts
Xavier M Grunauer +1 416 533 8223
Ian McLelland +44 (0)20 3077 5756
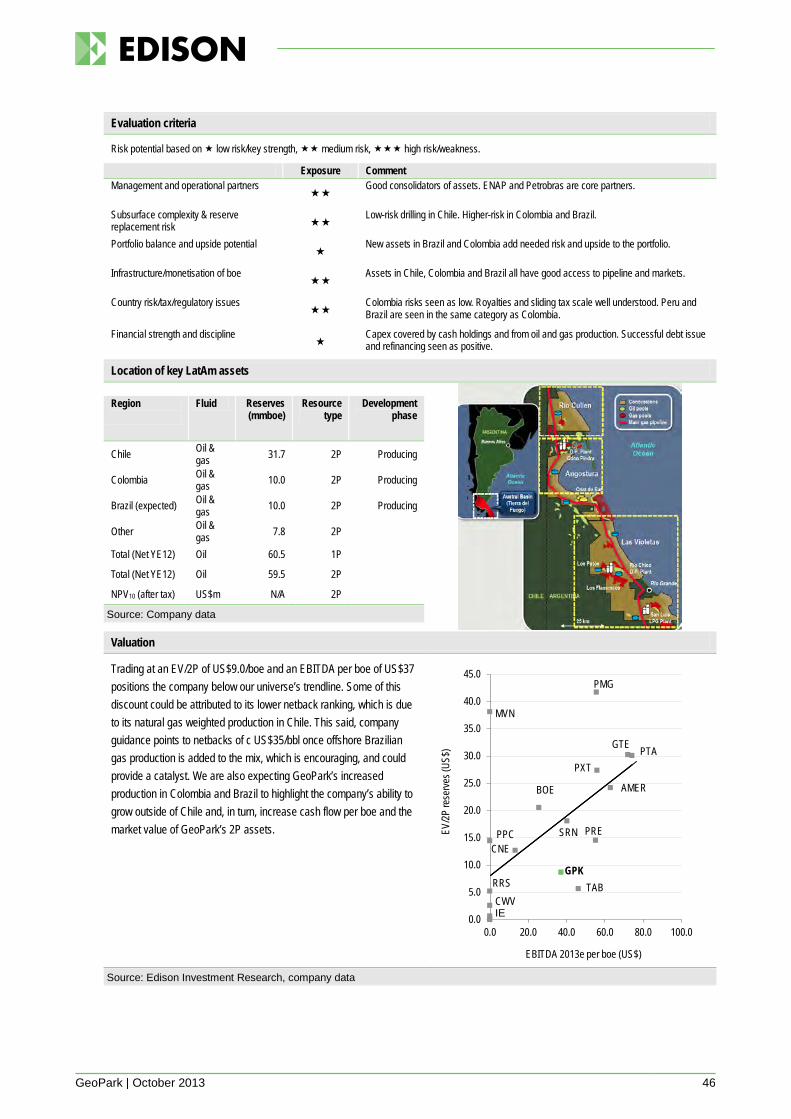
GeoPark | October 2013 46
Evaluation criteria
Risk potential based on low risk/key strength, medium risk, high risk/weakness.
Exposure Comment Management and operational partners
Good consolidators of assets. ENAP and Petrobras are core partners.
Subsurface complexity & reserve replacement risk
Low-risk drilling in Chile. Higher-risk in Colombia and Brazil.
Portfolio balance and upside potential
New assets in Brazil and Colombia add needed risk and upside to the portfolio.
Infrastructure/monetisation of boe
Assets in Chile, Colombia and Brazil all have good access to pipeline and markets.
Country risk/tax/regulatory issues
Colombia risks seen as low. Royalties and sliding tax scale well understood. Peru and Brazil are seen in the same category as Colombia.
Financial strength and discipline
Capex covered by cash holdings and from oil and gas production. Successful debt issue and refinancing seen as positive.
Location of key LatAm assets
Source: Company data
Region
Fluid Reserves (mmboe)
Resource type
Development phase
Chile Oil & gas 31.7 2P Producing
Colombia Oil & gas 10.0 2P Producing
Brazil (expected) Oil & gas 10.0 2P Producing
Other Oil & gas 7.8 2P
Total (Net YE12) Oil 60.5 1P
Total (Net YE12) Oil 59.5 2P NPV10 (after tax) US$m N/A 2P
Valuation
Trading at an EV/2P of US$9.0/boe and an EBITDA per boe of US$37 positions the company below our universe’s trendline. Some of this discount could be attributed to its lower netback ranking, which is due to its natural gas weighted production in Chile. This said, company guidance points to netbacks of c US$35/bbl once offshore Brazilian gas production is added to the mix, which is encouraging, and could provide a catalyst. We are also expecting GeoPark’s increased production in Colombia and Brazil to highlight the company’s ability to grow outside of Chile and, in turn, increase cash flow per boe and the market value of GeoPark’s 2P assets.
Source: Edison Investment Research, company data
BOE
CNE
GPK
GTE
CWV
AMER
MVN
PMG
PPC PRE
PTAPXT
RRS
SRN
TAB
0.0
5.0
10.0
15.0
20.0
25.0
30.0
35.0
40.0
45.0
0.0 20.0 40.0 60.0 80.0 100.0
EV/2P
rese
rves (
US$)
EBITDA 2013e per boe (US$)
IE
Encouraged by its 31.6mmbbl (2C) Bretaña Norte (Block 95) discovery, Gran Tierra has increased its expenditures in Peru to US$109m, or 24% of its 2013e capex budget of US$454m. Gran Tierra points to continued successes in Peru and the potential FY15e drilling of Block 107, with the size of this prospect potentially on trend with nearby world-class gas-condensate discoveries in Blocks 56 and 88, also known as Camisea.
Year end Revenue (US$m)
EBITDA (US$m)
PBT (US$m)
Debt (US$m)
Net cash (US$m)
Capex (US$m)
12/11 596.2 441.0 234.2 0.0 351.0 (333.0) 12/12 583.1 399.0 197.4 0.0 212.6 (276.0) 12/13e 787.8 579.0 324.9 0.0 217.0 (444.0) 12/14e 849.9 627.8 333.9 N/A 324.0 (384.0) Source: Bloomberg, company data
Assets: Light oil, the engine of growth Gran Tierra’s oil and gas production averaged 22mboe/d in Q213, with Colombia contributing 18.3mboe/d of light oil, Argentina producing 3.1mboe/d with 82% of this volume oil, and Brazil producing 736boe/d. Gran Tierra’s Colombia production is Putumayo-basin focused, with the Costayaco field production playing a core role in the production of light oil. Stronger than expected H113 production has led to an increase in guidance for 2013 from 20 to 21-22mboe/d. As outlined in Q2 results, planned capex has been revised to US$454m from US$424m and includes US$216m for Colombia (seven wells), US$94m for Brazil (three wells), US$33m for Argentina (four wells), as well as US$109m for Peru (two wells), all expected to be funded from cash-on-hand and cash flows from current operations.
Challenges: A lead actor in Peru’s oil production Following the successful Q213 production tests from a horizontal sidetrack of Bretaña Norte (31.6mmbbl of 2C), Gran Tierra has increased its commitment to Peru, with a capex budget of now US$109m. It will entail front end engineering design, seen as positive news, with this discovery having the potential to transform Gran Tierra Energy’s reserve base future growth.
Management and strategy The company is led by Dana Coffield (CEO), Shane O’Leary (COO) and James Rozon (CFO), with the team leaning heavily on its in-house technical and global oil and gas experience. The strategy across Latin America is to build and lead via the drill bit, and to consolidate regional positions, leveraging strategic relationships.
Catalysts Gran Tierra has deferred two exploration wells in Colombia, with only US$124m of the US$235m drilling budget allocated to exploration wells in 2013. Catalysts on the horizon include potential Bretaña reserve booking, additional Moqueta drilling, and the 2015 drilling of Block 107 in Peru, with these results having a good chance of being on trend with world class Blocks 56 and 88 (c 500km to the south), which are also known as Camisea.
Gran Tierra Energy Opportunity knocks in Peru
Price US$7.31* Market cap US$1,981m
*As at 3 October 2013 Net cash (US$m) as at 30 June 2013 282
Shares in issue 271m
Free float 94.5%
Code GTE
Primary exchange NYSE MKT
Secondary exchange TSX
Share price performance
Business description
Gran Tierra Energy holds interests in Colombia, Argentina, Peru and Brazil, with an established portfolio of producing assets and drilling opportunities aimed at growing future reserves. Sixteen new wells are targeted for 2013.
Catalysts/next events
Q3 results 7 November 2013
Miraflor exploration well, Putumayo
Q413
Mayalito, LLA-22 exploration well Q413
Noroeste, Argentina exploration well Q114
Offshore Brazil Reconcavo, Block 155 exploration well, to be drilled by Petrobras
2014
Block 107 exploration well 2015
Analysts
Xavier M Grunauer +1 416 533 8223
Ian McLelland +44 (0)20 3077 5756
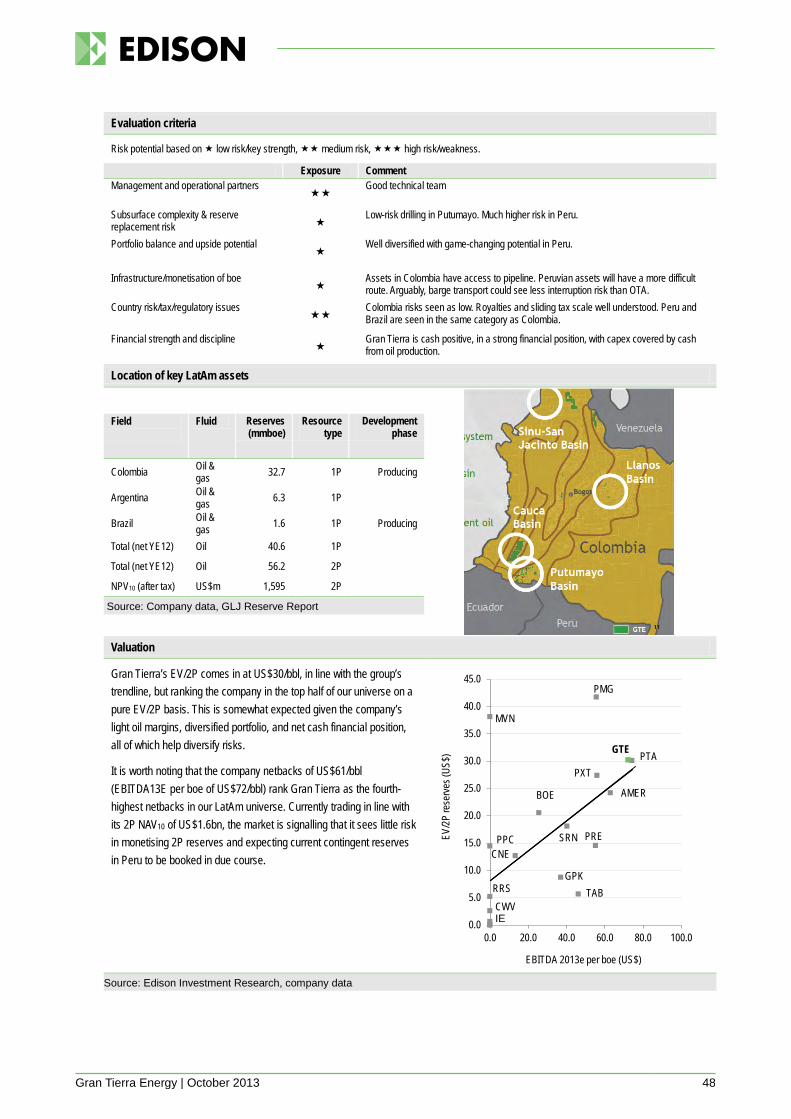
Gran Tierra Energy | October 2013 48
Evaluation criteria
Risk potential based on low risk/key strength, medium risk, high risk/weakness.
Exposure Comment Management and operational partners
Good technical team
Subsurface complexity & reserve replacement risk
Low-risk drilling in Putumayo. Much higher risk in Peru.
Portfolio balance and upside potential
Well diversified with game-changing potential in Peru.
Infrastructure/monetisation of boe
Assets in Colombia have access to pipeline. Peruvian assets will have a more difficult route. Arguably, barge transport could see less interruption risk than OTA.
Country risk/tax/regulatory issues
Colombia risks seen as low. Royalties and sliding tax scale well understood. Peru and Brazil are seen in the same category as Colombia.
Financial strength and discipline
Gran Tierra is cash positive, in a strong financial position, with capex covered by cash from oil production.
Location of key LatAm assets
Source: Company data, GLJ Reserve Report
Field
Fluid Reserves (mmboe)
Resource type
Development phase
Colombia Oil & gas 32.7 1P Producing
Argentina Oil & gas 6.3 1P
Brazil Oil & gas 1.6 1P Producing
Total (net YE12) Oil 40.6 1P
Total (net YE12) Oil 56.2 2P NPV10 (after tax) US$m 1,595 2P
Valuation
Gran Tierra’s EV/2P comes in at US$30/bbl, in line with the group’s trendline, but ranking the company in the top half of our universe on a pure EV/2P basis. This is somewhat expected given the company’s light oil margins, diversified portfolio, and net cash financial position, all of which help diversify risks.
It is worth noting that the company netbacks of US$61/bbl (EBITDA13E per boe of US$72/bbl) rank Gran Tierra as the fourth-highest netbacks in our LatAm universe. Currently trading in line with its 2P NAV10 of US$1.6bn, the market is signalling that it sees little risk in monetising 2P reserves and expecting current contingent reserves in Peru to be booked in due course.
Source: Edison Investment Research, company data
BOE
CNE
GPK
GTE
CWV
AMER
MVN
PMG
PPC PRE
PTAPXT
RRS
SRN
TAB
0.0
5.0
10.0
15.0
20.0
25.0
30.0
35.0
40.0
45.0
0.0 20.0 40.0 60.0 80.0 100.0
EV/2P
rese
rves (
US$)
EBITDA 2013e per boe (US$)
IE
Ivanhoe Energy is a heavy oil-focused company looking to develop its proprietary Heavy-to-Light (HTL) partial upgrading technology. Current operations are in Tamarack, Alberta, where it is working through the regulatory approval process and looking to secure a financial partner. In Ecuador, Ivanhoe has a heavy oil production agreement with the government, where it is finalising the approval of a partner and working with this partner to develop Block 20.
Year end Revenue (US$m)
EBITDA (US$m)
PBT (US$m)
Debt (US$m)
Net (debt)/ cash (US$m)
Capex (US$m)
12/11 0.6 (45.9) (31.1) 61.9 (45.0) (51.1) 12/12 0.0 (58.4) (66.4) 65.2 (2.4) (47.4) 12/13e 0.0 (59.0) (69.0) 67.6 (5.6) (6.0) 12/14e N/A N/A N/A N/A N/A (15.8) Source: Bloomberg, company data
Assets: HTL technology – a key asset Ivanhoe Energy has two heavy oil assets: the 176mmbbls (2P) Tamarack Project in Northern Alberta, where it holds a 100% WI and is expecting to develop a 40mbpd project using SAGD and HTL; and Block 20 in Ecuador, where best estimates point to 6.7bn barrels of oil in place, and the company is planning to apply its HTL technology. Currently working through the regulatory process at Tamarack, this approval is seen as key to securing a partner in this US$1.3bn project (company estimates). However, delays have dimmed the chances of Tamarack coming on line before 2017. In Ecuador, Ivanhoe has a 30-year service contract signed in 2008 to develop the Pungarayacu heavy oil Block 20. Ivanhoe is working to secure government approval of a partner to develop this block, which it expects by end 2013 and, should this partner be approved, Ivanhoe will proceed with further appraisal drilling in 2014.
Challenges: Funding, which will require partners Ivanhoe has three main challenges: commercialising HTL before applying its application to Tamarack or Block 20; achieving regulatory approval in Alberta, securing a partner and then constructing Tamarack; and finalising approval of a partner in Ecuador, before working with that partner to develop Block 20.
Management and strategy The team is led by executive chairman, Carlos Cabrera. Robert Friedland is Ivanhoe’s founder and co-chairman. Company strategy is to tap into heavy oil opportunities on a global basis and prove up the commercial side of the HTL technology, which is based on partial upgrading technology, modular in construction, and deployable to remote regions.
Catalysts The potential approval of a farm-in partner for Block 20 in Ecuador, expected in late 2013, and the potential approval of Tamarack in 2014, are both key catalysts.
Ivanhoe Energy Global heavy oil ambitions
Price C$0.84* Market cap C$97m
*As at 3 October 2013 Net debt (US$m) as at June 2013 16.3
Shares in issue 114.8m
Free float 81%
Code IE
Primary exchange TSX-V
Secondary exchange NASDAQ
Share price performance
Business description
Ivanhoe Energy is a petroleum company differentiated by its heavy oil partial upgrading process: Heavy to Light (HTL). Core operations are in Canada, the US and Ecuador. The company also has an exploration asset in Mongolia.
Catalysts/next events
Farm-in of partner in Ecuador’s block 20 Q413
Tamarack regulatory approval 2014
Tamarack partner 2014
Potential divestiture of Nyalga H214
Analysts
Xavier M Grunauer +1 416 533 8223
Ian McLelland +44 (0)20 3077 5756
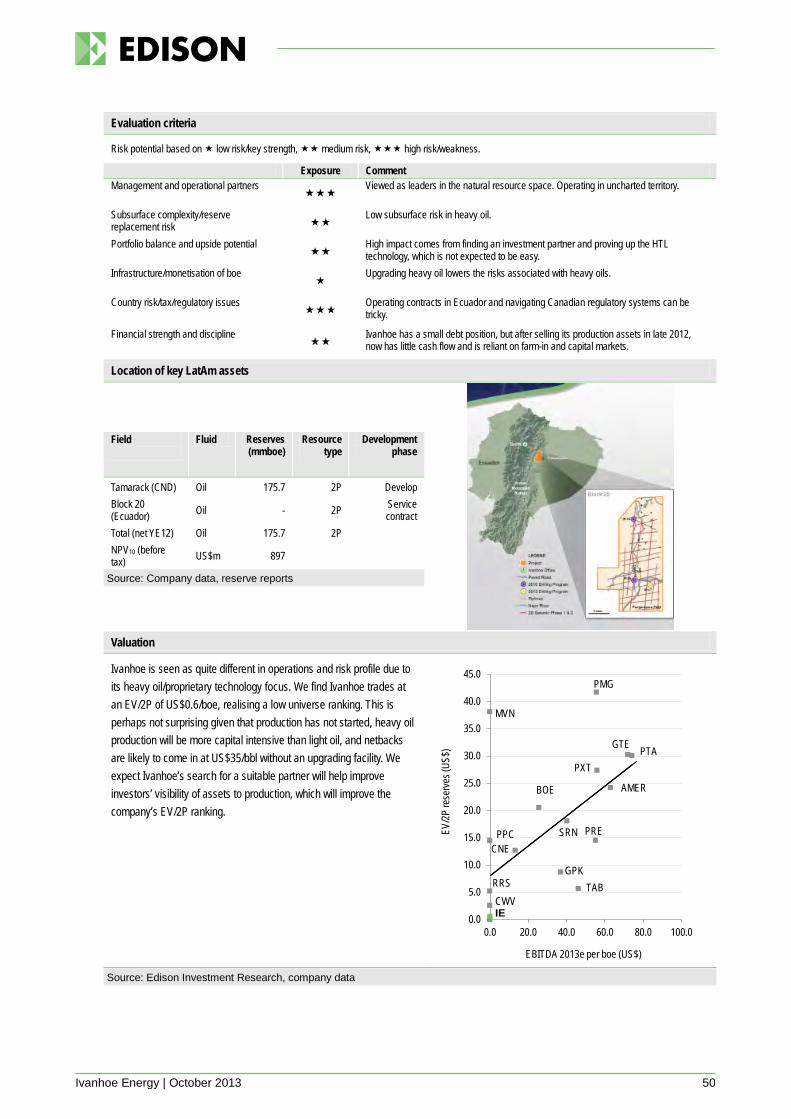
Ivanhoe Energy | October 2013 50
Evaluation criteria
Risk potential based on low risk/key strength, medium risk, high risk/weakness.
Exposure Comment Management and operational partners
Viewed as leaders in the natural resource space. Operating in uncharted territory.
Subsurface complexity/reserve replacement risk
Low subsurface risk in heavy oil.
Portfolio balance and upside potential
High impact comes from finding an investment partner and proving up the HTL technology, which is not expected to be easy.
Infrastructure/monetisation of boe
Upgrading heavy oil lowers the risks associated with heavy oils.
Country risk/tax/regulatory issues
Operating contracts in Ecuador and navigating Canadian regulatory systems can be tricky.
Financial strength and discipline
Ivanhoe has a small debt position, but after selling its production assets in late 2012, now has little cash flow and is reliant on farm-in and capital markets.
Location of key LatAm assets
Source: Company data, reserve reports
Field
Fluid Reserves (mmboe)
Resource type
Development phase
Tamarack (CND) Oil 175.7 2P Develop Block 20 (Ecuador) Oil - 2P Service
contract Total (net YE12) Oil 175.7 2P NPV10 (before tax) US$m 897
Valuation
Ivanhoe is seen as quite different in operations and risk profile due to its heavy oil/proprietary technology focus. We find Ivanhoe trades at an EV/2P of US$0.6/boe, realising a low universe ranking. This is perhaps not surprising given that production has not started, heavy oil production will be more capital intensive than light oil, and netbacks are likely to come in at US$35/bbl without an upgrading facility. We expect Ivanhoe’s search for a suitable partner will help improve investors’ visibility of assets to production, which will improve the company’s EV/2P ranking.
Source: Edison Investment Research, company data
BOE
CNE
GPK
GTE
CWV
AMER
MVN
PMG
PPC PRE
PTAPXT
RRS
SRN
TAB
0.0
5.0
10.0
15.0
20.0
25.0
30.0
35.0
40.0
45.0
0.0 20.0 40.0 60.0 80.0 100.0
EV/2P
rese
rves (
US$)
EBITDA 2013e per boe (US$)
IE
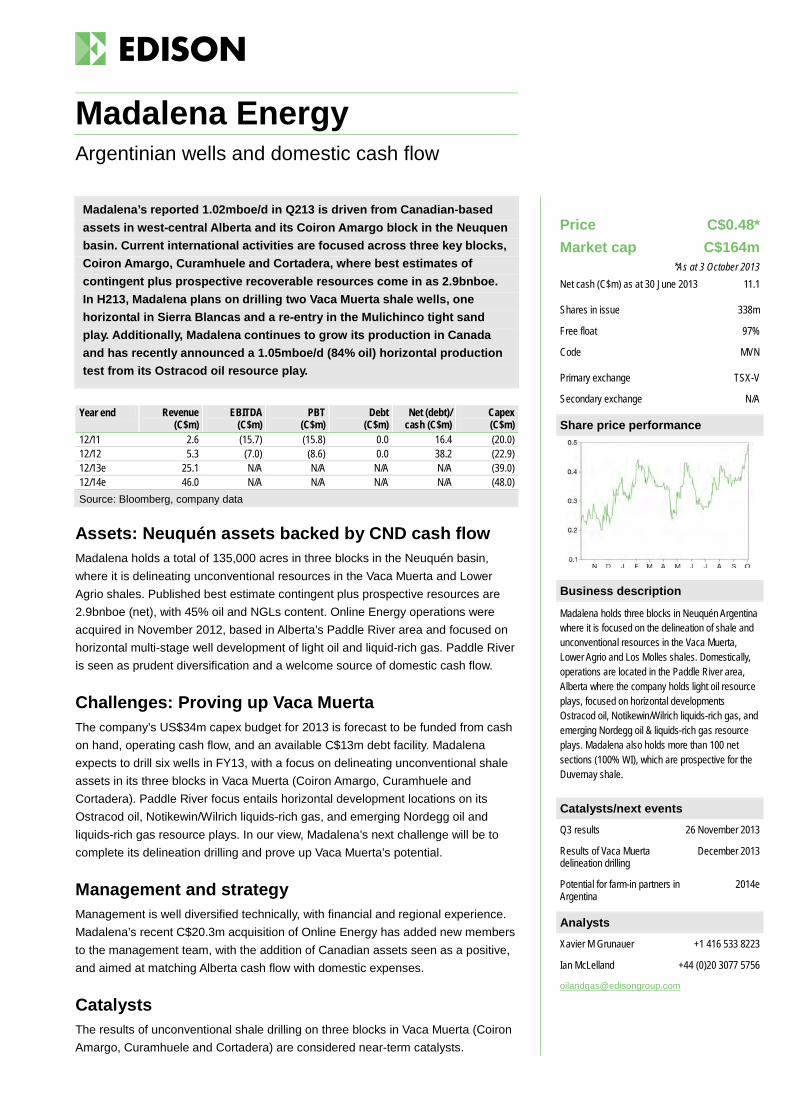
Madalena’s reported 1.02mboe/d in Q213 is driven from Canadian-based assets in west-central Alberta and its Coiron Amargo block in the Neuquen basin. Current international activities are focused across three key blocks, Coiron Amargo, Curamhuele and Cortadera, where best estimates of contingent plus prospective recoverable resources come in as 2.9bnboe. In H213, Madalena plans on drilling two Vaca Muerta shale wells, one horizontal in Sierra Blancas and a re-entry in the Mulichinco tight sand play. Additionally, Madalena continues to grow its production in Canada and has recently announced a 1.05mboe/d (84% oil) horizontal production test from its Ostracod oil resource play.
Year end Revenue (C$m)
EBITDA (C$m)
PBT (C$m)
Debt (C$m)
Net (debt)/ cash (C$m)
Capex (C$m)
12/11 2.6 (15.7) (15.8) 0.0 16.4 (20.0) 12/12 5.3 (7.0) (8.6) 0.0 38.2 (22.9) 12/13e 25.1 N/A N/A N/A N/A (39.0) 12/14e 46.0 N/A N/A N/A N/A (48.0) Source: Bloomberg, company data
Assets: Neuquén assets backed by CND cash flow Madalena holds a total of 135,000 acres in three blocks in the Neuquén basin, where it is delineating unconventional resources in the Vaca Muerta and Lower Agrio shales. Published best estimate contingent plus prospective resources are 2.9bnboe (net), with 45% oil and NGLs content. Online Energy operations were acquired in November 2012, based in Alberta’s Paddle River area and focused on horizontal multi-stage well development of light oil and liquid-rich gas. Paddle River is seen as prudent diversification and a welcome source of domestic cash flow.
Challenges: Proving up Vaca Muerta The company’s US$34m capex budget for 2013 is forecast to be funded from cash on hand, operating cash flow, and an available C$13m debt facility. Madalena expects to drill six wells in FY13, with a focus on delineating unconventional shale assets in its three blocks in Vaca Muerta (Coiron Amargo, Curamhuele and Cortadera). Paddle River focus entails horizontal development locations on its Ostracod oil, Notikewin/Wilrich liquids-rich gas, and emerging Nordegg oil and liquids-rich gas resource plays. In our view, Madalena’s next challenge will be to complete its delineation drilling and prove up Vaca Muerta’s potential.
Management and strategy Management is well diversified technically, with financial and regional experience. Madalena’s recent C$20.3m acquisition of Online Energy has added new members to the management team, with the addition of Canadian assets seen as a positive, and aimed at matching Alberta cash flow with domestic expenses.
Catalysts The results of unconventional shale drilling on three blocks in Vaca Muerta (Coiron Amargo, Curamhuele and Cortadera) are considered near-term catalysts.
Madalena Energy Argentinian wells and domestic cash flow
Price C$0.48* Market cap C$164m
*As at 3 October 2013 Net cash (C$m) as at 30 June 2013 11.1
Shares in issue 338m
Free float 97%
Code MVN
Primary exchange TSX-V
Secondary exchange N/A
Share price performance
Business description
Madalena holds three blocks in Neuquén Argentina where it is focused on the delineation of shale and unconventional resources in the Vaca Muerta, Lower Agrio and Los Molles shales. Domestically, operations are located in the Paddle River area, Alberta where the company holds light oil resource plays, focused on horizontal developments Ostracod oil, Notikewin/Wilrich liquids-rich gas, and emerging Nordegg oil & liquids-rich gas resource plays. Madalena also holds more than 100 net sections (100% WI), which are prospective for the Duvernay shale.
Catalysts/next events
Q3 results 26 November 2013
Results of Vaca Muerta delineation drilling
December 2013
Potential for farm-in partners in Argentina
2014e
Analysts
Xavier M Grunauer +1 416 533 8223
Ian McLelland +44 (0)20 3077 5756
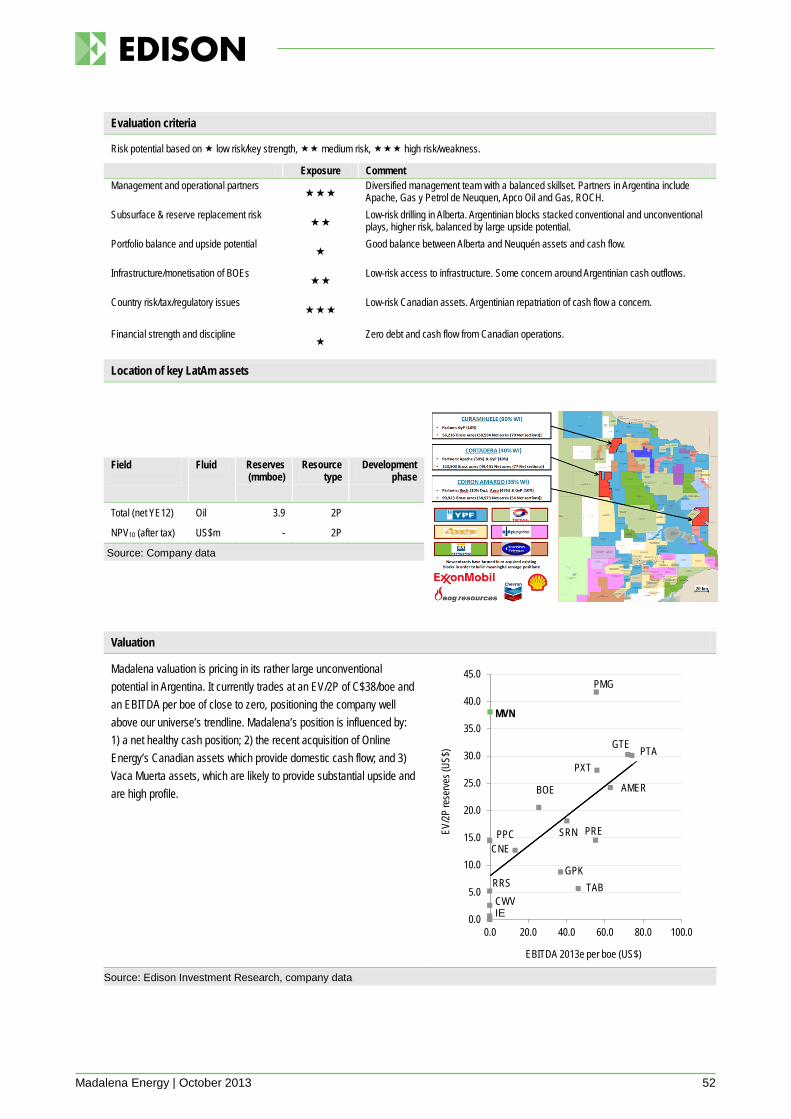
Madalena Energy | October 2013 52
Evaluation criteria
Risk potential based on low risk/key strength, medium risk, high risk/weakness.
Exposure Comment Management and operational partners
Diversified management team with a balanced skillset. Partners in Argentina include Apache, Gas y Petrol de Neuquen, Apco Oil and Gas, ROCH.
Subsurface & reserve replacement risk
Low-risk drilling in Alberta. Argentinian blocks stacked conventional and unconventional plays, higher risk, balanced by large upside potential.
Portfolio balance and upside potential
Good balance between Alberta and Neuquén assets and cash flow.
Infrastructure/monetisation of BOEs
Low-risk access to infrastructure. Some concern around Argentinian cash outflows.
Country risk/tax/regulatory issues
Low-risk Canadian assets. Argentinian repatriation of cash flow a concern.
Financial strength and discipline
Zero debt and cash flow from Canadian operations.
Location of key LatAm assets
Source: Company data
Field
Fluid Reserves (mmboe)
Resource type
Development phase
Total (net YE12) Oil 3.9 2P NPV10 (after tax) US$m - 2P
Valuation
Madalena valuation is pricing in its rather large unconventional potential in Argentina. It currently trades at an EV/2P of C$38/boe and an EBITDA per boe of close to zero, positioning the company well above our universe’s trendline. Madalena’s position is influenced by: 1) a net healthy cash position; 2) the recent acquisition of Online Energy’s Canadian assets which provide domestic cash flow; and 3) Vaca Muerta assets, which are likely to provide substantial upside and are high profile.
Source: Edison Investment Research, company data
BOE
CNE
GPK
GTE
CWV
AMER
MVN
PMG
PPC PRE
PTAPXT
RRS
SRN
TAB
0.0
5.0
10.0
15.0
20.0
25.0
30.0
35.0
40.0
45.0
0.0 20.0 40.0 60.0 80.0 100.0
EV/2P
rese
rves (
US$)
EBITDA 2013e per boe (US$)
IE
Cash previously aimed at dividends and buybacks has been turned to acquisitions, with a recent offer to buy Petrominerales for C$935m (C$11/share) and C$640m in net debt. The acquisition will be financed with short-term debt, expected to be refinanced after the acquisition is complete. Delivering a flat q-o-q production of 129mboe/d in Q213, production is now forecast to increase to 148mboe/d post acquisition and 2P reserves to increase from 514 to 551mmboe, at a cost of C$25 per bbl. Newly acquired light oil production as well as access to OCENSA and OBC oil pipelines are both seen as adding synergies to current operations.
Year end Revenue (US$m)
EBITDA (US$m)
PBT (US$m)
Debt (US$m)
Net (debt)/ cash (US$m)
Capex (US$m)
12/11 3,380 1,897 1,002 1,034 (304) (1,152) 12/12 3,885 1,883 817 1,287 (1,044) (1,511) 12/13e 4,766 2,576 1,091 2,539 (1,252) (1,807) 12/14e N/A 4,000 N/A N/A N/A N/A Source: Bloomberg, company data
Assets: Large, diversified, and growing Pacific Rubiales reported net production of 128mboe/d of net production (Q213), an increase of 38% y-o-y, maintaining its position as Latin America’s largest independent producer by a wide margin. Mostly Colombian heavy oil (77%), Pacific Rubiales’ production also contains light/medium oil and natural gas. Company guidance points to an organic doubling of production from 2012 through to 2016, with growth to be driven by CPE-6, La Creciente gas and Quifa heavy oil. Main field Rubiales (currently 60% of production and 19% of 2P reserves) is expected to begin a slow decline, and by May 2016 the Rubiales production agreement will have come to an end, and operation of this field will revert to Ecopetrol.
Challenges: Growth beyond Rubiales agreement Somewhat lowering reserve replacement risk post Rubiales handover in 2016 are recent discoveries in Colombia and Brazil, as well as success of its STAR secondary oil recovery pilot project, which has the potential to double Quifa’s primary recovery factor. Fuelling these projects is a capex budget of US$1.7bn, which looks well funded by company cash flow based on consensus estimates.
Management and strategy The team’s top management is well diversified with global and heavy oil experience and expertise. Pacific Rubiales’ strategy to grow reserves organically has been well received by the markets, with its active exploration programme beginning to yield results in Peru and Brazil. This said, it is our expectation that the company’s current financial flexibility allows for more growth through acquisition.
Catalysts Catalysts include consolidation of PMG assets, results from the STAR Pilot Project, the potential monetisation of Midstream assets, receipt of the blanket exploration and development environmental permit for CPE-6 and exploration upside potential.
Pacific Rubiales Cash generation aimed at acquisitions
Price C$20.57* Market cap C$6,642m
*As at 3 October 2013 Net debt (US$m) as at 30 June 2013 1,547
Shares in issue 323m
Free float 95%
Code PRE
Primary exchange TSX
Secondary exchange BVC
Share price performance
Business description
Pacific Rubiales’ activities focus on Colombia’s heavy crude Llanos basin. In Q213 it reported net production of 127mboe/d. Year-end 2P reserves came in at 514mmboe with 78% of these classified P1.
Catalysts/next events
Completion of PMG purchase Q413
Receipt of CPE-6 permit Q413
Drilling results in Brazil and Peru YE13
Developments of STAR technology Q413
Potential monetisation of Midstream assets
Q114
LNG export FEED Q114
Analysts
Xavier M Grunauer +1 416 533 8223
Ian McLelland +44 (0)20 3077 5756
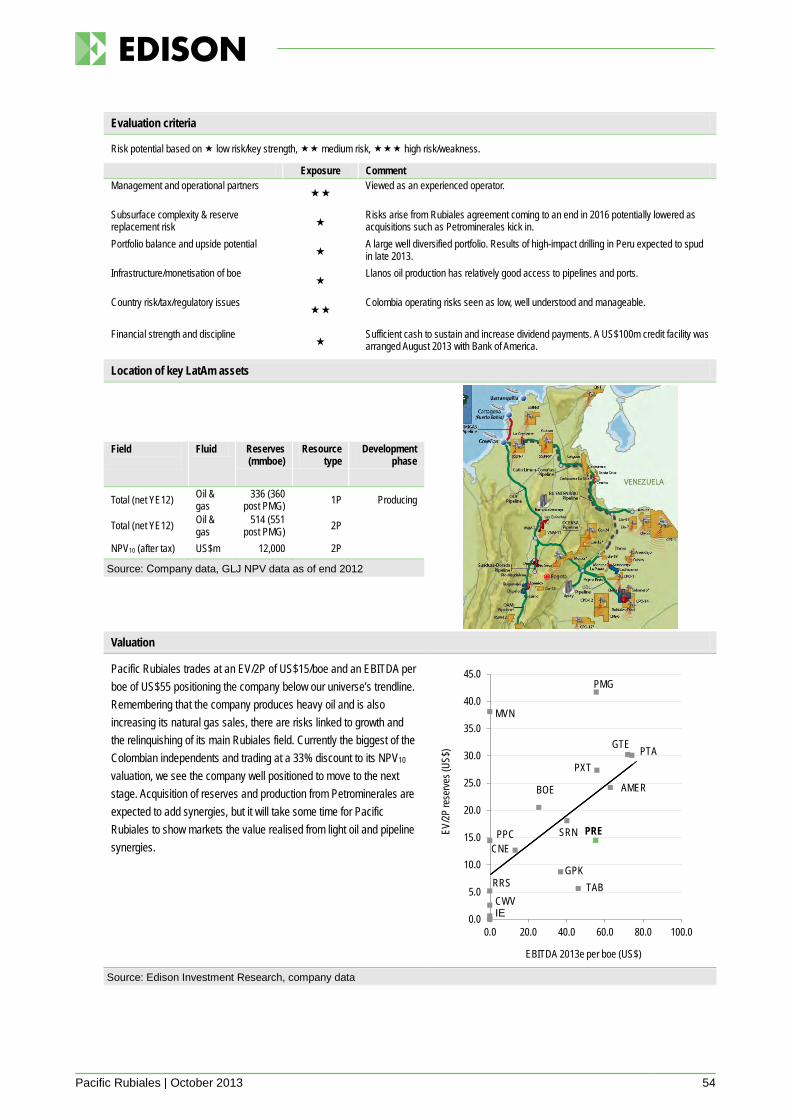
Pacific Rubiales | October 2013 54
Evaluation criteria
Risk potential based on low risk/key strength, medium risk, high risk/weakness.
Exposure Comment Management and operational partners
Viewed as an experienced operator.
Subsurface complexity & reserve replacement risk
Risks arise from Rubiales agreement coming to an end in 2016 potentially lowered as acquisitions such as Petrominerales kick in.
Portfolio balance and upside potential
A large well diversified portfolio. Results of high-impact drilling in Peru expected to spud in late 2013.
Infrastructure/monetisation of boe
Llanos oil production has relatively good access to pipelines and ports.
Country risk/tax/regulatory issues
Colombia operating risks seen as low, well understood and manageable.
Financial strength and discipline
Sufficient cash to sustain and increase dividend payments. A US$100m credit facility was arranged August 2013 with Bank of America.
Location of key LatAm assets
Source: Company data, GLJ NPV data as of end 2012
Field
Fluid Reserves (mmboe)
Resource type
Development phase
Total (net YE12) Oil & gas
336 (360 post PMG) 1P Producing
Total (net YE12) Oil & gas
514 (551 post PMG) 2P
NPV10 (after tax) US$m 12,000 2P
Valuation
Pacific Rubiales trades at an EV/2P of US$15/boe and an EBITDA per boe of US$55 positioning the company below our universe’s trendline. Remembering that the company produces heavy oil and is also increasing its natural gas sales, there are risks linked to growth and the relinquishing of its main Rubiales field. Currently the biggest of the Colombian independents and trading at a 33% discount to its NPV10 valuation, we see the company well positioned to move to the next stage. Acquisition of reserves and production from Petrominerales are expected to add synergies, but it will take some time for Pacific Rubiales to show markets the value realised from light oil and pipeline synergies.
Source: Edison Investment Research, company data
BOE
CNE
GPK
GTE
CWV
AMER
MVN
PMG
PPC PRE
PTAPXT
RRS
SRN
TAB
0.0
5.0
10.0
15.0
20.0
25.0
30.0
35.0
40.0
45.0
0.0 20.0 40.0 60.0 80.0 100.0
EV/2P
rese
rves (
US$)
EBITDA 2013e per boe (US$)
IE
Parex’s growth trend continued in Q213, with a 49% y-o-y increase in production to 15.4mb/d. Reserves also realised material growth, with a new assessment increasing 2P reserves 47% from 16.1 to 23.7mmbbl (as of 30 June 2013). Operating netbacks sustained healthy levels of US$58/bbl, despite lower realised prices in the quarter. Parex’s plans for the year entail a US$220m self-funded capex programme, which includes drilling 20 wells in the second half (including five exploration wells) all in Colombia, deferring Trinidad drilling activities to 2014.
Year end Revenue (US$m)
EBITDA (US$m)
PBT (US$m)
Debt (US$m)
Net (debt)/ cash (US$m)
Capex (US$m)
12/11 157.2 96.7 44.5 60.0 43.9 (149.6) 12/12 487.6 259.5 74.1 74.7 (42.8) (267.7) 12/13e 534.2 315.7 95.4 85.0 (28.5) (220.0) 12/14e 560.8 311.7 87.8 N/A (5.4) (185.8) Source: Bloomberg, company data
Assets: Preferred growth is through the drill bit Parex’s production is mostly light oil and sourced from three core blocks in the Llanos basin: 1) LLA-16 (Kona, discovered by Parex), production of 6.0mb/d; 2) Los Ocarros (Las Maracas), 4.5mb/d; and 3) LLA-34 (Max and Tua) 2.5mb/d. Parex’s production guidance for the year has increased slightly to 15.0-15.5mb/d, in line with H113 results, which delivered 14.9mb/d.
Challenges: Continued growth Capex guidance for the year comes in at US$220m (H113 total spend US$125m), which will be spent drilling 40 wells in Colombia, including five exploration wells in H213. Two exploration wells previously scheduled for Trinidad in 2013 have been deferred to 2014. Reporting US$126m in fund flow from operations in H113, H213 capex estimates of US$95m look well funded.
Management and strategy The team is led by CEO and president Wayne Foo, founder of Petro Andina, which spun out Parex in 2009. Other top management include Barry Larson, Kenneth Pinsky and David Taylor, all of whom have substantial technical and international oil and gas experience. The operating strategy is based on applying proven technology used in Western Canada sedimentary basins to Colombia’s sedimentary basins. A further focus for Parex entails being the operator on most all of its blocks, granting it greater leverage over cost control, shortening the cycle time from discovery to production, and making use of a portfolio approach to manage subsurface risks.
Catalysts Parex plans to drill five exploration wells in the second half of 2013, focused on Los Ocarros, and Adalia (LLA-30 and LLA-29). Further out, deeper wells in Trinidad could provide material catalysts, with these expected to spud in 2014.
Parex Resources Continued growth in Colombia
Price C$5.79* Market cap C$627m
*As at 3 October 2013 Net debt (US$m) as at 30 June 2013 47
Shares in issue 108m
Free float 85%
Code PXT
Primary exchange TSX
Secondary exchange N/A
Share price performance
Business description
Parex Resources is engaged in oil and gas exploration and production in Colombia and Trinidad. Parex holds interests in 17 exploration blocks with assets in Llanos Basin and Middle Magdalena Basin, Colombia, and onshore Trinidad & Tobago. It is the result of a 2009 spin-out from Petro Andina.
Catalysts/next events
Q3 results 13 November 2013
Drilling exploration wells LLA-29/30 September 2013
Development programme at Los Ocarros
Q413
Adalia(LLA-30) delineation well and LLA-29 prospects
Q413
Results of Trinidad exploration well Q214
Analysts
Xavier M Grunauer +1 416 533 8223
Ian McLelland +44 (0)20 3077 5756
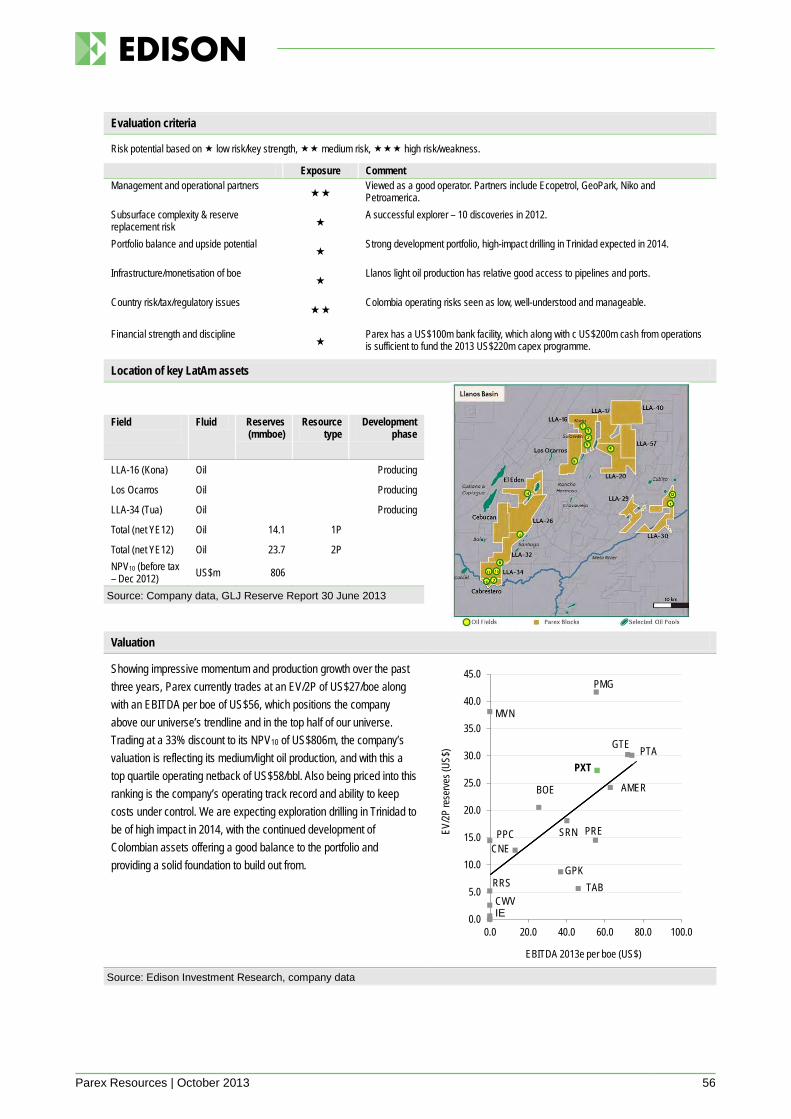
Parex Resources | October 2013 56
Evaluation criteria
Risk potential based on low risk/key strength, medium risk, high risk/weakness.
Exposure Comment Management and operational partners
Viewed as a good operator. Partners include Ecopetrol, GeoPark, Niko and Petroamerica.
Subsurface complexity & reserve replacement risk
A successful explorer – 10 discoveries in 2012.
Portfolio balance and upside potential
Strong development portfolio, high-impact drilling in Trinidad expected in 2014.
Infrastructure/monetisation of boe
Llanos light oil production has relative good access to pipelines and ports.
Country risk/tax/regulatory issues
Colombia operating risks seen as low, well-understood and manageable.
Financial strength and discipline
Parex has a US$100m bank facility, which along with c US$200m cash from operations is sufficient to fund the 2013 US$220m capex programme.
Location of key LatAm assets
Source: Company data, GLJ Reserve Report 30 June 2013
Field
Fluid Reserves (mmboe)
Resource type
Development phase
LLA-16 (Kona) Oil Producing
Los Ocarros Oil Producing
LLA-34 (Tua) Oil Producing
Total (net YE12) Oil 14.1 1P
Total (net YE12) Oil 23.7 2P NPV10 (before tax – Dec 2012) US$m 806
Valuation
Showing impressive momentum and production growth over the past three years, Parex currently trades at an EV/2P of US$27/boe along with an EBITDA per boe of US$56, which positions the company above our universe’s trendline and in the top half of our universe. Trading at a 33% discount to its NPV10 of US$806m, the company’s valuation is reflecting its medium/light oil production, and with this a top quartile operating netback of US$58/bbl. Also being priced into this ranking is the company’s operating track record and ability to keep costs under control. We are expecting exploration drilling in Trinidad to be of high impact in 2014, with the continued development of Colombian assets offering a good balance to the portfolio and providing a solid foundation to build out from.
Source: Edison Investment Research, company data
BOE
CNE
GPK
GTE
CWV
AMER
MVN
PMG
PPC PRE
PTAPXT
RRS
SRN
TAB
0.0
5.0
10.0
15.0
20.0
25.0
30.0
35.0
40.0
45.0
0.0 20.0 40.0 60.0 80.0 100.0
EV/2P
rese
rves (
US$)
EBITDA 2013e per boe (US$)
IE
Petroamerica’s operational focus lies in the Colombia’s Llanos basin, where light oil production and relatively low-risk exploration have realised strong cash flows along with a certain amount of repeatability. Reporting 2P reserves of 5.1mmbbl, and having recently revised 2013FY production guidance from 4.5 to 5.0mb/d, Petroamerica has also increased capex guidance from US$70 to US$87m, expected to be fully funded from current cash position of US$55m and cash flow from operations.
Year end Revenue (US$m)
EBITDA (US$m)
PBT (US$m)
Debt (US$m)
Net (debt)/ cash (US$m)
Capex (US$m)
12/11 10.5 (27.7) (33.4) 0.0 19.3 (30.0) 12/12 42.8 4.1 (13.5) 32.6 (6.0) (31.5) 12/13e 198.0 122.0 N/A N/A 9.8 (87.0) 12/14e 209.0 N/A N/A N/A 32.7 (56.8) Source: Bloomberg, company data
Assets: Llanos basin – a core focus Petroamerica reported Q213 production of 5.0mb/d and netbacks of US$70/bbl, predominantly from Las Maracas Field (Los Ocarros Blocks, 50% stake, Parex, operator) and Balay Field (15% stake, Petrobras is the operator), both in the Llanos basin. Reported proven and probable reserves (2P) of 5.1mmbbl are 94% light oil with a small heavy oil component and no gas.
Challenges: Growth beyond 10mb/d Petroamerica has successfully transitioned from an exploration company to currently producing (August) 6.0mb/d with a full pipeline of exploration and development drilling expected to push production volumes above 7mb/d over the next 12 months. This said, growth beyond the current line of sight is expected to include some growing pains as well as diversification away from Llanos, which will entail risks and challenges for the company.
Management and strategy Petroamerica’s management team is led by Jeffrey Boyce and Nelson Navarrete, both deemed experienced at managing country and operational risk. Mr Boyce was the co-founder of Vermilion Energy, while Mr Navarrete was formerly VP of exploration and production with Ecopetrol. Over the past four years, management has proven its ability to grow Petroamerica organically, through the drill bit. The company’s strategy is to add production from an existing asset base making use of the short cycle time to first oil, as well attractive light oil netback margins.
Catalysts Petroamerica has set aside a capex budget of US$87m for 2013 to be funded by cash on hand and projected cash flow for the year. The drilling programme includes four exploration wells for the rest of 2013, and includes La Guira, Rumi, Crypto and Malavar, all potential catalysts over the next 12 months.
Petroamerica Oil Corp Approaching critical mass
Price C$0.30* Market cap C$174m
*As at 3 October 2013 Net cash (US$m) as at 30 June 2013 15.8
Shares in issue 581m
Free float 95%
Code PTA
Primary exchange TSX-V
Secondary exchange N/A
Share price performance
Business description
Petroamerica is a junior producer focused on light oil in Colombia’s Llanos basin. It is strategically positioned along the Bicentennial Pipeline route and makes use of underexplored blocks using modern methods that entail 3D seismic.
Catalysts/next events
Q3 results 12 November 2013
Drilling La Guira-1 (8-11mmbbl) Los Ocarros, 55% chance of success
Q313
Drilling LLA-10, Malavar-1 (10-20mmbbl), 39% chance of success
Q413
Balay exploration well H114
Analysts
Xavier M Grunauer +1 416 533 8223
Ian McLelland +44 (0)20 3077 5756
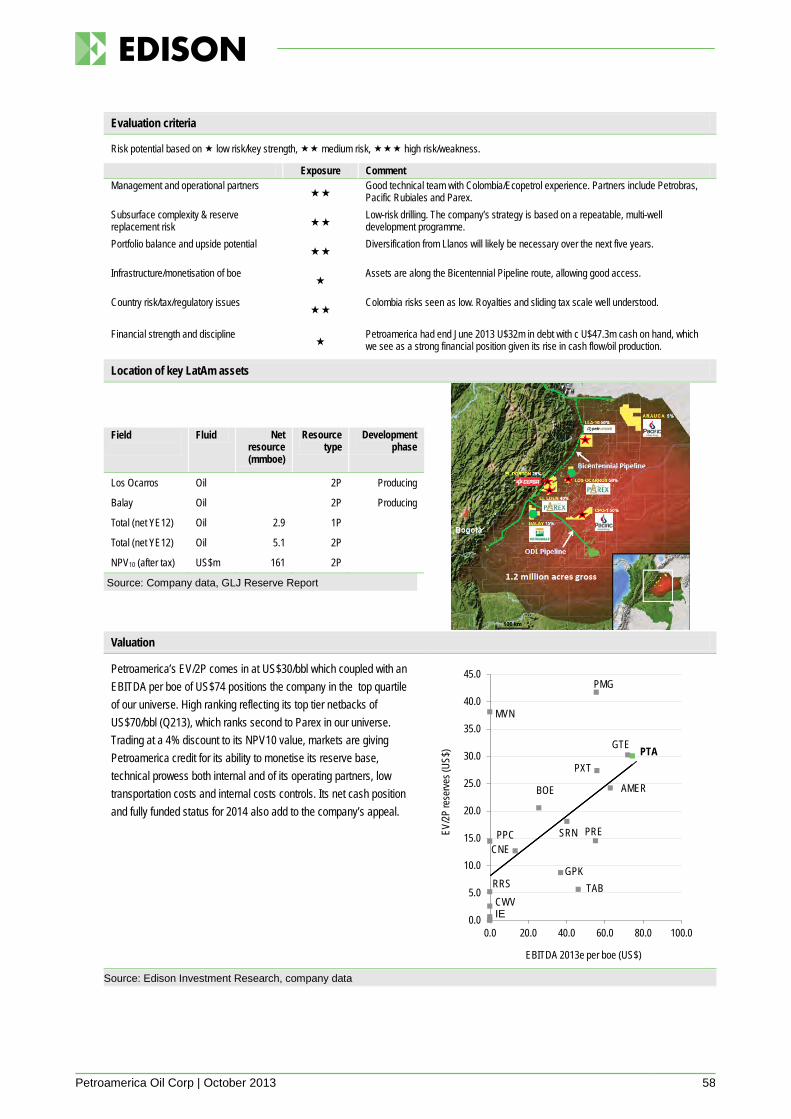
Petroamerica Oil Corp | October 2013 58
Evaluation criteria
Risk potential based on low risk/key strength, medium risk, high risk/weakness.
Exposure Comment Management and operational partners
Good technical team with Colombia/Ecopetrol experience. Partners include Petrobras, Pacific Rubiales and Parex.
Subsurface complexity & reserve replacement risk
Low-risk drilling. The company’s strategy is based on a repeatable, multi-well development programme.
Portfolio balance and upside potential
Diversification from Llanos will likely be necessary over the next five years.
Infrastructure/monetisation of boe
Assets are along the Bicentennial Pipeline route, allowing good access.
Country risk/tax/regulatory issues
Colombia risks seen as low. Royalties and sliding tax scale well understood.
Financial strength and discipline
Petroamerica had end June 2013 U$32m in debt with c U$47.3m cash on hand, which we see as a strong financial position given its rise in cash flow/oil production.
Location of key LatAm assets
Source: Company data, GLJ Reserve Report
Field
Fluid Net resource (mmboe)
Resource type
Development phase
Los Ocarros Oil 2P Producing
Balay Oil 2P Producing
Total (net YE12) Oil 2.9 1P
Total (net YE12) Oil 5.1 2P NPV10 (after tax) US$m 161 2P
Valuation
Petroamerica’s EV/2P comes in at US$30/bbl which coupled with an EBITDA per boe of US$74 positions the company in the top quartile of our universe. High ranking reflecting its top tier netbacks of US$70/bbl (Q213), which ranks second to Parex in our universe. Trading at a 4% discount to its NPV10 value, markets are giving Petroamerica credit for its ability to monetise its reserve base, technical prowess both internal and of its operating partners, low transportation costs and internal costs controls. Its net cash position and fully funded status for 2014 also add to the company’s appeal.
Source: Edison Investment Research, company data
BOE
CNE
GPK
GTE
CWV
AMER
MVN
PMG
PPC PRE
PTA
PXT
RRS
SRN
TAB
0.0
5.0
10.0
15.0
20.0
25.0
30.0
35.0
40.0
45.0
0.0 20.0 40.0 60.0 80.0 100.0
EV/2P
rese
rves (
US$)
EBITDA 2013e per boe (US$)
IE
Recent review of Loto and Kamal exploration wells in Colombia’s Llanos Basin point to a poor cement bond as the cause of high water cuts. Side-track wells are now being considered with required government approval likely to push proposed drilling into 2014e. Regarding farmed-in heavy oil assets in California, first directional well K 2-33 has now reached target depth of 1,472ft, logged and cased, and is expected to be placed on production later in the year, with two more wells planned for California in 2013. Currently holding US$0.8m cash and $32.6m in short-term investments, 2013’s US$17.5m budget is expected to be covered.
Year end Revenue (US$m)
EBITDA (US$m)
PBT (US$m)
Debt (US$m)
Net (debt)/ cash (US$m)
Capex (US$m)
12/11 4.1 (7.6) (8.7) 0.0 9.2 (22.2) 12/12 0.7 (20.0) (20.2) 0.0 2.7 (19.0) 12/13e N/A N/A N/A N/A N/A N/A 12/14e N/A N/A N/A N/A N/A N/A Source: Bloomberg, company data
Assets: Adding California to the mix Originally focused on five Colombian exploration blocks, Petrodorado has diversified away from high-impact drilling and has farmed-into a heavy oil opportunity in the San Joaquin Basin, California. Petrodorado has committed US$2.5m in 2013 towards the development of the Kreyenhagen Field, with the first phase entailing three appraisal wells, and a 15% WI (these three shallow wells will target 13-18 degree API oil accumulations). In Colombia, core exploration assets include a 30% interest in Block CPO-5 in the Llanos Basin on which two wells have been drilled (ONGC Operated) with Loto-1x, declared an oil discovery in April 2013.
Challenges: Moving forward in Colombia Third-party technical review of Loto and Kamal in Block CPO-5 has led to consideration of at least one side-track well in the Loto structure, which would require government approval and likely be drilled in 2014. While news of lower-risk, cash-generating assets in California are seen in a positive light, it is our opinion that Petrodorado’s biggest challenge will be moving forward in Colombia and coming to some conclusions on the near-term direction of its exploration assets.
Management and strategy Krishna Vathyam is the chairman, president and CEO of Petrodorado. His background includes Schlumberger, as a country manager for Colombia and Venezuela. The current strategy entails balancing high-impact drilling in Colombia with more stable assets in North America.
Catalysts News of a potential farm-out of the Magdalena Talora Block, which entails one exploration well in 2013 and results of appraisal wells in Kreyenhagen, along with news regarding lateral wells on Loto and Kamal are all potential catalysts.
Petrodorado Energy Fully funded for 2013
Price C$0.04* Market cap C$19m
*As at 3 October 2013 Net cash (US$m) as at 1 July 2013 0.8
Shares in issue 483m
Free float 85%
Code PDQ
Primary exchange TSX-V
Secondary exchange OTC
Share price performance
Business description
Petrodorado has interests in five exploration blocks in Colombia’s Llanos, Putumayo and Magdalena basins. It recently farmed into the Kreyenhagen Project, a heavy oil opportunity in California, US.
Catalysts/next events
Potential Talora farm-out Q313
Appraisal wells in Kreyenhagen October 2013
Loto 1x sidetrack well Q114
Potential divestment of La Maye 2014
Analysts
Xavier M Grunauer +1 416 533 8223
Ian McLelland +44 (0)20 3077 5756
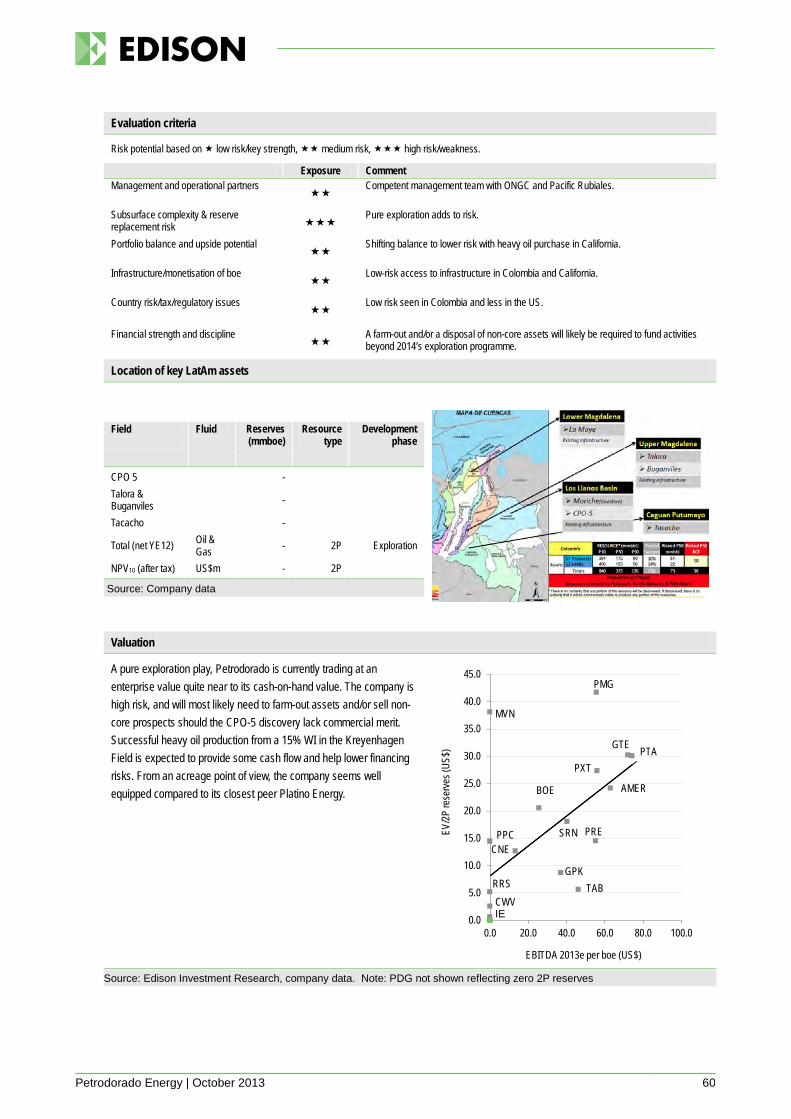
Petrodorado Energy | October 2013 60
Evaluation criteria
Risk potential based on low risk/key strength, medium risk, high risk/weakness.
Exposure Comment Management and operational partners
Competent management team with ONGC and Pacific Rubiales.
Subsurface complexity & reserve replacement risk
Pure exploration adds to risk.
Portfolio balance and upside potential
Shifting balance to lower risk with heavy oil purchase in California.
Infrastructure/monetisation of boe
Low-risk access to infrastructure in Colombia and California.
Country risk/tax/regulatory issues
Low risk seen in Colombia and less in the US.
Financial strength and discipline
A farm-out and/or a disposal of non-core assets will likely be required to fund activities beyond 2014’s exploration programme.
Location of key LatAm assets
Source: Company data
Field
Fluid Reserves (mmboe)
Resource type
Development phase
CPO 5 - Talora & Buganviles -
Tacacho -
Total (net YE12) Oil & Gas - 2P Exploration
NPV10 (after tax) US$m - 2P
Valuation
A pure exploration play, Petrodorado is currently trading at an enterprise value quite near to its cash-on-hand value. The company is high risk, and will most likely need to farm-out assets and/or sell non-core prospects should the CPO-5 discovery lack commercial merit. Successful heavy oil production from a 15% WI in the Kreyenhagen Field is expected to provide some cash flow and help lower financing risks. From an acreage point of view, the company seems well equipped compared to its closest peer Platino Energy.
Source: Edison Investment Research, company data. Note: PDG not shown reflecting zero 2P reserves
BOE
CNE
GPK
GTE
CWV
AMER
MVN
PMG
PPC PRE
PTAPXT
RRS
SRN
TAB
0.0
5.0
10.0
15.0
20.0
25.0
30.0
35.0
40.0
45.0
0.0 20.0 40.0 60.0 80.0 100.0
EV/2P
rese
rves (
US$)
EBITDA 2013e per boe (US$)
IE
Following a frustrating FY12, which saw declines in both production and reserves, Petrominerales has brokered a deal to be purchased by Pacific Rubiales for C$935m, or C$11 per share, plus one share in a new exploration company (Exploreco International), which will retain all of Petrominerales’ Brazilian onshore exploration assets plus C$100m cash.
Year end Revenue (US$m)
EBITDA (US$m)
PBT (US$m)
Debt (US$m)
Net (debt)/ cash (US$m)
Capex (US$m)
12/11 1,257.2 862.0 674.0 527.8 (232.4) (1,034.9) 12/12 965.9 672.3 173.0 557.9 (517.4) (790.4) 12/13e 826.6 448.2 56.3 562.0 (456.0) (374.0) 12/14e 701.9 375.5 51.0 N/A (526.0) (365.0) Source: Bloomberg, company data
Assets: Focused on lower-risk drilling and reserves Petrominerales’ main assets are located in Colombia’s Llanos Basin. The company’s latest set of results reports robust netbacks of US$54/bbl, production of 21.5mb/d (mostly light oil) and year-end reserves of 41mmbbl, with both production and reserves falling 35% and 20% y-o-y respectively. Addressing decline concerns, Petrominerales attempted to plot a c US$400m lower-risk drilling programme aimed at proving-up reserves, with a focus on development drilling, heavy oil in Colombia, as well as unconventional tight sands in Brazil.
Challenges: Cash flow and growth created strains Recent repurchase and cancelling of US$60.2m of convertible debt, as well as extending the put date on the remaining US$138.7m outstanding to February 2014, granted the company greater financial flexibility. This said, the promised dividend stream did require as much as 10% of the company’s cash flow, which, along with a royalty dispute that was likely to increase royalty payments from 2014, all seemed to leave investors with concerns over liquidity. Addressing liquidity, Petrominerales did initiate the sale process of its pipeline assets, which entail a 5% equity stake in the OCENSA pipeline (potentially worth c US$300m), along with a joint effort with other shareholders to offer a combined 27% equity stake in OCENSA, with Pacific Rubiales expected to continue this monetisation process.
Management and strategy Management is experienced and is expected to continue with Exploreco or join Pacific Rubiales.
Catalysts Closing of the sale to Pacific Rubiales and listing Exploreco are likely to be the only tasks on hand. The market’s pricing of C$11.8 per share currently suggests Exploreco will trade at near cash (C$100m) value.
Petrominerales To be acquired by Pacific Rubiales
Price C$11.8* Market cap C$1,002m
*As at 3 October 2013 Net debt (US$m) as at 30 June 2013 746
Shares in issue 84.9m
Free float 95%
Code PMG
Primary exchange TSX-V
Secondary exchange BVC
Share price performance
Business description
Petrominerales is an exploration company with operations in Colombia, Peru and Brazil. Its main oil producing assets are in the Llanos Basin, in Central Colombia. New initiatives are expected to tap into unconventional assets in Brazil and Colombia.
Catalysts/next events
OCENSA equity stake sale Q413
Tight oil in Brazil and heavy oil in Colombia wells expected later in the year
Q413
Peru (one well) targeting 95mmbbl (unrisked)
Q413
Analysts
Xavier M Grunauer +1 416 533 8223
Ian McLelland +44 (0)20 3077 5756
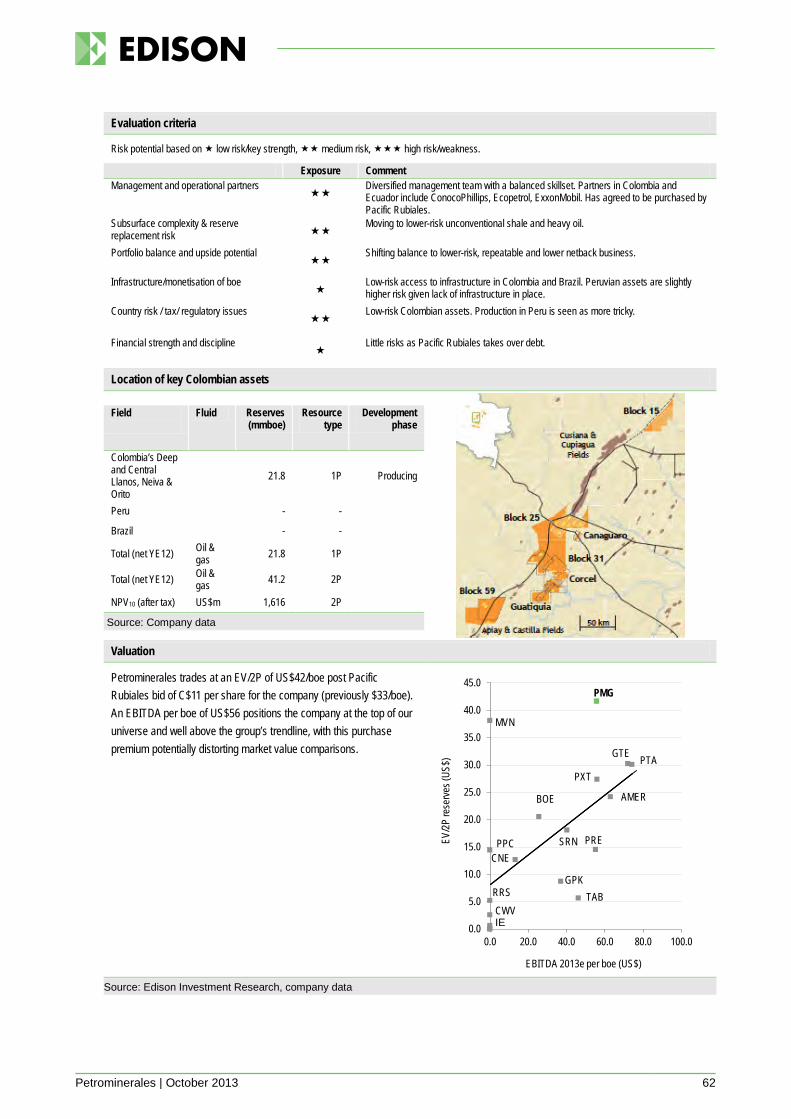
Petrominerales | October 2013 62
Evaluation criteria
Risk potential based on low risk/key strength, medium risk, high risk/weakness.
Exposure Comment Management and operational partners
Diversified management team with a balanced skillset. Partners in Colombia and Ecuador include ConocoPhillips, Ecopetrol, ExxonMobil. Has agreed to be purchased by Pacific Rubiales.
Subsurface complexity & reserve replacement risk
Moving to lower-risk unconventional shale and heavy oil.
Portfolio balance and upside potential
Shifting balance to lower-risk, repeatable and lower netback business.
Infrastructure/monetisation of boe
Low-risk access to infrastructure in Colombia and Brazil. Peruvian assets are slightly higher risk given lack of infrastructure in place.
Country risk / tax/ regulatory issues
Low-risk Colombian assets. Production in Peru is seen as more tricky.
Financial strength and discipline
Little risks as Pacific Rubiales takes over debt.
Location of key Colombian assets
Source: Company data
Field
Fluid Reserves (mmboe)
Resource type
Development phase
Colombia’s Deep and Central Llanos, Neiva & Orito
21.8 1P Producing
Peru - - Brazil - -
Total (net YE12) Oil & gas 21.8 1P
Total (net YE12) Oil & gas 41.2 2P
NPV10 (after tax) US$m 1,616 2P
Valuation
Petrominerales trades at an EV/2P of US$42/boe post Pacific Rubiales bid of C$11 per share for the company (previously $33/boe). An EBITDA per boe of US$56 positions the company at the top of our universe and well above the group’s trendline, with this purchase premium potentially distorting market value comparisons.
Source: Edison Investment Research, company data
BOE
CNE
GPK
GTE
CWV
AMER
MVN
PMG
PPC PRE
PTAPXT
RRS
SRN
TAB
0.0
5.0
10.0
15.0
20.0
25.0
30.0
35.0
40.0
45.0
0.0 20.0 40.0 60.0 80.0 100.0
EV/2P
rese
rves (
US$)
EBITDA 2013e per boe (US$)
IE
Platino’s Coati-1 exploration well has now been drilled to a total depth of 10,800ft, with preliminary testing results expected in Q413. Believed by management to be the company’s largest prospect, Coati-1 could provide significant near-term catalysts. Further, Putumayo-8 (PUT-8) exploration well is expected to spud in H214 and, while estimated at half the risked potential of Coati, it adds upside and diversification to the story.
Year end Revenue (US$m)
EBITDA (US$m)
PBT (US$m)
Debt (US$m)
Net (debt)/ cash (US$m)
Capex (US$m)
12/11 0.0 (0.5) (0.5) 0.0 94.2 (10.3) 12/12 0.0 (0.8) (0.8) 0.0 89.5 (10.4) 12/13e N/A N/A N/A N/A 60.0 (15.8) 12/14e N/A N/A N/A N/A 37.0 (25.0) Source: Bloomberg, company data
Assets: Coati-1 well at target depth Spun out in December 2012 following Pacific Rubiales’ acquisition of C&C Energia, Platino’s core assets are exploration blocks Coati and Putumayo-8. Targeting its largest prospect first, Coati-1 (risked estimates of c 6mmbbl) is now at target depth with preliminary results expected in Q413. Platino has a 100% interest in Coati, which will decline to 80% once farm-in partner Canacol earns its 20%. Next up, after some environmental licensing delays, will be PUT-8, which is operated by Vetra (50% stake) and targets risked reserves of c 3mmbbl. Effective July 2013, Platino’s 50% stake in Morpho in Middle Magdalena Basin was assigned to Parex in return for a 4% profit royalty, eliminating future capex in the venture while retaining a stake in profits should the asset prove successful.
Challenges: Beyond target depth Targeting what management believes is Platino’s largest prospect in the portfolio, the results of Coati-1 and PUT-8 could be transformational for the company. Beyond these two assets, we would expect Platino’s biggest challenge to entail moving forward to new targets should results of the current drill programme be inconclusive.
Management and strategy The team is led by Tomas Villamil who founded C&C Energia and has a proven track record in Colombia. Other key members of the team with proven experience in Colombia include Tyler Rimbey, Cesar Vasquez, Fred Watchorn and Andres Modarelli. Partners in exploration include Canacol and Vetra. Currently (Q213) Platino has US$75m of cash available and a planned spending of US$21m in 2013. While its cash position and commitments point to a fully-funded 2014, Platino is pursuing additional farm-in agreements to Andaquies in an effort to add to near-term drilling prospects.
Catalysts Completion and testing of the Coati-1 exploration well and the results of the PUT-8 exploration well in H214 are seen as the main catalysts.
Platino Energy Drilling forward
Price C$0.71* Market cap C$49m
*As at 3 October 2013 Net cash (US$m) as at 30 June 2013 74.7
Shares in issue 68.5m
Free float 61%
Code PZE
Primary exchange TSX-V
Secondary exchange N/A
Share price performance
Business description
Platino Energy is a pure-play exploration oil and gas company formed as a spin-out from the acquisition of C&C Energia by Pacific Rubiales. Its assets are located in Colombia, covering over 279,515 gross acres in the Putumayo basin in Colombia.
Catalysts/next events
Results of Coati exploration well Q413
Spud PUT-8 exploration well H214
Results/testing PUT-8 H214
Analysts
Xavier M Grunauer +1 416 533 8223
Ian McLelland +44 (0)20 3077 5756
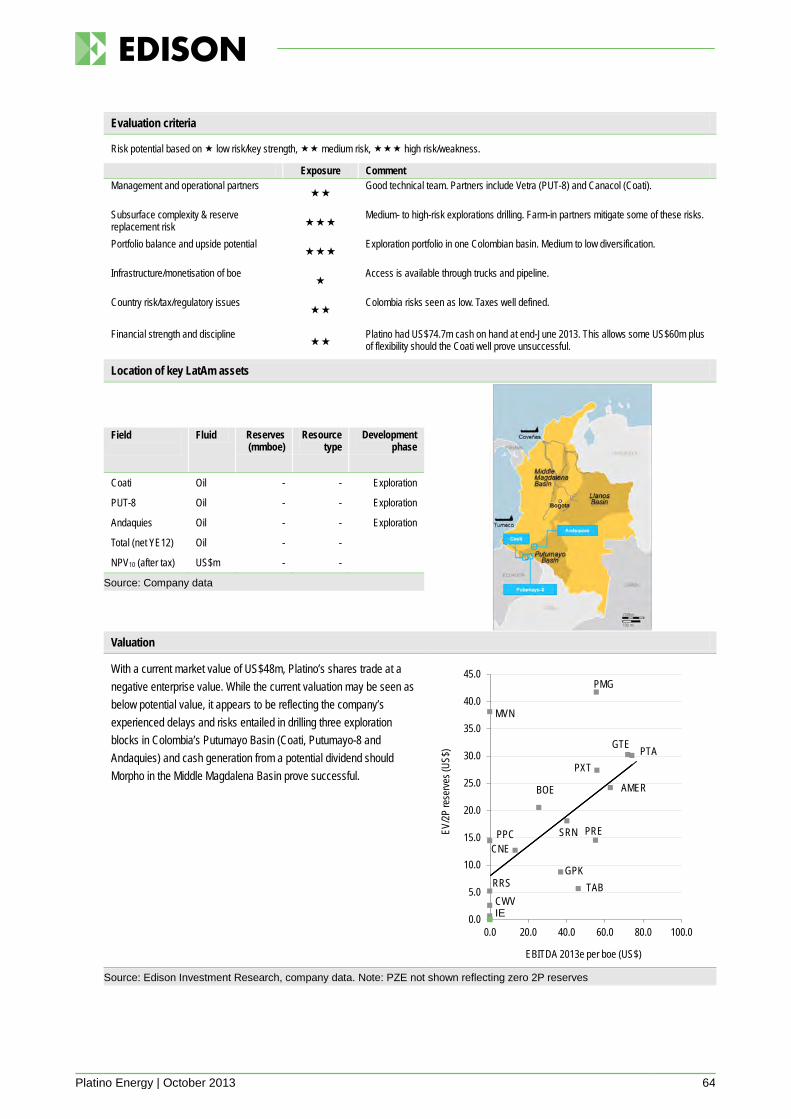
Platino Energy | October 2013 64
Evaluation criteria
Risk potential based on low risk/key strength, medium risk, high risk/weakness.
Exposure Comment Management and operational partners
Good technical team. Partners include Vetra (PUT-8) and Canacol (Coati).
Subsurface complexity & reserve replacement risk
Medium- to high-risk explorations drilling. Farm-in partners mitigate some of these risks.
Portfolio balance and upside potential
Exploration portfolio in one Colombian basin. Medium to low diversification.
Infrastructure/monetisation of boe
Access is available through trucks and pipeline.
Country risk/tax/regulatory issues
Colombia risks seen as low. Taxes well defined.
Financial strength and discipline
Platino had US$74.7m cash on hand at end-June 2013. This allows some US$60m plus of flexibility should the Coati well prove unsuccessful.
Location of key LatAm assets
Source: Company data
Field
Fluid Reserves (mmboe)
Resource type
Development phase
Coati Oil - - Exploration
PUT-8 Oil - - Exploration
Andaquies Oil - - Exploration
Total (net YE12) Oil - - NPV10 (after tax) US$m - -
Valuation
With a current market value of US$48m, Platino’s shares trade at a negative enterprise value. While the current valuation may be seen as below potential value, it appears to be reflecting the company’s experienced delays and risks entailed in drilling three exploration blocks in Colombia’s Putumayo Basin (Coati, Putumayo-8 and Andaquies) and cash generation from a potential dividend should Morpho in the Middle Magdalena Basin prove successful.
Source: Edison Investment Research, company data. Note: PZE not shown reflecting zero 2P reserves
BOE
CNE
GPK
GTE
CWV
AMER
MVN
PMG
PPC PRE
PTAPXT
RRS
SRN
TAB
0.0
5.0
10.0
15.0
20.0
25.0
30.0
35.0
40.0
45.0
0.0 20.0 40.0 60.0 80.0 100.0
EV/2P
rese
rves (
US$)
EBITDA 2013e per boe (US$)
IE
President Energy is a research client of Edison Investment Research Limited
President Energy is primarily a play on exploration in Paraguay, where work in 2013 has continued to extend the company’s understanding of potentially transformative acreage. Analysis of 2D/3D seismic work has revealed at least two major structural fairways and the possibility of risked resource potential of more than 500mmboe. Successful drilling in Q214 could unlock enormous value for the company – we currently hold an illustrative 50mmboe discovery at a risked value of 31p/share. Furthermore, the results of the Argentinian frack stimulation pilot are encouraging, and 3-5mmboe of contingent resources could be converted into reserves. We updated our valuation following the recent update, slightly reducing the RENAV of 55p/share due to the proposed dilution implied by the IFC (World Bank Group) equity financing. President remains a top pick among our coverage.
Year end Revenue (US$m)
EBITDA (US$m)
PBT (US$m)
Net (debt)/ cash (US$m)
Capex (US$m)
12/10 3.4 (3.3) (7.3) 44.3 (12.0) 12/11 7.0 (20.1) (21.7) 6.3 (30.9) 12/12 11.3 (2.9) (6.9) 17.5 (24.1) 12/13e 13.9 (1.3) (4.4) 15.4 (14.7) Source: Edison Investment Research, company data
Paraguay could be a company maker President Energy holds up to 60% in two blocks in Paraguay, where the seismic programme has revealed potential of more than 500mmboe of risked resource within the acreage. The basin has existing production on the Argentine side and these assets are expected to offer relatively low-risk exploration. An oil discovery would be extremely valuable given the fiscal terms (we estimate around US$18/bbl), so any field could prove a company maker. More detail can be found in recent notes.
Argentina The Argentine assets should see to increased production and cash flow over time. The results of the stimulation pilot indicate that further reserves can be unlocked from the tight carbonates, putting the region in a virtuous circle of excess cash flow.
Management and strategy The management team includes chairman Peter Levine (ex-Imperial Energy). Technical staff and non-executive directors include two former chief geologists of BP and a VP of worldwide exploration at Anadarko.
Catalysts We expect a resource report from the company with a CPR to follow in Q413. With the support of the IFC and chairman Peter Levine, the company has two large, stable shareholders and is in a strong position to drill a three-well campaign in Paraguay in Q214. The company offers investors the opportunity to invest in a funded explorer drilling in a relatively low-risk exploration province where success would be transformational.
President Energy Opening up Paraguay
Price 24.75p* Market cap £67m
*As at 3 October 2013 Net cash (US$m) as at 30 June 2013 6.8
Shares in issue 269m
Free float 35%
Code PPC
Primary exchange AIM
Secondary exchange N/A
Share price performance
Business description
President Energy is a South-American focused E&P with assets in Paraguay, Argentina, the US and Australia (non-core). With a strong board and prospective assets, we expect material newsflow in 2013 and 2014.
Catalysts/next events
Resource update November 2013
Paraguay CPR December 2013
Analysts
Will Forbes +44 (0)20 3077 5749
Xavier M Grunauer +1 416 533 8223
Ian McLelland +44 (0)20 3077 5756
Edison profile page
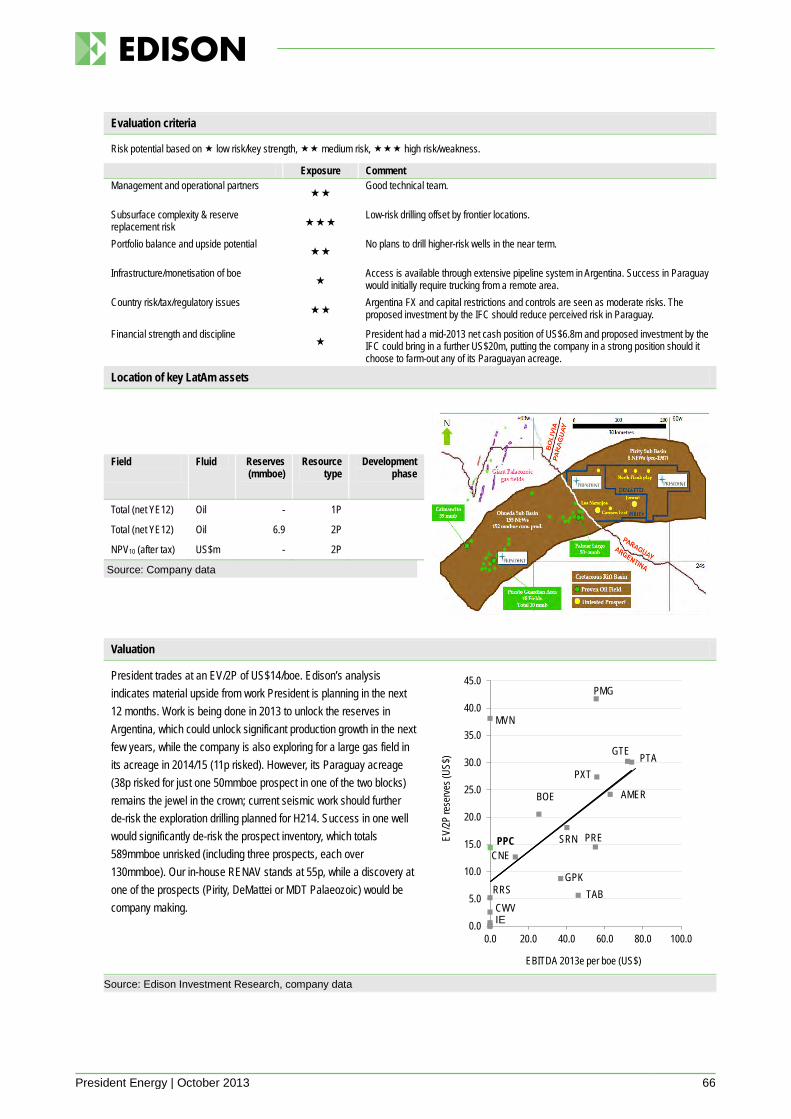
President Energy | October 2013 66
Evaluation criteria
Risk potential based on low risk/key strength, medium risk, high risk/weakness.
Exposure Comment Management and operational partners
Good technical team.
Subsurface complexity & reserve replacement risk
Low-risk drilling offset by frontier locations.
Portfolio balance and upside potential
No plans to drill higher-risk wells in the near term.
Infrastructure/monetisation of boe
Access is available through extensive pipeline system in Argentina. Success in Paraguay would initially require trucking from a remote area.
Country risk/tax/regulatory issues
Argentina FX and capital restrictions and controls are seen as moderate risks. The proposed investment by the IFC should reduce perceived risk in Paraguay.
Financial strength and discipline
President had a mid-2013 net cash position of US$6.8m and proposed investment by the IFC could bring in a further US$20m, putting the company in a strong position should it choose to farm-out any of its Paraguayan acreage.
Location of key LatAm assets
Source: Company data
Field
Fluid Reserves (mmboe)
Resource type
Development phase
Total (net YE12) Oil - 1P
Total (net YE12) Oil 6.9 2P NPV10 (after tax) US$m - 2P
Valuation
President trades at an EV/2P of US$14/boe. Edison’s analysis indicates material upside from work President is planning in the next 12 months. Work is being done in 2013 to unlock the reserves in Argentina, which could unlock significant production growth in the next few years, while the company is also exploring for a large gas field in its acreage in 2014/15 (11p risked). However, its Paraguay acreage (38p risked for just one 50mmboe prospect in one of the two blocks) remains the jewel in the crown; current seismic work should further de-risk the exploration drilling planned for H214. Success in one well would significantly de-risk the prospect inventory, which totals 589mmboe unrisked (including three prospects, each over 130mmboe). Our in-house RENAV stands at 55p, while a discovery at one of the prospects (Pirity, DeMattei or MDT Palaeozoic) would be company making.
Source: Edison Investment Research, company data
BOE
CNE
GPK
GTE
CWV
AMER
MVN
PMG
PPC PRE
PTAPXT
RRS
SRN
TAB
0.0
5.0
10.0
15.0
20.0
25.0
30.0
35.0
40.0
45.0
0.0 20.0 40.0 60.0 80.0 100.0
EV/2P
rese
rves (
US$)
EBITDA 2013e per boe (US$)
IE
Range Resources is a research client of Edison Investment Research Limited
Range’s operational focus is Trinidad where it has a major development programme underway aimed at boosting production from 700b/d to 8mb/d by 2015. A A$105m merger was announced in April with NSX-listed International Petroleum but this has yet to be consummated pending the disposal of the core Russian assets. Assuming the merger takes place, Range will emerge primarily as a LatAm development play with interesting exploration upside in Africa, Georgia and Kazakhstan.
Year end Revenue (US$m)
EBITDA (US$m)
PBT (US$m)
Debt (US$m)
Net (debt)/ cash (US$m)
Capex (US$m)
06/11 3.2 0.0 0.0 0.0 18.4 0.0 06/12 25.0 (22.0) (32.9) 0.0 10.6 (26.9) 06/13 27.3 (5.8) (17.6) (11.0) (9.3) (12.3) Source: Edison Investment Research, company data. Note: PBT is normalised.
Assets: Trinidad assets are core Range has a suite of LatAm exploration/development assets in Trinidad, Guatemala and Colombia. In addition, it has frontier exploration interests in Puntland-Somalia and development assets focused on CBM in RO Georgia. The reserve base is significant for a junior with 1P, 2P and 3P of 17.6, 20.2 and 25.2mm barrels respectively. Virtually all the reserves and the production of 700b/d stem from Trinidad. Production is scheduled to gather pace in Trinidad in the coming months following an intensified drilling programme. A waterflood project is also planned for 2014/15. The move into Guatemala in January has proved highly successful with commercial quantities of high quality oil discovered at the Atzam 4 well.
Challenges: Boosting Trinidad production Range’s principal near-term challenge is to boost Trinidad production from recent disappointing levels. The key to this will be completing the refurbishment of the in-house rig fleet, which has been plagued by reliability issues. Reserve-based financing has been arranged for the development programme in Trinidad. Other major issues facing the company are completing the International Petroleum merger and concluding the disposal of the Texas assets. Range has a definitive agreement to sell these for $30m, including a $5m royalty but awaits payment.
Management and strategy Range is led by Peter Landau, an experienced businessman in the resources sector. The strategic thrust is very much focused on unlocking the potential of the Trinidad assets. In July Range announced a major increase in its Trinidad exposure through a proposed farm-in to Niko Resources onshore and offshore interests.
Catalysts Near term, the key share price drivers are likely to be concluding the Texas disposal, completing the International merger and regaining momentum on the Trinidad development programme. Long term, the acid test for Range will be Trinidad output.
Range Resources It’s mainly about Trinidad
Price A$0.035* Market cap A$110m
*As at 3 October 2013 Net debt (US$m) 30 June 2013 (9.3)
Shares in issue 3,149m
Free float 100%
Code RRS
Primary exchange ASX
Secondary exchange AIM
Share price performance
Business description
Range Resources is a dual ASX- and AIM-listed E&P junior. The operational focus is currently Trinidad, where a major development programme is underway. There are also exploration interests in Puntland-Somalia, Republic of Georgia, Colombia and Guatemala.
Catalysts/next events
Trinidad development programme October 2013
Texas disposal (pending) October 2013
International merger (pending) October 2013
Guatemala Atzam 5 well spud October 2013
Analysts
Peter J Dupont +44 (0)20 3077 5741
Xavier M Grunauer +1 416 533 8223
Ian McLelland +44 (0)20 3077 5756
Edison profile page
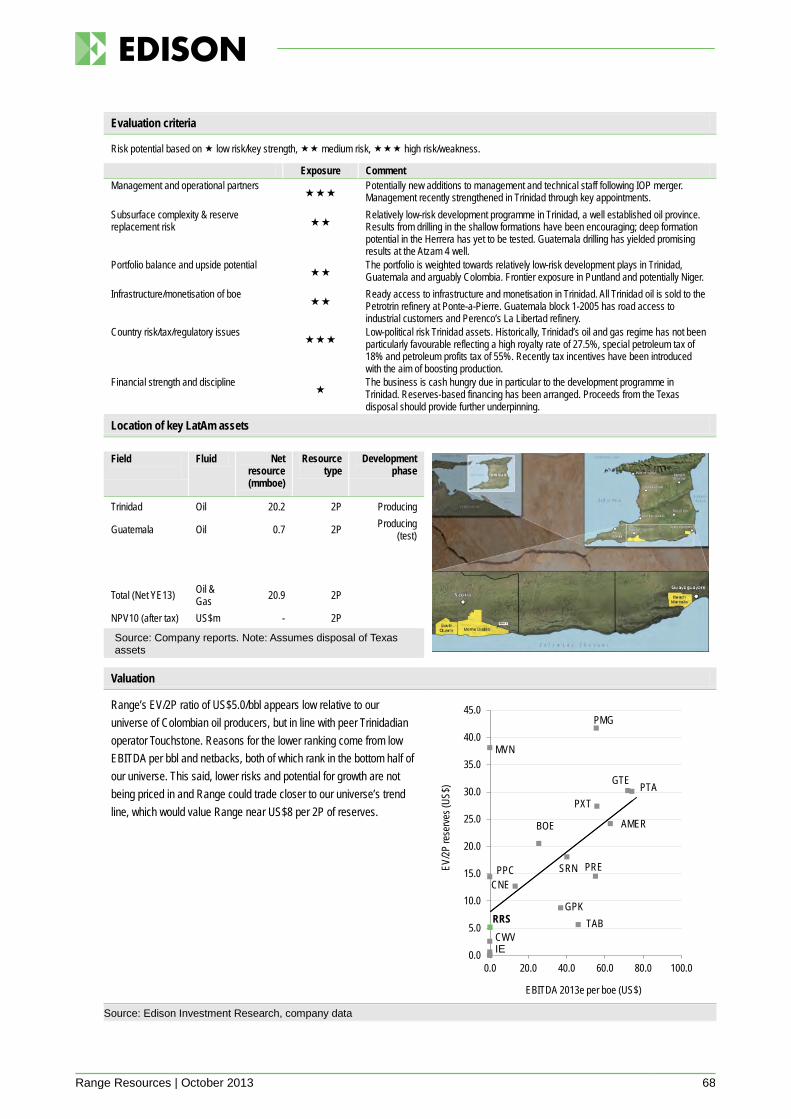
Range Resources | October 2013 68
Evaluation criteria
Risk potential based on low risk/key strength, medium risk, high risk/weakness.
Exposure Comment Management and operational partners
Potentially new additions to management and technical staff following IOP merger. Management recently strengthened in Trinidad through key appointments.
Subsurface complexity & reserve replacement risk
Relatively low-risk development programme in Trinidad, a well established oil province. Results from drilling in the shallow formations have been encouraging; deep formation potential in the Herrera has yet to be tested. Guatemala drilling has yielded promising results at the Atzam 4 well.
Portfolio balance and upside potential
The portfolio is weighted towards relatively low-risk development plays in Trinidad, Guatemala and arguably Colombia. Frontier exposure in Puntland and potentially Niger.
Infrastructure/monetisation of boe
Ready access to infrastructure and monetisation in Trinidad. All Trinidad oil is sold to the Petrotrin refinery at Ponte-a-Pierre. Guatemala block 1-2005 has road access to industrial customers and Perenco’s La Libertad refinery.
Country risk/tax/regulatory issues
Low-political risk Trinidad assets. Historically, Trinidad’s oil and gas regime has not been particularly favourable reflecting a high royalty rate of 27.5%, special petroleum tax of 18% and petroleum profits tax of 55%. Recently tax incentives have been introduced with the aim of boosting production.
Financial strength and discipline
The business is cash hungry due in particular to the development programme in Trinidad. Reserves-based financing has been arranged. Proceeds from the Texas disposal should provide further underpinning.
Location of key LatAm assets
Field
Fluid Net resource (mmboe)
Resource type
Development phase
Trinidad Oil 20.2 2P Producing
Guatemala Oil 0.7 2P Producing (test)
Total (Net YE13) Oil & Gas 20.9 2P
NPV10 (after tax) US$m - 2P
Source: Company reports. Note: Assumes disposal of Texas assets
Valuation
Range’s EV/2P ratio of US$5.0/bbl appears low relative to our universe of Colombian oil producers, but in line with peer Trinidadian operator Touchstone. Reasons for the lower ranking come from low EBITDA per bbl and netbacks, both of which rank in the bottom half of our universe. This said, lower risks and potential for growth are not being priced in and Range could trade closer to our universe’s trend line, which would value Range near US$8 per 2P of reserves.
Source: Edison Investment Research, company data
BOE
CNE
GPK
GTE
CWV
AMER
MVN
PMG
PPC PRE
PTAPXT
RRS
SRN
TAB
0.0
5.0
10.0
15.0
20.0
25.0
30.0
35.0
40.0
45.0
0.0 20.0 40.0 60.0 80.0 100.0
EV/2P
rese
rves (
US$)
EBITDA 2013e per boe (US$)
IE
Suroco operates in Colombia’s Putumayo basin through a partnership with Vetra and Ecopetrol. Current assets deliver production of 1.67mb/d (net) and an expected 2013 cash flow of over US$20m, which we expect will be reinvested into a development drilling and water-flood programme. Further to development drilling, the company holds a 50% stake in the Alea 1848A exploration block, where it plans to spud one exploration well in 2014.
Year end Revenue (US$m)
EBITDA (US$m)
PBT (US$m)
Debt (US$m)
Net (debt)/ cash (US$m)
Capex (US$m)
12/11 47.1 25.3 7.8 2.3 17.7 (26.8) 12/12 52.2 22.6 11.8 2.7 1.9 (26.9) 12/13e N/A N/A N/A N/A 5.0 (32.0) 12/14e N/A N/A N/A N/A 6.0 (26.4) Source: Bloomberg, company data
Assets: Focused on Putumayo Suroco holds a 15.8% non-operating working interest in the Suroriente Block in Putumayo, Colombia, which delivered all of its 1.67mb/d oil production in Q213. Production in Suroriente comes from Pinuna-Quillacinga, which produces 29° API oil from the Villeta U and T sands; and Cohembi, which delivers a heavier oil averaging 19° API from the Villeta N sand. Capex of US$31.7m is aimed at development drilling, expected to deliver over 20 new wells into 2014, as well as a water-flood programme that will include infrastructure costs. The capital programme is expected to be funded by cash from operations and US$17.6m cash (June 2013).
Challenges: Transport and high-impact exploration Suroco’s oil production is transported by truck to nearby pipelines, which in the past year have been disrupted, a problem that could continue medium term. We expect challenges for the company to include taking on the bigger role of operator in the production of assets and, with this, the challenge of navigating new growth opportunities outside of the current Vetra-led consortium. Recent acquisition of a 25% interest in PUT-2 from PetroNova for US$3m is seen as positive and in line with strategy laid out by management.
Management and strategy Led by president and CEO Alastair Hill (formerly of EnCana), the management team is experienced. CFO Travis Doupe’s previous postings include Milagro Energy and Sherritt Oil and Gas. The team has attracted partners such as Ecopetrol and Vetra. The company strategy entails building a balanced exploration and production portfolio in the Putumayo Basin, where it plans to continue developing expertise and growing reserves and production.
Catalysts Drilling rig is currently on Pinuna, which is to be followed by Quinde step-out well and two appraisal wells at Cohembi in late Q413. A larger medium-term catalyst may arise from the degree of success of the water/polymer flood and the resulting uplift in 2P reserves.
Suroco Energy A development focus until 2014
Price C$0.35* Market cap C$47m
*As at 3 October 2013 Net debt (US$m) as at 30 June2013 1.3
Shares in issue 134m
Free float 81%
Code SRN
Primary exchange TSX-V
Secondary exchange OTC US
Share price performance
Business description
Suroco Energy holds a 15.8% non-operating interest in the Suroriente Block in Colombia’s Putumayo Basin where light and medium-quality oil is produced from two fields: Pinuna-Quillacinga and Cohembi. New activities are expected to focus on secondary recovery and development drilling.
Catalysts/next events
Q3 results 27 November 2013
Pinuna 7 step-out Q313
Environmental approval at Cohembi Q313
Cohembi appraisal (subject to ELA) Q414
Exploration well in Alea 1848A Block
January 2014
Analysts
Xavier M Grunauer +1 416 533 8223
Ian McLelland +44 (0)20 3077 5756
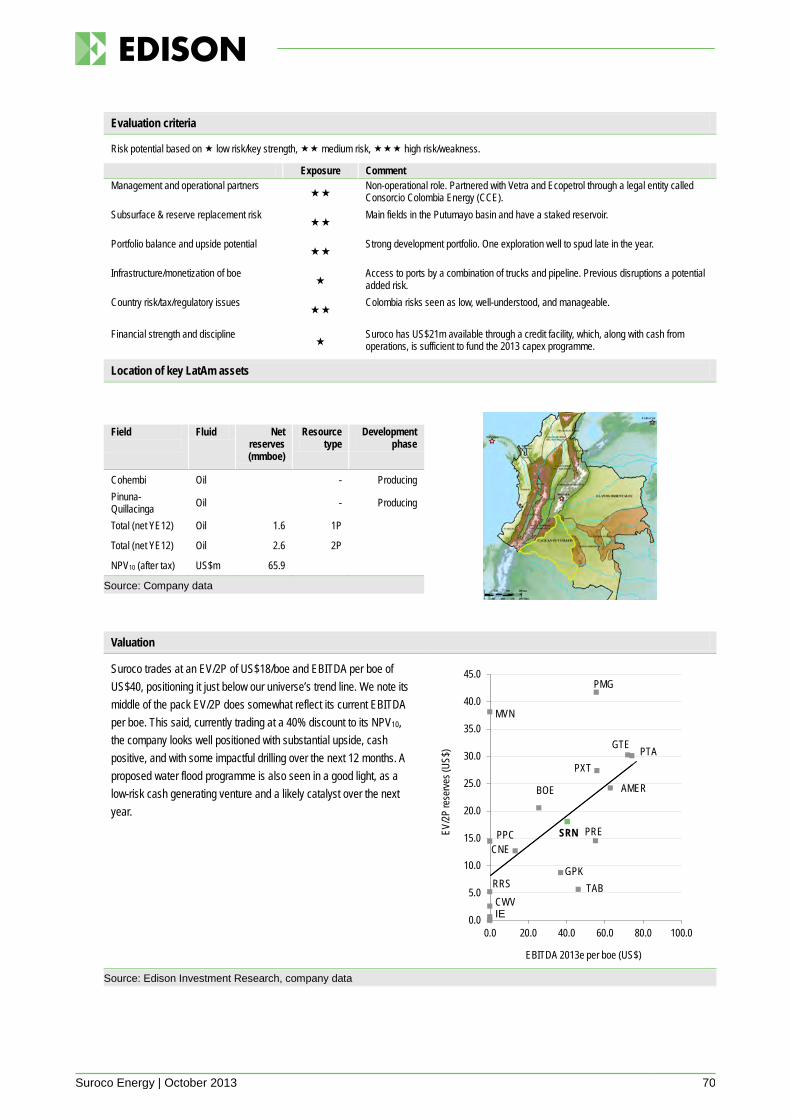
Suroco Energy | October 2013 70
Evaluation criteria
Risk potential based on low risk/key strength, medium risk, high risk/weakness.
Exposure Comment Management and operational partners
Non-operational role. Partnered with Vetra and Ecopetrol through a legal entity called Consorcio Colombia Energy (CCE).
Subsurface & reserve replacement risk
Main fields in the Putumayo basin and have a staked reservoir.
Portfolio balance and upside potential
Strong development portfolio. One exploration well to spud late in the year.
Infrastructure/monetization of boe
Access to ports by a combination of trucks and pipeline. Previous disruptions a potential added risk.
Country risk/tax/regulatory issues
Colombia risks seen as low, well-understood, and manageable.
Financial strength and discipline
Suroco has US$21m available through a credit facility, which, along with cash from operations, is sufficient to fund the 2013 capex programme.
Location of key LatAm assets
Source: Company data
Field
Fluid Net reserves (mmboe)
Resource type
Development phase
Cohembi Oil - Producing Pinuna-Quillacinga Oil - Producing
Total (net YE12) Oil 1.6 1P
Total (net YE12) Oil 2.6 2P
NPV10 (after tax) US$m 65.9
Valuation
Suroco trades at an EV/2P of US$18/boe and EBITDA per boe of US$40, positioning it just below our universe’s trend line. We note its middle of the pack EV/2P does somewhat reflect its current EBITDA per boe. This said, currently trading at a 40% discount to its NPV10, the company looks well positioned with substantial upside, cash positive, and with some impactful drilling over the next 12 months. A proposed water flood programme is also seen in a good light, as a low-risk cash generating venture and a likely catalyst over the next year.
Source: Edison Investment Research, company data
BOE
CNE
GPK
GTE
CWV
AMER
MVN
PMG
PPC PRE
PTAPXT
RRS
SRN
TAB
0.0
5.0
10.0
15.0
20.0
25.0
30.0
35.0
40.0
45.0
0.0 20.0 40.0 60.0 80.0 100.0
EV/2P
rese
rves (
US$)
EBITDA 2013e per boe (US$)
IE
Touchstone Exploration is a research client of Edison Investment Research Limited
Touchstone is moving forward with a focused recompletion, reactivation and infill drilling programme, which we find relatively low-risk and well-positioned. We are expecting the company to drill 10 vertical wells in this financial year, with our models pointing to a resulting 51% y-o-y increase in oil production to an average of 1.75mb/d, generating sufficient cash flow to cover capex and potentially partially pay down debt. With Touchstone trading well below our core NAV of C$0.64/share, we find substantial value in the story, should drilling costs and production targets be met.
Year end Revenue (US$m)
EBITDA (US$m)
PBT (US$m)
Debt (US$m)
Net (debt)/ cash (US$m)
Capex (US$m)
09/11 14.05 2.7 1.0 14.2 (18.8) (5.1) 09/12 40.35 16.1 4.3 24.4 (17.1) (14.8) 09/13e 58.00 33.1 22.55 19.7 (10.4) (9.5) 09/14e 78.82 38.3 26.15 19.6 (4.8) (12.0) Source: Edison Investment Research, company data
Assets: Onshore Trinidad Touchstone owns and operates 11 onshore producing assets, eight onshore exploration blocks and two offshore exploration blocks. Currently in the third year of operations in Trinidad, Touchstone has delivered growth from: 1) a low-risk development drilling programme; 2) successful recompletion drilling; and 3) well-timed acquisitions. Production has increased to a current 1.75mb/d, and while some operating technical difficulties should be expected, we are of the opinion that the ‘proof-of-concept’ stage is coming to an end, with a potential doubling of production from FY12 levels becoming a very real possibility.
Challenges: Beyond this year’s 10 wells Approaching the last leg of its 2013 drilling programme, Touchstone is expecting to have drilled 10 vertical wells by financial year end, at an average cost of US$0.75m per well, with current wells pointing to IP averages of 50b/d. Should well cost and production increases all add up in 2013, Touchstone is looking to target up to two new wells a month, along with production averages of over 2.5mb/d for FY15.
Management and strategy The team is led by Paul Baay and Ron Bryant, both with over 25 years of experience. Team members can boast experience in the development of mature assets, entailing recompletions as well the identification and exploitation of undeveloped horizons within mature fields. The company’s strategy is to create a proof of concept in the recompletion of Trinidadian fields and capitalise on developed expertise to deploy resources and grow reserves and production.
Catalysts Near-term catalysts are likely to entail organic production growth. Potential divestment of non-core offshore exploration blocks East Brighton (A and B) are also possible, with proceeds from a sale expected in the US$5-10m range, and potentially used to clean up dilutive balance sheet items.
Touchstone Exploration Growing onshore Trinidad
Price C$0.20* Market cap C$28m
*As at 3 October 2013 Net debt (US$) as at 30 June 2013 26
Shares in issue 139m
Free float 90%
Code TAB
Primary exchange TSX-V
Secondary exchange N/A
Share price performance
Business description
Touchstone Exploration’s primary business entails acquisitions of prospective onshore oil and gas properties in Trinidad, as well as drilling and recompletion of existing wells, making use of advanced technology.
Catalysts/next events
2013 results Late January 2014
Development programme Ongoing
Potential divestment of East Brighton
December 2013
Analysts
Xavier M Grunauer +1 416 533 8223
Ian McLelland +44 (0)20 3077 5756
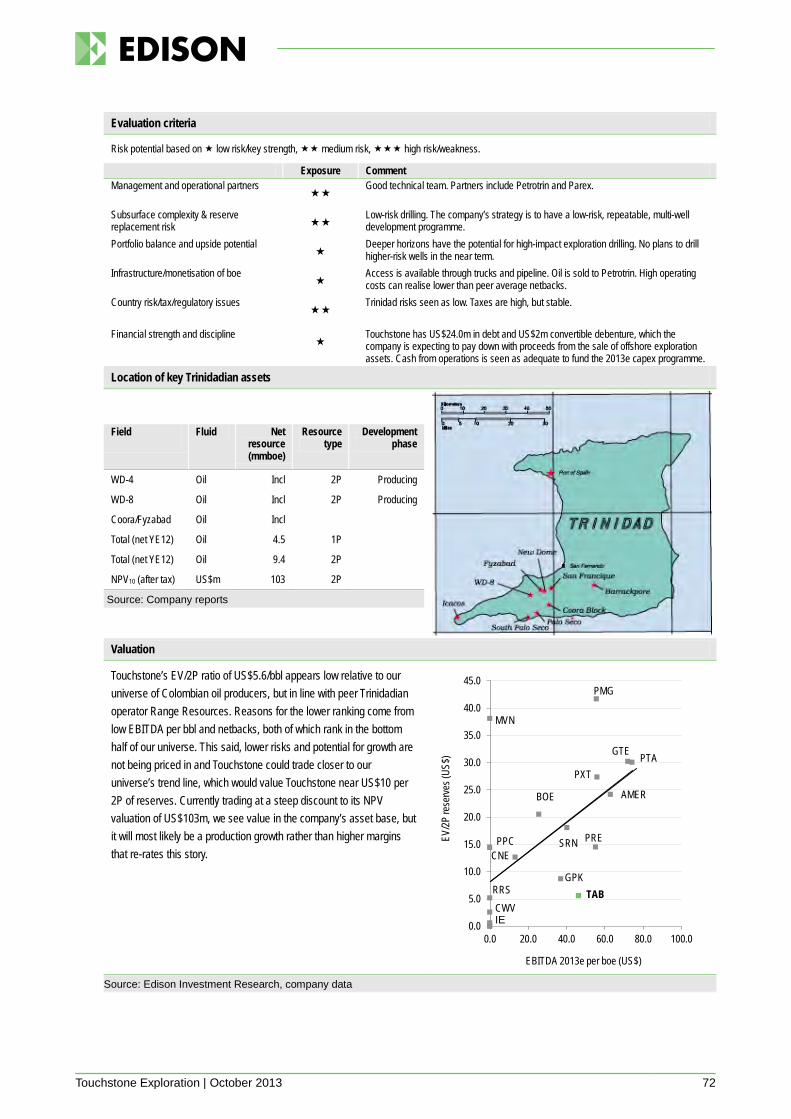
Touchstone Exploration | October 2013 72
Evaluation criteria
Risk potential based on low risk/key strength, medium risk, high risk/weakness.
Exposure Comment Management and operational partners
Good technical team. Partners include Petrotrin and Parex.
Subsurface complexity & reserve replacement risk
Low-risk drilling. The company’s strategy is to have a low-risk, repeatable, multi-well development programme.
Portfolio balance and upside potential
Deeper horizons have the potential for high-impact exploration drilling. No plans to drill higher-risk wells in the near term.
Infrastructure/monetisation of boe
Access is available through trucks and pipeline. Oil is sold to Petrotrin. High operating costs can realise lower than peer average netbacks.
Country risk/tax/regulatory issues
Trinidad risks seen as low. Taxes are high, but stable.
Financial strength and discipline
Touchstone has US$24.0m in debt and US$2m convertible debenture, which the company is expecting to pay down with proceeds from the sale of offshore exploration assets. Cash from operations is seen as adequate to fund the 2013e capex programme.
Location of key Trinidadian assets
Source: Company reports
Field
Fluid Net resource (mmboe)
Resource type
Development phase
WD-4 Oil Incl 2P Producing
WD-8 Oil Incl 2P Producing
Coora/Fyzabad Oil Incl
Total (net YE12) Oil 4.5 1P
Total (net YE12) Oil 9.4 2P NPV10 (after tax) US$m 103 2P
Valuation
Touchstone’s EV/2P ratio of US$5.6/bbl appears low relative to our universe of Colombian oil producers, but in line with peer Trinidadian operator Range Resources. Reasons for the lower ranking come from low EBITDA per bbl and netbacks, both of which rank in the bottom half of our universe. This said, lower risks and potential for growth are not being priced in and Touchstone could trade closer to our universe’s trend line, which would value Touchstone near US$10 per 2P of reserves. Currently trading at a steep discount to its NPV valuation of US$103m, we see value in the company’s asset base, but it will most likely be a production growth rather than higher margins that re-rates this story.
Source: Edison Investment Research, company data
BOE
CNE
GPK
GTE
CWV
AMER
MVN
PMG
PPC PRE
PTAPXT
RRS
SRN
TAB
0.0
5.0
10.0
15.0
20.0
25.0
30.0
35.0
40.0
45.0
0.0 20.0 40.0 60.0 80.0 100.0
EV/2P
rese
rves (
US$)
EBITDA 2013e per boe (US$)
IE

Healthcare quarterly | 10 April 2013 2
Edison, the investment intelligence firm, is the future of investor interaction with corporates. Our team of over 100 analysts and investment professionals work with leading companies, fund managers and investment banks worldwide to support their capital markets activity. We provide services to more than 400 retained corporate and investor clients from our offices in London, New York, Frankfurt, Sydney and Wellington. Edison is authorised and regulated by the Financial Services Authority (www.fsa.gov.uk/register/firmBasicDetails.do?sid=181584). Edison Investment Research (NZ) Limited (Edison NZ) is the New Zealand subsidiary of Edison. Edison NZ is registered on the New Zealand Financial Service Providers Register (FSP number 247505) and is registered to provide wholesale and/or generic financial adviser services only. Edison Investment Research Inc (Edison US) is the US subsidiary of Edison and is not regulated by the Securities and Exchange Commission. Edison Investment Research Limited (Edison Aus) [46085869] is the Australian subsidiary of Edison and is not regulated by the Australian Securities and Investment Commission. Edison Germany is a branch entity of Edison Investment Research Limited [4794244]. www.edisongroup.com DISCLAIMER Copyright 2013 Edison Investment Research Limited. All rights reserved. This report has been prepared and issued by Edison for publication globally. All information used in the publication of this report has been compiled from publicly available sources that are believed to be reliable, however we do not guarantee the accuracy or completeness of this report. Opinions contained in this report represent those of the research department of Edison at the time of publication. The securities described in the Investment Research may not be eligible for sale in all jurisdictions or to certain categories of investors. This research is issued in Australia by Edison Aus and any access to it, is intended only for "wholesale clients" within the meaning of the Australian Corporations Act. The Investment Research is distributed in the United States by Edison US to major US institutional investors only. Edison US is not registered as an investment adviser with the Securities and Exchange Commission. Edison US relies upon the "publishers' exclusion" from the definition of investment adviser under Section 202(a)(11) of the Investment Advisers Act of 1940 and corresponding state securities laws. As such, Edison does not offer or provide personalised advice. We publish information about companies in which we believe our readers may be interested and this information reflects our sincere opinions. The information that we provide or that is derived from our website is not intended to be, and should not be construed in any manner whatsoever as, personalised advice. Also, our website and the information provided by us should not be construed by any subscriber or prospective subscriber as Edison’s solicitation to effect, or attempt to effect, any transaction in a security. The research in this document is intended for New Zealand resident professional financial advisers or brokers (for use in their roles as financial advisers or brokers) and habitual investors who are “wholesale clients” for the purpose of the Financial Advisers Act 2008 (FAA) (as described in sections 5(c) (1)(a), (b) and (c) of the FAA). It is not intended for retail clients. This is not a solicitation or inducement to buy, sell, subscribe, or underwrite any securities mentioned or in the topic of this document. This document is provided for information purposes only and should not be construed as an offer or solicitation for investment in any securities mentioned or in the topic of this document. Edison has a restrictive policy relating to personal dealing. Edison Group does not conduct any investment business and, accordingly, does not itself hold any positions in the securities mentioned in this report. However, the respective directors, officers, employees and contractors of Edison may have a position in any or related securities mentioned in this report. Edison or its affiliates may perform services or solicit business from any of the companies mentioned in this report. The value of securities mentioned in this report can fall as well as rise and are subject to large and sudden swings. In addition it may be difficult or not possible to buy, sell or obtain accurate information about the value of securities mentioned in this report. Past performance is not necessarily a guide to future performance. Forward-looking information or statements in this report contain information that is based on assumptions, forecasts of future results, estimates of amounts not yet determinable, and therefore involve known and unknown risks, uncertainties and other factors which may cause the actual results, performance or achievements of their subject matter to be materially different from current expectations. For the purpose of the FAA, the content of this report is of a general nature, is intended as a source of general information only and is not intended to constitute a recommendation or opinion in relation to acquiring or disposing (including refraining from acquiring or disposing) of securities. The distribution of this document is not a “personalised service” and, to the extent that it contains any financial advice, is intended only as a “class service” provided by Edison within the meaning of the FAA (ie without taking into account the particular financial situation or goals of any person). As such, it should not be relied upon in making an investment decision. To the maximum extent permitted by law, Edison, its affiliates and contractors, and their respective directors, officers and employees will not be liable for any loss or damage arising as a result of reliance being placed on any of the information contained in this report and do not guarantee the returns on investments in the products discussed in this publication. FTSE International Limited (“FTSE”) © FTSE 2013. “FTSE®” is a trade mark of the London Stock Exchange Group companies and is used by FTSE International Limited under license. All rights in the FTSE indices and/or FTSE ratings vest in FTSE and/or its licensors. Neither FTSE nor its licensors accept any liability for any errors or omissions in the FTSE indices and/or FTSE ratings or underlying data. No further distribution of FTSE Data is permitted without FTSE’s express written consent.

Frankfurt +49 (0)69 78 8076 960 Schumannstrasse 34b 60325 Frankfurt Germany
London +44 (0)20 3077 5700 280 High Holborn London, WC1V 7EE United Kingdom
New York +1 646 653 7026 245 Park Avenue, 39th Floor 10167, New York United States
Sydney +61 (0)2 9258 1162 Level 33, Australia Square 264 George St, Sydney NSW 2000, Australia
Wellington +64 (0)4 8948 555 Level 15, 171 Featherston St Wellington 6011 New Zealand
Edison Investment Research Limited is registered in England. Registered office: 280 High Holborn, London, WC1V 7EE. Company number 4794244. www.edisongroup.com