Oecd economic surveys turkey 2012
35
OECD Economic Surveys TURKEY July 2012 OVERVIEW
Transcript of Oecd economic surveys turkey 2012

OECD Economic Surveys TURKEY July 2012
OVERVIEW

This document and any map included herein are without prejudice to the status of or sovereignty over any territory, to the delimitation of international frontiers and boundaries and to the name of any territory, city or area.
The statistical data for Israel are supplied by and under the responsibility of the relevant Israeli authorities. The use of such data by the OECD is without prejudice to the status of the Golan Heights, East Jerusalem and Israeli settlements in the West Bank under the terms of international law.
© OECD 2012 1
Summary
Effective macroeconomic and structural policies helped the Turkish economy rebound vigorously following the global crisis: growth averaged close to 9% in 2010-11, accompanied by strong job creation. In the process, however, the current account deficit widened to around 10% of GDP and consumer price inflation rose to over 10%. The economic slowdown since mid-2011 is helping to reduce these external and domestic imbalances, albeit only gradually, given rising international energy prices. In order to ensure that the current account gap moves back into safer territory and inflation to the 5% target, both macroeconomic and structural policy levers need to be used and action has started to be taken in this direction. This will also lay the basis for sustained improvements in living standards over the longer run.
External competitiveness is essential for Turkey to rebalance the economy from domestic to external demand, as well as to sustain employment, income and domestic savings growth. Competitiveness gains particularly improve employment opportunities of the low-skilled and hence directly help reduce poverty and foster social cohesion.
The current monetary, fiscal and macro-prudential policy mix aims at bringing down inflation and avoiding excessive real exchange rate appreciation while coping with volatile capital flows. To this end, the central bank uses a wide interest rate corridor as well as
intervention. Concomitantly, the supervisory authorities are actively using prudential tools such as loan-to-value ceilings and provisioning requirements to keep credit in check. The overall fiscal position remains sound but the stance could be tighter to better support monetary restraint. A more transparent fiscal framework, with a general government spending cap and greater emphasis on cyclically-adjusted developments, would help too.
Employment and labour market participation rates are on the rise but too many of the new jobs are created in the informal sector and the skills of the majority of the labour force remain too low. Both exert a drag on productivity and competitiveness. To encourage hiring in the formal sector, a more flexible labour contract is needed and minimum wage setting should be decentralised. Enrolment in the education system has risen but there is ample scope to improve quality and equity, notably by granting more autonomy to schools and universities, and shifting to per-student funding with adjustments for socio-economic disadvantages. Upskilling of the existing labour force will be key to improve employability.
Boosting productivity also requires pushing ahead with product market reforms. Greater competition in the energy, telecommunication and agricultural sectors would benefit consumers and economy-wide competitiveness, and help reduce the external deficit. The long-planned liberalisation of the electricity and natural gas sectors needs to be implemented. Broadband internet services need to be more open to competition. Support to agriculture ought to rest less on price support and more on direct transfers and rural development.
Poverty and inequality have declined in Turkey over the past decade but from high levels. For growth to be sufficiently inclusive, social labour force participation, not least by making affordable child and elderly care a priority. The tax and transfer system needs to better protect vulnerable groups without undermining work incentives.
carbon footprint is low but set to rise fast as economic catch-up proceeds, despite a high share of environmentally-related taxes. More reliance on market-based economic incentives to rein in emissions, and greater neutrality across emission sources, are in order.
Over the longer run, keeping up the momentum of convergence with the more advanced OECD economies calls for a smooth unwinding of short-run macroeconomic
demographic dividend. Scenario analysis suggests that by 2030, this could boost the level of output and incomes by as much as 25% relative to the OECD baseline.

© OECD 2012 2
Key policy recommendations
Macroeconomic and structural policies should concentrate on keeping the economy on a balanced and sustainable growth path. Preserving competitiveness in the short and long term is crucial.
Monetary and financial policies
Attaining the inflation target should be given more prominence, to bring inflation expectations closer to the target and, over time, reduce inflation differentials with trading partners.
During capital inflow surges, appreciation pressures should be countered by sterilised intervention. This would appropriately increase foreign exchange reserves.
As planned, comply fully with Basel II banking supervision guidelines and converge in due course with Basel III guidelines.
Fiscal policy
The present fiscal stance is broadly appropriate and should remain tight, not least to preserve room for action were the world economy to weaken. If warranted, stand ready to tighten the fiscal stance more.
Improve fiscal data at general government level, on a unified accounting basis according to international accounting standards.
Adopt a general government spending ceiling within a longer-term fiscal framework. This would help avoid pro-cyclical loosening in case of positive revenue surprises.
Labour market and education policies
The severance payment regime should be re-designed in line with international best practices to make permanent labour contracts more flexible. Temporary and agency employment should be allowed, without sectoral restrictions.
Official minimum wages should be kept in check. Wage adjustments to productivity gains should be sought more through collective bargaining at enterprise level.
The scope and eligibility conditions for the official unemployment insurance
adapted to the Turkish context.
Offer effective lifelong education programmes to upgrade the labour market skills for adults whose schooling was inadequate.
Reduce the large quality gaps among both schools and universities by granting them more autonomy in exchange for more accountability for performance, and by shifting to per-student funding, with adjustments for socio-economic disadvantages.
Increase by providing high-quality and affordable child and elderly care.

© OECD 2012 3
Product market and other structural policies
Liberalise agricultural product markets by reducing the high degree of price interventions, using less distortive forms of support and offering greater scope for import competition. Social cohesion policies in agriculture should rest on direct transfers to eligible farmers and rural development.
The comprehensive energy liberalisation plans prepared in the 2000s should be fully implemented.
Review the structure of fuel taxes and harmonise the implicit carbon tax rate on different fuels in different uses. Co-ordinate fuel taxation initiatives with Climate Change Action Plan priorities.

© OECD 2012 4
Assessment and recommendations
-crisis recovery has drawn heavily on foreign saving
The impact of the global crisis was severe for Turkey, but shorter than in the rest of the OECD area and with a much sharper rebound. Domestic demand recovered swiftly and growth reached 9.2% in 2010 and 8.5% in 2011 (Figure 1). Employment has been remarkably resilient during the crisis, thanks to a set of new pro-employment incentives (OECD/ILO, 2011). Employment in industry declined in 2009 but then rebounded rapidly, whereas employment remained on a rising trend in agriculture, construction and services (Figure 2).
The recovery was facilitated by macroeconomic and structural policy measures. Its pace largely reflects private sector dynamism, both in the more developed Western regions and in less-advanced Anatolia. In the process, Turkish firms have managed to reorient their activities towards a variety of new sectors where they have a comparative advantage, and their exports towards the Middle East and other fast-growing regions.
Figure 1. Turkey's performance has been strong, but imbalances have emerged
1. GDP per capita as per cent of OECD average, at current prices and current PPPs. Estimates for 2011.
2. Annual average per cent change of CPI.
Source: OECD, OECD Economic Outlook and Annual National Accounts databases; Central Bank of Republic of Turkey.

© OECD 2012 5
Figure 2. Strong employment performance
Source: OECD, OECD Economic Outlook and Main Economic Indicators databases.
In the process of the post-crisis recovery, however, significant economic tensions have arisen. With estimated slack shrinking fast and the nominal exchange rate depreciating markedly, consumer price inflation rose to nearly 11% by December 2011, twice the target level, and remained above 10% in early 2012. At the same time, the current account deficit widened to almost 10% of GDP in 2011, a historically unprecedented level even if part of the deterioration was due to oil price increases (Figure 1). These imbalances reflect the macroeconomic policy stance but also a number of structural tensions. This Survey discusses both and identifies policies that may help Turkey overcome them and achieve more sustainable growth.
Government demand has played a limited role in the recovery. It provided a temporary countercyclical stimulus in 2009, which was withdrawn in 2010 and 2011. Household consumption and business investment boomed, bolstered by confidence gains, strong capital inflows and rapid credit growth (Figure 3).
Figure 3. Private demand has been fuelled by credit
1. Net 6-month change in the total loan stock as a percentage of 6-month rolling cumulative GDP.
2. 6-month rolling cumulative current account balance as a percentage of 6-month rolling cumulative GDP. Monthly GDP figures are approximated using the industrial production index.
3. Contributions to year-on-year real GDP growth.
Source: Central Bank of Republic of Turkey; OECD, OECD Economic Outlook database.
© OECD 2012 6
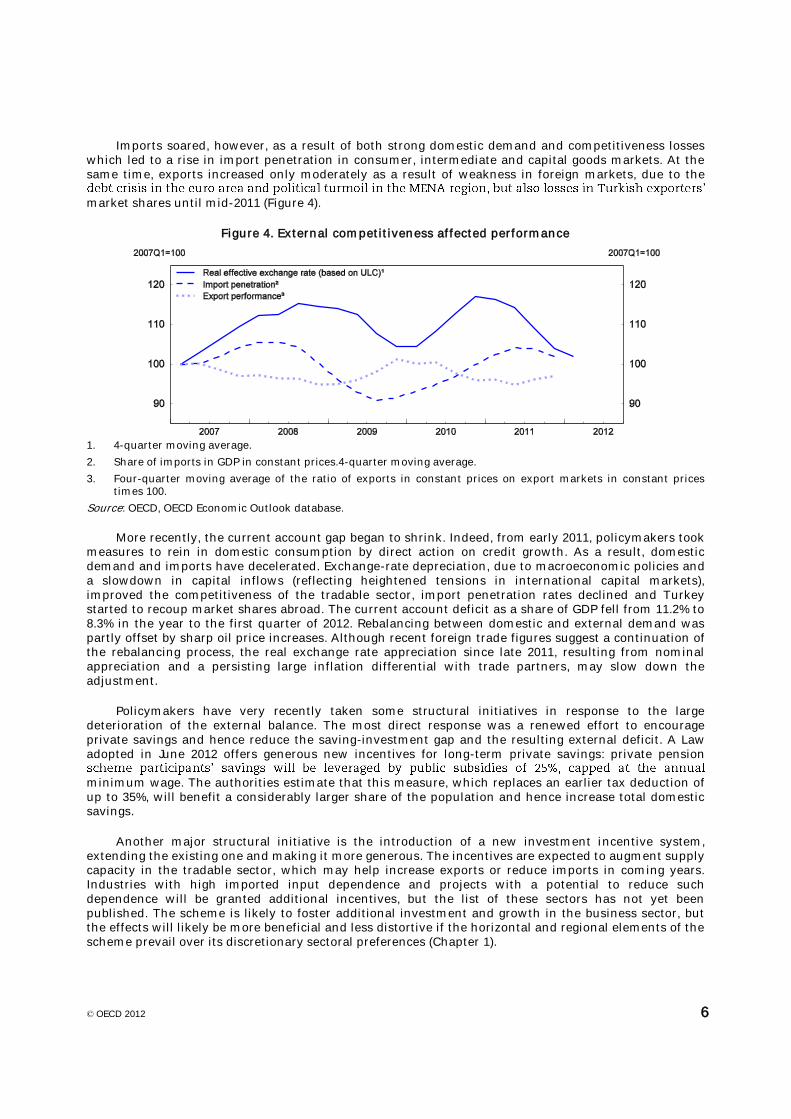
Imports soared, however, as a result of both strong domestic demand and competitiveness losses which led to a rise in import penetration in consumer, intermediate and capital goods markets. At the same time, exports increased only moderately as a result of weakness in foreign markets, due to the
market shares until mid-2011 (Figure 4).
Figure 4. External competitiveness affected performance
1. 4-quarter moving average.
2. Share of imports in GDP in constant prices.4-quarter moving average.
3. Four-quarter moving average of the ratio of exports in constant prices on export markets in constant prices times 100.
Source: OECD, OECD Economic Outlook database.
More recently, the current account gap began to shrink. Indeed, from early 2011, policymakers took measures to rein in domestic consumption by direct action on credit growth. As a result, domestic demand and imports have decelerated. Exchange-rate depreciation, due to macroeconomic policies and a slowdown in capital inflows (reflecting heightened tensions in international capital markets), improved the competitiveness of the tradable sector, import penetration rates declined and Turkey started to recoup market shares abroad. The current account deficit as a share of GDP fell from 11.2% to 8.3% in the year to the first quarter of 2012. Rebalancing between domestic and external demand was partly offset by sharp oil price increases. Although recent foreign trade figures suggest a continuation of the rebalancing process, the real exchange rate appreciation since late 2011, resulting from nominal appreciation and a persisting large inflation differential with trade partners, may slow down the adjustment.
Policymakers have very recently taken some structural initiatives in response to the large deterioration of the external balance. The most direct response was a renewed effort to encourage private savings and hence reduce the saving-investment gap and the resulting external deficit. A Law adopted in June 2012 offers generous new incentives for long-term private savings: private pension
minimum wage. The authorities estimate that this measure, which replaces an earlier tax deduction of up to 35%, will benefit a considerably larger share of the population and hence increase total domestic savings.
Another major structural initiative is the introduction of a new investment incentive system, extending the existing one and making it more generous. The incentives are expected to augment supply capacity in the tradable sector, which may help increase exports or reduce imports in coming years. Industries with high imported input dependence and projects with a potential to reduce such dependence will be granted additional incentives, but the list of these sectors has not yet been published. The scheme is likely to foster additional investment and growth in the business sector, but the effects will likely be more beneficial and less distortive if the horizontal and regional elements of the scheme prevail over its discretionary sectoral preferences (Chapter 1).
© OECD 2012 7
The macroeconomic outlook appears relatively favourable, with risks on both sides
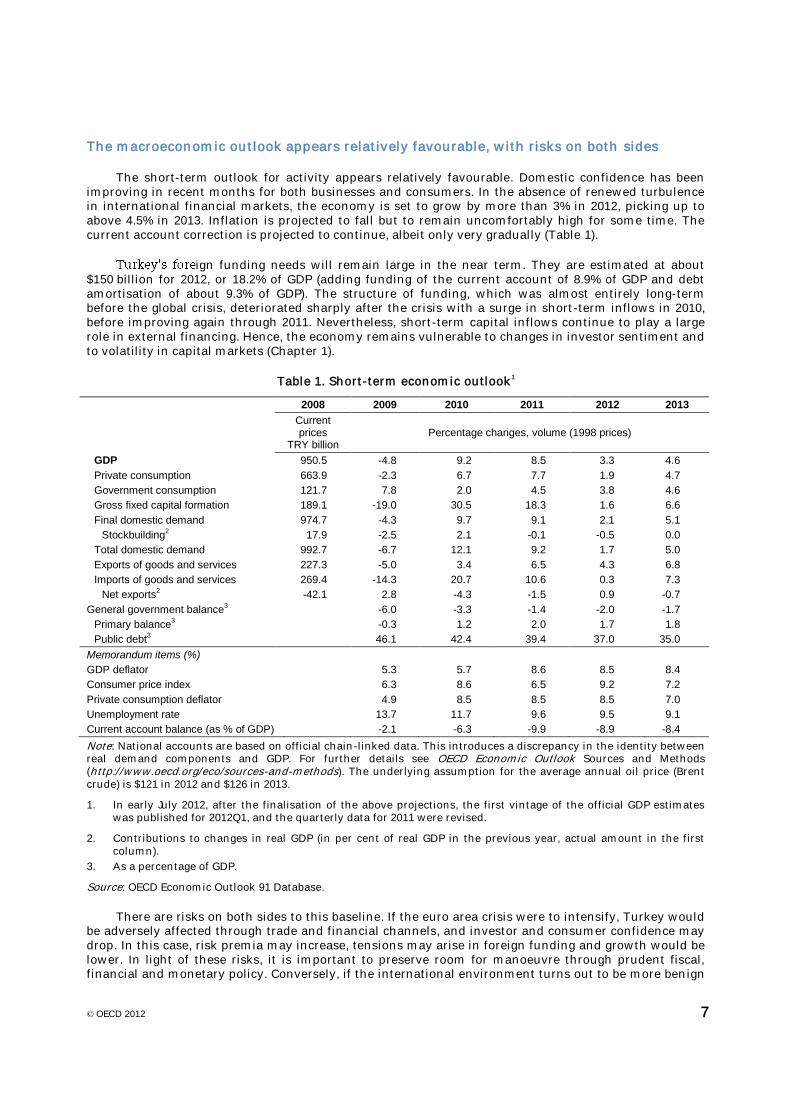
The short-term outlook for activity appears relatively favourable. Domestic confidence has been improving in recent months for both businesses and consumers. In the absence of renewed turbulence in international financial markets, the economy is set to grow by more than 3% in 2012, picking up to above 4.5% in 2013. Inflation is projected to fall but to remain uncomfortably high for some time. The current account correction is projected to continue, albeit only very gradually (Table 1).
ign funding needs will remain large in the near term. They are estimated at about $150 billion for 2012, or 18.2% of GDP (adding funding of the current account of 8.9% of GDP and debt amortisation of about 9.3% of GDP). The structure of funding, which was almost entirely long-term before the global crisis, deteriorated sharply after the crisis with a surge in short-term inflows in 2010, before improving again through 2011. Nevertheless, short-term capital inflows continue to play a large role in external financing. Hence, the economy remains vulnerable to changes in investor sentiment and to volatility in capital markets (Chapter 1).
Table 1. Short-term economic outlook1
2008 2009 2010 2011 2012 2013
Current prices
TRY billion Percentage changes, volume (1998 prices)
GDP 950.5 -4.8 9.2 8.5 3.3 4.6
Private consumption 663.9 -2.3 6.7 7.7 1.9 4.7
Government consumption 121.7 7.8 2.0 4.5 3.8 4.6
Gross fixed capital formation 189.1 -19.0 30.5 18.3 1.6 6.6
Final domestic demand 974.7 -4.3 9.7 9.1 2.1 5.1
Stockbuilding2
17.9 -2.5 2.1 -0.1 -0.5 0.0
Total domestic demand 992.7 -6.7 12.1 9.2 1.7 5.0
Exports of goods and services 227.3 -5.0 3.4 6.5 4.3 6.8
Imports of goods and services 269.4 -14.3 20.7 10.6 0.3 7.3
Net exports2
-42.1 2.8 -4.3 -1.5 0.9 -0.7
General government balance3
-6.0 -3.3 -1.4 -2.0 -1.7
Primary balance3
-0.3 1.2 2.0 1.7 1.8
Public debt3
46.1 42.4 39.4 37.0 35.0
Memorandum items (%)
GDP deflator 5.3 5.7 8.6 8.5 8.4
Consumer price index 6.3 8.6 6.5 9.2 7.2
Private consumption deflator 4.9 8.5 8.5 8.5 7.0
Unemployment rate 13.7 11.7 9.6 9.5 9.1
Current account balance (as % of GDP)
-2.1 -6.3 -9.9 -8.9 -8.4
Note: National accounts are based on official chain-linked data. This introduces a discrepancy in the identity between real demand components and GDP. For further details see OECD Economic Outlook Sources and Methods (http://www.oecd.org/eco/sources-and-methods). The underlying assumption for the average annual oil price (Brent crude) is $121 in 2012 and $126 in 2013.
1. In early July 2012, after the finalisation of the above projections, the first vintage of the official GDP estimates was published for 2012Q1, and the quarterly data for 2011 were revised.
2. Contributions to changes in real GDP (in per cent of real GDP in the previous year, actual amount in the first column).
3. As a percentage of GDP.
Source: OECD Economic Outlook 91 Database.
There are risks on both sides to this baseline. If the euro area crisis were to intensify, Turkey would be adversely affected through trade and financial channels, and investor and consumer confidence may drop. In this case, risk premia may increase, tensions may arise in foreign funding and growth would be lower. In light of these risks, it is important to preserve room for manoeuvre through prudent fiscal, financial and monetary policy. Conversely, if the international environment turns out to be more benign

© OECD 2012 8
or the oil price turns out to be lower than assumed in the projections, growth may be stronger and the current account deficit lower.
Putting growth on a more balanced path
The composition of demand has fluctuated since the early 2000s, not least as a result of volatile capital movements. During periods of strong capital inflows, domestic demand and imports were boosted by currency appreciation and abundant credit, whereas exports were held back, leading to widening trade and current account deficits. In contrast, when capital inflows declined and the exchange rate weakened, external deficits narrowed. Over the past decade, including after the global crisis, the first type of episode has dominated, hence leaving a growing competitiveness gap and imbalances in the economy.
The flipside of the widening trade deficit was the opening-up of a domestic saving-investment gap from the beginning of the 2000s. This gap reflects both a secular decline in private saving and a surge in private investment (Figure 5). In contrast to private saving, public deficits turned into surpluses in the 2000s on the back of steady fiscal consolidation. However, this only partly offset the drop in private saving. Public investment remained relatively stable throughout the entire period.
Figure 5. Public and private saving and investment
In % of GDP
Source: Ministry of Development.
Despite the surge in investment, the investment share in GDP remains lower than in several high performing Asian countries, suggesting that reducing the saving-investment gap will require higher domestic saving. The decline in the private saving rate mainly reflected macroeconomic stabilisation leading to a fall in interest rates, lower precautionary saving, higher availability of credit and in the first half of the 2000s a falling aggregate employment rate. Macroeconomic stabilisation also contributed to a surge in private investment, as did microeconomic liberalisation and a stronger banking sector, which led to sharply falling capital costs following the 2000-01 crisis (OECD, 2008, 2010). In addition the government granted regional and horizontal investment incentives and provided public infrastructure (organised industrial zones), notably in previously non-industrial regions. Strong entrepreneurial dynamism also played a role. Narrowing the saving-investment gap first and foremost requires increasing household incomes by lifting employment rates, in particular of women, with a higher share in the formal sector. Improving the external competitiveness of the formal sector plays a vital role in this respect.
Variations in external competitiveness have had uneven and enduring impacts on the tradable and non-tradable sectors. Currency strength benefited domestic services, but hurt output and employment in manufacturing. Symmetrically, when capital inflows declined, employment and growth in manufacturing strengthened. These effects have been particularly visible in the more price-sensitive, lower- -skilled labour force. Such
© OECD 2012 9
competitiveness effects will continue to bear on the output and employment performance of these activities which, together with higher-tech and higher-process (Chapter 2).
Putting Turkeposition in the short and in the long term. To this end:
i) Inflation and nominal wage growth need to remain under control. Price and wage increases are shaped by the effectiveness of macroeconomic policy and structural conditions (openness to competition and flexibility) in product, labour and capital markets.
ii) Productivity growth needs to remain strong. Productivity gains depend on the structural strength of the business sector, including its composition between formal, semi-formal and informal activities, and on improvements in human capital. Labour market reforms allowing the shift of a higher share of resources to the formal sector and effective education policies, including upskilling of the existing working age population, are critical.
iii) The (nominal) exchange rate needs to stay on a sustainable path. If the exchange rate appreciates or depreciates too much or too abruptly, required adjustments in the other determinants of the competitive position (disinflation and productivity gains) may be too difficult to achieve to maintain balance in the economy. A supportive combination of monetary and fiscal policies is needed to help secure such sustainability.
This Survey argues that if the economy reaches and remains on a more balanced path, it will make fuller use of its resources and will produce higher employment, income and private saving, with a lower external imbalance. Increasing employment and income is crucial to reduce the saving gap and should be supported by tight fiscal policies to increase public savings.
Supportive social cohesion and environmental policies are also needed to maintain the economy on a sustainable path. Effective social policies would help to further reduce poverty and help ensure that no part of the population is economically and socially marginalised. Well designed environmental policies
Monetary policy
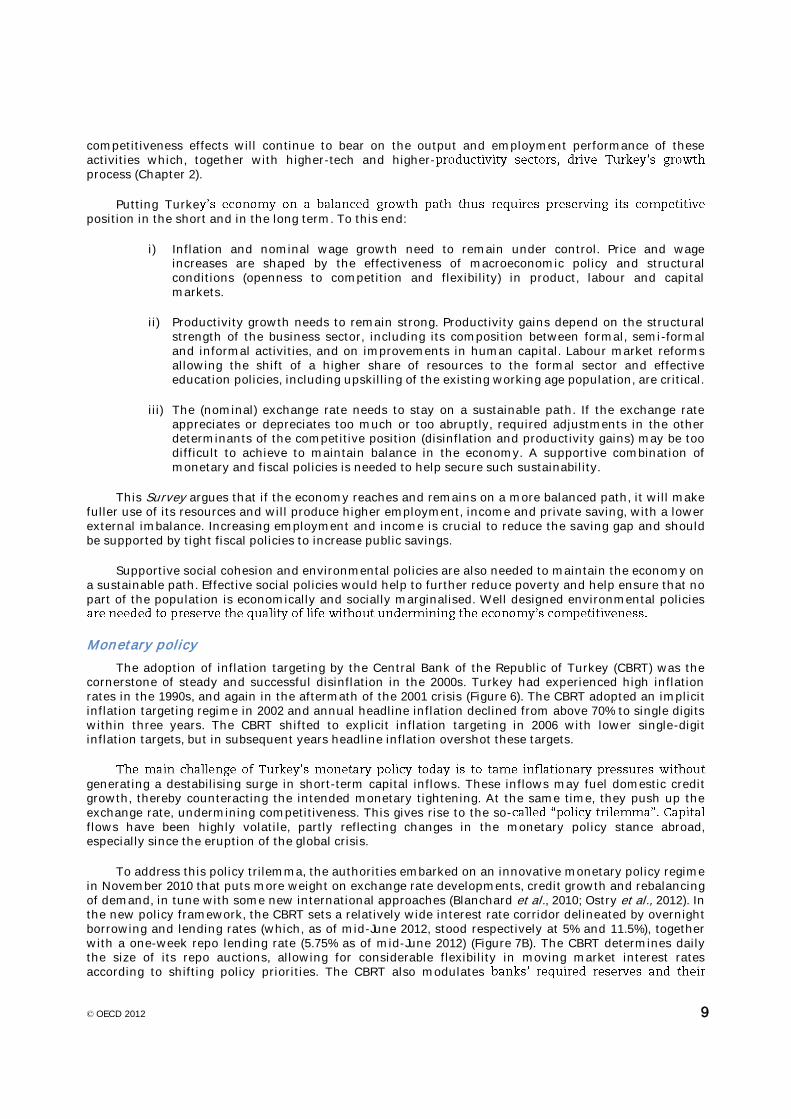
The adoption of inflation targeting by the Central Bank of the Republic of Turkey (CBRT) was the cornerstone of steady and successful disinflation in the 2000s. Turkey had experienced high inflation rates in the 1990s, and again in the aftermath of the 2001 crisis (Figure 6). The CBRT adopted an implicit inflation targeting regime in 2002 and annual headline inflation declined from above 70% to single digits within three years. The CBRT shifted to explicit inflation targeting in 2006 with lower single-digit inflation targets, but in subsequent years headline inflation overshot these targets.
generating a destabilising surge in short-term capital inflows. These inflows may fuel domestic credit growth, thereby counteracting the intended monetary tightening. At the same time, they push up the exchange rate, undermining competitiveness. This gives rise to the so-flows have been highly volatile, partly reflecting changes in the monetary policy stance abroad, especially since the eruption of the global crisis.
To address this policy trilemma, the authorities embarked on an innovative monetary policy regime in November 2010 that puts more weight on exchange rate developments, credit growth and rebalancing of demand, in tune with some new international approaches (Blanchard et al., 2010; Ostry et al., 2012). In the new policy framework, the CBRT sets a relatively wide interest rate corridor delineated by overnight borrowing and lending rates (which, as of mid-June 2012, stood respectively at 5% and 11.5%), together with a one-week repo lending rate (5.75% as of mid-June 2012) (Figure 7B). The CBRT determines daily the size of its repo auctions, allowing for considerable flexibility in moving market interest rates according to shifting policy priorities. The CBRT also modulates

© OECD 2012 10
currency composition. Furthermore, it may initiate foreign currency buying or selling auctions, alongside direct interventions in the market. The CBRT considers that the flexible use of the wide interest-rate corridor allows it to modulate interest rate uncertainty as a means to limit capital inflows when warranted.
Figure 6. Inflation since 2001
Year-on-year percentage change
1. CPI excluding energy, alcoholic beverages, tobacco products, administered prices, indirect taxes and
unprocessed food.
Source: Central Bank of Republic of Turkey; OECD, OECD Economic Outlook database.
Figure 7. Inflation and monetary policy
1. CPI excluding energy, alcoholic beverages, tobacco products, administered prices, indirect taxes and unprocessed food.
2. Overnight repo rate at the Istanbul Stock Exchange, 7-business day moving average.
Source: Central Bank of Republic of Turkey; OECD, OECD Economic Outlook database.
© OECD 2012 11
This new regime has gone through two phases since its inception (Figure 7B). From November 2010 through October 2011, monetary policy focused on limiting short-term capital inflows while letting the exchange rate depreciate. The interest rate corridor was widened by lowering the borrowing rate to increase interest rate volatility and uncertainty at the lower end and thereby discourage short-term inflows: foreign exchange reserves were built up. To were raised substantially. Even if banks could fund increased reserve requirements through the one-week repo facility at low rates, this policy started to contain credit growth, which was further curbed following additional measures taken by the Banking Regulation and Supervision Agency (BRSA) in June 2011. At the same time, capital inflows abated due to heightened global financial turmoil.
Since October 2011, the priority has shifted to coping with the volatility of international capital movements and to avoiding excessive currency depreciation which fed through to inflation. The interest-rate corridor was broadened at the higher end and the CBRT repeatedly provided less liquidity through the one-week repo facility, which caused the short-term market rates (funding rates) to jump (Figure 7B), leading to a downward-sloping yield curve. However, the CBRT started to provide longer-term liquidity via one-month repo auctions and allowed more flexibility in terms of currency composition of Turkish lira reserve requirements. The CBRT also engaged in foreign exchange reserve sales. As of mid-June 2012, total reserves (including gold) stood at $92 billion, equivalent to 4.6 months of imports and 112% of short-term foreign debt (Chapter 1).
The new regime has helped contain exchange rate volatility (CBRT, 2012). However, inflation has been very volatile and in 2011 it markedly overshot the 5.5±2% target (Figure 7). To a large extent this reflected the depreciation of the currency, commodity and food price changes, and tax adjustments. However, core inflation started to veer up in late 2011 and exceeded 8% by early 2012. The CBRT estimates that increased import prices (in foreign currency), notably for energy, and the sharp nominal depreciation contributed 5 percentage points to the surge in inflation in late 2011. Sizeable adjustments in administered prices, mostly for energy and tobacco products, in October 2011, also contributed. At the same time, spare capacity was rapidly diminishing and did not mitigate these pressures.
The early record of the new monetary policy regime is therefore mixed. While the larger weight on exchange rate stability contributed to an improvement of competitiveness and a rebalancing of the economy through 2011, it has failed to deliver low and stable inflation, and inflation expectations remained consistently above target. Moreover, persistent inflation differentials with trading partners erode competitiveness insofar as they are not fully compensated by exchange rate depreciation. In any case, chronic depreciation can undermine confidence. Thus, as over time Turkish prices converge with those prevailing in trading partners and structural rigidities decline, a policy goal should be to reduce inflation further. Since October 2011 the CBRT appears to have put more weight again on the inflation target and responded to the surge in inflation with a considerable tightening of its monetary stance. Nevertheless, it continues to view the flexibility provided by the new monetary framework as appropriate given that heightened global uncertainty is likely to persist over the medium term and Turkey will continue to face capital flow cycles challenging the conduct of monetary policy. Communication needs to be strengthened on the fundamental goals of the new regime and the link between instruments and goals, to counter concerns that the complexity of the new regime has made monetary policy hard to read (Chapter 1).
Box 1. Monetary policy recommendations
To strengthen the credibility and effectiveness of the new monetary regime:
Attaining the inflation target should be given more prominence to bring inflation expectations closer to the target and, over time, reduce inflation differentials with trading partners.
During capital inflow surges, appreciation pressures should be countered by sterilised intervention. This would appropriately increase foreign exchange reserves.
Communication on the fundamental goals of the new regime and the link between instruments and goals should be strengthened. The success of the instruments in achieving these goals should be evaluated.

© OECD 2012 12
Fiscal policy
Since the early 2000s, public debt has been brought down to under 40% of GDP and the general government deficit stood at 2.1% of GDP in 2011, a much better position than in most other OECD countries (Figure 8). Fiscal policy is managed under a rolling three-year economic programme, updated each autumn. This framework has been effective, and allowed for a targeted and temporary stimulus package during the crisis in 2009. After this countercyclical stimulus, fiscal policy outperformed the headline objectives of the 2010 and 2011 programmes, thanks to stronger-than-projected GDP growth and sharp revenue increases including from a sizeable restructuring scheme of public receivables. Recent IMF estimates, based on an innovative methodology, suggest that, taking into account one-off factors and the tax receipts from the surge in domestic demand and imports, the structural primary balance may have weakened since the mid-2000s (Figure 8A and IMF, 2012). However, given a low public debt ratio, fiscal sustainability is not jeopardised at current levels of the structural primary balance.
Figure 8. Fiscal performance remains robust
1. For 2011, estimated headline general government balance from the Pre-accession Economic Programme submitted to the European Commission in January 2012, which provides an approximation close to international standards (Government of Turkey, 2012a) (the 2012-14 Medium-Term Economic Programme is based on different accounting methodologies and puts the headline deficit for the public sector at 1% of GDP for 2011). For 2012, objective of the 2012-14 Medium-Term Economic Programme.
Source: IMF (2012), 2011 Article IV Report on Turkey; Ministry of Development; OECD, OECD Economic Outlook database.
Looking ahead, the Medium-Term Programme published in the Autumn of 2011 foresees further the general government debt stock according to the
EU definition, to respectively 0.4% and 32% of GDP by 2014 (Government of Turkey, 2011b and 2012a). In the context of slower and below-potential growth, these fiscal plans involve some tightening of the fiscal stance.
Strategy of Fight with the Informal Economy (discussed in the 2010 OECD Economic Survey), published in December 2011, contains specific measures to reduce tax loopholes. The emphasis is on taxpayer groups with significant unreported incomes and an ability to pay. Based on improved information technologies, taxpayers are screened according to their professional background, asset holdings and consumption patterns, and the plausibility of tax declarations is more effectively checked. Several groups, including real estate owners, started to comply much better with their tax obligations and revenues from related taxes are increasing. The Ministry of Finance plans to move further in this direction in co-operation with other government departments. The number of tax inspectors is to rise from around 4 000 now to 15 000 in a few years. As discussed in earlier OECD Economic Surveys, potential gains from more effective tax administration are very large in Turkey, both for public finances and improved fairness in the tax system.
In addition to securing public finance sustainability, fiscal management in Turkey needs to play a , additional
discretionary tightening may be required. During periods of strong capital inflows, such a stance would help counter domestic overheating. In addition, it could at least partially offset the private saving

© OECD 2012 13
shortfalls. A multi-year spending ceiling could help preserve a tight fiscal stance in the presence of exceptional revenue surges. The magnitude of fiscal support should not be exaggerated, however: the general government sector is relatively small and so are fiscal multipliers (OECD, 2008a). Fiscal restraint can therefore only partly compensate private sector exuberance.
The present fiscal stance is broadly appropriate and should remain tight. Public primary spending increased rapidly between 2007 and 2011 (Figure 8A). Its growth ought to be restrained as intended in the Medium-Term Programme, which aims at stabilising total primary spending at around 33% of GDP. As emphasised in previous OECD Surveys, additional spending needs remain very large in areas such as education, social services and physical infrastructures, and room needs to be created for such additional spending through savings in existing expenditures. The intended shift to performance-based budgeting should help identify and exploit such saving opportunities (Government of Turkey, 2012b). On the revenue side, resources that have been available in recent years may not recur. Hence, fiscal prudence is in order, lest the authorities find themselves forced to pro-cyclically tighten the fiscal stance in a possible cyclical downturn.
It is crucial, in these circumstances, to preserve a prudent fiscal stance which takes into account the full range of cyclical budget items. In this regard the new methodological approach suggested by the IMF deserves consideration (IMF, 2012). In addition to monitoring general government accounts according to international standards, this would require further technical investigation. A Fiscal Policy
Inflation Report) encompassing all quasi-fiscal institutions and containing a full set of cyclical adjustments could be published to improve fiscal transparency. In a subsequent step, although the Medium-Term Programme provides an anchor for fiscal policy, the introduction of a permanent fiscal rule could be considered, drawing on earlier government efforts to develop a quantitative fiscal rule permitting the operation of automatic stabilisers (see OECD, 2010). An independent Fiscal Council, along the lines of those existing in a number of OECD countries, could be established to carry out these tasks.
Box 2. Fiscal policy recommendations
The present fiscal stance is broadly appropriate and it should remain tight, not least to preserve room for action were the world economy to weaken. If warranted, stand ready to tighten the fiscal stance more.
Long-term financial balances of the social security system should be investigated with the help of alternative scenarios of growth, employment, revenue collection, and pension and health spending.
Improve fiscal data at general government level, on a unified accounting basis according to international standards. Publish these accounts at quarterly frequency.
Adopt a general government spending ceiling within a longer-term fiscal framework. This would help avoid pro-cyclical loosening in case of positive revenue surprises.
Publish a regular Fiscal Policy Report Inflation Report) encompassing all major quasi-fiscal institutions and containing a full set of cyclical adjustments.
An independent fiscal council could be established, in line with OECD best practices. It could monitor fiscal performance, participate in the design of a fiscal framework, develop alternative methodologies for estimating cyclical sensitivity of revenues and publish the Fiscal Policy Report.
be remedied. Although welcome progress has been made on the major components of these accounts, notably through direct data reporting by local governments and social security institutions to the central government, standard general government accounts become available only with very long lags and are not yet fully compliant with international standards (OECD, 2010). Different general government accounting methodologies continue to be used across economic agencies. The financial balances and debt of a range of quasi-fiscal institutions are not yet part of a systematic monitoring and reporting system. The prospective fiscal costs of the expanding social security system also call for close scrutiny, against alternative scenarios of growth, employment, revenue collection and pension and health

© OECD 2012 14
spending. Such scrutiny is particularly important as the ongoing demographic window will close in about a decade, and the old-age dependency ratio will start to increase rapidly, entailing growing ageing costs.
Financial sector policies
i) preserving the soundness of the financial sector through standard micro-prudential measures; and ii) contributing more actively to the cyclical regulation of the economy through macro-prudential supervision.
The rehabilitation of the financial sector after the 2001 crisis, which led to a smaller number of better capitalised commercial banks, was central to macroeconomic credibility and stability in the 2000s. As Turkey is now fully integrated with global capital markets, capital inflows, which were mostly channelled through the banking system after the crisis, raise risks of excessively rapid balance sheet expansion and credit growth.
Even if corporate and household debt levels are still low as a share of GDP,
the authorities have been addressing these risks with both traditional micro-prudential and newly developed macro-prudential instruments.
(Figure 9). Bank loans have continued to grow strongly after the crisis but were allocated under conservative policies and rigorous provisioning rules. Yet, ban -term foreign exchange debt
long but declined from an average of 4 years at the end of 2007 to 3.5 years at the end of 2011. Non-financial firms also accumulated sizeable additional foreign currency exposure (over 15% of GDP by early 2012). In an interim assessment, the ongoing Financial Sector Assessment Programme (FSAP) review of
nt to absorb a short-lived macroeconomic shock, but that strains would be much greater if the shock were protracted (IMF, 2012).
Figure 9. Capital adequacy is high but EMBI spreads have increased
1. Ratio of regulatory capital to risk-weighted assets. Data are compiled in accordance with the guidelines of either Basel I or Basel II. It measures the capital adequacy of deposit takers.
2. For Greece data in Q3 2011 and for Italy and United Kingdom data in Q2 2011.
Source: IMF, Financial Soundness Indicators (FSI, see website fsi.imf.org); Datastream.
According to the Turkish authorities, the sector remains well capitalised and resilient to all reasonable shock scenarios. They nonetheless started to increase capital adequacy ratios by limiting dividend pay-outs, and phased in new capital charges for maturity mismatches (applicable from July 2012). New regulations on credit risk management are also being prepared. The authorities also confirmed again their intention to comply with Basel II guidelines in the course of 2012 and have started work to implement Basel 2011 before narrowing again more recently.
© OECD 2012 15
Countercyclical credit containment measures introduced by the CBRT in early 2011, including hikes in the required reserve ratios of banks, their differentiation according to maturity, and their non-remuneration have proven less effective than expected in curbing credit growth. Accordingly, over the past two years, the BRSA has imposed loan-to-value ceilings on housing and commercial real-estate loans, rescinded the crisis-era easing of prudential standards on loan restructuring (after a one-year extension decided in early 2010), raised additional provisioning requirements and risk weights on loans and tightened conditions for the use of credit cards.
A new Financial Stability Committee was created in 2011 to co-ordinate macro-prudential and countercyclical policies. Good co-ordination between the Undersecretariat of Treasury, the CBRT, the BRSA, the Capital Market Board (CMB) and the Saving and Deposit Insurance Fund (SDIF) is key, although the independence of participating institutions should not be compromised.
Micro- and macro-prudential policies may have limitations when surges in capital inflows are channelled through the non-financial corporate sector. In this case temporary and targeted capital controls, provided they are in line with the provisions of the OECD Code of Liberalisation of Capital Movements, could be considered as an option. While their effectiveness to influence the level of inflows is controversial, well-targeted capital controls can affect the composition of flows towards longer-term
d, 2011). Direct capital controls have not been favoured by the authorities to date. In fact, direct capital controls would conflict with the long-term goal of promoting Istanbul as an international financial centre.
Box 3. Financial policy recommendations
As planned, comply fully with Basel II banking supervision guidelines and converge in due course with Basel III guidelines.
Continue to evaluate the countercyclical financial policy measures which have the strongest leverage on aggregate demand, and focus on those.
Closely monitor the cross-border funding of the non-financial corporate sector and, if and when capital inflows attain a pace incompatible with financial stability, as a last resort consider introducing temporary and targeted capital controls, provided they are in line with the provisions of the OECD Code of Liberalisation of Capital Movements.
Future growth performance will be shaped by structural policy choices
Long-term growth projections for Turkey are highly sensitive to policy and other assumptions.
capacity to mobilise labour resources and domestic and international savings in a balanced way in the short term and the pace of convergence with OECD labour utilisation, human capital and productivity standards in the longer term.
A new, stylised, cross-country long-term growth model (OECD, 2012c) is used to estimate the impact
growth rate would average 4.4% between 2012 and 2030, with some decline over time. This baseline scenario incorporates likely structural policy developments in line with but less far-reaching than the recommendations in this Survey affecting labour participation and productivity, which would imply higher growth:
i) Educational attainment is assumed to continue to converge slowly across countries, leading to an increase from 7 to 8½ years of schooling in Turkey between 2012 and 2030 (see below).
ii) Labour force participation projections take into account recently implemented pension reforms and feedback effects from increasing educational attainment, and the trend labour force participation rate is projected to increase from the current 49% to 55% by 2030.

© OECD 2012 16
iii) The baseline further assumes a gradual easing of product market regulations towards average standards observed in the OECD, which contributes to the average multi-factor productivity (MFP) growth of 1.5% per year between 2012 and 2030.
The first assumption does not fully reflect the extension of compulsory education to 12 years legislated in April 2012, which will entail an increase in the average duration of schooling by 2030 to about 9½ years (provided that it is implemented for the entire student population already from the school year 2012/13, as stipulated by a May 2012 implementation decree). However, the OECD cross-country model assumes that a year of schooling delivers the same increase in knowledge and skills in all education systems. Since the quality of education in Turkey is still well below the international average, the effects on growth of the increase in average schooling years are likely overestimated in this model.
educational attainment may be broadly in line with what can be hoped for from the new Turkish legislation.
In this baseline, the contributions from longer schooling, increased labour market participation and MFP growth to the average annual GDP growth rate amount to 0.5, 0.4 and 1 percentage points, respectively. Starting from this baseline, several scenarios building in stronger structural reform efforts are investigated:
Deeper labour market reforms than in the baseline scenario, such as the ones recommended in this Survey, could raise participation rates further. In this scenario aggregate labour force participation would increase from 49% in 2012 to 60% (rather than 55%) by 2030. The trend growth rate would be increased by 0.6 percentage points compared to the baseline and the level of trend output would be 10% higher in 2030.
Lifting the average duration of schooling of the adult population to 10 years between 2012 and 2030 (similar to the improvement observed in Korea over the past two decades) would increase average annual trend growth by 0.8 percentage points and the level of potential output by 15% by 2030 relative to the baseline, assuming major quality improvements in the
Combining these two sets of labour and education reforms would raise GDP growth by 1.3 percentage points annually relative to the baseline over 2012-30 and potential output would increase by 25% by 2030. Table 2 summarises these different scenarios and the key underlying assumptions.
Table 2. Long-term growth scenarios
Baseline
Labour market scenario
Education scenario
Combined scenario
Average potential GDP growth 2012-30, in per cent
4.4 5.0 5.2 5.7
Difference in level of potential output relative to baseline in 2030, in per cent
10 15 25
Labour force participation rate in 2030, in per cent
55 60 56 61
Average years of schooling of the adult population in 2030
8.5 8.5 10 10
Memorandum items:
Average MFP growth 2012-30, in per cent 1.5 1.5 1.5 1.5
Average capital stock growth 2012-30, in per cent
4.9 5.2 5.4 5.8
Average population (aged 15 and above) growth 2012-30, in per cent
1.3 1.3 1.3 1.3
Structural level of unemployment in 2030, in per cent
9.2 9.2 9.2 9.2
Source: OECD estimations.

© OECD 2012 17
Reforming labour markets and advancing formalisation
features since the early 2000s, with important effects on labour mobilisation and potential growth:
i) Accelerated migration of working-age individuals from rural to urban areas, notwithstanding an increase in rural employment in the post-crisis years 2009-11.
ii) Steady increases in the employment of skilled workers with secondary education or above, who represent around 36% of total employment (and 33% of the labour force and 16% of the working age population).
iii) A U-shaped pattern in the employment of the low-skilled majority of the labour force. The employment rate of workers with primary education or less declined through the 2000s but appears to have reached a trough in 2008-09 and has increased since then.
iv) The large informal sector. Many workers continue to be employed without social security
from 2012, will be able to do so through a universal health insurance system), or are in self-employment or unpaid family work. Salaried unskilled workers in the formal sector are still a minority (Figure 10).
v) A large and persistent gap in labour market participation between men and women.
Figure 10. The structure of employment is still weak
Source: Turkish Statistical Institute, Household Labour Force Survey results.
A key priority for improving potential growth is to shift employment to higher-quality jobs in fully formal activities. Indeed, informality acts as a drag on both the level of economy-wide productivity and its growth rate (OECD, 2008b and 2010; World Bank, 2010). Informal and semi-formal enterprises have limited access to economies of scale and scope, to professional labour, to foreign investors and to financial markets. Many of them therefore face limitations in their technological and commercial development. This keeps productivity growth in the entire economy below potential (Figure 11, and Chapter 2). Informality also deprives clients, including other enterprises using intermediary inputs, of efficient sources of supply. Formalisation, together with improved coverage and eligibility conditions for unemployment insurance, would also bring major benefits to Turkish workers by improving social protection against unemployment and income loss, poverty, exploitation and unsafe workplaces.

© OECD 2012 18
Figure 11. Labour productivity and degree of formalisation in selected sectors
Note: 2010 Turkstat data on the proportion of informal workers across enterprise size classes in manufacturing and service sectors were used to differe -their employment and productivity levels. More details are available in Figure 2.6 in Chapter 2 of the Survey.
Source: OECD estimates based on Turkstat data.
However, transition to formality presents informal and semi-formal enterprises with a dilemma: to become more productive, they need to graduate to formality, but transition to formality increases their costs, due to the rigidities of the formal regulatory framework. In particular, enterprises in low and medium-tech activities that employ low-skilled workers face two challenges:
Wage flexibility is higher in the informal sector. Informal sector wages respond better to economic circumstances than official, inflation-indexed minimum wages and public-sector wages. For example, informal sector wages can decline in nominal terms when exchange rate appreciation pressures are too strong or when competitiveness losses call for adjustment. They may also vary according to local differences in productivity and living costs.
Employment flexibility is also higher in the informal sector. Labour inputs can be adapted to changing conditions in product markets, notably in markets where orders are not predictable and delivery times short. Such flexibility is recognised as the distinct competitive edge of Turkish enterprises in international markets. But as both temporary employment and agency work are quasi-banned by prevailing regulations, such flexibility is only possible in the informal and semi-formal activities.
As discussed in earlier OECD Economic Surveys, only cost-reducing and flexibility-enhancing regulatory reforms can increase formalisation. A new and more flexible labour contract, a less costly severance payment regime, legal availability of temporary and agency work, and lower minimum wages are required. Otherwise, government efforts to reduce informality and facilitate formalisation, including through the comprehensive Strategy of Fight against Informal Economy cannot deliver much progress. The challenge is to foster transition to formality without undermining the flexibility and entrepreneurial vigour of the business sector, and hence without output, employment and competitiveness losses.
ployment policy initiatives go in this direction. The temporary measures introduced during the global crisis reduced some of the most penalising aspects of legal employment, and paid off by boosting formal employment, notably of youth and women (OECD/ILO, 2011). Ongoing discussions on a new National Employment Strategy also suggest that key shortcomings of the present regulatory framework are well identified. Notably, a severance pay reform is being prepared to make permanent labour contracts more flexible and a draft law liberalising temporary work has been submitted to the social partners for discussion.

© OECD 2012 19
The reform recommendations in this Survey build on OECD experiences, including labour market reform efforts in Southern European OECD countries such as Spain, Portugal, Italy and Greece. These
challenges. From the 1990s onwards, these Southern European countries encouraged hiring by introducing a diversity of legal employment forms. This has led to labour market dualism problems that more recent reforms in Southern Europe aim to address. The liberalisation of temporary employment in Turkey would involve similar risks, but appears necessary to facilitate the formalisation of many informal jobs. To minimise the potential problems arising from duality, these reforms should be embedded in an integrated flexicurity strategy avoiding the entrenchment of a deep divide between rigid permanent employment and precarious jobs.
Lack of consensus on the direction of labour market reforms in Turkey has made their implementation difficult to date. There is opposition from the unions to any significant changes regarding permanent work contracts, the costly severance payment regime, temporary and agency work, and the regional differentiation of minimum wages. However, a more co-operative climate is now emerging between government, employer and labour organisations following near-consensus on a draft law facilitating union organisation, representation and collective negotiation in workplaces. Broadening the scope of the unemployment insurance scheme, which currently covers less than 20% of the formal sector workers losing their jobs, may also help unions agree with flexibility-enhancing reforms.
Official investment incentive schemes could also make the formal sector more attractive for entrepreneurs. These schemes were considerably diversified and developed in the second half of the 2000s, including a wide range of support programmes for smaller businesses by the SME agency KOSGEB, and 43 Technology Development Zones promoting innovation and technology development in co-operation with universities. They support the investment, training and R&D efforts of enterprises. However, more fundamental reforms lowering the costs of doing business in the formal sector would reduce the need for fiscally costly subsidy schemes (Box 3 in Chapter 1 reviews the extended investment incentive system legislated in June 2012).
Box 4. Labour market and formalisation recommendations
A new and more flexible labour contract should be negotiated with social partners, as envisaged in the ongoing discussions on a National Employment Strategy. It should be introduced for all new hires on permanent contracts.
The severance payment regime should be re-designed in line with international best practices, to make permanent labour contracts more flexible. Temporary and agency employment should be allowed, without sectoral restrictions.
Official minimum wages should be kept in check. Wage adjustments to productivity gains should be sought more through collective bargaining at enterprise level.
The scope and eligibility conditions for the official unemployment insurance scheme should be
Strengthening human capital
Upgrading education is the prime avenue for strengthening long-run growth, as highlighted in the special chapter on education in the 2006 OECD Economic Survey of Turkey. Major education policy initiatives have been taken over the past two decades, including the lengthening of compulsory education from five to eight years in 1997, before its further lengthening to 12 years in 2012. As a result, the enrolment of young cohorts has increased markedly at all education levels, from pre-school to tertiary, for both genders and in all regions and socio-economic groups. In addition, the OECD PISA indicators suggest that the academic proficiency of 15-year olds, starting from a very low level, has improved in the successive tests in 2003, 2006 and 2009. The demographic window over the next decade makes it especially important to increase the leverage of education policies, as larger cohorts graduating from the education system (with potentially stronger human capital) will be better integrated into the labour force.

© OECD 2012 20
Even so, the quality distribution of primary and secondary education remains excessively skewed. The academic proficiency of students differs widely across schools, reflecting the uneven skills and commitment of teachers and the large influence of the socio-economic background on student performance. Further emphasis on pre-school education is needed to reduce the influence of socio-economic factors. Innovative reforms are also needed in the governance of schools, including for teacher recruitment and motivation, to stimulate the quality of education in those falling behind.
A particularly weak point to date has been the unsatisfactory quality of vocational education. About 84% of primary education graduates start secondary education, but drop-out rates are high, especially from vocational education. Only about half of the 15-19 age cohort remain in education. It has been argued that this is because upper secondary education as such does not provide skills that are valued in the labour market (Education Reform Initiative, 2009), even if certain vocational streams have proven more successful than in the past, notably those for tourism and health care and the technical high schools established in organised industrial zones. As underlined in earlier OECD Economic Surveys, higher education also suffers from various quality shortcomings. At the same time, a number of high-quality universities now operate, with teaching programmes of internationally recognised quality.
levels pays off, but it is important to implement them on a broad, regionally and socially balanced basis. -14 emphasises quality and equity as top
priorities (Government of Turkey, 2009). However, implementing this strategy at an affordable fiscal cost will require major gains in the efficiency of education spending. Existing studies suggest that such gains are achievable by improving the managerial autonomy and accountability of schools and universities, provided that this is backed not only with efficient transparency channels but also mechanisms to support quality improvement at each education level (Chapter 2). Despite some steps towards regional decentralisation within the Ministry of Education, the autonomy of education institutions is still very limited. Public universities also remain under tight central control, in contrast to private foundation universities, which have expanded strongly in the 2000s and are successfully piloting pedagogical and curricula innovations.
youth can improve human capital endowment only gradually, because cohorts above the education age dwarf those entering the labour force. Those in need of upskilling are found across the age spectrum, even in relatively young age cohorts: in the 25-34 age cohort for example, 53% of men and 64% of women have only primary education or less. These individuals will remain in the labour force until 2040-50. Their weaknesses contrast with expanding skill requirements in the labour market, especially in newly-developing regions. A sizeable portion of the low-skilled are also still in agriculture, and are likely to leave rural areas to seek employment in cities in the years ahead. Upskilling working-age cohorts is
the future. In view of the requirements of the developing economy and labour market, a Lifelong Learning Strategy and Action Plan was launched in 2009 to increase individual skills.
Turkey has been trying to introduce new initiatives in this area. In line with recommendations in earlier OECD Economic Surveys, the government has decided to participate in the OECD
evaluate, for the first time, the skills profile of the working-age population in order to help support upskilling priorities. In the meantime, well-designed policies and programmes can already be developed to facilitate the upskilling process for the adult population, in particular by focusing on strengthening literacy and numeracy for those whose schooling was inadequate. Successful upskilling would permit many industries to access stronger professional know-how and improve productivity and employment.
© OECD 2012 21
Box 5. Recommendations on human capital development
Higher-quality education at all levels, including upskilling and lifelong learning, ought to be a top policy priority. This calls for reallocating fiscal resources to this area. Against this background the following priorities stand out:
Offer effective lifelong education programmes to upgrade the labour market skills for adults whose schooling was inadequate.
Reduce the large quality gaps among both schools and universities by granting them more autonomy in exchange for more accountability for performance, and by shifting to per student funding with adjustments for socio-economic disadvantages.
In vocational education, emphasise generic skills. Vocational schools should co-operate with the business sector in developing and teaching their curricula.
Social cohesion policies
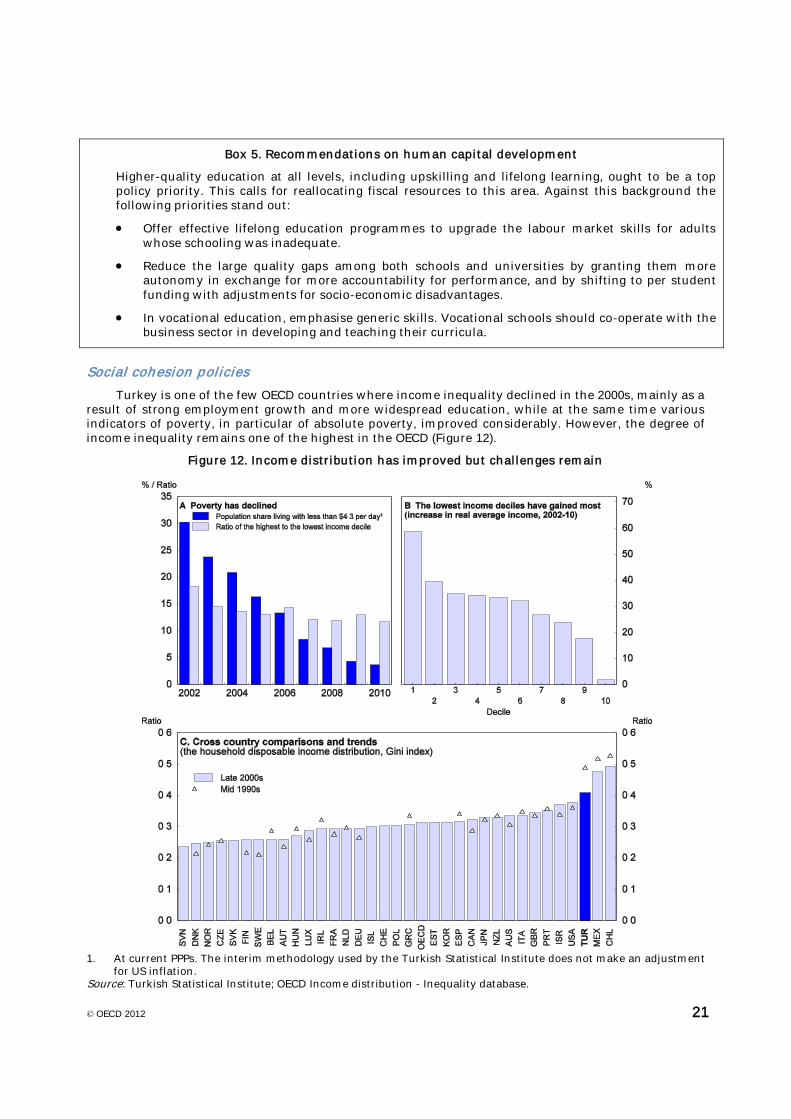
Turkey is one of the few OECD countries where income inequality declined in the 2000s, mainly as a result of strong employment growth and more widespread education, while at the same time various indicators of poverty, in particular of absolute poverty, improved considerably. However, the degree of income inequality remains one of the highest in the OECD (Figure 12).
Figure 12. Income distribution has improved but challenges remain
1. At current PPPs. The interim methodology used by the Turkish Statistical Institute does not make an adjustment
for US inflation. Source: Turkish Statistical Institute; OECD Income distribution - Inequality database.

© OECD 2012 22
Prevailing income distribution patterns and their determinants place Turkey in a cluster of OECD countries that notably includes Chile, Mexico, Israel and Portugal characterised by: i) above-average income inequality, mainly reflecting a low employment rate coupled with high wage dispersion; ii) capital incomes tending to benefit a small group of households; iii) low cash transfers; and iv) the personal income tax system playing a limited redistributive role. However, indirect and consumption taxes have some redistributional effect to the extent that many basic products carry lower rates in Turkey.
OECD analyses (OECD, 2011b and Hoeller et albe reduced by: i) continuing to strengthen labour force participation and employment; ii) upgrading human capital and reducing labour market duality; and iii) relying more on transfers. Such transfers
employment (for example via subsidies to transportation and child care costs).
Indeed, raising the low employment rate and shifting its composition toward formal jobs can
income distribution. Increasing employment opportunities for women should be at the core of such policies. As mentioned, their participation rate is currently very low: the ongoing Development Plan (Government of Turkey, 2006) aimed at increasing it to nearly 30% by 2013, against an OECD average of 62% in 2010. Existing obstacles to female labour market participation include insufficient supply of dependable child and elderly care, which was found to penalise working women at both high and low education levels (Aran et al., 2010). It is also important that new jobs for women be created in the higher-quality formal sector, rather than, as happened in the late 2000s, mainly in the informal sector (Figure 10). Labour market rigidities channel an even higher share of female than male workers into informal employment, undermining their productivity, incomes and work incentives.
More effective social transfers would increase the well-being of the most vulnerable groups. Despite progress achieved in the reduction of absolute poverty, 3.7% of the population still have less than $4.3 (at PPP) per day. Turkey has room to make more active use of the tax and transfer system for redistributive purposes. It currently has the fourth least progressive income tax structure among OECD peers, despite having made the biggest progress on this score in the 2000s. At the same time, social assistance represents 1.2% of GDP, one of the lowest levels OECD-wide, despite a regular increase since 2003. Nevertheless, important steps have recently been taken to increase the efficiency of the social assistance system by strengthening the links between social benefits and labour market participation.
Designing effective transfers without undermining work incentives a challenge in all OECD countries is particularly crucial in Turkey because the employment rate is so low. Recent developments in social transfers may have reduced the work (and training) incentives of certain groups, notably in low-income regions, where living costs are low and nationally-set nominal transfers may exceed the work-related income of low-skilled individuals. For instance, it has been estimated that in a typical south-eastern city, an unemployed family with one breadwinner and two children might currently receive a combination of social transfers amounting to TL 475 (€ 235) per month, compared to a net minimum wage income of TL 700 (€ 345) (OECD estimate based on information provided by the Southeast Anatolian
addressing this challenge by integrating government databases on social benefits and employment assistance, and requiring social assistance recipients to consult with employment agency advisors.
Social transfers are currently distributed from a variety of sources, with limited co-ordination. Monitoring all transfers and social benefits on an individual recipient basis would help manage transfers by reviewing all individual circumstances, family needs, and behavioural responses including in terms of training and employment efforts. A comprehensive technical project is under way, under the aegis of the newly created Ministry of Family and Social Policies which is in charge of a better co-ordination of social services and social assistance, and the National Scientific and Technical Research Foundation, to develop a sophisticated database at individual level to facilitate policy analysis and implementation.
© OECD 2012 23
Box 6. Social policy recommendations
-quality and affordable child and elderly care.
-and-transfer system by taking into account international best practice. Draw on growth-friendly taxes such as real estate taxes, and target progressive transfers and benefits conditional on labour market participation.
Furthering product market reforms
-tradable activities provide tradable sectors with more competitively produced and lower-cost inputs. Three key upstream sectors whose market conditions affect the performance of the entire economy are energy, telecommunications and agricultural production.
The electricity sector is still dominated by incumbent state-owned entities. Only limited progress has been made with the liberalisation plans introduced in the 2000s. These plans sought to introduce competition in the competitive segments of the industry (generation, wholesale trade and retail sales). Consumers with certain consumption thresholds were made eligible to choose their suppliers, assuming that significant competitive supply alternatives would develop. This threshold was originally set to 9 million kWh per year, and was reduced annually, to reach 25 000 kWh of yearly consumption at present, making 77% of market demand eligible for supplier choice. 100% of consumers will be eligible by 2015. However, alternative competitive suppliers have not grown at the intended pace.
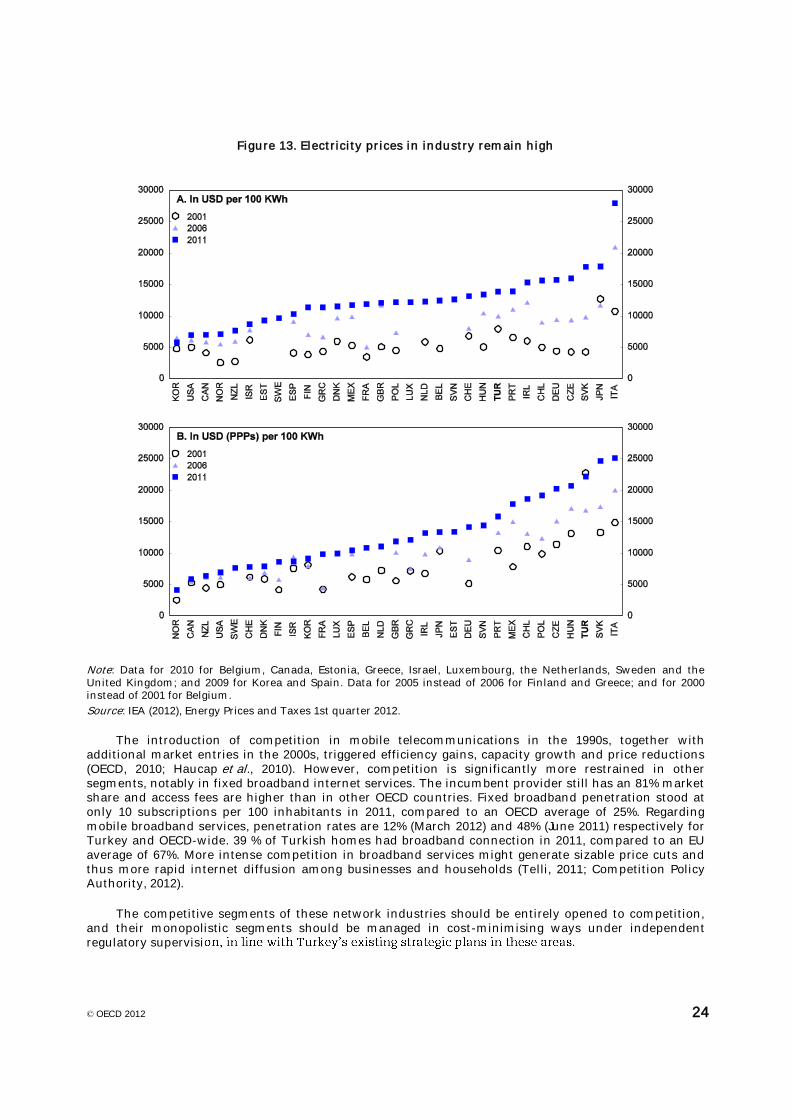
The planned reforms were held up notably by delays in the privatisation of large-scale generation capacities and distribution companies, which proved even more difficult to implement in the conditions of the global economic crisis (Competition Policy Authority, 2012). Power potential in hydro, wind, and environmentally sustainable coal plants, and, in the long term, in nuclear energy could be more effectivelin the distribution of electricity would be reduced under stronger incentives for productivity gains. Prevailing pricing and billing practices entail cross-subsidisation between user categories, which does not encourage efficient electricity utilisation by subsidised groups. Against this backdrop, electricity costs for industrial users remain high in international comparison (Figure 13). The implementation of the planned liberalisation and competition reforms will stimulate more rational electricity use on the demand side and more efficient production on the supply side, but also more effective utilisation of
high imported energy bill (which reached 6% of GDP in 2011), improve energy security and contribute to keeping greenhouse gas emissions in check (see below).
Other energy sectors also have only limited competition. In the natural gas sector, despite a legal
market share. On the other hand, all the major local gas distribution companies were privatised, with the exception of those in Istanbul and Ankara. In oil distribution (which has a particularly large weight in the Turkish energy market because of dependence on road transportation) rules restricting the entry of oil importers hinder competition.
© OECD 2012 24
Figure 13. Electricity prices in industry remain high
Note: Data for 2010 for Belgium, Canada, Estonia, Greece, Israel, Luxembourg, the Netherlands, Sweden and the United Kingdom; and 2009 for Korea and Spain. Data for 2005 instead of 2006 for Finland and Greece; and for 2000 instead of 2001 for Belgium.
Source: IEA (2012), Energy Prices and Taxes 1st quarter 2012.
The introduction of competition in mobile telecommunications in the 1990s, together with additional market entries in the 2000s, triggered efficiency gains, capacity growth and price reductions (OECD, 2010; Haucap et al., 2010). However, competition is significantly more restrained in other segments, notably in fixed broadband internet services. The incumbent provider still has an 81% market share and access fees are higher than in other OECD countries. Fixed broadband penetration stood at only 10 subscriptions per 100 inhabitants in 2011, compared to an OECD average of 25%. Regarding mobile broadband services, penetration rates are 12% (March 2012) and 48% (June 2011) respectively for Turkey and OECD-wide. 39 % of Turkish homes had broadband connection in 2011, compared to an EU average of 67%. More intense competition in broadband services might generate sizable price cuts and thus more rapid internet diffusion among businesses and households (Telli, 2011; Competition Policy Authority, 2012).
The competitive segments of these network industries should be entirely opened to competition, and their monopolistic segments should be managed in cost-minimising ways under independent regulatory supervisi

© OECD 2012 25
Stronger competition at all levels of the agricultural chain would also unleash latent productivity gains and reduce agricultural product costs. Food and non-alcoholic beverages represent a quarter of the consumer price index and one fifth of total household consumption. They are characterised by high price volatility and asymmetric price rigidities (upward adjustments are more frequent than downward adjustments). These sectors are sheltered from import competition, and obstacles to domestic competition are widespread. According to the latest information available, agricultural product prices are significantly above average world prices. The difference reaches about 200% for milk, 80% for sugar, 70% for beef meat, 40% for poultry and eggs, and 40% for wheat and sunflower grains (WTO, 2012).
According to OECD estimates, the level of support to agriculture in Turkey, as a percentage of gross farm revenues, declined from 38% in 2006 to 25% in 2008, before rising to 28% in 2010. This suggests that
border protection). Policymakers expect the amount of support to decline as employment in agriculture contracts (it still represents a quarter of total employment), facilitating market-based adjustments. They consider the WTO agricultural negotiations as an adequate tool to open up Turkish agricultural markets
Agricultural Policy Review of Turkey (OECD, 2011a) recommended measures to spur market outcomes and competition, in particular to: i) reduce the high degree of price support (which is the biggest distortion in this sector, representing 84% of total support to agriculture by 2010 according to OECD calculations); ii) cut total public transfers to the agricultural sector; and iii) liberalise import competition. The Review also recommended to carry on with the structural reforms introduced in the 2000s, to facilitate the consolidation and restructuring of low-productivity farms. To promote social cohesion, safety-net programmes ought to be extended and targeted to explicit social objectives. Agricultural support tools will be progressively aligned with EU standards. The Review -operation with the European Union, and which targets the diversification of economic activities, human resource development, and the protection of the rich natural environments and ecosystems.
Box 7. Recommendations on product market competition
In network industries with monopolistic elements, especially in the energy and telecommunications sectors, competitive segments should be fully opened to competition and naturally monopolistic segments should be managed in cost-minimising ways under independent regulatory supervision. The comprehensive energy liberalisation plans prepared in the 2000s should be fully implemented.
Liberalise agricultural product markets by reducing the high degree of price interventions, using less distortive forms of support and offering greater scope for import competition in the context of WTO negotiations and convergence with EU standards. Social cohesion policies in agriculture should rest on direct transfers to eligible farmers and rural development, rather than on product market interventions.
Quality of life: the case of air pollutants and greenhouse gas emissions
Turkey became a party to the UN Framework Convention on Climate Change (UNFCCC) in 2004 and to the Kyoto Protocol in 2009. Along with other OECD countries, UNFCCC. However given its special circumstances, Turkey has been exempt from setting quantitative emission mitigation targets.
The carbon footprint per capita is relatively low (Figure 14). Annual greenhouse gas (GHG) emissions per capita are 5.3 tonnes of CO
2 equivalent, against an EU average of 10.2 tonnes and an OECD average of
15 tonnes. However, the emission intensity of existing energy, dwelling, transportation and manufacturing activities is high. Under existing energy utilisation patterns, GHG emissions are set to rise rapidly (Figure 14). Therefore, Turkey has started to introduce product norms and projects subsidies to boost the use of clean and renewable energy sources and to increase energy efficiency.

© OECD 2012 26
At a more local level, pollutants have reached high concentrations in certain Turkish cities (OECD, 2008c). In this respect, a major step has been the adoption of a new Regulation on Control of Air Pollution from Industrial Plants (including energy plants) in 2006. This regulation has significantly tightened authorised pollution from emissions, in accordance with EU norms.
The Government approved the National Climate Change Strategy in May 2010 and published the National Climate Change Action Plan in July 2011. The plan includes short- and long-term objectives concerning greenhouse gas emissions, without setting quantitative targets. It nevertheless includes quantified objectives to increase the share of renewable energy in electricity production to 30% by 2023. Shifts are also planned to move passengers and freight away from road transportation. The plan further includes the expansion of public transportation in cities, together with more active diffusion of heating and insulation standards (only 9% of dwellings have any insulation), more efficient fertiliser and water utilisation in agriculture, and more proactive emission management in industry. Investments have already been launched in the areas of hydro, wind and geo-thermal power and high-speed trains. A monitoring system of all GHG emissions is to be put in place but implementation could be difficult because of the large share of informal activities. The Ministry of Environment and Urbanisation intends to support companies implementing the system by drawing on the 108 organised industrial zones that are currently in operation, and the 147 that are under construction.
At this point, Turkey s climate change strategy emphasises containing GHG emissions by regulatory means, and recent public projects in energy and transportation take account of environmental priorities. Economic instruments (such as carbon taxes and cap-and-trade systems), which would mitigate emissions at lower costs, have not yet been implemented. Fuel taxes have, however, reached very high levels. Although driven by revenue rather than environmental policy, they do have positive
ally-a share of GDP, and this provides a good starting point for future co-ordination between tax and environmental policies (Figure 14D).
However, major tax differences between emission sources remain. rate for the CO
2 emissions of diesel and second-highest for petrol. In contrast, emissions from natural
gas and coal are practically not taxed at all. Important sources of carbon emissions thus escape taxation, such as household use of natural gas and industrial use of light fuel oil. Turkey had long been the only OECD country applying a higher tax-rate for low-sulphur diesel than for high-sulphur diesel, but this ceased in 2011 with the prohibition of the commercialisation of high-sulphur diesel.
More active recourse to economic instruments, such as tradable emission permits, for reining in emissions is being considered by the authorities. A related, non-official development has been the emergence of a voluntary carbon market. Turkey is one of the most active countries in this area, as many Turkish enterprises detected rewarding opportunities in selling emission reductions to international counterparts on a voluntary basis. About 150 projects are under way with expected annual GHG reductions of approximately 10 be traded on the voluntary carbon market. A carbon registry is being set up within the Ministry of Environment and Urbanization to facilitate these trades. A carbon market is also planned as part of the Istanbul Financial Center Strategy.
Box 8. Recommendations on greenhouse gas emissions and air quality
The National Climate Strategy and Action Plan needs to be implemented further and the following measures are particularly advisable:
Review the structure of fuel taxes and harmonise the implicit carbon tax rate on different fuels in different uses. Co-ordinate fuel taxation initiatives with Climate Change Action Plan priorities.
Set quantitative mitigation targets for greenhouse gas emissions, even if Turkey has no international obligation in this area at this stage.
Adopt economic instruments such as emission permit systems in sectors where the pricing of emissions is technically feasible.
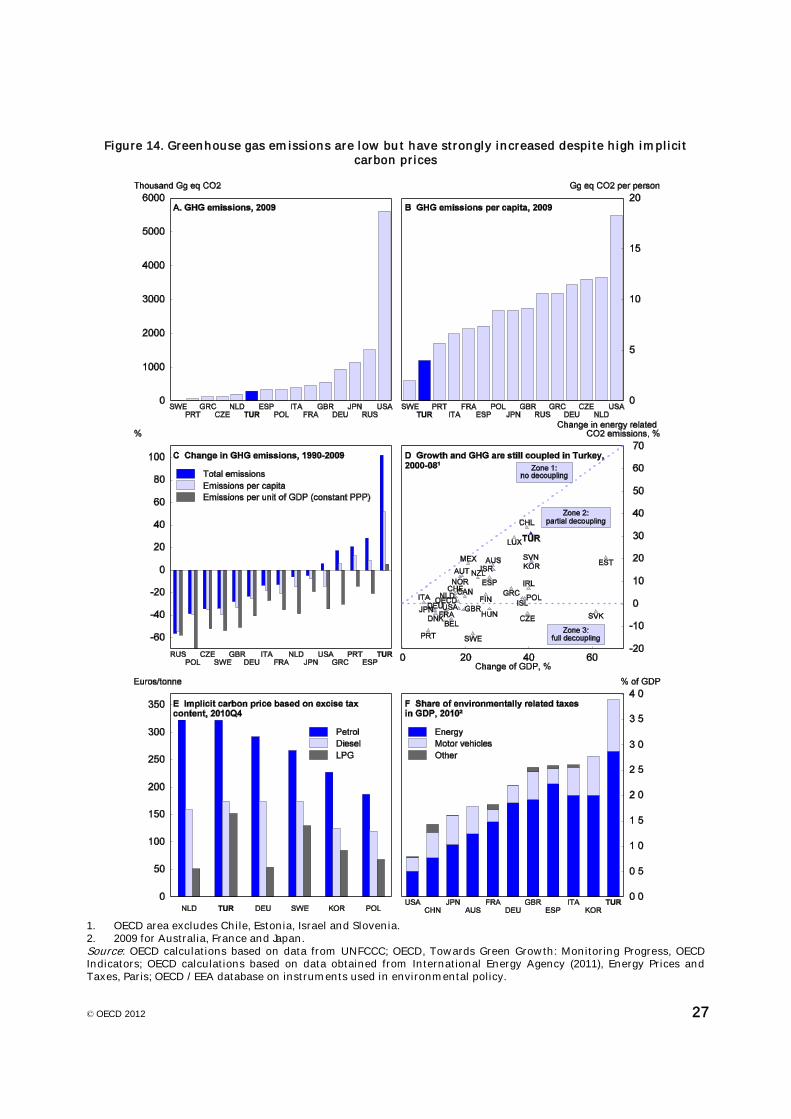
© OECD 2012 27
Figure 14. Greenhouse gas emissions are low but have strongly increased despite high implicit carbon prices
1. OECD area excludes Chile, Estonia, Israel and Slovenia. 2. 2009 for Australia, France and Japan. Source: OECD calculations based on data from UNFCCC; OECD, Towards Green Growth: Monitoring Progress, OECD Indicators; OECD calculations based on data obtained from International Energy Agency (2011), Energy Prices and Taxes, Paris; OECD / EEA database on instruments used in environmental policy.

© OECD 2012 28
l reform priorities and related national actions and plans*
OECD policy recommendations Actions taken or planned by the authorities
Improve educational achievement. Fully enforce
minimum schooling rules, revise the education curricula according to labour market needs, increase spending on education (financed by cuts in lower priority areas), fund schools on a per-pupil basis and provide them with more managerial responsibility. New universities should be adequately funded.
A national campaign was launched to increase the school enrolment of girls in 2005. Net enrolment rates in compulsory education were raised from 85% in 1997 to 99% in 2011. Education curricula in primary and secondary schools were revised starting from 2006, and again in 2012. Educational tools, textbooks, and teacher manuals were adapted. Electronic media will be used to replace and reduce school manuals (the FATIH project). Curricula in vocational and technical education are also being revised, under a new Vocational and Technical Education Strategy.
Pilot experiments for the per-pupil funding of schools, and for the management of schools through local authorities, started in several cities. Most recently, with a new law adopted in April 2012, compulsory education was extended to 12 years, one of the longest in the OECD. This is planned to be divided into three periods of four years. At the end of the first four years, at age 10, access will be given to religious vocational education. For the other vocational streams, branching will start at age 15 (10
th grade). This reform will immediately apply to current
school cohorts (students terminating their 8th year of compulsory
education in 2012 will directly continue with the lengthened stream).
Reduce the minimum cost of labour. Reduce the minimum
wage relative to the average wage and differentiate it across regions. Cut social security contributions, especially on low earnings.
A personal tax allowance was introduced for low-income workers in 2008. Employer social security contributions were also reduced for all workers in 2008 (by 5 percentage points), with additional exemptions for young and female workers for a limited period. As a response to the global crisis in 2009, these contributions were further cut for the first years of employment of young and female workers, for six to 54 months. These cuts were made available for all workers starting from 2011, provided that employers increase their total volume of employment. In April 2012, a new incentive scheme exempted all new employees hired in the least advanced Eastern regions (the so-called Category VI regions), not only from employer social contributions, but also from employee contributions and income taxes (eliminating the labour tax wedge in about one sixth of the national territory).
Reform employment protection legislation. Ease employment
protection in the formal sector, both by reforming severance payments and by facilitating temporary work. Allow more flexible labour contracts on a temporary basis.
Parliament adopted a new Law authorising manpower agencies to offer temporary work services in 2009, but a Presidential veto after strong trade union opposition suspended the reform. A new draft Law was submitted for discussion to the social partners in November 2011.
Reduce incentives for early retirement. Reduce incentives for
early retirement by making benefits more actuarially neutral, and by establishing a health insurance contribution for young retirees. Remove retiring workers’ entitlement to severance payments (in new labour contracts).
A social security withholding tax was recently introduced for workers re-employed after retirement (paid by employers). In 2011, a new law extended the coverage of social (pension, health and unemployment) insurance to part-time, seasonal and other atypical workers, provided that they have paid their contributions in full.
A new law adopted in June 2012 will offer new incentives for private pension schemes: participants’ savings will be leveraged by public subsidies of 25%, capped at the annual minimum wage.

© OECD 2012 29
Simplify product market regulations. Streamline product
market regulations, in particular the sectoral licensing rules. Encourage greater competition in network industries.
Permits concerning environmental issues were consolidated into a single “environmental permit” administered electronically, with a simplification of the required documentation. YOIKK (the joint public-private Council for the Improvement of the Investment Environment) continued to consult and issue recommendations. The Competition Authority published its first Report on Competition in February 2012: remaining obstacles to competition are analysed and pro-competitive measures are recommended in a set of sectors including electricity, natural gas, airways, railways, maritime transportation, banking, broadband internet services, and pharmaceuticals.
Reduce the scope of public ownership. Facilitate the
privatisation of national energy, telecommunications, transport and banking enterprises by removing barriers to foreign ownership.
Foreign ownership caps were lowered and privatisation tenders opened to foreign investors in 2006, leading to the acquisition of controlling shares by foreign investors in telecommunications, oil refining, and petro-chemicals. Large scale privatisation tenders are planned in electricity production and distribution, and in gas distribution in 2012.
Reduce administrative burdens on start-ups. Simplify regulatory
requirements for small enterprises.
A new "central registration facility" is being built up for on-line company establishment/registration and information sharing between government agencies. The licensing of food production was centralised in the Ministry of Food, Agriculture and Livestock in the context of regulatory streamlining.
Facilitate banking and capital market financing of enterprises
A new Commercial Code was adopted by Parliament, to come into force in July 2012. It mandates the publication of audited financial accounts according to international standards by all sizes of incorporated firms. In response to concerns from smaller firms, compliance was facilitated by authorising sole auditors rather than certified accounting firms to certify smaller enterprises’ accounts.
Complete agricultural reform and continue with the transition from sheltered to competitive agriculture. Replace
product-specific subsidies with direct income support to eligible farmers, promote competition in all input markets, facilitate land consolidation, and anticipate Turkey’s liberalisation objectives in the WTO and EU negotiations.
The share of direct income support measures (that initially accounted for the majority of the agricultural support budget in the early 2000s, and which are recommended by the OECD) was progressively reduced, but the government declared its intention to raise them again at a later stage. A new approach to agricultural policy was announced in 2010, which distinguishes 30 agricultural basins in the country and aims at providing differentiated support across crops according to ecological conditions in each basin. From 2012, this support is being provided mainly through area-based payments. Irrigation investments and land consolidation efforts are also accelerated, especially in top priority regions such as South Eastern Anatolia, Eastern Anatolia and Konya Basin. New irrigation projects will promote efficient water use.
* On the basis of OECD recommendations in the 2006, 2008 and 2010 Economic Surveys of Turkey, and in the 2005, 2007, 2009, 2011 and 2012 editions of Going for Growth
© OECD 2012 30
Bibliography
OECD Economics Department Working Paper, No. 902.
Aran, M., S. Capar, M. Husamoglu, D. Susalmis and A. Uraz (2009), State Planning Organization of the Republic of Turkey and World Bank,
Welfare and Social Policy Working Papers, No. 2, Ankara and Washington D.C.
Journal of Money, Credit and Banking, Vol. 42.
CBRT (2012), Inflation Report 2012-I, Central Bank of the Republic of Turkey, January, Ankara.
Competition Policy Authority (2012), Rekabet Raporu (Competition Report), Draft, mimeo, Ankara.
Education Reform Initiative (2009), Egitim Reform Grubu Egitim Izleme Raporu (Education Monitoring Report), Istanbul.
Government of Turkey (2006), 9. Kalkinma Plani (2007-2013) (9th Development Plan), Ankara.
Government of Turkey (2009), Milli Egitim Bakanligi 2010-2014 Stratejik Plani (Strategic Plan for Education, 2010-14), Ministry of Education, Ankara.
Government of Turkey (2011a), (61st Government Programme Presented to Turkish Parliament), 8 July, Ankara.
Government of Turkey (2011b), Medium Term Programme 2012-2014, October, Ankara.
Government of Turkey (2011c), 2012 Yili Programi (Yearly Programme), Ministry of Development, October, Ankara.
Government of Turkey (2011d), National Climate Change Action Plan, Ministry of Environment and Urbanisation, July, Ankara.
Government of Turkey (2012a), Pre-accession Economic Programme submitted to the European Commission, January, Ankara.
Government of Turkey (2012b), Performans Esasli Butçeleme (Performance-Based Budgeting), Ministry of Finance, General Directorate for Budget and Fiscal Control, Ankara http://www.bumko.gov.tr/PEB/Genel/Default.aspx?
Düsseldorf Institute for Competition Economics Discussion Papers, No. 12.
Are They OECD Economics Department Working Papers, No. 927, OECD, Paris.
IMF (2012), Turkey: 2011 Article IV Consultation, Washington D.C.
OECD (2008a), OECD Economic Outlook, Vol. 2008/2, OECD, Paris.

© OECD 2012 31
OECD (2008b), OECD Economic Surveys: Turkey, OECD, Paris.
OECD (2008c), OECD Environmental Performance Reviews: Turkey, OECD, Paris.
OECD (2009), Pensions at a Glance, OECD, Paris.
OECD (2010), OECD Economic Surveys: Turkey, OECD, Paris.
OECD (2011a), Evaluation of Agricultural Policy Reforms in Turkey, OECD, Paris.
OECD (2011b), Divided We Stand: Why Inequality Keeps Rising, OECD, Paris.
OECD (2011c), Measuring Well-Being, OECD, Paris.
OECD (2011d), OECD Employment Outlook, OECD, Paris.
OECD (2011e), Towards Green Growth: Monitoring Progress, OECD Indicators, OECD Green Growth Studies, Paris.
OECD (2012a), OECD Economic Surveys: Chile, OECD, Paris.
OECD (2012b), OECD Economic Surveys: Poland, OECD, Paris.
OECD (2012c), OECD Economic Outlook, Vol. 2012/1 (Chapter 4 - Medium and Long-term Scenarios for Global Growth and Imbalances), OECD, Paris
OECD- - Supporting Employment Through Reduc -20 Country Policy Brief, Meeting of Labour and Employment Ministers, 26-27 September, Paris.
Policies in Emerging Market IMF Staff Discussion Note, 29 February.
IZA Discussion Papers, No. 6271, Institute for the Study of Labor, Bonn.
Washington D.C.
World Bank (2010), Informality: Causes, Consequences, Policies, Country Economic Memorandum, Report No. 48523-TR, Washington, DC.
World Trade Organization (2012), Trade Policy Review: Turkey, Report by the Secretariat, Geneva.

© OECD 2012 32
Chapter summaries
Chapter 1. Tackling external and domestic macroeconomic imbalances
Effective macroeconomic and structural policies helped Turkey bounce back quickly and strongly from the global crisis, with annual growth averaging close to 9% over 2010-11. However, the current account deficit widened to around 10% of GDP in 2011 and consumer price inflation rose to over 10%. The external deficit, which is far too large for comfort, is a source of vulnerability. So is double-digit inflation, even if it partly reflects transient factors. These imbalances signal competitiveness problems and a dearth of domestic saving. They need to be addressed using both macroeconomic and structural policy levers. Monetary policy has recently tried to reduce the volatility of capital flows but inflation has been high and volatile. The inflation target needs to be given greater prominence. The fiscal stance remains broadly appropriate but could be tighter, if warranted, to complement monetary restraint and help keep the real exchange rate on a sustainable path. More balanced growth through strengthened competitiveness and greater private saving calls inter alia for increased labour force participation, accelerated formalisation, stronger productivity growth, improvements in financial literacy and a more attractive menu of saving instruments. Improvements in the business environment would spur foreign direct investment, making for healthier funding of the external gap.
Chapter 2. Structural reforms to boost long-term growth
Turkey has the potential to achieve strong sustainable growth and job creation but further reforms in the labour market, education and product markets are required for such gains to materialise. In recent years, growth has been largely driven by the industrial catch-up of Anatolian regions, although the Marmara area in the West has also been very dynamic. At the same time, export diversification towards the Middle East and Africa has helped support the expansion. In the process, labour force participation has started to rise anew, but around one third of new low-skilled jobs have been created in the informal sector, in firms exposed to competition from less-advanced emerging economies. Sustaining vigorous growth over the longer run therefore requires pushing ahead with a number of structural reforms that are conducive to higher productivity within each sector
rigid labour market regulation needs to evolve, so as to encourage job creation in the formal sector. Second, further progress with education reform, from pre-school all the way to the tertiary level and vocational training, is needed to boost growth and bring about employment gains in the formal sector. Third, implementing product market reforms, notably in network industries, would unleash productivity gains in those sectors and be a boost to the rest of the economy. A set of alternative growth scenarios through 2030 illustrates how progress on these various fronts can lift productivity growth and deliver lasting improvements in living standards.
This Survey is published on the responsibility of the Economic and Development Review Committee (EDRC) of the OECD, which is charged with the examination of the economic situation of member countries.
The economic situation and policies of Turkey were reviewed by the Committee on 14 june 2012. The draft report was then revised in the light of the discussions and given final approval as the agreed report of the whole Committee on 27 June 2012.
Rauf Gönenç, Oliver Röhn, Şeref Saygili and Ramazan Karaşahin under the supervision of Vincent Koen. Statistical assistance was provided by Béatrice Guérard.
The previous Survey of Turkey was issued in July 2010.
Information about the latest as well as previous Surveys and more information about how Surveys are prepared is available at www.oecd.org/eco/surveys.
Further information
For further information regarding this overview, please contact:
Vincent Koen, e-mail: vincent.koen @oecd.org; tel.: +33 1 45 24 87 89; or Rauf Gönenç, e-mail: rauf.gonenc @oecd.org; tel.: +33 1 45 24 94 04; or Oliver Röhn, e-mail: oliver.roehn @oecd.org; tel.: +33 1 45 24 91 50.
See also http://www.oecd.org/eco/surveys/Turkey.
How to obtain this book This survey can be purchased from our online bookshop: www.oecd.org/bookshop.
OECD publications and statistical databases are also available via our online library: www.oecdilibrary.org.
Related reading OECD Economic Surveys: OECD Economic Surveys review the economies of member countries and, from time to time, selected non-members. Approximately 18 Surveys are published each year. They are available individually or by subscription. For more information, consult the Periodicals section of the OECD online Bookshop at www.oecd.org/bookshop.
OECD Economic Outlook: More information about this publication
www.oecd.org/eco/Economic_Outlook.
Economic Policy Reforms: Going for Growth: More information
www.oecd.org/economics/goingforgrowth.
Additional Information: More information about the work of the OECD Economics Department, including information about other publications, data products and Working Papers available for
www.oecd.org/eco.
Economics Department Working Papers: www.oecd.org/eco/workingpapers
OECD work on Turkey: www.oecd.org/Turkey