OECD Economic Surveys Tunisia
46
OECD Economic Surveys Tunisia March 2018 OVERVIEW www.oecd.org/eco/surveys/economic-survey-tunisia.htm
Transcript of OECD Economic Surveys Tunisia

OECD Economic Surveys
TunisiaMarch 2018OVERVIEW
www.oecd.org/eco/surveys/economic-survey-tunisia.htm

This Overview is extracted from the 2018 Economic Survey of Tunisia. The Survey was discussed at a
meeting of the Economic and Development Review Committee on 15 January 2018 and is published is published under the responsibility of the Secretary-General of the OECD.
This document, as well as any data and any map included herein, are without prejudice to the status of or
sovereignty over any territory, to the delimitation of international frontiers and boundaries and to the
name of any territory, city or area.
The statistical data for Israel are supplied by and under the responsibility of the relevant Israeli
authorities. The use of such data by the OECD is without prejudice to the status of the Golan Heights,
East Jerusalem and Israeli settlements in the West Bank under the terms of international law.
OECD Economic Surveys: Tunisia © OECD 2018
You can copy, download or print OECD content for your own use, and you can include excerpts from
OECD publications, databases and multimedia products in your own documents, presentations, blogs,
websites and teaching materials, provided that suitable acknowledgement of OECD as source and
copyright owner is given. All requests for public or commercial use and translation rights should be
submitted to [email protected]. Requests for permission to photocopy portions of this material for public
or commercial use shall be addressed directly to the Copyright Clearance Center (CCC) at
[email protected] or the Centre français d’exploitation du droit de copie (CFC) at
[email protected] of or sovereignty over any territory, to the delimitation of international
frontiers and boundaries and to the name of any territory, city or area.

OECD Economic Surveys: Tunisia
© OECD 2018
11
Executive summary
● The drivers of inclusive growth need to be rebalanced
● Reviving business investment is vital for relaunching the convergence process
● The creation of quality jobs will help reduce the gap in living standards

EXECUTIVE SUMMARY
OECD ECONOMIC SURVEYS: TUNISIA © OECD 201812
The drivers of inclusive growth need to be rebalancedThe process of economic convergence slowed after 2010,reflecting specific factors and an exacerbation of structuralconstraints. Tourism and mining activities suffered from adownturn in security and the social climate. Privateconsumption was underpinned by a sharp increase inemployment and public-sector salaries but economicactivity and job creation in the private sector remained low.Increased demand has put pressure on prices and thecurrent account. The ratios of public and external debt toGDP have risen sharply. In order to return public debt to asustainable footing without stifling growth, fiscalstabilisation needs to be targeted over the medium-termand accompanied by structural reforms which will reviveeconomic activity and job creation in the private sector.Public spending also needs to be refocused on supportingunderprivileged populations and inclusive growth.
Reviving business investment is vital for relaunching the convergence processThe investment rate has been on a downward trend sincethe start of the century, and is currently low. To date, publicinvestment has been for the most part preserved. On theother hand, business investment has suffered fromexcessive regulations on product markets, as well ascomplex administrative procedures which can encouragecorruption, unpredictable taxation, increasing problemswith customs clearance and the shipping of goods, and afinancial system which does not particularly favour start-upsand growing companies. In order to revive businessinvestments, these restrictions need to be lifted, which willalso help revive productivity, job creation and thepurchasing power of all Tunisians. Housing investment hasbeen underpinned by financial and tax incentives whichhave moved savings away from more productiveinvestments. The current reform process, kicked off by thenew law on investment, needs to be continued.
The creation of quality jobs will help reduce the gap in living standardsThe average standard of living of Tunisians has improved inrecent decades and there has been a substantial decline inpoverty. Nevertheless, significant inequality still exists inthe labour market, with high unemployment especiallyamong young graduates, widespread informal employment,and many Tunisians in precarious working situations.Gender gaps are smaller than in other MENA countries butthe employment rate is much lower for women than men,and women often have less skilled jobs. There aresignificant regional inequalities in terms of living standardsand employment. A new regional development policy isrequired to leverage the specific strengths of each region.
Source: World Bank World Development Indicators database.1 2 http://dx.doi.org/10.1787/888933692807
24
25
26
27
28
29
30
31
1995
1996
1997
1998
1999
2000
2001
2002
2003
2004
2005
2006
2007
2008
2009
2010
2011
2012
2013
2014
2015
2016
% of OECD average
Tunisia GDP per capita2011 USD PPP
Source: INS.1 2 http://dx.doi.org/10.1787/888933692826
15
17
19
21
23
25
27
1997
1998
1999
2000
2001
2002
2003
2004
2005
2006
2007
2008
2009
2010
2011
2012
2013
2014
2015
2016
% of GDP
Investment rate
Source: INS.1 2 http://dx.doi.org/10.1787/888933692845
0
5
10
15
20
25
30
2000 2005 2010 2015
% of population
Poverty rate
Poverty Extreme poverty

EXECUTIVE SUMMARY
OECD ECONOMIC SURVEYS: TUNISIA © OECD 2018 13
MAIN FINDINGS KEY RECOMMENDATIONS
Improve macroeconomic policies
There has been a sharp increase in the fiscal deficit and governmentdebt.
Accompany fiscal adjustment with structural reforms to set the ratio ofgovernment debt to GDP on a downward trend over the medium-term.Carry out spending reviews on the utility of public programmes,including infrastructure projects, in order to prioritise public spending.
Taxes are already high and weigh in particular on job creation in theformal sector and on private initiative. Tax incentives are eroding taxrevenues and have not proved very effective.
Restore tax justice by facilitating the cross-check of information andincreasing tax inspections in order to better combat tax evasion andfraud.Systematically assess the impact, costs and beneficiaries of taxincentives, especially for housing and business investment.
Public employment has risen sharply. Public servants’ wages absorbhalf of public spending.
Gradually reduce public sector employment by maintaining the rule ofpartial replacement of persons leaving for retirement.
The pension regime is unsustainable, mainly as a result of the increasein life expectancy.
Gradually increase the legal age of retirement and undertake reforms toguarantee the financial sustainability of the pension regimes.
Subsidies mainly benefit wealthy households. They encourage fraud andexcessive consumption, and are harmful to the environment.
Reform subsidies by implementing automatic adjustment rules forhydrocarbon products and, for other products, replace them by cashtransfers to households.
Non-performing loans are high, especially in public banks. Speed up the introduction of legislative changes allowing banks toreduce levels of non-performing loans.Continue to disengage the State from public banks and banks in which ithas shareholding interests.
Revive business investment
The fall in the rate of business investment steepened after 2010. Sector,regulatory and administrative restrictions are holding back privateinitiative. The new investment law introduces freedom of investmentwith a negative list which will gradually be applied.
Speed up the process for reducing the number of permissions tooperate, and administrative authorisations, licences and permits.Further reduce restrictions on the presence of foreign executives.
Tunisia’s ranking in terms of logistical performance and trade facilitationhas deteriorated.
Simplify administrative and customs procedures for goods entering andexiting the country.Improve the management of port infrastructures, potentially throughpublic-private partnerships.
Several sectors are dominated by public companies which are often in aprecarious financial situation as employment has risen sharply since2011 while the price and tariff adjustments were limited.
Improve the governance of public enterprises, by better enforcingperformance contracts and with a level playing field for public andprivate companies.
Access to funding is difficult for start-ups and fast growing businesses. Allow banks to set risk premiums by reconsidering the ceiling onlending rates.Speed up the adoption and application of the new code for collectiveinvestment funds.
Reduce inequalities in the labour market and across regions
Unemployment is high, particularly among young graduates. Ensure that systems for education, learning and training respond to therequirements of businesses.
Job creation is weak. Contributions remain high, pushing peopletowards the informal sector.
Diversify the funding sources for social security.
There is a gender gap in the labour market. Encourage the recruitment of women through campaigns to raiseawareness of the repercussions of educational choices on opportunitiesin terms of employment, entrepreneurship, career development andsalaries.
Small enterprises and low-income households make little use offinancial services.
Speed up the implementation of the financial inclusion strategy.
There are significant regional inequalities in terms of living standardsand employment.
Modernise regional structures and institutions to take better advantageof investment opportunities and help investors in the regions.


OECD Economic Surveys: Tunisia
© OECD 2018
15
Assessment and recommendations
● Solid progress for several decades in the political, social and economic fields
● Growth is going to become stronger, but inflationary pressures and the twin deficitspersist
● Policies to restore macroeconomic balances without halting growth
● Returning Tunisia to a path of inclusive and robust growth

ASSESSMENT AND RECOMMENDATIONS
OECD ECONOMIC SURVEYS: TUNISIA © OECD 201816
Solid progress for several decades in the political, social and economic fieldsTunisia is firmly committed to a process of democratisation since the fall of the
political regime in power since 1987. From independence in 1956 until the “revolution for
freedom and dignity” at the end of 2010, Tunisia had only two presidents, and few elections
were truly democratic. In October 2011, the country held elections to designate the
constituent assembly responsible for drafting a new constitution. That constitution was
adopted in January 2014, and parliamentary and presidential elections were organised at
the end of that year. The democratic leap since 2010, measured by the World Bank indicator
of citizens’ capacity to participate in political life as well as their freedom of expression and
association, has been significant. This indicator also places Tunisia in a favourable position
compared to other countries of the region, and to many emerging countries (Figure 1). In
addition, there is a higher proportion of women in the Assembly of the Representatives of
the People than in most OECD and emerging countries.
This democratic renewal has gone hand-in-hand with frequent changes of
government. The presence of a well-formed administration has nevertheless served to
ensure continuity of the State during these changes. Moreover, successive governments
have broadly shared the same economic agenda – the programme of major reforms. The
Carthage Pact was concluded in July 2016 by nine political parties and representatives of
the principal labour unions and employer associations. A government of national unity,
comprising representatives of the Pact’s signatory parties, was formed in August 2016. The
essential components of this Pact are to combat terrorism and corruption, to speed growth
and employment, to bring the public finances under control, to implement an effective
social policy, and to promote regional development.
Figure 1. Political transition: significant progress toward democracy
Source: World Bank, Worldwide Governance Indicators; and World Bank, World Development Indicators (WDI).1 2 http://dx.doi.org/10.1787/888933692864
0102030405060708090
100
Chi
naEg
ypt
Alge
riaM
oroc
coTu
rkey
Mex
ico
Indo
nesi
aTu
nisi
aBr
azil
Indi
aSo
uth
Afric
aKo
rea
Slov
ak R
ep.
Chi
leIta
lySp
ain
Pola
nd EUO
ECD
Portu
gal
Fran
ce
Rank1-100
A. Voice and Accountability(the higher the score, the better the performance)
2010 2015
05
1015202530354045
Chi
le
Kore
a
Indo
nesi
a
Slov
ak R
ep.
Mor
occo
Chi
na
Fran
ce
Pola
nd EU
OEC
D
Italy
Tuni
sia
Alge
ria
Portu
gal
Spai
n
Sout
h Af
rica
Mex
ico
%
B. Female representation in parliamentProportion of seats held by women in the national
parliament

ASSESSMENT AND RECOMMENDATIONS
OECD ECONOMIC SURVEYS: TUNISIA © OECD 2018 17
While there is a broad consensus on the need for reforms, implementation of the
reforms has run up against economic and political constraints. Political fragmentation has
made it difficult for the Assembly of the Representatives of the People to adopt the reforms
proposed by the government (Council of Economic Analysis, 2016). Moreover, there is often
a delay in implementing laws adopted by the Assembly as implementation decrees, which
are the responsibility of the executive, are published belatedly.
Inclusiveness has been a major concern in Tunisia since its independence. The Code
of Personal Status, adopted in 1956, makes Tunisia the most progressive country in the
Arab world in terms of women’s rights. Schooling, in particular for girls, was also made a
national priority much earlier than in the majority of emerging countries. The plan
launched by the President in mid-2017 to give men and women equal inheritance rights
goes in the same direction. Access to basic public services, such as electricity and water, is
notably higher than in the majority of emerging countries. The basis for social protection
was laid as early as 1960, with a “pay-as-you-go” retirement pension scheme and a
relatively high-quality health system. A system of social benefits for workers who lost their
jobs for economic and technical reasons was introduced in 1997. A national programme of
transfer payments and free or cheap healthcare for poor and low-income families has been
introduced. Tunisia is therefore more favourably positioned than other emerging
economies in terms of its population’s well-being, especially in the dimensions of health,
housing and basic infrastructure (Figure 2).
The numerous social programmes adopted since the 1970s have helped to reduce
poverty (Figure 3). The low poverty rate is particularly impressive in comparison with other
countries of the Middle East and North Africa (MENA). Thus, the country’s economic
growth has benefited the majority of Tunisian households, including the poorest ones,
which have seen their consumption rise at a faster pace than the wealthier segments
(World Bank, 2016).
Labour market inequalities and regional disparities have persisted and have even been
widening (Chapter 2), and they helped to precipitate the revolution of 2011. Women’s
participation, while higher than in most MENA countries, remains low. The unemployment
rate is high, especially for young people and women. For those who have a job, there are
important differences in status and income between public sector employees, private sector
employees, and employees in the informal sector (who have no social coverage at all). The
interior regions of the country suffer from low levels of activity, high unemployment rates,
and lower-quality public services. They are also poorly linked to the main economic sectors
on the coasts.
Since independence, Tunisia has accorded the State an important role. The economic
model was built around an active industrial policy to foster the development of certain
sectors of activity, large enterprises, and public banks. This statist development model
became gradually more open to foreign trade and to foreign direct investment, beginning
in 1972 with a new investment code that instituted a favourable tax and customs regime
for enterprises devoted exclusively to export – the so-called “offshore system”. The
Agreement of Association with the European Union in 1995 accelerated the process of
opening. Private initiative and business creation have been encouraged since the
mid-1990s, with a wide range of financial and tax measures for small and medium-sized
enterprises. At the same time, Tunisia has experienced several waves of privatisation,
notably in the mid-1980s and in 2006-2007, as well as regulatory reforms. Some of these

ASSESSMENT AND RECOMMENDATIONS
OECD ECONOMIC SURVEYS: TUNISIA © OECD 201818
Figure 2. Indicators of well-being are fairly high, except for employment and income
Note: The variables used for these dimensions are the following: i) Housing: share of population with access to improved sanitation andshare of population with access to electricity; ii) Income: GDP per capita expressed in purchasing power parity; iii) Employment:employment rate and share of unemployed without paid work for at least one year; iv) Education: average outcomes from PISA tests inreading, mathematics and science, and share of the over-25 population with at least an upper secondary school education;v) Environment: inverse of the average annual concentration of PM2.5 and share of population with access to an improved drinking watersource; vi) Health: life expectancy at birth.Source: World Bank, World Development Indicators, INS, OECD PISA database, UNESCO.
1 2 http://dx.doi.org/10.1787/888933692883
0
20
40
60
80
100
120Housing
Income
Employment
Education
Environment
Health
A. Well-being, main dimensions OECD = 100
Tunisia
Low-income OECD countries
0 20 40 60 80 100 120 140
Basic sanitation facilities
Access to electricity
GDP per capita
Employment rate
Dynamism of the employment market
Student skills
Years of schooling
Air quality
Water quality
Life expectancy
Hou
sing
Inco
me
Empl
oym
ent
Educ
atio
nEn
viro
nmen
tH
ealth
B. Well-being, sub-indicatorsOECD = 100
Tunisia
Low-income OECD countries

ASSESSMENT AND RECOMMENDATIONS
OECD ECONOMIC SURVEYS: TUNISIA © OECD 2018 19
reforms have however been seen as smacking of cronyism, by reinforcing the control of
important families over the economy (Rijkers et al., 2014).
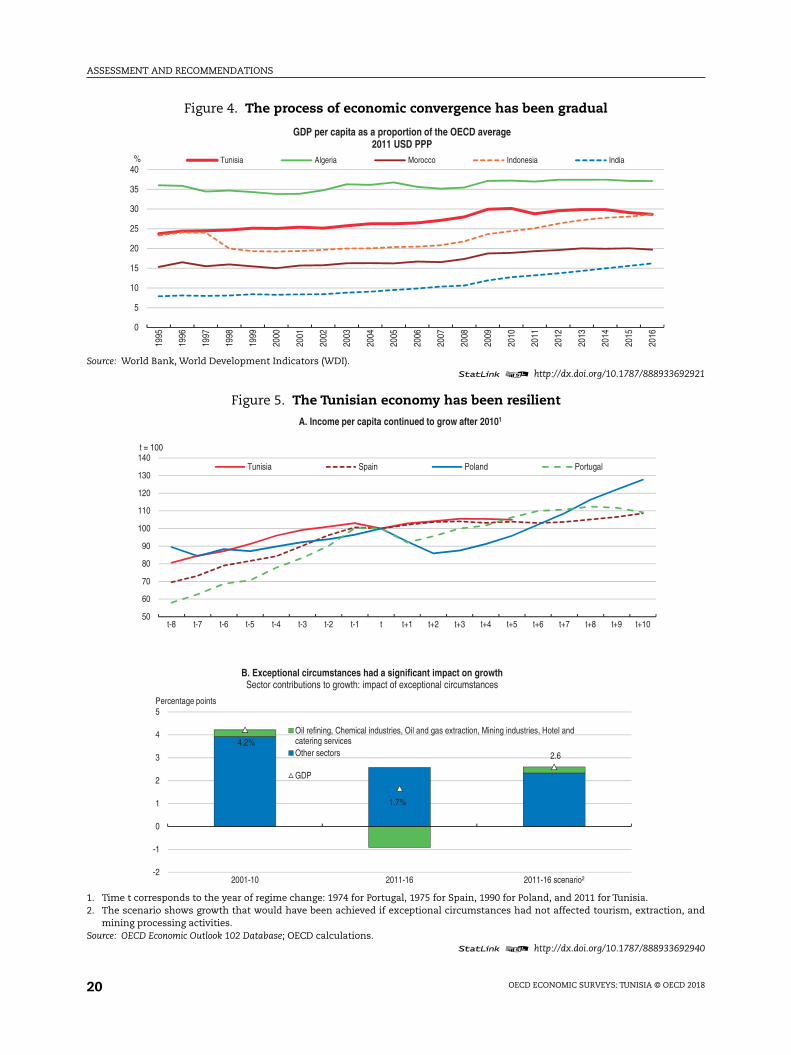
After accelerating during the 1990s, the process of economic convergence came to a
temporary halt (Figure 4). Growth faltered after 2010. Business investment as a percentage
of GDP has been on a downward track since the beginning of the century (Chapter 1), and
this has weighed upon productivity, job creation and the improvement of living standards.
The sharp growth in public employment and wages sustained demand, but led to twin
deficits (fiscal and trade) that have reached critical levels. The slowing of economic activity
is also a reflection of exceptional circumstances – labour strife and terrorist attacks – that
have affected the production and export of oil, gas and phosphates, as well as the tourism
sector. It is estimated that if these sectors had continued to grow at the same rate as before
2011, average GDP growth for the 2011-16 period would have stood at 2.6%, all things being
equal, rather than the 1.7% increase observed. The economic slowdown has however been
less severe than in other countries that have been through major political transitions, such
as Spain, Poland and Portugal (Figure 5.A).
The Tunisian economy also suffered from the impact of the crisis in Libya, which was its
number two trading partner after the European Union. Libya was an important market,
especially for agri-food and construction. While it is true that the influx of Libyan refugees,
with average revenues which were much higher than in Tunisian households, boosted
consumption, the Libyan crisis also precipitated the return home of around 60 000 Tunisians,
most of whom originally came from deprived regions, thereby exacerbating unemployment
and regional inequalities. Flaring tensions in the region also affected investment and
tourism in Tunisia, leading to an increase in military and security spending. Overall, the
World Bank estimates that the Libyan crisis resulted in a fall in growth of one percentage
point over the period 2011 to 2015 (World Bank, 2017).
The normalisation of the domestic and external situation should allow recovery of
growth, as well as an improvement in the balance of payments and the fiscal balance. Such
Figure 3. The poverty rate has declined
Note: The poverty rate is defined as the percentage of the population earning less than TND 1 706 or USD 712 per year (in 2015). Forextreme poverty, the threshold is TND 1 032 or USD 431 per year.Source: INS.
1 2 http://dx.doi.org/10.1787/888933692902
0
5
10
15
20
25
30
2000 2005 2010 2015
% of population
Poverty Extreme poverty
ASSESSMENT AND RECOMMENDATIONS
OECD ECONOMIC SURVEYS: TUNISIA © OECD 201820
Figure 4. The process of economic convergence has been gradual
Source: World Bank, World Development Indicators (WDI).1 2 http://dx.doi.org/10.1787/888933692921
Figure 5. The Tunisian economy has been resilient
1. Time t corresponds to the year of regime change: 1974 for Portugal, 1975 for Spain, 1990 for Poland, and 2011 for Tunisia.2. The scenario shows growth that would have been achieved if exceptional circumstances had not affected tourism, extraction, and
mining processing activities.Source: OECD Economic Outlook 102 Database; OECD calculations.
1 2 http://dx.doi.org/10.1787/888933692940
0
5
10
15
20
25
30
35
4019
95
1996
1997
1998
1999
2000
2001
2002
2003
2004
2005
2006
2007
2008
2009
2010
2011
2012
2013
2014
2015
2016
%
GDP per capita as a proportion of the OECD average2011 USD PPP
Tunisia Algeria Morocco Indonesia India
50
60
70
80
90
100
110
120
130
140
t-8 t-7 t-6 t-5 t-4 t-3 t-2 t-1 t t+1 t+2 t+3 t+4 t+5 t+6 t+7 t+8 t+9 t+10
t = 100
A. Income per capita continued to grow after 20101
Tunisia Spain Poland Portugal
4.2%
1.7%
2.6
-2
-1
0
1
2
3
4
5
2001-10 2011-16 2011-16 scenario²
Percentage points
B. Exceptional circumstances had a significant impact on growth Sector contributions to growth: impact of exceptional circumstances
Oil refining, Chemical industries, Oil and gas extraction, Mining industries, Hotel andcatering servicesOther sectors
GDP

ASSESSMENT AND RECOMMENDATIONS
OECD ECONOMIC SURVEYS: TUNISIA © OECD 2018 21
normalisation will however not be enough to spark a sustained pace of growth, to make a
significant dent in unemployment (a key factor for inequality in Tunisia), and to return the
public debt to a sustainable path.
Tunisia and the IMF signed a USD 2.9 billion Extended Fund Facility agreement in 2016
to address the underlying vulnerabilities. This agreement calls, in particular, for promoting
more vigorous and more equitably shared economic growth by shoring up macroeconomic
stability, reforming public institutions (especially the civil service), facilitating financial
intermediation, and enhancing the business climate.
Tunisia could make more of its comparative advantages. It has a relatively well-trained
workforce and a strategic geographic situation, between Europe and Africa. It will be an
essential partner in the reconstruction of Libya. Its economy is open to trade and to foreign
investors. Some parts of the economy are particularly robust, notably the offshore sector.
In this sector, the number of enterprises grew by a factor of more than 13 between 1996 and
2016, while the number of firms in the onshore sector less than doubled. Enterprises in the
offshore sector accounted for 78% of non-energy exports in 2015, and 34% of formal
employment. The output of the offshore sector has been diversified toward more complex
products than the traditional textile and clothing business, with the steady progression of
the engineering and electrical industries. The outlook for growth to 2025, based on the
sophistication and diversification of products (The Atlas of Economic Complexity) is highly
favourable (Figure 6). In terms of innovation, Tunisia is the leading African and MENA zone
country in the Bloomberg Innovation Index, ranking 43rd out of 200 countries in 2018. To
capitalise on these assets, Tunisia will have to undertake reforms that will unleash private
initiative and help to exploit the country’s comparative advantages.
The main messages from this first OECD economic review of Tunisia are the following:
● To return public debt to a sustainable path will require a combination of gradual fiscal
stabilisation and structural reforms capable of sustaining growth. As the tax-to-GDP
ratio is already high, fiscal consolidation will have to focus on public spending and be
enshrined in a medium-term horizon. Tax justice must be reinforced and the bias of
Figure 6. Medium-term growth outlook based on the complexity of the economy
Source: The Atlas of Economic Complexity, 2015. Harvard Center for International Development.1 2 http://dx.doi.org/10.1787/888933692959
Egypt 7.0
Tunisia 4.9South Africa 4.8Morocco 4.2
Algeria 2.8
Mexico 4.6Brazil 4.2
Chile 2.6
India 7.7
Indonesia 5.8Turkey 5.6
China 4.4
Korea 3.4Spain 3.8 Portugal 3.6
Slovak Rep. 3.1 Poland 3.1France 2.9Italy 2.1
0.0
1.0
2.0
3.0
4.0
5.0
6.0
7.0
8.0
9.0
0 1 2 3 4 5
%
Projected growth in 2025 by region
Africa Americas Asia Europe Oceania

ASSESSMENT AND RECOMMENDATIONS
OECD ECONOMIC SURVEYS: TUNISIA © OECD 201822
subsidies in favour of wealthy households must be corrected. The governance of State-
owned enterprises needs to be reinforced, and their financial performances significantly
improved.
● To revive economic activity, and create jobs, the pace of structural reforms must be
quickened. Priority needs to be given to improving the business climate it will be easier
to achieve gains doing this rather than modernising the Labour Code. To this end, the
regulatory, administrative and financing constraints facing businesses must be lifted,
and a level playing field must be created for public and private companies. Opening the
economy to competition should help as well to reduce established positions and speed
the dissemination of new technologies. Better logistical performances and facilitation of
external trade should make it possible to attract more foreign investment and to move
further along global value chains. The predictability of regulation, including tax
regulation, is also important for investors.
● Job creation and regional development are the key factors behind more inclusive growth.
In order to cut unemployment and to create high-quality jobs, the social contributions that
now weigh upon paid employment must be lightened. Policies that promote women’s
participation in the labour market and their employment, and that provide better
guidance on training courses that help ensure employment should be implemented. A
new regional development policy is needed, one that can capitalise on the specific
advantages of each region, notably through the introduction of conditions conducive to
business designed to attract investors. Measures to encourage worker mobility, such as
improvements to infrastructure and public transport in isolated regions, are also needed.
Growth is going to become stronger, but inflationary pressures and the twindeficits persist
The economy is gaining strength
Economic activity has been recovering since 2016, driven by good harvests and the
strong performance of the services sector, especially tourism and transport (Figure 7). In
2015, growth slowed as a result of temporary factors that were specific to certain sectors.
Industrial performance was affected by labour unrest, especially in the chemicals industry,
mining and hydrocarbons production. The output of oil and gas also suffered from
declining reserves, the closing of some fields for maintenance, the paucity of foreign direct
investment (FDI), and the absence of new discoveries (Central Bank of Tunisia, 2017). The
terrorist attacks of 2015 had a heavy impact on the tourism sector, although tourist arrivals
recovered in 2017 with the lifting of traveller alerts in several European countries.
Job creation is weak and unemployment remains high
The weakness of economic activity in recent years has stymied any substantial growth
in employment. The employment rate (defined as the labour force divided by the total
working-age population [aged 15+]) has been on a downward track since mid-2014,
dropping to around 40% in the second quarter of 2017 (Figure 7.C). The unemployment rate
is high: it stood at 15% of the economically active population in mid-2017, and in 2016 it
was as high as 30.5% among young graduates of higher education.
Inflation has resumed its upward track since April 2016, and now stands at more than
6% year-over-year at the end of 2017 (Figure 7.D). Inflationary pressures are essentially a
reflection of the devaluation of the dinar as well as higher wages and salaries, which have

ASSESSMENT AND RECOMMENDATIONS
OECD ECONOMIC SURVEYS: TUNISIA © OECD 2018 23
boosted consumption. In fact, real wages have risen faster than productivity in 2016 and
2017, especially in government, the agri-food industries, and hydrocarbons (Figure 8). The
wage agreement signed in March 2017 foresees an increase of 6% for 2016 (with retroactive
effect to August 2016) and a similar increase as of May 2017. Some sectors are facing
difficulties in applying these salary increases, even if they have been granted a derogation
to defer their application.
It is proving hard to reverse the current account deficit
External payments have been affected since 2011 by social unrest and greater insecurity
in the wake of the revolution, and by the Libya crisis. The current deficit has deepened
significantly to an average of 9.1% of GDP between 2013 and 2017, compared to 3.1% of GDP
between 2006 and 2010.
Figure 7. Macroeconomic indicators
1. GDP at factor cost.2. The Employment rate is calculated as the labour force divided by the total working-age population (aged 15+).3. The Unemployment rate is calculated as the number of unemployed people as a percentage of the active population. Unemployed
people are persons of working age who are without work, available for work and that have taken active steps to find work. The activepopulation is defined as the total number of unemployed people plus the employed civilian workforce.
Source: INS; OECD Economic Outlook 102 Database.1 2 http://dx.doi.org/10.1787/888933692978
0
1
2
3
4
5
6
7
8
9
2011 2012 2013 2014 2015 2016 2017 2018
Annual change in %
D. Steadily rising inflation
General consumer price inflationFree pricesAdministered prices
-4
-2
0
2
4
6
8
10
Annual change in %
A. Real quarterly GDP¹ growth
-3
-2
-1
0
1
2
3
4
5
6
2011 2014 2017
Annual change in %
B. Contributions to GDP¹ growth
Other
Manufacturing sector
Market services
Real GDP
14.0
14.5
15.0
15.5
16.0
16.5
17.0
17.5
18.0
18.5
38.0
38.5
39.0
39.5
40.0
40.5
41.0
2012 2013 2014 2015 2016 2017
%% C. Labour market
Employment rate² (left-hand axis)Unemployment rate³ (right-hand axis)

ASSESSMENT AND RECOMMENDATIONS
OECD ECONOMIC SURVEYS: TUNISIA © OECD 201824
The trade deficit increased from 13.2% of GDP in 2010 to 16% of GDP in 2017, mainly as
a result of uncontrolled imports, especially of consumer goods, and a downturn in
exportations in some sectors such as extractive industries.
The energy balance has been largely in deficit in recent years as a result of declining
volumes in domestic production, the increase in domestic consumption and the decrease
in investment activity in the oil and gas exploration and development sectors. Export
volumes of phosphates and derivatives have fallen sharply since 2011 as a result of ongoing
social unrest at production and transport sites. Nevertheless, manufacturing exports,
especially in the electromechanical industries, have performed well over the last two years
as a result of stringer demand from European Union countries.
The longstanding surplus on the services balance has fluctuated substantially since
2011 as a result of the decline in tourist activity and transport after the 2015 terror attacks.
However, the improvement in security conditions in the past two years has gradually
restored the previous situation. Despite the financial crisis and unemployment levels
prevailing in the host countries, remittances by Tunisians living abroad are high. In 2016,
they amounted to 4.4% of GDP, which represents almost the double of foreign direct
investment.
The devaluation of the dinar has not yet led to a reduction in the current deficit (Figure 9).
Since October 2017, in a bid to stem the decline in foreign currency holdings, economic actors
importing non-essential consumer goods are no longer allowed to use bank loans for these
operations.
Tunisia’s external debt, over three-quarters of which is medium- and long-term debt,
has increased recently, and stood at 70% of GDP at the end of 2016 (IMF, 2017). Given its
structure – low average interest rate, relatively long maturities, and relatively large
proportion of concessional debt – the external debt should be robust to most shocks, with
the exception of major real exchange rate depreciation (IMF, 2017). In November 2017, foreign
exchange reserves were barely at the level allowing them to cover three months of imports
of goods and services.
Figure 8. Real wages have outpaced productivity
Note: An increase in the index indicates that wages are growing faster than productivity.Source: ITCEQ.
1 2 http://dx.doi.org/10.1787/888933692997
70
75
80
85
90
95
100
105
110
115
120
2010 2011 2012 2013 2014 2015 2016 2017
Index, 2010=100
Index of labour productivity/real wages
Agri-food industries Mechanical and electric industriesNon-manufacturing industries AdministrationEconomy as a whole

ASSESSMENT AND RECOMMENDATIONS
OECD ECONOMIC SURVEYS: TUNISIA © OECD 2018 25
Growth will strengthen in 2018 and 2019, but risks persist
Growth should reach 2.8% in 2018 and 3.4% in 2019 (Table 1). Business investment will
benefit from the simplification of procedures inherent in the new investment law, while
exports will benefit from the recovery in European markets. Inflation rose in the second
half of 2017 and tension has continued in 2018 due to the impacts of currency depreciation,
rising wages and the increase in VAT. Nevertheless, it should ease relatively as of 2019.
Unemployment will fall but certain groups – women, young people and graduates – will
still face great difficulties. The current deficit will decline slightly as tourism recovers and
exports resume as expected.
Recent developments in agriculture and agri-food suggest that the farm sector could
contribute more than expected to growth. On the other hand, social unrest could dampen
Figure 9. The devaluation of the dinar was not enough to reduce the current deficit
Note: A decline in the real effective exchange rate signifies an increase in competitiveness.Source: Central Bank of Tunisia; and INS.
1 2 http://dx.doi.org/10.1787/888933693016
80
83
86
89
92
95
98
101
104
-15
-12
-9
-6
-3
0
3
2014 2015 2016 2017
Index, 2010=100% of GDP
Balance on current transactions Real effective exchange rate (right-hand axis)
Table 1. Recent developments and projections
2014 2015 2016 2017 2018 2019
Current pricesin billions of TND
Percentage change in volume (2010 prices)
GDP at market prices 80.8 1.1 1.0 2.0 2.8 3.4
Private consumption 55.9 3.2 3.3 3.3 3.2 2.9
Public consumption 15.1 4.4 2.5 0.8 0.2 0.2
Gross fixed capital formation 16.4 -0.5 2.4 3.3 5.4 6.6
Final domestic demand 87.4 2.7 3.0 2.8 3.0 3.1
Exports of goods and services. 36.3 -5.3 -0.3 3.2 5.0 5.6
Imports of goods and services 45.2 -2.6 3.1 5.6 5.0 4.6
Net exports1 -8.9 -0.9 -1.7 -1.5 -0.5 0.0
Memorandum items
GDP deflator - 3.2 5.1 6.0 6.9 5.4
Consumer price index - 4.9 3.7 5.3 6.4 5.0
Unemployment rate (% of active population) - 15.2 15.5 15.4 15.2 14.7
Current account balance (% of GDP) - -8.9 -8.8 -10.1 -9.5 -9.0
1. Contributions to changes in GDP in volume, effective amount for the first column.Source: OECD Economic Outlook No. 102 Database, adjusted for the most recent available information.

ASSESSMENT AND RECOMMENDATIONS
OECD ECONOMIC SURVEYS: TUNISIA © OECD 201826
growth. The lack of security in certain zones still poses a risk for investors and tourists. The
continued increase in oil prices could adversely affect inflation, the public finances, and
the balance of current payments. The Tunisian economy may also have to face shocks
whose potential repercussions are difficult to integrate into forecasts (Table 2).
Policies to restore macroeconomic balances without halting growth
Create conditions for the transition to a medium-term explicit inflation targetingsystem
Since 2006, the principal objective of monetary policy has been price stability, with an
implicit target of 4% which corresponds to the long-term average. The interest rate on the
money market is considered the key instrument of monetary policy. The control exercised
over prices – administered prices represent around a quarter of the consumer price index –
nevertheless limits the transmission of monetary policy. Taking into account the increase
in inflationary pressures since 2016, the central bank increased its policy rate in April and
in May 2017, bringing it to 5%, and again in March 2018 to 5.75%. The authorities are ready
to raise the policy rate yet further if inflationary pressures persist.
In order to anchor inflationary expectations, an explicit inflation target should be
adopted by the central bank, mirroring the many OECD countries and emerging economies
which have successfully deployed an inflation targeting system: they include South Africa,
Canada, Chile, Colombia, India, the Philippines, the United Kingdom, and Sweden.
Nevertheless, this targeting can only be introduced when certain preconditions have been
achieved, such as a solid banking system, developed financial markets, macroeconomic
stability and the opening of the capital account.
Since 2011, the central bank has made efforts to stimulate the interbank foreign
exchange market and reduce its intervention as much as possible. To this end, a series of
reforms were put in place, such as the removal of the obligation of the collateralisation of
actual operations for foreign currency/dinar operations between approved intermediaries, the
authorisation for banks to sell foreign banknotes in exchange for currency, and the
liberalisation of interest rate hedging between approved intermediaries in order to encourage
the approved intermediaries to embrace their role as market makers. Accordingly, the pegging
to a basket of currencies was removed in April 2012 and replaced by a fixing arrangement
representing the average of market participants’ quotes.
While current account operations are completely free, certain restrictions remain on
the capital account. The planned simplification of procedures for transferring the assets of
non-residents, boosting the thresholds for investments abroad by residents, and
harmonising the operation of regulated accounts of resident individuals will allow further
Table 2. Events which could affect economic performance
Shock Possible impact
Worsening of political instability Greater political instability would slow the pace of structural reforms, underlineinvestors’ confidence and increase pressure on the budget balance and the balance ofpayments.
Sudden deterioration of security in the region An increase in insecurity or a deterioration of the situation in Libya would affect theeconomy, and in particular the tourism sector, which is highly labour intensive.
Increase in protectionism in partner countriesand decline in world trade
The export sector would be affected, and job creation along with it. The resultingincrease in unemployment would reinforce inequalities and social tensions.

ASSESSMENT AND RECOMMENDATIONS
OECD ECONOMIC SURVEYS: TUNISIA © OECD 2018 27
opening of the capital account (Central Bank, 2017b). Tunisia is aware that, before the
capital account is fully opened, it must reinforce its macroeconomic stability, develop its
financial institutions, and step up prudential surveillance (IMF, 2015).
Improving banks’ health
The banks perform an essential function: they conduct more than 90% of financial
intermediation, while the insurance companies and microcredit institutions still play only
a marginal role. The number of universal banks, at 24, is relatively high, given the country’s
size. They are often of small scale and their profitability is weak (Figure 10). Moreover,
businesses struggle to obtain access to bank financing. The lending rate has increased
since 2010, but it remains low in comparison to OECD countries (Figure 11).
Figure 10. Bank profits in international comparison, 2015 or latest year available
Source: World Bank Global Financial Development database.1 2 http://dx.doi.org/10.1787/888933693035
Figure 11. The rate of lending is higher but remains weak
Source: World Bank, World Development Indicators (WDI).1 2 http://dx.doi.org/10.1787/888933693054
-20
-15
-10
-5
0
5
10
15
20
25
-2
-1.5
-1
-0.5
0
0.5
1
1.5
2
2.5
Portu
gal
Italy
Spai
n
EU
Kore
a
OEC
D
Fran
ce
Slov
ak R
ep.
Tuni
sia
Pola
nd
Indi
a
Mor
occo
Chi
na
Alge
ria
Turk
ey
Mex
ico
Braz
il
Sout
h Af
rica
Chi
le
Indo
nesi
a
% profits after taxes% profits after taxes
Return on assets (LHS) Return on equity (RHS)
0
50
100
150
200
250
300
Indonesia Mexico Poland Tunisia Morocco Chile EU France Portugal Korea Italy Spain OECD
% of GDP Domestic credit provided by the financial system to the private sector
2010 2016

ASSESSMENT AND RECOMMENDATIONS
OECD ECONOMIC SURVEYS: TUNISIA © OECD 201828
Between 2010 and 2016, the proportion of non-performing loans (NPLs) in total loans
rose from 12% to 15.4%, which is high in comparison to OECD countries (Figure 12), and it
actually reached 20% in the public banks. These NPLs are to be found for the most part in the
agriculture and tourism sectors. The weaknesses of bankruptcy procedures, which allow
inefficient companies to avoid paying their debts but to continue doing business, instead of
obliging them to restructure or to leave the market, have aggravated the problem of NPLs.
Since 2012, the central bank has several measures to strengthen the banking sector. The
regulations governing provisioning have been tightened. The statutory solvency ratio has
been increased. In addition, a plan to restructure the public banks has been launched with
the recapitalisation of three large public banks and the disposal of minority shareholdings in
some mixed banks. A banking law was adopted in 2016: among other things, it introduces a
bank resolution mechanism, a “lender of last resort” device, and a deposit guarantee fund.
Moreover, the new law on the central bank has reinforced its powers of banking supervision.
These measures have helped to reduce the sources of vulnerability in the sector.
The existence of a significant portion of non-performing loans tends to constrain
resources and impede their efficient allocation. Experience in many countries suggests that
there is no one solution for all countries. Resolution tools can include individual
restructurings of banks, resolution units within the banks (Poland in 1990), an asset
management company (AMC) (Sweden in 1993) specific to one bank or an AMC for the
country as a whole, managed by the authorities (Asian countries in the 1990s, Spain in 2012,
Ireland) (Baudino and Yun, 2017).
The Tunisian authorities have abandoned their plan to create an AMC. For the time
being, they must implement legislative changes to facilitate the winding down of NPLs in the
public banks. Currently, in fact, the managers of public banks can be taken to court if they
negotiate the restructuring or abandonment of NPLs, and this poses an obstacle to their
resolution. The banks thus retain in their portfolio assets of companies that have a low
probability of survival, and this slows the reallocation of resources towards more productive
enterprises. The bankruptcy law, which was adopted in 2016 but has still not yet been fully
Figure 12. Non-performing loans are significant
Source: IMF financial soundness indicators database, and Central Bank of Tunisia.1 2 http://dx.doi.org/10.1787/888933693073
0
2
4
6
8
10
12
14
16
18
20
Kore
a
Chi
na
Chi
le
Mex
ico
Sout
h Af
rica
Indo
nesi
a
Turk
ey
Braz
il
Fran
ce
Slov
ak R
ep.
Pola
nd
OEC
D
Spai
n
EU
Indi
a
Tuni
sia
Portu
gal
Italy
% of total gross loansShare of non-performing loans in total loans 2017
Q2 or latest available data

ASSESSMENT AND RECOMMENDATIONS
OECD ECONOMIC SURVEYS: TUNISIA © OECD 2018 29
applied, should help to facilitate the winding down of NPLs. An effective resolution process
for NPLs should be accompanied by an efficient judicial system, particularly as it relates to
bankruptcies.
In order to stabilise the banking sector and support credit supply more effectively, a
consolidation of the banking system would seem necessary. Consolidation would enable
significant economies of scale by relying on the progress of information technologies and
on a more prudent diversification (Hughes and Mester, 2013). A disengagement by the
State, which still has a presence in almost a dozen banks with shareholding interests
running from 10% to 87%, could favour this tendency. The authorities should also
reconsider the ceilings on interest rates, which limit competition and make it difficult to
set risk premiums. A draft amendment to the law on excessive interest rates has been
submitted to the Assembly of Representatives and is expected to be examined at the start
of 2018. Lastly, the structures for financing investment in the country’s hinterland need to
be improved. Nevertheless, the interest shown in the Bank of the Regions project, which
seeks to improve access to financing for micro-enterprises and SMEs in these regions,
should be reassessed in light of the banking sector’s fragmentation and the institutions
already existing in this niche.
Consolidating public finances while preserving growth and reinforcing social justice
Fiscal outcomes have deteriorated
Public deficits and debt are higher than in most emerging countries (Figure 13). The
deterioration in public finances reflects both cyclical and specific effects. After 2010,
government revenues suffered from the slowing of economic activity, the shutdown of
certain mining operations and the strong advance of parallel trade. Public spending has risen
in order to address the challenges of insecurity and to respond to social demands.
Recruitment into the public service was massive between 2011 and 2013 (Figure 13.E). In fact,
Parliament adopted an “exceptional” law in 2012 promoting access to public administration
positions for persons wounded during the revolution, as well as those covered by the general
amnesty of 2011. There has been a sharp increase in salaries in the public administration
(Figure 13.F). In total, the remuneration of public servants has grown by more than four
percentage points of GDP since 2010, reaching 14.6% of GDP in 2016 (Table 3), a level that is
historically unequalled and is much higher than in most other countries (Figure 13.D). The
influx of Libyan refugees also weighed on spending on subsidies on basic products.
Pressures on future spending: pensions, implicit liabilities and decentralisation
The pay-as-you-go retirement pension system will generate additional pressure on the
public finances, in the absence of reform. The Social Contract adopted by the government
and the social partners in 2013 reaffirms Tunisian society’s preference for the pay-as-you-go
retirement pension system. Social security fund spending on pensions has risen sharply, to
almost 6% of GDP in 2016, reflecting in part the ageing of the population. While life
expectancy has risen rapidly, moving from 70 to 75.5 years between 1990 and 2016, the legal
age of retirement has remained fixed at 60 years. As a consequence, the number of workers
making pension contributions – a key indicator of the system’s viability – has dropped
sharply, particularly in the public sector (Figure 14.A). The proposal to increase the legal
retirement age to 62 by 2019 will help to relieve pressure, without necessarily guaranteeing
the viability of the system.

ASSESSMENT AND RECOMMENDATIONS
OECD ECONOMIC SURVEYS: TUNISIA © OECD 201830
Quite apart from the retirement age, the calculation of pension rights is generous. The
replacement rate is high (Figure 14.B), particularly in the public regime where pension rights
are moreover calculated on the basis of the last salary. Pensions are indexed to salaries,
whereas they are partially indexed to prices in most OECD countries. The Tunisian Social
Security Fund (CNSS) also suffers from under-declaration and under-collection. Despite an
increase in contribution rates, the deficit in the social security funds stood at around 1% of
GDP in 2017.
The implicit liabilities associated with State-owned banks and enterprises could lead to
a further jump in public spending. The implicit liabilities associated with public enterprises,
notably in the form of debts guaranteed by the State, and the recapitalisation needs of the
public banks, stood at 12% of GDP in 2016 (IMF, 2017). To control costs, the government has
established performance contracts with the five main public enterprises. Experience to date
has been unconvincing, however, as by limiting price adjustments and imposing obligations
to create jobs or raise salaries, the government has made it difficult for the public enterprises
to return to financial viability. In April 2017, the government adopted a strategy to restructure
public enterprises with a view to re-establishing their financial viability. In the future, the
adjustment of prices to cost-recovery levels, combined with control over the payroll and
improving the management performance of these enterprises, would seem to be
unavoidable components of the return to financial viability for public enterprises.
The new Constitution includes a process of decentralisation which may place
additional pressure on public finances. While decentralisation should help to bring policy
decisions closer to citizens and thereby respond more effectively to people’s needs, it is
likely to generate additional spending. Experience from Spain and France in fact suggests
that the decentralisation process is often accompanied, at least initially, by a hike in public
Table 3. Fiscal outcomes:1 principal data(% of GDP2)
2005 2010 2015 2016 LF20174
A. Total revenues 21.6 23.4 23.4 22.8 24.0
Tax revenues 18.9 20.1 21.9 20.7 22.2
Non-tax revenues3 2.7 3.3 1.5 2.1 1.8
B. Total spending 24.5 24.5 28.2 28.9 29.5
Current spending 15.7 15.9 20.4 20.4 20.8
Of which wages and salaries 11.0 10.8 13.7 14.6 14.1
Subsidies/Compensation 1.9 2.4 3.4 2.4 2.8
Food 1.0 0.9 1.8 1.7 1.6
Transport 0.3 0.3 0.5 0.5 0.5
Oil and gas 0.6 1.2 1.1 0.2 0.7
Capital spending 6.0 6.8 5.7 6.0 6.3
Loans 0.3 -0.1 0.3 0.3 0.1
Interest payments 2.5 1.8 1.9 2.2 2.3
C. Deficit = A-B -2.9 -1.0 -4.8 -6.1 -5.5
Memorandum item:
Grants 0.2 0.1 0.3 0.1 0.3
Privatisations 0.4 0.0 0.0 0.4 0.0
Proceeds from confiscations 0.1 0.1 0.2
1. Central government. Social security income and expenditure do not feature.2. GDP 2016 and 2017 figures from the Ministry of Finance.3. Excluding grants, privatisations and confiscated revenues.4. Budget Law for 2017.Source: Ministry of Finance.

ASSESSMENT AND RECOMMENDATIONS
OECD ECONOMIC SURVEYS: TUNISIA © OECD 2018 31
Figure 13. Tunisia needs to return its public finances to a more sustainable path
Source: Ministry of Finance; INS; OECD Economic Outlook 102 Database; IMF World Economic Outlook Database; BCT; and ITCEQ.1 2 http://dx.doi.org/10.1787/888933693092
-8
-7
-6
-5
-4
-3
-2
-1
0
2000
2001
2002
2003
2004
2005
2006
2007
2008
2009
2010
2011
2012
2013
2014
2015
2016
% of GDP
E. Change in public deficits
-14-12-10-8-6-4-2024
Alge
riaBr
azil
Indi
aTu
nisi
aSp
ain
Mor
occo
Chi
naR
ussi
aSo
uth
Afric
aFr
ance
Italy
Indo
nesi
aPo
land
Slov
ak R
epub
licPo
rtuga
lEU
Mex
ico
OEC
DKo
rea
% of GDP
A. Government balance 2016 or latest year available
0
2
4
6
8
10
12
14
16
Indi
aIn
done
sia
Chi
leTu
rkey
Slov
ak R
epub
licBr
azil
Mex
ico
Kore
aIta
lyO
ECD EU
Spai
nPo
rtuga
lSo
uth
Afric
aM
oroc
coAl
geria
Fran
ceTu
nisi
a
% of GDP
B. Public service payroll2016 or latest year available
8.57.7 6.7
19.9
17.6
29.1 5.1
-2.4
0.1
0102030405060708090
100
2008 2009 2010 2011 2012 2013 2014 2015 2016
Thousands of persons
D. Net job creation in government
90
110
130
150
170
190
210
230
2007 2008 2009 2010 2011 2012 2013 2014 2015 2016 2017
Index, 2007=100
F. Change in public and private wages/salaries and prices
Wages/Salaries in non-farm productive sectorWages/Salaries in governmentConsumer prices
020406080
100120140160180
Rus
sia
Alge
riaIn
done
sia
Turk
eyKo
rea
Chi
naSo
uth
Afric
aSl
ovak
Rep
ublic
Tuni
sia
Mor
occo
Indi
aPo
land
Braz
ilEU
OEC
DSp
ain
Fran
cePo
rtuga
lIta
ly
% of GDP
C. Government debt2016 or latest year available

ASSESSMENT AND RECOMMENDATIONS
OECD ECONOMIC SURVEYS: TUNISIA © OECD 201832
spending (Joumard and Giorno, 2005; Jamet, 2007). The reallocation of employees from the
central government to the local authorities is often incomplete, and duplications are
numerous. In Indonesia, decentralisation came up against the lack of expertise at the local
level. The level of quality of local public services is highly uneven, and bribery is a serious
issue (Vujanovic, 2017). To minimise these pitfalls, decentralisation will have to be gradual
in order to facilitate the reallocation of resources, and to increase the capacity for managing
and mobilising decentralised collective resources.
Restoring public finances to a sustainable path
In the absence of reforms, the persistence of high fiscal deficits and weak economic
growth will lead to a further increase in the public debt. The ratio of public debt to GDP rose
from 41% in 2010 to 62% in 2016. Nearly 2/3 of this debt is financed by foreign currency
loans, most of which are concessional, which reduces debt service but increases external
vulnerability. The ratings agencies have downgraded Tunisian sovereign debt, which has
Figure 14. The pension regime is generous but unsustainable
1. The data for 2015 are projections by the Tunisian government.Source: Government of Tunisia; OECD Pensions Outlook 2015; and OECD Database on pensions.
1 2 http://dx.doi.org/10.1787/888933693111
0
0.5
1
1.5
2
2.5
3
3.5
4
4.5
1990
1991
1992
1993
1994
1995
1996
1997
1998
1999
2000
2001
2002
2003
2004
2005
2006
2007
2008
2009
2010
2011
2012
2013
2014
2015
¹
Number of workers paying pension contributions
A. The number of workers contributing to the financing of the pension regime is falling steadily
Public Private
0102030405060708090
100
Sout
h Af
rica
Uni
ted
King
dom
Mex
ico
Pola
ndAu
stra
liaC
hile
Irela
ndJa
pan
Slov
enia
Ger
man
yU
nite
d St
ates
Kore
aN
ew Z
eala
ndC
anad
aSw
itzer
land
Nor
way
Cze
ch R
ep.
Belg
ium
Latv
iaEs
toni
aO
ECD
Gre
ece
Swed
enFi
nlan
dEU
Hun
gary
Fran
ceIn
done
sia
Slov
ak R
ep.
Isra
elIc
elan
dBr
azil
Turk
eySp
ain
Portu
gal
Chi
naLu
xem
bour
gAu
stria
Tuni
sia
(priv
ate)
Italy
Den
mar
kIn
dia
Tuni
sia
(pub
lic)
Net
herla
nds
%
B. The gross replacement rate is high, 2014

ASSESSMENT AND RECOMMENDATIONS
OECD ECONOMIC SURVEYS: TUNISIA © OECD 2018 33
not been “investment grade” at Fitch and Standard & Poor’s since 2012, and since 2013 at
Moody’s. Moody’s further downgraded the rating of Tunisian sovereign debt in August 2017.
The government has undertaken to put in place reforms in order to, between now and
2020, i) reduce the deficit from 6.1% of GDP in 2016 to 3%; ii) maintain public debt at below
70% of GDP and, iii) reduce the payroll to 12.5% of GDP.
Several options can be envisaged for restoring the sustainability of the debt, based on
the effort at fiscal stabilisation and also on structural reforms capable of strengthening
growth. OECD simulations suggest that simultaneous pursuit of a gradual fiscal adjustment
and a reform of the regulations of the goods and services markets could neutralise the
temporary adverse impacts of fiscal adjustment on economic activity, and set the public
debt/GDP ratio on a downward track (see Box 3 below).
In light of the heavy fiscal burden, Tunisia must promote tax efficiency and fairness
The compulsory contribution rate has increased since 2010, despite the unfavourable
economic setting. At more than 30% of GDP, the sum of taxes and social contributions is
higher than in all countries in Africa and most emerging countries (Figure 15). This partially
reflects broader coverage by public services and the better quality thereof, in particular for
healthcare. A further increase of taxes and social contributions has been established for
2018. Efforts to combat tax fraud and evasion are commendable. They are reducing tax
inequalities. At the national level, the government has made efforts to gradually abolish the
flat regime for artisans and professionals, to create a tax police as of the autumn of 2017, and
has prepared a strategy for combating tax evasion and fraud of social security contributions.
Efforts to expand the tax base, in particular for VAT by eliminating various exceptions, are
also moves in the right direction. At the international level, in 2012 Tunisia signed the
Convention on Mutual Administrative Assistance in Tax Matters and the Memorandum of
Understanding with the OECD. It has also been a member of the Global Forum on
Transparency and Exchange of Information for Tax Purposes since 2012 (OECD, 2016a). At the
start of 2018, Tunisia signed the Multilateral Convention to Implement Tax Treaty Related
Measures to Prevent Base Erosion and Profit Shifting (BEPS).
Figure 15. Tax revenues are relatively high in comparison to other emerging countries
Source: OECD Revenues Database.1 2 http://dx.doi.org/10.1787/888933693130
0
5
10
15
20
25
30
35
40
45
50
Mex
ico
Afric
a
Chi
le
Latin
Amer
ica
Kore
a
Mor
occo
Turk
ey
Tuni
sia
Pola
nd
Slov
akR
ep.
Spai
n
OEC
D
Portu
gal
Italy
Fran
ce% of GDP Tax revenues, 2015
Other taxes Goods and services taxes Social contributions and deductions from pay Income and property taxes
ASSESSMENT AND RECOMMENDATIONS
OECD ECONOMIC SURVEYS: TUNISIA © OECD 201834
Taxation weighs disproportionately on salaried employment, and discourages the
creation of quality jobs. Salary-based social contributions are high, and employees pay the
bulk of income tax. The hike in the VAT rate planned for 2018 will minimise the growth
impact of higher taxes: OECD studies (Johansson et al., 2008; OECD, 2017c) show in fact that
consumption taxes have a less negative impact on growth and on job creation than direct
taxes on income and profits. Nevertheless, the budget law for 2018 introduces a “social
solidarity” contribution of 1%, to be paid by individuals and businesses filing tax returns, in
order to finance the social security fund deficit. The creation of a high council for the
financing of social protection is also planned, mainly tasked with ensuring the
diversification of financing sources for the social security funds, and with proposing apposite
measures for guaranteeing the financial equilibrium of the social security regimes While the
increase in social contributions may be the only short-term solution for reducing the deficit
in the social funds, it will be important going forward to avoid introducing new taxes on
labour and on businesses, or raising their rates further, for they will depress growth and
quality job creation (Chapter 2). New taxes also increase collection costs.
The tax base will have to be broadened to increase public revenues. Increased
transparency is needed with regard to the cost and beneficiaries of tax incentives and the
publication of the report on tax expenditure which is expected in 2018 will be a first step in
this direction. There are certain fiscal incentives (in particular for home ownership) that
should be reconsidered, as they divert savings from more productive investment and tend
to benefit the wealthiest households (Chapter 1). The savings thus achieved could be
redirected in part to improving the supply of housing for the poorest members of society.
As well, some of the tax incentives for investment should be assessed and adjusted, or
even eliminated if they are found to be inefficient.
The fight against tax fraud and evasion should be stepped up nationwide in order to
increases tax fairness. According to a recent study, more than half of registered taxpayers
do not file tax returns, and among those who do, under-reporting is blatant (Haddar and
Bouzaiene, 2017). Closer cooperation between the taxation and the control directorates
should improve the cross-checking of information and boost the recovery rate, which is
currently low. Creation of the Large Businesses Directorate is a move in this direction.
Systematic and random controls would be useful. As well, a tax information, control and
enforcement campaign should be launched among licensed professionals.
Improving the sustainability, equity and quality of public spending
The government’s objective is to lower the fiscal deficit in order to stabilise the public
debt at below 70% of GDP by the year 2020, while boosting investment spending and social
outlays. The budget law for 2018 reaffirms these priorities (Box 1). Public servants’ salaries,
interest payments and subsidies absorbed two-thirds of government spending in 2016,
leaving little room for investment in social and physical infrastructure, its maintenance
and efficient operation, and for programs in favour of the poorest population. What is
needed, then, is to improve the quality of public spending in order to make it more
equitable and supportive of inclusive growth.
To bring the payroll under control, the government has limited net job creation in the
public service since 2014, and it has been encouraging early retirement (Figure 12.D). In
2017, the government announced its intention to cut wage and salary costs from 14.5% of
GDP in 2017 to 12.5% in 2020, by replacing only one retiring employee in four and deploying

ASSESSMENT AND RECOMMENDATIONS
OECD ECONOMIC SURVEYS: TUNISIA © OECD 2018 35
a voluntary departure programme under which each person reaching the age of 60 between
2018 and 2021 will be entitled to an enhanced retirement pension. The effect on total
spending may be fairly minimal in the short term, especially since the voluntary
retirement programme has attracted fewer volunteers than expected (just 6 400 requests).
On the other hand, the partial replacement of persons leaving for retirement could well be
effective over the medium term, but care will have to be taken to maintain an adequate
level of supervisory and managerial staff.
Box 1. Budget law for 2018
The main measures in the Budget law for 2018 are as follows:
Income tax and tax on corporations
● Exemption from Corporation tax and Income tax for recently established enterprises, andfor enterprises with a certificate proving that an investment declaration was submittedin 2018 and 2019, for four years as of the effective start of activity.
● Reduction in rate of corporation tax from 25% to 20% for SMEs.
● Increase in the rate of tax on dividends from 5% to 10%.
● Introduction of a “social solidarity” contribution to be paid by individuals and businesses.
● Income tax reduction for families.
● Tightening of the flat-rate tax regime.
● Simplification of the conditions for granting tax relief on capital reinvestment.
Indirect taxes
● Increase of 1 percentage point in the different rates of VAT, and extension of the VATbase to sales of properties built exclusively for residential purposes, with the exceptionof social housing.
● Increase from 20% to 30% in the customs duties for some products, and introduction ofcustoms duties for others.
● Revision of excise duties on some goods.
● Introduction of a holiday tax in hotels.
Others
● Payment by the State of employer contributions for the recruitment on open-endedcontracts of young graduates from higher education in regional development zones.
● Creation of a special fund for farmers to cover natural disasters.
● Strengthening of measures to combat smuggling and tax fraud, notably with the creationof a general directorate of taxes, public accounting and recovery.
In January 2018, the Assembly of Representatives of the People adopted the draft law onthe voluntary retirement of public sector employees. Under the law, officials wishing toleave the civil service are entitled to 36 months of salary as an early retirement premium,provided that they have paid into social security funds for five years. To counter socialconcerns, the government has also taken a certain number of measures in favour offamilies in need: A 20% increase in the subsidy for each family in need and approval of aminimum retirement pension of 180 dinars per month; doubling of the subsidy fordeprived disabled children; extension of free healthcare to unemployed people; creation ofa home loan guarantee fund for citizens with irregular income.

ASSESSMENT AND RECOMMENDATIONS
OECD ECONOMIC SURVEYS: TUNISIA © OECD 201836
The reform of subsidies, which represented 3.4% of GDP in 2015, is essential for making
public spending fairer and more efficient. Prices of certain goods, in particular foodstuffs and
energy products, have been kept artificially low in order to preserve household purchasing
power. Producers and distributors of the products concerned receive financial compensation
from the State. Although the subsidies may help to attenuate poverty, they are of greatest
benefit to the wealthiest households (ITCEQ, 2017; Araar and Verme, 2016). Moreover, they
create market distortions and tend to fuel the parallel economy and incite bribery, which
often hit poorer households hardest. By way of example, illegal exports of subsidised projects
(such as pasta, couscous, sugar and milk), intercepted on their way to Libya by customs and
border police, amounted to 1.1 billion dinars in 2015 (World Bank, 2017).
Measures have been taken to reduce subsidy costs. The subsidy on sugar and vegetable
oil is no longer granted to the respective industries, as of 2017, and power subsidies to
energy-consuming industries such as cement factories have not been paid since 2013.
Electricity prices were raised in 2017, and now contain a surcharge applicable beyond a basic
consumption threshold. This system of “social pricing” involves cross-subsidies from the
wealthiest (large consumers) to the poorest. The automatic adjustment rules for
hydrocarbon prices, adopted in 2016 to shield the budget from rising oil prices, have been
partially applied. A similar rule was applied more systematically in Morocco, however, while
India and Indonesia were removing petrol subsidies. As a result, the recovery of oil prices and
the depreciation of the dinar weighed on the cost of subsidies in Tunisia in 2017.
The question of targeting poses a dilemma for any reform that seeks to make subsidies
more equitable. The “social pricing” introduced for electricity and water could be replicated
in the case of gas. Setting rates in this way protects the most vulnerable households, while
others pay a higher price beyond the basic consumption threshold. This would also help to
reduce over-consumption and thereby protect natural resources.
Social pricing is however hard to apply for some goods, especially food products. The
government has begun work on revising the subsidies for basic food products and the
rationalisation of expenditure with a view to maintaining the subsidies for basic food
products while controlling the distribution channels and diversifying the products on
sales. The database of poor and low-income households, launched by the Ministry of Social
Affairs in 2012 to better target the different social assistance programmes, could be used as
a mechanism for channelling subsidies to the poorest families. The implementation of the
database has however proved to be more complicated than expected.
International experience suggests that errors of inclusion and exclusion are often
considerable (Coady et al., 2004). In Colombia, the targeting of social measures, especially
in health, has been affected by manifest errors (Joumard and Londoño Vélez, 2013): almost
20% of the poorest households were not registered, and were therefore excluded, while a
quarter of beneficiaries were not poor. Similarly, research in Indonesia has revealed that
just one third of subsidies for basic food products are in fact benefiting the poorest
households that were being targeted by the programme, and over half of poor households
are not benefiting from the subsidies to which they are entitled (OECD, 2015a and 2016b).
Replacing the current system with a cash transfer would improve both equity and
efficiency. In Tunisia’s case, a study (INS and CRES, 2013) found that a flat-rate cash
transfer, equal in amount for all, would be more effective than subsidies in reducing
income inequalities. The experience of India, which has taken this approach and combined
it with a financial inclusion objective (Box 2), offers a model that Tunisia could usefully

ASSESSMENT AND RECOMMENDATIONS
OECD ECONOMIC SURVEYS: TUNISIA © OECD 2018 37
consider by introducing the principle of targeting at the earliest opportunity. The political
risks involved in reforming the subsidy system are significant. It is essential to deploy a
communication strategy that emphasises the advantages of the reform in terms of social
fairness and macroeconomic stability. In the meantime, regular adjustment of product
prices is needed to prevent further pressure on the budget.
Public spending sustainability and quality improvement can only be achieved in the
medium term. A budgetary rule setting a ceiling on spending should be introduced, with
medium-term targets covering current spending, on one hand, and investment in social
and physical infrastructure, on the other hand, to protect the latter. Tunisia already has
medium-term expenditure frameworks (CDMT) for public spending programmes, as well
as a medium-term fiscal framework that sets limits on total spending over three years.
These ceilings need to be imposed systematically when it comes to budget preparation
(OECD, 2017a). To improve the effectiveness of public investment, the government must
avoid dispersing its resources between too many different ministries, and should set out
consistent selection criteria that comply with the 2016-20 National Development Plan. It
will also be important to avoid overspending in budget execution, as has been occurring for
several years.
The introduction of a spending target should be based on the setting of priorities. To
this end, several countries have put in place systematic spending reviews that make it
possible to give priority to programmes with the highest economic and social impact. The
role and resources of the Auditor General (Cour des Comptes) and the General Authority for
Monitoring Public Programmes could be extended here. The adoption and application of
the new organic budget law, which institutes budget management by objective, should also
help to improve the efficiency of public spending (OECD, 2017b).
Box 2. India’s experience in reforming subsidies
General principle: The Indian reform of subsidies is based on a unique biometricidentification number (Aadhar) and the opening of bank accounts for all households thatdo not have one. “Market” prices are applied, the subsidy to businesses is eliminated, andhouseholds receive the equivalent of the average subsidy, which is paid into their accountswith a bank transfer. The reform is being introduced gradually across the national territory,after tests at the state level.
The LPG example: The replacement of the subsidy on bottled gas by a direct bank transfer,of the same size for all, has been extended gradually across India since 2014. This reform hasbeen accompanied by a sharp reduction in subsidy costs because of the drastic drop in fraud.The reform has also encouraged financial inclusion and removed the bias against poorhouseholds which, in the past, purchased less gas than did the wealthy ones, andconsequently received less in the way of subsidies (Tripathi et al., 2015). To improve targeting,in March 2015 India launched a campaign (“Give it up”) to encourage the wealthiesthouseholds to forgo their gas subsidy in the name of social equity. In 2017, a million Indianhouseholds had renounced the subsidy.
Other subsidies: Tests are now under way in some states to replace food and fertilisersubsidies by direct transfers to households, with preliminary results that appear fairlyfavourable (Gangopadhyay et al., 2015).

ASSESSMENT AND RECOMMENDATIONS
OECD ECONOMIC SURVEYS: TUNISIA © OECD 201838
Returning Tunisia to a path of inclusive and robust growthTo revive the convergence process, Tunisia needs to promote private investment and
make better use of its comparative advantages, in particular its relatively well-qualified
workforce. More investment will generate the creation of formal employment which in
turn will improve the standard of living of many Tunisians. The potential for growth, which
was rapid until the beginning of this century, has declined under the impact of falling
investment and productivity (Figure 16). The low rate of female participation offers
significant potential for growth, but unemployment and underemployment remain serious
issues. The revival of investment and the creation of quality jobs are priorities. In light of
the fiscal constraints, this will require a redeployment of the private sector.
Promoting business investment by improving the regulatory and institutionalframework
The investment rate has been dropping since the early years of this century. This
decline reflects essentially a stalling of business investment, whereas investment by
households and governments has stood up fairly well (Chapter 1). The decline accelerated
after 2010, reflecting uncertainties surrounding the development of new institutions, and
insecurity linked to terrorist acts. Nevertheless, business investment suffers from several
structural factors, in particular the proliferation of regulations and authorisations and the
inefficiency of logistical services. On both of these fronts, Tunisia’s position in world
rankings has deteriorated noticeably.
The OECD indicator of product market regulation (PMR), produced in collaboration with
the World Bank, shows that licenses and pre-authorisations, as well as the cumbersome
administrative procedures that accompany them, are particularly restrictive (Figure 17.A).
Restrictions on business entry, investment and activity create situations of rent for local
businesses and discourage companies from improving the quality of the services they
supply. They also promote corruption, which ranks among the top three factors that are
most detrimental to the country’s business climate (WEF, 2017a). Corruption increases
businesses’ costs, undermines the confidence of the public and investors, and affects the
Figure 16. Contributions to economic growth
Source: OECD Economic Outlook 102 Database.1 2 http://dx.doi.org/10.1787/888933693149
-1
0
1
2
3
4
5
6
7
1998 1999 2000 2001 2002 2003 2004 2005 2006 2007 2008 2009 2010 2011 2012 2013 2014 2015 2016 2017 2018 2019
Annual change in %
Breakdown of potential growth
Population of working age Participation rate Employment rateTotal factor productivity Capital per worker Potential growth

ASSESSMENT AND RECOMMENDATIONS
OECD ECONOMIC SURVEYS: TUNISIA © OECD 2018 39
Figure 17. Product market regulations are particularly restrictive
1. Data show the simple averages for the following countries: Brazil, India, Indonesia, China and South Africa.Note: Data refer to 2016 for Tunisia and 2013 for other countries.Source: OECD-World Bank Product Market Regulation Database.
1 2 http://dx.doi.org/10.1787/888933693168
0
0.5
1
1.5
2
2.5
3
3.5
4
4.5
Slov
ak R
ep.
New
Zea
land
Net
herla
nds
Italy
Den
mar
kAu
stria
Can
ada
Portu
gal
Uni
ted
King
dom
Finl
and
Uni
ted
Stat
esSw
itzer
land
Esto
nia
Pola
ndG
erm
any
Japa
nFr
ance EU
Aust
ralia
Nor
way
Hun
gary
Bulg
aria
OEC
DSw
eden
Luxe
mbo
urg
Belg
ium
Slov
enia
Cze
ch R
epub
licKo
rea
Col
ombi
aG
reec
eIre
land
Cro
atia
Chi
leLa
tvia
Peru
Rom
ania
Icel
and
Spai
nSo
uth
Afric
aM
exic
oIs
rael
Indo
nesi
aKe
nya
Turk
eyBr
azil
BIIC
S¹Ar
gent
ina
Chi
naEg
ypt
Indi
aBo
livia
Tuni
sia
A. Regulatory obstacles to entrepreneurship are particularly high
More constraints
Fewer constraints
0
0.5
1
1.5
2
2.5
3
3.5
4
Nor
way
Aust
ralia
Ger
man
ySw
eden
Uni
ted
King
dom
Den
mar
kC
zech
Rep
ublic
Aust
riaN
ew Z
eala
ndIre
land
Finl
and
Esto
nia
Icel
and
Net
herla
nds
Péro
uM
exic
oFr
ance
Japa
nSw
itzer
land
Can
ada
EUO
ECD
Slov
ak R
ep.
Italy
Hun
gary
Pola
ndSp
ain
Portu
gal
Chi
leLa
tvia
Belg
ium
Cro
atia
Rom
ania
Bulg
aria
Luxe
mbo
urg
Slov
enia
Kore
aBr
azil
Col
ombi
aU
nite
d St
ates
Egyp
tBo
livia
Indo
nesi
aG
reec
eKe
nya
Sout
h Af
rica
BIIC
S¹Is
rael
Chi
naTu
nisi
aTu
rkey
Arge
ntin
aIn
dia
C. State control over business activity: involvement in business management
More constraints
Fewer constraints
0
1
2
3
4
5
6
Net
herla
nds
Spai
nEs
toni
aLa
tvia
Péro
uU
nite
d Ki
ngdo
mJa
pan
Can
ada
Chi
leAu
stria
Col
ombi
aBe
lgiu
mH
unga
ryPo
rtuga
lIc
elan
dM
exic
oSl
ovak
Rep
.Ko
rea
Braz
ilG
erm
any
Italy
OEC
D EULu
xem
bour
gSl
oven
iaD
enm
ark
Keny
aG
reec
eC
zech
Rep
ublic
Aust
ralia
New
Zea
land
Isra
elFi
nlan
dC
roat
iaU
nite
d St
ates
Irela
ndFr
ance
Nor
way
Sout
h Af
rica
Bulg
aria
Swed
enR
oman
iaTu
rkey
Switz
erla
ndBo
livia
Arge
ntin
aBI
ICS¹
Chi
naPo
land
Indi
aTu
nisi
aEg
ypt
Indo
nesi
a
B. State control over business activity: public share ownership
More constraints
Fewer constraints

ASSESSMENT AND RECOMMENDATIONS
OECD ECONOMIC SURVEYS: TUNISIA © OECD 201840
poorest sectors of the population by diverting resources away from more productive
applications, such as essential public services. Lastly, regulatory and administrative
constraints impede the creation of jobs and wealth, they burden people’s well-being, and
they exacerbate inequalities.
The fight against corruption and good governance are key government objectives and
enshrined in the Carthage Pact. Several measures have been taken. The national
anti-corruption authority, which is provisional, and the legal and financial have been
allocated human and financial resources for their operations. In 2017, 94 corruption cases
were referred to the courts. A new law protecting whistle-blowers was adopted. Training and
awareness raising programmes for civil servants were organised. A draft law against
unlawful enrichment was submitted to the Assembly of the Representatives of the People.
There is now an urgent need to put in place the independent constitutional body responsible
for good governance and fighting corruption, and to reform the audit and inspection system
in the public sector (OECD 2014). Together with its anti-corruption initiatives, Tunisia joined
the Open Government Partnership (OGP), a platform designed to encourage citizen’s
participation, transparency, integrity and accountability. These principles need to be further
strengthened (OECD, 2015d).
State-owned enterprises dominate many sectors, and direct State intervention in the
economy is heavier than in OECD countries and in most emerging economies. In addition to
the network sectors, such as electricity, telecommunications and rail transport, enterprises
controlled by the State have long operated in banking, phosphates and fertilisers, mining
and refining, construction materials, ironworks and steel, and paper. The recent
confiscation of private enterprises and assets, linked to fraud and embezzlement under the
former regime, has reinforced the State’s dominant position in certain sectors, especially
telecoms.
The operating deficits of public enterprises have widened, impeding their capacity to
maintain existing equipment and to invest in new projects. Called upon by the government
to take on their subcontractors’ employees and to hire those wounded in the revolution,
many public enterprises have seen their staffing levels rise by over 50% since 2010.
According to the new OECD Guidelines on Corporate Governance of State-Owned Enterprises,
(OECD, 2015b), improving effectiveness and transparency in the sector of public enterprises
would offer substantial advantages, especially in countries in which state ownership is
extensive. Governance issues arise when state-owned enterprises have the dual objective of
practising economic activities and carrying out a political mission. In these cases, the
enterprises can face undue political interference, leading to the dilution of responsibilities, a
lack of transparency and the loss of efficiency in the operation of the enterprise.
Furthermore, the lack of surveillance may increase the probability that employees work for
their own interests. On the other hand, subjecting state-owned and private enterprises to
equitable rules will encourage the development of a strong, competitive economy.
It is also important to strengthen the integrity and independence of regulatory agencies
in the network sector and to facilitate access to new operators. The new OECD Practical
Guidance against Undue Influence and Creating a Culture of Independence for regulators (OECD
2017g) proposes measures for establishing and maintaining the regulators’ capacity to
make objective, impartial, coherent and expert decisions.
In Tunisia, in addition to introducing performance contracts for state-owned
enterprises, the government might also entrust some activities to the private sector, should

ASSESSMENT AND RECOMMENDATIONS
OECD ECONOMIC SURVEYS: TUNISIA © OECD 2018 41
it prove to be more effective, especially in network maintenance (electricity, water, etc.),
the production of electricity, water desalinisation, and the construction and operation of
wastewater treatment plants.
In some sectors, the State also intervenes by fixing prices or restricting the number of
firms that can operate. This State intervention is more frequent in Tunisia than in most
countries covered by the OECD indicator in product market regulation (Figure 17.C). Shielded
from competition, these firms have little incentive to produce services of better quality.
The introduction of structural reforms will revive investment, boost job creation, and
sustain incomes for all Tunisians. The new investment law applied in April 2017 supports
the principle of freedom of investment by reducing the field of activities subject to
authorisation. A decree establishing the list of activities subject to authorisation, the list of
administrative authorisations required for carrying out projects, and the timeframes,
procedures and conditions for the granting thereof was due to be issued at that start of
2018. The list will be reviewed before 2020 as part of the execution of the programme for
simplifying procedures for granting authorisations, abolishing them and replacing them
with specifications. It will also make procedures more predictable. The new competition
law of 2015 expands the role of the Competition Board (Conseil de la concurrence), reduces
investigation times in cases of concentration, and tightens the penalties. In the long run,
this should improve Tunisia’s position in international business climate rankings.
It would be desirable to go further, by simplifying authorisations, licenses and permits
more drastically, and improving information on the rules and procedures to follow in
creating and managing an enterprise. It is important to establish cross-cutting policies
designed to improve the quality of regulations, including systematic and thorough reviews of
existing rules. The aims of these cross-cutting policies are to reduce unnecessary regulatory
burdens on enterprises; to put in place a new evidence-based approach to regulation using
stakeholder involvement; and to improve transparency and access to regulations. The legal
obstacles to the entry of competitors in certain sectors should be reconsidered. At the same
time, there is a need to reduce the competitive distortions induced by government
intervention, including its price controls.
OECD simulations for Tunisia indicate that lowering the barriers to entry and improving
conditions of competition would increase national income by around 1¾% in five years, and
by close to 5% over 20 years, with a positive impact on investment, productivity and
employment (Table 4). Combined with a gradual budgetary adjustment, regulatory reforms
would spur growth and put public debt back on a sustainable trajectory (Box 3).
Box 3. Regulatory reform: impact on growth and debt sustainability
Regulatory reform to spur growth…
Some product market regulations are significantly stricter in Tunisia than elsewhere. Their reform wouldstimulate competition and entrepreneurship and hence also support growth. The room for improvement isespecially great in the following areas:
● Authorisations, licenses and permits:
❖ Provide a “one stop shop” for obtaining information on licenses and permits, and introduce a “silenceis consent” rule.
❖ Establish a programme to reduce the number of licenses and permits required by the government.

ASSESSMENT AND RECOMMENDATIONS
OECD ECONOMIC SURVEYS: TUNISIA © OECD 201842
Box 3. Regulatory reform: impact on growth and debt sustainability (cont.)
● Administrative burden posed by regulation:
❖ Publish proposed changes to rules and procedures in a systematic manner.
❖ Introduce a programme with explicit objectives for reducing the administrative burden on enterprises.
● Opening the capital of public enterprises to the private sector:
❖ Partial opening, without ceding powers of control, in the electricity and gas sectors.
❖ More complete opening, or full retreat from public ownership, in the telecoms and manufacturingsectors where the State is still present, as well as in the commerce sector (where the State owns thewholesale markets).
● Governance of public enterprises:
❖ Limit the access of public enterprises to forms of financing not available to private businesses.
❖ Make the Ministry of Finance, or an independent agency, responsible for managing State shareholdingsin public enterprises.
● Price control:
❖ Re-examine, and if necessary abolish, price controls on gasoline, tobacco, cellular communications andother products, as well as controls on the fees charged in air transport and the regulated professions.
These reforms would lead to a fall of 20% in the OECD’s price regulation indicator for Tunisia. After thereform, the indicator would remain slightly higher than the average for emerging countries, and would besignificantly higher than the average for countries in the OECD.
… and put public debt back on a sustainable trajectory
By supporting growth, these structural reforms would allow the country to restore its public debt to asustainable trajectory. Debt sustainability depends on the rate of economic growth, inflation, the debt’sinterest rates and the budget deficit.
The OECD Secretariat has simulated the impact of improved competition conditions and the budgetaryadjustment on growth and the public debt (Figures 18 and 19). Five scenarios were selected:
1. Benchmark scenario – no budgetary adjustment and no structural reform. Economic growth moves towardsits potential rate (estimated by the OECD to be 2.8% in the absence of major structural reforms), inflation(measured by the GDP deflator) stabilises at around 4.2% (i.e. slightly above the implicit inflation target),and the nominal effective interest rate on public debt moves towards the effective rate of 4.9% seenduring the period from 1990 to 2016. In this scenario, the public debt comes to over 100% of GDP in 2040.
Table 4. Economic gains from reducing obstacles to competitionEstimated impacts on GDP and the main components of supply (compared to a no-reform scenario)1
Horizon GDP Total employment Investment TFP2
Increase in level of each variable as a percentage of the initial level
5 years 1.7 0.4 2.7 1.2
10 years 2.4 0.5 3.8 1.7
20 years 4.8 0.6 9.0 3.4
Average increase in growth rate in percentage points
20 years 0.25 0.03 0.43 0.15
1. The impacts on GDP, employment, investment and TFP are based on the experience of OECD countries. Recent studies evensuggest that the impact of structural reforms on growth is higher in emerging countries (OECD, 2017f). This would suggest thatthe impacts in the table are underestimated for Tunisia.
2. Total factor productivity.Source: OECD Secretariat estimates.

ASSESSMENT AND RECOMMENDATIONS
OECD ECONOMIC SURVEYS: TUNISIA © OECD 2018 43
Box 3. Regulatory reform: impact on growth and debt sustainability (cont.)
2. Scenario with reform of the goods and services market but no budgetary adjustment. Product marketregulations are relaxed. Structural reforms increase the economic growth rate by almost 0.25 percentagepoints to close to 3.1%. In this scenario, Tunisia’s income (GDP) is around 5% higher than in the scenariowith no reform, and as a proportion of GDP, the public debt would amount to 85% in 2040.
3. Scenario with drastic budgetary adjustment (return to zero for the primary balance in five years) and nostructural reform of the goods and services market. The ratio of public debt to GDP falls tangibly, approachingits pre-2011 level, but the economic and social costs of the budgetary adjustment are significant. After fiveyears, the level of income is considerably lower (by 1.3%) than in the scenario with no reform.
Figure 18. Impact of the different reform scenarios on growth
Source: OECD estimates.1 2 http://dx.doi.org/10.1787/888933693187
0.00
-0.69-0.39 -0.39
1.18
-1.32-0.74
0.43
2.37
-0.22 -0.12
2.24
4.80
-0.01 0.00
4.80
Structural reform without fiscaladjustment
Primary fiscal balance in equilibrium Gradual fiscal adjustment Structural reform with gradual fiscaladjustment
GDP differential in % in comparison to the scenario with no fiscal adjustment0 5 years 10 years 20 years
Figure 19. Changes in the ratio of public debt to GDP: past and future scenario
Note: The accounting treatment of certain government deposits was modified to bring it into conformity with internationalpractices, and this raised the gross debt in 2016.Source: OECD estimates.
1 2 http://dx.doi.org/10.1787/888933693206
101.4
85.5
42.4
68.4
56.8
20
30
40
50
60
70
80
90
100
110
2000
2001
2002
2003
2004
2005
2006
2007
2008
2009
2010
2011
2012
2013
2014
2015
2016
2017
2018
2019
2020
2021
2022
2023
2024
2025
2026
2027
2028
2029
2030
2031
2032
2033
2034
2035
2036
2037
2038
2039
2040
% of GDP
Gross government debt
No fiscal adjustment Structural reform without fiscal adjustment
Primary fiscal balance Gradual fiscal adjustment
Structural reform with gradual fiscal adjustment

ASSESSMENT AND RECOMMENDATIONS
OECD ECONOMIC SURVEYS: TUNISIA © OECD 201844
Trade openness has promoted growth and employment in offshore companies
Recent OECD studies suggest that trade can improve the population’s well-being (OECD,
2017d). On one hand, it enhances the purchasing power of consumers by giving them access
to a broader range of goods and services, often at lower cost. The poorest households are
often those that benefit the most, as they devote a larger portion of their income to products
of mass consumption (Fajgelbaum and Kandhelwal, 2016). On the other hand, trade
generates productivity gains by giving firms access to a broader range of inputs,
encouraging the dissemination of foreign knowledge, and helping to expand markets. In the
OECD zone, an increase of one percentage point in trade openness translates into 0.2%
growth in multifactor productivity after five years and 0.6% over the longer term (Egert and
Gal, 2017).
In Tunisia, the strategy of integrating the country into global value chains has relied
on the progressive liberalisation of trade, the signature of free-trade agreements, and the
creation of an attractive regime for companies engaged entirely in exports – the so-called
“offshore regime”. Tunisia joined the World Trade Organisation in 1995. In 1996 it signed an
association agreement with the European Union aimed at the gradual dismantling of tariff
and non-tariff barriers, and it obtained the status of privileged partner. Negotiations on a
“deep and comprehensive free-trade agreement” are now under way. Tunisia signed a
free-trade agreement in 2004 withTurkey, and it was fully in effect as of 2014.The tariff regime
has also been simplified, reducing the number of tariff bands from 54 in 2003 to 3 in 2017.
Tunisia’s participation in global value chains has progressed significantly since the
mid-1990s. Trade intensity, measured by the share of exports and imports in GDP,
approached the OECD average in 2016, and was higher than that for many emerging
countries (Figure 20.A). The share of manufactured goods in total exports rose to 76%
(Figure 20.B), well above the level observed in Egypt, Morocco and the majority of other
countries in the region. Moreover, the product structure of exports has become more
diversified (Institut de la Méditerranée, 2014). Among countries of the Maghreb, Tunisia has
the greatest number of exported products with revealed comparative advantage
(Figure 20.C). Tunisian exports have also moved up the complexity scale (Figure 20.D).
Thus, in 2016 Tunisia ranked 52nd worldwide on the scale of complexity, which reflects the
sophistication, diversity and specificity of exports according to the Atlas of Economic
Complexity, thus, outstripping all the countries of Africa but South Africa. Exports of
products from the pharmaceutical, plastics and engineering and electrical industries have
performed particularly well, reflecting long-standing investments in the education sector,
especially in science and engineering.
Box 3. Regulatory reform: impact on growth and debt sustainability (cont.)
4. Scenario with structural budgetary adjustment of around 2% of GDP (the primary deficit being reducedgradually to 1.5% of GDP over a five-year period) with no reform of the goods and services market. Thepublic debt stabilises at around 68% of GDP, but the level of income is lower (by 0.7%) than in the scenariowith no reform.
5. Structural budgetary adjustment of around 2% of GDP (towards a primary deficit of 1.5% of GDP) combinedwith reform of the goods and services market. The debt falls to 57% of GDP in 2040. Tunisia’s income is 5%higher than in the scenario with no reform. The negative impact of the adjustment – through budgetmultipliers – is rapidly neutralised.
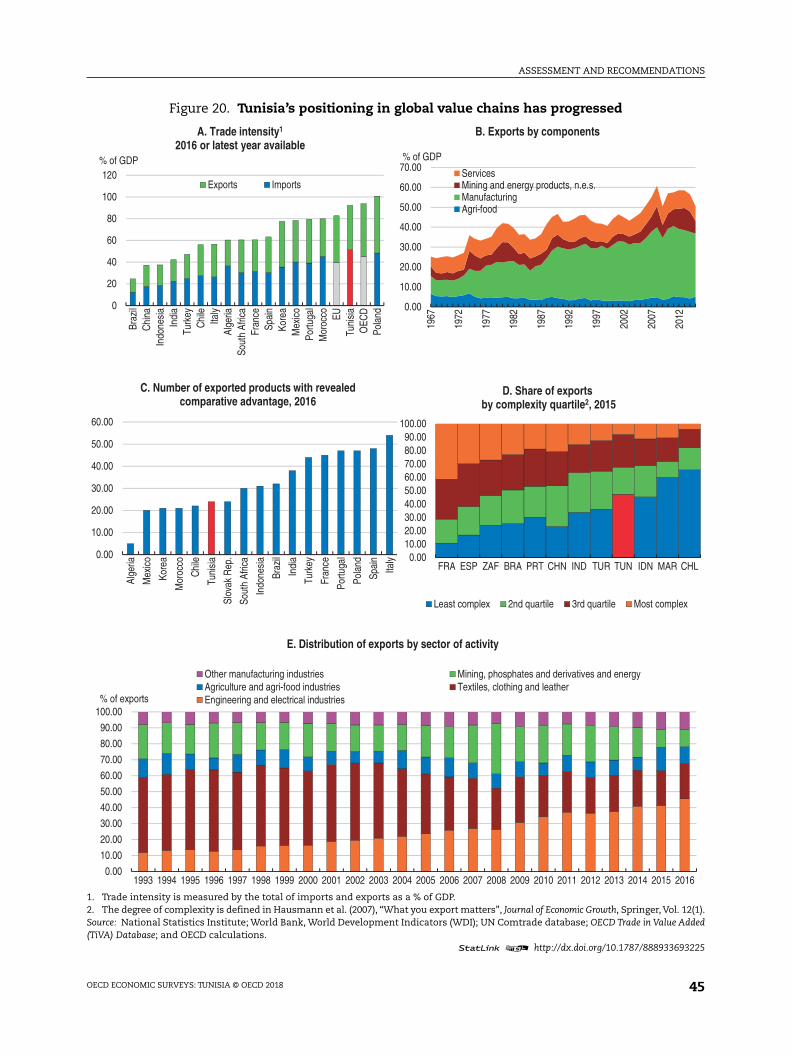
ASSESSMENT AND RECOMMENDATIONS
OECD ECONOMIC SURVEYS: TUNISIA © OECD 2018 45
Figure 20. Tunisia’s positioning in global value chains has progressed
1. Trade intensity is measured by the total of imports and exports as a % of GDP.2. The degree of complexity is defined in Hausmann et al. (2007), “What you export matters”, Journal of Economic Growth, Springer, Vol. 12(1).Source: National Statistics Institute; World Bank, World Development Indicators (WDI); UN Comtrade database; OECD Trade in Value Added(TiVA) Database; and OECD calculations.
1 2 http://dx.doi.org/10.1787/888933693225
0
20
40
60
80
100
120
Braz
ilC
hina
Indo
nesi
aIn
dia
Turk
eyC
hile
Italy
Alge
riaSo
uth
Afric
aFr
ance
Spai
nKo
rea
Mex
ico
Portu
gal
Mor
occo EU
Tuni
sia
OEC
DPo
land
% of GDP
A. Trade intensity1
2016 or latest year available
Exports Imports
0.00
10.00
20.00
30.00
40.00
50.00
60.00
70.00
1967
1972
1977
1982
1987
1992
1997
2002
2007
2012
% of GDP
B. Exports by components
ServicesMining and energy products, n.e.s.ManufacturingAgri-food
0.00
10.00
20.00
30.00
40.00
50.00
60.00
Alge
ria
Mex
ico
Kore
a
Mor
occo
Chi
le
Tuni
sia
Slov
ak R
ep.
Sout
h Af
rica
Indo
nesi
a
Braz
il
Indi
a
Turk
ey
Fran
ce
Portu
gal
Pola
nd
Spai
n
Italy
C. Number of exported products with revealed comparative advantage, 2016
0.0010.0020.0030.0040.0050.0060.0070.0080.0090.00
100.00
FRA ESP ZAF BRA PRT CHN IND TUR TUN IDN MAR CHL
D. Share of exportsby complexity quartile2, 2015
Least complex 2nd quartile 3rd quartile Most complex
0.00
10.00
20.00
30.00
40.00
50.00
60.00
70.00
80.00
90.00
100.00
1993 1994 1995 1996 1997 1998 1999 2000 2001 2002 2003 2004 2005 2006 2007 2008 2009 2010 2011 2012 2013 2014 2015 2016
% of exports
E. Distribution of exports by sector of activity
Other manufacturing industries Mining, phosphates and derivatives and energyAgriculture and agri-food industries Textiles, clothing and leatherEngineering and electrical industries

ASSESSMENT AND RECOMMENDATIONS
OECD ECONOMIC SURVEYS: TUNISIA © OECD 201846
Tunisia is not exploiting all the potential advantages of trade openness. Companies in
the offshore sector – which are exempt from customs duties on imports and exports, pay a
reduced tax rate, and enjoy simplified administrative procedures – have been very active.
In 2016 they accounted for 78% of merchandise exports excluding energy, and that share
has been rising sharply. Their share in formal salaried employment of the private sector
has doubled since 1996 to 34%. Due to its status, the offshore sector has little
interrelationship with the rest of the economy. Firms can import their inputs without
customs duties, provided their total production is re-exported. In 2017, they acquired the
right to conduct up to 30% of their sales within the national territory. Nevertheless,
cumbersome administrative and customs procedures limit the spill-over effect of exports
onto enterprises of the onshore sector. In fact, low-technology products such as
agricultural, energy, mining and phosphate products account for more than 60% of the
exports of onshore firms.
To improve its integration into global value chains and create more and better jobs,
Tunisia must reduce trade barriers further and remove regulatory, customs and logistical
obstacles. The efficiency of logistics services in port facilities is low, and this impacts the
quality and the availability of maintenance and transport services for goods (Figure 21).
Tunisia has been outpaced by its direct competitors with respect to key indicators such as
waiting times at the border or the efficiency of customs services. OECD data on trade
facilitation suggest as well that border procedures applied to onshore firms have
deteriorated (Figure 22). Moreover, Firms that do not operate in the offshore regime suffer
from multiple customs duties, often accompanied by verifications of the type of goods
being imported and a great deal of red tape. This generates costs and hurts the export
competitiveness of onshore firms.
Figure 21. Logistical performance has deteriorated
Note: The global score on the logistics performance index reflects perceptions of a country’s logistics based on the efficiency of customsand border clearance, the quality of trade infrastructure and related transport infrastructure, the ease of arranging shipment atcompetitive prices, the quality of infrastructure services, the ability to track and trace consignments, and the frequency with whichshipments reach their destination on time. The index runs from 1 to 5, with a higher score representing a better performance. For groupsof countries, see the World Bank website.Source: World Bank Logistics Performance Index database.
1 2 http://dx.doi.org/10.1787/888933693244
0
0.5
1
1.5
2
2.5
3
3.5
4
Tuni
sia
Alge
riaBr
azil
Indo
nesi
aM
exic
oM
oroc
coPo
rtuga
lEg
ypt
Chi
leIn
dia
Slov
ak R
ep.
Turk
eyPo
land EU
OEC
DKo
rea
Sout
h Af
rica
Spai
nFr
ance
Italy
Chi
na
A. Logistics performance Index, 2016International transportation
Best performance
Worst performance
0
0.5
1
1.5
2
2.5
3
3.5
4
Tuni
sia
Mor
occo
Alge
riaIn
done
sia
Egyp
tBr
azil
Mex
ico
Indi
aTu
rkey
Chi
lePo
land
Slov
ak R
ep.
Chi
naPo
rtuga
lEU Ita
lyKo
rea
Spai
nO
ECD
Sout
h Af
rica
B. Logistics performance Index, 2016Customs
Best performance
Worst performance

ASSESSMENT AND RECOMMENDATIONS
OECD ECONOMIC SURVEYS: TUNISIA © OECD 2018 47
Encouraging all citizens to participate in economic life in order to reduce inequalities
Unemployment is high and informal employment is widespread
The unemployment rate is high, especially among young graduates. In 2016, the
unemployment rate stood at 15.6% of the economically active population, and was higher
than the OECD average or that of MENA countries. At around 35%, the unemployment rate
for youth (15 to 24 years) is above that for the majority of OECD countries and emerging
countries. Graduates of higher education face a worse unemployment rate than do persons
with primary or secondary schooling. There is a significant mismatch between the skills
acquired by young Tunisians and employers’ needs, which represents an obstacle to their
employability. Employers need to be more involved in the design of programmes.
While microbusinesses and self-employment play a big role in job creation, just 2% of
young people aged between 18 and 24 were involved in setting up a company in 2012
(Belkacem and Mansouri, 2013). Compared to their peers in OECD countries, young
Tunisians are less likely to state that they have access to training and financing. Even
though Tunisia has a relatively well developed system for supporting business creation,
providing information, training, financing and monitoring services during the first two
years of activity, efficiency gains remain possible. Furthermore, there is a need for better
medium- and long-term assistance to young entrepreneurs, especially women, who face
many obstacles when setting up a business (OECD, 2015c).
The public sector recruitment policy, which gave priority to the long-term unemployed,
seems to have aggravated the problem of unemployment among graduates. This clearly
represented an incentive to turn to the employment agency and await a job in the public
sector, which offered a higher salary, job security, and more generous social benefits
(OECD, 2015).
Many Tunisians must put up with precarious working conditions. Informal employment
is widespread and, depending on sources and definition, may represent between 30% and
Figure 22. Trade could be facilitated
Note: The OECD Trade facilitation indicators measure the relative economic and trade impact of trade facilitationmeasures currently under negotiation in the World Trade Organization (WTO) on trade flows and trade costs. Theindicators vary between 0 and 2, the higher is the value of the indicator the better is the performance.Source: OECD Trade facilitation indicators Database.
1 2 http://dx.doi.org/10.1787/888933693263
0
0.5
1
1.5
2Information availability
Involvement of traders
Advance rulings
Appeal procedures
Fees and charges
Formalities: documentsFormalities: automation
Formalities: procedures
Internal co-operation between various borderagencies
External co-operation between various borderagencies
Governance and impartiality
Trade facilitation indicators, 2017
Tunisia
OECD
MENA

ASSESSMENT AND RECOMMENDATIONS
OECD ECONOMIC SURVEYS: TUNISIA © OECD 201848
45% of total employment (World Bank, 2014; CRES, 2016). Although this rate is lower than
the average for the countries of Latin America and Asia, it is nonetheless higher than for
countries of the OECD or countries in transition (Figure 23). A high rate of informality
usually generates inequalities, as people working in this sector have lower earnings,
insecure working conditions, and little access to the financial system. In Tunisia, young
people are more likely to be informally employed (CRES, 2016). Workers are for the most
part hired on fixed-term contracts (FTC), given the small size of companies (over 90% of
enterprises have fewer than 10% employees), and the rigidity of regulations on terminating
open-ended or permanent contracts.
Social security contributions are relatively high (Figure 24) even if the related
advantages are also relatively generous for a small number of social security regimes. This
encourages a shift to the informal sector, as employers may be reluctant to declare
workers, and independent workers may prefer to operate in the informal sector.
International experience suggests that lower taxation of labour can boost job creation in
the formal sector. For example, in 2012, Colombia implemented a tax reform that
eliminated or reduced certain contributions on wages and salaries, and this led to an
increase in formal employment.
There are some labour market regulations and practices that, even though they tend
to discourage stable job creation in the formal sector, seem more difficult to reform at the
present time without sparking protests that could block the reform process. Thus, for
example, the wage negotiation process is a lengthy one. Wage increases apply to all
sectors, sometimes retroactively, whatever the economic situation of the sector or the size
of the firm. This can induce employers to automate production processes in order to
reduce their need for workers. Moreover, while regulations governing redundancy for
persons on permanent contracts are stricter than in many emerging countries and trading
partners, workers on temporary contracts have little protection. This results in a dual
labour market, with protected groups on one side and vulnerable groups on the other, and
there are few possibilities for moving between these groups.
Figure 23. Informal employment is widespread
Source: World Bank Enterprise Survey.1 2 http://dx.doi.org/10.1787/888933693282
01020304050607080
Tran
sitio
n eo
nom
ies
Tuni
sia
Alge
ria
Egyp
t
Nor
th A
frica
Wes
t Asi
a
Latin
Am
eric
a
Sout
h As
ia
Mor
occo
Afric
a
% of non-agricultural employment
Employment in the informal economy as a proportion of non-agricultural employment
2000-04 2010-14

ASSESSMENT AND RECOMMENDATIONS
OECD ECONOMIC SURVEYS: TUNISIA © OECD 2018 49
Gender differences: a mixed record
Tunisia is a leader among countries of the MENA region in efforts to achieve gender
equality (World Economic Forum, 2017). The Personal Status Code confirms the principle of
equality between men and women in socioeconomic, cultural and political life. Since that
time, successive reforms have advanced the rights and the status of women. In August
2017, the President of the Republic opened a debate on a proposal to introduce gender
equality with respect to inheritance.
These policies have borne fruit, but significant disparities between men and women
persist on the labour market. The female employment rate is one of the highest in the MENA
region, but it still falls well short of that for the OECD (23% versus 63%). The proportion of
women holding management positions in the public and private sectors is the highest among
MENA countries, at 14.8% (OECD, 2017e). Whereas the female enrolment rate at all levels of
education is today 10 points higher than that for men (71% versus 61%, Daghari, 2017), the
unemployment rate is higher for women than for men (22% versus 12% in 2015). The gap
between the male and female employment rate is generated by discriminatory attitudes on
the part of employers which are based on socio-cultural values. In the provinces, the high rate
of unemployment among women may also be caused by their lower mobility, which prevents
them moving house to take up a job, and by the distance to the nearest job centre. A further
factor is that women often take qualifications that are less in demand on the labour market.
Overall, women work in lower-skilled jobs than men with the same level of qualification
(Stampini and Verdier-Chouchane, 2011). Female entrepreneurs face many obstacles in
Tunisia, the most significant being: i) cultural barriers to starting a business; ii) a lack of
collateral for bank loans, since women own little property in their own right; and iii) the
general scarcity of women in the working population and in executive posts (OECD, 2015c).
The supply of female labour could be stimulated by policies in favour ofchild day care
and education. For lack of funding, the number of public day-care centres has declined
Figure 24. Social contributions depress formal employment
1. Data refer to 2010 for Brazil, China, India and South Africa, and to 2009 for Indonesia.2. The non-organised sector in India corresponds to companies with fewer than 20 employees. Companies with more than 20 employees
have to comply with the law on pension funds for employees and other provisions, and to this end pay social security contributions.Note: The scenario considers a single person with no children earning 100% of the average wage.Source: OECD revenue statistics and Ministry of Finance.
1 2 http://dx.doi.org/10.1787/888933693301
0
10
20
30
40
50
60
Indi
a (n
on-o
rgan
ised
)¹ ²
Chi
leIn
done
sia¹
Sout
h Af
rica¹
New
Zea
land
Mex
ico
Switz
erla
ndIs
rael
Kore
aIn
dia
(org
anis
ed)¹
²Ire
land
Aust
ralia
Uni
ted
King
dom
Can
ada
Uni
ted
Stat
esJa
pan
Braz
il¹Ic
elan
dTu
nisi
aC
hina
¹Po
land
OEC
DN
orw
ayD
enm
ark
Net
herla
nds
Turk
eyLu
xem
bour
gEs
toni
aSp
ain
Gre
ece
Portu
gal
Slov
ak R
epub
licLa
tvia
Slov
enia
Swed
enC
zech
Rep
.Fi
nlan
dAu
stria
Italy
Fran
ceH
unga
ryG
erm
any
Belg
ium
% of labour costs
Taxation of income from work, 2016
Employer contributions Employee contributions Income tax

ASSESSMENT AND RECOMMENDATIONS
OECD ECONOMIC SURVEYS: TUNISIA © OECD 201850
sharply since the 1980s, even if some have been rehabilitated since 2015. Efforts are also
under way to improve the country’s network of early education structures with a view of
increasing the rate of coverage to 53% in 2020 from 35% in 2015. This extended coverage
could help increase the level of female participation (defined as the number of active – in
work or unemployed – divided by the number of women of working age [15-64]) to the
target of 35% in 2020 compared to 28% in 2015.It is essential to pursue this work so that the
poorest households can have access to quality child care at lower cost.
Several programmes and initiatives have been launched with the aim of strengthening
the social, economic and political empowerment of women, and especially women from
rural areas. These mainly revolve around promoting female participation in the labour
market and female, strengthening the involvement of women in public and political life,
fighting educational wastage among young girls from rural areas as well as violence
against women.
A financial inclusion strategy is needed
The supply of inclusive financial services is fragmented, incomplete and not very
accessible (World Bank, 2015). Only 27% of Tunisians have an account in a financial
institution, and fewer than 7% have a credit card, a figure that is low in comparison with
emerging countries and OECD members. Many firms identify access to credit as one of the
key constraints on their development (Chapter 1). Financial services are at a rudimentary
stage of development, and are concentrated in the coastal regions, although the post office
maintains a presence in the regions that allows rural people and those living in isolated
zones to have access to financial services. Yet with a quarter of its agencies still not
connected to the central server, with relatively restrictive opening hours, and with minimum
deposit amounts, the post office does not yet offer solutions for micro-savings (regular
withdrawals and deposits of very small amounts) or means of payment that are easy to use
(World Bank, 2015). The services offered by the banks are not geared to micro and small
enterprises or to low-income people, given the high costs of maintaining an account and the
collateral demanded for loans.
In 2016 the authorities launched a financial inclusion strategy which is due to be
implemented in the 2018-22 period, aimed, among other things, at promoting digital
finance, micro-insurance, the social and solidarity economy, and financial education. In
2011, a law was adopted regulating the micro-finance sector and allowing the introduction
of a new legal form for microfinance institutions in addition to the creation of a new
regulatory watchdog for the sector. In 2016, a Financial Inclusion Observatory was created
within the central bank with the main mission of evaluating and monitoring changes in
access to financial services. Many emerging countries have introduced measures that
Tunisia could copy. For example, Brazil, Colombia and India have promoted financial
inclusion by opening bank accounts for everyone and depositing social allowances to those
accounts. A study into financial inclusion was launched at the end of 2017 in order to
determine, using indicators, the level of financial inclusion. This study will be duplicated
in the future by the Financial Inclusion Observatory in collaboration with the INS. Lastly,
the draft law on the promotion of start-ups was approved at the end of 2017 by the Council
of Ministers. It aims to simplify administrative procedures, facilitate access to funding,
encourage entrepreneurship and create the right conditions for the breakthrough of start-
ups at the international level.

ASSESSMENT AND RECOMMENDATIONS
OECD ECONOMIC SURVEYS: TUNISIA © OECD 2018 51
Regional development: allowing each region to exploit its comparative advantages
Improvements in living standards have been observed across all regions of Tunisia.
The poverty rate has dropped and access to basic infrastructure and public services has
improved. Nevertheless, the economic choice to favour the export sector has led to a
concentration of activities in the coastal areas, leaving the inland regions behind. Those
regions generally depend on a narrow range of basic products, and they are little integrated
into global value chains. The unemployment rate in these regions is much higher than in
the coastal areas (Figure 25).
Figure 25. The unemployment rate varies greatly among regions
Source: INS.1 2 http://dx.doi.org/10.1787/888933693320

ASSESSMENT AND RECOMMENDATIONS
OECD ECONOMIC SURVEYS: TUNISIA © OECD 201852
Since 2011, the government has restated the priority given to regional development. In
order to succeed in this effort, multidimensional policies (covering such aspects as
education, innovation, infrastructure and institutional factors) will have to be adopted with
a view to capitalising on the specific assets of each region and improving its competitiveness,
while ensuring coordination among the different levels of government (OECD, 2012). To this
end, a potential regional development strategy, based on other successful experiments,
might see the authorities promoting the development of regional centres or “clusters” in the
country’s interior. They would draw support from urban centres, in order to harness the
economies of agglomeration that only cities of a certain size can generate, using their high
productivity and their ability to attract productive investment. The ripple effects of these
poles would allow them to serve as engines for development in their respective regions, by
creating trading markets and economic integration both at regional and national level.
Modernising the institutions responsible for regional development by providing them
with highly skilled officers and financial and decision-making autonomy would enable the
deployment of the new strategy. These independent institutions would be fully dedicated
to identifying public and private investment opportunities in the region, establishing a
suitable climate for private investment by reducing bureaucracy, helping investors, and
setting up their projects quickly. They would also be responsible for evaluating the strategy,
in order to adjust it as necessary according to the results obtained and the actual
conditions in the field. The upgrading of infrastructure and public services in the regions of
the interior would reduce inequalities, boost living standards, and make those regions
more attractive. Proper governance of the different levels of government is also essential.
A decentralisation plan is under study. Worldwide, it can be observed that countries
with the greatest level of decentralisation often have a higher standard of living, as
measured by GDP per capita (OECD, regional database). The Tunisian decentralisation
project could help to increase participation and bring decisions closer to the citizens, and
respond more effectively to local circumstances and preferences. It could also serve to
reduce regional disparities by encouraging better use of local resources (Bartolini et al.,
2016). Yet this plan will have to be implemented gradually, with due regard to the
managerial and financial capacities of the different levels of local government. It is also
important to enhance the mobility of workers from declining regions to the more dynamic
regions. The National Development Plan 2016-2020 includes a large public investment
intended to reinforce links between the regions by developing a road network. Mobility can
also be reinforced by a suitable housing policy that would, for example, promote the rental
market while reducing the tax bias in favour of owner-occupancy.

ASSESSMENT AND RECOMMENDATIONS
OECD ECONOMIC SURVEYS: TUNISIA © OECD 2018 53
Bibliography
Araar, A. and P. Verme (2016), “A Comparative Analysis of Subsidy reforms in the Middle East and NorthAfrican Region”, World Bank Policy Research Working Paper 7755 http://documents.worldbank.org/curated/en/965461469022650590/pdf/WPS7755.pdf.
Bartolini, D., S. Stossberg and H. Blöchliger (2016), “Fiscal Decentralisation and Regional Disparities”,OECD Economics Department Working Papers, No. 1330, OECD Publishing, Paris.
Baudino, P. and H. Yun (2017), “Resolution of non-performing loans – policy options”, BIS FSI Insightson policy implementation, No. 3.
Ben Chaâben (2017), “La rémunération des salariés 2010-2017”, Notes et analyses de l’Institut Tunisien dela Compétitivité et des Etudes Quantitatives, No. 60.
Central Bank of Tunisia (2016), “Rapport annuel sur la supervision bancaire”.
Central Bank of Tunisia (2017a), Périodique de Conjoncture, No. 116.
Central Bank of Tunisia (2017b), Annual Report 2016.
Coady, D., M. Grosh and J. Hoddinott (2004), Targeting of transfers in developing countries: Review of lessonsand experience, World Bank.
Conseil des Analyses économiques (2016), Programme National des Réformes Majeures, 2016-2020.
CRES (2016), “Protection sociale et économie informelle en Tunisie, Défis de la transition versl’économie informelle”.
Daghari, S. (2017), “Evolution du système éducatif tunisien”, Notes et analyses de l’Institut Tunisien de laCompétitivité et des Etudes Quantitatives (ITCEQ), No. 51.
Égert, B. and P. Gal (2017), “The Quantification of Structural Reforms in OECD Countries: A NewFramework”, OECD Economics Department Working Papers, No. 1354, OECD Publishing, Paris, http://dx.doi.org/10.1787/2d887027-en.
Fajgelbaum, P. and A. Kandhelwal (2016), “Measuring the unequal gains from trade”, QJE, Vol. 131.
Gangopadhyay, S., R. Lensink and B. Yadav (2015), “Cash or In-kind Transfers? Evidence from aRandomised Controlled Trial in Delhi, India”, The Journal of Development Studies, 51:6, 660-673.
Haddar, M. and M. Bouzaiene (2017), “Ancrage de la justice fiscale et mobilisation des ressources”,www.asectu.org/Documents/PDF/JF_Rapport.pdf.
Hughes, J. and L. Mester (2013), “Who Said Large Banks Don’t Experience Scale Economies? Evidencefrom a Risk-Return-Driven Cost Function”, Journal of Financial Intermediation, Vol. 22, No. 4, October.
ILO (2011), Tunisia: A New Social Contract for Fair and Equitable Growth – Studies on Growth with Equity, ILO,Geneva.
IMF (2015), “Article IV Consultation, Sixth Review Under The Stand-By Arrangement, And Request ForRephasing – Press Release; Staff Report; And Statement By The Executive Director For Tunisia”.
IMF (2017), “First Review Under The Extended Fund Facility, Request For Waivers Of Non observance OfPerformance Criteria And Rephasing Of Access – Press Release; Staff Report; And Statement By TheExecutive Director For Tunisia”.
Institut de la Méditerranée (2014), Eléments Pour Une Stratégie de Développement Economique & Social àMoyen Terme en Tunisie, www.femise.org/wp-content/uploads/2015/03/Ouvrage_Tunisie_Final_V4.pdf.
ITCEQ (2017), “Quelle stratégie de réforme de la subvention énergétique en Tunisie”, Tribune de l’ITCEQNo. 19, May 2017, www.itceq.tn/upload/files/tribune/tribune2017/tribune19.pdf.
ITCEQ (2011), “Convertibilité totale du dinar: enjeux et défis”.
Jamet, S. (2007), “Meeting the challenges of decentralisation in France”, OECD Economics DepartmentWorking Papers, No. 571, OECD Publishing, Paris, http://dx.doi.org/10.1787/127050885680.
Johansson, Å. et al. (2008), “Taxation and Economic Growth”, OECD Economics Department WorkingPapers, No. 620, OECD Publishing, Paris, http://dx.doi.org/10.1787/241216205486.
Joumard, I. and C. Giorno (2005), “Getting the most out of public sector decentralisation in Spain”,OECD Economics Department Working Papers, No. 436, OECD Publishing, Paris, http://dx.doi.org/10.1787/838564110008.

ASSESSMENT AND RECOMMENDATIONS
OECD ECONOMIC SURVEYS: TUNISIA © OECD 201854
Joumard, I. and J. Londoño Vélez (2013), “Income Inequality and Poverty in Colombia – Part 2. TheRedistributive Impact of Taxes and Transfers”, OECD Economics Department Working Papers, No. 1037,OECD Publishing, Paris.
Joussour (2016), “Commencer par cerner l’informel pour préparer son cantonnement : un enjeu depolitique publique”.
Minegishi, M. and B. Cournède (2009), “The Role of Transparency in the Conduct of Monetary Policy”,OECD Economics Department Working papers, No. 724, OECD Publishing, Paris, http://dx.doi.org/10.1787/221128317344.
Moulay, S. (2012), “The role of monetary policies and macroeconomic convergence in the developmentof financial systems in south Mediterranean countries”, MEDPRO Technical Report, No. 12.
OECD (2012), Promoting Growth in All Regions, OECD Publishing, Paris, http://dx.doi.org/10.1787/9789264174634-en.
OECD (2014), OECD Integrity Review of Tunisias Audit System: Managing Risk in Public Institutions.
OECD (2015a), Economic Survey of Indonesia 2015.
OECD (2015b), OECD Guidelines on Corporate Governance of State-Owned Enterprises, 2015 edition.
OECD (2015c), Investing in Youth: Tunisia – Strengthening the Employability of Youth during the Transition to aGreen Economy, OECD Publishing, Paris, http://dx.doi.org/10.1787/9789264226470-en.
OECD (2015d), Open Government Review of Tunisia.
OECD (2016a), Global Forum on Transparency and Exchange of Information for Tax Purposes Peer Reviews:Tunisia 2016; Phase I: Legal and Regulatory Framework, http://dx.doi.org/10.1787/9789264250697-en.
OECD (2016b), OECD Economic Survey of Indonesia 2016.
OECD (2017a), Une meilleure planification pour une meilleure gouvernance budgétaire en Tunisie : le cadre dedépenses à moyen terme.
OECD (2017b), Une meilleure performance pour une meilleure gouvernance publique en Tunisie : la gestionbudgétaire par objectifs.
OECD (2017c), “The effects of the tax mix on inequality and growth”, OECD Economics Department WorkingPapers.
OECD (2017d), “How to make trade work for all”, OECD Economic Outlook, June 2017, Chapter 2.
OECD (2017e), Women’s Economic Empowerment in Selected MENA Countries: The Impact of Legal Frameworksin Algeria, Egypt, Jordan, Libya, Morocco and Tunisia, Competitiveness and Private Sector Development,OECD Publishing, Paris, http://dx.doi.org/10.1787/9789264279322-en.
OECD (2017f), “The quantification of structural reforms: Extending the framework to emerging marketeconomies”, OECD Economics Department Working Papers.
OECD (2017g), “Creating a Culture of Independence: Practical Guidance against Undue Influence”, OECDPublishing, Paris”, http://dx.doi.org/10.1787/9789264287884-fr.
Rijkers, B., C. Freund and A. Nucifora (2014), “All in the Family – State Capture in Tunisia”, The WorldBank WPS6810.
Statistiques Tunisie and CRES (2013), Analyse de l’Impact des Subventions Alimentaires et des Programmesd’Assistance Sociale sur la Population Pauvre et Vulnérable.
Tripathi, A., A.D. Sagar and K.R Smith (2015), “Promoting Clean and Affordable Cooking – SmarterSubsidies for LPG”, Economic and Political Weekly, Vol. L, No. 48, 28 November 2015.
Vujanovic, P. (2017), “Decentralisation to promote regional development in Indonesia”, OECD EconomicsDepartment Working Papers, No. 1380, OECD Publishing, Paris, http://dx.doi.org/10.1787/d9cabd0a-en.
World Bank (2014), “The Unfinished Revolution: Bringing Opportunity, Good jobs and Greater Wealthto all Tunisians”.
World Bank (2015), “Snapshot: Financial inclusion in Tunisia – low-income households and micro-enterprises”.
World Bank (2016), “Tunisia Poverty Assessment, 2015”.
World Bank (2017), Impact of Libya crisis on the Tunisian economy.
World Economic Forum (2017a), “Global Competitiveness Report”.


