October 26, 2021 GE 2021 third quarter performance
24
GE 2021 third quarter performance Financial results & company highlights October 26, 2021 CAUTION CONCERNING FORWARD-LOOKING STATEMENTS: This document contains "forward-looking statements" – that is, statements related to future events that by their nature address matters that are, to different degrees, uncertain. For details on the uncertainties that may cause our actual future results to be materially different than those expressed in our forward-looking statements, see https://www.ge.com/investor-relations/important-forward-looking-statement-information as well as our annual reports on Form 10-K and quarterly reports on Form 10-Q. We do not undertake to update our forward-looking statements. This document also includes certain forward-looking projected financial information that is based on current estimates and forecasts. Actual results could differ materially. NON-GAAP FINANCIAL MEASURES: In this document, we sometimes use information derived from consolidated financial data but not presented in our financial statements prepared in accordance with U.S. generally accepted accounting principles (GAAP). Certain of these data are considered “non-GAAP financial measures” under the U.S. Securities and Exchange Commission rules. These non-GAAP financial measures supplement our GAAP disclosures and should not be considered an alternative to the GAAP measure. The reasons we use these non-GAAP financial measures and the reconciliations to their most directly comparable GAAP financial measures are included in our quarterly report on Form 10-Q, our earnings release and the appendix of this presentation, as applicable. Amounts shown on subsequent pages may not add due to rounding. Our financial services business is operated by GE Capital Global Holdings, LLC (GECGH). In this document, we refer to GECGH and our financial services business as “GE Capital”. We refer to the industrial businesses of the Company as GE Industrial. GE’s Investor Relations website at www.ge.com/investor and our corporate blog at www.gereports.com , as well as GE’s Facebook page and Twitter accounts, contain a significant amount of information about GE, including financi al and other information for investors. GE encourages investors to visit these websites from time to time, as information is updated and new information is posted.
Transcript of October 26, 2021 GE 2021 third quarter performance

GE 2021 third quarter performanceFinancial results & company highlights
October 26, 2021
CAUTION CONCERNING FORWARD-LOOKING STATEMENTS:
This document contains "forward-looking statements" – that is, statements related to future events that by their nature address matters that are, to different degrees, uncertain. For details on the uncertainties that may cause our actual future
results to be materially different than those expressed in our forward-looking statements, see https://www.ge.com/investor-relations/important-forward-looking-statement-information as well as our annual reports on Form 10-K and quarterly
reports on Form 10-Q. We do not undertake to update our forward-looking statements. This document also includes certain forward-looking projected financial information that is based on current estimates and forecasts. Actual results could
differ materially.
NON-GAAP FINANCIAL MEASURES:
In this document, we sometimes use information derived from consolidated financial data but not presented in our financial statements prepared in accordance with U.S. generally accepted accounting principles (GAAP). Certain of these data
are considered “non-GAAP financial measures” under the U.S. Securities and Exchange Commission rules. These non-GAAP financial measures supplement our GAAP disclosures and should not be considered an alternative to the GAAP
measure. The reasons we use these non-GAAP financial measures and the reconciliations to their most directly comparable GAAP financial measures are included in our quarterly report on Form 10-Q, our earnings release and the appendix of
this presentation, as applicable.
Amounts shown on subsequent pages may not add due to rounding.
Our financial services business is operated by GE Capital Global Holdings, LLC (GECGH). In this document, we refer to GECGH and our financial services business as “GE Capital”. We refer to the industrial businesses of the Company as
GE Industrial.
GE’s Investor Relations website at www.ge.com/investor and our corporate blog at www.gereports.com, as well as GE’s Facebook page and Twitter accounts, contain a significant amount of information about GE, including financial and other
information for investors. GE encourages investors to visit these websites from time to time, as information is updated and new information is posted.

3Q 2021 snapshot
2
Results Dynamics
Adjusted GE Industrial
organic margin expansion*
Adjusted EPS*
GE Industrial
free cash flow*
270 bps
$0.57
$1.7B
GE Industrial
organic revenue growth*(1)%
* Non-GAAP Financial Measure
Performance encouraging, managing through supply chain challenges & PTC pressure
• Strong performance continues with robust orders growth ...
up across all segments in both services & equipment
• Revenue mixed ... services up 7%org*, largely Aviation;
equipment down (9)%org* primarily Healthcare & Power
• Adjusted GE Industrial margins* of 7.5% ... y/y expansion
driven by services at Aviation & Power
• Adjusted EPS* up $0.19 y/y ... driven by Industrial
• GE Industrial FCF* up $1.8B y/y ex disc. factoring programs-a)
driven by better earnings, working capital & Aviation delayed
aircraft delivery payments (AD&A)
• '21 outlook: Raising margins and adjusted EPS* with flat
revenue growth … narrowing FCF*
(a- Excludes CFOA impact from factoring programs discontinued as of April 1, 2021 of $(0.4)B in 3Q'21 and $0.6B in 3Q'20

GE: A more focused, simpler, stronger high-tech industrial
3
Financial & operational progress continues to accelerate … driving growth across businesses
Transforming GE Business highlights
• Solidifying financial position & focusing on Industrial
core ... GECAS important catalyst, expected to close
November 1; post GECAS close total reduction of ~$75B
of debt since ’18
• Deploying lean & decentralization ... team driving
sustainable SQDC improvements & improving cross-
functional collaboration
• Playing offense ... investing in organic growth
opportunities, supporting continued innovation …
complemented by targeted inorganic investment
Healthcare to acquire BK Medical to
expand its ultrasound portfolio into
surgical & therapeutic interventions
Renewable Energy's Haliade-X
prototype began operating at 14 MW in
Rotterdam, Netherlands
Power deployed four TM2500
aeroderivative gas turbines to support
California’s emergency power needs
Photo credit: BK Medical
Members of Aviation's Military business
focused on delivering lean improvements
during Kaizen week in Lynn, MA

Earnings performance
4
* Non-GAAP Financial Measure(a – Excludes interest & other financial charges, non-operating benefit costs, gains (losses), restructuring & other charges, debt extinguishment costs (YTD only)(b – Numbers may not add due to rounding(c – Includes significant, higher-cost programs that are recorded within Corporate Items and Eliminations
Revenue mixed while orders & Industrial profit continue to improve
($ in billions – except EPS)
3Q'21 EPS walk-b)3Q'21 y/y y/y (org.) YTD
Orders $22.1 42% 42% $57.3
Revenues 18.4 (1)% 53.8
- GE Industrial 17.8 (1)% (1)%* 51.6
Adjusted GE Industrial profit*-a) 1.3 55% 54% 3.1
Adjusted GE Industrial profit margin*-a) 7.5% 270bps 270bps 6.0%
GAAP Continuing EPS 0.54 F (0.01)
Adjusted EPS* 0.57 50% 1.20
GAAP Continuing EPS $0.54
Less: MTM & Gains 0.33
Less: Restructuring & other-c) (0.05)
Less: Non-op. pension & other benefits (0.30)
Adjusted EPS* $0.57

5
($ in billions)
Industrial free cash flow
Significant 3Q improvement … narrowing '21 FCF* guide
* Non-GAAP Financial Measure(a – Aggregates the following: Net earnings (loss) and (earnings) loss from discontinued operations(b – Excludes CFOA impact from factoring programs discontinued as of April 1, 2021, of $(0.4)B in 3Q'21 and $(2.7)B in 2Q'21(c – Aggregates the following: (Gains) losses on sales of business interests, (Gains) losses on equity securities, principal pension plans (net), other post retirement benefit plans (net), income taxes (net), and all other operating activities; excludesdeal taxes and GE Pension Plan contributions(d – Aggregates the following: additions to property, plant & equipment and internal use software(e - Excludes CFOA impact from factoring programs discontinued as of April 1, 2021 in current and prior periods, of $(0.4)B in 3Q'21, $(2.7)B in 2Q'21, $(0.8)B in 1Q'21 and $0.6B in 3Q'20
3Q'21 commentary
• Industrial FCF up $1.8B y/y ex disc. factoring programs*… robust
FCF conversion* in Aviation, Power, & Healthcare
• Working capital $0.8B better y/y ex disc. factoring:
◦ Receivables: source … DSO improved sequentially & y/y,
more linear billings
◦ Inventory: source … better flow, navigating fulfillment &
execution challenges
◦ Accounts payable: use … disbursements from 1H'21 build
◦ Progress: use … Onshore Wind deliveries partially offset by
down payments in Gas Power & Offshore Wind
◦ Contract assets: source … higher Aviation utilization billings
• Other CFOA inflow ... delayed aircraft delivery payments (AD&A)
3Q'21 y/y YTD
Net earnings (loss)-a) 0.8 2.0 1.0
Depreciation & amortization 0.7 (0.4) 2.2
Operating working capital (0.1) 0.1 (0.8)
Current receivables-b) 0.1 0.6 1.6
Inventory 0.2 (0.3) (1.1)
Accounts payable (0.4) (0.7) (0.3)
Progress collections (0.2) 0.5 (1.5)
Current contract assets 0.2 (0.0) 0.5
Other CFOA-c) 0.7 (0.4) (0.2)
Gross CAPEX-d) (0.3) 0.0 (1.0)
GE Industrial FCF* 1.7 1.2 1.3
GE Industrial FCF excluding cash flow from discontinued factoring programs * -e) 1.7 1.8 2.0

6
Cumulative debt reduction-a, b)Progress($ in billions)
Liquidity & deleveraging update
(a – Cumulative gross debt reduction since 4Q’18 - includes pension; numbers may not add due to rounding
(b – Due to pending balance sheet consolidation post AerCap close, factoring reduction now reflects off balance sheet only
(c – Includes $0.9B remaining 2021 debt maturities and further debt reduction associated with the GECAS deal closure
(d – Post the close of the AerCap / GECAS transaction
• Post AerCap close, expect to reduce debt by ~$75B since
2018
• With AerCap close, will receive 46% equity stake in one of the
world's leading aviation lessors as the industry recovers
• Strong liquidity $25B of cash
◦ Monetized 135M of BKR shares ($3.0B) 3Q’21 YTD …
remaining stake ~ 20%
◦ Improvement in peak intra-quarter Industrial cash needs
consistently at ~$11B down from ~$13B
Continued progress on debt reduction

Industrial performance primarily driven by Aviation & Power, services growth
Healthcare
7
Renewable Energy
3Q'21 Industrial segments results($ in billions)
PowerAviation
* Non-GAAP Financial Measure: organic revenue, organic segment profit, and organic segment margin in columns labeled y/y (org.)
$ / % y/yy/y
(org.)* $ / % y/yy/y
(org.)* $ / % y/yy/y
(org.)* $ / % y/yy/y
(org.)*
Orders $6.9 69% 70% $5.0 21% 19% $6.6 65% 65% $3.7 8% 6%
Revenue $5.4 10% 10% $4.3 (5)% (6)% $4.2 (7)% (9)% $4.0 —% (1)%
Segmentprofit
$0.8 F F $0.7 (5)% (10)% $(0.2) U U $0.2 38% 34%
Segmentmargin
15.7% 860bps 850bps 16.2% —bps (60)bps (3.6)% (250)bps (250)bps 5.1% 140bps 130bps

• Adj. continuing earnings* down y/y: non-repeat tax benefits
partially offset by preferred dividend
• Disc. ops. earnings up y/y: mark to market from recent increase
in AerCap stock price
8
$ y/y
Functions & operations $(0.2) 38%
EHS-c) and other items $(0.1) U
Eliminations $(0.0) 76%
Adjusted Corporate costs* $(0.3) 17%
3Q'21 GE Capital & Corporate results
Corporate
• Continued cost reduction in functions & operations
• Decentralization & leaner processes
• Now expecting ~$1B of Adjusted Corporate costs* in '21
($ in billions)
GE Capital transition on track; streamlining Corporate
3Q'21y/y /
sequential
Adjusted earnings*-a) $(0.1) U
Assets
(ex-liquidity)*-b)$95.4 $(1.2)
Discontinued operations earnings
$0.6 F
GE Capital
y/y
y/y
sequential
*Non-GAAP Financial Measure
(a - Excludes $9M tax benefits in 3Q'20
(b - Total segments assets of $66.3B plus assets of discontinued operations of $36.5B, less GE Capital cash $7.0B and discontinued operations cash of $0.4B
(c - Environmental, health & safety

Healthcare: Edison True Picture Archive & Communication System (TruePACS)
9
Wrap-up
Position of strength today … on track to deliver high single-digit FCF* margins over time
* Non-GAAP Financial Measure
Strong performance continues
Transforming to a more focused, simpler, stronger high-tech industrial company
Driving long-term growth & value in our businesses
Future of flight … new technology for
sustainability & reliability
Precision health … more personalized,
efficient patient care
Energy transition … solving trilemma of
sustainability, affordability, reliability
Aviation: Catalyst™ turboprop engine Gas Power: Cricket Valley Energy Center

Q&A
10

Appendix
11
• 2021 overview
• Aviation update: what we’re seeing
• Liquidity & Debt update
• Maturity profile
• Orders
• Orders units

12
2021 overview (updated October 2021)
Positive trajectory in 2021, managing through challenges
* Non-GAAP Financial MeasureExcludes impact of factoring reduction from 2Q’21 to 4Q’21
• Degree of supply chain impact
• Aviation market recovery, timing of aircraft deliveries
• Renewables new product ramp, supply chain, PTC pressure
• Restructuring: Expense (total & in-segment) & cash better y/y
Outlook assumptions
• Aviation market recovery beginning in 2H… '21 top line ~flat
• Gas a key enabler of energy transition … services growth,
selective equipment deals
• Renewables revenue flat … expand international, ramp up
Offshore, optimize cost base, '21 FCF* down & negative
• Attractive Healthcare market, supply chain pressures …
invest in Healthcare systems growth, PDx recovery
• FCF* driven by earnings & working capital, excludes one-time
factoring reduction impact
Key variables
Revenues
Free cash flow*
LSD(GE Industrial organic*)
Prior: $2.5B to $4.5B(GE Industrial FCF*)
Updated 2Q: $3.5B to $5.0B
Updated 3Q: $3.75B - $4.75B
Margins
EPS
250+ bps expansion(Adjusted GE Industrial
organic margin*)
Updated: 350+ bps
$1.20 - $2.00(Adjusted EPS*)
Updated: $1.80 - $2.10
Revenues
Free cash flow*
LSD(GE Industrial organic*)
Updated: ~Flat
Margins
EPS

Aviation update: what we’re seeing
13
Continue planning for 2021 GE/CFM departures +20% y/y … SVs-d) up MSD+ y/y
DynamicsEnd market dynamics: departures-a)
• Recovery momentum on improved fundamentals and market indicators:
• ~2/3 of GE/CFM departures concentrated in improving regions: China, NAM, Europe
• Strong market recovery in narrow-body fleets … green-time impact decreasing vs. 1H’21
• SV-d) volume continues to improve … anticipating 4Q SVs up ~30+% y/y
• SV-d) scope uptick in 3Q … tracking to be flat q/q in 4Q, but monitoring MRO buying behavior
• Commercial Engines: Aligned to production rates … monitoring supply chain impact
• Military: expect supply chain challenges through mid-’22… expect ‘21 revenue down
• Cost actions: $0.5B incremental impact in ‘21 … total $0.5B in structural cost out since ‘19
• Expect sequential margin expansion in 4Q … LDD margins for '21
• Aircraft delivery payments (AD&A): expect ‘21 flow of ~$0.3B, ~$0.7B better vs. initial
outlook … higher ‘22 aircraft deliveries driving expected ~$(1.2)B flow in '22
1Q’214Q’203Q’202Q’201Q’20 2Q’21 3Q’21 Oct
GE / CFM total GE / CFM domestic GE / CFM int’l
GE/CFM departures
~(23)% compared to
same week in 2019-b)
◦ ~18% of GE/CFM fleet parked-c)
◦ Freight up 34%-b)
◦ 3Q departures impacted by Delta variant;
expecting 4Q improvement as travel restrictions
lift … China ~(11)%, North America ~(9)%,
Europe ~(34)%; APAC lagging ~(52)%
(a – Source: FlightAware; rolling 7 day average vs. same week in 2019(b – As of Oct 20th
(c – As of October 21st
(d – World Wide Shop Visits ex-LEAP

Liquidity & Debt update
* Non-GAAP Financial Measure(a – Excludes discontinued operations cash and Insurance cash of $1.2B at 3Q'21 and $1.6B at 2Q’21(b – Consolidated debt of $62.9B in 3Q’21 and $63.5B in 2Q’21, after intercompany eliminations of $(0.2)B in 3Q’21 and $(0.1)B in 2Q’21
GE Industrial cash balance walk GE Capital cash balance walk
14
Other borrowings
$0.1, FX $(0.2)
GE Industrial debt balance walk-b)
MTM $(0.2), FX $(0.3)
GE Capital debt balance walk-b)
($ in billions)
Beginning balance – 2Q’21 $15.6
GE Industrial FCF* 1.7
Discontinued factoring (0.4)
BKR proceeds 1.3
Other borrowings 0.1
Other (0.3)
Ending balance – 3Q’21 $18.0
Beginning balance – 2Q’21 $18.8
Other (0.1)
Ending balance – 3Q’21 $18.7
Beginning balance – 2Q’21-a) $6.9
Business operations / other 0.1
Contractual debt maturities (0.0)
Other 0.0
Ending balance – 3Q’21-a) $7.0
Beginning balance – 2Q’21 $44.9
Contractual debt maturities (0.0)
Other (0.5)
Ending balance – 3Q’21 $44.4

$1.8-b)YTD maturities
$46.1B long term debt maturities
outstanding as of September 30, 2021-a)
YTD maturities -
GE Industrial GE Capital
$14.7B long term debt maturities
outstanding as of September 30, 2021-a)
(a – Principal amount outstanding on publicly traded long-term debt(b – 1Q’21 maturities $0.9B, 2Q'21 maturities $0.9B, 3Q'21 maturities $0.0B
15
Maturity profile($ in billions)

Orders - supplemental information
3Q'21y/y
(org.)3Q'21 YTD
y/y (org.)
3Q'21y/y
(org.)3Q'21 YTD
y/y (org.)
3Q'21y/y
(org.)3Q'21 YTD
y/y (org.)
Aviation $2.8 F $6.8 25% $4.1 40% $11.1 13% $6.9 70% $17.9 17%
Healthcare $2.9 33% $8.0 15% $2.1 4% $6.2 8% $5.0 19% $14.3 12%
Renewable Energy
$6.0 71% $11.0 27% $0.6 27% $2.3 60% $6.6 65% $13.3 31%
Power $0.9 8% $3.3 18% $2.7 6% $8.8 14% $3.7 6% $12.1 15%
GE Industrial
$12.5 65% $28.9 25% $9.6 20% $28.4 14% $22.1 42% $57.3 19%
Equipment orders Service orders
($ in billions)
Total orders
16

Orders - supplemental information, units
(a - LEAP engines are a subset of commercial engines(b - Includes Onshore and Offshore units(c - Gigawatts reported associated with orders in the periods presented(d - Heavy-Duty Gas Turbines and Aeroderivatives are subsets of GE Gas Turbines(e - HA-Turbines are a subset of Heavy-Duty Gas Turbines
(in units)
17
3Q'21 3Q'20 3Q'21 YTD 3Q'20 YTD
Aviation
Commercial Engines 418 94 1,271 336
LEAP Engines-a) 287 16 866 46
Military Engines 389 116 668 851
Renewable Energy
Wind Turbines-b) 1,089 953 2,215 2,336
Wind Turbine Gigawatts-b),-c) 5.3 3.3 9.0 7.8
Repower units 175 75 645 199
Power
GE Gas Turbines 31 17 96 32
Heavy-Duty Gas Turbines-d) 21 15 43 23
HA-Turbines-e) 0 3 6 5
Aeroderivatives-d) 10 2 53 9
GE Gas Turbine Gigawatts-c) 2.5 3.4 8.3 6.0

Non-GAAP reconciliations
18
• Aviation Commercial Services & Engines organic revenues
• Healthcare Systems & PDx organic revenues
• GE Industrial free cash flow (FCF) & GE Industrial rebaselined FCF (incl. and excl. BP)
• Gas Power equipment & service organic revenues
• Adjusted Corporate cost

19
Non-GAAP reconciliation: Aviation Commercial Services &
Engines organic revenues
* Non-GAAP Financial Measure
We believe that these measures provide management and investors with a more complete understanding of underlying operating results and trends of established, ongoing operations by excluding the
effect of acquisitions, dispositions and foreign currency, as these activities can obscure underlying trends. We also believe that presenting organic revenues* and organic profit* separately for our
industrial businesses provides management and investors with useful information about the trends of our industrial businesses and enables a more direct comparison to other non-financial companies.
AVIATION COMMERCIAL SERVICES ORGANIC REVENUES (NON-GAAP)
(Dollars in millions) 3Q'21 3Q'20 V% 3Q'21 YTD 3Q'20 YTD V%
Aviation commercial services revenues (GAAP) $ 2,385 $ 1,631 46 % $ 6,132 $ 6,095 1 %
Adjustments:
Less: acquisitions — — — —
Less: business dispositions — — — —
Less: foreign currency effect — — — —
Aviation commercial services organic revenues (Non-GAAP) $ 2,385 $ 1,631 46 % $ 6,132 $ 6,095 1 %
AVIATION COMMERCIAL ENGINES ORGANIC REVENUES (NON-GAAP)
(Dollars in millions) 3Q'21 3Q'20 V% 3Q'21 YTD 3Q'20 YTD V%
Aviation commercial engines revenues (GAAP) $ 1,217 $ 1,456 (16)% $ 3,940 $ 4,623 (15)%
Adjustments:
Less: acquisitions — — — —
Less: business dispositions — — — —
Less: foreign currency effect — — — —
Aviation commercial engines organic revenues (Non-GAAP) $ 1,217 $ 1,456 (16)% $ 3,940 $ 4,623 (15)%
20
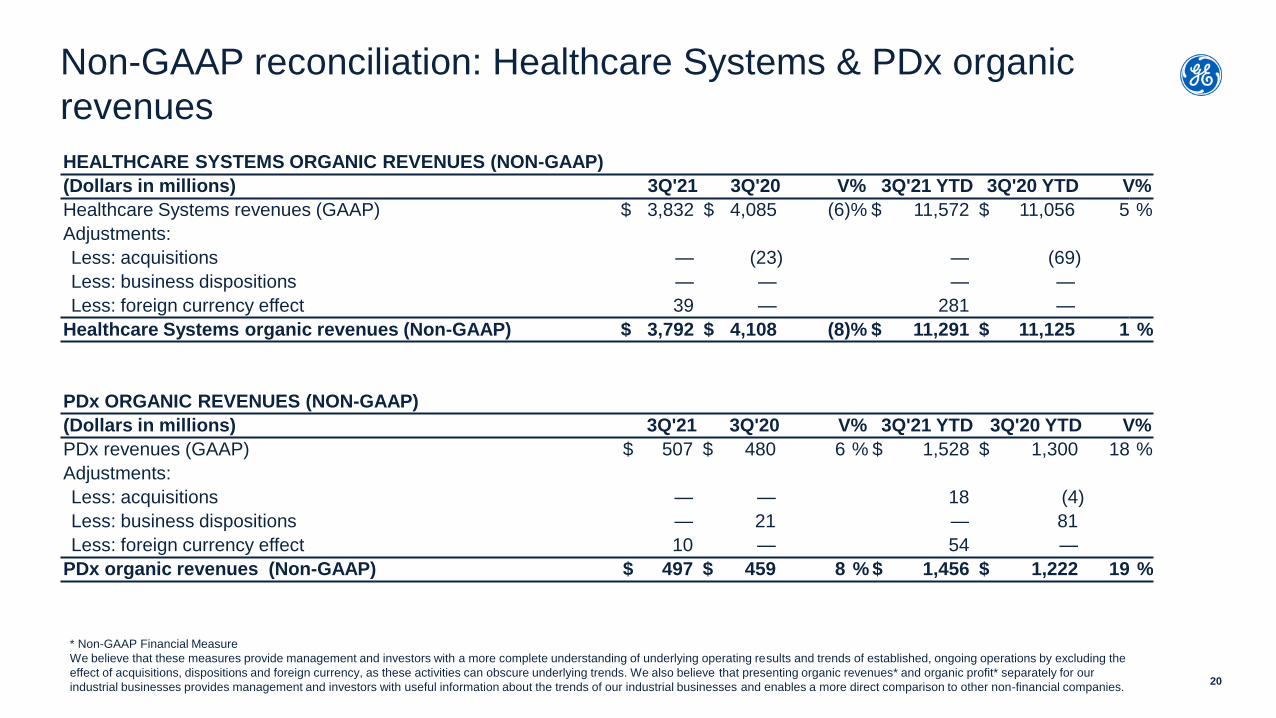
Non-GAAP reconciliation: Healthcare Systems & PDx organic
revenues
* Non-GAAP Financial Measure
We believe that these measures provide management and investors with a more complete understanding of underlying operating results and trends of established, ongoing operations by excluding the
effect of acquisitions, dispositions and foreign currency, as these activities can obscure underlying trends. We also believe that presenting organic revenues* and organic profit* separately for our
industrial businesses provides management and investors with useful information about the trends of our industrial businesses and enables a more direct comparison to other non-financial companies.
HEALTHCARE SYSTEMS ORGANIC REVENUES (NON-GAAP)
(Dollars in millions) 3Q'21 3Q'20 V% 3Q'21 YTD 3Q'20 YTD V%
Healthcare Systems revenues (GAAP) $ 3,832 $ 4,085 (6)% $ 11,572 $ 11,056 5 %
Adjustments:
Less: acquisitions — (23) — (69)
Less: business dispositions — — — —
Less: foreign currency effect 39 — 281 —
Healthcare Systems organic revenues (Non-GAAP) $ 3,792 $ 4,108 (8)% $ 11,291 $ 11,125 1 %
PDx ORGANIC REVENUES (NON-GAAP)
(Dollars in millions) 3Q'21 3Q'20 V% 3Q'21 YTD 3Q'20 YTD V%
PDx revenues (GAAP) $ 507 $ 480 6 % $ 1,528 $ 1,300 18 %
Adjustments:
Less: acquisitions — — 18 (4)
Less: business dispositions — 21 — 81
Less: foreign currency effect 10 — 54 —
PDx organic revenues (Non-GAAP) $ 497 $ 459 8 % $ 1,456 $ 1,222 19 %

21
Non-GAAP reconciliation: GE Industrial free cash flows (FCF), GE
Industrial rebaselined FCF (including and excluding BioPharma)
GE INDUSTRIAL FREE CASH FLOWS (FCF) (NON-GAAP)
(Dollars in millions) 3Q'21 3Q'20 V$ 3Q'21 YTD 3Q'20 YTD V$
GE Industrial CFOA (GAAP) $ 1,690 $ 90 $ 1,600 $ (832) $ (3,175) $ 2,343
Add: gross additions to property, plant and equipment (297) (300) 3 (896) (1,302) 407
Add: gross additions to internal-use software (28) (26) (2) (76) (121) 45
Less: CFOA impact from factoring programs discontinued as of April 1, 2021-a) (362) — (362) (3,067) — (3,067)
Less: taxes related to business sales — (749) 749 (6) (837) 831
GE Industrial free cash flows (Non-GAAP) $ 1,727 $ 514 $ 1,213 $ 1,270 $ (3,761) $ 5,031
Less: prior period CFOA impact from factoring programs discontinued as of April 1, 2021-a) — 613 (613) (765) (1,022) 257
GE Industrial rebaselined free cash flows (Non-GAAP) $ 1,727 $ (100) $ 1,826 $ 2,035 $ (2,740) $ 4,774
Less: BioPharma CFOA — — — — 315 (315)
Less: BioPharma gross additions to property, plant and equipment — — — — (17) 17
Less: BioPharma gross additions to internal-use software — — — — (2) 2
GE Industrial rebaselined free cash flows excluding BioPharma (Non-GAAP)
$ 1,727 $ (100) $ 1,826 $ 2,035 $ (3,035) $ 5,070
(a – Represents the CFOA impact from cash that GE Industrial would have otherwise collected had customer receivables not been previously sold in factoring programs that have now been discontinued.
* Non-GAAP Financial Measure
We believe investors may find it useful to compare GE’s Industrial free cash flows* performance without the effects of cash used for taxes related to business sales and the factoring program
discontinuation. We believe this measure will better allow management and investors to evaluate the capacity of our industrial operations to generate free cash flows.

22
Non-GAAP reconciliation: Gas Power equipment & service
organic revenues
* Non-GAAP Financial Measure
We believe that these measures provide management and investors with a more complete understanding of underlying operating results and trends of established, ongoing operations by excluding the
effect of acquisitions, dispositions and foreign currency, as these activities can obscure underlying trends. We also believe that presenting organic revenues* and organic profit* separately for our
industrial businesses provides management and investors with useful information about the trends of our industrial businesses and enables a more direct comparison to other non-financial companies.
GAS POWER ORGANIC EQUIPMENT REVENUES (NON-GAAP)
(Dollars in millions) 3Q'21 3Q'20 V% 3Q'21 YTD 3Q'20 YTD V%
Gas Power equipment revenues (GAAP) $ 915 $ 1,160 (21)% $ 2,370 $ 3,360 (29)%
Adjustments:
Less: acquisitions — — — —
Less: business dispositions — — — —
Less: foreign currency effect 3 — 30 —
Gas Power organic equipment revenues (Non-GAAP) $ 913 $ 1,160 (21)% $ 2,341 $ 3,360 (30)%
GAS POWER ORGANIC SERVICE REVENUES (NON-GAAP)
(Dollars in millions) 3Q'21 3Q'20 V% 3Q'21 YTD 3Q'20 YTD V%
Gas Power service revenues (GAAP) $ 1,945 $ 1,780 9 % $ 6,369 $ 5,516 15 %
Adjustments:
Less: acquisitions — — — —
Less: business dispositions — — — —
Less: foreign currency effect 2 — 35 —
Gas Power organic service revenues (Non-GAAP) $ 1,943 $ 1,780 9 % $ 6,334 $ 5,516 15 %

Non-GAAP reconciliation: 2021 Adjusted Corporate cost
2021 Adjusted total Corporate operating costs: We cannot provide a reconciliation of the differences between the non-GAAP
expectations and corresponding GAAP measure for adjusted total corporate operating costs* in 2021 without unreasonable effort due
to the uncertainty of timing of any gains or losses related to acquisitions & dispositions, the timing and magnitude of the financial impact
related to the mark-to-market of our remaining investment in Baker Hughes, and the timing and magnitude of restructuring expenses.
Although we have attempted to estimate the amount of gains and restructuring charges for the purpose of explaining the probable
significance of these components, this calculation involves a number of unknown variables, resulting in a GAAP range that we believe
is too large and variable to be meaningful.
23

Upcoming calendar
24
4Q’21 earnings January 25, 2022