
GE Capital Fourth quarter 2013 supplement - GE.com
35
GE Capital Fourth quarter 2013 supplement Results are unaudited. This document contains “forward-looking statements” – that is, statements related to future, not past, events. In this context, forward-looking statements often address our expected future business and financial performance and financial condition, and often contain words such as “expect,” “anticipate,” “intend,” “plan,” “believe,” “seek,” “see,” or “will.” Forward-looking statements by their nature address matters that are, to different degrees, uncertain. For us, particular uncertainties that could cause our actual results to be materially different than those expressed in our forward-looking statements include: current economic and financial conditions, including volatility in interest and exchange rates, equity prices and the value of financial assets; potential market disruptions or other impacts arising in the United States or Europe from developments in sovereign debt situations; the impact of conditions in the financial and credit markets on the availability and cost of our funding and on our ability to reduce our asset levels as planned; the impact of conditions in the housing market and unemployment rates on the level of commercial and consumer credit defaults; changes in Japanese consumer behavior that may affect our estimates of liability for excess interest refund claims (GE Money Japan); pending and future mortgage securitization claims and litigation in connection with WMC, which may affect our estimates of liability, including possible loss estimates; our ability to maintain our current credit rating and the impact on our funding costs and competitive position if we do not do so; our ability to pay dividends to GE at the planned level; the level of demand and financial performance of the major industries GE serves, including, without limitation, air transportation, energy generation, real estate and healthcare; the impact of regulation and regulatory, investigative and legal proceedings and legal compliance risks, including the impact of financial services regulation; our success in completing announced transactions and integrating acquired businesses; our ability to complete the staged exit from our North American Retail Finance business as planned; the impact of potential information technology or data security breaches; and numerous other matters of national, regional and global scale, including those of a political, economic, business and competitive nature. These uncertainties may cause our actual future results to be materially different than those expressed in our forward-looking statements. We do not undertake to update our forward-looking statements. This document may also contain non-GAAP financial information. Management uses this information in its internal analysis of results and believes that this information may be informative to investors in gauging the quality of our financial performance, identifying trends in our results and providing meaningful period-to-period comparisons. Prior period amounts have been recast for discontinued operations.
Transcript of GE Capital Fourth quarter 2013 supplement - GE.com

GE Capital Fourth quarter 2013 supplement
Results are unaudited. This document contains “forward-looking statements” – that is, statements related to future, not past, events. In this context, forward-looking statements often address our expected future business and financial performance and financial condition, and often contain words such as “expect,” “anticipate,” “intend,” “plan,” “believe,” “seek,” “see,” or “will.” Forward-looking statements by their nature address matters that are, to different degrees, uncertain. For us, particular uncertainties that could cause our actual results to be materially different than those expressed in our forward-looking statements include: current economic and financial conditions, including volatility in interest and exchange rates, equity prices and the value of financial assets; potential market disruptions or other impacts arising in the United States or Europe from developments in sovereign debt situations; the impact of conditions in the financial and credit markets on the availability and cost of our funding and on our ability to reduce our asset levels as planned; the impact of conditions in the housing market and unemployment rates on the level of commercial and consumer credit defaults; changes in Japanese consumer behavior that may affect our estimates of liability for excess interest refund claims (GE Money Japan); pending and future mortgage securitization claims and litigation in connection with WMC, which may affect our estimates of liability, including possible loss estimates; our ability to maintain our current credit rating and the impact on our funding costs and competitive position if we do not do so; our ability to pay dividends to GE at the planned level; the level of demand and financial performance of the major industries GE serves, including, without limitation, air transportation, energy generation, real estate and healthcare; the impact of regulation and regulatory, investigative and legal proceedings and legal compliance risks, including the impact of financial services regulation; our success in completing announced transactions and integrating acquired businesses; our ability to complete the staged exit from our North American Retail Finance business as planned; the impact of potential information technology or data security breaches; and numerous other matters of national, regional and global scale, including those of a political, economic, business and competitive nature. These uncertainties may cause our actual future results to be materially different than those expressed in our forward-looking statements. We do not undertake to update our forward-looking statements.
This document may also contain non-GAAP financial information. Management uses this information in its internal analysis of results and believes that this information may be informative to investors in gauging the quality of our financial performance, identifying trends in our results and providing meaningful period-to-period comparisons.
Prior period amounts have been recast for discontinued operations.
Fourth quarter 2013 supplemental information
Table of Contents Page #
1. GE Capital Structure
a) GE Capital Structure 3
2. Financial Statements
a) GE Capital – Condensed Statement of Earnings 5
b) GE Capital – Condensed Statement of Comprehensive Income
c) GE Capital – Condensed Statement of Changes in Shareowners’ Equity
6
6
d) GE Capital – Condensed Statement of Financial Position 7
e) GE Capital – Continuing Operations 8
3. GE Capital Asset Quality
a) Assets by Region 10
b) Assets in Selected Emerging Markets 11
c) Portfolio Overview and Ratios 12-18
d) Nonearning and Nonaccrual Financing Receivables 19
e) Consumer Allowance for Losses on Financing Receivables 20
f) Consumer Financing Receivables by Region 21
g) Consumer Mortgage Portfolio by Country 22
h) Commercial Allowance for Losses on Financing Receivables 23
i) Real Estate Allowance for Losses on Financing Receivables 24
j) Commercial Real Estate Debt and Equity Overview 25-26
k) Equipment Leased to Others Overview 27
l) Commercial Aircraft Asset Details 28
4. GE Capital Other Key Areas
a) Investment Securities 30
b) Investments measured at Fair Value in Earnings 31
c) Net Interest Margin 32
5. Appendix
a) Glossary 34-35
(3)
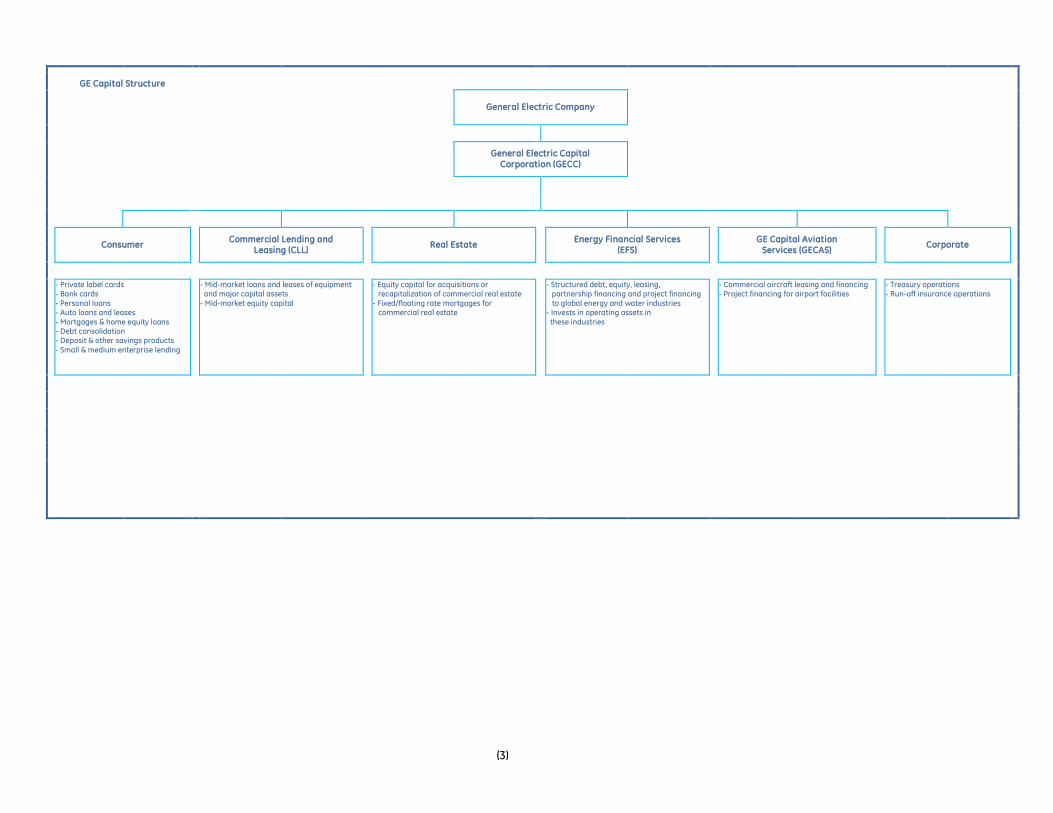
GE Capital Structure
General Electric Company
General Electric Capital Corporation (GECC)
Consumer
Commercial Lending and Leasing (CLL)
Real Estate
Energy Financial Services (EFS)
GE Capital Aviation Services (GECAS)
Corporate
- Private label cards - Bank cards - Personal loans - Auto loans and leases - Mortgages & home equity loans - Debt consolidation - Deposit & other savings products - Small & medium enterprise lending
- Mid-market loans and leases of equipment and major capital assets - Mid-market equity capital
- Equity capital for acquisitions or recapitalization of commercial real estate - Fixed/floating rate mortgages for commercial real estate
- Structured debt, equity, leasing, partnership financing and project financing to global energy and water industries - Invests in operating assets in these industries
- Commercial aircraft leasing and financing - Project financing for airport facilities
- Treasury operations - Run-off insurance operations

(4)
Financial Statements
(5)
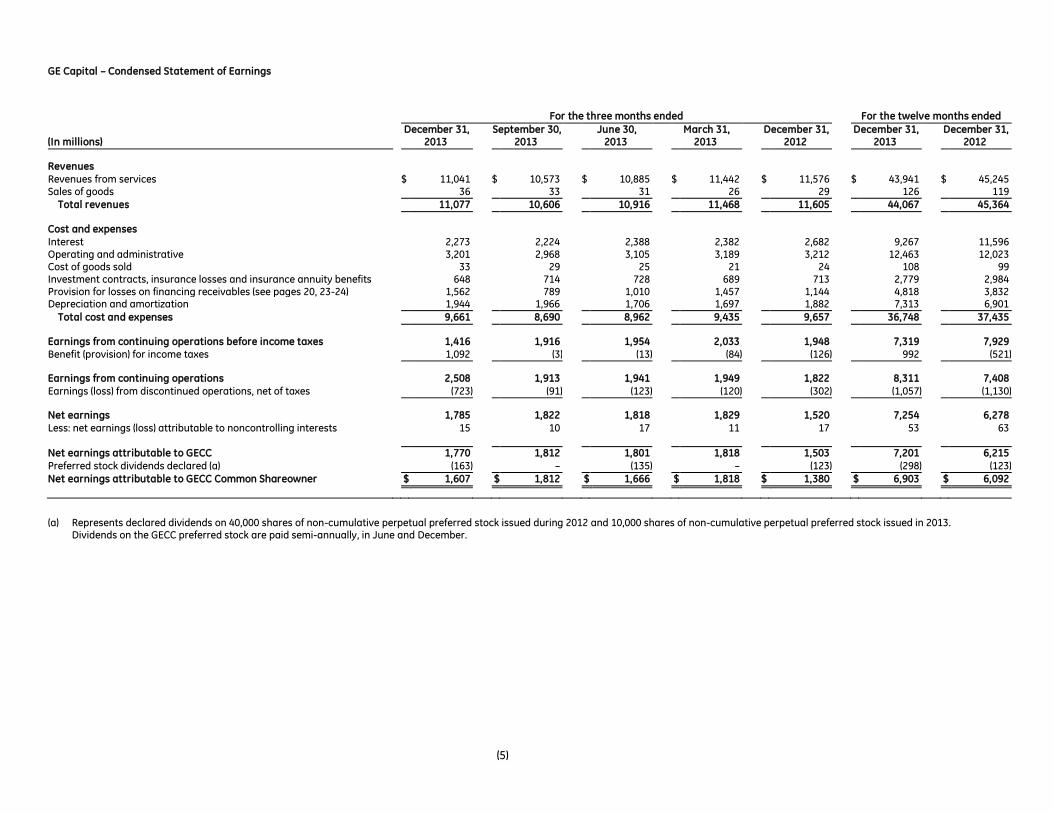
GE Capital – Condensed Statement of Earnings
For the three months ended For the twelve months ended
December 31, September 30, June 30, March 31, December 31, December 31, December 31, (In millions) 2013 2013 2013 2013 2012 2013 2012
Revenues Revenues from services $ 11,041 $ 10,573 $ 10,885 $ 11,442 $ 11,576 $ 43,941 $ 45,245 Sales of goods 36 33 31 26 29 126 119
Total revenues 11,077 10,606 10,916 11,468 11,605 44,067 45,364
Cost and expenses Interest 2,273 2,224 2,388 2,382 2,682 9,267 11,596 Operating and administrative 3,201 2,968 3,105 3,189 3,212 12,463 12,023 Cost of goods sold 33 29 25 21 24 108 99 Investment contracts, insurance losses and insurance annuity benefits 648 714 728 689 713 2,779 2,984 Provision for losses on financing receivables (see pages 20, 23-24) 1,562 789 1,010 1,457 1,144 4,818 3,832 Depreciation and amortization 1,944 1,966 1,706 1,697 1,882 7,313 6,901
Total cost and expenses 9,661 8,690 8,962 9,435 9,657 36,748 37,435
Earnings from continuing operations before income taxes 1,416 1,916 1,954 2,033 1,948 7,319 7,929 Benefit (provision) for income taxes 1,092 (3) (13) (84) (126) 992 (521)
Earnings from continuing operations 2,508 1,913 1,941 1,949 1,822 8,311 7,408
Earnings (loss) from discontinued operations, net of taxes (723) (91) (123) (120) (302) (1,057) (1,130)
Net earnings 1,785 1,822 1,818 1,829 1,520 7,254 6,278
Less: net earnings (loss) attributable to noncontrolling interests 15 10 17 11 17 53 63 Net earnings attributable to GECC 1,770 1,812 1,801 1,818 1,503 7,201 6,215
Preferred stock dividends declared (a) (163) – (135) – (123) (298) (123)
Net earnings attributable to GECC Common Shareowner $ 1,607 $ 1,812 $ 1,666 $ 1,818 $ 1,380 $ 6,903 $ 6,092
(a) Represents declared dividends on 40,000 shares of non-cumulative perpetual preferred stock issued during 2012 and 10,000 shares of non-cumulative perpetual preferred stock issued in 2013.
Dividends on the GECC preferred stock are paid semi-annually, in June and December.

(6)
GE Capital – Condensed Statement of Comprehensive Income
For the three months ended For the twelve months ended
December 31, September 30, June 30, March 31, December 31, December 31, December 31, (In millions) 2013 2013 2013 2013 2012 2013 2012
Net earnings $ 1,785 $ 1,822 $ 1,818 $ 1,829 $ 1,520 $ 7,254 $ 6,278 Less: net earnings (loss) attributable to noncontrolling interests 15 10 17 11 17 53 63
Net earnings attributable to GECC 1,770 1,812 1,801 1,818 1,503 7,201 6,215
Other comprehensive income (loss) Investment securities $ 8 $ 159 $ (602) $ 66 $ 71 $ (369) $ 707 Currency translation adjustments (469) (122) (1) 8 25 (584) 280 Cash flow hedges 106 63 194 92 215 455 354 Benefit plans 343 8 9 13 (157) 373 (173)
Other comprehensive income (loss) (12) 108 (400) 179 154 (125) 1,168
Less: other comprehensive income (loss) attributable to noncontrolling interests – 12 (19) (3) 11 (10) 12
Other comprehensive income (loss) attributable to GECC $ (12) $ 96 $ (381) $ 182 $ 143 $ (115) $ 1,156
Comprehensive income 1,773 1,930 1,418 2,008 1,674 7,129 7,446 Less: comprehensive income (loss) attributable to noncontrolling interests 15 22 (2) 8 28 43 75
Comprehensive income attributable to GECC $ 1,758 $ 1,908 $ 1,420 $ 2,000 $ 1,646 $ 7,086 $ 7,371
GE Capital – Condensed Statement of Changes in Shareowners’ Equity
For the three months ended For the twelve months ended
December 31, September 30, June 30, March 31, December 31, December 31, December 31, (In millions) 2013 2013 2013 2013 2012 2013 2012
GECC shareowners' equity balance at beginning of period $ 84,114 $ 84,211 $ 83,882 $ 81,890 $ 81,349 $ 81,890 $ 77,110 Increases from net earnings attributable to GECC 1,770 1,812 1,801 1,818 1,503 7,201 6,215 Dividends and other transactions with shareowners (a) (2,200) (2,000) (2,082) - (1,102) (6,282) (6,549) Other comprehensive income (loss) attributable to GECC (12) 96 (381) 182 143 (115) 1,156 Changes in additional paid-in capital (1) (5) 991 (8) (3) 977 3,958 Ending balance $ 83,671 $ 84,114 $ 84,211 $ 83,882 $ 81,890 $ 83,671 $ 81,890
Noncontrolling interests 432 539 550 587 707 432 707
Total equity balance at end of period $ 84,103 $ 84,653 $ 84,761 $ 84,469 $ 82,597 $ 84,103 $ 82,597
(a) Dividends to GE (2,038) (2,000) (1,947) – (980) (5,985) (6,426) Dividends on preferred stock (163) – (135) – (123) (298) (123)
(7)
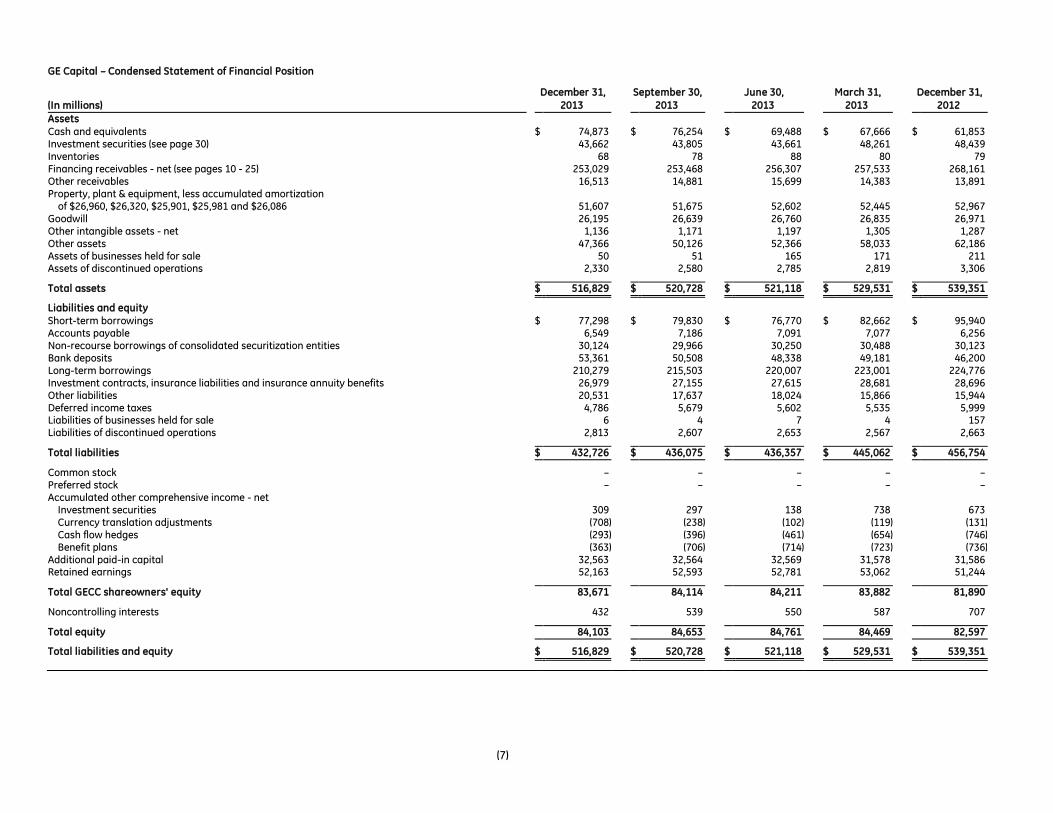
GE Capital – Condensed Statement of Financial Position
December 31, September 30, June 30, March 31, December 31,
(In millions) 2013 2013 2013 2013 2012
Assets Cash and equivalents $ 74,873 $ 76,254 $ 69,488 $ 67,666 $ 61,853 Investment securities (see page 30) 43,662 43,805 43,661 48,261 48,439 Inventories 68 78 88 80 79 Financing receivables - net (see pages 10 - 25) 253,029 253,468 256,307 257,533 268,161 Other receivables 16,513 14,881 15,699 14,383 13,891 Property, plant & equipment, less accumulated amortization of $26,960, $26,320, $25,901, $25,981 and $26,086 51,607 51,675 52,602 52,445 52,967 Goodwill 26,195 26,639 26,760 26,835 26,971 Other intangible assets - net 1,136 1,171 1,197 1,305 1,287 Other assets 47,366 50,126 52,366 58,033 62,186 Assets of businesses held for sale 50 51 165 171 211 Assets of discontinued operations 2,330 2,580 2,785 2,819 3,306 Total assets $ 516,829 $ 520,728 $ 521,118 $ 529,531 $ 539,351
Liabilities and equity Short-term borrowings $ 77,298 $ 79,830 $ 76,770 $ 82,662 $ 95,940 Accounts payable 6,549 7,186 7,091 7,077 6,256 Non-recourse borrowings of consolidated securitization entities 30,124 29,966 30,250 30,488 30,123 Bank deposits 53,361 50,508 48,338 49,181 46,200 Long-term borrowings 210,279 215,503 220,007 223,001 224,776 Investment contracts, insurance liabilities and insurance annuity benefits 26,979 27,155 27,615 28,681 28,696 Other liabilities 20,531 17,637 18,024 15,866 15,944 Deferred income taxes 4,786 5,679 5,602 5,535 5,999 Liabilities of businesses held for sale 6 4 7 4 157 Liabilities of discontinued operations 2,813 2,607 2,653 2,567 2,663 Total liabilities $ 432,726 $ 436,075 $ 436,357 $ 445,062 $ 456,754
Common stock – – – – – Preferred stock – – – – – Accumulated other comprehensive income - net Investment securities 309 297 138 738 673 Currency translation adjustments (708) (238) (102) (119) (131) Cash flow hedges (293) (396) (461) (654) (746) Benefit plans (363) (706) (714) (723) (736) Additional paid-in capital 32,563 32,564 32,569 31,578 31,586 Retained earnings 52,163 52,593 52,781 53,062 51,244 Total GECC shareowners' equity 83,671 84,114 84,211 83,882 81,890 Noncontrolling interests 432 539 550 587 707 Total equity 84,103 84,653 84,761 84,469 82,597
Total liabilities and equity $ 516,829 $ 520,728 $ 521,118 $ 529,531 $ 539,351
(8)
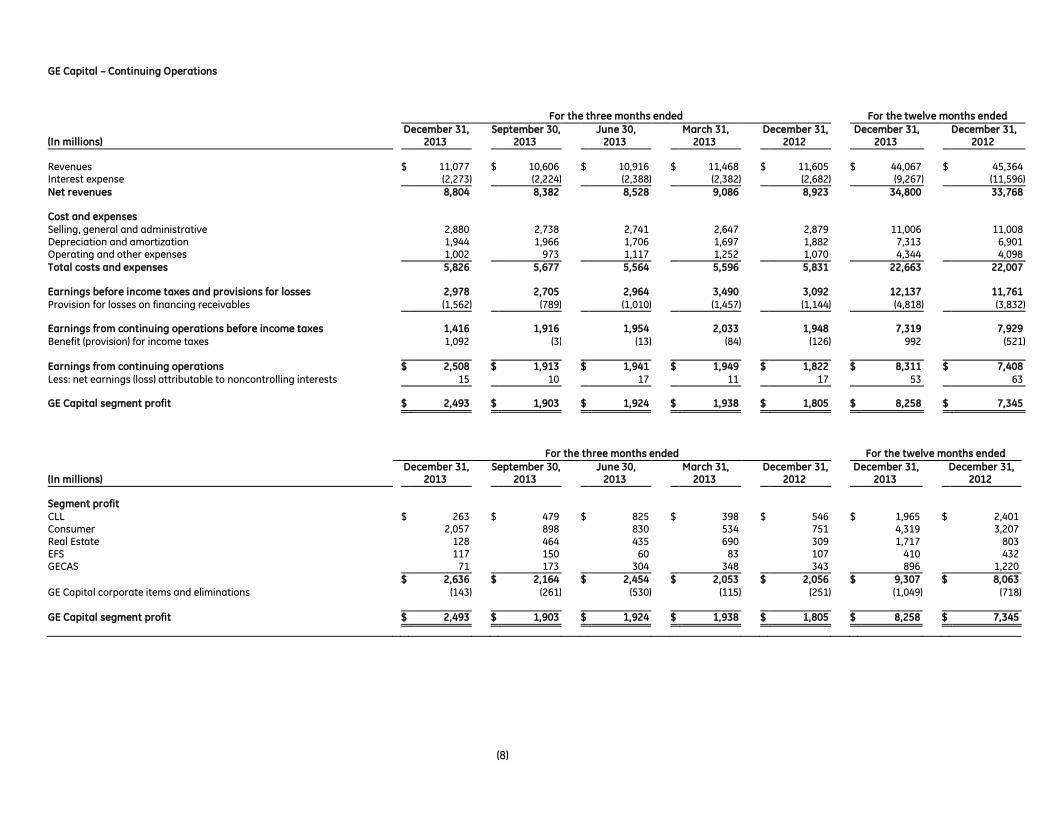
GE Capital – Continuing Operations
For the three months ended For the twelve months ended
December 31, September 30, June 30, March 31, December 31, December 31, December 31, (In millions) 2013 2013 2013 2013 2012 2013 2012
Revenues $ 11,077 $ 10,606 $ 10,916 $ 11,468 $ 11,605 $ 44,067 $ 45,364 Interest expense (2,273) (2,224) (2,388) (2,382) (2,682) (9,267) (11,596)
Net revenues 8,804 8,382 8,528 9,086 8,923 34,800 33,768 Cost and expenses Selling, general and administrative 2,880 2,738 2,741 2,647 2,879 11,006 11,008 Depreciation and amortization 1,944 1,966 1,706 1,697 1,882 7,313 6,901 Operating and other expenses 1,002 973 1,117 1,252 1,070 4,344 4,098
Total costs and expenses 5,826 5,677 5,564 5,596 5,831 22,663 22,007 Earnings before income taxes and provisions for losses 2,978 2,705 2,964 3,490 3,092 12,137 11,761
Provision for losses on financing receivables (1,562) (789) (1,010) (1,457) (1,144) (4,818) (3,832)
Earnings from continuing operations before income taxes 1,416 1,916 1,954 2,033 1,948 7,319 7,929
Benefit (provision) for income taxes 1,092 (3) (13) (84) (126) 992 (521) Earnings from continuing operations $ 2,508 $ 1,913 $ 1,941 $ 1,949 $ 1,822 $ 8,311 $ 7,408
Less: net earnings (loss) attributable to noncontrolling interests 15 10 17 11 17 53 63
GE Capital segment profit $ 2,493 $ 1,903 $ 1,924 $ 1,938 $ 1,805 $ 8,258 $ 7,345
For the three months ended For the twelve months ended
December 31, September 30, June 30, March 31, December 31, December 31, December 31, (In millions) 2013 2013 2013 2013 2012 2013 2012
Segment profit CLL $ 263 $ 479 $ 825 $ 398 $ 546 $ 1,965 $ 2,401 Consumer 2,057 898 830 534 751 4,319 3,207 Real Estate 128 464 435 690 309 1,717 803 EFS 117 150 60 83 107 410 432 GECAS 71 173 304 348 343 896 1,220
$ 2,636 $ 2,164 $ 2,454 $ 2,053 $ 2,056 $ 9,307 $ 8,063
GE Capital corporate items and eliminations (143) (261) (530) (115) (251) (1,049) (718) GE Capital segment profit $ 2,493 $ 1,903 $ 1,924 $ 1,938 $ 1,805 $ 8,258 $ 7,345
(9)
GE Capital Asset Quality

(10)
GE Capital – Assets by Region (a)
At
December 31, September 30, June 30, March 31, December 31, 2013 2013 2013 2013 2012
Financing Property, plant
and
(In millions) receivables (net) equipment (net) Total assets Total assets Total assets Total assets Total assets
U.S. (b) $ 131,669 $ 11,655 $ 300,482 $ 300,874 $ 296,331 $ 300,331 $ 301,359 Europe (c) Western (including U.K.) 64,761 3,817 88,032 88,197 89,571 89,125 92,374 Eastern 14,982 164 22,230 22,006 22,380 22,148 22,847 Pacific Basin 19,874 2,304 35,363 37,334 39,223 41,258 44,374 Americas (excluding U.S.) 14,793 1,327 24,497 24,518 24,669 27,014 27,303 Other (d) 6,950 32,340 43,895 45,219 46,159 46,836 47,788 Total $ 253,029 $ 51,607 $ 514,499 $ 518,148 $ 518,333 $ 526,712 $ 536,045
Total at September 30, 2013 $ 253,468 $ 51,675 $ 518,148
Total at June 30, 2013 $ 256,307 $ 52,602 $ 518,333
Total at March 31, 2013 $ 257,533 $ 52,445 $ 526,712
Total at December 31, 2012 $ 268,161 $ 52,967 $ 536,045
(a) Excludes assets of discontinued operations.
(b) Total assets include our global Treasury operations, including both U.S. and non U.S. cash equivalents.
(c) Total assets include non-financing assets (cash, goodwill and other intangible assets, property, plant and equipment and allowance for losses on financing receivables) of approximately $11,708 million at December 31, 2013.
(d) Includes total assets of $42,616 million at GECAS, approximately $11,241 million of which relates to European airlines and other investments at December 31, 2013.

(11)
GE Capital – Assets in Selected Emerging Markets (a)
At
December 31, September 30, June 30, March 31, December 31, 2013 2013 2013 2013 2012
Financing Property, plant
and
(In millions) receivables (net) equipment (net) Total assets Total assets Total assets Total assets Total assets
Eastern Europe Poland $ 7,533 $ 97 $ 11,018 $ 10,689 $ 10,854 $ 10,922 $ 11,094 Czech Republic 4,753 28 6,698 6,877 6,997 6,855 6,913 Hungary 2,690 38 4,157 4,100 4,096 3,952 4,222
Total Eastern Europe 14,976 163 21,873 21,666 21,947 21,729 22,229
Pacific Basin and Other
India 680 17 1,060 1,061 1,171 1,254 1,446
Total Pacific Basin and Other 680 17 1,060 1,061 1,171 1,254 1,446
Americas
Mexico 5,372 836 7,053 7,110 7,476 7,969 7,861
Total Americas 5,372 836 7,053 7,110 7,476 7,969 7,861
Total $ 21,028 $ 1,016 $ 29,986 $ 29,837 $ 30,594 $ 30,952 $ 31,536
Total at September 30, 2013 $ 20,928 $ 1,012 $ 29,837
Total at June 30, 2013 $ 21,349 $ 1,010 $ 30,594
Total at March 31, 2013 $ 21,644 $ 1,005 $ 30,952
Total at December 31, 2012 $ 22,437 $ 1,013 $ 31,536
(a) We have disclosed here selected emerging markets where our total assets at December 31, 2013 exceed $1 billion. Assets of discontinued operations are excluded.

(12)
GE Capital – CLL Portfolio Overview (a)
(In millions) Balances Financing receivables (b)
December 31, September 30, June 30, March 31, December 31, CLL 2013 2013 2013 2013 2012
Americas $ 68,585 $ 69,240 $ 70,499 $ 72,318 $ 72,517 Europe (c) 37,962 35,529 35,840 35,437 37,037 Asia 9,469 9,573 9,907 10,158 11,401 Other (c) 451 468 505 532 603
Total $ 116,467 $ 114,810 $ 116,751 $ 118,445 $ 121,558
Nonaccrual receivables (d)
December 31, September 30, June 30, March 31, December 31, CLL 2013 2013 2013 2013 2012
Americas $ 1,275 $ 1,655 $ 1,715 $ 1,896 $ 1,951 Europe 1,046 1,269 1,298 1,573 1,740 Asia 413 465 384 408 395 Other – – – 9 52
Total $ 2,734 $ 3,389 $ 3,397 $ 3,886 $ 4,138
Nonearning receivables (d)
December 31, September 30, June 30, March 31, December 31, CLL 2013 2013 2013 2013 2012
Americas $ 1,243 $ 1,182 $ 1,232 $ 1,401 $ 1,333 Europe 1,046 916 958 1,122 1,299 Asia 413 226 177 170 193 Other – – – 9 52
Total $ 2,702 $ 2,324 $ 2,367 $ 2,702 $ 2,877
Allowance for losses (e)
December 31, September 30, June 30, March 31, December 31, CLL 2013 2013 2013 2013 2012
Americas $ 473 $ 470 $ 480 $ 490 $ 490 Europe 415 342 329 411 445 Asia 90 75 72 72 80 Other – – – 3 6
Total $ 978 $ 887 $ 881 $ 976 $ 1,021
Write-offs (net) - for three months ending
December 31, September 30, June 30, March 31, December 31, CLL 2013 2013 2013 2013 2012 (f)
Americas $ 83 $ 34 $ 118 $ 73 $ 111 Europe 55 45 151 112 232 Asia 47 16 26 14 14 Other – – 3 – –
Total $ 185 $ 95 $ 298 $ 199 $ 357
(a) Local currency exposure includes amounts payable to the Corporation by borrowers with a country of residence other than the one in which the credit is booked.
(b) Financing receivables include impaired loans of $3,882 million at December 31, 2013.
(c) During the third quarter of 2013, we transferred the European equipment services portfolio from CLL Other to CLL Europe. Prior-period amounts were reclassified to conform to the current period presentation.
(d) During the fourth quarter of 2013, we updated our nonaccrual and nonearning policies to more closely align with industry practice, resulting in a convergence in nonearning and nonaccrual amounts. As a result, we plan to discontinue the reporting of nonearning receivables in the first quarter of 2014. Refer to the glossary for definitions of nonaccrual and nonearning receivables.
(e) For information on the determination of the allowance for losses on financing receivables, refer to page 62 of the General Electric Capital Corporation Form 10-Q for the quarterly period ended September 30, 2013.
(f) Includes write-offs resulting from the modification to our write-off policy, effective October 1, 2012, in line with regulatory guidance, where we now write off a portion of the loans against specific reserves at the earlier of transaction confirmation (e.g., foreclosure, discounted pay-off, restructuring, etc.) and not later than twelve months after initial recognition.
(13)
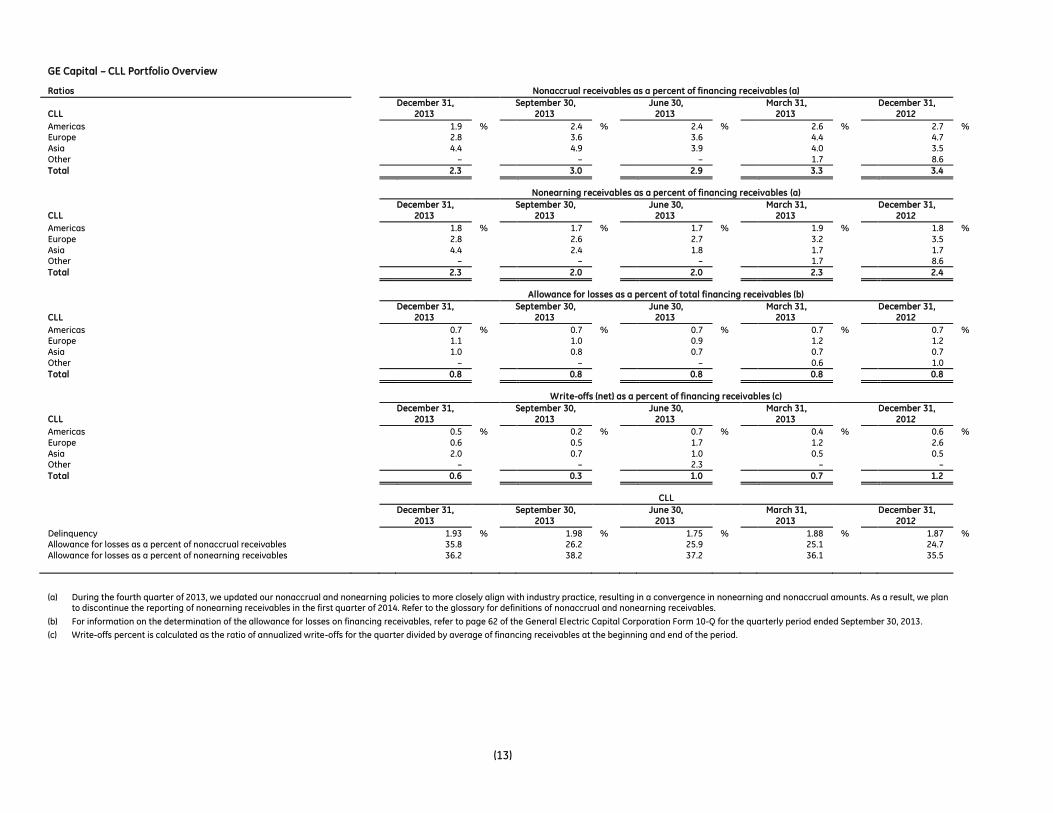
GE Capital – CLL Portfolio Overview
Ratios Nonaccrual receivables as a percent of financing receivables (a)
December 31, September 30, June 30, March 31, December 31, CLL 2013 2013 2013 2013 2012
Americas 1.9 % 2.4 % 2.4 % 2.6 % 2.7 % Europe 2.8 3.6 3.6 4.4 4.7 Asia 4.4 4.9 3.9 4.0 3.5 Other – – – 1.7 8.6
Total 2.3 3.0 2.9 3.3 3.4
Nonearning receivables as a percent of financing receivables (a)
December 31, September 30, June 30, March 31, December 31, CLL 2013 2013 2013 2013 2012
Americas 1.8 % 1.7 % 1.7 % 1.9 % 1.8 % Europe 2.8 2.6 2.7 3.2 3.5 Asia 4.4 2.4 1.8 1.7 1.7 Other – – – 1.7 8.6
Total 2.3 2.0 2.0 2.3 2.4
Allowance for losses as a percent of total financing receivables (b)
December 31, September 30, June 30, March 31, December 31, CLL 2013 2013 2013 2013 2012
Americas 0.7 % 0.7 % 0.7 % 0.7 % 0.7 % Europe 1.1 1.0 0.9 1.2 1.2 Asia 1.0 0.8 0.7 0.7 0.7 Other – – – 0.6 1.0
Total 0.8 0.8 0.8 0.8 0.8
Write-offs (net) as a percent of financing receivables (c)
December 31, September 30, June 30, March 31, December 31, CLL 2013 2013 2013 2013 2012
Americas 0.5 % 0.2 % 0.7 % 0.4 % 0.6 % Europe 0.6 0.5 1.7 1.2 2.6 Asia 2.0 0.7 1.0 0.5 0.5 Other – – 2.3 – –
Total 0.6 0.3 1.0 0.7 1.2
CLL
December 31, September 30, June 30, March 31, December 31,
2013 2013 2013 2013 2012
Delinquency 1.93 % 1.98 % 1.75 % 1.88 % 1.87 % Allowance for losses as a percent of nonaccrual receivables 35.8 26.2 25.9 25.1 24.7 Allowance for losses as a percent of nonearning receivables 36.2 38.2 37.2 36.1 35.5
(a) During the fourth quarter of 2013, we updated our nonaccrual and nonearning policies to more closely align with industry practice, resulting in a convergence in nonearning and nonaccrual amounts. As a result, we plan
to discontinue the reporting of nonearning receivables in the first quarter of 2014. Refer to the glossary for definitions of nonaccrual and nonearning receivables.
(b) For information on the determination of the allowance for losses on financing receivables, refer to page 62 of the General Electric Capital Corporation Form 10-Q for the quarterly period ended September 30, 2013.
(c) Write-offs percent is calculated as the ratio of annualized write-offs for the quarter divided by average of financing receivables at the beginning and end of the period.

(14)
GE Capital – EFS, GECAS and Commercial Other Portfolio Overview
(In millions) Balances Financing receivables (a)
December 31, September 30, June 30, March 31, December 31, 2013 2013 2013 2013 2012
EFS $ 3,107 $ 4,367 $ 4,671 $ 4,734 $ 4,851 GECAS 9,377 9,642 9,998 10,557 10,915 Other 318 393 425 456 486 Nonaccrual receivables (b)
December 31, September 30, June 30, March 31, December 31, 2013 2013 2013 2013 2012
EFS $ 4 $ 4 $ 4 $ – $ – GECAS – – – – 3 Other 6 11 12 14 25 Nonearning receivables (b)
December 31, September 30, June 30, March 31, December 31, 2013 2013 2013 2013 2012
EFS $ 4 $ 4 $ 4 $ – $ – GECAS – – – – – Other 6 – 6 13 13 Allowance for losses (c)
December 31, September 30, June 30, March 31, December 31, 2013 2013 2013 2013 2012
EFS $ 8 $ 11 $ 8 $ 8 $ 9 GECAS 17 10 11 7 8 Other 2 2 2 2 3 Write-offs (net) - for three months ending
December 31, September 30, June 30, March 31, December 31, 2013 2013 2013 2013 2012
EFS $ – $ – $ – $ – $ – GECAS – – – – 2 Other – (1) – 1 3
(a) Financing receivables include $4 million, $0 million, and $6 million of impaired loans at EFS, GECAS, and Other, respectively, at December 31, 2013.
(b) During the fourth quarter of 2013, we updated our nonaccrual and nonearning policies to more closely align with industry practice, resulting in a convergence in nonearning and nonaccrual amounts. As a result, we plan to discontinue the reporting of nonearning receivables in the first quarter of 2014. Refer to the glossary for definitions of nonaccrual and nonearning receivables.
(c) For information on the determination of the allowance for losses on financing receivables, refer to page 62 of the General Electric Capital Corporation Form 10-Q for the quarterly period ended September 30, 2013.
(15)
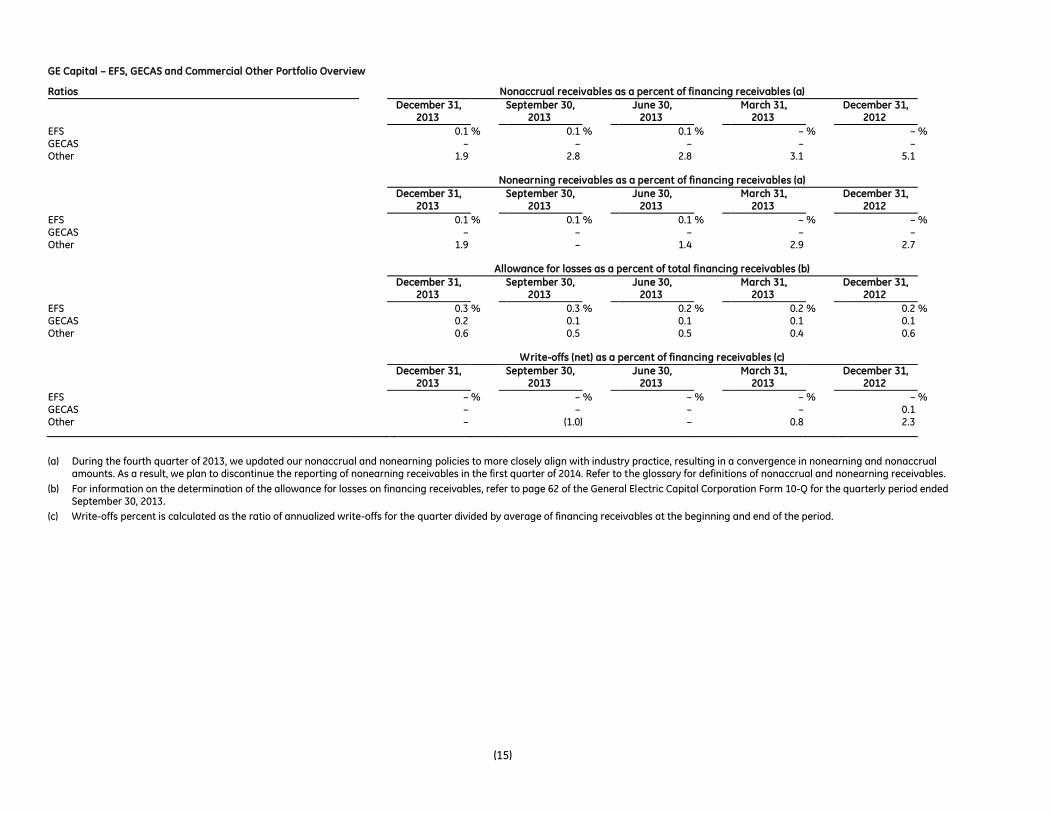
GE Capital – EFS, GECAS and Commercial Other Portfolio Overview
Ratios Nonaccrual receivables as a percent of financing receivables (a)
December 31, September 30, June 30, March 31, December 31,
2013 2013 2013 2013 2012
EFS 0.1 % 0.1 % 0.1 % – % – % GECAS – – – – – Other 1.9 2.8 2.8 3.1 5.1 Nonearning receivables as a percent of financing receivables (a)
December 31, September 30, June 30, March 31, December 31,
2013 2013 2013 2013 2012
EFS 0.1 % 0.1 % 0.1 % – % – % GECAS – – – – – Other 1.9 – 1.4 2.9 2.7 Allowance for losses as a percent of total financing receivables (b)
December 31, September 30, June 30, March 31, December 31,
2013 2013 2013 2013 2012
EFS 0.3 % 0.3 % 0.2 % 0.2 % 0.2 % GECAS 0.2 0.1 0.1 0.1 0.1 Other 0.6 0.5 0.5 0.4 0.6 Write-offs (net) as a percent of financing receivables (c)
December 31, September 30, June 30, March 31, December 31,
2013 2013 2013 2013 2012
EFS – % – % – % – % – % GECAS – – – – 0.1 Other – (1.0) – 0.8 2.3
(a) During the fourth quarter of 2013, we updated our nonaccrual and nonearning policies to more closely align with industry practice, resulting in a convergence in nonearning and nonaccrual
amounts. As a result, we plan to discontinue the reporting of nonearning receivables in the first quarter of 2014. Refer to the glossary for definitions of nonaccrual and nonearning receivables.
(b) For information on the determination of the allowance for losses on financing receivables, refer to page 62 of the General Electric Capital Corporation Form 10-Q for the quarterly period ended September 30, 2013.
(c) Write-offs percent is calculated as the ratio of annualized write-offs for the quarter divided by average of financing receivables at the beginning and end of the period.
(16)
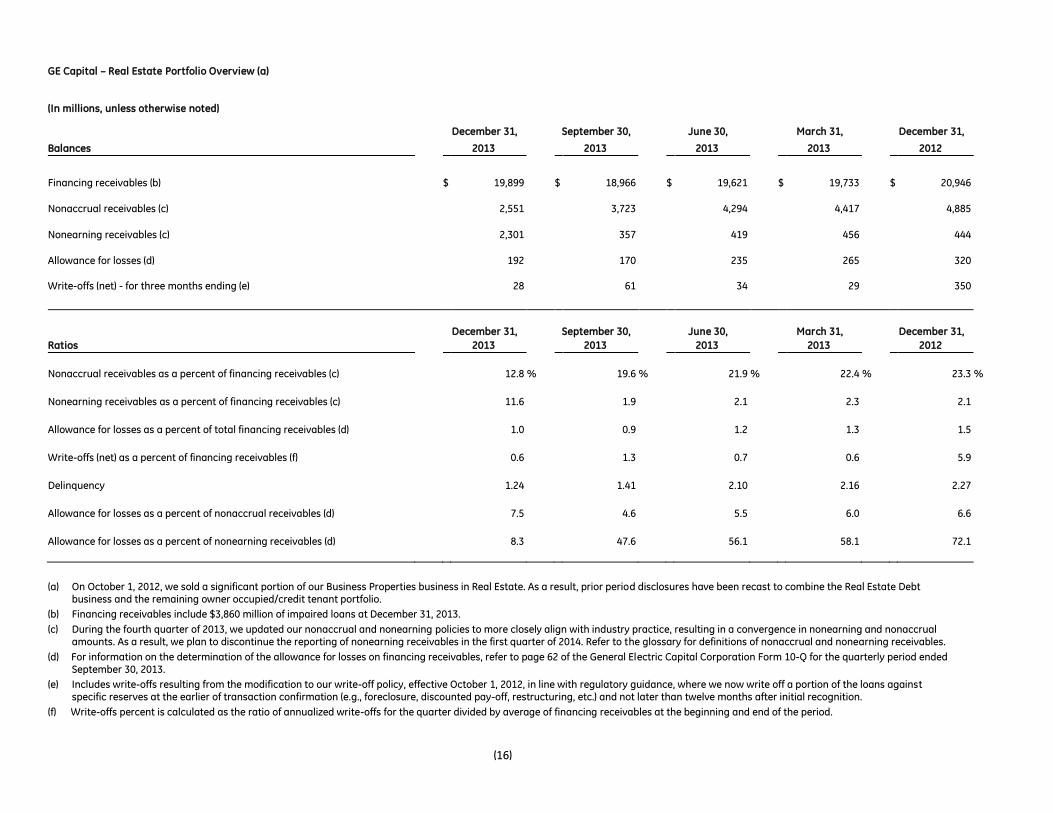
GE Capital – Real Estate Portfolio Overview (a)
(In millions, unless otherwise noted) December 31, September 30, June 30, March 31, December 31,
Balances 2013 2013 2013 2013 2012
Financing receivables (b) $ 19,899 $ 18,966 $ 19,621 $ 19,733 $ 20,946
Nonaccrual receivables (c) 2,551 3,723 4,294 4,417 4,885
Nonearning receivables (c) 2,301 357 419 456 444
Allowance for losses (d) 192 170 235 265 320
Write-offs (net) - for three months ending (e) 28 61 34 29 350
December 31, September 30, June 30, March 31, December 31,
Ratios 2013 2013 2013 2013 2012
Nonaccrual receivables as a percent of financing receivables (c) 12.8 % 19.6 % 21.9 % 22.4 % 23.3 %
Nonearning receivables as a percent of financing receivables (c) 11.6 1.9 2.1 2.3 2.1
Allowance for losses as a percent of total financing receivables (d) 1.0 0.9 1.2 1.3 1.5
Write-offs (net) as a percent of financing receivables (f) 0.6 1.3 0.7 0.6 5.9
Delinquency 1.24 1.41 2.10 2.16 2.27
Allowance for losses as a percent of nonaccrual receivables (d) 7.5 4.6 5.5 6.0 6.6
Allowance for losses as a percent of nonearning receivables (d) 8.3 47.6 56.1 58.1 72.1
(a) On October 1, 2012, we sold a significant portion of our Business Properties business in Real Estate. As a result, prior period disclosures have been recast to combine the Real Estate Debt
business and the remaining owner occupied/credit tenant portfolio.
(b) Financing receivables include $3,860 million of impaired loans at December 31, 2013.
(c) During the fourth quarter of 2013, we updated our nonaccrual and nonearning policies to more closely align with industry practice, resulting in a convergence in nonearning and nonaccrual amounts. As a result, we plan to discontinue the reporting of nonearning receivables in the first quarter of 2014. Refer to the glossary for definitions of nonaccrual and nonearning receivables.
(d) For information on the determination of the allowance for losses on financing receivables, refer to page 62 of the General Electric Capital Corporation Form 10-Q for the quarterly period ended September 30, 2013.
(e) Includes write-offs resulting from the modification to our write-off policy, effective October 1, 2012, in line with regulatory guidance, where we now write off a portion of the loans against specific reserves at the earlier of transaction confirmation (e.g., foreclosure, discounted pay-off, restructuring, etc.) and not later than twelve months after initial recognition.
(f) Write-offs percent is calculated as the ratio of annualized write-offs for the quarter divided by average of financing receivables at the beginning and end of the period.
(17)
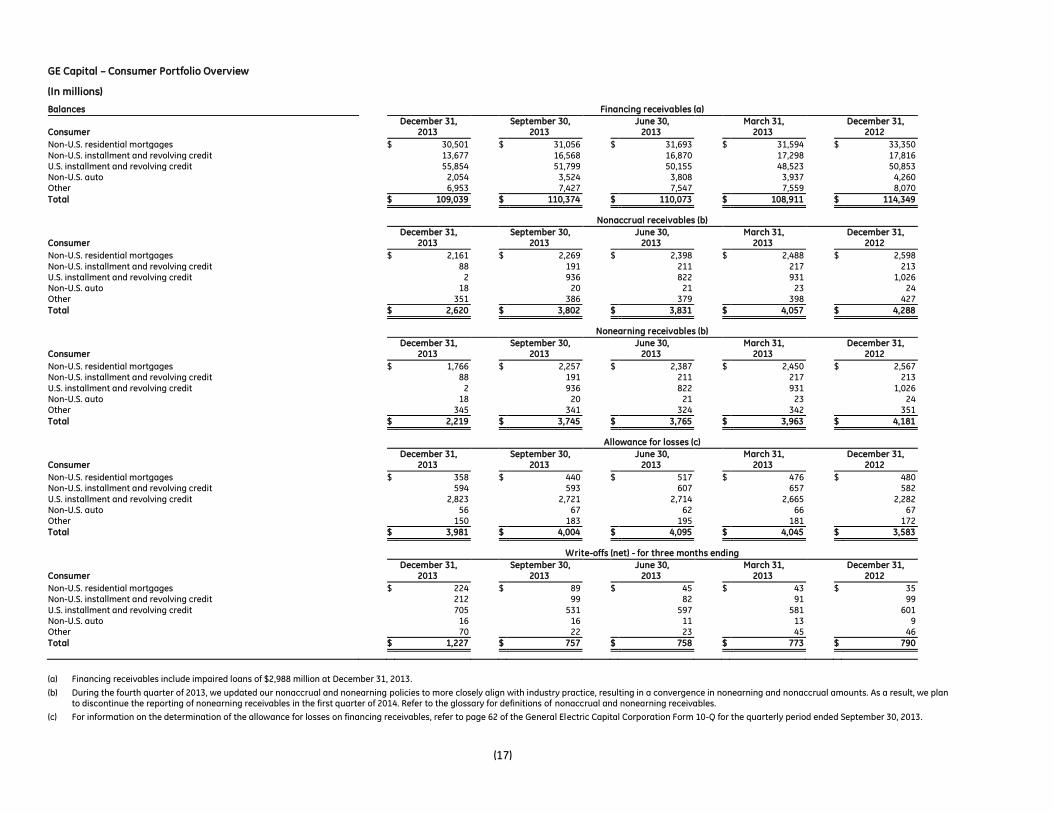
GE Capital – Consumer Portfolio Overview
(In millions) Balances Financing receivables (a)
December 31, September 30, June 30, March 31, December 31, Consumer 2013 2013 2013 2013 2012
Non-U.S. residential mortgages $ 30,501 $ 31,056 $ 31,693 $ 31,594 $ 33,350 Non-U.S. installment and revolving credit 13,677 16,568 16,870 17,298 17,816 U.S. installment and revolving credit 55,854 51,799 50,155 48,523 50,853 Non-U.S. auto 2,054 3,524 3,808 3,937 4,260 Other 6,953 7,427 7,547 7,559 8,070
Total $ 109,039 $ 110,374 $ 110,073 $ 108,911 $ 114,349
Nonaccrual receivables (b)
December 31, September 30, June 30, March 31, December 31, Consumer 2013 2013 2013 2013 2012
Non-U.S. residential mortgages $ 2,161 $ 2,269 $ 2,398 $ 2,488 $ 2,598 Non-U.S. installment and revolving credit 88 191 211 217 213 U.S. installment and revolving credit 2 936 822 931 1,026 Non-U.S. auto 18 20 21 23 24 Other 351 386 379 398 427
Total $ 2,620 $ 3,802 $ 3,831 $ 4,057 $ 4,288
Nonearning receivables (b)
December 31, September 30, June 30, March 31, December 31, Consumer 2013 2013 2013 2013 2012
Non-U.S. residential mortgages $ 1,766 $ 2,257 $ 2,387 $ 2,450 $ 2,567 Non-U.S. installment and revolving credit 88 191 211 217 213 U.S. installment and revolving credit 2 936 822 931 1,026 Non-U.S. auto 18 20 21 23 24 Other 345 341 324 342 351
Total $ 2,219 $ 3,745 $ 3,765 $ 3,963 $ 4,181
Allowance for losses (c)
December 31, September 30, June 30, March 31, December 31, Consumer 2013 2013 2013 2013 2012
Non-U.S. residential mortgages $ 358 $ 440 $ 517 $ 476 $ 480 Non-U.S. installment and revolving credit 594 593 607 657 582 U.S. installment and revolving credit 2,823 2,721 2,714 2,665 2,282 Non-U.S. auto 56 67 62 66 67 Other 150 183 195 181 172
Total $ 3,981 $ 4,004 $ 4,095 $ 4,045 $ 3,583
Write-offs (net) - for three months ending
December 31, September 30, June 30, March 31, December 31, Consumer 2013 2013 2013 2013 2012
Non-U.S. residential mortgages $ 224 $ 89 $ 45 $ 43 $ 35 Non-U.S. installment and revolving credit 212 99 82 91 99 U.S. installment and revolving credit 705 531 597 581 601 Non-U.S. auto 16 16 11 13 9 Other 70 22 23 45 46
Total $ 1,227 $ 757 $ 758 $ 773 $ 790
(a) Financing receivables include impaired loans of $2,988 million at December 31, 2013.
(b) During the fourth quarter of 2013, we updated our nonaccrual and nonearning policies to more closely align with industry practice, resulting in a convergence in nonearning and nonaccrual amounts. As a result, we plan to discontinue the reporting of nonearning receivables in the first quarter of 2014. Refer to the glossary for definitions of nonaccrual and nonearning receivables.
(c) For information on the determination of the allowance for losses on financing receivables, refer to page 62 of the General Electric Capital Corporation Form 10-Q for the quarterly period ended September 30, 2013.

(18)
GE Capital – Consumer Portfolio Overview
Ratios Nonaccrual receivables as a percent of financing receivables (a)
December 31, September 30, June 30, March 31, December 31, Consumer 2013 2013 2013 2013 2012
Non-U.S. residential mortgages 7.1 % 7.3 % 7.6 % 7.9 % 7.8 % Non-U.S. installment and revolving credit 0.6 1.2 1.3 1.3 1.2 U.S. installment and revolving credit – 1.8 1.6 1.9 2.0 Non-U.S. auto 0.9 0.6 0.6 0.6 0.6 Other 5.0 5.2 5.0 5.3 5.3
Total 2.4 3.4 3.5 3.7 3.7
Nonearning receivables as a percent of financing receivables (a)
December 31, September 30, June 30, March 31, December 31, Consumer 2013 2013 2013 2013 2012
Non-U.S. residential mortgages 5.8 % 7.3 % 7.5 % 7.8 % 7.7 % Non-U.S. installment and revolving credit 0.6 1.2 1.3 1.3 1.2 U.S. installment and revolving credit – 1.8 1.6 1.9 2.0 Non-U.S. auto 0.9 0.6 0.6 0.6 0.6 Other 5.0 4.6 4.3 4.5 4.3
Total 2.0 3.4 3.4 3.6 3.7
Allowance for losses as a percent of total financing receivables (b)
December 31, September 30, June 30, March 31, December 31, Consumer 2013 2013 2013 2013 2012
Non-U.S. residential mortgages 1.2 % 1.4 % 1.6 % 1.5 % 1.4 % Non-U.S. installment and revolving credit 4.3 3.6 3.6 3.8 3.3 U.S. installment and revolving credit 5.1 5.3 5.4 5.5 4.5 Non-U.S. auto 2.7 1.9 1.6 1.7 1.6 Other 2.2 2.5 2.6 2.4 2.1
Total 3.7 3.6 3.7 3.7 3.1
Write-offs (net) as a percent of financing receivables (c)
December 31, September 30, June 30, March 31, December 31, Consumer 2013 2013 2013 2013 2012
Non-U.S. residential mortgages 2.9 % 1.1 % 0.6 % 0.5 % 0.4 % Non-U.S. installment and revolving credit 5.6 2.4 1.9 2.1 2.2 U.S. installment and revolving credit 5.2 4.2 4.8 4.7 4.9 Non-U.S. auto 2.3 1.7 1.1 1.3 0.8 Other 3.9 1.2 1.2 2.3 2.3
Total 4.5 2.7 2.8 2.8 2.8
Consumer
December 31, September 30, June 30, March 31, December 31,
2013 2013 2013 2013 2012
Delinquency 6.07 % 6.11 % 6.09 % 6.11 % 6.47 % Allowance for losses as a percent of nonaccural receivables 151.9 105.3 106.9 99.7 83.6 Allowance for losses as a percent of nonearning receivables 179.4 106.9 108.8 102.1 85.7
(a) During the fourth quarter of 2013, we updated our nonaccrual and nonearning policies to more closely align with industry practice, resulting in a convergence in nonearning and nonaccrual amounts. As a result, we plan
to discontinue the reporting of nonearning receivables in the first quarter of 2014. Refer to the glossary for definitions of nonaccrual and nonearning receivables.
(b) For information on the determination of the allowance for losses on financing receivables, refer to page 62 of the General Electric Capital Corporation Form 10-Q for the quarterly period ended September 30, 2013.
(c) Write-offs percent is calculated as the ratio of annualized write-offs for the quarter divided by average of financing receivables at the beginning and end of the period.

(19)
GE Capital – Nonaccrual and Nonearning Financing Receivables
($ millions, unless otherwise noted) Nonaccrual Nonearning financing financing December 31, 2013 receivables (a) receivables (a)
Commercial CLL $ 2,734 $ 2,702 EFS 4 4 GECAS – – Other 6 6
Total Commercial 2,744 2,712 Real Estate 2,551 2,301 Consumer 2,620 2,219 Total $ 7,915 $ 7,232
(a) During the fourth quarter of 2013, we updated our nonaccrual and nonearning policies to more closely align with industry practice, resulting in a convergence in nonearning and nonaccrual
amounts. As a result, nonearning financing receivables increased from $6.4 billion at September 30, 2013 to $7.2 billion at December 31, 2013 primarily due to financing receivables previously classified as cash basis ($2.2 billion, primarily in Real Estate and Commercial), partially offset by Consumer credit cards no longer classified as cost recovery ($1.1 billion). In addition, nonaccrual financing receivables declined from $10.9 billion to $7.9 billion primarily due to Real Estate and Commercial performing restructured receivables returned to accrual status ($1.5 billion) and Consumer credit cards no longer classified as nonaccrual ($1.1 billion). Given the convergence in nonaccrual and nonearning levels, we plan to discontinue the reporting of nonearning receivables in the first quarter of 2014. Refer to the glossary for definitions of nonaccrual and nonearning receivables.

(20)
GE Capital – Consumer Allowance for Losses on Financing Receivables
Balance
January 1, Provision charged Gross
Balance December 31,
(In millions) 2013 to operations Other (a) write-offs (b) Recoveries (b) 2013
Consumer
Non-U.S. residential mortgages $ 480 $ 269 $ 10 $ (458) $ 57 $ 358 Non-U.S. installment and revolving credit 582 589 (93) (967) 483 594 U.S. installment and revolving credit 2,282 3,005 (50) (2,954) 540 2,823 Non-U.S. auto 67 58 (13) (126) 70 56 Other 172 127 11 (236) 76 150 Total Consumer $ 3,583 $ 4,048 $ (135) $ (4,741) $ 1,226 $ 3,981
Balance
January 1, Provision charged Gross
Balance December 31,
(In millions) 2012 to operations Other (a) write-offs (b) Recoveries (b) 2012
Consumer
Non-U.S. residential mortgages $ 545 $ 112 $ 8 $ (261) $ 76 $ 480 Non-U.S. installment and revolving credit 690 290 24 (974) 552 582 U.S. installment and revolving credit 2,008 2,666 (24) (2,906) 538 2,282 Non-U.S. auto 101 18 (4) (146) 98 67 Other 199 132 18 (257) 80 172 Total Consumer $ 3,543 $ 3,218 $ 22 $ (4,544) $ 1,344 $ 3,583
(a) Other primarily included dispositions and the effects of currency exchange.
(b) Net write-offs (write-offs less recoveries) in certain portfolios may exceed the beginning allowance for losses as a result of losses that are incurred subsequent to the beginning of the fiscal year due to information becoming available during the current year, which may identify further deterioration on existing financing receivables.
(21)
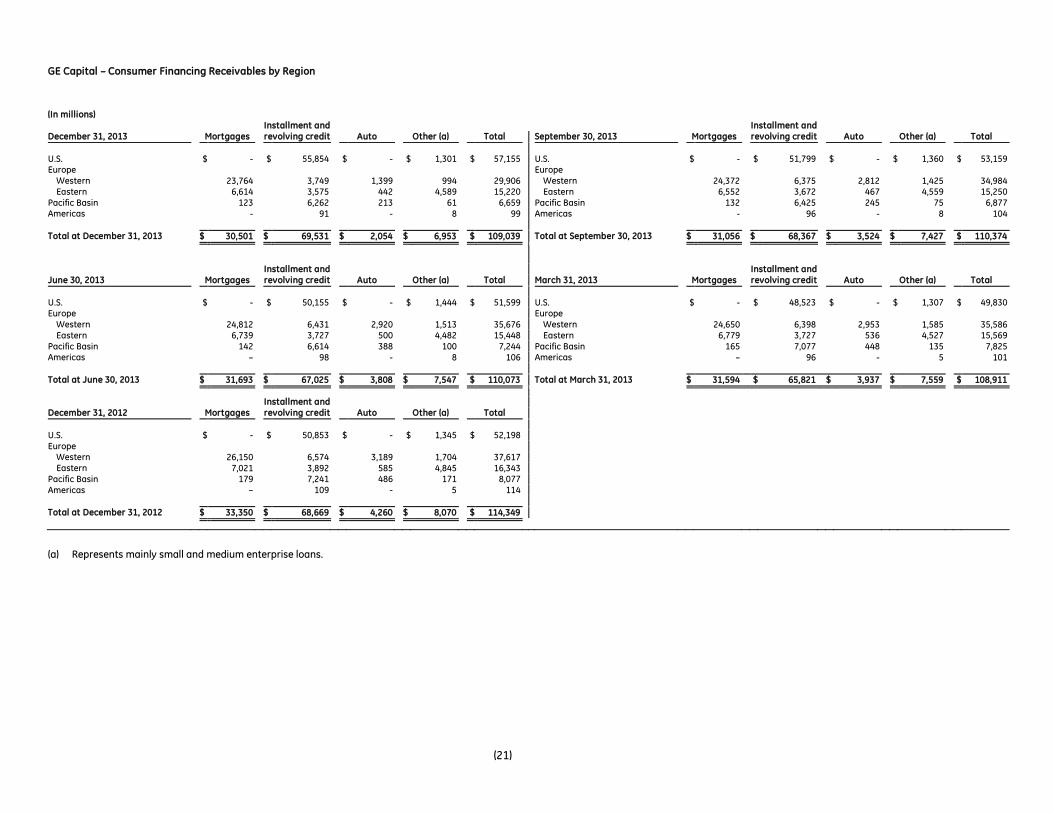
GE Capital – Consumer Financing Receivables by Region
(In millions) Installment and Installment and December 31, 2013 Mortgages revolving credit Auto Other (a) Total September 30, 2013 Mortgages revolving credit Auto Other (a) Total
U.S. $ - $ 55,854 $ - $ 1,301 $ 57,155 U.S. $ - $ 51,799 $ - $ 1,360 $ 53,159 Europe Europe Western 23,764 3,749 1,399 994 29,906 Western 24,372 6,375 2,812 1,425 34,984 Eastern 6,614 3,575 442 4,589 15,220 Eastern 6,552 3,672 467 4,559 15,250 Pacific Basin 123 6,262 213 61 6,659 Pacific Basin 132 6,425 245 75 6,877 Americas - 91 - 8 99 Americas - 96 - 8 104
Total at December 31, 2013 $ 30,501 $ 69,531 $ 2,054 $ 6,953 $ 109,039 Total at September 30, 2013 $ 31,056 $ 68,367 $ 3,524 $ 7,427 $ 110,374
Installment and Installment and June 30, 2013 Mortgages revolving credit Auto Other (a) Total March 31, 2013 Mortgages revolving credit Auto Other (a) Total
U.S. $ - $ 50,155 $ - $ 1,444 $ 51,599 U.S. $ - $ 48,523 $ - $ 1,307 $ 49,830 Europe Europe Western 24,812 6,431 2,920 1,513 35,676 Western 24,650 6,398 2,953 1,585 35,586 Eastern 6,739 3,727 500 4,482 15,448 Eastern 6,779 3,727 536 4,527 15,569 Pacific Basin 142 6,614 388 100 7,244 Pacific Basin 165 7,077 448 135 7,825 Americas – 98 - 8 106 Americas – 96 - 5 101
Total at June 30, 2013 $ 31,693 $ 67,025 $ 3,808 $ 7,547 $ 110,073 Total at March 31, 2013 $ 31,594 $ 65,821 $ 3,937 $ 7,559 $ 108,911
Installment and December 31, 2012 Mortgages revolving credit Auto Other (a) Total
U.S. $ - $ 50,853 $ - $ 1,345 $ 52,198 Europe Western 26,150 6,574 3,189 1,704 37,617 Eastern 7,021 3,892 585 4,845 16,343 Pacific Basin 179 7,241 486 171 8,077 Americas – 109 - 5 114
Total at December 31, 2012 $ 33,350 $ 68,669 $ 4,260 $ 8,070 $ 114,349
(a) Represents mainly small and medium enterprise loans.

(22)
GE Capital – Consumer Mortgage Portfolio by Country (a)
($ in millions)
Delinquent Delinquent
Financing Nonaccrual Nonearning more than Financing Nonaccrual Nonearning more than December 31, 2013 receivables As a % of total receivables receivables 30 days September 30, 2013 receivables As a % of total receivables receivables 30 days
U.K. (b) (c) $ 15,026 49.3 % 10.2 % 7.5 % 17.2 % U.K. $ 15,054 48.5 % 10.6 % 10.5 % 17.9 % France (c) 7,682 25.2 4.0 4.0 4.3 France 7,606 24.5 3.9 3.9 4.2 Poland 4,998 16.4 1.3 1.3 2.3 Poland 4,873 15.7 1.4 1.4 2.6 Czech Republic 879 2.9 2.7 2.7 3.3 Czech Republic 916 2.9 2.8 2.8 3.6 Netherlands 113 0.4 5.4 5.4 5.0 Netherlands 768 2.5 1.6 1.3 2.0 Hungary 737 2.4 19.0 19.0 21.5 Hungary 760 2.4 22.1 22.1 24.9 Spain 746 2.4 8.6 8.6 18.9 Spain 744 2.4 9.1 9.1 19.4 All other 320 1.0 8.3 11.2 16.3 All other 335 1.1 9.8 15.0 14.5
Total at December 31, 2013 (d) $ 30,501 100.0 % 7.1 % 5.8 % 11.2 %
Total at September 30, 2013 $ 31,056 100.0 % 7.3 % 7.3 % 11.5 %
Delinquent Delinquent
Financing Nonaccrual Nonearning more than Financing Nonaccrual Nonearning more than June 30, 2013 receivables As a % of total receivables receivables 30 days March 31, 2013 receivables As a % of total receivables receivables 30 days
U.K. $ 15,195 47.9 % 11.1 % 11.0 % 18.5 % U.K. $ 14,981 47.4 % 11.8 % 11.6 % 17.5 % France 7,829 24.7 3.7 3.7 4.2 France 7,865 24.9 3.6 3.6 3.9 Poland 4,992 15.8 1.5 1.5 2.6 Poland 4,992 15.8 1.5 1.5 2.5 Czech Republic 954 3.0 2.7 2.7 3.4 Czech Republic 975 3.1 2.7 2.7 3.4 Netherlands 798 2.5 2.3 2.3 2.4 Netherlands 801 2.5 1.5 1.5 1.9 Hungary 792 2.5 22.4 22.4 25.5 Hungary 793 2.5 21.6 21.6 25.0 Spain 780 2.5 11.3 11.3 21.6 Spain 789 2.5 12.3 12.3 23.4 All other 353 1.1 13.5 8.9 13.6 All other 398 1.3 15.9 15.5 13.6
Total at June 30, 2013 $ 31,693 100.0 % 7.6 % 7.5 % 11.8 %
Total at March 31, 2013 $ 31,594 100.0 % 7.9 % 7.8 % 11.2 %
Delinquent
Financing Nonaccrual Nonearning more than December 31, 2012 receivables As a % of total receivables receivables 30 days
U.K. $ 16,245 48.7 % 11.6 % 11.4 % 18.8 % France 8,046 24.1 3.5 3.5 3.8 Poland 5,174 15.5 1.3 1.3 2.9 Czech Republic 1,029 3.1 2.6 2.6 3.4 Netherlands 824 2.5 1.3 1.3 1.6 Hungary 818 2.5 20.3 20.3 24.7 Spain 810 2.4 12.9 12.9 23.0 All other 404 1.2 14.9 14.6 13.8
Total at December 31, 2012 $ 33,350 100.0 % 7.8 % 7.7 % 12.0 %
(a) Consumer loans secured by residential real estate (both revolving and closed-end loans) are written down to the fair value of collateral, less costs to sell, no later than when they become 180 days past due.
(b) At December 31, 2013, we had in repossession stock 447 houses in the U.K., which had a value of approximately $0.1 billion.
(c) Our U.K. and France portfolios have reindexed loan-to-value ratios of 77% and 56%, respectively.
(d) At December 31, 2013, net of credit insurance, about 40% of this portfolio comprised loans with introductory, below market rates that are scheduled to adjust at future dates; with high loan-to-value ratios at inception (greater than 90%); whose terms permitted interest-only payments; or whose terms resulted in negative amortization. At origination, we underwrite loans with an adjustable rate to the reset value. About 85% of these loans are in our U.K. and France portfolios, which comprise mainly loans with interest-only payments, high loan-to-value ratios at inception and introductory below market rates, have a delinquency rate of 14% and have a loan-to-value ratio at origination of 82%. At December 31, 2013, 11% (based on dollar values) of these loans in our U.K. and France portfolios have been restructured.

(23)
GE Capital – Commercial Allowance for Losses on Financing Receivables
Balance
January 1, Provision charged Gross
Balance December 31,
(In millions) 2013 to operations Other (a) write-offs (b) Recoveries (b) 2013
CLL
Americas $ 490 $ 292 $ (1) $ (422) $ 114 $ 473 Europe 445 321 12 (441) 78 415 Asia 80 124 (11) (115) 12 90 Other 6 (3) – (3) – – EFS 9 (1) – – – 8 GECAS 8 9 – – – 17 Other 3 (1) – (2) 2 2 Total Commercial $ 1,041 $ 741 $ – $ (983) $ 206 $ 1,005
Balance
January 1, Provision charged Gross
Balance December 31,
(In millions) 2012 to operations Other (a) write-offs (b) Recoveries (b) 2012
CLL
Americas $ 889 $ 109 $ (51) $ (568) $ 111 $ 490 Europe 400 374 (3) (390) 64 445 Asia 157 37 (3) (134) 23 80 Other 4 13 (1) (10) – 6 EFS 26 4 – (24) 3 9 GECAS 17 4 – (13) – 8 Other 37 1 (20) (17) 2 3 Total Commercial $ 1,530 $ 542 $ (78) $ (1,156) $ 203 $ 1,041
(a) Other primarily included the effects of currency exchange.
(b) Net write-offs (write-offs less recoveries) in certain portfolios may exceed the beginning allowance for losses as a result of losses that are incurred subsequent to the beginning of the fiscal year due to information becoming available during the current year, which may identify further deterioration on existing financing receivables.
(24)
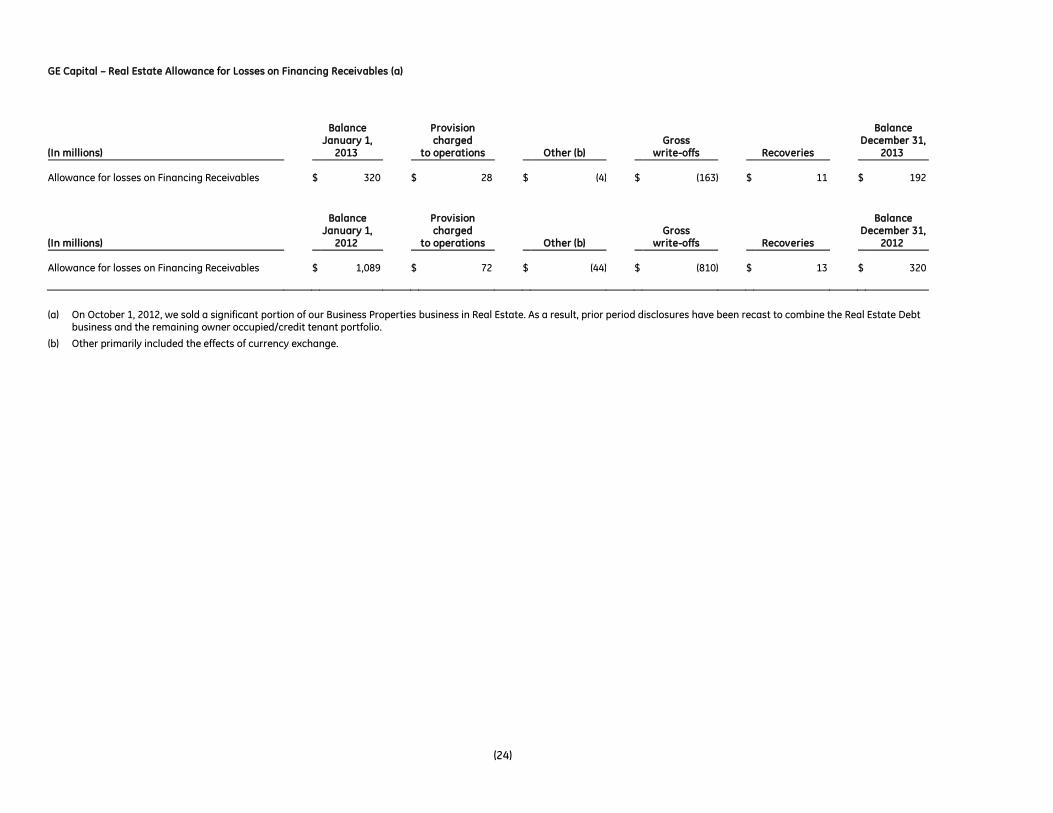
GE Capital – Real Estate Allowance for Losses on Financing Receivables (a)
Balance
January 1, Provision charged Gross
Balance December 31,
(In millions) 2013 to operations Other (b) write-offs Recoveries 2013
Allowance for losses on Financing Receivables $ 320 $ 28 $ (4) $ (163) $ 11 $ 192
Balance
January 1, Provision charged Gross
Balance December 31,
(In millions) 2012 to operations Other (b) write-offs Recoveries 2012
Allowance for losses on Financing Receivables $ 1,089 $ 72 $ (44) $ (810) $ 13 $ 320
(a) On October 1, 2012, we sold a significant portion of our Business Properties business in Real Estate. As a result, prior period disclosures have been recast to combine the Real Estate Debt
business and the remaining owner occupied/credit tenant portfolio.
(b) Other primarily included the effects of currency exchange.
(25)
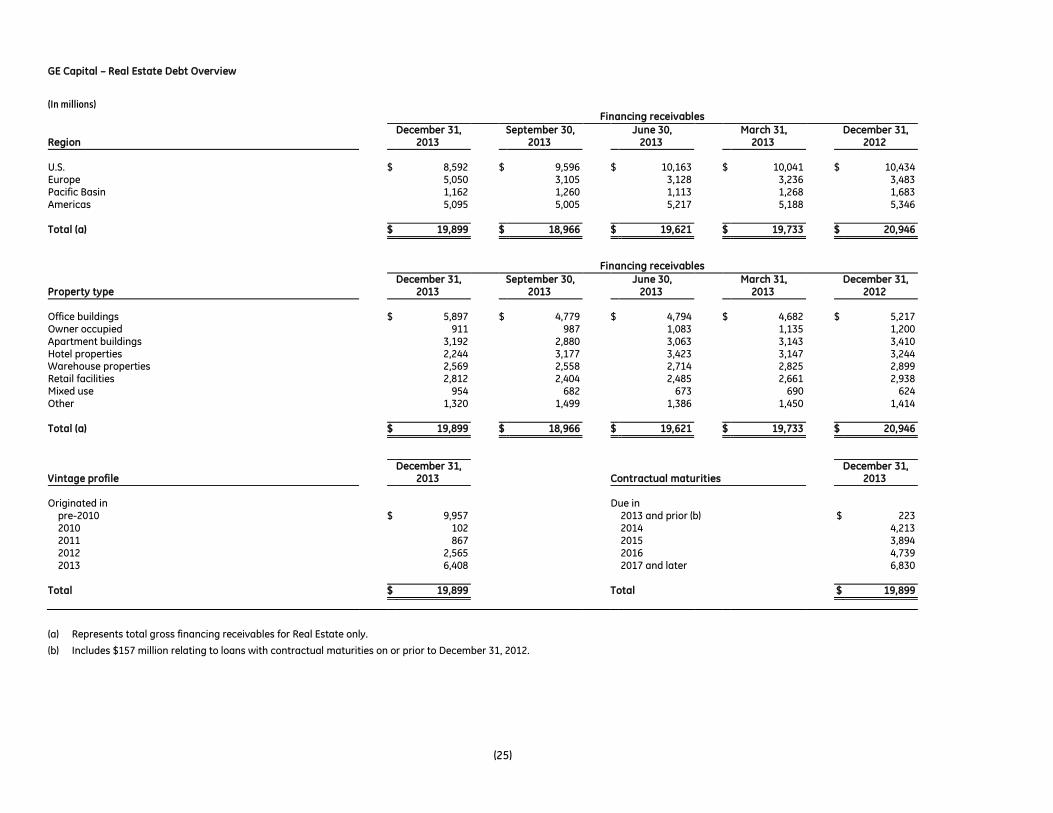
GE Capital – Real Estate Debt Overview
(In millions) Financing receivables
December 31, September 30, June 30, March 31, December 31, Region 2013 2013 2013 2013 2012
U.S. $ 8,592 $ 9,596 $ 10,163 $ 10,041 $ 10,434 Europe 5,050 3,105 3,128 3,236 3,483 Pacific Basin 1,162 1,260 1,113 1,268 1,683 Americas 5,095 5,005 5,217 5,188 5,346 Total (a) $ 19,899 $ 18,966 $ 19,621 $ 19,733 $ 20,946
Financing receivables
December 31, September 30, June 30, March 31, December 31, Property type 2013 2013 2013 2013 2012
Office buildings $ 5,897 $ 4,779 $ 4,794 $ 4,682 $ 5,217 Owner occupied 911 987 1,083 1,135 1,200 Apartment buildings 3,192 2,880 3,063 3,143 3,410 Hotel properties 2,244 3,177 3,423 3,147 3,244 Warehouse properties 2,569 2,558 2,714 2,825 2,899 Retail facilities 2,812 2,404 2,485 2,661 2,938 Mixed use 954 682 673 690 624 Other 1,320 1,499 1,386 1,450 1,414 Total (a) $ 19,899 $ 18,966 $ 19,621 $ 19,733 $ 20,946
December 31, December 31, Vintage profile 2013 Contractual maturities 2013
Originated in Due in pre-2010 $ 9,957 2013 and prior (b) $ 223 2010 102 2014 4,213 2011 867 2015 3,894 2012 2,565 2016 4,739 2013 6,408 2017 and later 6,830 Total $ 19,899 Total $ 19,899
(a) Represents total gross financing receivables for Real Estate only.
(b) Includes $157 million relating to loans with contractual maturities on or prior to December 31, 2012.

(26)
GE Capital – Real Estate Equity Overview (a)
($ in millions) Equity
December 31, September 30, June 30, March 31, December 31, Region 2013 2013 2013 2013 2012
U.S. $ 4,592 $ 5,587 $ 4,975 $ 5,125 $ 5,767 Europe 5,560 6,682 6,976 6,887 7,169 Pacific Basin 3,690 3,846 4,848 5,571 6,391 Americas 190 248 348 1,211 1,303
Total $ 14,032 $ 16,363 $ 17,147 $ 18,794 $ 20,630
Equity
December 31, September 30, June 30, March 31, December 31, Property type 2013 2013 2013 2013 2012
Office buildings $ 7,723 $ 8,517 $ 9,873 $ 10,950 $ 11,693 Apartment buildings 1,865 3,086 2,628 2,690 2,941 Warehouse properties 1,400 1,439 1,477 1,774 1,835 Retail facilities 1,297 1,346 1,416 1,515 2,026 Mixed use 754 852 886 902 854 Owner occupied 238 243 247 318 342 Hotel properties 276 276 216 218 220 Other 479 604 404 427 719
Total $ 14,032 $ 16,363 $ 17,147 $ 18,794 $ 20,630
December 31, September 30, June 30, March 31, December 31, Key metrics 2013 2013 2013 2013 2012
Owned real estate (b) $ 12,588 $ 14,531 $ 15,219 $ 16,666 $ 18,126 Net operating income (annualized) $ 723 $ 740 $ 811 $ 983 $ 1,077 Net operating income yield (c) 5.3 % 5.0 % 5.1 % 5.7 % 5.7 % End of period vacancies (d) 17.6 % 19.0 % 19.7 % 18.1 % 18.2 % Foreclosed properties (e) $ 994 $ 969 $ 907 $ 911 $ 893 December 31, Vintage profile 2013
Originated in pre-2010 $ 13,380 2010 33 2011 134 2012 205 2013 280
Total $ 14,032
(a) Includes real estate investments related to Real Estate only. Excludes foreclosed properties.
(b) Excludes joint ventures, equity investment securities, and foreclosed properties.
(c) Net operating income yield is calculated as annualized net operating income for the relevant quarter as a percentage of the average owned real estate.
(d) Excludes hotel properties, apartment buildings and parking facilities.
(e) Excludes foreclosed properties related to loans acquired at a discount with an expectation to foreclose.

(27)
GE Capital – Equipment Leased to Others (ELTO), Net of Depreciation and Amortization Overview
(In millions) December 31, 2013 September 30, 2013 Collateral type CLL GECAS EFS Consumer Total Collateral type CLL GECAS EFS Consumer Total
Aircraft $ 2,623 $ 32,315 $ – $ – $ 34,938 Aircraft $ 2,739 $ 32,452 $ – $ – $ 35,191 Vehicles 8,312 – – – 8,312 Vehicles 8,190 – – – 8,190 Railroad rolling stock 3,129 – – – 3,129 Railroad rolling stock 3,122 – – – 3,122 Construction and manufacturing 1,955 – – – 1,955 Construction and manufacturing 1,937 – – – 1,937 All other 1,736 – 509 3 2,248 All other 1,695 – 514 3 2,212 Total at December 31, 2013 $ 17,755 $ 32,315 $ 509 $ 3 $ 50,582 Total at September 30, 2013 $ 17,683 $ 32,452 $ 514 $ 3 $ 50,652
June 30, 2013 March 31, 2013 Collateral type CLL GECAS EFS Consumer Total Collateral type CLL GECAS EFS Consumer Total
Aircraft $ 2,569 $ 33,406 $ – $ – $ 35,975 Aircraft $ 2,782 $ 33,011 $ – $ – $ 35,793 Vehicles 8,253 – – 1 8,254 Vehicles 8,502 – – 1 8,503 Railroad rolling stock 3,120 – – – 3,120 Railroad rolling stock 3,135 – – – 3,135 Construction and manufacturing 2,017 – – – 2,017 Construction and manufacturing 1,950 – – – 1,950 All other 1,684 – 519 3 2,206 All other 1,545 – 524 3 2,072 Total at June 30, 2013 $ 17,643 $ 33,406 $ 519 $ 4 $ 51,572 Total at March 31, 2013 $ 17,914 $ 33,011 $ 524 $ 4 $ 51,453
December 31, 2012 Collateral type CLL GECAS EFS Consumer Total
Aircraft $ 2,809 $ 33,422 $ – $ – $ 36,231 Vehicles 8,633 – – 1 8,634 Railroad rolling stock 2,744 – – – 2,744 Construction and manufacturing 2,069 – – – 2,069 All other 1,492 – 795 3 2,290 Total at December 31, 2012 $ 17,747 $ 33,422 $ 795 $ 4 $ 51,968
(28)
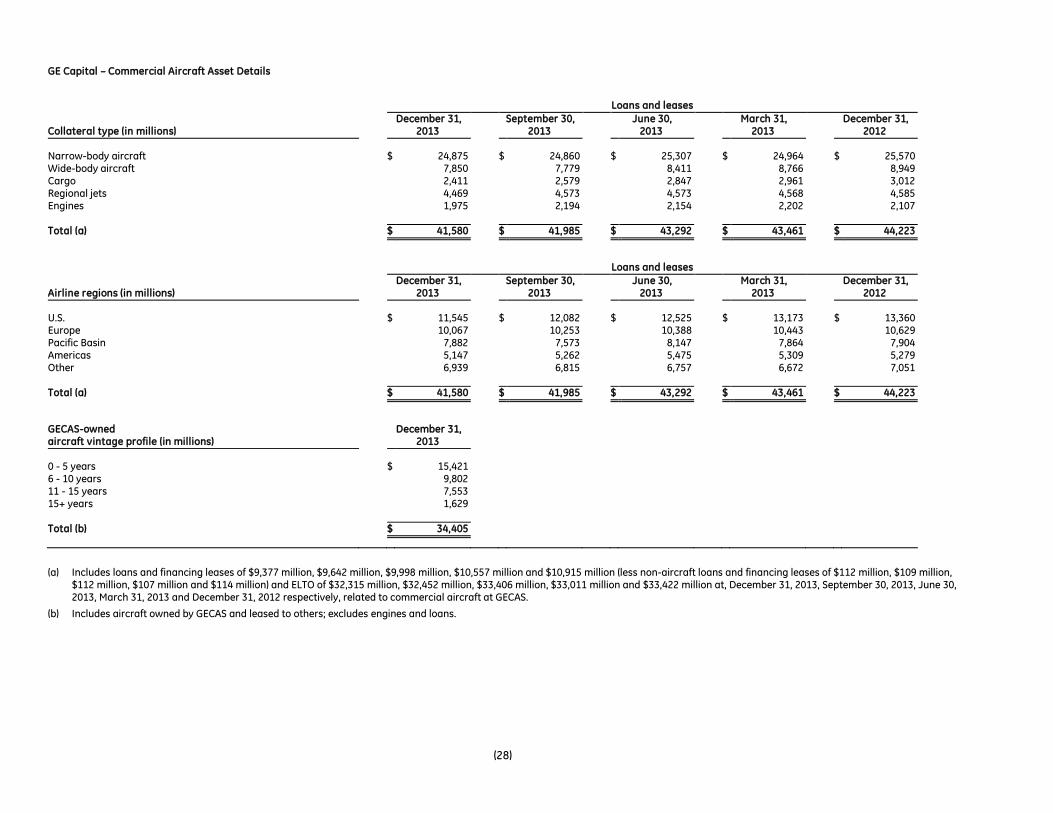
GE Capital – Commercial Aircraft Asset Details
Loans and leases
December 31, September 30, June 30, March 31, December 31, Collateral type (in millions) 2013 2013 2013 2013 2012
Narrow-body aircraft $ 24,875 $ 24,860 $ 25,307 $ 24,964 $ 25,570 Wide-body aircraft 7,850 7,779 8,411 8,766 8,949 Cargo 2,411 2,579 2,847 2,961 3,012 Regional jets 4,469 4,573 4,573 4,568 4,585 Engines 1,975 2,194 2,154 2,202 2,107 Total (a) $ 41,580 $ 41,985 $ 43,292 $ 43,461 $ 44,223
Loans and leases
December 31, September 30, June 30, March 31, December 31, Airline regions (in millions) 2013 2013 2013 2013 2012
U.S. $ 11,545 $ 12,082 $ 12,525 $ 13,173 $ 13,360 Europe 10,067 10,253 10,388 10,443 10,629 Pacific Basin 7,882 7,573 8,147 7,864 7,904 Americas 5,147 5,262 5,475 5,309 5,279 Other 6,939 6,815 6,757 6,672 7,051 Total (a) $ 41,580 $ 41,985 $ 43,292 $ 43,461 $ 44,223
GECAS-owned December 31, aircraft vintage profile (in millions) 2013
0 - 5 years $ 15,421 6 - 10 years 9,802 11 - 15 years 7,553 15+ years 1,629 Total (b) $ 34,405
(a) Includes loans and financing leases of $9,377 million, $9,642 million, $9,998 million, $10,557 million and $10,915 million (less non-aircraft loans and financing leases of $112 million, $109 million,
$112 million, $107 million and $114 million) and ELTO of $32,315 million, $32,452 million, $33,406 million, $33,011 million and $33,422 million at, December 31, 2013, September 30, 2013, June 30, 2013, March 31, 2013 and December 31, 2012 respectively, related to commercial aircraft at GECAS.
(b) Includes aircraft owned by GECAS and leased to others; excludes engines and loans.

(29)
GE Capital Other Key Areas
(30)
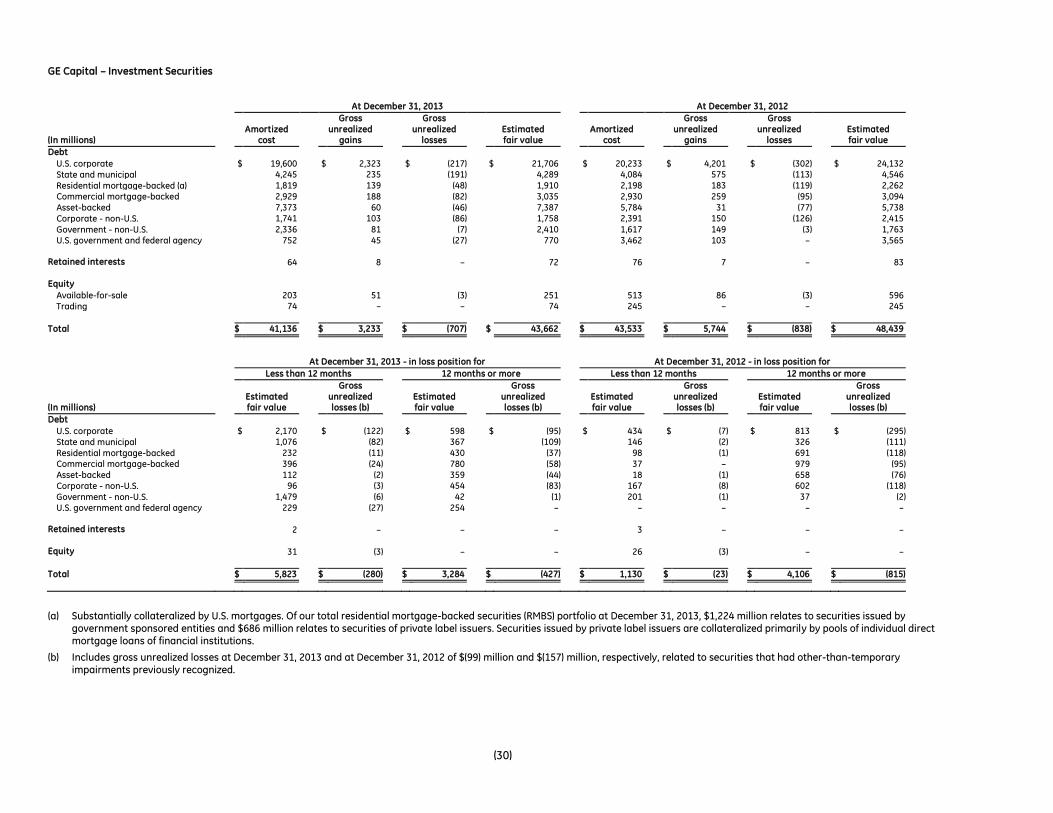
GE Capital – Investment Securities
At December 31, 2013 At December 31, 2012
Gross Gross Gross Gross
Amortized unrealized unrealized Estimated Amortized unrealized unrealized Estimated (In millions) cost gains losses fair value cost gains losses fair value
Debt
U.S. corporate $ 19,600 $ 2,323 $ (217) $ 21,706 $ 20,233 $ 4,201 $ (302) $ 24,132 State and municipal 4,245 235 (191) 4,289 4,084 575 (113) 4,546
Residential mortgage-backed (a) 1,819 139 (48) 1,910 2,198 183 (119) 2,262 Commercial mortgage-backed 2,929 188 (82) 3,035 2,930 259 (95) 3,094 Asset-backed 7,373 60 (46) 7,387 5,784 31 (77) 5,738 Corporate - non-U.S. 1,741 103 (86) 1,758 2,391 150 (126) 2,415
Government - non-U.S. 2,336 81 (7) 2,410 1,617 149 (3) 1,763 U.S. government and federal agency 752 45 (27) 770 3,462 103 – 3,565 Retained interests 64 8 – 72 76 7 – 83 Equity
Available-for-sale 203 51 (3) 251 513 86 (3) 596 Trading 74 – – 74 245 – – 245
Total $ 41,136 $ 3,233 $ (707) $ 43,662 $ 43,533 $ 5,744 $ (838) $ 48,439
At December 31, 2013 - in loss position for At December 31, 2012 - in loss position for
Less than 12 months 12 months or more Less than 12 months 12 months or more
Gross Gross Gross Gross
Estimated unrealized Estimated unrealized Estimated unrealized Estimated unrealized (In millions) fair value losses (b) fair value losses (b) fair value losses (b) fair value losses (b)
Debt
U.S. corporate $ 2,170 $ (122) $ 598 $ (95) $ 434 $ (7) $ 813 $ (295) State and municipal 1,076 (82) 367 (109) 146 (2) 326 (111)
Residential mortgage-backed 232 (11) 430 (37) 98 (1) 691 (118) Commercial mortgage-backed 396 (24) 780 (58) 37 – 979 (95) Asset-backed 112 (2) 359 (44) 18 (1) 658 (76) Corporate - non-U.S. 96 (3) 454 (83) 167 (8) 602 (118)
Government - non-U.S. 1,479 (6) 42 (1) 201 (1) 37 (2) U.S. government and federal agency 229 (27) 254 – – – – – Retained interests 2 – – – 3 – – – Equity 31 (3) – – 26 (3) – –
Total $ 5,823 $ (280) $ 3,284 $ (427) $ 1,130 $ (23) $ 4,106 $ (815)
(a) Substantially collateralized by U.S. mortgages. Of our total residential mortgage-backed securities (RMBS) portfolio at December 31, 2013, $1,224 million relates to securities issued by
government sponsored entities and $686 million relates to securities of private label issuers. Securities issued by private label issuers are collateralized primarily by pools of individual direct mortgage loans of financial institutions.
(b) Includes gross unrealized losses at December 31, 2013 and at December 31, 2012 of $(99) million and $(157) million, respectively, related to securities that had other-than-temporary impairments previously recognized.

(31)
GE Capital – Investments Measured at Fair Value in Earnings (a)
Asset balances at
Earnings impact for the December 31, December 31, twelve months ended Investment type (in millions) 2013 2012 December 31, 2013 (b)
Equities - trading $ 74 $ 245 $ 29 Assets held for sale (LOCOM) 2,571 4,194 (167) Assets of businesses held for sale (LOCOM) 50 211 – Other (investment companies and loans) 293 432 (94) Total $ 2,988 $ 5,083 $ (232)
(a) Excludes derivatives portfolio.
(b) All numbers are pre-tax.
(32)
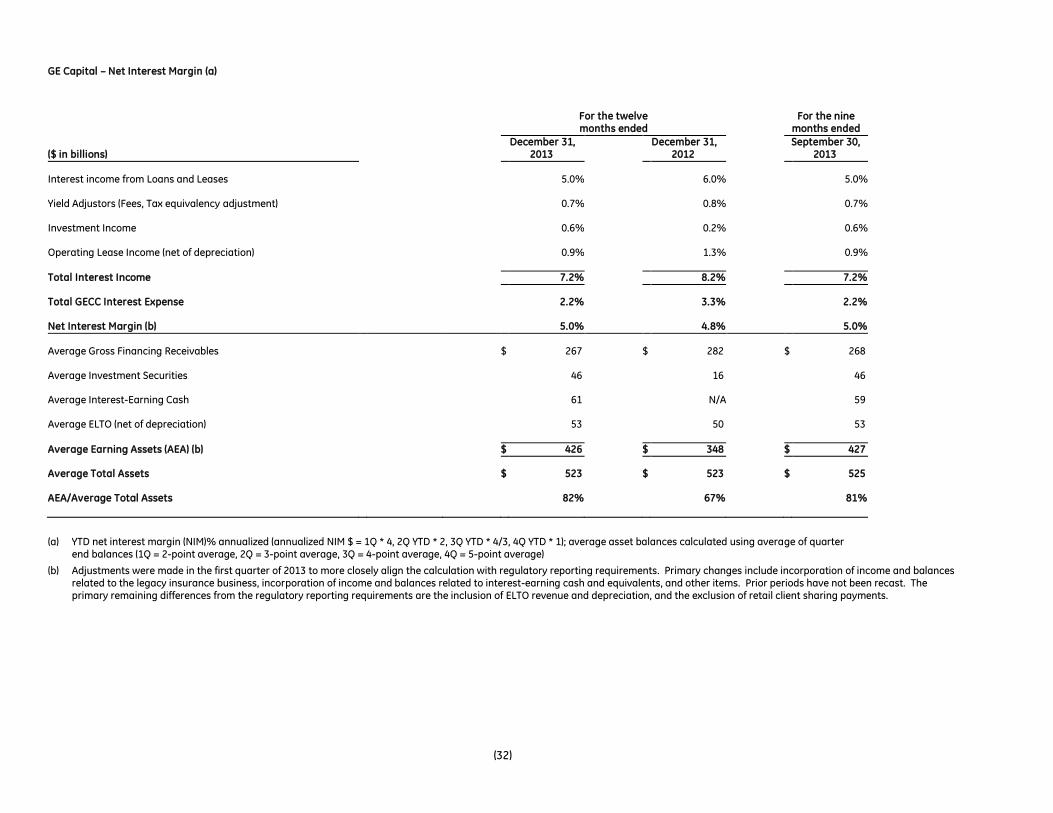
GE Capital – Net Interest Margin (a)
For the twelve For the nine
months ended months ended
December 31, December 31, September 30, ($ in billions) 2013 2012 2013
Interest income from Loans and Leases 5.0% 6.0% 5.0% Yield Adjustors (Fees, Tax equivalency adjustment) 0.7% 0.8% 0.7% Investment Income 0.6% 0.2% 0.6% Operating Lease Income (net of depreciation) 0.9% 1.3% 0.9% Total Interest Income 7.2% 8.2% 7.2%
Total GECC Interest Expense 2.2% 3.3% 2.2% Net Interest Margin (b) 5.0% 4.8% 5.0%
Average Gross Financing Receivables $ 267 $ 282 $ 268 Average Investment Securities 46 16 46 Average Interest-Earning Cash 61 N/A 59 Average ELTO (net of depreciation) 53 50 53 Average Earning Assets (AEA) (b) $ 426 $ 348 $ 427
Average Total Assets $ 523 $ 523 $ 525 AEA/Average Total Assets 82% 67% 81%
(a) YTD net interest margin (NIM)% annualized (annualized NIM $ = 1Q * 4, 2Q YTD * 2, 3Q YTD * 4/3, 4Q YTD * 1); average asset balances calculated using average of quarter
end balances (1Q = 2-point average, 2Q = 3-point average, 3Q = 4-point average, 4Q = 5-point average)
(b) Adjustments were made in the first quarter of 2013 to more closely align the calculation with regulatory reporting requirements. Primary changes include incorporation of income and balances related to the legacy insurance business, incorporation of income and balances related to interest-earning cash and equivalents, and other items. Prior periods have not been recast. The primary remaining differences from the regulatory reporting requirements are the inclusion of ELTO revenue and depreciation, and the exclusion of retail client sharing payments.
(33)
Appendix
(34)
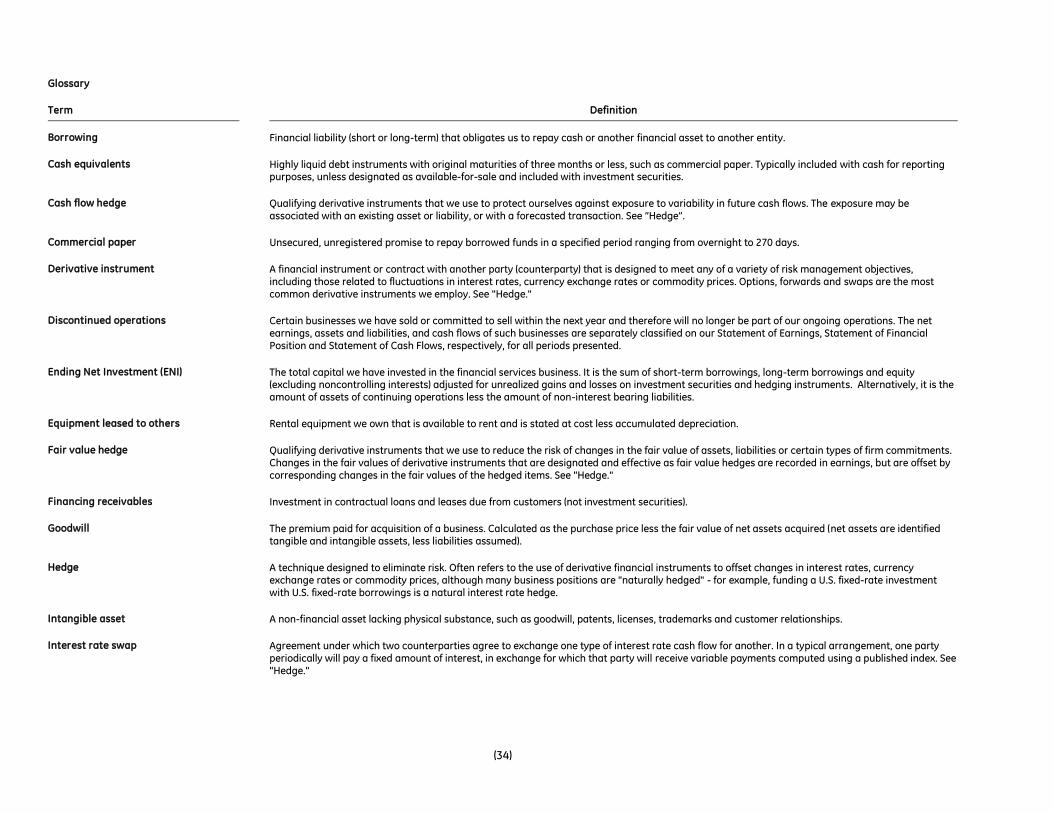
Glossary
Term Definition
Borrowing Financial liability (short or long-term) that obligates us to repay cash or another financial asset to another entity.
Cash equivalents Highly liquid debt instruments with original maturities of three months or less, such as commercial paper. Typically included with cash for reporting purposes, unless designated as available-for-sale and included with investment securities.
Cash flow hedge Qualifying derivative instruments that we use to protect ourselves against exposure to variability in future cash flows. The exposure may be associated with an existing asset or liability, or with a forecasted transaction. See “Hedge”.
Commercial paper Unsecured, unregistered promise to repay borrowed funds in a specified period ranging from overnight to 270 days.
Derivative instrument A financial instrument or contract with another party (counterparty) that is designed to meet any of a variety of risk management objectives, including those related to fluctuations in interest rates, currency exchange rates or commodity prices. Options, forwards and swaps are the most common derivative instruments we employ. See "Hedge."
Discontinued operations Certain businesses we have sold or committed to sell within the next year and therefore will no longer be part of our ongoing operations. The net earnings, assets and liabilities, and cash flows of such businesses are separately classified on our Statement of Earnings, Statement of Financial Position and Statement of Cash Flows, respectively, for all periods presented.
Ending Net Investment (ENI) The total capital we have invested in the financial services business. It is the sum of short-term borrowings, long-term borrowings and equity (excluding noncontrolling interests) adjusted for unrealized gains and losses on investment securities and hedging instruments. Alternatively, it is the amount of assets of continuing operations less the amount of non-interest bearing liabilities.
Equipment leased to others Rental equipment we own that is available to rent and is stated at cost less accumulated depreciation.
Fair value hedge Qualifying derivative instruments that we use to reduce the risk of changes in the fair value of assets, liabilities or certain types of firm commitments. Changes in the fair values of derivative instruments that are designated and effective as fair value hedges are recorded in earnings, but are offset by corresponding changes in the fair values of the hedged items. See "Hedge."
Financing receivables Investment in contractual loans and leases due from customers (not investment securities).
Goodwill The premium paid for acquisition of a business. Calculated as the purchase price less the fair value of net assets acquired (net assets are identified tangible and intangible assets, less liabilities assumed).
Hedge A technique designed to eliminate risk. Often refers to the use of derivative financial instruments to offset changes in interest rates, currency exchange rates or commodity prices, although many business positions are "naturally hedged" - for example, funding a U.S. fixed-rate investment with U.S. fixed-rate borrowings is a natural interest rate hedge.
Intangible asset A non-financial asset lacking physical substance, such as goodwill, patents, licenses, trademarks and customer relationships.
Interest rate swap Agreement under which two counterparties agree to exchange one type of interest rate cash flow for another. In a typical arrangement, one party periodically will pay a fixed amount of interest, in exchange for which that party will receive variable payments computed using a published index. See "Hedge."

(35)
Term
Definition
Investment securities Generally, an instrument that provides an ownership position in a corporation (a stock), a creditor relationship with a corporation or governmental body (a bond), rights to contractual cash flows backed by pools of financial assets or rights to ownership such as those represented by options, subscription rights and subscription warrants.
Net interest margin A measure of the yield on interest earning assets relative to total interest expense. It is the amount of interest income less interest expense, divided by average interest earning assets.
Net operating income Represents operating income less operating expenses for owned real estate properties.
Nonaccrual receivables Financing receivables on which we have stopped accruing interest. We stop accruing interest at the earlier of the time at which collection of an account becomes doubtful or the account becomes 90 days past due, with the exception of consumer credit card accounts. Although we stop accruing interest in advance of payments, we recognize interest income as cash is collected when appropriate provided the amount does not exceed that which would have been earned at the historical effective interest rate. Recently restructured financing receivables are not considered delinquent when payments are brought current according to the restructured terms, but may remain classified as nonaccrual until there has been a period of satisfactory payment performance by the borrower and future payments are reasonably assured of collection.
Noncontrolling interest Portion of shareowners’ equity in a subsidiary that is not attributable to GECC.
Nonearning receivables A subset of nonaccrual financing receivables for which cash payments are not being received or for which we are on the cost recovery method of accounting (i.e., any payments are accounted for as a reduction of principal). This category excludes loans purchased at a discount (unless they have deteriorated post acquisition). These loans are initially recorded at fair value and accrete interest income over the estimated life of the loan based on reasonably estimable cash flows even if the underlying loans are contractually delinquent at acquisition.
Other comprehensive income Changes in assets and liabilities that do not result from transactions with shareowners and are not included in net income but are recognized in a separate component of shareowners' equity. Other comprehensive income includes the following components:
- Investment securities - unrealized gains and losses on securities classified as available for sale
- Currency translation adjustments - the result of translating into U.S. dollars those amounts denominated or measured in a different currency
- Cash flow hedges - the effective portion of the fair value of cash flow hedges. Such hedges relate to an exposure to variability in the cash flows of recognized assets, liabilities or forecasted transactions that are attributable to a specific risk
- Benefit plans - unamortized prior service costs and net actuarial losses (gains) related to pension and retiree health and life benefits
Retained interest A portion of a transferred financial asset retained by the transferor that provides rights to receive portions of the cash inflows from that asset.
Securitization A process whereby loans or other receivables are packaged, underwritten and sold to investors. In a typical transaction, assets are sold to a special purpose entity, which purchases the assets with cash raised through issuance of beneficial interests (usually debt instruments) to third-party investors. Whether or not credit risk associated with the securitized assets is retained by the seller depends on the structure of the securitization. See "Variable interest entity."
Variable interest entity (VIE) An entity that must be consolidated by its primary beneficiary, the party that holds a controlling financial interest. A variable interest entity has one or both of the following characteristics: (1) its equity at risk is not sufficient to permit the entity to finance its activities without additional subordinated financial support from other parties, or (2) as a group, the equity investors lack one or more of the following characteristics: (a) the power to direct the activities that most significantly affect the economic performance of the entity, (b) obligation to absorb expected losses, or (c) right to receive expected residual returns.