October 25, 2020 Christopher Carril Starbucks Corporation ...
14
EQUITY RESEARCH RBC Capital Markets, LLC Christopher Carril (Analyst) (617) 725-2109 [email protected] Sector: Restaurants Outperform NASDAQ: SBUX; USD 90.80 Price Target USD 97.00 ↑ 89.00 WHAT'S INSIDE Rating/Risk Change Price Target Change In-Depth Report Est. Change Preview News Analysis Scenario Analysis* Downside Scenario 67.00 25% Current Price 90.80 Price Target 97.00 8% Upside Scenario 111.00 24% *Implied Total Returns Key Statistics Shares O/S (MM): 1,406.6 Dividend: 1.44 Float (MM): NA Debt to Cap: NA Market Cap (MM): 127,719 Yield: 1.6% Tr. 12 ROE: NA Avg. Daily Volume: 6,125,564 3-Yr. Est. EPS Growth: NA RBC Estimates FY Sep 2019A 2020E 2021E 2022E Revenue 26,508.6 23,448.1 28,737.4 30,576.8 Prev. 23,478.0 28,727.4 EPS, Ops Diluted 2.83 0.96 2.84 3.33 Prev. 2.79 P/E 32.1x NM 32.0x 27.3x Revenue Q1 Q2 Q3 Q4 2019 6,632.7A 6,305.9A 6,823.0A 6,747.0A 2020 7,097.1A 5,995.7A 4,222.1A 6,133.2E Prev. 6,163.1E 2021 6,879.1E 6,609.2E 7,231.3E 8,017.8E Prev. 7,066.3E 6,920.2E 7,286.5E 7,454.4E EPS, Ops Diluted 2019 0.75A 0.60A 0.78A 0.70A 2020 0.79A 0.32A (0.46)A 0.31E 2021 0.57E 0.56E 0.79E 0.91E Prev. 0.60E 0.58E 0.81E 0.81E All values in USD unless otherwise noted. October 25, 2020 Starbucks Corporation 4Q20 Preview, and Thoughts on FY21 Our view: SBUX is scheduled to report 4Q20 earnings on 10/29. A key focus for earnings—aside from an update on the pace of top line recovery —will be guidance for FY21, which we explore in greater detail in this note. In our view, SBUX remains an attractive recovery play within restaurants, due in large part to its ability to accelerate the transformation of its physical store base (e.g. develop more drive-thru and 'Pickup' stores), while also leveraging its already best-in-class digital platform and loyalty program. Adjusting estimates, and raising our PT to $97, from $89. Key points: SBUX is scheduled to report 4Q20 earnings on Thursday, October 29th. For the 4Q, we estimate EPS of $0.31, in line with consensus and near the high-end of the guidance range provided in July ($0.18 to $0.33). SBUX will also provide FY21 guidance with earnings (more on this below). For the 4Q, we estimate a consolidated global comp of -12%, driven by an Americas comp of -12% and International comp of -10%. In September, SBUX provided an intra-quarter update on comps for both the US (July -14%, August -11%) and China (July -10%, August flat; note that both China comp figures include the VAT exemption, a ~4pp benefit). Our estimates assume continued sequential recovery in the US, based on improving mobility data, as well as app usage data (see Exhibits 3 & 4). A tale of two halves? Thoughts on FY21: For FY21 (a 53 week year), we model EPS of $2.84, versus our prior $2.79 and consensus' $2.72. While the pace of SBUX's top line recovery will continue to be closely watched, the timing of the FY21 margin recovery will also be a key focus for investors and the subject of debate. SBUX will provide detailed FY21 guidance on Thursday, though mgmt has already indicated it believes that a margin recovery will lag the sales recovery by ~two quarters. For FY21, we assume an adjusted operating margin of 16.4%, below FY19's 17.2% and the company's (pre-COVID) LT target of 17-18%. We do assume, however, that margins accelerate meaningfully in the 2H—to ~18%, from ~14% in the 1H—driven by: 1) the continued store volume recovery and associated improving fixed cost leverage; 2) the tapering off of incremental investments; 3) the impact of accelerated closures of lower profitability stores (up to 400, or ~5% of, US company stores); and 4) the benefit of FY21's extra week. As noted, a key variable for margin improvement will be the level at which SBUX makes incremental investments in partners (i.e. employees) and technology. For context, during the Q most impacted by COVID (3Q20), SBUX made ~$300M in partner investments, including sick pay and enhanced frontline pay for store employees. While we don't yet know the contemplated level of incremental investments for FY21, we estimate that for each $100M in incremental investment spend, the impact to full-year FY21 consolidated margin would be ~35 bps, and ~$0.07 to EPS. Disseminated: Oct 25, 2020 15:36ET; Produced: Oct 25, 2020 15:36ET Priced as of prior trading day's market close, EST (unless otherwise noted). For Required Conflicts Disclosures, see Page 11.
Transcript of October 25, 2020 Christopher Carril Starbucks Corporation ...

EQU
ITY
RESE
ARC
H RBC Capital Markets, LLCChristopher Carril (Analyst)(617) [email protected]
Sector: Restaurants
OutperformNASDAQ: SBUX; USD 90.80
Price Target USD 97.00 ↑ 89.00WHAT'S INSIDE
Rating/Risk Change Price Target Change
In-Depth Report Est. Change
Preview News Analysis
Scenario Analysis*
DownsideScenario
67.0025%
CurrentPrice
90.80
PriceTarget
97.008%
UpsideScenario
111.0024%
*Implied Total Returns
Key StatisticsShares O/S (MM): 1,406.6Dividend: 1.44Float (MM): NADebt to Cap: NA
Market Cap (MM): 127,719Yield: 1.6%Tr. 12 ROE: NAAvg. Daily Volume: 6,125,5643-Yr. Est. EPS Growth: NA
RBC EstimatesFY Sep 2019A 2020E 2021E 2022ERevenue 26,508.6 23,448.1 28,737.4 30,576.8Prev. 23,478.0 28,727.4EPS, Ops Diluted 2.83 0.96 2.84 3.33Prev. 2.79P/E 32.1x NM 32.0x 27.3x
Revenue Q1 Q2 Q3 Q42019 6,632.7A 6,305.9A 6,823.0A 6,747.0A2020 7,097.1A 5,995.7A 4,222.1A 6,133.2EPrev. 6,163.1E2021 6,879.1E 6,609.2E 7,231.3E 8,017.8EPrev. 7,066.3E 6,920.2E 7,286.5E 7,454.4EEPS, Ops Diluted2019 0.75A 0.60A 0.78A 0.70A2020 0.79A 0.32A (0.46)A 0.31E2021 0.57E 0.56E 0.79E 0.91EPrev. 0.60E 0.58E 0.81E 0.81EAll values in USD unless otherwise noted.
October 25, 2020
Starbucks Corporation4Q20 Preview, and Thoughts on FY21Our view: SBUX is scheduled to report 4Q20 earnings on 10/29. A keyfocus for earnings—aside from an update on the pace of top line recovery—will be guidance for FY21, which we explore in greater detail in this note.In our view, SBUX remains an attractive recovery play within restaurants,due in large part to its ability to accelerate the transformation of itsphysical store base (e.g. develop more drive-thru and 'Pickup' stores),while also leveraging its already best-in-class digital platform and loyaltyprogram. Adjusting estimates, and raising our PT to $97, from $89.
Key points:SBUX is scheduled to report 4Q20 earnings on Thursday, October 29th.For the 4Q, we estimate EPS of $0.31, in line with consensus and near thehigh-end of the guidance range provided in July ($0.18 to $0.33). SBUXwill also provide FY21 guidance with earnings (more on this below). Forthe 4Q, we estimate a consolidated global comp of -12%, driven by anAmericas comp of -12% and International comp of -10%. In September,SBUX provided an intra-quarter update on comps for both the US (July-14%, August -11%) and China (July -10%, August flat; note that both Chinacomp figures include the VAT exemption, a ~4pp benefit). Our estimatesassume continued sequential recovery in the US, based on improvingmobility data, as well as app usage data (see Exhibits 3 & 4).
A tale of two halves? Thoughts on FY21: For FY21 (a 53 week year),we model EPS of $2.84, versus our prior $2.79 and consensus' $2.72.While the pace of SBUX's top line recovery will continue to be closelywatched, the timing of the FY21 margin recovery will also be a key focusfor investors and the subject of debate. SBUX will provide detailed FY21guidance on Thursday, though mgmt has already indicated it believesthat a margin recovery will lag the sales recovery by ~two quarters.For FY21, we assume an adjusted operating margin of 16.4%, belowFY19's 17.2% and the company's (pre-COVID) LT target of 17-18%. Wedo assume, however, that margins accelerate meaningfully in the 2H—to~18%, from ~14% in the 1H—driven by: 1) the continued store volumerecovery and associated improving fixed cost leverage; 2) the taperingoff of incremental investments; 3) the impact of accelerated closuresof lower profitability stores (up to 400, or ~5% of, US company stores);and 4) the benefit of FY21's extra week. As noted, a key variable formargin improvement will be the level at which SBUX makes incrementalinvestments in partners (i.e. employees) and technology. For context,during the Q most impacted by COVID (3Q20), SBUX made ~$300M inpartner investments, including sick pay and enhanced frontline pay forstore employees. While we don't yet know the contemplated level ofincremental investments for FY21, we estimate that for each $100M inincremental investment spend, the impact to full-year FY21 consolidatedmargin would be ~35 bps, and ~$0.07 to EPS.
Disseminated: Oct 25, 2020 15:36ET; Produced: Oct 25, 2020 15:36ET Priced as of prior trading day's market close, EST (unless otherwise noted).For Required Conflicts Disclosures, see Page 11.

Target/Upside/Downside Scenarios
Exhibit 1: Starbucks Corporation
150m
100m
50m
J J A S O N2018
D J F M A M J J A S O N2019
D J F M A M J J A S2020
O
UPSIDE 111.00TARGET 97.00CURRENT 90.80
DOWNSIDE 67.00
Oct 2021
10595
85
75
65
55
45
125 Weeks 04JUN18 - 23OCT20
SBUX US Rel. S&P 500 COMPOSITE MA 40 weeks
Source: Bloomberg and RBC Capital Markets estimates for Upside/Downside/Target
Price target/base caseOur price target of $97 is based on applying a 31.0x P/E multiple to CY21E EPS of $3.14 (prior metrics were 29xCY21E EPS of $3.06). Our target implies an EV/EBITDA multipleof ~19x on CY21E EBITDA. Our target multiple represents apremium to the broader fast food group given Starbucks’above-average long-term unit and revenue growth. Ourmultiple is supported by Starbucks’ dividend yield and ongoinggrowth model seeking to deliver double-digit EPS growth,which we see as increasingly rare among larger publicly tradedconsumer companies.
Upside scenarioOur upside scenario of $111 is based on 33.0x upside CY21EEPS of $3.35. Our upside target multiple is above SBUX’srecent peak multiple and would represent a premium to therestaurant peer group average.
Downside scenarioOur downside scenario of $67 is based on 25x downside CY21EEPS of $2.69. Our downside target multiple is approximately inline with SBUX’s more recent trough multiple and represents abelow-peer-group average multiple given our below-ongoing(double-digit) EPS growth in our downside scenario.
Investment summaryRare, quality growth among larger-cap consumer peer group:While there are numerous growth opportunities across theconsumer investing landscape, SBUX is among only a handfulof $100B market cap consumer companies expected to drivedouble-digit EPS growth in FY22E and beyond. While weexpect COVID-19 will impact FY20 and into FY21, we see long-term guidance as achievable—and potentially conservative—and setting up for double-digit growth beyond this year.
Potential catalysts• An acceleration in US traffic and/or same-store sales trends.• Continued strong growth in China.• An acceleration in unit development.• Delivery of double-digit EPS growth, in line with the
company’s ongoing goals.
Risks to our thesis• COVID-19 related risks may continue to impact top-line,
margins, and cash flow longer than expected.• Same-store sales could grow more slowly than anticipated
for a number of reasons, including: macro/consumerheadwinds; increased competition; declining consumerdemand for the brand.
• A number of potential factors can adversely impactrestaurant margins, including: higher-than-forecast laborcosts (driven by both government legislation and marketsupply/demand for labor); commodity volatility.
• Unit growth—a key long-term top-line driver for thecompany—could be impacted by increasing competition forreal estate, changes in development costs, or shifts in overalldemand for the brand.
Starbucks CorporationRestaurants
October 25, 2020 Christopher Carril, (617) 725-2109; [email protected] 2
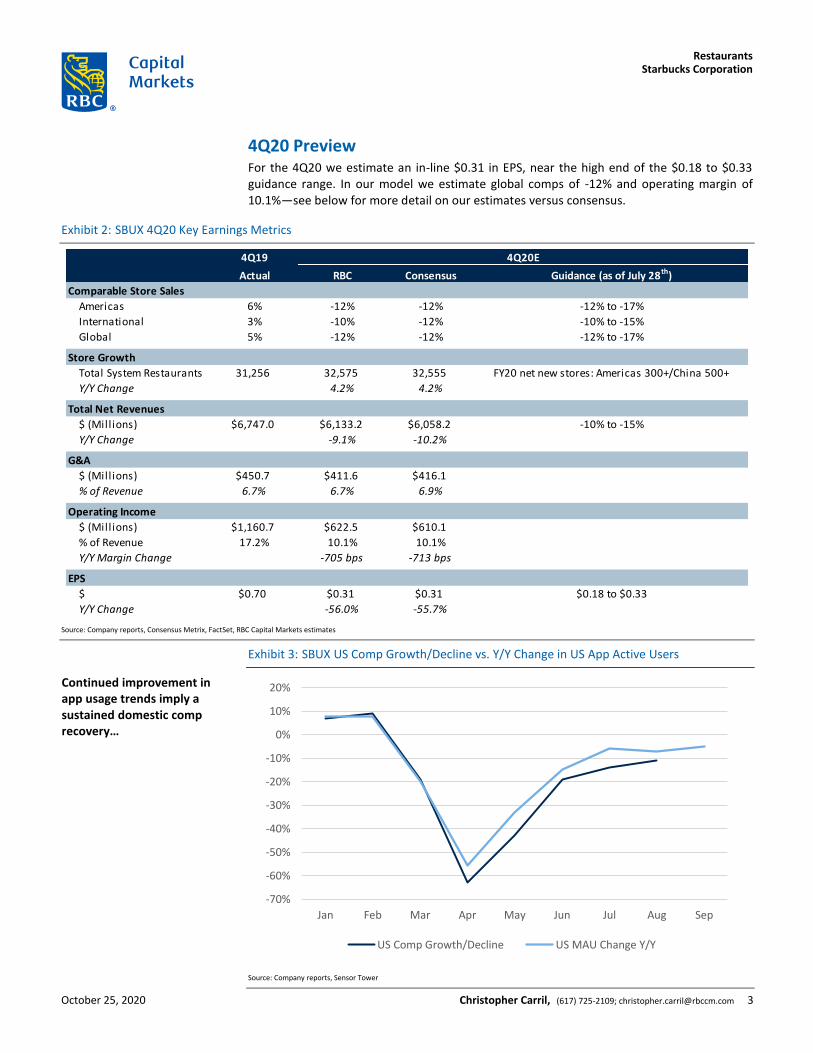
4Q20 Preview For the 4Q20 we estimate an in-line $0.31 in EPS, near the high end of the $0.18 to $0.33 guidance range. In our model we estimate global comps of -12% and operating margin of 10.1%—see below for more detail on our estimates versus consensus.
Exhibit 2: SBUX 4Q20 Key Earnings Metrics
Source: Company reports, Consensus Metrix, FactSet, RBC Capital Markets estimates
Exhibit 3: SBUX US Comp Growth/Decline vs. Y/Y Change in US App Active Users
Source: Company reports, Sensor Tower
4Q19 4Q20E FY21E
Actual RBC Consensus Guidance (as of July 28th)
Comparable Store Sales
Americas 6% -12% -12% -12% to -17%
International 3% -10% -12% -10% to -15%
Global 5% -12% -12% -12% to -17%
Store Growth
Total System Restaurants 31,256 32,575 32,555 FY20 net new stores: Americas 300+/China 500+
Y/Y Change 4.2% 4.2%
Total Net Revenues
$ (Mill ions) $6,747.0 $6,133.2 $6,058.2 -10% to -15%
Y/Y Change -9.1% -10.2%
G&A
$ (Mill ions) $450.7 $411.6 $416.1
% of Revenue 6.7% 6.7% 6.9%
Operating Income
$ (Mill ions) $1,160.7 $622.5 $610.1
% of Revenue 17.2% 10.1% 10.1%
Y/Y Margin Change -705 bps -713 bps
EPS
$ $0.70 $0.31 $0.31 $0.18 to $0.33
Y/Y Change -56.0% -55.7%
-70%
-60%
-50%
-40%
-30%
-20%
-10%
0%
10%
20%
Jan Feb Mar Apr May Jun Jul Aug Sep
US Comp Growth/Decline US MAU Change Y/Y
Continued improvement in app usage trends imply a sustained domestic comp recovery…
Starbucks CorporationRestaurants
October 25, 2020 Christopher Carril, (617) 725-2109; [email protected] 3

Exhibit 4: SBUX US Comp Growth/Decline vs. Change In US Mobility Trends (7-Day Average, Indexed to January 13th)
Source: Company reports, Apple Mobility Trends Reports
Thoughts on FY21 For FY21, we are estimating EPS of $2.84, versus consensus of $2.72. A key factor for FY21 earnings growth will be Americas segment margin recovery, driven by sales improvement in the US, as well as the level of investment spend by SBUX to support the ongoing recovery. While SBUX does plan to provide detailed FY21 guidance with 4Q20 earnings, management has already provided some directional guidance, including:
FY21 includes a 53rd week. For context, FY16 was the last year with a 53rd week, and the extra week added about $0.06 to EPS of $1.89 (or ~4% to overall growth of nearly 20%). Of course, the circumstances of that year were far different than that of FY21.
In September, the company reiterated that it expects—based on the current trajectory—that US comps will turn positive by the end of 2Q21, and that China comps (ex-VAT benefit) will turn positive by the end of 1Q21.
With respect to margins, the company noted with 3Q20 earnings (in July), that it expects margin recovery to trail sales recovery by ~two quarters. The company expects investment spend (e.g. labor and tech investments) to continue into FY21.
Net new unit growth in the Americas segment will be impacted by transformation initiatives (e.g. accelerated drive-thru and Pickup stores) as well as closures. As such, the company anticipates a return to the Americas +3-4% annual net new unit growth model beyond FY21, with lower net new unit growth in FY21.
In our model, we assume overall operating margin for the year will be 16.4%, which is below the company’s (pre-COVID) “ongoing model” target of 17% to 18% and FY19’s 17.2%. We assume that margins will recover back to near-FY19 levels by the 3Q.
0
20
40
60
80
100
120
140
160
-70%
-60%
-50%
-40%
-30%
-20%
-10%
0%
10%
Jan Feb Mar Apr May Jun Jul Aug Sep Oct
SBUX US Comp (LHS) US Mobility - Driving US Mobility - Transit
… as does stabilization of mobility trends
Starbucks CorporationRestaurants
October 25, 2020 Christopher Carril, (617) 725-2109; [email protected] 4

Exhibit 5: SBUX FY21 Key Earnings Metrics
Source: Company reports, Consensus Metrix, FactSet, RBC Capital Markets estimates
Exhibit 6: SBUX Consolidate Adj. Operating Margin
Source: Company reports, RBC Capital Markets estimates
FY21E
RBC Consensus Comments
Comparable Store Sales
Americas 20% 18%
International 30% 27%
Global 22% 20%
Store Growth
Total System Restaurants 34,440 34,241
Y/Y Change 5.7% 5.2%
Total Net Revenues
$ (Mill ions) $28,737.4 $28,169.3 53 Week Year
Y/Y Change 22.6% 20.5%
G&A
$ (Mill ions) $1,820.8 $1,747.6
% of Revenue 6.3% 6.2%
Operating Income
$ (Mill ions) $4,719.8 $4,535.6
Y/Y Change 143.6% 135.6%
% of Revenue 16.4% 16.1%
EPS
$ $2.84 $2.72 53 Week Year
Y/Y Change 197.0% 180.4%
18.0%17.2%
8.3%
16.4%
14.4%
18.2% 17-18%
6.0%
8.0%
10.0%
12.0%
14.0%
16.0%
18.0%
20.0%
FY18A FY19A FY20E FY21E 1HFY21E
2HFY21E
OngoingModel
Includes benefitof 53rd week
We are modeling meaningful operating margin expansion in the 2H of FY21…
Starbucks CorporationRestaurants
October 25, 2020 Christopher Carril, (617) 725-2109; [email protected] 5

Exhibit 7: SBUX Quarterly EPS
Source: Company reports, RBC Capital Markets estimates
As noted earlier, the key driver of SBUX’s overall margin recovery will be that of the Americas segment, given that: A) Americas segment operating income was responsible for nearly 85% of consolidated operating income in FY19; and B) China (~10%+ of overall operating profit, and a significant portion of International segment) has seen sales recover faster, so International margin recovery is less of a debate. Top line recovery will be driven by factors both within SBUX’s control, as well as external factors, including the impact of at-home coffee consumption and changes in consumer mobility. However, we assume that store volumes approach FY19 levels by the late 1Q or early 2Q, with sales effectively “fully” recovered by 3Q21.
($0.60)
($0.40)
($0.20)
$0.00
$0.20
$0.40
$0.60
$0.80
$1.00… Which we expect to drive an acceleration in EPS in the 3Q/4Q of FY21
Starbucks CorporationRestaurants
October 25, 2020 Christopher Carril, (617) 725-2109; [email protected] 6
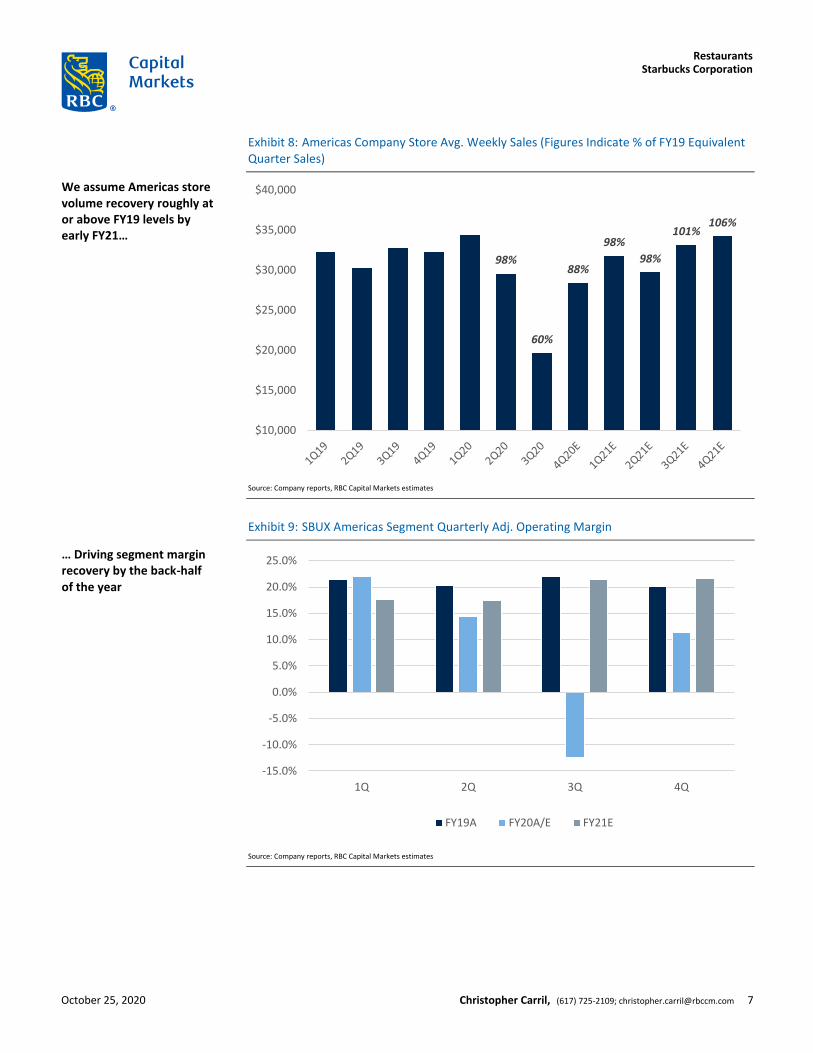
Exhibit 8: Americas Company Store Avg. Weekly Sales (Figures Indicate % of FY19 Equivalent Quarter Sales)
Source: Company reports, RBC Capital Markets estimates
Exhibit 9: SBUX Americas Segment Quarterly Adj. Operating Margin
Source: Company reports, RBC Capital Markets estimates
98%
60%
88%
98%
98%
101%106%
$10,000
$15,000
$20,000
$25,000
$30,000
$35,000
$40,000
-15.0%
-10.0%
-5.0%
0.0%
5.0%
10.0%
15.0%
20.0%
25.0%
1Q 2Q 3Q 4Q
FY19A FY20A/E FY21E
We assume Americas store volume recovery roughly at or above FY19 levels by early FY21…
… Driving segment margin recovery by the back-half of the year
Starbucks CorporationRestaurants
October 25, 2020 Christopher Carril, (617) 725-2109; [email protected] 7

Exhibit 10: SBUX Americas Segment Average Weekly Sales vs. Adj. Operating Margin
Source: Company reports, Consensus Metrix, Factset, RBC Capital Markets estimates
16.0%
17.0%
18.0%
19.0%
20.0%
21.0%
22.0%
$15,000
$20,000
$25,000
$30,000
$35,000
$40,000
Americas (Company) Avg. Weekly Sales Americas Operating Margin (RHS)
RBC Estimates Consensus EstimatesVersus consensus, we assume more significant margin expansion in the back-half of FY21
Starbucks CorporationRestaurants
October 25, 2020 Christopher Carril, (617) 725-2109; [email protected] 8

ValuationOur price target of $97 is based on applying a 31.0x P/E multiple to CY21E EPS of $3.14. Ourtarget implies an EV/EBITDA multiple of ~19x on CY21E EBITDA. Our target multiple representsa premium to the broader fast food group given Starbucks’ above-average long-term unit andrevenue growth. Our multiple is supported by Starbucks’ dividend yield and ongoing growthmodel seeking to deliver double-digit EPS growth, which we see as increasingly rare amonglarger publicly traded consumer companies. Our price target supports our Outperform rating.
Risks to rating and price targetOur investment view is driven by a number of factors and any material deviation from thefollowing may add or diminish support for the stock price:
1. COVID-19 related risks may continue to impact top-line, margins, and cash flow longer thanexpected.
2. Same-store sales could grow more slowly than anticipated for a number of reasons,including: macro/consumer headwinds; increased competition; declining consumerdemand for the brand.
3. A number of potential factors can adversely impact restaurant margins, including: higher-than-forecast labor costs (driven by both government legislation and market supply/demand for labor); commodity volatility.
4. Unit growth—a key long-term top-line driver for the company—could be impacted byincreasing competition for real estate, changes in development costs, or shifts in overalldemand for the brand.
Company descriptionStarbucks is a multi-channel brand company offering primarily brewed and espresso basedcoffee beverages, smoothies, and teas. It operates two distinct segments: Americas andInternational. The company operates and licenses more than 32,000 retail coffeehouses,bakeries, and mall-based stores serving ready-to-consume beverages and food items includingcoffee, tea, juices, and baked goods under the Starbucks brand. The company licenses brandedpackaged goods in grocery, warehouse, and mass market channels as part of its ChannelDevelopment segment.
Starbucks CorporationRestaurants
October 25, 2020 Christopher Carril, (617) 725-2109; [email protected] 9

Resegmented
Starbucks Corporation (SBUX)
(in millions, except per share data)
Income Statement
Net revenues
Company-operated stores
Licensed stores
Other
Total net revenues
Cost of sales
Store operating expenses
Other operating expenses
Depreciation and amortization
General and Administrative
Income from equity investees
Operating income
Gain on sale of investment/other
Interest income and other, net
Interest expense
Total other income
Earnings before income taxes
Income tax expense
Reported Net Income
EPS
Diluted Shares Out
YOY Change
Share Price
Dividends per share
% Growth YOY
Margins / Key Ratios
Cost of sales including occupancy costs
YOY basis point change
Store operating expenses
YOY basis point change
Company-operated Margin
YOY basis point change
Other operating expenses
YOY basis point change
Depreciation and amortization (% of total revenue)
Depreciation and amortization (% of company revenue)
YOY basis point change
G&A % of operating revenue
YOY basis point change
G&A % of system-wide sales
EBIT Margin
YOY change margin (bps)
Interest % of Avg. Net Debt
Tax rate
Year-Over-Year Changes
Company-operated stores
Licensed stores
Other
Licensed + Other
Total net revenues
Cost of sales including occupancy costs
Store operating expenses
Other operating expenses
Depreciation and amortization
General and Administrative
Income from equity investees
Operating income
Net income
EPS
Source: Company documents; RBC Capital Markets estimates
Resegmented
2016 2017 2018 1Q19 2Q19 3Q19 4Q19 2019 1Q20 2Q20 3Q20 4Q20E 2020E 2021E 2022E
Dec-18 Mar-19 Jun-19 Sep-19 Dec-19 Mar-20 Jun-20 Sep-20
$16,844.2 $17,650.7 $19,690.3 $5,370.3 $5,159.0 $5,535.0 $5,480.1 $21,544.4 $5,780.7 $4,766.0 $3,444.4 $4,980.5 $18,971.6 $23,328.3 $24,840.1
2,355.0 2,652.2 737.1 678.2 725.0 734.7 2,875.0 792.0 689.8 300.5 692.6 2,474.9 3,192.2 3,457.8
2,381.0 2,376.9 525.3 468.7 563.0 532.2 2,089.2 524.4 539.9 477.2 460.1 2,001.6 2,216.9 2,278.9
21,315.9 22,386.7 24,719.4 6,632.7 6,305.9 6,823.0 6,747.0 26,508.6 7,097.1 5,995.7 4,222.1 6,133.2 23,448.1 28,737.4 30,576.8
8,511.0 9,023.0 7,929.0 2,176.0 2,012.0 2,199.6 2,139.8 8,527.4 2,236.4 1,997.7 1,484.0 1,969.4 7,687.5 9,195.1 9,821.4
6,064.3 6,489.1 9,460.8 2,582.1 2,550.3 2,638.3 2,706.1 10,476.8 2,818.2 2,717.2 2,533.5 2,814.6 10,883.5 11,604.0 11,984.6
545.4 500.2 507.2 92.6 82.8 90.6 90.0 356.0 96.5 88.4 98.6 92.6 376.1 408.5 434.4
980.8 962.9 1,071.9 281.0 302.2 289.5 291.6 1,164.3 297.9 302.7 308.1 313.7 1,222.4 1,322.9 1,426.9
1,326.6 1,390.4 1,594.1 415.1 421.8 434.4 450.7 1,722.0 430.6 403.4 396.5 411.6 1,642.1 1,820.8 1,929.3
318.2 391.4 301.2 67.8 62.3 76.0 91.9 298.0 73.9 67.9 68.4 91.3 301.5 333.7 356.6
4,206.0 4,412.5 4,457.6 1,153.7 999.1 1,246.6 1,160.7 4,560.1 1,291.4 554.2 (530.2) 622.5 1,937.9 4,719.8 5,336.8
5.6 0.0 5.4 0.0 0.0 0.0 0.0 0.0 0.0 0.0 0.0 0.0 0.0 0.0 0.0
108.0 191.4 191.4 24.8 15.2 40.2 16.4 96.6 15.9 2.0 12.7 5.0 35.6 70.0 70.0
(81.3) (92.5) (170.2) (75.0) (73.9) (86.4) (95.7) (331.0) (91.9) (99.2) (120.8) (128.1) (440.0) (498.0) (498.0)
32.3 98.9 26.6 (50.2) (58.7) (46.2) (79.3) (234.4) (76.0) (97.2) (108.1) (123.1) (404.4) (428.0) (428.0)
4,238.3 4,511.4 4,484.2 1,103.5 940.4 1,200.4 1,081.4 4,325.7 1,215.4 457.0 (638.3) 499.4 1,533.5 4,291.8 4,908.8
1,426.1 1,478.4 1,102.7 163.5 185.3 252.3 237.7 838.7 273.3 79.5 (98.8) 139.8 393.7 987.1 1,129.0
$2,812.2 $3,033.0 $3,381.5 $940.1 $755.1 $948.1 $843.7 $3,487.0 $942.1 $377.5 ($539.5) $359.5 $1,139.7 $3,304.7 $3,779.8
$1.89 $2.07 $2.42 $0.75 $0.60 $0.78 $0.70 $2.83 $0.79 $0.32 ($0.46) $0.31 $0.96 $2.84 $3.33
1,486.9 1,462.4 1,394.7 1,253.4 1,250.7 1,223.0 1,205.6 1,232.7 1,191.0 1,180.7 1,168.5 1,168.5 1,191.2 1,163.0 1,134.9
-1.7% -1.6% -4.6% -12.6% -11.1% -11.9% -10.6% -11.6% -5.0% -5.6% -4.5% -3.1% -3.4% -2.4% -2.4%
$77 $79
$0.85 $1.05 $1.32 $0.36 $0.36 $0.36 $0.41 $1.49 $0.41 $0.41 $0.41 $0.47 $1.70 $1.96 $2.25
$0.25 $0.24 25.7% 20% 20% 0% 14% $0.13 14% 14% 14% 15% $0.14 $0.15 $0.15
50.5% 51.1% 40.3% 40.5% 39.0% 39.7% 39.0% 39.6% 38.7% 41.9% 43.1% 39.5% 40.5% 39.4% 39.5%
(71) bp 59 bp (1,085) bp (133) bp (139) bp 69 bp (85) bp (69) bp (183) bp 292 bp 334 bp 50 bp 94 bp (111) bp 12 bp
36.0% 36.8% 48.0% 48.1% 49.4% 47.7% 49.4% 48.6% 48.8% 57.0% 73.6% 56.5% 57.4% 49.7% 48.2%
40 bp 76 bp 1,128 bp 54 bp 47 bp 2 bp 133 bp 58 bp 67 bp 758 bp 2,589 bp 713 bp 874 bp (763) bp (149) bp
13.5% 12.1% 11.7% 11.4% 11.6% 12.6% 11.6% 11.8% 12.6% 1.1% (16.6%) 3.9% 2.1% 10.8% 12.2%
32 bp (135) bp (43) bp 79 bp 92 bp (71) bp (48) bp 11 bp 116 bp (1,049) bp (2,923) bp (763) bp (968) bp 873 bp 137 bp
12.2% 10.6% 10.1% 7.3% 7.2% 7.0% 7.1% 7.2% 7.3% 7.2% 12.7% 8.0% 8.4% 7.6% 7.6%
(98) bp (164) bp (48) bp (264) bp (292) bp (341) bp (267) bp (291) bp (0) bp (3) bp 564 bp 93 bp 123 bp (85) bp 2 bp
4.6% 4.3% 4.3% 4.2% 4.8% 4.2% 4.3% 4.4% 4.2% 5.0% 7.3% 5.1% 5.2% 4.6% 4.7%
5.8% 5.5% 5.4% 5.2% 5.9% 5.2% 5.3% 5.4% 5.2% 6.4% 8.9% 6.3% 6.4% 5.7% 5.7%
(6) bp (37) bp (1) bp 3 bp 14 bp (20) bp (10) bp (4) bp (8) bp 49 bp 371 bp 98 bp 104 bp (77) bp 7 bp
6.2% 6.2% 6.4% 6.3% 6.7% 6.4% 6.7% 6.5% 6.1% 6.7% 9.4% 6.7% 7.0% 6.3% 6.3%
26 bp (1) bp 24 bp 5 bp 14 bp (28) bp 30 bp 5 bp (19) bp 4 bp 302 bp 3 bp 51 bp (67) bp (3) bp
4.5% 4.4% 4.5% 4.3% 4.6% 4.4% 4.6% 4.5% 4.1% 4.6% 7.6% 4.5% 4.9% 4.3% 4.3%
19.7% 19.7% 18.0% 17.4% 15.8% 18.3% 17.2% 17.2% 18.2% 9.2% -12.6% 10.1% 8.3% 16.4% 17.5%
66 bp (2) bp (168) bp (183) bp (36) bp (27) bp (93) bp (83) bp 80 bp (660) bp (3,083) bp (705) bp (894) bp 816 bp 103 bp
3.0% 2.5% 2.6% 3.3% 3.2% 3.4% 3.4% 3.3% 3.4% 3.5% 3.8% 3.5% 3.4% 3.4% 3.3%
33.6% 32.8% 24.6% 14.8% 19.7% 21.0% 22.0% 19.4% 22.5% 17.4% 15.5% 28.0% 25.7% 23.0% 23.0%
10.8% 4.8% 11.6% 13.3% 6.9% 9.4% 8.3% 9.4% 7.6% (7.6%) (37.8%) (9.1%) (11.9%) 23.0% 6.5%
12.6% 8.0% 8.4% 9.7% 7.5% 8.4% 7.4% 1.7% (58.6%) (5.7%) (13.9%) 29.0% 8.3%
(0.2%) (19.1%) (18.9%) (4.5%) (4.9%) (12.1%) (0.2%) 15.2% (15.2%) (13.6%) (4.2%) 10.8% 2.8%
12.8% 5.9% 6.2% (5.2%) (4.7%) 3.0% 1.9% (1.3%) 4.3% 7.2% (39.6%) (9.0%) (9.8%) 20.8% 6.1%
11.2% 5.0% 10.4% 9.2% 4.5% 8.1% 7.0% 7.2% 7.0% (4.9%) (38.1%) (9.1%) (11.5%) 22.6% 6.4%
9.3% 6.0% -12.1% 9.7% 3.2% 11.3% 6.0% 7.5% 2.8% -0.7% -32.5% -8.0% -9.8% 19.6% 6.8%
12.1% 7.0% 45.8% 14.5% 7.9% 9.4% 11.3% 10.7% 9.1% 6.5% -4.0% 4.0% 3.9% 6.6% 3.3%
4.4% -8.3% 1.4% -30.3% -32.2% -30.6% -26.0% -29.8% 4.2% 6.8% 8.8% 2.9% 5.6% 8.6% 6.4%
9.7% -1.8% 11.3% 13.8% 9.5% 5.4% 6.3% 8.6% 6.0% 0.2% 6.4% 7.6% 5.0% 8.2% 7.9%
16.2% 4.8% 14.7% 10.0% 6.7% 3.5% 12.1% 8.0% 3.7% -4.4% -8.7% -8.7% -4.6% 10.9% 6.0%
27.3% 23.0% -23.0% -24.2% 18.2% 6.4% 4.8% -1.1% 9.0% 9.0% -10.0% -0.6% 1.2% 10.7% 6.9%
15.1% 4.9% 1.0% -1.2% 2.3% 6.6% 1.5% 2.3% 11.9% -44.5% -142.5% -46.4% -57.5% 143.6% 13.1%
17.5% 7.9% 11.5% 0.7% 0.5% 10.1% 0.9% 3.1% 0.2% -50.0% -156.9% -57.4% -67.3% 190.0% 14.4%
19.7% 9.7% 16.9% 15.3% 13.0% 25.0% 12.9% 16.7% 5.5% -47.0% -159.6% -56.0% -66.2% 197.0% 17.2%
Starbucks CorporationRestaurants
October 25, 2020 Christopher Carril, (617) 725-2109; [email protected] 10
Required disclosures
Conflicts disclosuresThe analyst(s) responsible for preparing this research report received compensation that is based upon various factors, includingtotal revenues of the member companies of RBC Capital Markets and its affiliates, a portion of which are or have been generatedby investment banking activities of the member companies of RBC Capital Markets and its affiliates.
Please note that current conflicts disclosures may differ from those as of the publication date on, and as set forth in,this report. To access current conflicts disclosures, clients should refer to https://www.rbccm.com/GLDisclosure/PublicWeb/DisclosureLookup.aspx?entityId=1 or send a request to RBC CM Research Publishing, P.O. Box 50, 200 Bay Street, Royal Bank Plaza,29th Floor, South Tower, Toronto, Ontario M5J 2W7.
RBC Capital Markets, LLC makes a market in the securities of Starbucks Corporation.
Explanation of RBC Capital Markets Equity rating systemAn analyst's 'sector' is the universe of companies for which the analyst provides research coverage. Accordingly, the rating assignedto a particular stock represents solely the analyst's view of how that stock will perform over the next 12 months relative to theanalyst's sector average.RatingsOutperform (O): Expected to materially outperform sector average over 12 months.Sector Perform (SP): Returns expected to be in line with sector average over 12 months.Underperform (U): Returns expected to be materially below sector average over 12 months.Restricted (R): RBC policy precludes certain types of communications, including an investment recommendation, when RBC isacting as an advisor in certain merger or other strategic transactions and in certain other circumstances.Not Rated (NR): The rating, price targets and estimates have been removed due to applicable legal, regulatory or policy constraintswhich may include when RBC Capital Markets is acting in an advisory capacity involving the company.As of March 31, 2020, RBC Capital Markets discontinued its Top Pick rating. Top Pick rated securities represented an analysts bestidea in the sector; expected to provide significant absolute returns over 12 months with a favorable risk-reward ratio. Top Pickrated securities have been reassigned to our Outperform rated securities category, which are securities expected to materiallyoutperform sector average over 12 months.Risk RatingThe Speculative risk rating reflects a security's lower level of financial or operating predictability, illiquid share trading volumes,high balance sheet leverage, or limited operating history that result in a higher expectation of financial and/or stock price volatility.
Distribution of ratingsFor the purpose of ratings distributions, regulatory rules require member firms to assign ratings to one of three rating categories -Buy, Hold/Neutral, or Sell - regardless of a firm's own rating categories. Although RBC Capital Markets' ratings of Outperform (O),Sector Perform (SP), and Underperform (U) most closely correspond to Buy, Hold/Neutral and Sell, respectively, the meanings arenot the same because our ratings are determined on a relative basis.
Distribution of ratings
RBC Capital Markets, Equity Research
As of 30-Sep-2020
Investment Banking
Serv./Past 12 Mos.
Rating Count Percent Count Percent
BUY [Outperform] 788 52.96 248 31.47
HOLD [Sector Perform] 619 41.60 135 21.81
SELL [Underperform] 81 5.44 11 13.58
Starbucks CorporationRestaurants
October 25, 2020 Christopher Carril, (617) 725-2109; [email protected] 11

Rating and price target history for: Starbucks Corporation, SBUX US as of 23-Oct-2020 (in USD)
110
100
90
80
70
60
50
40Q3 2018 Q1 Q2 Q3 2019 Q1 Q2 Q3 2020 Q1 Q2 Q3 2021
21-Dec-2017Rtg:O
Target: 66.00
26-Jan-2018Rtg:O
Target: 65.00
20-Jun-2018Rtg:O
Target: 63.00
16-Jul-2018Rtg:O
Target: 58.00
02-Nov-2018Rtg:O
Target: 68.00
14-Dec-2018Rtg:O
Target: 74.00
25-Jan-2019Rtg:O
Target: 75.00
14-Feb-2019Rtg:NR
Target: NA
09-Dec-2019Rtg:I:O
Target: 97.00
11-Dec-2019RL 8 ON
30-Mar-2020Rtg:O
Target: 80.00
29-Apr-2020Rtg:O
Target: 86.00
10-Jun-2020Rtg:O
Target: 85.00
29-Jul-2020Rtg:O
Target: 89.00
Legend:TP: Top Pick; O: Outperform; SP: Sector Perform; U: Underperform; R: Restricted; I: Initiation of Research Coverage; D: Discontinuation of Research Coverage;NR: Not Rated; NA: Not Available; RL: Recommended List - RL: On: Refers to date a security was placed on a recommended list, while RL Off: Refers to datea security was removed from a recommended list; Rtg: Rating.
Created by: BlueMatrix
References to a Recommended List in the recommendation history chart may include one or more recommended lists or modelportfolios maintained by RBC Wealth Management or one of its affiliates. RBC Wealth Management recommended lists includethe Guided Portfolio: Prime Income (RL 6), the Guided Portfolio: Dividend Growth (RL 8), the Guided Portfolio: ADR (RL 10),and the Guided Portfolio: All Cap Growth (RL 12). RBC Capital Markets recommended lists include the Strategy Focus List andthe Fundamental Equity Weightings (FEW) portfolios. The abbreviation 'RL On' means the date a security was placed on aRecommended List. The abbreviation 'RL Off' means the date a security was removed from a Recommended List.
Equity valuation and risksFor valuation methods used to determine, and risks that may impede achievement of, price targets for covered companies, pleasesee the most recent company-specific research report at https://www.rbcinsightresearch.com or send a request to RBC CapitalMarkets Research Publishing, P.O. Box 50, 200 Bay Street, Royal Bank Plaza, 29th Floor, South Tower, Toronto, Ontario M5J 2W7.
Starbucks Corporation
Valuation
Our price target of $97 is based on applying a 31.0x P/E multiple to CY21E EPS of $3.14. Our target implies an EV/EBITDA multiple of~19x on CY21E EBITDA. Our target multiple represents a premium to the broader fast food group given Starbucks’ above-averagelong-term unit and revenue growth. Our multiple is supported by Starbucks’ dividend yield and ongoing growth model seeking todeliver double-digit EPS growth, which we see as increasingly rare among larger publicly traded consumer companies. Our pricetarget supports our Outperform rating.
Risks to rating and price target
Our investment view is driven by a number of factors and any material deviation from the following may add or diminish supportfor the stock price:
1. COVID-19 related risks may continue to impact top-line, margins, and cash flow longer than expected.
2. Same-store sales could grow more slowly than anticipated for a number of reasons, including: macro/consumer headwinds;increased competition; declining consumer demand for the brand.
3. A number of potential factors can adversely impact restaurant margins, including: higher-than-forecast labor costs (driven byboth government legislation and market supply/demand for labor); commodity volatility.
4. Unit growth—a key long-term top-line driver for the company—could be impacted by increasing competition for real estate,changes in development costs, or shifts in overall demand for the brand.
Starbucks CorporationRestaurants
October 25, 2020 Christopher Carril, (617) 725-2109; [email protected] 12
Conflicts policyRBC Capital Markets Policy for Managing Conflicts of Interest in Relation to Investment Research is available from us on request.To access our current policy, clients should refer tohttps://www.rbccm.com/global/file-414164.pdfor send a request to RBC Capital Markets Research Publishing, P.O. Box 50, 200 Bay Street, Royal Bank Plaza, 29th Floor, SouthTower, Toronto, Ontario M5J 2W7. We reserve the right to amend or supplement this policy at any time.
Dissemination of research and short-term trade ideasRBC Capital Markets endeavors to make all reasonable efforts to provide research simultaneously to all eligible clients, havingregard to local time zones in overseas jurisdictions. RBC Capital Markets' equity research is posted to our proprietary websiteto ensure eligible clients receive coverage initiations and changes in ratings, targets and opinions in a timely manner. Additionaldistribution may be done by the sales personnel via email, fax, or other electronic means, or regular mail. Clients may alsoreceive our research via third party vendors. RBC Capital Markets also provides eligible clients with access to SPARC on the Firmsproprietary INSIGHT website, via email and via third-party vendors. SPARC contains market color and commentary regardingsubject companies on which the Firm currently provides equity research coverage. Research Analysts may, from time to time,include short-term trade ideas in research reports and / or in SPARC. A short-term trade idea offers a short-term view onhow a security may trade, based on market and trading events, and the resulting trading opportunity that may be available. Ashort-term trade idea may differ from the price targets and recommendations in our published research reports reflecting theresearch analyst's views of the longer-term (one year) prospects of the subject company, as a result of the differing time horizons,methodologies and/or other factors. Thus, it is possible that a subject company's common equity that is considered a long-term'Sector Perform' or even an 'Underperform' might present a short-term buying opportunity as a result of temporary selling pressurein the market; conversely, a subject company's common equity rated a long-term 'Outperform' could be considered susceptibleto a short-term downward price correction. Short-term trade ideas are not ratings, nor are they part of any ratings system, andthe firm generally does not intend, nor undertakes any obligation, to maintain or update short-term trade ideas. Short-term tradeideas may not be suitable for all investors and have not been tailored to individual investor circumstances and objectives, andinvestors should make their own independent decisions regarding any securities or strategies discussed herein. Please contactyour investment advisor or institutional salesperson for more information regarding RBC Capital Markets' research.For a list of all recommendations on the company that were disseminated during the prior 12-month period, please click on thefollowing link: https://rbcnew.bluematrix.com/sellside/MAR.actionThe 12 month history of SPARCs can be viewed at https://www.rbcinsightresearch.com.
Analyst certificationAll of the views expressed in this report accurately reflect the personal views of the responsible analyst(s) about any and all ofthe subject securities or issuers. No part of the compensation of the responsible analyst(s) named herein is, or will be, directly orindirectly, related to the specific recommendations or views expressed by the responsible analyst(s) in this report.
Third-party-disclaimersThe Global Industry Classification Standard ("GICS”) was developed by and is the exclusive property and a service mark of MSCI Inc. (“MSCI”) and Standard & Poor's Financial ServicesLLC (“S&P”) and is licensed for use by RBC. Neither MSCI, S&P, nor any other party involved in making or compiling the GICS or any GICS classifications makes any express or impliedwarranties or representations with respect to such standard or classification (or the results to be obtained by the use thereof), and all such parties hereby expressly disclaim all warrantiesof originality, accuracy, completeness, merchantability and fitness for a particular purpose with respect to any of such standard or classification. Without limiting any of the foregoing,in no event shall MSCI, S&P, any of their affiliates or any third party involved in making or compiling the GICS or any GICS classifications have any liability for any direct, indirect, special,punitive, consequential or any other damages (including lost profits) even if notified of the possibility of such damages.
RBC Capital Markets disclaims all warranties of originality, accuracy, completeness, merchantability or fitness for a particular purpose with respect to any statements made to the mediaor via social media that are in turn quoted in this report, or otherwise reproduced graphically for informational purposes.
References herein to "LIBOR", "LIBO Rate", "L" or other LIBOR abbreviations means the London interbank offered rate as administered by ICE Benchmark Administration (or any otherperson that takes over the administration of such rate).
Disclaimer
RBC Capital Markets is the business name used by certain branches and subsidiaries of the Royal Bank of Canada, including RBC Dominion Securities Inc., RBCCapital Markets, LLC, RBC Europe Limited, Royal Bank of Canada, Hong Kong Branch and Royal Bank of Canada, Sydney Branch. The information contained in thisreport has been compiled by RBC Capital Markets from sources believed to be reliable, but no representation or warranty, express or implied, is made by RoyalBank of Canada, RBC Capital Markets, its affiliates or any other person as to its accuracy, completeness or correctness. All opinions and estimates contained in this
Starbucks CorporationRestaurants
October 25, 2020 Christopher Carril, (617) 725-2109; [email protected] 13
report constitute RBC Capital Markets' judgement as of the date of this report, are subject to change without notice and are provided in good faith but withoutlegal responsibility. Nothing in this report constitutes legal, accounting or tax advice or individually tailored investment advice. This material is prepared for generalcirculation to clients and has been prepared without regard to the individual financial circumstances and objectives of persons who receive it. The investments orservices contained in this report may not be suitable for you and it is recommended that you consult an independent investment advisor if you are in doubt aboutthe suitability of such investments or services. This report is not an offer to sell or a solicitation of an offer to buy any securities. Past performance is not a guideto future performance, future returns are not guaranteed, and a loss of original capital may occur. RBC Capital Markets research analyst compensation is basedin part on the overall profitability of RBC Capital Markets, which includes profits attributable to investment banking revenues. Every province in Canada, state inthe U.S., and most countries throughout the world have their own laws regulating the types of securities and other investment products which may be offered totheir residents, as well as the process for doing so. As a result, the securities discussed in this report may not be eligible for sale in some jurisdictions. RBC CapitalMarkets may be restricted from publishing research reports, from time to time, due to regulatory restrictions and/ or internal compliance policies. If this is the case,the latest published research reports available to clients may not reflect recent material changes in the applicable industry and/or applicable subject companies.RBC Capital Markets research reports are current only as of the date set forth on the research reports. This report is not, and under no circumstances should beconstrued as, a solicitation to act as securities broker or dealer in any jurisdiction by any person or company that is not legally permitted to carry on the business of asecurities broker or dealer in that jurisdiction. To the full extent permitted by law neither RBC Capital Markets nor any of its affiliates, nor any other person, acceptsany liability whatsoever for any direct, indirect or consequential loss arising from, or in connection with, any use of this report or the information contained herein.No matter contained in this document may be reproduced or copied by any means without the prior written consent of RBC Capital Markets in each instance.
Additional information is available on request.
To U.S. Residents:This publication has been approved by RBC Capital Markets, LLC (member FINRA, NYSE, SIPC), which is a U.S. registered broker-dealer and which acceptsresponsibility for this report and its dissemination in the United States. Any U.S. recipient of this report that is not a registered broker-dealer or a bank acting ina broker or dealer capacity and that wishes further information regarding, or to effect any transaction in, any of the securities discussed in this report, shouldcontact and place orders with RBC Capital Markets, LLC.To Canadian Residents:This publication has been approved by RBC Dominion Securities Inc.(member IIROC). Any Canadian recipient of this report that is not a Designated Institution inOntario, an Accredited Investor in British Columbia or Alberta or a Sophisticated Purchaser in Quebec (or similar permitted purchaser in any other province) andthat wishes further information regarding, or to effect any transaction in, any of the securities discussed in this report should contact and place orders with RBCDominion Securities Inc., which, without in any way limiting the foregoing, accepts responsibility for this report and its dissemination in Canada.To U.K. Residents:This publication has been approved by RBC Europe Limited ('RBCEL') which is authorized by the Prudential Regulation Authority and regulated by the FinancialConduct Authority ('FCA') and the Prudential Regulation Authority, in connection with its distribution in the United Kingdom. This material is not for generaldistribution in the United Kingdom to retail clients, as defined under the rules of the FCA. RBCEL accepts responsibility for this report and its dissemination inthe United Kingdom.To German Residents:This material is distributed in Germany by RBC Europe Limited, Frankfurt Branch which is regulated by the Bundesanstalt für Finanzdienstleistungsaufsicht (BaFin).To Persons Receiving This Advice in Australia:This material has been distributed in Australia by Royal Bank of Canada, Sydney Branch (ABN 86 076 940 880, AFSL No. 246521). This material has been prepared forgeneral circulation and does not take into account the objectives, financial situation or needs of any recipient. Accordingly, any recipient should, before acting onthis material, consider the appropriateness of this material having regard to their objectives, financial situation and needs. If this material relates to the acquisitionor possible acquisition of a particular financial product, a recipient in Australia should obtain any relevant disclosure document prepared in respect of that productand consider that document before making any decision about whether to acquire the product. This research report is not for retail investors as defined in section761G of the Corporations Act.To Hong Kong Residents:This publication is distributed in Hong Kong by Royal Bank of Canada, Hong Kong Branch, which is regulated by the Hong Kong Monetary Authority and theSecurities and Futures Commission (SFC) in Hong Kong, RBC Investment Services (Asia) Limited and RBC Global Asset Management (Asia) Limited, both entitiesare regulated by the SFC. This material is not for general distribution in Hong Kong to persons who are not professional investors (as defined in the Securities andFutures Ordinance of Hong Kong (Cap. 571) and any rules made thereunder.To Singapore Residents:This publication is distributed in Singapore by the Royal Bank of Canada, Singapore Branch, a registered entity licensed by the Monetary Authority of Singapore.This material has been prepared for general circulation and does not take into account the objectives, financial situation, or needs of any recipient. You are advisedto seek independent advice from a financial adviser before purchasing any product. If you do not obtain independent advice, you should consider whether theproduct is suitable for you. Past performance is not indicative of future performance. If you have any questions related to this publication, please contact the RoyalBank of Canada, Singapore Branch. Royal Bank of Canada, Singapore Branch accepts responsibility for this report and its dissemination in Singapore.To Japanese Residents:Unless otherwise exempted by Japanese law, this publication is distributed in Japan by or through RBC Capital Markets (Japan) Ltd. which is a Financial InstrumentsFirm registered with the Kanto Local Financial Bureau (Registered number 203) and a member of the Japan Securities Dealers Association (JSDA) and the FinancialFutures Association of Japan (FFAJ).
.® Registered trademark of Royal Bank of Canada. RBC Capital Markets is a trademark of Royal Bank of Canada. Used under license.Copyright © RBC Capital Markets, LLC 2020 - Member SIPC
Copyright © RBC Dominion Securities Inc. 2020 - Member Canadian Investor Protection FundCopyright © RBC Europe Limited 2020
Copyright © Royal Bank of Canada 2020All rights reserved
Starbucks CorporationRestaurants
October 25, 2020 Christopher Carril, (617) 725-2109; [email protected] 14