October 15, 1965 BUSINESS A WEEKLY STATISTICS · business statistics october 15, 1965 a weekly...
4
BUSINESS STATISTICS October 15, 1965 A WEEKLY SUPPLEMENT TO THE SURVEY OF CURRENT BUSINESS' U. S. DEPARTMENT OF COMMERCE / OFFICE OF BUSINESS ECONOMICS ; : Bi^i^;£r^:^ipi^ Index, 1941-43=10 index, 1941-43 = 100 90 80 70 60 - PRICES OF 425 INDUSTRIAL STOCKS > r*~^ XX - - Monthly (avg. of daily close) ™n4™™! A 4 i,„ i, J... ,', 1 .» 1. 1962 1963 1964 1965 JFMAMJ JASOND Index, 1957-59 = 100 200' 150 100" 50 0 STEEL PRODUCTION (Ingots and steel for costings) 1 • > 4 ^ - U - ^ ! • ~^~^ • • I 1 . 1 ... . ^^^^^^^ ~ ~ Monthly -In 1 ' ' ' 1 > 1 h 1 1 Index, 1957-59 = 100 200 150 1965 s* •"v«\. 1964 . , , l »x y^ X Weekly 100 50 1962 1963 1964 1965 JFMAMJ JASOND Billion Dollars 30 25 15 10 SALES OF RETAIL STORES (seasonally adjusted) 1962 Nondurable Goods (asJKSj sss «® ""S'^ T BB «» # ' #s,aBfc n \ Durable Goods \ . ffl „.u«.»««lK'-»' , " w,, '%** ^ ,M '»ll|U»' ,H "»l 1963 1964 1965 Dollars 2.80 2.60 2.40 2.20 2.00 1.80 MANUFACTURING HOURS & EARNINGS / Average Hourly Gross Earnings (left scale) Average Hours Per Week* (right scale) \j^> <% W&^%^ J ^ ^ i. I I I I I I I I 1962 ^«-4/^--^ v*-. *Seasonally adjusted i i i I i i i i i I i i i i • I i i i i i 48 46 44 42 40 38 1963 1964 1965 * Available only with subscription to the SURVEY OF CURRENT BUSINESS, at $6.00 annually, this Supplement provides selected weekly and monthly data subsequent to those published in the latest monthly SURVEY Digitized for FRASER http://fraser.stlouisfed.org/ Federal Reserve Bank of St. Louis
Transcript of October 15, 1965 BUSINESS A WEEKLY STATISTICS · business statistics october 15, 1965 a weekly...
BUSINESS STATISTICS
October 15, 1965
A WEEKLY
SUPPLEMENT
TO THE
SURVEY OF CURRENT BUSINESS'
U. S. DEPARTMENT OF COMMERCE / OFFICE OF BUSINESS ECONOMICS
; :Bi^i^;£r^:^ipi^
Index, 1941-43=10 index, 1941-43 =
100
90
80
70
60
- PRICES OF 425 INDUSTRIAL STOCKS
>
r*~^ X X
-
-
Monthly
(avg. of daily close)
™n4™™! A 4 i,„ i, J... ,', 1 ...» 1.
1962 1963 1964 1965 J F M A M J J A S O N D
Index, 1957-59 = 100 200'
150
100"
50
0
STEEL PRODUCTION (Ingots and steel for costings)
1 • > 4 ^ - U - ^ ! • ~ ^ ~ ^ • • I 1 . 1 ... .
^^^^^^^
~
~
Monthly
- I n 1 ' ' ' 1 > 1 h 1 1
Index, 1957-59 = 100 200
150 1965
s* •"v«\.
1964
. , , l
»x y ^ X
Weekly
100
50
1962 1963 1964 1965 J F M A M J J A S O N D
Billion Dollars 30
25
15
10
SALES OF RETAIL STORES (seasonally adjusted)
1962
Nondurable Goods
(asJKSj sss «® ""S'^ T B B « » # ' # s , a B f c n
\
Durable Goods
\ .ffl„.u«.»««lK'-»',"w,,'%** ^ , M ' » l l | U » ' , H " » l
1963 1964 1965
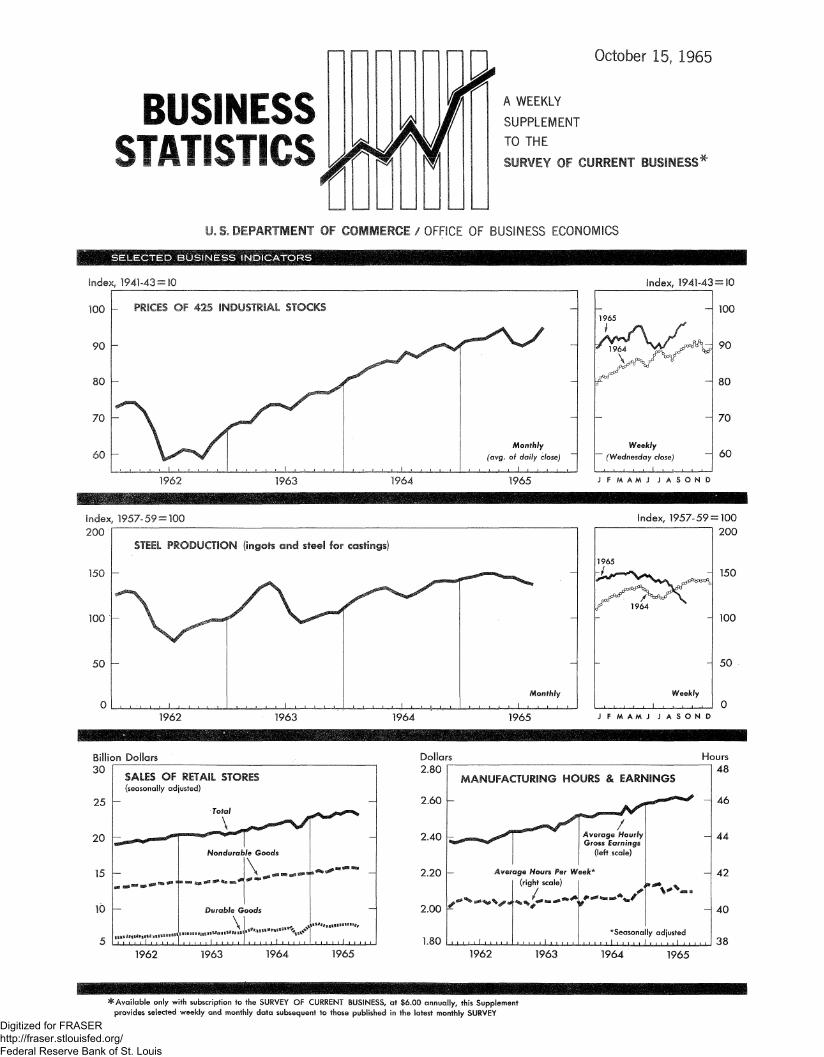
Dollars 2.80
2.60
2.40
2.20
2.00
1.80
MANUFACTURING HOURS & EARNINGS
/ Average Hourly Gross Earnings
(left scale)
Average Hours Per Week*
(r ight scale)
\j^> <% W&^%^ J ^ ^
i. I I I I I I I I
1962
^«-4/^--^ v*-. *Seasonal ly adjusted
i i i I i i i i i I i i i i • I i i i i i
48
46
44
42
40
38 1963 1964 1965
* Ava i l ab le only wi th subscription to the SURVEY OF CURRENT BUSINESS, at $6.00 annual ly , this Supplement
provides selected weekly and monthly da ta subsequent to those published in the latest monthly SURVEY
Digitized for FRASER http://fraser.stlouisfed.org/ Federal Reserve Bank of St. Louis

2 WEEKLY BUSINESS STATISTICS1
COMMODITY PRICES, WHOLESALE: Ai i commodities . i 957-59= 100. .
Farm products . .. -. .do. . „ . Foods, processed . do.... A I I other do
22 commod i t ies 2/ .do.. . . ALL RETAIL STORES, SALES.. . mil. $..
Nondurable goods stores ........do....
INITIAL UNEMPLOYMENT CLAIMS, State programs..........thous.. INSURED UNEMPLOYMENT, all programs do.... State programs (50 States, D.C., and Puerto Rico)...do....
FAILURES, INDUST. AND COMMERCIAL (Dun & Bradstreet).number.. FINANCE:
Currency in circulation^/ ....mil. $.. Federal Reserve bank credit outstanding, total 3_/...do. Member bank reserve ba lances _3/ do....
Excess reserves, estimated 3_/ do.... Reporting member banks (of F.R.System) in leading cities:4,/
Demand deposits, adjusted , ..mil. $.. Savi ngs depos its do.... Loans and investments (adjusted), total do....
U.S. Government obligations.. do.... Commercial and industrial loans (gross) do.... Real estate loans (gross) ......do....
Bond yields, domestic corporate (Moody's) 3/ percent.. Stock prices, 500 stocks (Stand. & Poor's)4/..1941-43=10..
Industrials, 425 stocks do.... PRODUCTION:
Bituminous coal _3/ thous. sh. tons.. Electric power, by utilities mil. kw-hr.. Motor vehicles (cars, trucks, buses) number.. Petroleum (crude) and condensate 3/ thous. bb I..
Steel thous. sh. tons.. Index of production 1957-59=100..
FREIGHT CARLOAD I NGS, TOTAL thous. cars.. Mi see I laneous do....
1964
Oct. 3
*I00.8 *93.8
*I0I.7 *ICH,5 10 I. I 5,362 3,457
212 1,235 I, 106
268
38,074 37,487 21,141
386
63,722 39,873 145,878 27,207 38,153 19,533.
4.56 84. 18 89. 12
1,669 18,331
101,21 I 7,621
2,563 137.6 611 325
Oct. 10
101.6
5,001
3,423,
237 1,241 1, 1 12 246
38,209
38,051 2 1,264
439
63,522 39,933 143,951 26,422 39,743 19,560
4.57 84.80 89.77
1,697
18,245 96,682 7,638
2,571 138.0 633 334
1965
Sept. IE
105.4 5, 145 3,525
177 1,049 940 243
40,488 4 1,508 21,583
464
66,203 43,967 159,423 22,987 47,697 21,869
4.69 89.52 95.09
1,657 21,025 155,098 7, 164
2,343
125.8 590 316
Sept. 25
105.7 5, 145 3,497
171 1,014
908 246
40,319
41,918 22, I 14
436
63,618 44,i 00 159,199 23,060 47,955 2 1,930
4.69 90.22 95.86
1,570
2 1,065 i86,894 7,515
2,259 121.3 '585 317
Oct. 2
102 98 105 102 105 5,427 3,568
177
230
40,286 41,578 21 .,890
33?
64,133 44,319 158,776 22,830 48,086 22,012
4.70 90.02 95.69
1,707 19,631
206,230 7,705
2,229 I 19.7 603 326
Oct. 9
102.8 7
06 02 05
242
40,448 42,196 22,084
496
4.71
90.54
96.25
225,634
2, 173
I 16.5
_]_/ Data do not always cover calendar weeks. 2/ Tuesday price. 3_/ Daily average. 4/ Wednesday data. * Monthly index for Oct. 1964.
MONTHLY BUSINESS STATISTICS
ITEM
1964
Aug. Sept.
1965
July Aug. Sept.
GENERAL BUSINESS INDICATORS
INDUSTRIAL AND COMMERCIAL FAILURES (Dun & Bradstreet, Inc.): Fa i lures, tota I number..
Commerc i a I servi ce do.... Construction .do.... Manufacturing and mining do.... Reta i I trade do . Whoiesa ie trade do....
Liabilities (current), total thous. $.. Commercia I service .do.... Construction do.... Manufacturing and mining do.... Retai I trade do.... Whoiesa Ie trade do....
Failure annual rate (seas. adj.)..No. per 10,000 concerns.
CONSTRUCTION AND REAL ESTATE
CONSTRUCTION COST INDEXES:
Associated General Contractors (bldg. only)..I 957-59=100..
DOMESTIC TRADE
RETAIL TRADE, ALL RETAIL STORES: ESTIMATED SALES (UNADJUSTED), TOTAL 1/ mi
DurabIe goods stores Automotive group Furniture and appliance group Lumber, building, hardware group
Nondurable goods stores Apparel group Drug and proprietary stores. Eating and drinking places.. Food group.. Gasoline service stations... General merchandise group
I . $ . d o . . .
. d o . . .
. d o . . .
. d o . . .
, d o . . . . d o . . . . d o . . . . d o . . . . d o . . . . d o . . . . d o . . .
1
95 22 17 16 25 12
169 1 13 203 185 550 1 18
, 180
,555 ,897
,079 ,715 ,934
59. I
120
21 ,778 7,01 I 3 ,853 1,111 1,052
14,767 1,209
708 1,805 5 ,283 1,801
2 ,591
1,034
1 14 6 32 31 24 19
208 163 484 98
565 074 185 396 958 952
56.3
120
21,313 6,893 3,728 1,088 1,045
,420 ,289 701 ,67 1. ,099 ,701 ,550
1
44 54 35 22 22 10
094 90
205 172 510 i 17
607 207 601 435 353 01 1
50. I
23", 825 8,451 5,071 I, I 10 I, 175
15,374 1,229
744 1,852 5,422 1,899
2,682
1
121 4 53 31 21 10
074 82 205 157 514 1 ID
485 ,891 ,372
, 145 ,352 ,725
52.8
124
r24,129 r8,154 r4,800 rl,136 rI,193
rl5,975 r1,166
r764 r2,00l r5,983 rI,967 r2,608
I, 131 I 14
208 176 533 100
135,039 47, 127 24,080 30,097 19,704 14,031
56.9
124
r23,098 r7,590 r4,267 rI,142 I, 147
rl5,508 rl,193-
r750 rI,997 r5,427 rI,944 r2,789
124
22,388 7,028 3,661 I, 151
15,360 1,333 752
1,777 5,442 1,790 2,792
£_/ Revised, nonres ident i a
±/ Data for Sept. 1965 are advance estimates. CORRECTION for construction activity for Sept. 1965 should read $15,019 mil.
p. 4 of the Oct. 8, 1965 Weekly Supplement: Total private Digitized for FRASER http://fraser.stlouisfed.org/ Federal Reserve Bank of St. Louis
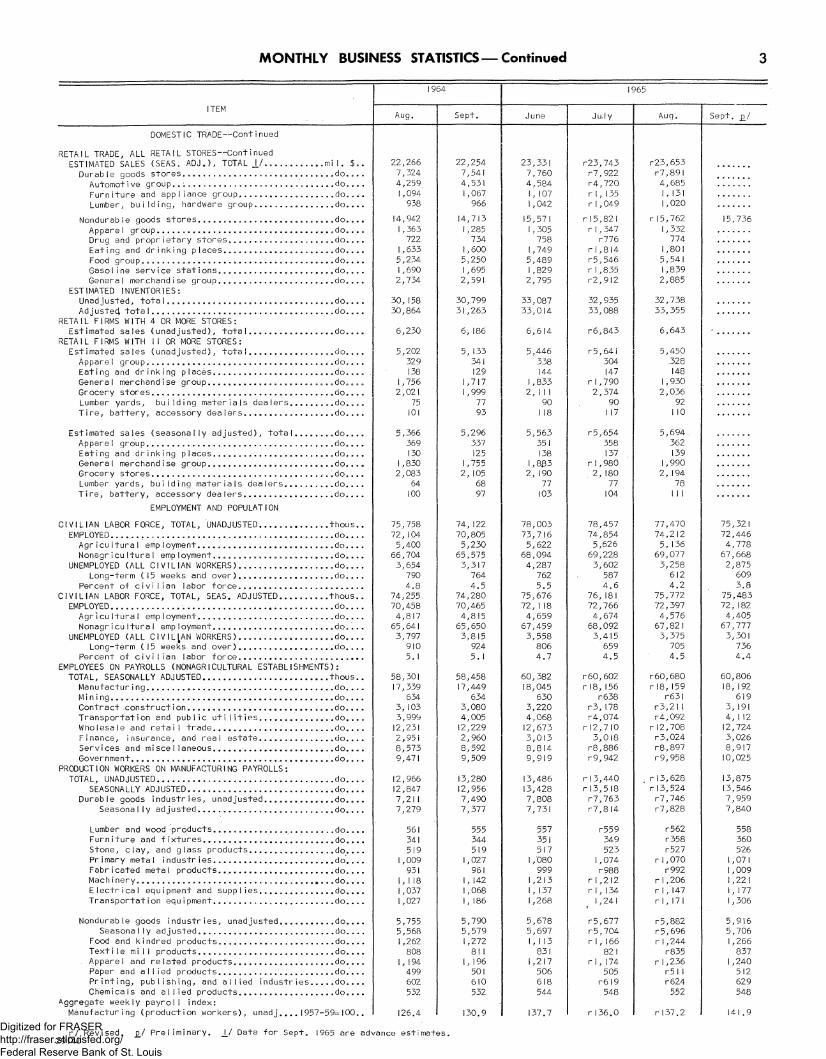
MONTHLY BUSINESS STATISTICS —Continued 3
ITEM
DOMESTIC. TRADE—Continued
RETAIL TRADE, ALL RETAIL STORES—Cont i nued ESTIMATED SALES (SEAS. ADJ.), TOTAL!/ mil.
Durable goods stores ..do.
Automotive group. „. .do. Furniture and appliance group ........do. Lumber, building, hardware group..... do.
Nondurab le goods stores. do....
Appare I group ..,do.... Drug and proprietary stores do.... Eating and drinking places do.... Food group -. do.... Gasoline service stations do.... General merchandise group do....
ESTIMATED INVENTORIES: Unadjusted, tota I do.... Adjusted, tota I do.
RETAIL FIRMS WITH 4 OR MORE STORES: Estimated sales (unadjusted), total do....
RETAIL FIRMS WITH II OR MORE STORES: Estimated sales (unadjusted), total ....do....
Appare I group „• .do.... Eating and drinking places do.... Genera I merchand ise group do,... Grocery stores do.... Lumber yards, building materiaIs dealers do.... Tire, battery, accessory dealers do....
Estimated sales (seasonally adjusted), total .do.... Appare 1 group do.... Eating and drinking places.. do.... General merchandise group do.... Grocery stores .do.... Lumber yards, building materials dealers do.... Tire, battery, accessory dealers do....
EMPLOYMENT AND POPULATION
CIVILIAN LABOR FORCE, TOTAL, UNADJUSTED thous.. EMPLOYED ,. .. do
Agr icu Itura I emp loyment do.... Nonagr icu Itura I emp loyment do....
UNEMPLOYED (ALL CIVILIAN WORKERS) do.... Long-term (15 weeks and over) do....
Percent of civilian labor force CIVILIAN LABOR FORCE, TOTAL, SEAS. ADJUSTED thous..
EMPLOYED . do Agrlcu Itura I emp loyment do.... Nonagr icu Itura I emp loyment do....
UNEMPLOYED (ALL CIVILIAN WORKERS) do Long-term (15 weeks and over) do....
Percent of civilian labor force EMPLOYEES ON PAYROLLS (NONAGRI CULTURAL ESTABLISHMENTS):
TOTAL, SEASONALLY ADJUSTED thous.. Manufacturing do.... Min i ng do.... Contract .construction do.... Transportation and public utilities do.... Wholesale and retail trade do.... Finance, insurance, and real estate do.... Services and miscellaneous do....
Government do.... PRODUCTION WORKERS ON MANUFACTURING PAYROLLS:
TOTAL, UNADJUSTED do SEASONALLY ADJUSTED do
Durable goods industries, unadjusted do.... Seasona I ly adjusted do....
Lumber and wood products do.... Furniture and fixtures do.... Stone, clay, and glass products do.... Primary metal industries do'.... Fabr icated meta I products. do.... Mach inery do.... Electrical equipment and supplies do.... Transportation equ ipment do....
Nondurable goods industries, unadjusted do.... Seasona I ly adjusted. do. .. .
Food and kindred products do.... Textile mill products do....
. Apparel and related products.. do.... Paper and allied products do.... Printing, publishing, and allied industries do.... Chemicals and allied products do....
Aggregate weekly payroll index: Manufacturing (production workers), unadj.... 1957-59=100..
Aug.
22 7 4 1
14 1
1 5 1 2
30 30
266 324 ,259
,094 938
942 363 722 633 234 690 734
158 864
6,230
,202 329 138 756 021 75 101
5,366 369 130
1,830 2,083
64 100
75,758 72,104 5,400
66,704 3,654
790
4.8 74,255. 70,458 4,817
65,64 I 3,797
910 5.1
58,301 17,339
634 3, 103 3,999 12,231 2,95 i 8,573 9,471
12,966 12,847 7,21 I 7,279
561 341 519
1,009 931
I, I 18 1,037 1,027
5,755 5,568 1,262 808
I, 194 499 602 532
126.4
Sept.
22,254 7,541 4,531 1,067 966
14,713 1,285 734
1,600 5,250 1,695 2,591
30,799 31,263
6, 186
5, 133 341 129
1,717 1,999
77 93
5,296 337
125 1,755 2, 105
68 97
74,122
70,805 5,230
65,575 3,317
764 4.5
74,280 70,465 4,815
65,650 3,815
924 5.1
58,458 17,449
634 3,080 4,005 12,229 2,960 8,592 9,509
13,280 12,956 7,490 7,377
555 344 519
1,027 961
I, 142 1,068 I, 186
5,790 5,579 1,272
81 I I, 196 501 610 532
130.9
1965
June
23,331 7,760 4,584 1, 107 1,042
15,571
1,305 758
1,749 5,489 1,829 2,795
33,087 33,014
6,614
5,446 338 144
1,833
90
5,563
351 138
1,833 2, 190
77 103
78,003 73,716 5,622 68,094 4,287 762 5.5
75,676 72, I 18 4,659
67,459 3,558
806 4.7
60,382 18,045
630 3,220 4,068 12,673 3,0i3 8,814 9,919
13,486 13,428 7,808 7,731
557 351 517
1,080 999
1,213 I, 137 1,268
5,678 5,697 I, I 13 831
1,217 506 618 544
137.7
July
r23,743 r7,922 r4,720 rl,135 rI,049
r15,82 I rI,347 r776
r1,814 r5,546 rl,835 r2,9l2
32,935 33,088
r6,843
,641 304 147 ,790 ,374 90 I 17
r5,654 358 137
rI,980 2, 180
77 104
78,457 74,854 5,626 69,228 3,602 587 4.6
76,181 72,766 4,674 68,092 3,415 659 4.5
r60,602 rl8,156
r638 r3,178 r4,074 r12,710 3,018 r8,886 r9,942
r13,440 r13,5 18 r7,763 r7,8l4
r559 349 523
1,074 r988
rI,212 r1, 134 1,241
r5,677 r5,704 rI,166
821 rI,174
505 r6l9 548
r136.0
Aug.
r23,653 >r7,89l 4,685 I, 131 1,020
r15,762 1,332 774
1,801 5,541 1,839 2,885
32,738 33,355
6,643
5,450 .328 148
1,930 2,036
92 I 10
5,694 . 362 139
194 78
I I I
77,470 74,212 5, 136
69,077 3,258
612 4.2
75,772 72,397 4,576
67,821 3,375
705 4.5
r60,680 rl8,159
r63l r3,2lI r4,092
r12,708 r3,024 r8,897 r9,958
r13,628 r13,524 r7,746 r7,828
r562 r358 r527
rI,070 r992
r1,206 rI,147 rI,171
r5,882 r5,696 r1,244
r835 r1,236
r5l I r624 552
rl37.2
r/ Revised. 29140
JD/ Preliminary. J_/ Data for Sept. 1965 are advance estimates. Digitized for FRASER http://fraser.stlouisfed.org/ Federal Reserve Bank of St. Louis
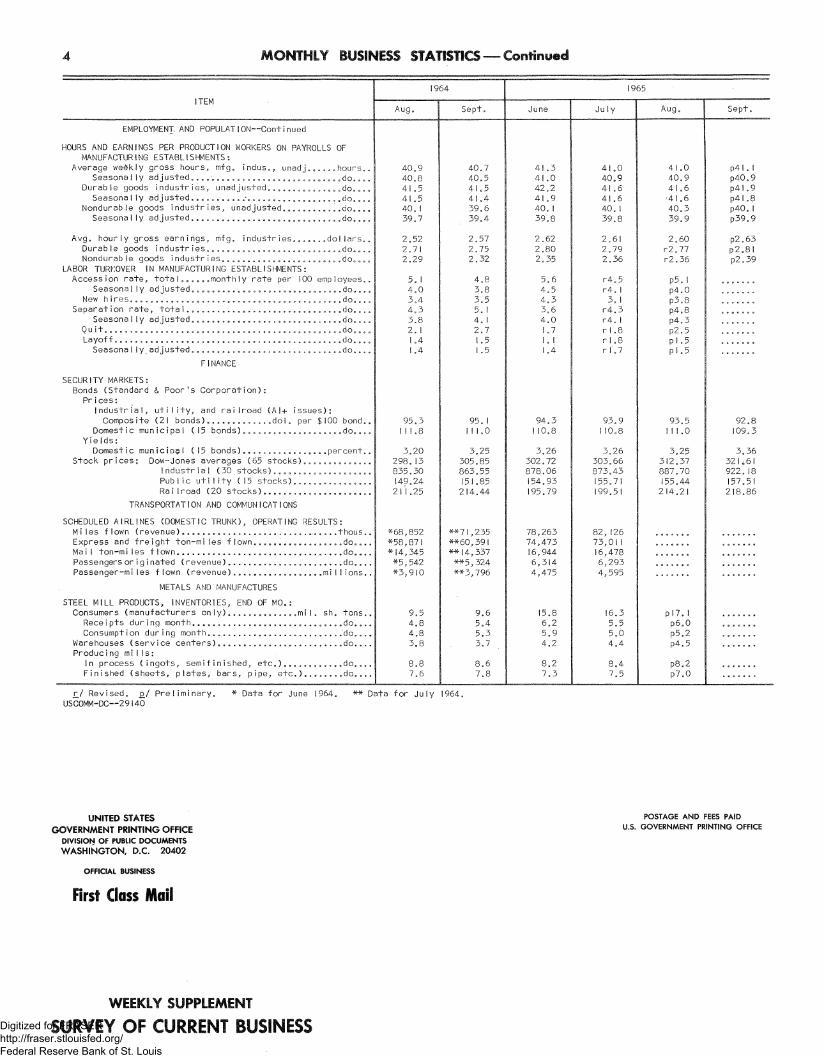
4 MONTHLY BUSINESS STATISTICS — Continued
ITEM
EMPLOYMENT, AND POPULAT ION—Conti nued
HOURS AND EARNINGS PER PRODUCTION WORKERS ON PAYROLLS OF MANUFACTURIN6 ESTABLISHMENTS:
Average weekly gross hours, mfg. indus., unadj. .....hours. Seasona I ly adjusted. ............................. .do...
Durable goods industries, unadjusted0„8„,..8„0..„00do.0. SeasonaIly adjusted...............................do-..
Nondurable goods industries, unadjusted......„.....do... SeasonaIly adjusted..............................do...
..do!I Avg. hourly gross earnings, mfg. industries*,, Durable goods industries................... Nondurable goods industries................
LABOR TURNOVER IN MANUFACTURING ESTABLISHMENTS: Accession rate, totaI.....Dmonthly rate per 100 emp
Seasonally adjusted... New h ires...............
Separation rate, total.... Seasonally adjusted...
Quit.................. .. Layoff..................
SeasonaIly adjusted...
FINANCE
SECURITY MARKETS: Bonds (Standard & Poor's Corporation):
Prices: Industrial, utility, and railroad (AI+ issues) Composite (21 bonds).............dol. per $1
Domestic municipal (15 bonds).................
ars ..do.. ..do..
loyees ..do.. ..do.. ..do.. ..do.. ..do.. ..do.. ..do..
Yields: Domestic municiDa
Stock prices
00 bond. ....do...
.percent. (15 bonds)............. Dow-Jones averages (65 stocks).............
Industr i a I (30.stocks)................... Public utility (15 stocks)............... Railroad (20 stocks).....................
TRANSPORTATION AND COMMUNICATIONS
SCHEDULED AIRLINES (DOMESTIC TRUNK), OPERATING RESULTS: Miles flown (revenue)................................thous. Express and freight ton-miles f lown..................do... Mail ton-miles flown.................................do... Passengers or ig inated (revenue).......................do... Passenger-miles flown (revenue)..................mi I I ions.
METALS AND'MANUFACTURES
STEEL MILL PRODUCTS, INVENTORIES, END OF M0.: Consumers (manufacturers only) .mil. sh. tons.
Receipts during month..............................do... Consumpt i on during month.......................... .'do...
Warehouses (service centers).........................do... Producing mills:
In process (ingots, semifinished, etc.)............do... Finished (sheets, plates, bars, pipe, etc.)...-.... .do...
Aug.
40 40 41 41 40 39
9 8 ,5 5 1 7
2.52 2.71 2.29
5 4 3 4 3 2 1 1
. I
.0
.4
.3
.8
. 1
.4 A
95 .3
3.20 298.13 835.30 149.24 2 M . 2 5
9.5
4.8 3.8
*68 *58 *I4 *5 *3
852 87! 345 542 910
**7I
**60 **I4 *~*5 *"#3
235 39! 337 324 796
Sept.
1965
40 40 4! 41 39 39
2. 2. 2.
4 3 3 5 4 2 1 1
7 ,5 ,5 A .6 A
57 75 32
.8
.8
.5
. 1
. I J .5 .5
91 1 1
3. 305. 863.
151, 214
. I
.0
25 85 55 85 44
June
41 .3 41 .0 42.2 41 .9 40. I 39.8
2 .62 2 .80 2.35
5.6 4 .5 4 . 3 3.6 4 .0 1.7 I. I 1.4
94 .3 I 10.8
3.26 302.72 878.06 154.93 195.79
78,263 74,473 16,944 6,314 4,475
15.8 6.2 5.9 4 .2
8.2 7.3
Ju ly
41.0 40.9 41 .6 41.6 40. I 39.8
2.61 2 .79 2.36
r4.5 r4 . I 3. I
r4 .3 r4 . I
r 1.7
93.9 I 10.8
3.26 303.66 873.43 155.7! 199.51
82,126 73 ,0! I 16,478 6,293 4,595
16.3 5.5 5.0 4 .4
7.5
Aug.
41 40 4!
•'41 40 39
2.( r2." r2.
p5 p4 p3 p4 p4 p2 p! Pi
0 9 6 6 3 9
30 11 36
.1
.0
.8
.8 ,3 .5 .5 .5
93.5 I I 1.0
3.25 312.37 887.70 155.44
214.21
p 17. I p6.0 P 5 .2 p4.5
p8.2 p7.0
p2.8l p2.39
r/ Revised, JD/ Prel iminary. USC0MM-DC—29140
* Data for June 1964. * * Data for July
UNITED STATES GOVERNMENT PRINTING OFFICE
DIVISION OF PUBLIC DOCUMENTS WASHINGTON, D C . 20402
POSTAGE AND FEES PAID U.S. GOVERNMENT PRINTING OFFICE
OFFICIAL BUSINESS
First Class Mail
WEEKLY SUPPLEMENT
SURVEY OF CURRENT BUSINESS Digitized for FRASER http://fraser.stlouisfed.org/ Federal Reserve Bank of St. Louis