Octet potency assay: development, qualification and ......of a drug candidate during development,...
8
1 APPLICATION NOTE Octet potency assay: development, qualification and validation strategies Carson Cameron, Brendan Peacor, Nathan Oien, Andrew Cheeseman, and Jimmy Smedley, KBI Biopharma, Durham, NC John Laughlin, and David O. Apiyo, ForteBio, Fremont, CA Introduction Kinetic analysis of biomolecular interactions is critical during drug discovery and development. The affinity of an interaction directly affects the dose required for a biopharmaceutical to be effective. Real-time data on affinity and the kinetics of binding can provide useful information at every stage of biopharma- ceutical reagent development. Moreover, understanding the mechanism of binding can provide insights into the desirability of a drug candidate during development, including implications for the drug’s stability upon complex formation with its binding target. Binding kinetics assays and specifically affinity constant (K D ) analysis are increasingly being used for biological products lot release. Regulatory requirements necessitate that such products be QC tested using methods that are robust and have been appropriately developed, qualified and validated under GMP conditions. In this application note, we discuss the strategies for the development and validation of a potency assay using Octet ® systems. We have highlighted the Octet system’s ease-of- use and fast time to results by showcasing strategies for the development and validation of a method for evaluating the binding of an Fc gamma receptor III molecule to the widely characterized NISTmAb. Fc receptors are widely distributed cell-surface proteins that act as communication points between effector antibodies and their biological implements. There are three classes of Fc recep- tors including Fc-gamma receptor I (CD64) that is responsible for phagocytosis and the activation of monocytic cell lines, Fc-gamma receptor II (CD32) that is mainly responsible for anti- body-dependent cellular phagocytosis and Fc-gamma receptor III (CD16), which is responsible for antibody-dependent cellular cytoxicity (ADCC). These receptor molecules bind to antibodies through their Fc region and impart different activities. Glycosyla- tion and other modifications to the Fc region of an antibody can affect Fc gamma receptor binding hence these receptor mole- cules are a good tool for evaluating antibody drug efficacy and for antibody product lot release assessment. In this application note, we use affinity constants (K D ) as the reportable parameter to determine Percent Relative Potency to a reference lot. Figure 1: Relative intensity of the light reflection pattern from the two surfaces on the biosensor. Octet BLI sys- tems measure the difference in reflected light’s wavelength (Δλ) between the two surfaces. Incident white light BLI signal processing Wavelength (nm) 0.2 0.4 0.6 0.8 1.0 Relative Intensity Biocompatible surface Bound molecule Unbound molecules have no effect 26
Transcript of Octet potency assay: development, qualification and ......of a drug candidate during development,...
1
APPLICATION NOTE
Octet potency assay: development, qualification and validation strategiesCarson Cameron, Brendan Peacor, Nathan Oien, Andrew Cheeseman, and Jimmy Smedley, KBI Biopharma, Durham, NC John Laughlin, and David O. Apiyo, ForteBio, Fremont, CA
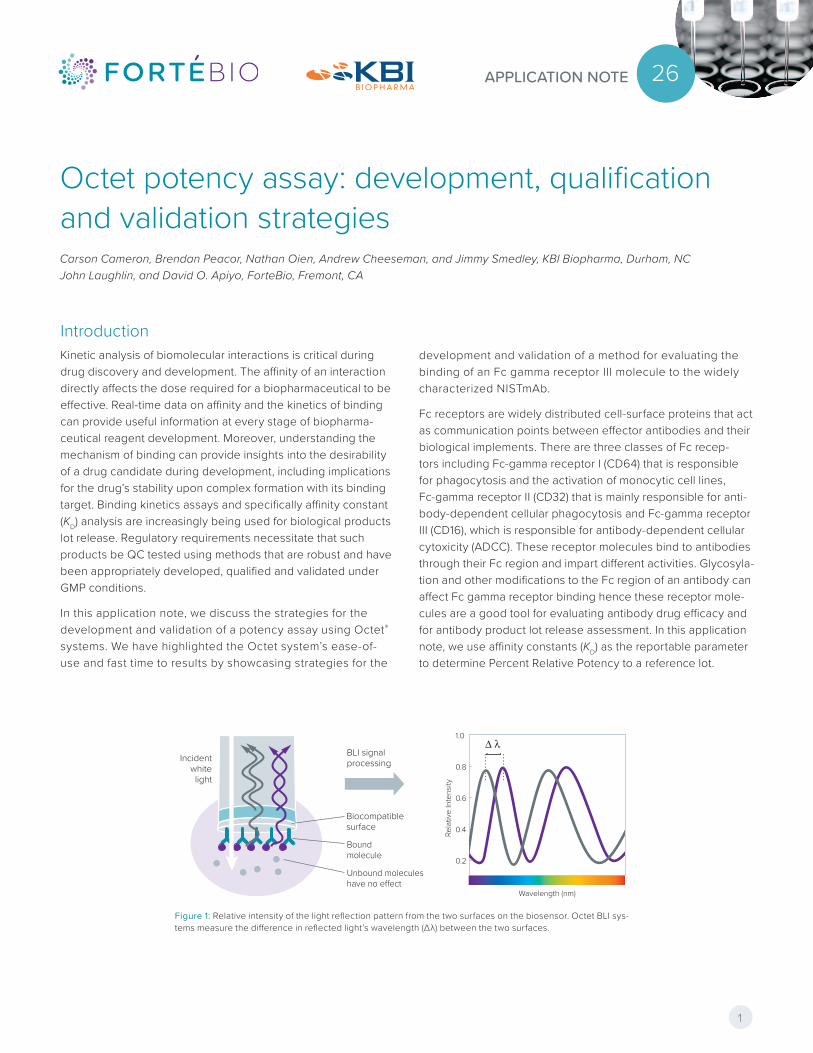
IntroductionKinetic analysis of biomolecular interactions is critical during drug discovery and development. The affinity of an interaction directly affects the dose required for a biopharmaceutical to be effective. Real-time data on affinity and the kinetics of binding can provide useful information at every stage of biopharma-ceutical reagent development. Moreover, understanding the mechanism of binding can provide insights into the desirability of a drug candidate during development, including implications for the drug’s stability upon complex formation with its binding target. Binding kinetics assays and specifically affinity constant (KD) analysis are increasingly being used for biological products lot release. Regulatory requirements necessitate that such products be QC tested using methods that are robust and have been appropriately developed, qualified and validated under GMP conditions.
In this application note, we discuss the strategies for the development and validation of a potency assay using Octet® systems. We have highlighted the Octet system’s ease-of-use and fast time to results by showcasing strategies for the
development and validation of a method for evaluating the binding of an Fc gamma receptor III molecule to the widely characterized NISTmAb.
Fc receptors are widely distributed cell-surface proteins that act as communication points between effector antibodies and their biological implements. There are three classes of Fc recep-tors including Fc-gamma receptor I (CD64) that is responsible for phagocytosis and the activation of monocytic cell lines, Fc-gamma receptor II (CD32) that is mainly responsible for anti-body-dependent cellular phagocytosis and Fc-gamma receptor III (CD16), which is responsible for antibody-dependent cellular cytoxicity (ADCC). These receptor molecules bind to antibodies through their Fc region and impart different activities. Glycosyla-tion and other modifications to the Fc region of an antibody can affect Fc gamma receptor binding hence these receptor mole-cules are a good tool for evaluating antibody drug efficacy and for antibody product lot release assessment. In this application note, we use affinity constants (KD) as the reportable parameter to determine Percent Relative Potency to a reference lot.
Figure 1: Relative intensity of the light reflection pattern from the two surfaces on the biosensor. Octet BLI sys-tems measure the difference in reflected light’s wavelength (Δλ) between the two surfaces.
Incidentwhitelight
BLI signalprocessing
Wavelength (nm)
0.2
0.4
0.6
0.8
1.0
Rela
tive
Inte
nsity
Biocompatiblesurface
Boundmolecule
Unbound moleculeshave no effect
26
2
Bio-Layer InterferometryThe Octet platform utilizes a Dip and Read™ format in combina-tion with Bio-Layer Interferometry (BLI) to monitor the interac-tions between biological molecules. BLI is an optical technique where white light incident to a reflective biosensor surface immobilized with a ligand results in changing interference pat-terns of the reflected white light detected upon the interaction between the ligand and the analyte which is kept in solution. Binding events between the ligand and the analyte result in an increase in optical thickness on the tip of the biosensor that can be measured as a wavelength shift from the reference surface, and is a proportional measure of the change in thickness of the biological layer (Figure 1).
Materials and reagentsMaterials and reagents for the studies:
Material/reagent Vendor Catalog #
Ni-NTA biosensors ForteBio 18-5102
FcγRIIIa R&D Systems 4325-FC-050
NISTmAb National Institute of Standards and Technology (NIST)
RM8671
96-well plates Griener Bio-One 655209
384-well plates Griener Bio-One 781209
Octet HTX system ForteBio NA
Diluent (1X PBS, 0.1%Tween 20, 0.2% BSA)
KBI (prepared day of use)
NA
Method developmentDetermination of analyte characteristics, including potency, can be affected by the test method used. Factors such as the amount of FcγRIIIa immobilized on the biosensor for the detec-tion of the analyte, the temperature and shaking speed of the reaction, the sample matrix, and the equilibration time allowed for binding can affect the binding behavior. Each of these factors can also impact critical assay attributes such as accu-racy. The Octet platform is highly suited for a fast evaluation of the interactions between these potential key assay inputs and allows for relatively high-throughput method development.
Three key input variables: temperature, shake speed and ligand loading density, were identified to be critical to the performance of the potency assay and were evaluated in a mini-design of experiment (DOE) prior to establishing the method. Each vari-able was examined at three or four levels. To establish assay performance at these conditions, the analyte concentration, sample matrix and assay step run times were maintained at con-stant values. A control condition was set at the ForteBio default conditions for ligand binding assay (kinetics) with the shaking speed at 1000 RPM and temperature at 30°C for these studies.
Optimal assay behavior can be split into four distinct parts for kinetic determination assays:
1 The baseline(s) must be flat and absent of upward or down-ward drift (Figure 2, 0–60 seconds).
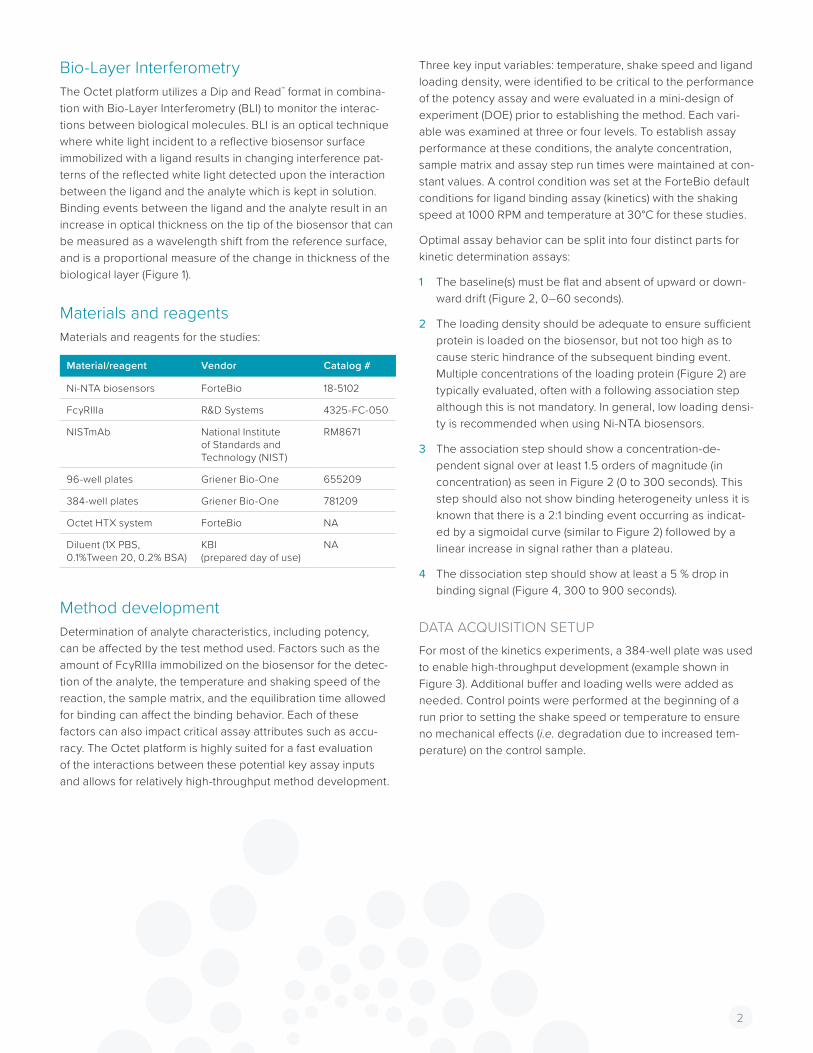
2 The loading density should be adequate to ensure sufficient protein is loaded on the biosensor, but not too high as to cause steric hindrance of the subsequent binding event. Multiple concentrations of the loading protein (Figure 2) are typically evaluated, often with a following association step although this is not mandatory. In general, low loading densi-ty is recommended when using Ni-NTA biosensors.
3 The association step should show a concentration-de-pendent signal over at least 1.5 orders of magnitude (in concentration) as seen in Figure 2 (0 to 300 seconds). This step should also not show binding heterogeneity unless it is known that there is a 2:1 binding event occurring as indicat-ed by a sigmoidal curve (similar to Figure 2) followed by a linear increase in signal rather than a plateau.
4 The dissociation step should show at least a 5 % drop in binding signal (Figure 4, 300 to 900 seconds).
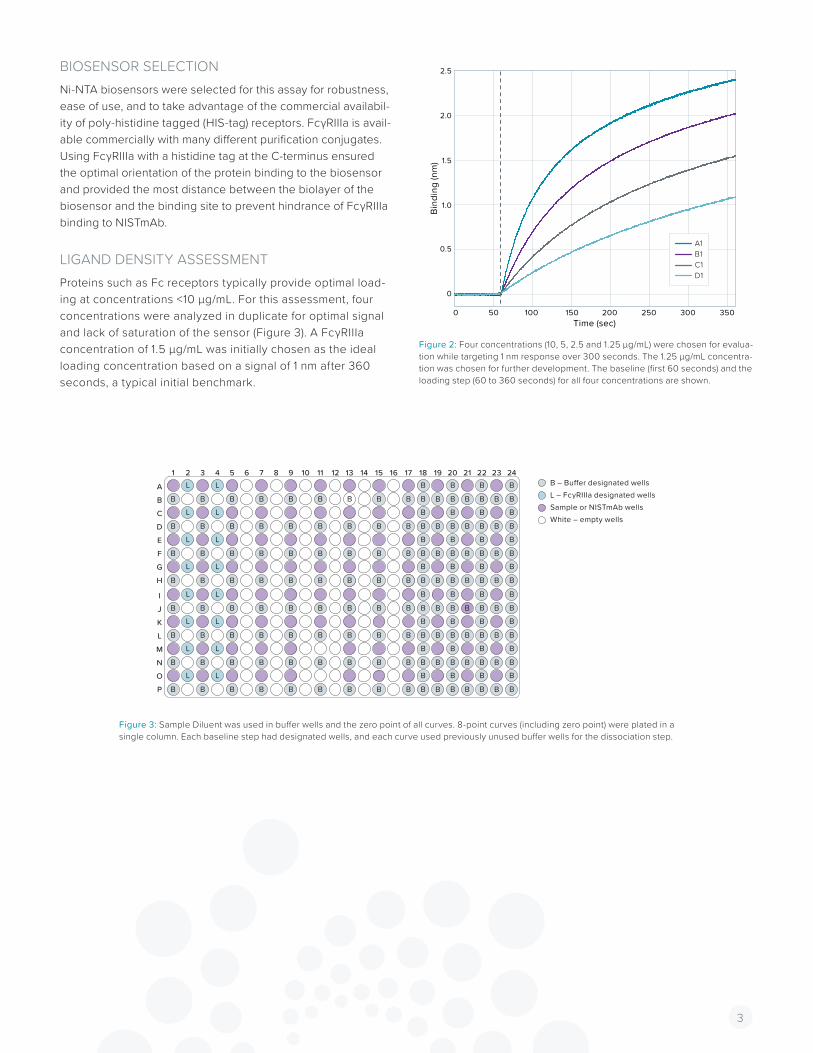
DATA ACQUISITION SETUPFor most of the kinetics experiments, a 384-well plate was used to enable high-throughput development (example shown in Figure 3). Additional buffer and loading wells were added as needed. Control points were performed at the beginning of a run prior to setting the shake speed or temperature to ensure no mechanical effects (i.e. degradation due to increased tem-perature) on the control sample.
3
Time (sec)
Bind
ing
(nm
)
0 50 100 150 200 250 300 350
0
0.5
1.0
1.5
2.0
2.5
A1B1C1D1
BIOSENSOR SELECTIONNi-NTA biosensors were selected for this assay for robustness, ease of use, and to take advantage of the commercial availabil-ity of poly-histidine tagged (HIS-tag) receptors. FcγRIIIa is avail-able commercially with many different purification conjugates. Using FcγRIIIa with a histidine tag at the C-terminus ensured the optimal orientation of the protein binding to the biosensor and provided the most distance between the biolayer of the biosensor and the binding site to prevent hindrance of FcγRIIIa binding to NISTmAb.
LIGAND DENSITY ASSESSMENTProteins such as Fc receptors typically provide optimal load-ing at concentrations <10 µg/mL. For this assessment, four concentrations were analyzed in duplicate for optimal signal and lack of saturation of the sensor (Figure 3). A FcγRIIIa concentration of 1.5 µg/mL was initially chosen as the ideal loading concentration based on a signal of 1 nm after 360 seconds, a typical initial benchmark.
Figure 2: Four concentrations (10, 5, 2.5 and 1.25 µg/mL) were chosen for evalua-tion while targeting 1 nm response over 300 seconds. The 1.25 µg/mL concentra-tion was chosen for further development. The baseline (first 60 seconds) and the loading step (60 to 360 seconds) for all four concentrations are shown.
Figure 3: Sample Diluent was used in buffer wells and the zero point of all curves. 8-point curves (including zero point) were plated in a single column. Each baseline step had designated wells, and each curve used previously unused buffer wells for the dissociation step.
1
A
2 3 4 5 6 7 8 9 10 11 12
B
C
D
E
F
G
H
13 14 15 16 17 18 19 20 21 22 23 24
I
J
K
L
M
N
O
P
B
B
B
B
B
B
B
B
B
B
B
B
B
B
B
B
B
B
B
B
B
B
B
B
B
B
B
B
B
B
B
B
B
B
B
B
B
B
B
B
B
B
B
B
B
B
B
B
B
B
B
B
B
B
B
B
B
B
B
B
B
B
B
B
B
B
B
B
B
B
B
B
B
B
B
B
B
B
B
B
B
B
B
B
B
B
B
B
B
B
B
B
B
B
B
B
B
B
B
B
B
B
B
B
B
B
B
B
B
B
B
B
B
B
B
B
B
B
B
B
B
B
B
B
B
B
B
B
B
B
B
B
B
B
B
B
B
B
B
B
B
B
B
B
B
B
B
B
B
B
B
B
B
B
B
B
B
B
B
B
L
L
L
L
L
L
L
L
L
L
L
L
L
L
L
L
B – Bu�er designated wellsL – FcγRIIIa designated wellsSample or NISTmAb wellsWhite – empty wells
4
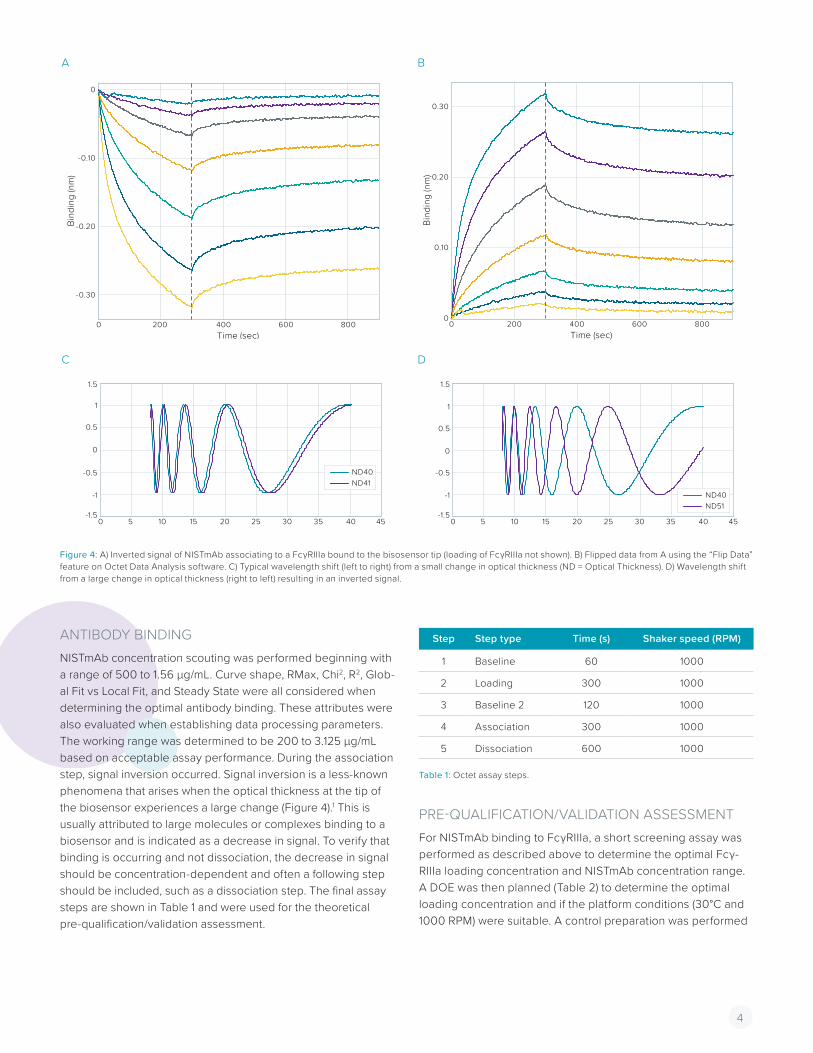
ANTIBODY BINDINGNISTmAb concentration scouting was performed beginning with a range of 500 to 1.56 µg/mL. Curve shape, RMax, Chi2, R2, Glob-al Fit vs Local Fit, and Steady State were all considered when determining the optimal antibody binding. These attributes were also evaluated when establishing data processing parameters. The working range was determined to be 200 to 3.125 µg/mL based on acceptable assay performance. During the association step, signal inversion occurred. Signal inversion is a less-known phenomena that arises when the optical thickness at the tip of the biosensor experiences a large change (Figure 4).1 This is usually attributed to large molecules or complexes binding to a biosensor and is indicated as a decrease in signal. To verify that binding is occurring and not dissociation, the decrease in signal should be concentration-dependent and often a following step should be included, such as a dissociation step. The final assay steps are shown in Table 1 and were used for the theoretical pre-qualification/validation assessment.
Figure 4: A) Inverted signal of NISTmAb associating to a FcγRIIIa bound to the bisosensor tip (loading of FcγRIIIa not shown). B) Flipped data from A using the “Flip Data” feature on Octet Data Analysis software. C) Typical wavelength shift (left to right) from a small change in optical thickness (ND = Optical Thickness). D) Wavelength shift from a large change in optical thickness (right to left) resulting in an inverted signal.
Step Step type Time (s) Shaker speed (RPM)
1 Baseline 60 1000
2 Loading 300 1000
3 Baseline 2 120 1000
4 Association 300 1000
5 Dissociation 600 1000
Table 1: Octet assay steps.
PRE-QUALIFICATION/VALIDATION ASSESSMENTFor NISTmAb binding to FcγRIIIa, a short screening assay was performed as described above to determine the optimal Fcγ-RIIIa loading concentration and NISTmAb concentration range. A DOE was then planned (Table 2) to determine the optimal loading concentration and if the platform conditions (30°C and 1000 RPM) were suitable. A control preparation was performed
Time (sec)
Bind
ing
(nm
)
0 200 400 600 800
-0.30
-0.20
-0.10
0
Time (sec)
Bind
ing
(nm
)
0 200 400 600 8000
0.10
0.20
0.30
A B
DC
0 5 10 15 20 25 30 35 40 45-1.5
-1
-0.5
0
0.5
1
1.5
ND41 ND40
0 5 10 15 20 25 30 35 40 45-1.5
-1
-0.5
0
0.5
1
1.5
ND51 ND40

5
at these platform conditions (including 1.5 µg/mL loading) to observe day-to-day repeatability and to calculate %relative potency. The DOE approach, coupled with the fast assay time of the Octet platform allows for the method parameters to be scouted in minimal time.
Parameter Range Number of points
Temperature 28–35°C 4
Loading concentration 0.75–3.0 µg/mL 4
Shake speed 800–1200 RPM 3
Table 2: Pre-qualification/validation development DOE.
The results were analyzed using statistical analysis software which showed the optimal conditions for this assay were a 1.1 (±0.1) µg/mL loading concentration for FcγRIIIa, a 1000 (±100) RPM plate shake speed, and a 30°C (29.5-31.5°C) assay temperature.
CRITICAL PROCESS PARAMETER ASSESSMENTThe pre-qualification DOE also provided the data required to assess specificity, precision/repeatability, and the working range of the assay. A diluent blank was performed as part of each NISTmAb curve. These blanks all demonstrated no matrix interference, indicating specificity of the assay. Due to the nature of the DOE, evaluating precision required assessing the data points from center points of the DOE. The average %relative potency was 91% with a %RSD of 7%, suggesting good precision of the assay. Further, all points in the DOE showed R2 ≥0.97, suggesting the working range of the assay (200 µg/mL to 3.125 µg/mL) is suitable for qualification.
The hydration of the biosensors was also evaluated. The base-line signal immediately after biosensor hydration of 10, 15, and 20 minutes was comparable, demonstrating that a 10- minute hydration time was suitable for the final method.
METHOD QUALIFICATIONMethod Qualification, while not always required, can be a useful tool in early phases of drug development and provide critical data leading up to a validation. In general, the qualification of a potency method involves evaluating linearity, specificity, ac-curacy, precision, and range. Method Qualification also serves to set system suitability criteria for the assay as well as sample acceptance criteria for release testing and/or stability samples. For instance, the results from the accuracy calculations may allow for a criterion of 70% to 130% relative potency for test arti-cles. When test samples meet this criterion, they are considered
equivalent to reference. The results of an Octet %relative poten-cy method qualification generally allow criteria to be set for: R2, X2, maximum response signal, minimum response signal, and a range of % Relative Potency (potency comparison to reference). Typically, the results from running a qualified method (during development or stability experiments, etc.) in conjunction with the process (purification, culture, etc.) can provide the data to set criteria for a validation protocol. Validation of a method com-monly repeats the studies, (linearity, accuracy, etc.) performed in the qualification with tighter passing criteria and includes significant ruggedness and robustness studies.
METHOD VALIDATIONMethod Validations are completed to ensure an analytical method is suitable for its intended purpose. This provides an assurance of reliability for routine testing in GMP envi-ronment. Validation involves comprehensive protocol-driven experiments that evaluate and document the performance of an assay. As this method was being established as a potency assay, linearity, specificity, accuracy, precision, range, robust-ness, and ruggedness were evaluated as recommended by ICH Guideline Q2 (R1)3 “Validation of Analytical Procedures: Text and Methodology.”
Linearity is the expected relationship between known poten-cies of samples and their measured values using a range of 50% to 150% of the nominal relative potency, but treating them as 100%. Five levels were tested over the 50% to 150% range including 100%. The R2 values of the resulting curves were all ≥0.95, indicating good linearity.
Accuracy is the degree of closeness to the expected value and was determined using results obtained from the linearity studies by calculating the percent recovery for each linearity level. For example; a %Relative Potency of 46% at the 50% linearity level returns a 92% recovery. The average %recovery was calculated to be 97% with a range of 85% to 118% recovery. These results showed the method was accurate.
Precision is the variability in the data from replicate determi-nations under normal assay conditions. Repeatability of the method was assessed by testing multiple preparations at the nominal load. The average relative potency was 101% with a %RSD of 6%. Intermediate precision of the method was as-sessed using a second analyst to test multiple preparations at the nominal load. The average relative potency between two analysts was 101% with a %RSD of 8%. These results were within the expected limit.

6
The range of the method is demonstrated when precision, ac-curacy and linearity of the method show suitable performance. Suitable performance was demonstrated spanning the working range of 50% to 150% of the nominal potency. This correspond-ed to 100 µg/mL to 300 µg/mL for the highest concentration of the dose-response curve.
Specificity of the method was verified by testing a buffer blank and a generic non-human antibody, both diluted in the same scheme as NISTmAb. The %relative potency of the blank and generic antibody were determined to be not-comparable to NISTmAb and specificity of the method was confirmed.
Robustness of this assay was evaluated by testing the work-ing range of the parameters generated by the results of the development DOE. This involved making small but deliberate changes to the assay loading concentration, shake speed, and temperature. These changes in methodology returned results within 70% to 130% proving the method is robust.
Ruggedness of this assay was tested by evaluating normal test conditions that may vary over time. To test ruggedness of the assay, a DOE was performed on the parameters with the most risk for variance. This included biosensor lot, FcγRIIIa lot, and analyst to analyst variability (Tables 3 and 4).
The results of the DOE were analyzed by performing a Fit Least Squares analysis. The results of this analysis are shown in Figure 5. The Effect Summary Table showed no statistically significant interactions (i.e. all ρ values were greater than 0.05). The Prediction Profile and Interaction Profiler showed no clear substantial trends between different variables. The effects of this DOE prove the method is rugged.
Parameter # of Points
Biosensor lots: 5
FcγR3A lots: 2
Analysts: 3
Table 3: Ruggedness DOE.
Run Biosensor FcyR3A Analyst KD (nM)%Relative potency
1 1 2 1 25 100%
2 1 2 3 21 93%
3 5 1 1 31 82%
4 1 2 2 30 109%
5 1 1 2 28 103%
6 2 1 1 23 112%
7 3 2 2 25 91%
8 4 2 3 24 80%
9 5 2 1 21 119%
10 3 1 1 22 114%
11 5 1 2 30 110%
12 3 2 3 22 88%
13 5 2 2 26 96%
14 3 2 1 20 127%
15 5 1 2 28 113%
16 1 1 2 22 86%
17 4 2 1 23 108%
18 3 1 2 27 105%
19 5 2 1 24 104%
20 1 1 1 19 109%
21 1 2 2 25 98%
22 1 1 3 18 105%
23 4 2 3 18 109%
24 3 1 2 30 115%
25 3 2 2 22 86%
26 1 2 1 23 109%
27 5 1 1 31 82%
28 5 2 2 25 97%
29 1 1 1 25 85%
30 3 2 1 33 76%
Table 4: A 30 run DOE showing the various combination of parameters tested.

7
A Effect summary table
C Interaction profiler
B Prediction profiler
Figure 5: A) Effect screen of multiple parameters showing no significant interactions. LogWorth = -Log (p-Value). B) Pre-diction Profiler showing results are not able to predict future trends in data. C) Interaction Profiler showing the interactions between two variables have no predictable effect on %Relative Potency.
Source LogWorth PValue Biosensor*FcyRIIIa 0.677 0.21029 Biosensor*Analyst 0.629 0.23475 Biosensor 0.611 0.24497 Biosensor*FcyRIIIa*Analyst 0.551 0.28098 FcyRIIIa 0.216 0.60810 FcyRIIIa*Analyst 0.171 0.67448 Analyst 0.079 0.83416
70
1 2 1 23 1 2 34 5
80
90
100
110
120
130
97[7
5.05
58, 1
18.9
44]
1Biosensor
1FcyRIIIa
1Analyst
%Re
lativ
e Po
tenc
y
70
80
90
100
110
120
130
70
80
90
100
110
120
130
70
80
90
100
110
120
130
1
1
1
2
3
2
2 3 4 5 1 2 1 2 3
Biosensor
FcyRIIIa
Analyst
BiosensorFcyRIIIa
Analyst
12 3
1
2
1122
3
45
4
3
5%Re
lativ
e Po
tenc
y%
Rela
tive
Pote
ncy
%Re
lativ
e Po
tenc
y
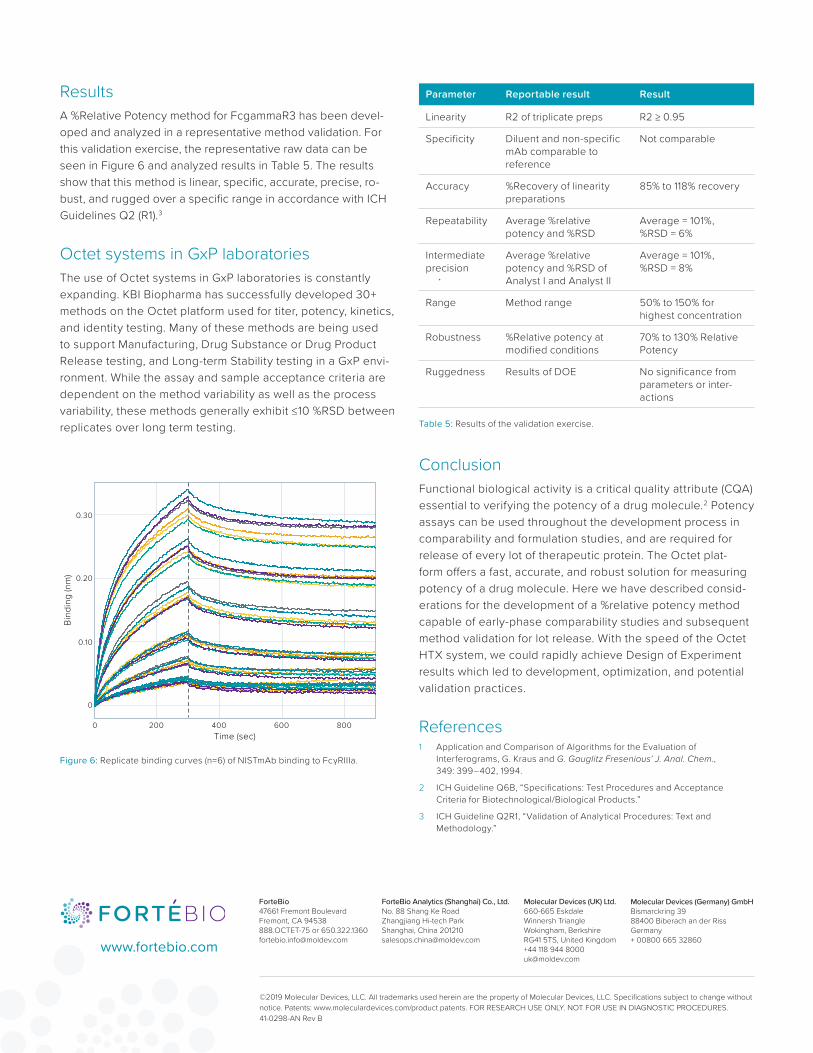
ResultsA %Relative Potency method for FcgammaR3 has been devel-oped and analyzed in a representative method validation. For this validation exercise, the representative raw data can be seen in Figure 6 and analyzed results in Table 5. The results show that this method is linear, specific, accurate, precise, ro-bust, and rugged over a specific range in accordance with ICH Guidelines Q2 (R1).3
Octet systems in GxP laboratoriesThe use of Octet systems in GxP laboratories is constantly expanding. KBI Biopharma has successfully developed 30+ methods on the Octet platform used for titer, potency, kinetics, and identity testing. Many of these methods are being used to support Manufacturing, Drug Substance or Drug Product Release testing, and Long-term Stability testing in a GxP envi-ronment. While the assay and sample acceptance criteria are dependent on the method variability as well as the process variability, these methods generally exhibit ≤10 %RSD between replicates over long term testing.
Parameter Reportable result Result
Linearity R2 of triplicate preps R2 ≥ 0.95
Specificity Diluent and non-specific mAb comparable to reference
Not comparable
Accuracy %Recovery of linearity preparations
85% to 118% recovery
Repeatability Average %relative potency and %RSD
Average = 101%, %RSD = 6%
Intermediate precision
Average %relative potency and %RSD of Analyst I and Analyst II
Average = 101%, %RSD = 8%
Range Method range 50% to 150% for highest concentration
Robustness %Relative potency at modified conditions
70% to 130% Relative Potency
Ruggedness Results of DOE No significance from parameters or inter-actions
Table 5: Results of the validation exercise.
ConclusionFunctional biological activity is a critical quality attribute (CQA) essential to verifying the potency of a drug molecule.2 Potency assays can be used throughout the development process in comparability and formulation studies, and are required for release of every lot of therapeutic protein. The Octet plat-form offers a fast, accurate, and robust solution for measuring potency of a drug molecule. Here we have described consid-erations for the development of a %relative potency method capable of early-phase comparability studies and subsequent method validation for lot release. With the speed of the Octet HTX system, we could rapidly achieve Design of Experiment results which led to development, optimization, and potential validation practices.
References1 Application and Comparison of Algorithms for the Evaluation of
Interferograms, G. Kraus and G. Gauglitz Fresenious’ J. Anal. Chem., 349: 399–402, 1994.
2 ICH Guideline Q6B, “Specifications: Test Procedures and Acceptance Criteria for Biotechnological/Biological Products.”
3 ICH Guideline Q2R1, “Validation of Analytical Procedures: Text and Methodology.”
Figure 6: Replicate binding curves (n=6) of NISTmAb binding to FcγRIIIa.
Time (sec)
Bind
ing
(nm
)
0 200 400 600 800
0
0.10
0.20
0.30
ForteBio47661 Fremont BoulevardFremont, CA 94538 888.OCTET-75 or [email protected]
ForteBio Analytics (Shanghai) Co., Ltd. No. 88 Shang Ke RoadZhangjiang Hi-tech ParkShanghai, China [email protected]
Molecular Devices (UK) Ltd. 660-665 EskdaleWinnersh TriangleWokingham, BerkshireRG41 5TS, United Kingdom+44 118 944 [email protected]
Molecular Devices (Germany) GmbH Bismarckring 3988400 Biberach an der RissGermany+ 00800 665 32860www.fortebio.com
©2019 Molecular Devices, LLC. All trademarks used herein are the property of Molecular Devices, LLC. Specifications subject to change without notice. Patents: www.moleculardevices.com/product patents. FOR RESEARCH USE ONLY. NOT FOR USE IN DIAGNOSTIC PROCEDURES. 41-0298-AN Rev B