OCEANIA REPORT - RLBassets.rlb.com/production/2017/02/07234930/RLB-Oceania...r L Oceania Report –...
32
FIRST QUARTER 2017 CONSTRUCTION MARKET INTELLIGENCE OCEANIA REPORT
Transcript of OCEANIA REPORT - RLBassets.rlb.com/production/2017/02/07234930/RLB-Oceania...r L Oceania Report –...

First Quarter 2017
CONSTRUCTION MARKET INTELLIGENCE
OCEANIA REPORT

Disclaimer: While the information in this publication is believed to be correct at the time of publishing, no responsibility is accepted for its accuracy. Persons desiring to utilise any information appearing in the publication should verify its applicability to their specific circumstances. Cost information in this publication is indicative and for general guidance only and is based on rates as at December 2016. National statistics are derived from the Australian Bureau of Statistics (ABS) and Statistics New Zealand.
Cover: Anadara & Alexander, Barangaroo South, Sydney
ABOUT RIDER LEVETT BUCKNALLCONfIDENCE TODAy INsPIREs TOmORROwWith a network that covers the globe and a heritage spanning over two centuries, Rider Levett Bucknall is a leading independent organisation in quantity surveying and advisory services.
Our achievements are renowned: from the early days of pioneering quantity surveying, to landmark projects such as the Sydney Opera House, HSBC Headquarters Building in Hong Kong, the 2012 London Olympic Games and CityCenter in Las Vegas.
We continue this successful legacy with our dedication to the value, quality and sustainability of the built environment. Our innovative thinking, global reach, and flawless execution push the boundaries. Taking ambitious projects from an idea to reality.
CREATINg A BETTER TOmORROwThe Rider Levett Bucknall vision is to be the global leader in the market, through flawless execution, a fresh perspective and independent advice. Our focus is to create value for our customers, through the skills and passion of our people, and to nurture strong long-term partnerships. By fostering confidence in our customers, we empower them to bring their imagination to life, to shape the future of the built environment, and to create a better tomorrow.
THE OCEANIA REPORTThe RLB Oceania Report is published twice-yearly and provides detailed regional and local construction market intelligence and data compiled from our network of offices.
The strength of RLB, the largest independent and most geographically prevalent construction cost consultancy of its kind in the world, is that it has the foremost construction intelligence available to it. We collect and collate current construction data and forecast trends on a global, regional, country, city and sector basis. RLB publish key industry intelligence publications throughout each year. For more detailed sector and city/country information than is published within the Oceania Report please review our regional or country specific publications.
All publications are available from www.rlb.com or for a hard copy please contact your local office.
CONsTRUCTION mARKET INTELLIgENCEThe Oceania Report is supplemented by RLB's biannual International Report, quarterly NZ Forecast and annual Riders Digests published within the Oceania Region.
BRINGING IMAGINATION TO LIfE
Anadara: Barangaroo SouthClient: Lend Lease (Millers Point)Architect: FJMT
Alexander: Barangaroo SouthClient: Lend Lease (Millers Point)Architect: PTW

Rider Levett Bucknall | Oceania Report – First Quarter 2017
3
The Oceania Report, covering Australia and New Zealand, provides a snapshot of the current construction market conditions and construction price movements in the key cities in Australia and New Zealand. Each RLB office provides an insight into the current market conditions influencing construction cost movements.
Information contained within the publication includes:
A broad overview of Construction market Intelligence within Oceania is provided on page 5,
RLB’s Tender Price Index (TPI) trends and Relativity analysis are contained on pages 6 and 7. Annual percentage movements in RLB’s TPI are highlighted in the market data table on page 6, which tracks the tender price movement since 2010 and forecasted to the end of 2019.
RLB’s Construction market Activity Cycle, on page 8 and 9, represent the insight of RLB offices on the current status of key construction sectors within the development activity model. The current cycle position of each sector is identified in the table on page 8 and consolidated by sectors for all cities and graphically represented on Page 9.
Australian Construction market Intelligence is found page 10, followed by specific data and commentaries from RLB directors in nine key locations across the country on pages 13 -23.
New Zealand Construction market Intelligence is found page 24, followed by specific data and commentaries from RLB directors in three principle locations across the country on pages 25 - 29.
Each Location Intelligence page highlights for that city:
• CommentaryontheKey Local matters affecting the construction market within the region,
• RLB’sEscalation forecasts for 2016 & 17,
• SummaryofBuilding work Done (work put in place),
• SummaryofBuilding Approvals,
• Graphicalrepresentationofthemarket sector Activity Cycle responses through the doughnut graphs.
Oceania cOnstructiOnGLOBAL OUTLOOK
ABBREVIATIONs
$B Billion (Thousand Million) Dollars
$m Million Dollars
ABs Australian Bureau Of Statistics
CVm Chain Volume Measure
CPI Consumer Price Index
fy Financial Year Ending 30 June
RBA Reserve Bank Of Australia
sNZ Statistics New Zealand
DEfINITIONs
CONsTRUCTION Building and Engineering
BUILDINg Residential Building and Non-Residential Building
ENgINEERINg Includes but not limited to: Roads, runways, rail, bridges, harbours, water storage, sewerage works, pipelines, electricity generation and distribution, telecommunications and mining works,
REsIDENTIAL BUILDINg New Houses & Other New Residential building & Alterations/additions (incl. refurb and conversion)
NEw HOUsEs Detached Dwellings
OTHER NEw REsIDENTIAL BUILDINg
Semi Detached dwellings (Townhouses etc.) & multilevel dwellings (Apartments)
NON-REsIDENTIAL BUILDINg
Offices, Commercial, Industrial, Retail, Education, Health, Recreation, Civic, Short-term Accommodation and other building not classified, but not Residential or Engineering
TERmINOLOgy UsED wITHIN THIs REPORT

4
570 Bourke, Melbourne
Client: Charter Hall's Core Plus Office Fund
Architect: Hassell Architects

5
Rider Levett Bucknall | Oceania Report – First Quarter 2017
Location inteLLigenceOceania
2017 RLB fORECAsTED TPI UPLIfTs
ADELAIDE 3.0%
AUCKLAND 4.6%
BRIsBANE 4.0%
CANBERRA 2.8%
CHRIsTCHURCH 4.0%
DARwIN 0.8%
gOLD COAsT 5.0%
mELBOURNE 3.0%
PERTH 1.5%
syDNEy 4.2%
TOwNsVILLE 4.0%
wELLINgTON 4.0%
PEAK PHAsE mID PHAsE TROUgH PHAsE
gROwTH DECLINE
OCEANIA PHAsE sUmmARy
Global economic growth is forecast to accelerate moderately to 2.7% in 2017. The World Bank stated recently that global economic growth in advanced economies is expected to edge up to 1.8% in 2017 according to the World Bank’s January 2017 Global Economic Prospects report. The report stated that fiscal stimulus in major economies, particularly in the United States, could generate faster domestic and global growth than projected, although rising trade protection could have adverse effects.
This is positive news for both Australia and New Zealand. Economic growth in Australia is projected to pick up to 3% by 2018. The decline in resource-sector investment has commenced to tail off and the non-resource sector is seeing a steady increase in household consumption and investment as wages and employment rise.
Recent strong economic growth in New Zealand is projected to moderate to less than 3% in 2018. Both net migration and expenditure on the Canterbury earthquake rebuild are expected to slow gradually, slowing domestic demand, especially construction activity. The latest earthquake will entail rebuilding investment, but this is not included in the projection because it is too early to judge the economic effects. Growth will continue to be driven by tourism, with dairy price increases providing a further boost to incomes through the terms of trade. Inflation is likely to rise but remain below the mid-point of the official 1 to 3% target range.
The New Zealand Reserve Bank has tightened loan-to-value restrictions in order to limit financial stability risks from the high levels of household debt associated with rapid house price increases. These increases have been fuelled by low interest rates, as the bank has attempted to lift persistently below-target inflation.
Within both Australia and New Zealand, low interest rates reflect low inflation which continue to fuel high house prices.
Rising and elevated house prices may lead to a build-up of systemic risks, which was highlighted by the continuing media coverage on overheated housing markets in both countries.
Our construction industry observations are highlighted in the RLB Market Sector Activity Model (refer to page 8). Across Oceania, of the seven sectors RLB monitors, 64% of all city’s sectors are in a growth phase, with 36% in a decline phase. All market sectors within Sydney are in the growth and mid phases of the market cycle, whereas Canberra has the most sectors within the trough phase. Wellington, where six of seven sectors are in the mid growth zone, is poised for a stronger year in 2017. Both Melbourne and Darwin have four sectors within the peak phase, showcasing the historical construction work done performance.
The construction outlook within both countries remains positive with the residential market fuelling growth. What RLB is not experiencing over the last three years however, is a significant rise in construction costs fuelled by the significant surge in building works.
The last three years of building activity has seen double digit percentage rises across both Australia and New Zealand. Historically, the last significant period of double digit annual increases of building work done was in the financial years 2002 to 2004. During this period, annual construction escalation rises across Oceania ranged from 3.5% to 11.7%.
RLB has reported escalation rises for the past three years of between 0.6% to 6.0% which is a significant decrease from the 2002 and 2004 numbers.
It is noted that CPI rates in 2002/04 were not significantly different to those in 2014/16 with rates in the order of between 2.5% and 3.5%. Home mortgage rates for the same periods were between 7% and 8% in 2002/04 and 5% and 6% in 2014/16.
RLB CONsTRUCTION mARKET ACTIVITy CyCLE sUmmARy
16
31
36
3053
Within the major 12 cities of Oceania, 38% of sectors are within the peak phase, 43% in the mid phase and 19% in the trough phase (refer to page 8 for more details).
63% of all sectors are within the growth stage of the market activity cycle. (refer to page 8 for more details)
OCEANIA sTAgE sUmmARy
OCEANIA sECTOR sUmmARy
PEAK gROwTH 20
PEAK DECLINE 11
mID gROwTH 26
TROUgH DECLINE
9
TROUgHgROwTH
7
mID DECLINE
10
The sector summary highlights the number of sectors within each phase broken down into growth or decline stages (refer to page 8)

Rider Levett Bucknall | Oceania Report – First Quarter 2017
6
tender Price index trends OCEANIA
Rider Levett Bucknall’s Tender Price Index (TPI) is calculated by using RLB costing models for a CBD/CBD fringe commercial office project and a multi-storey residential project. The costing of each model by RLB offices gives the basis for the changing costs of construction works over time, relative to Sydney’s base 100 at January 2000.
The forecast has been calculated by RLB Directors using market intelligence, pipeline analysis and economic reports to forecast construction cost uplifts into the future.
RLB TENDER PRICE INDEX sERIEs (% CHANgE) - DECEmBER 2016CITy 2010 2011 2012 2013 2014 2015 2016 (f) 2017 (f) 2018 (f) 2019 (f)
ADELAIDE 2.9 -3.2 0.1 0.9 0.6 0.8 1.8 3.0 3.5 3.5
AUCKLAND 0.0 0.0 0.0 0.8 4.1 5.1 5.6 4.6 3.0 1.5
BRIsBANE -0.7 0.3 0.0 -1.9 5.1 5.9 7.2 4.0 4.0 4.0
CANBERRA 3.4 1.4 -0.6 2.2 1.6 2.0 2.5 2.8 3.0 3.0
CHRIsTCHURCH 4.6 3.0 4.7 5.1 6.0 6.0 3.0 4.0 3.0 1.5
DARwIN 2.0 -11.4 2.0 3.0 1.8 0.8 0.2 0.8 1.5 2.0
gOLD COAsT N/A N/A N/A 0.0 4.1 4.0 6.0 5.0 4.0 3.0
mELBOURNE 4.2 3.0 0.0 0.2 1.5 2.0 2.0 3.0 3.0 3.0
PERTH -1.6 1.3 -2.3 1.1 0.8 0.8 0.8 1.5 3.0 3.0
syDNEy 1.0 2.2 1.2 2.0 3.0 4.5 4.8 4.2 4.0 3.5
TOwNsVILLE 0.4 0.5 1.0 1.3 2.0 3.0 3.0 4.0 4.0 4.0
wELLINgTON 1.5 1.0 1.5 2.0 3.4 3.0 4.0 4.0 4.5 5.0
(F) RLB Forecast
RELATIVITIEsCITy DEC 2016
ADELAIDE 86
AUCKLAND 84
BRIsBANE 84
CANBERRA 92
CHRIsTCHURCH 87
DARwIN 96
gOLD COAsT 89
mELBOURNE 89
PERTH 90
syDNEy 100
TOwNsVILLE 85
wELLINgTON 88
Using Sydney as the base of 100, all offices’ costs have been recalibrated highlighting the building cost relativities between each city.
RLB TENDER PRICE INDEX RELATIVITy mATRIX Q4 2016ADELAIDE BRIsBANE CANBERRA DARwIN gOLD COAsT mELBOURNE PERTH syDNEy TOwNsVILLE
100 100 100 100 100 100 100 100 100
BNE 98 ADE 102 ADE 93 ADE 89 ADE 111 ADE 96 ADE 95 ADE 86 ADE 101
CAN 107 CAN 110 BNE 91 BNE 87 BNE 109 BNE 94 BNE 93 BNE 84 BNE 99
DAR 112 DAR 114 DAR 104 CAN 96 CAN 119 CAN 103 CAN 102 CAN 92 CAN 108
GC 90 GC 92 GC 84 GC 80 DAR 124 GC 86 GC 86 GC 77 GC 91
MEL 104 MEL 107 MEL 97 MEL 93 MEL 116 DAR 107 DAR 106 DAR 96 DAR 113
PER 105 PER 108 PER 98 PER 94 PER 117 PER 101 MEL 99 MEL 89 MEL 105
SYD 116 SYD 119 SYD 108 SYD 104 SYD 129 SYD 112 SYD 111 PER 90 PER 106
TVE 99 TVE 101 TVE 92 TVE 89 TVE 110 TVE 95 TVE 94 TVE 85 SYD 118
RLB TENDER PRICE INDEX RELATIVITy mATRIX Q4 2016AUCKLAND CHRIsTCHURCH syDNEy wELLINgTON
100 100 100 100
CHC 104 AUCK 96 AUCK 84 AUCK 95
SYD 119 SYD 115 CHC 87 CHC 99
WELL 105 WELL 101 WELL 88 SYD 114
RLB TPI CITy RELATIVITIEsTPI relativities have been calculated using the model costings to determine the construction cost in RLB offices and comparing the differences in cost between each office. Using Sydney as the base of 100, all offices’ costs have recalibrated highlighting the building cost relativities between each city.
For example, building costs in Melbourne (relativity of 89) when compared to Auckland (relativity of 84) are 6% more expensive, and conversely, Auckland’s building costs are 5.6% cheaper than Melbourne. The calculations are:
[ 1 - ( MELBOURNE ) ] *100 = Relativity % Difference i.e. 1 - ( 89 ) *100 = 5.95%AUCKLAND 86
[ 1 - ( AUCKLAND ) ] *100 = Relativity % Difference i.e. 1 - ( 86 ) *100 = 5.618%MELBOURNE 89

Rider Levett Bucknall | Oceania Report – First Quarter 2017
7
tender Price index trends OCEANIA
The tender price index graph shows the changing costs of works over time, relative to Sydney’s base 100 at January 2000, and is based upon RLB’s costing models for CBD/CBD fringe commercial office building and a residential multi-storey construction project.
DEC 11110
200
130
120
150
160
140
170
180
190
DEC 12 DEC 13 DEC 19DEC 14 DEC 15 DEC 17 DEC 18DEC 16
FORECAST
AUCKLAND CHRISTCHURCH WELLINGTON SYDNEY
NEW ZEALAND RLB TENDER PRICE INDEX JAN 2000 = 100
RLB
TE
ND
ER
PR
ICE
IND
EX
DEC 11110
200
130
120
150
160
140
170
180
190
DEC 12 DEC 13 DEC 19DEC 14 DEC 15 DEC 17 DEC 18DEC 16
ADELAIDE BRISBANE CANBERRA DARWIN MELBOURNE
PERTH SYDNEY TOWNSVILLE GOLD COAST
AUSTRALIAN RLB TENDER PRICE INDEX JAN 2000 = 100
RLB
TE
ND
ER
PR
ICE
IND
EX
FORECAST

Rider Levett Bucknall | Oceania Report – First Quarter 2017
8
sECTOR sTATUs wITHIN RLB OCEANIA OffICEs – DECEmBER 2016
OCEANIA HOUsEs APARTmENTs OffICEs INDUsTRIAL RETAIL HOTEL CIVIL
ADELAIDE
AUCKLAND
BRIsBANE
CANBERRA
CHRIsTCHURCH
DARwIN
gOLD COAsT
mELBOURNE
PERTH
syDNEy
TOwNsVILLE -
wELLINgTON
Within the general construction industry, RLB considers seven sectors to be representative of the industry as a whole which are represented in the table below.
Each sector is assessed as to which of the three phases (peak, mid and trough) best represents the current status of the sector within the cycle, then further refined by identifying whether the current status is in a growth stage or a decline stage.
The ‘up’ and ‘down’ arrows within the table represent whether the sector is in a growth or decline stage with the color of the arrow determining the phase within the cycle. The three colours identified in the cycle diagram (red, grey and blue) represent the peak, mid and trough phases of the cycle.
The doughnut graphs contained within this publication showcase the number of responses for each sector that are either in the peak, mid or trough phases of the cycle (as per page 9 graphs) and the number of sector responses which have been deemed to be in the growth or decline stages of the cycle, irrespective of the current phase (as per page 5 graphs).
cOnstructiOn MarKet actiVitY cYcLeOCEANIA
PEAK gROwTH
PEAK DECLINE
mID gROwTH
mID DECLINE
TROUgH gROwTH
TROUgH DECLINE
Activity within the construction industry traditionally has been subject to volatile cyclical fluctuations. The RLB Construction Market Activity Cycle (cycle) is a representation of the development activity cycle for the construction industry within the general economy.

Rider Levett Bucknall | Oceania Report – First Quarter 2017
9
PEAK PHAsE mID PHAsE TROUgH PHAsE
cOnstructiOn MarKet actiVitY cYcLeOCEANIA
The Market Activity Cycle charts, reflected on this page and within this publication, show the aggregated responses, by sector, from RLB’s Oceania offices, in each of the three phases, Trough, Mid and Peak.
The charts highlight the aggregated responses from the twelve RLB offices across the Oceania Region for the seven construction sectors tracked. The responses are summerised and graphically represented within each sector by the number of responses within the three phases that form the RLB Market Activity Cycle, Peak, Mid and Trough.
The results highlight that across Oceania, the Housing, Apartment, Retail, Civil and Retail sectors are performing strongly with more than 50% of offices indicating that these sectors are currently within the Growth phase of the cycle.
The majority of RLB offices see that the Office, Industrial and Hotel sectors are within both the Mid and Trough phase.
mARKET ACTIVITy CyCLE
HOUsEs
17
4
APARTmENTs
2 6
4
OffICEs
2
64
INDUsTRIAL
2
7
3
RETAIL
1 6
5
HOTEL
1
64
CIVIL
17
4

Rider Levett Bucknall | Oceania Report – First Quarter 2017
10
As 2016 comes to a close, the year will be best remembered as the year of international geopolitical surprises. The decision of UK voters to Brexit in June together with America confounding almost all experts in appointing Donald Trump as the 45th US President will have an impact into 2017 and later years.
Fortunately, 2016 has been a year of good news for building in Australia. The latest Australian Bureau of Statistics (ABS) reported over $107B of building work done for the year ending 30 June 2016, up $9B (9%) from 2015 results and $18B from 2014 (20%). As highlighted in the table to the right, significant residential construction is fuelling the industry’s growth. New dwelling commencements are predicted to reach almost 230,000 during 2016, an increase of 5% on 2015 numbers.
The growth in residential work done is being fuelled by rising population. Current indicators remain positive with Australia’s population growing by 338,000 people in the twelve months to June 2016. This provides a strong underpinning for GDP growth. According to the latest forecasts from the Department of Immigration and Border Protection, Australia’s population is set to grow by 400,000 people a year by 2020. This should continue the need for continued dwelling construction in the years ahead.
Apartments are still accounting for a historically disproportionate portion of the upturn in new dwelling
fy 2016 BUILDINg wORK DONE % CHANgE
fy 2016 BUILDINg APPROVALs % CHANgE
mARKET sECTOR ACTIVITy CyCLE
14
25
23
10
-15
-10
-5
0
5
15
cOnstructiOn MarKet inteLLiGenceAUSTRALIA
20
-30
-20
-10
0
10
30
commencements since 2012, highlighting the changing residential market within most capital cities.
The concentration of high rise apartment building in the Sydney and Melbourne markets mean these two cities are currently important engines of residential building activity nationally.
The value of building work commenced during the year ending 30 June 2016 grew by 11.2% over 2015 results, highlighting the strength of the building sector across Australia. Total commencements for 2016 were more than $100B up from $97B for the year ended 30 June 2015. Work currently under construction across Australia was up 4.6% at 30 June to $122B.
Building Approvals remain strong with an overall growth of 11.3% realised in the 2016 Financial Year over 2015 and 39% over 2012 results. The Apartment sector represents the biggest growth area for approvals with 2016 results 13% over 2015 and 133% over 2012 approval levels. Both New South Wales and Victorian residential approvals represent 62% of the total Australian value.
For the first time this century, 2016 saw residential dwelling numbers for each of dwellings under construction, dwelling commencements and dwellings that were completed, rise to levels above 200,000. This reflects the current strength of the residential market across Australia.
BUILDINg ACTIVITy sUmmARy – AUsTRALIA2014 2015 2016 2015
v. 20142016
v. 2015
BUILDINg ACTIVITy (REsIDENTIAL & NON-REsIDENTIAL)
VALUE Of wORK DONE DURINg yEAR ($m) 89,478 98,624 107,591 10.2% 9.1%
VALUE Of wORK yET TO BE DONE ($m) 52,308 53,960 56,987 3.2% 5.6%
VALUE Of wORK IN THE PIPELINE ($m) 67,030 70,759 75,846 5.6% 7.2%
VALUE Of wORK COmmENCED fOR yEAR ($m) 90,482 97,401 108,356 7.6% 11.2%
VALUE Of wORK UNDER CONsTRUCTION ($m) 109,390 116,992 122,332 6.9% 4.6%
REsIDENTIAL DwELLINg NUmBERs
DwELLINg UNITs COmPLETED (NO.) 160,186 190,994 201,027 19.2% 5.3%
DwELLINg UNITs UNDER CONsTRUCTION (NO.) 164,193 189,376 215,058 15.3% 13.6%
DwELLINg UNITs COmmENCED (NO.) 182,929 218,485 229,560 19.4% 5.1%
DwELLINg UNITs NOT yET COmmENCED (NO.) 29,852 34,592 39,359 15.9% 13.8%
BUILDINg wORK DONE ($m)yEAR ENDINg 30 JUNE 2014 2015 2016NEw HOUsEs 28,203 32,408 34,278sEmI-DETACHED 18,075 21,574 27,928APARTmENTs 7,472 8,024 8,624TOTAL REsIDENTIAL 53,750 62,005 70,830OffICEs 5,884 6,558 6,342COmmERCIAL 1,438 1,668 1,195INDUsTRIAL 5,077 5,032 4,704RETAIL 6,207 6,236 6,971EDUCATION 4,862 4,604 4,318HEALTH 6,387 6,366 6,083HOTELs 1,053 1,771 2,080OTHER NON-REs. 4,821 4,383 5,068TOTAL NON-REs. 35,729 36,618 36,761TOTAL 89,479 98,624
+10.2%107,591
+9.1%
BUILDINg APPROVALs ($m)yEAR ENDINg 30 JUNE 2014 2015 2016NEw HOUsEs 30,057 33,356 34,989 TOTAL sEmI-DETACH 5,371 6,262 7,824 APARTmENTs 15,689 20,995 23,749 TOTAL REsIDENTIAL 51,117 60,614 66,562 OffICEs 7,314 4,585 4,466 COmmERCIAL 1,485 1,367 1,094 INDUsTRIAL 5,102 4,538 5,099 RETAIL 6,018 6,396 6,298 EDUCATION 4,707 4,080 5,314 HEALTH 4,585 4,262 4,914 HOTELs 2,606 1,651 2,863 OTHER NON-REs. 4,771 4,763 6,067 TOTAL NON-REs. 36,587 31,640 36,115 TOTAL 87,704 92,254
5.2% 102,678
11.3%
PEAK PHAsE mID PHAsE TROUgH PHAsE
Refer Page 8 for more details

Rider Levett Bucknall | Oceania Report – First Quarter 2017
11
cOnstructiOn MarKet inteLLiGenceAUSTRALIA
Despite the current press reports of a downturn in building activity, the value of building work in the pipeline rose 7.2% during the year to 30 June 2016, up from 5.6% the previous year.
The Federal Treasurer’s Mid-year Economic and Fiscal Outlook statement highlighted an easing of the forecasted Consumer Price Index (CPI) of 50 basis points in 2016/17 and 25 basis points in 2017/18. The CPI forecasts of 2% and 2.75% respectively may have a small impact on general construction escalation during this period, however, with Enterprise Bargaining Agreements recently agreed to across the Eastern Seaboard, we are forecasting higher construction escalation than forecasted CPI for this period. Market pressures are dictating higher pricing in Sydney and Brisbane with the rest of the country relatively stable, albeit higher than CPI with the exception of Perth.
2
4
0
6
8
10
NSW VIC QLD SA WA NT ACT
SEP 2015 DEC 2015 MAR 2016 JUN 2016
BIL
LIO
NS
BUILDING WORK DONE - QUARTERS
SOURCE ABS 8755 - ORIGINAL
2
4
0
6
10
8
12
NSW VIC QLD SA WA NT ACT
SEP 2015 DEC 2015 MAR 2016 JUN 2016
BIL
LIO
NS
ENGINEERING WORK DONE - QUARTERS
SOURCE ABS 8755 - ORIGINAL
2
4
6
0
8
14
12
10
16
NSW VIC QLD SA WA NT ACT
SEP 2015 DEC 2015 MAR 2016 JUN 2016
BIL
LIO
NS
CONSTRUCTION WORK DONE - QUARTERS
SOURCE ABS 8755 - ORIGINAL
12
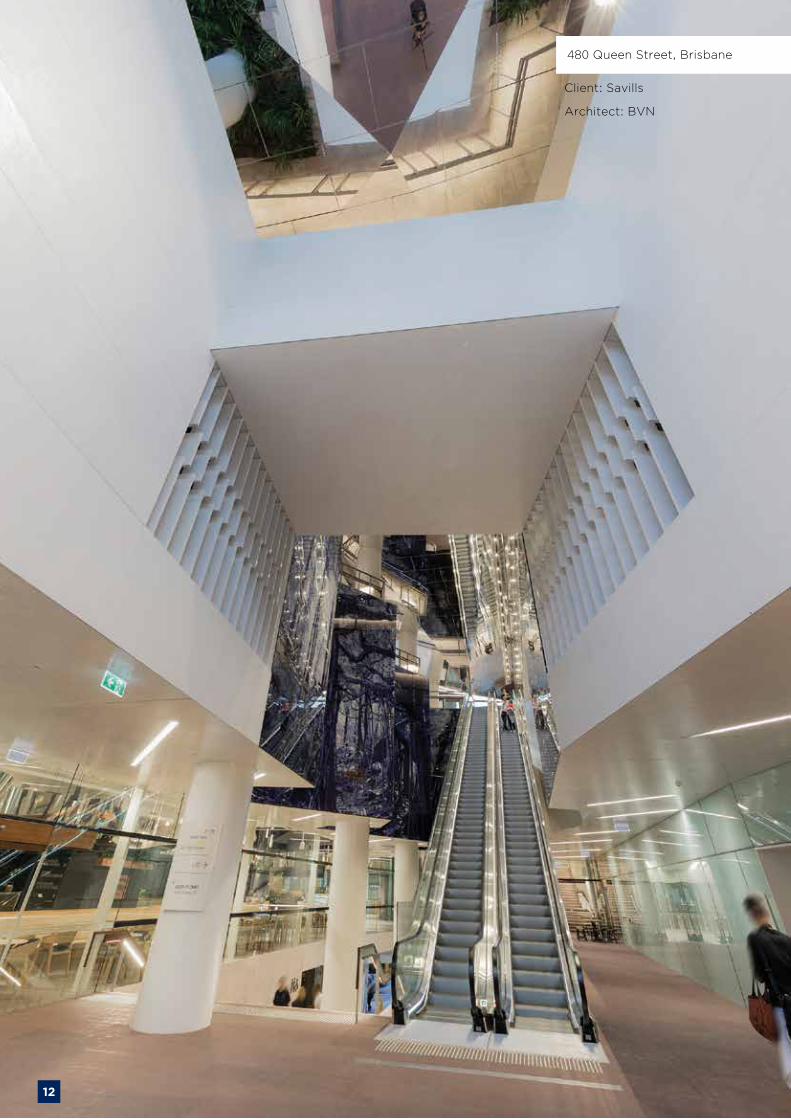
480 Queen Street, Brisbane
Client: Savills
Architect: BVN

13
Rider Levett Bucknall | Oceania Report – First Quarter 2017
Location inteLLigenceAUSTRALIA
ADELAIDEThe South Australian economy is expected to grow 1.5% in 2015/16 and modest growth of around 1.25% in 2016/17. The imminent closure of South Australia’s car industry in late 2017 will represent a significant negative for South Australian manufacturing. The Government’s recent announcements of increased defence manufacturing spend will offset the loss of manufacturing within the car industry to some extent. The weaker currency has lifted the competitiveness of the manufacturing sector, as well as agriculture, tourism and international education.
The South Australian housing market continues to lift as investors and owner-occupiers broaden their view. Annual growth of home starts and home loans are solid. House prices in Adelaide have grown only modestly through the year to September. House prices are up 2.7% for the year to September 2016, while unit prices slipped 0.2%, according to CoreLogic.
The general labour market in South Australia has picked up during 2016. Employment rose by 1.8% in the year to September 2016. This is above growth in employment nationally of 1.4% over the same period.
The tender market continues to be keen but there are clear signs with more work coming into the pipeline the cost of construction is increasing. RLB continues to see signs of larger contractors pricing smaller projects to ensure they maintain work into 2017. The expansion of education projects is seeing tertiary institutions continue their activity with large projects being tendered to Tier One Contractors (Usually national head contractors which have the expertise, resources, and finances to undertake
multiple large-scale projects (over $250m).at the same time). The retail sector continues to provide new project work into the next year, this has kept many of the Tier Two contractors (smaller contractors which are sometimes based locally) tendering in this sector. There are some major projects in early stages that are expected to help lift the market including new work in the defence sector.
While aged care continues to provide many opportunity to the mid-sized builders the public sector still remains relatively quiet however with the release of the National STEM (Science, Technology, Engineering and Mathematics) School Education Strategy Program should also provide some more opportunity for trade and head contractors alike.
Major projects within Adelaide include: Adelaide University Clinical School ($230M); University of South Australia Health Innovation Building ($200M); Skycity Casino ($300M), University of South Australia Great Hall ($50M); New CBD High School Adelaide ($80M).
All trade contractors continue to remain competitive and are actively seeking new work as the year comes to an end. With the prospect of more work becoming available in the new year there is an expectation that costs will rise more than what has been seen in recent years.
sA BUILDINg wORK DONE ($m)yEAR ENDINg 30 JUNE 2014 2015 2016NEw HOUsEs 1,671 1,930 1,863APARTmENTs 481 576 607ALT. & RENO. 429 442 448TOTAL REsIDENTIAL 2,580 2,947 2,918OffICEs 217 205 140COmmERCIAL 54 52 36INDUsTRIAL 210 287 260RETAIL 298 258 288EDUCATION 486 285 420HEALTH 547 768 418HOTELs 69 36 35OTHER NON-REs. 362 263 230TOTAL NON-REs. 2,243 2,154 1,826TOTAL 4,823 5,101
+5.7%4,744-7.0%
sA BUILDINg APPROVALs ($m)yEAR ENDINg 30 JUNE 2014 2015 2016NEw HOUsEs 1,860 1,808 1,948 sEmI-DETACHED 267 313 373 APARTmENTs 258 368 440 TOTAL REsIDENTIAL 2,385 2,489 2,761 OffICEs 247 216 122 COmmERCIAL 21 47 42 INDUsTRIAL 179 269 261 RETAIL 309 248 274 EDUCATION 331 247 452 HEALTH 168 202 508 HOTELs 43 17 79 OTHER NON-REs. 211 201 448 TOTAL NON-REs. 1,508 1,448 2,186 TOTAL 3,893 3,938
1.1% 4,947 25.6%
80
2
4
6
10
2016
2017
10
-15
-10
-5
0
5
15
RLB EsCALATION fORECAsT (%)
fy 2016 BUILDINg wORK DONE % CHANgE
mARKET sECTOR ACTIVITy CyCLE(No of Market Sectors within each phase).
52
PEAK PHAsE mID PHAsE TROUgH PHAsE
Refer Page 8 for more details
480 Queen Street, Brisbane

14
Rider Levett Bucknall | Oceania Report – First Quarter 2017
Location inteLLigenceAUSTRALIA
BRIsBANEQueensland’s State Final Demand (SFD) finally increased in the first two quarters of 2016, after declining in seven of the previous eight quarters. This key measure of economic activity highlights the level of spending in the Queensland economy by both the private and government sectors. Queensland’s SFD is expected to increase at just over 2% over the next two years.
Queensland’s diversified economy will be a key factor in its recovery, but the sharp slowing in population growth, from the boom time 2.6% to 1.3% now, will act as a constraint. The recent jump in coal prices together with production ramping up on the Gladstone LNG plants, will boost government revenues and help underwrite the forecasted increases in public investment and government consumption expenditure.
Engineering work done (mining engineering, road and train infrastructure) for the twelve months to 30 June 2016 was down $11.6B from the June 2015 levels. The sector peaked at $45.7B for the twelve months ending June 2014.
In comparison the building work done for year ending 2016 was $20.8B, an increase of $2.7B on the year ending 30 June 2015. This has been driven by the boom in residential construction which accounted for $13.6B of the total work done. As residential construction slows over the next 12 months this level of expenditure will reduce significantly noting that there is still a significant pipeline of projects under construction. The public sector accounted for $1B of building work done in 2016.
There is currently a large differential between house prices in Brisbane and those in Melbourne and particularly Sydney. In the past when this has occurred there has been significant inter-state migration to Queensland. In the current market this has not occurred. The lack of job opportunities in Queensland following the resource sector downturn has resulted in Queensland’s population remaining static over the period.
The long-awaited commencement of the Queens Wharf project will occur in early 2017 when the demolition of the government buildings will start the construction process. The state government also announced Australian Unity as the preferred proponent for the redevelopment of the Herston Quarter. This will see a major health, research and aged care precinct developed on the site of the old Children’s Hospital site.
A number of major commercial projects were completed in 2016 including 1 William Street, 480 Queen Street and 160 Ann Street that have resulted in the historically high commercial vacancy rates in both Brisbane CBD and Fringe markets.
With commercial buildings at Southpoint and 900 Ann Street yet to come on line this situation is likely to get worse before it improves. Construction cost increases appear to have peaked and we expect some softening of construction costs during 2017. However there is still a large pipeline of work under construction and we expect the softening to be a gradual process with structural trades affected first.
80
2
4
6
10
2016
2017
10
-15
-10
-5
0
5
14.7
3
4
RLB EsCALATION fORECAsT (%)
fy 2016 BUILDINg wORK DONE % CHANgE
mARKET sECTOR ACTIVITy CyCLE(No of Market Sectors within each phase).
QLD BUILDINg wORK DONE ($m)yEAR ENDINg 30 JUNE 2014 2015 2016NEw HOUsEs 5,395 6,030 6,539APARTmENTs 2,790 3,857 5,515ALT. & RENO. 1,284 1,391 1,553TOTAL REsIDENTIAL 9,469 11,278 13,608OffICEs 830 1,059 1,020COmmERCIAL 203 317 205INDUsTRIAL 1,161 858 794RETAIL 1,515 1,705 1,768EDUCATION 867 985 703HEALTH 1,774 1,136 1,455HOTELs 242 306 443OTHER NON-REs. 593 491 813TOTAL NON-REs. 7,184 6,859 7,200TOTAL 16,653 18,137
+8.9%20,808+14.7%
QLD BUILDINg APPROVALs ($m)yEAR ENDINg 30 JUNE 2014 2015 2016NEw HOUsEs 5,542 6,218 6,855 sEmI-DETACHED 1,201 1,306 1,791 APARTmENTs 2,876 4,170 4,829 TOTAL REsIDENTIAL 9,619 11,694 13,476 OffICEs 1,022 601 679 COmmERCIAL 154 294 227 INDUsTRIAL 1,025 859 945 RETAIL 1,759 1,644 1,393 EDUCATION 1,136 653 1,171 HEALTH 631 742 814 HOTELs 286 383 805 OTHER NON-REs. 378 871 1,152 TOTAL NON-REs. 6,392 6,047 7,185 TOTAL 16,012 17,741
10.8% 20,660
16.5%
PEAK PHAsE mID PHAsE TROUgH PHAsE
Refer Page 8 for more details

15
Rider Levett Bucknall | Oceania Report – First Quarter 2017
Location inteLLigenceAUSTRALIA
RLB EsCALATION fORECAsT (%)CANBERRAThe current economic outlook for Canberra is now looking positive after some recent uncertainty due to Commonwealth Government job cuts. The recent ACT Government election result secured the future of the first stage of the Light Rail project and there is a strong pipeline of work in the Universities sector. Whilst there is still a risk to the economy around the Commonwealth Governments efficiency dividend; there is also potential opportunity in the recent establishment of Canberra’s first international flights between Singapore and Wellington, NZ.
Capital Metro Light Rail has commenced initial works on Northbourne Ave. The Australian National University (ANU) has recently awarded the circa $160M Union Court project to Lend Lease.
This will revitalise the heart of the university campus while providing new learning, teaching, social and community facilities.
The new ANU 800 bed student accommodation project will commence towards the end of the year and other key education projects are also underway. There is strong sentiment in the residential market with the proposed $500M “Section 200” mixed use development in Belconnen, a development to be staged over the next 10 years. There has been an increase in dwelling unit approvals of approximately 14% from the previous year overall.
With confidence returning and more projects currently in and planned for the market our forecast is a rise in the tender price index ahead of inflation for 2017 of 2.75 – 3%.
80
2
4
6
10
201620
17
10
-15
-10
-5
0
5
15
2
1
4
fy 2016 BUILDINg wORK DONE % CHANgE
mARKET sECTOR ACTIVITy CyCLE(No of Market Sectors within each phase).
ACT BUILDINg wORK DONE ($m)yEAR ENDINg 30 JUNE 2014 2015 2016NEw HOUsEs 528 544 396APARTmENTs 654 723 782ALT. & RENO. 121 128 137TOTAL REsIDENTIAL 1,303 1,395 1,314OffICEs 237 162 166COmmERCIAL 22 36 42INDUsTRIAL 39 33 34RETAIL 77 115 166EDUCATION 121 137 115HEALTH 102 74 143HOTELs 28 73 19OTHER NON-REs. 86 133 106TOTAL NON-REs. 712 763 790TOTAL 2,015 2,158
+7.1%2,104-2.5%
ACT BUILDINg APPROVALs ($m)yEAR ENDINg 30 JUNE 2014 2015 2016NEw HOUsEs 569 458 394 sEmI-DETACHED 127 167 301 APARTmENTs 513 507 539 TOTAL REsIDENTIAL 1,210 1,132 1,233 OffICEs 186 69 246 COmmERCIAL 33 18 23 INDUsTRIAL 45 42 23 RETAIL 73 186 105 EDUCATION 87 170 198 HEALTH 49 74 279 HOTELs 84 37 20 OTHER NON-REs. 151 90 244 TOTAL NON-REs. 708 686 1,138 TOTAL 1,918 1,819
-5.2% 2,371 30.4%
PEAK PHAsE mID PHAsE TROUgH PHAsE
Refer Page 8 for more details

16
567 Collins Street, Melbourne
Client: Investa Office Fund and Investa Commercial Property Fund
Architect: Cox and Spowers Architects

17
Rider Levett Bucknall | Oceania Report – First Quarter 2017
Location inteLLigenceAUSTRALIA
DARwINWith a new Northern Territory Government recently installed, the market is awaiting direction; noting the very soft prevailing market demand for construction output. New schools are being planned in Palmerston with ongoing development of existing school infrastructure in the rural areas. Road and infrastructure projects are continuing, though at a slower pace than previously. There is still a strong push for developing the north as well as ongoing defence investment in the top end.
A number of major projects have been completed this year, with no major projects commencing in the same period. Major projects currently underway include the Inpex Ichthys LNG plant, Gateway shopping Centre, new shopping centre at Coolalinga, a new hospital at Palmerston, Defence projects at Tindal with others planned for Darwin together with ongoing residential housing developments around newly released and subdivided land at Palmerstion.
The market has been flat this year, with very little pickup expected for 2017, given that very few projects proceeded through the design phase in 2016. Market conditions are expected to remain soft in 2017. Construction of the Inpex LNG plant will be continuing throughout 2017 and no major replacement project is expected upon its completion leading potentially to further market instability. It is likely at this stage that some defence projects may be starting which will infuse activity in the construction sector. We will also expect other projects to come on line given the unusually low level of activity experienced over the past two years and potentially next year.
RLB EsCALATION fORECAsT (%)
fy 2016 BUILDINg wORK DONE % CHANgE
mARKET sECTOR ACTIVITy CyCLE(No of Market Sectors within each phase).
2
41
80
2
4
6
10
20162017
10
-15
-10
-5
0
5
15
NT BUILDINg wORK DONE ($m)yEAR ENDINg 30 JUNE 2014 2015 2016NEw HOUsEs 300 324 350 APARTmENTs 447 322 200 ALT. & RENO. 74 86 94 TOTAL REsIDENTIAL 820 732 644 OffICEs 82 142 57 COmmERCIAL 45 9 4 INDUsTRIAL 323 229 63 RETAIL 54 43 156 EDUCATION 95 70 108 HEALTH 56 32 103 HOTELs 52 92 41 OTHER NON-REs. 393 105 75 TOTAL NON-REs. 1,101 722 607 TOTAL 1,921 1,455
-24% 1,251
-14%
NT BUILDINg APPROVALs ($m)yEAR ENDINg 30 JUNE 2014 2015 2016NEw HOUsEs 324 326 340 sEmI-DETACHED 113 80 55 APARTmENTs 171 151 144 TOTAL REsIDENTIAL 609 557 539 OffICEs 173 71 37 COmmERCIAL 13 6 4 INDUsTRIAL 114 101 27 RETAIL 91 356 69 EDUCATION 67 131 106 HEALTH 58 62 215 HOTELs 86 61 16 OTHER NON-REs. 85 95 198 TOTAL NON-REs. 685 884 672 TOTAL 1,294 1,441
11.3% 1,211 -15.9%
PEAK PHAsE mID PHAsE TROUgH PHAsE
Refer Page 8 for more details
18
Rider Levett Bucknall | Oceania Report – First Quarter 2017
Location inteLLigenceAUSTRALIA
RLB EsCALATION fORECAsT (%)
3
3 1
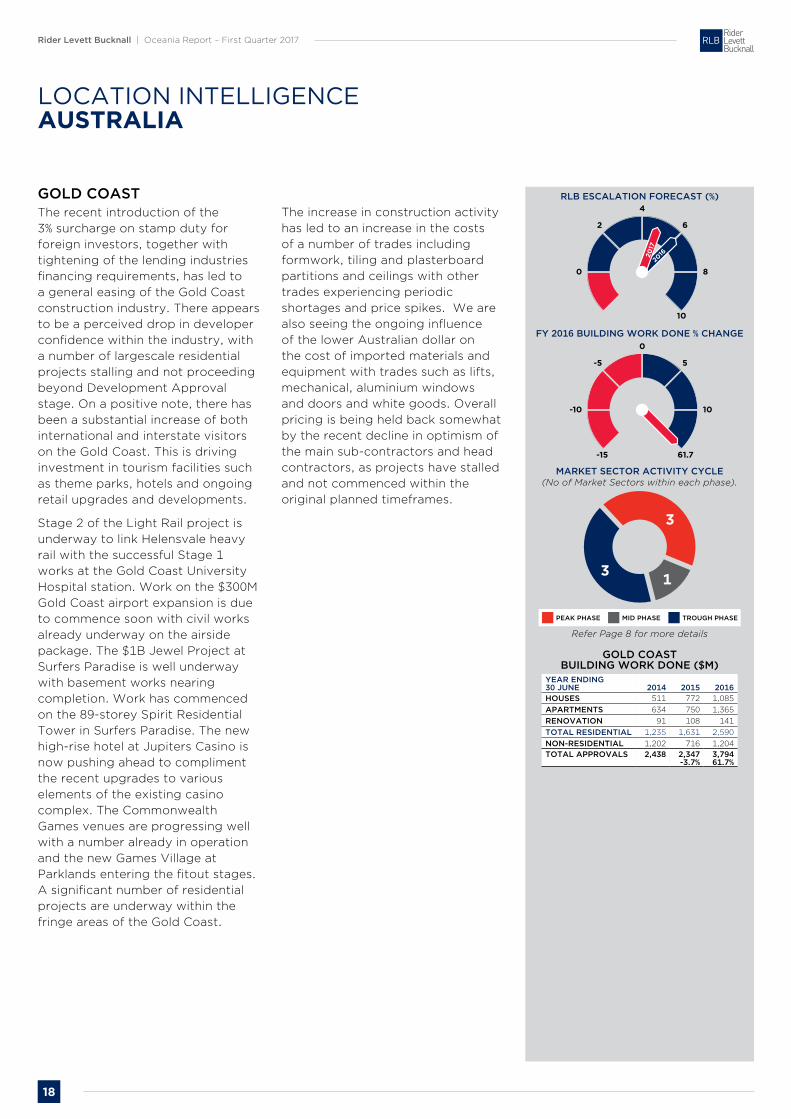
gOLD COAsTThe recent introduction of the 3% surcharge on stamp duty for foreign investors, together with tightening of the lending industries financing requirements, has led to a general easing of the Gold Coast construction industry. There appears to be a perceived drop in developer confidence within the industry, with a number of largescale residential projects stalling and not proceeding beyond Development Approval stage. On a positive note, there has been a substantial increase of both international and interstate visitors on the Gold Coast. This is driving investment in tourism facilities such as theme parks, hotels and ongoing retail upgrades and developments.
Stage 2 of the Light Rail project is underway to link Helensvale heavy rail with the successful Stage 1 works at the Gold Coast University Hospital station. Work on the $300M Gold Coast airport expansion is due to commence soon with civil works already underway on the airside package. The $1B Jewel Project at Surfers Paradise is well underway with basement works nearing completion. Work has commenced on the 89-storey Spirit Residential Tower in Surfers Paradise. The new high-rise hotel at Jupiters Casino is now pushing ahead to compliment the recent upgrades to various elements of the existing casino complex. The Commonwealth Games venues are progressing well with a number already in operation and the new Games Village at Parklands entering the fitout stages. A significant number of residential projects are underway within the fringe areas of the Gold Coast.
The increase in construction activity has led to an increase in the costs of a number of trades including formwork, tiling and plasterboard partitions and ceilings with other trades experiencing periodic shortages and price spikes. We are also seeing the ongoing influence of the lower Australian dollar on the cost of imported materials and equipment with trades such as lifts, mechanical, aluminium windows and doors and white goods. Overall pricing is being held back somewhat by the recent decline in optimism of the main sub-contractors and head contractors, as projects have stalled and not commenced within the original planned timeframes.
80
2
4
6
10
201620
17
10
-15
-10
-5
0
5
61.7
fy 2016 BUILDINg wORK DONE % CHANgE
mARKET sECTOR ACTIVITy CyCLE(No of Market Sectors within each phase).
gOLD COAsT BUILDINg wORK DONE ($m)
yEAR ENDINg 30 JUNE 2014 2015 2016HOUsEs 511 772 1,085 APARTmENTs 634 750 1,365 RENOVATION 91 108 141 TOTAL REsIDENTIAL 1,235 1,631 2,590 NON-REsIDENTIAL 1,202 716 1,204 TOTAL APPROVALs 2,438 2,347
-3.7% 3,794 61.7%
PEAK PHAsE mID PHAsE TROUgH PHAsE
Refer Page 8 for more details

19
Rider Levett Bucknall | Oceania Report – First Quarter 2017
Location inteLLigenceAUSTRALIA
RLB EsCALATION fORECAsT (%)
4
3
mELBOURNEThe outlook for Melbourne is favourable with sentiments in a number of sectors receiving a boost from government funding. Continuing strong commencement values have been seen in both the non-residential and residential (apartments) sectors. In excess of $2B of work has commenced in the non-residential sector for the past three quarters since the December 2015, highlighting a strong tender flow for contractors.
Residential commencements slowed in the June quarter but were still higher than 2014 levels. Work yet to be done in the June quarter remains at an almost all time high at $16.3B, which is providing stability in pricing at the moment.
Even with negative pressure that the ‘boom’ is over within Victoria, the HIA is predicting a drop off in the supply of new residential dwellings to 46,000 in 2018, down from a high of 68,000 in 2015. This decline is still higher than the 10 year average 2005- 2014.
Major projects such as Melbourne’s new Metro Tunnel and the Western Distributor, which are fully funded and ready to proceed after the state government announced they intend to fund these projects without assistance from the federal government due to current needs within the state.
Labour rates are still fluctuating within the market. On detached housing sites, labour is inching up slightly in the ‘hard’ trades i.e. bricklayers and carpenters. Within the large commercial and residential projects, even though labour rates are coming under ever more pressure due to constant EBA rate increases, the volume of overtime being worked is diminishing, causing a net constant pricing of labour within the project. Head contractors are asking subcontractors to increase labour rather than approve overtime.
The services trades within large projects have seen a small drop in pricing. This is due to market pressure in securing work rather than cheaper material cost. Pressure is still on suppliers to maximise market share due to decreasing margins. The supply/demand equilibrium is still finely balanced.
Small decreases in steel costs have shown up in the tender market during the past quarter. This is being fed by the reduction in base cost from China and companies attempting to secure pipeline for the future.
Construction activity is still good in Melbourne with a constant supply of new work coming into the market. Both large scale projects and suburban residential work is still strong
The continued growth in residential apartments is putting pressure on general pricing, with large spreads in pricing being seen. Current tenders have spreads of +/- 10% which is continuing.
As the Melbourne construction market remains positively stable, escalation rates are forecast to be 2% overall for 2016 and 3% for 2017. The strong civil sector is a strong factor holding up the overall forecasted escalation rate, with the commercial and residential sectors contributing small increases to the overall result.
Tendering is described as aggressive while contractors are trying to secure work with building costs remaining relatively stable.
fy 2016 BUILDINg wORK DONE % CHANgE
mARKET sECTOR ACTIVITy CyCLE(No of Market Sectors within each phase).
VIC BUILDINg wORK DONE ($m)yEAR ENDINg 30 JUNE 2014 2015 2016NEw HOUsEs 7,890 8,957 10,200sEmI-DETACHED 5,905 6,807 8,425APARTmENTs 2,516 2,524 2,656TOTAL REsIDENTIAL 16,311 18,288 21,281OffICEs 1,836 1,717 1,744COmmERCIAL 454 450 303INDUsTRIAL 839 1,480 1,528RETAIL 1,438 1,354 1,634EDUCATION 1,185 1,205 1,289HEALTH 1,369 1,869 1,577HOTELs 163 186 219OTHER NON-REs. 1,612 1,338 1,091TOTAL NON-REs. 8,897 9,598 9,384TOTAL 25,208 27,886
+10.6%30,665+10.0%
VIC BUILDINg APPROVALs ($m)yEAR ENDINg 30 JUNE 2014 2015 2016NEw HOUsEs 8,452 9,629 10,938 APARTmENTs 1,804 2,178 2,640 ALT. & RENO. 4,456 6,355 6,163 TOTAL REsIDENTIAL 14,713 18,162 19,740 OffICEs 1,717 1,569 1,368 COmmERCIAL 545 344 216 INDUsTRIAL 1,349 1,271 1,625 RETAIL 1,691 1,401 1,295 EDUCATION 884 1,143 1,532 HEALTH 1,416 1,098 1,178 HOTELs 217 271 574 OTHER NON-REs. 1,128 1,528 1,286 TOTAL NON-REs. 8,948 8,625 9,075 TOTAL 23,661 26,787
13.2% 28,815
7.6%
10
-15
-10
-5
0
5
15
80
2
4
6
10
2016
2017
PEAK PHAsE mID PHAsE TROUgH PHAsE
Refer Page 8 for more details

20
Rider Levett Bucknall | Oceania Report – First Quarter 2017
Location inteLLigenceAUSTRALIA
RLB EsCALATION fORECAsT (%)PERTHThe close link between commodity pricing (particularly oil and gas and iron ore) and the Western Australian economy continues to affect business confidence and investment. Although committed construction projects are proceeding, in the commercial sector there is a cautious approach to committing to significant new capital investment.
The Perth office vacancies are at historically high levels at 22% vacancy in the Perth CBD, and construction in the office sector is likely to remain low for a period of time. The residential sector has been strong over the last few years and is now slowing on the back of slower pre-sales and slowing population growth. The retail sector (and the major shopping centres in particular) have significant capital works planned over the next few years.
The State Government has awarded the $2B Forrestfield Link, a new train line that will connect the city with Perth Airport and a new terminus at the eastern suburb of Forrestfield. The contract for design and construction has been awarded to a joint venture led by the Italian industrial group, Salini Impreglio. Trains are expected to commence in 2020.
Similarly, the government is proceeding with the Perth Freight link. This $1.6B project is a major infrastructure project to enhance freight movement to Fremantle Ports.
CPI in Western Australia over the last 12 months (September quarter) was 0.8%. Despite five years without any measurable construction price increase, the current depressed work volumes have continued to keep price levels flat across most sectors. Over 2017 the predicted tender price index is anticipated to increase by 1.5%.
24
1
fy 2016 BUILDINg wORK DONE % CHANgE
mARKET sECTOR ACTIVITy CyCLE(No of Market Sectors within each phase).
80
2
4
6
10
2016
2017
10
-15
-10
-5
0
5
15
wA BUILDINg wORK DONE ($m)yEAR ENDINg 30 JUNE 2014 2015 2016NEw HOUsEs 5,920 6,591 6,076APARTmENTs 1,615 1,810 2,003ALT. & RENO. 679 678 810TOTAL REsIDENTIAL 8,214 9,080 8,888OffICEs 877 1,051 709COmmERCIAL 289 309 186INDUsTRIAL 1,264 822 298RETAIL 851 776 641EDUCATION 592 650 564HEALTH 992 684 488HOTELs 119 309 520OTHER NON-REs. 462 651 861TOTAL NON-REs. 5,446 5,250 4,267TOTAL 13,660 14,330
+4.9%13,155
-8.1%
wA BUILDINg APPROVALs ($m)yEAR ENDINg 30 JUNE 2014 2015 2016NEw HOUsEs 6,512 6,505 5,037 sEmI-DETACHED 641 671 507 APARTmENTs 944 1,566 1,086 TOTAL REsIDENTIAL 8,097 8,742 6,629 OffICEs 1,336 576 553 COmmERCIAL 192 184 148 INDUsTRIAL 1,162 697 514 RETAIL 730 579 1,026 EDUCATION 700 680 533 HEALTH 270 285 185 HOTELs 486 175 576 OTHER NON-REs 565 995 1,021 TOTAL NON-REs. 5,441 4,171 4,556 TOTAL 13,539 12,913
-4.6% 11,185 -13.4%
PEAK PHAsE mID PHAsE TROUgH PHAsE
Refer Page 8 for more details

21
Rider Levett Bucknall | Oceania Report – First Quarter 2017
Location inteLLigenceAUSTRALIA
RLB EsCALATION fORECAsT (%)
1
6
syDNEyRecent comments from economic analysts have noted that NSW is the top economic performing state in Australia. Activity in the Sydney construction market continues to be a major contributor to the economic performance of the state.
The residential sector continues to strengthen, and current indicators are that activity in the multi-unit segment will continue to increase well into 2017. The ABS Building Approvals data indicates that the value of dwellings approved are 22% above the values approved for FY 2016 against FY 2015. The Q3 2016 RLB Crane Index reported 305 cranes, of which 85% are located on residential projects. The strength of the residential sector is across all areas of the Sydney metropolitan area, and in particular multi-unit construction where demand for this type of development has not diminished.
In addition, the non-residential sector activity has now recovered from the lower levels of activity experienced in 2014 and early 2015. ABS approvals for FY 2016 are 15.5% above the values approved in FY 2015.
The Barangaroo South and International Convention Centre developments are now nearing completion, however subcontractors and suppliers appear to be able to source new replacement work in other sectors of the market place.
Work in the education, health, and aged care sectors in both small and large projects are of significant interest to contractors at the present time.
Concrete and masonry supply prices increased by 5% in the second quarter of 2016, whilst steel and plasterboard products increased by approximately 3% in the third quarter. Most other building material prices remained stable over the year to date. It is possible this price stability is due to the exchange rate and oil prices varying over a limited range, in addition the competition to maintain a market share and a full order book are required in order to maintain a strong cash flow position.
Whilst the supply cost of building materials has remained steady, the
cost of labour has continued to increase. All sectors of the industry are reporting increased demands for wage increases up to 5% per annum. These wage increases are being passed on to the cost of construction. Further, the Sydney market is now experiencing labour shortage in reinforcement fixers, form workers, bricklayers, carpenter/joiner and fire protection trades, with these trades reporting full order books and unable to accept new opportunities. Contractors are being forced into seeking alternative sources of subcontractor procurement.
In response to increasing wages and scarce resources, contractors and designers are continuing to take an increased interest in prefabricated methods of construction in order to overcome labour shortages and increase efficiency on site. The increase in the use of tower cranes is assisting in the development of prefabricated methods to reduce material handling methods and gain improvements in site efficiency to overcome reduced availability of site labour resources. In particular the higher quality prefabricated bathrooms modules are assisting in this transition.
The tender market during 2016 has been very strong. Tender results continue to report a large range of prices from lowest to highest prices. Contractors report that subcontract interest in projects is based upon the perceived quality of the project’s documentation and allocation of risk to subcontractors.
The availability of trades pricing new projects for contractors compiling tender offers is becoming a significant risk issue within the market due to levels of work. The strong fundamentals for a continuing strong work load throughout 2016 and well into 2017 indicate construction prices will increase in the range of 4.5% to 5% in 2016. The current strong work load and the opportunity for further increases in work in the first half of 2017 may lead to increased cost pressure, due to the competition for scarce resources to complete work that is in hand.
80
2
4
6
10
2016
2017
10
-15
-10
-5
0
5
16.1
fy 2016 BUILDINg wORK DONE % CHANgE
mARKET sECTOR ACTIVITy CyCLE(No of Market Sectors within each phase).
Nsw BUILDINg wORK DONE ($m)yEAR ENDINg 30 JUNE 2014 2015 2016NEw HOUsEs 6,121 7,496 8,292APARTmENTs 6,129 7,401 10,315ALT. & RENO. 2,226 2,639 2,785TOTAL REsIDENTIAL 14,475 17,535 21,392OffICEs 1,763 2,165 2,427COmmERCIAL 357 488 412INDUsTRIAL 1,151 1,208 999RETAIL 1,875 1,874 2,212EDUCATION 1,454 1,199 1,035HEALTH 1,398 1,632 1,669HOTELs 371 751 758OTHER NON-REs. 1,235 1,349 1,848TOTAL NON-REs. 9,605 10,665 11,360TOTAL 24,080 28,200
+17.1%32,752+16.1%
Nsw BUILDINg APPROVALs ($m)yEAR ENDINg 30 JUNE 2014 2015 2016NEw HOUsEs 6,374 7,841 8,964 sEmI-DETACHED 1,185 1,512 2,101 APARTmENTs 6,446 7,836 10,533 TOTAL REsIDENTIAL 14,005 17,189 21,598 OffICEs 2,588 1,362 1,424 COmmERCIAL 518 470 420 INDUsTRIAL 1,122 1,205 1,647 RETAIL 1,297 1,901 2,069 EDUCATION 1,457 986 1,153 HEALTH 1,672 1,772 1,609 HOTELs 1,394 655 738 OTHER NON-REs. 2,168 948 1,686 TOTAL NON-REs. 12,214 9,300 10,746 TOTAL 26,219 26,489
1.0% 32,344
22.1%
PEAK PHAsE mID PHAsE TROUgH PHAsE
Refer Page 8 for more details

22
Sir Owen Glenn National Aquatic Centre, Auckland
Client: AUT Millennium Ownership Trust
Architect: Pacific Environments NZ Ltd

23
Rider Levett Bucknall | Oceania Report – First Quarter 2017
Location inteLLigenceAUSTRALIA
RLB EsCALATION fORECAsT (%)
2
2
2
TOwNsVILLEThe economic activity in Townsville and North Queensland region has moved through a trough in recent years; with fewer major project commencements and less major projects in the pipeline. Seen in the context of Queensland, Townsville city has had high unemployment, and low population growth.
There is great potential however, with 2017 shaping up to be the start of recovery in major activities in the Townsville region. The Townsville Waterfront Priority Development Area is likely to deliver a good opportunity for a relifed CBD. The Waterfront revitalisation is expected to become shovel-ready in the short term. Additional to the Townsville Waterfront project, the North Queensland Stadium and Entertainment precinct project (commencing design in 2017 and construction in 2018) will also provide a catalyst for further CBD revitalisation.
The biggest impact on economic activity in the Townsville region, will be that it will most likely be the headquarters for the Carmichael coal mine project as recently announced by the Adani Group. It is expected that the wider North Queensland region will also benefit from this coal mine project. The outlook for the expected economic activity in the Townsville region looks positive for the foreseeable 12 months.
80
2
4
6
10
2016
2017
10
-20
-10
-5
0
5
15
fy 2016 BUILDINg APPROVALs % CHANgE
mARKET sECTOR ACTIVITy CyCLE(No of Market Sectors within each phase).
TOwNVILLE REgION BUILDINg APPROVALs ($m)
yEAR ENDINg 30 JUNE 2014 2015 2016HOUsEs 246 281 311APARTmENTs 6 16 25RENOVATION 57 51 56TOTAL REsIDENTIAL 308 349 392NON-REsIDENTIAL 210 124 197TOTAL APPROVALs TOwNsVILLE REgION
518 473 17.2%
589 -20.0%
PEAK PHAsE mID PHAsE TROUgH PHAsE
Refer Page 8 for more details

24
Rider Levett Bucknall | Oceania Report – First Quarter 2017
Location inteLLigenceNew ZealaNd
26
13
fy 2016 BUILDINg PUT IN PLACE % CHANgE
fy 2016 BUILDINg CONsENTs % CHANgE
Growth in the New Zealand economy over the first half of 2016 was stronger than expected rising 2.8% to 30 June. Strong housing activity and New Zealand consumer spending helped drive economic growth in 2016. Politically the resignation of the John Key after eight years as Prime Minister was unexpected however economists believe his legacy of an improved economy since taking office will continue. His successor will inherit a growing economy driven by construction, manufacturing, increased business confidence and stronger labour force figures.
While there has been a slight rise in unemployment numbers there has also been the largest labour force increase since 2004 at 1.5%. This is being slightly impacted upon by the increase in migration.
A record number of house sales pushed real estate services to its highest quarterly rise in 18 months. There is also ongoing strong demand for new builds, particularly in the Auckland region as reported in Value of Building Work Put in Place: June 2016 quarter.
10
-15
-10
-5
0
5
15
20
-30
-20
-10
0
10
30
New Zealand building activity saw 14.9 % increase in residential building and 9.4 % increase to non-residential building. The total rise in all construction to June 2016 saw a 12.8% increase.
Manufacturing grew 0.8% in the June 2016 quarter, a rise connected to construction. The largest contributor to the growth was non-metallic mineral product manufacturing, which increased 11%. This industry includes glass, cement, and concrete manufacturing – products used mainly in the construction sector.
mARKET sECTOR ACTIVITy CyCLE(No of Market Sectors within each phase).
BUILDINg wORK PUT IN PLACE ($m)yEAR ENDINg 30 JUNE 2014 2015 2016REsIDENTIAL 8,661 9,907 11,385 HOTELs 383 316 388 HEALTH 437 490 551 EDUCATION 698 904 1,051 sOCIAL 400 479 491 COmmERCIAL 1,906 2,200 2,554 INDUsTRIAL 1,072 1,304 1,298 fARm 292 364 294 TOTAL NON-REs 5,187 6,057 6,627 TOTAL 13,848 15,964
15.3% 18,011
12.8%
BUILDINg CONsENTs ($m)yEAR ENDINg 30 JUNE 2014 2015 2016REsIDENTIAL 8,850 9,787 11,688 RETAIL 630 698 904 OffICEs 1,035 1,197 1,171 INDUsTRIAL 962 1,217 1,119 EDUCATION 619 776 1,239 HEALTH 419 481 681 HOTELs 226 277 396 OTHER 699 716 632 TOTAL NON-REs 4,591 5,362 6,141 TOTAL CONsENTs 13,441 15,149
12.7% 17,829
17.7%
PEAK PHAsE mID PHAsE TROUgH PHAsE
Refer Page 8 for more details

25
Rider Levett Bucknall | Oceania Report – First Quarter 2017
Location inteLLigenceNew ZealaNd
RLB EsCALATION fORECAsT (%)
fy 2016 BUILDINg PUT IN PLACE % CHANgE
fy 2016 BUILDINg CONsENTs % CHANgE
AUCKLANDNational construction has experienced sustained growth since 2011 with a forecast peak in 2017.
Over half of the national growth is in the residential sector within the Auckland region. The recent release of the Auckland Unitary plan has loosened planning restrictions to allow more intensification and opening of greenfield developments on the city fringe, to accommodate expected net migration flows with some 422,000 additional dwellings estimated to be required by 2040. Last year alone saw net migration of around 32,000. On the back of this strong population growth, there are significant non-residential construction projects in the delivery phase, with many more planned to start construction in the short term. All sectors are experiencing strong demand, with the exception of the Hotel sector, and activity is currently expected to peak in 2018. In this heated market, resource issues are evident, particularly on the larger projects. Tier One and Two contractors and the larger subcontractors are generally fully booked. This lack of resource is increasing prices and affecting delivery programs. Banks have also started to tighten up on lending. This combination of tighter lending and increasing construction costs are likely to see a number of planned projects shelved or deferred.
There is a significant volume of work underway within the CBD. The three largest projects being the City Rail Loop, Commercial Bay and the Skycity Convention Centre and Hotel. Additionally, there are a number of commercial and residential projects within the Wynyard Quarter area and city fringe. The University of Auckland has large projects in planning, and population growth is requiring significant investment in public infrastructure such as prisons, hospitals and schools etc.
The construction market, with respect to projects over $50M requiring Tier One and Two contractors, is heated. There are a lack of contractors with the resource and skill base to deliver the number of large projects in many the Auckland region. Many out of town contractors have established themselves in Auckland to fill part of this void, namely Leighs Construction from Christchurch and LT McGuiness from Wellington. The subcontractor market across the board is also under resource pressure, and this is seen in generally poor tender responses and volatile tender prices. To mitigate tendering risk, it is now more important than ever to provide good quality tender documentation with realistic timeframes. A well set up project can achieve competitive pricing, in the current market, if it is made as attractive as possible. Despite CPI inflation below 1%, within the construction sector, wage growth and demand has seen tender prices increase in the order of 6% for 2016 with a forecast of 5% for 2017.
80
2
4
6
10
201620
17
20
-30
-20
-10
0
10
30
20
-30
-20
-10
0
10
30
13
3
mARKET sECTOR ACTIVITy CyCLE(No of Market Sectors within each phase).
BUILDINg wORK PUT IN PLACE ($m)yEAR ENDINg 30 JUNE 2014 2015 2016REsIDENTIAL 2,827 3,409 4,186 TOTAL NON-REs 1,733 1,871 2,087 TOTALAUCKLAND REgION
4,560 5,279 15.8%
6,27318.8%
BUILDINg CONsENTs ($m)yEAR ENDINg 30 JUNE 2014 2015 2016REsIDENTIAL 2,845 3,418 4,371 RETAIL 273 247 324 OffICEs 318 326 445 INDUsTRIAL 269 330 402 EDUCATION 248 306 369 HEALTH 107 103 169 HOTELs 66 125 236 OTHER 181 123 107 TOTAL NON-REs 4,308 4,976 6,423 TOTAL CONsENTsAUCKLAND REgION
7,152 8,394 17.4%
10,793 28.6%
PEAK PHAsE mID PHAsE TROUgH PHAsE
Refer Page 8 for more details

26

27
Clyde Quay Wharf, Wellington
Client: Investa Clyde Quay Wharf Redevelopment Ltd Partnership
Architect: Athfield Architects
28
Rider Levett Bucknall | Oceania Report – First Quarter 2017
Location inteLLigenceNew ZealaNd
13
3
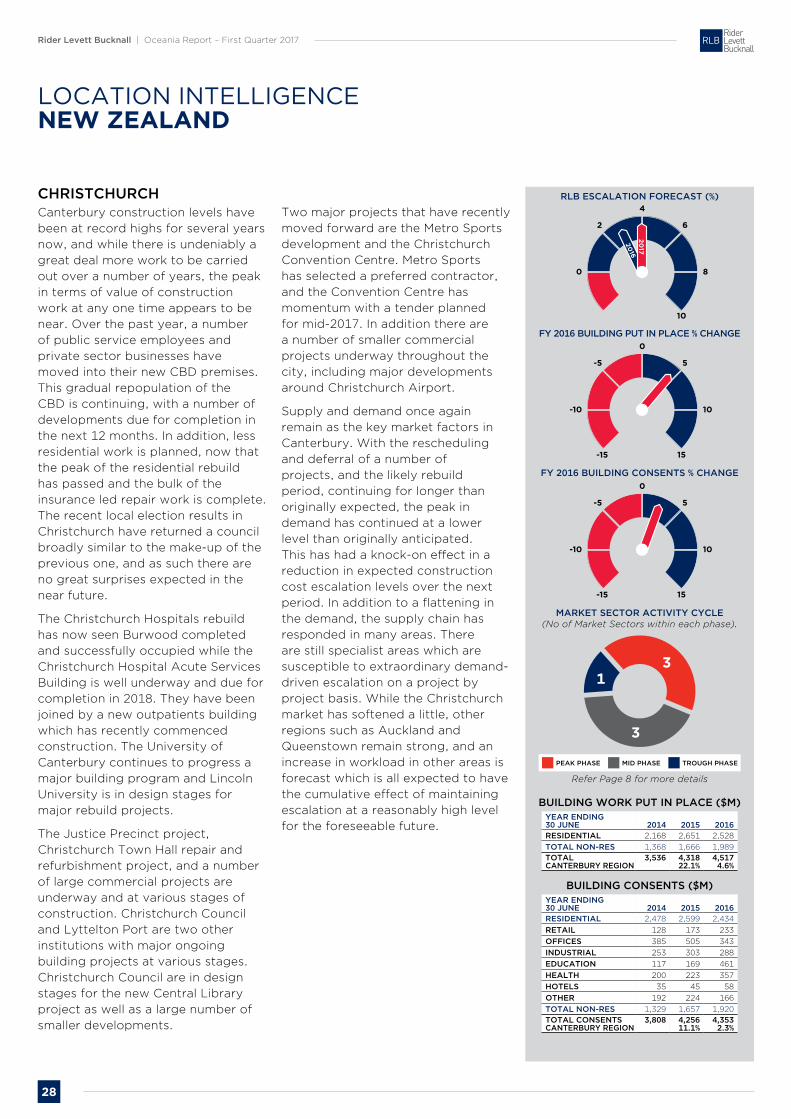
CHRIsTCHURCH Canterbury construction levels have been at record highs for several years now, and while there is undeniably a great deal more work to be carried out over a number of years, the peak in terms of value of construction work at any one time appears to be near. Over the past year, a number of public service employees and private sector businesses have moved into their new CBD premises. This gradual repopulation of the CBD is continuing, with a number of developments due for completion in the next 12 months. In addition, less residential work is planned, now that the peak of the residential rebuild has passed and the bulk of the insurance led repair work is complete. The recent local election results in Christchurch have returned a council broadly similar to the make-up of the previous one, and as such there are no great surprises expected in the near future.
The Christchurch Hospitals rebuild has now seen Burwood completed and successfully occupied while the Christchurch Hospital Acute Services Building is well underway and due for completion in 2018. They have been joined by a new outpatients building which has recently commenced construction. The University of Canterbury continues to progress a major building program and Lincoln University is in design stages for major rebuild projects.
The Justice Precinct project, Christchurch Town Hall repair and refurbishment project, and a number of large commercial projects are underway and at various stages of construction. Christchurch Council and Lyttelton Port are two other institutions with major ongoing building projects at various stages. Christchurch Council are in design stages for the new Central Library project as well as a large number of smaller developments.
Two major projects that have recently moved forward are the Metro Sports development and the Christchurch Convention Centre. Metro Sports has selected a preferred contractor, and the Convention Centre has momentum with a tender planned for mid-2017. In addition there are a number of smaller commercial projects underway throughout the city, including major developments around Christchurch Airport.
Supply and demand once again remain as the key market factors in Canterbury. With the rescheduling and deferral of a number of projects, and the likely rebuild period, continuing for longer than originally expected, the peak in demand has continued at a lower level than originally anticipated. This has had a knock-on effect in a reduction in expected construction cost escalation levels over the next period. In addition to a flattening in the demand, the supply chain has responded in many areas. There are still specialist areas which are susceptible to extraordinary demand- driven escalation on a project by project basis. While the Christchurch market has softened a little, other regions such as Auckland and Queenstown remain strong, and an increase in workload in other areas is forecast which is all expected to have the cumulative effect of maintaining escalation at a reasonably high level for the foreseeable future.
80
2
4
6
10
2016
2017
10
-15
-10
-5
0
5
15
10
-15
-10
-5
0
5
15
RLB EsCALATION fORECAsT (%)
fy 2016 BUILDINg PUT IN PLACE % CHANgE
fy 2016 BUILDINg CONsENTs % CHANgE
mARKET sECTOR ACTIVITy CyCLE(No of Market Sectors within each phase).
BUILDINg wORK PUT IN PLACE ($m)yEAR ENDINg 30 JUNE 2014 2015 2016REsIDENTIAL 2,168 2,651 2,528 TOTAL NON-REs 1,368 1,666 1,989 TOTALCANTERBURy REgION
3,536 4,318 22.1%
4,517 4.6%
BUILDINg CONsENTs ($m)yEAR ENDINg 30 JUNE 2014 2015 2016REsIDENTIAL 2,478 2,599 2,434 RETAIL 128 173 233 OffICEs 385 505 343 INDUsTRIAL 253 303 288 EDUCATION 117 169 461 HEALTH 200 223 357 HOTELs 35 45 58 OTHER 192 224 166 TOTAL NON-REs 1,329 1,657 1,920 TOTAL CONsENTsCANTERBURy REgION
3,808 4,25611.1%
4,3532.3%
PEAK PHAsE mID PHAsE TROUgH PHAsE
Refer Page 8 for more details

29
Rider Levett Bucknall | Oceania Report – First Quarter 2017
Location inteLLigenceNew ZealaNd
wELLINgTONConstruction in the Wellington region continues to improve, with a number of good size projects currently underway. Three additional tower cranes have been erected over the past couple of months and further large projects remain in design stage. Activity across all sectors remains strong and very positive for the next few years. Strengthening of existing buildings still remains as a key construction component in our region, and this is also driving much needed fit-out upgrade works at the same time. The Lower North Island regional centres are showing signs of increased construction activity with the positive economic signals in the main centres filtering through. We expect this to continue for some time.
Wellington has a good variety of current projects now under construction, including some major office refurbishments in various stages, with the majority to finish this year. New commercial office buildings have started, along with some mixed-use developments and further public space work on the waterfront and throughout the city.
Public and private multi-unit apartment construction is also underway, with new developments in the pre-sale and detailed design phases at present. Victoria University projects are now well underway and will continue through 2017, as will the airport terminal and carpark extension works. Other planned works at the airport include extensions to the International Departure area and a potential hotel. Council-owned buildings are also due for some strengthening and refurbishment work and these may get underway this year.
Fit-out work is also continuing, which is providing good ongoing work for the subcontractor market in Wellington. Transmission Gully and other major civil roading works on the Kapiti Coast are progressing well, and property demand is being felt already in the northern reaches of our region.
Cost escalation in our region is finally starting to show its teeth, after being very flat since 2008. We remain at low levels compared with other centres around New Zealand, but given the likely activity over the next few years, we will probably see increasing escalation over the next few years. Demand for construction labour resources is driving cost escalation more so than actual material inflation costs. Various sub trades are experiencing labour shortages not seen for many years, with no short term solutions in place.
Competition between contractors is also reducing, as order books are filled, leading to increasing preliminaries & general and margin prices.
A few larger projects are continuing through the design phases at present and are likely to come to the market in early-mid 2017, which will further impact the already hot market conditions. Material selection for projects is becoming critical with some product groups being priced out of the market at present, namely precast concrete, metal windows and steelwork.
80
2
4
6
10
2016
2017
10
-15
-10
-5
0
5
15
10
-15
-10
-5
0
5
15
1
6
RLB EsCALATION fORECAsT (%)
fy 2016 BUILDINg PUT IN PLACE % CHANgE
fy 2016 BUILDINg CONsENTs % CHANgE
mARKET sECTOR ACTIVITy CyCLE(No of Market Sectors within each phase).
BUILDINg wORK PUT IN PLACE ($m)yEAR ENDINg 30 JUNE 2014 2015 2016REsIDENTIAL 662 694 681 TOTAL NON-REs 422 536 604 TOTALwELLINgTON REgION
1,084 1,230 13.5%
1,285 4.4%
BUILDINg CONsENTs ($m)yEAR ENDINg 30 JUNE 2014 2015 2016REsIDENTIAL 603 606 663 RETAIL 36 31 49 OffICEs 190 199 193 INDUsTRIAL 35 33 51 EDUCATION 42 85 154 HEALTH 20 58 27 HOTELs 19 16 8 OTHER 41 33 37 TOTAL NON-REs 381 454 518 TOTAL CONsENTswELLINgTON REgION
984 1,061 7.8%
1,181 11.4%
PEAK PHAsE mID PHAsE TROUgH PHAsE
Refer Page 8 for more details

30
The University of Queensland, Brisbane
Client: University of Queensland
Architect: Cox Architecture

Rider Levett Bucknall | Oceania Report – First Quarter 2017
31
OFFices arOundTHE WORLD
aFricaBOTswANAGaborone
mAURITIUsSaint Pierre
mOZAmBIQUEMaputo
sOUTH AfRICACape TownJohannesburgPretoria
asiaNORTH AsIABeijingChengduChongqingDalianGuangzhouGuiyangHaikouHangzhouHong KongJejuMacauNanjingNanningQingdaoSeoulShanghaiShenyangShenzhenTianjinWuhanWuxiXiamenXianZhuhai
sOUTH AsIABacolodBoholCagayan de OroCebuDavaoHo Chi Minh CityIloiloJakartaKuala LumpurLagunaMetro ManilaSingaporeYangon
aMericasCARIBBEANBarbadosCayman IslandsSt. Lucia
NORTH AmERICAAustinBostonCalgaryChicagoDenverGuamHiloHonoluluLas VegasLos AngelesMauiNew YorkOrlandoPhoenixPortlandSan FranciscoSeattleTorontoTucsonWaikoloaWashington DC
eurOPeUNITED KINgDOmBirminghamBristolCumbriaLeedsLondonManchesterSheffieldThames ValleyWarrington/BirchwoodWelwyn Garden City
RLB | EURO ALLIANCEAustriaBelgiumCzech RepublicFinlandGermanyHungaryIrelandItalyLuxemburgNetherlandsNorwayPolandPortugalRussiaSpainSwedenTurkey
MiddLe eastOmANMuscat
QATARDoha
sAUDI ARABIARiyadh
UNITED ARAB EmIRATEsAbu DhabiDubai
OceaniaAUsTRALIAAdelaideBrisbaneCairnsCanberraCoffs HarbourDarwinGold CoastMelbourneNewcastlePerthSunshine CoastSydneyTownsville
NEw ZEALANDAucklandChristchurchHamiltonPalmerston NorthQueenstownTaurangaWellington

32
RLB.com