Occurrence of Chlorothalonil, Its Transformation Products, and … · · 2008-04-17Occurrence of...
15
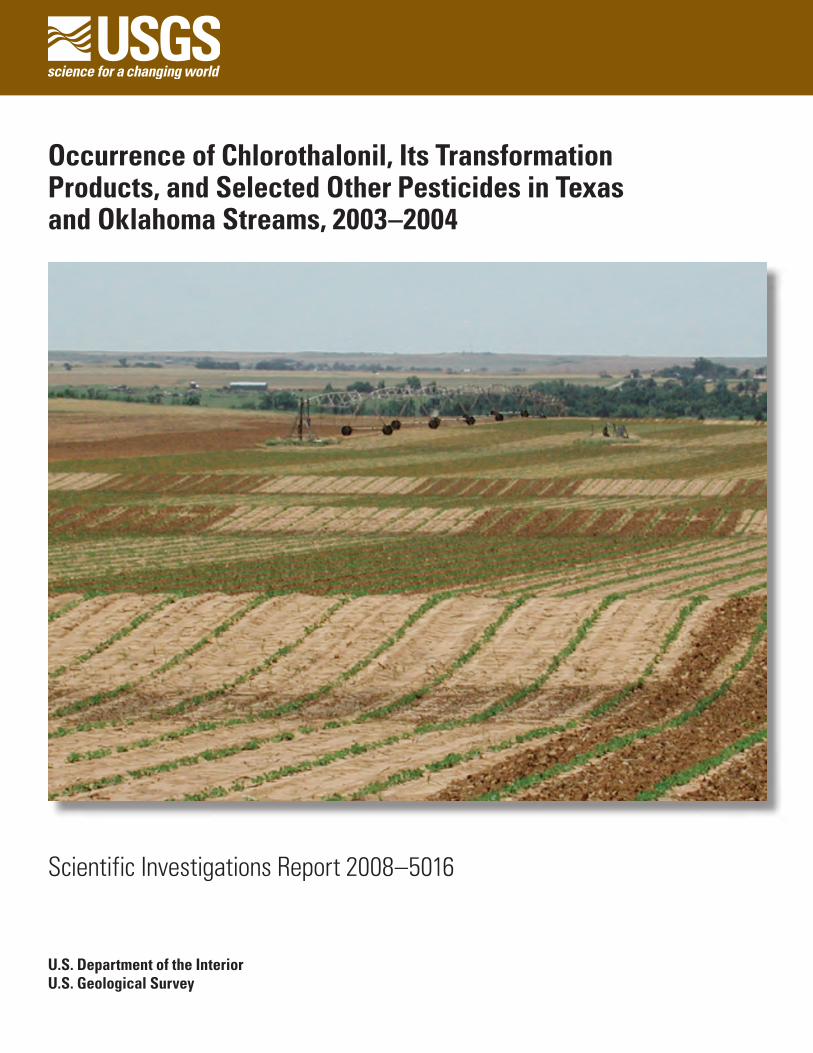
U.S. Department of the Interior U.S. Geological Survey Scientific Investigations Report 2008–5016 Occurrence of Chlorothalonil, Its Transformation Products, and Selected Other Pesticides in Texas and Oklahoma Streams, 2003–2004
Transcript of Occurrence of Chlorothalonil, Its Transformation Products, and … · · 2008-04-17Occurrence of...
U.S. Department of the InteriorU.S. Geological Survey
Scientific Investigations Report 2008–5016
Occurrence of Chlorothalonil, Its Transformation Products, and Selected Other Pesticides in Texas and Oklahoma Streams, 2003–2004

Occurrence of Chlorothalonil, Its Transformation Products, and Selected Other Pesticides in Texas and Oklahoma Streams, 2003–2004
By William A. Battaglin, Kathryn Kuivila, Kim Winton, and Michael Meyer
Scientific Investigations Report 2008–5016
U.S. Department of the InteriorU.S. Geological Survey
U.S. Department of the InteriorDIRK KEMPTHORNE, Secretary
U.S. Geological SurveyMark D. Myers, Director
U.S. Geological Survey, Reston, Virginia: 2008
About USGS Products For product and ordering information: World Wide Web: http://www.usgs.gov/pubprod Telephone: 1-888-ASK-USGS
For more information on the USGS—the Federal source for science about the Earth, its natural and living resources, natural hazards, and the environment: World Wide Web: http://www.usgs.gov Telephone: 1-888-ASK-USGS
Any use of trade, product, or firm names is for descriptive purposes only and does not imply endorsement by the U.S. Government.
Although this report is in the public domain, permission must be secured from the individual copyright owners to reproduce any copyrighted materials contained within this report.
Suggested citation:
Battaglin, W.A., Kuivila, K., Winton, K., and Meyer, M., 2008, Occurrence of chlorothalonil, its transforma-tion products, and selected other pesticides in Texas and Oklahoma streams, 2003–2004: U.S. Geological Survey Scientific Investigations Report 2008–5016, 9 p.
About this Product For more information concerning this publication, contact: William Battaglin, Research Hydrologist Box 25046 Denver Federal Center MS 415 Denver, CO 80225-0046 (303) 236-4882
Or visit the Research on Pesticides in the Environment Web site at: http://co.water.usgs.gov/midconherb/
This publication is available online at: http://pubs.usgs.gov/sir/2008/5016/
Publishing support provided by: Denver Publishing Service Center, Denver, Colorado Manuscript approved for publication, September 2007 Edited by Mary A. Kidd Layout by Sharon Powers
iii
Contents
Abstract ..........................................................................................................................................................1Introduction.....................................................................................................................................................1
Chlorothalonil Use and Toxicity ..........................................................................................................1Sampling Sites and Sample Collection .............................................................................................2Analytical Methods...............................................................................................................................5
Occurrence of Chlorothalonil, Its Transformation Products, and Selected Other Pesticides ..........5Summary..........................................................................................................................................................8Acknowledgments .........................................................................................................................................8References Cited............................................................................................................................................8
Figures 1. Sampling-site locations, drainage basins, and acres of peanuts harvested, 2002 ...........3 2. Sampling-site locations, drainage basins, and estimated annual chlorothalonil
use, circa 2002 ...............................................................................................................................4
Tables 1. Sampling-site names, site ids, drainage areas, acres of harvested peanuts
(2002), and estimated chlorothalonil application (circa 2002) ...............................................5 2. Range of measured pesticide concentrations in micrograms per liter, by
site, for stream samples collected in Texas and Oklahoma in 2003 and 2004 ....................7
iv
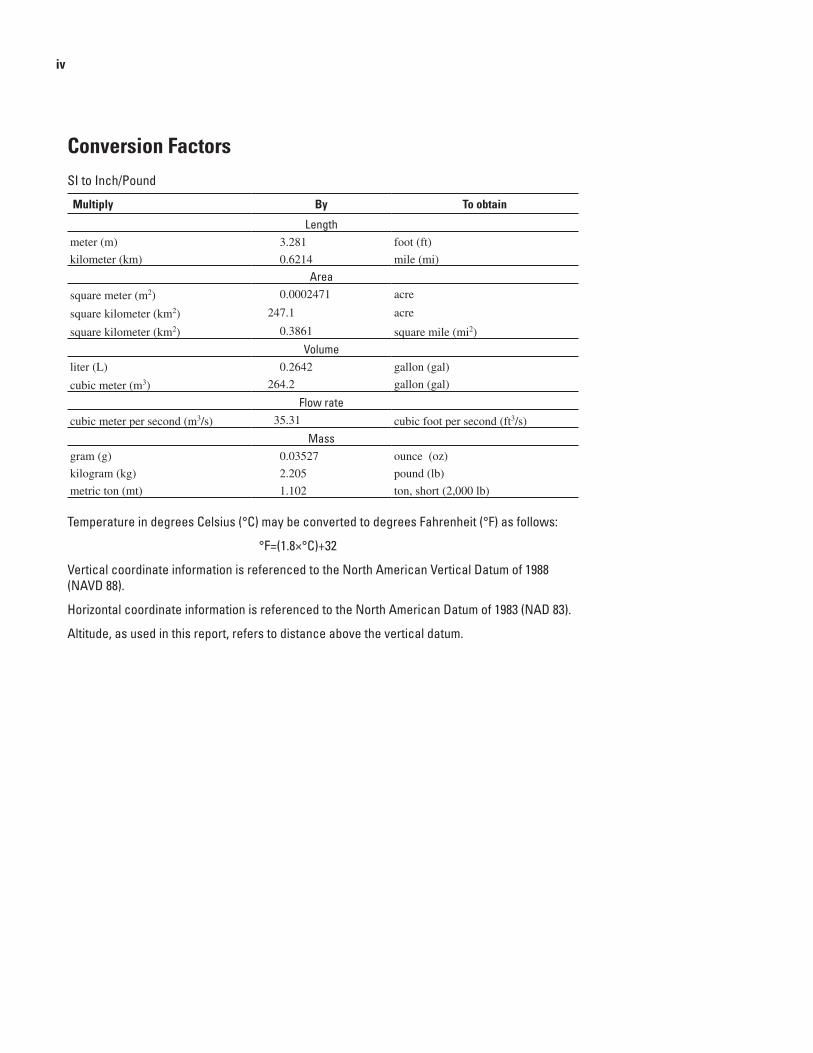
Conversion FactorsSI to Inch/Pound
Multiply By To obtain
Lengthmeter (m) 3.281 foot (ft)
kilometer (km) 0.6214 mile (mi)
Areasquare meter (m2) 0.0002471 acre
square kilometer (km2) 247.1 acre
square kilometer (km2) 0.3861 square mile (mi2)
Volumeliter (L) 0.2642 gallon (gal)
cubic meter (m3) 264.2 gallon (gal)
Flow ratecubic meter per second (m3/s) 35.31 cubic foot per second (ft3/s)
Massgram (g) 0.03527 ounce (oz)
kilogram (kg) 2.205 pound (lb)
metric ton (mt) 1.102 ton, short (2,000 lb)
Temperature in degrees Celsius (°C) may be converted to degrees Fahrenheit (°F) as follows:
°F=(1.8×°C)+32
Vertical coordinate information is referenced to the North American Vertical Datum of 1988 (NAVD 88).
Horizontal coordinate information is referenced to the North American Datum of 1983 (NAD 83).
Altitude, as used in this report, refers to distance above the vertical datum.
Abstract The primary purpose of the study described in this report
was to determine if the fungicide chlorothalonil (2,4,5,6-tetra-chloroisophthalonitrile), three of its transformation products, or selected other pesticides are transported to surface water after use on peanuts or other crops in Texas and Oklahoma. The results summarized here are part of a larger study that includes data from sites in Alabama, Florida, and Georgia. Chlorothalonil is classified as a probable carcinogen, and the 4-hydroxy of chlorothalonil transformation product is more soluble, more stable, and, for some species, more toxic than its parent compound. In 2003, water samples were collected from three surface-water sites in Texas and two surface-water sites in Oklahoma; in 2004, samples were collected from the two Oklahoma sites. Chlorothalonil was not detected in any of the 20 samples analyzed. The 4-hydroxy of chlorothalonil trans-formation product was detected in three samples collected in 2004, with a maximum concentration of 0.018 microgram per liter (µg/L); the other two transformation products (diamide chlorothalonil and 1-amide-4-hydroxy chlorothalonil) were not detected in any sample. In addition, 19 samples were analyzed for as many as 109 other pesticides and transforma-tion products. Atrazine was detected in 13 samples and had a maximum concentration of 0.122 µg/L. Deethylatrazine was detected in 10 samples and had a maximum concentration of 0.04 µg/L. Metolachlor was detected in eight samples and had a maximum concentration of 0.019 µg/L. Fifteen other pesti-cides or pesticide transformation products also were detected. In general, concentrations of pesticides were less than concen-trations that are commonly observed in Midwestern streams. The results indicate that the use of chlorothalonil on peanut crops has not resulted in substantial contamination of the stud-ied streams in Texas and Oklahoma.
IntroductionIn 2003 and 2004, the U.S. Geological Survey (USGS)
conducted a study to determine if the fungicide chlorothalonil
(2,4,5,6-tetrachloroisophthalonitrile) or three of its transfor-mation products are transported to surface water after use on peanuts or other crops in five southern States (Scribner and others, 2006). Chlorothalonil has a wide variety of beneficial uses, including agricultural, home and garden, industrial, and vector control of fungi, and it is used extensively for disease control in peanuts, potatoes, turf, and many fruit and vegetable crops.
The purpose of this report is to summarize occurrence of chlorothalonil, its transformation products, and selected other pesticides in four Texas and Oklahoma streams. Three pairs of samples are used to compare nonstorm and storm-event pesticide flux. Data used in this report are available in Scribner and others (2006). Peanuts are the primary crop treated with chlorothalonil in Texas and Oklahoma, but it is also applied to onions, melons, cabbage, and other crops (National Agricul-tural Statistics Service, 2007).
Soybean rust is a devastating plant disease caused by fungal pathogens. Soybean rust was detected for the first time in the United States in November 2004, in Louisiana. In 2007, soybean rust was confirmed on soybean crops in 24 counties in Texas and 8 in Oklahoma (U.S. Department of Agriculture, 2007a). The use of fungicides on soybeans is expected to increase in areas where soybean rust spreads during the grow-ing season, and chlorothalonil is one of only a few fungicides registered for use as a treatment of soybean rust. Hence, selected results from this study will provide a baseline of water-quality information collected prior to the use of fungi-cides to control soybean rust.
Chlorothalonil Use and Toxicity
Chlorothalonil is a broad spectrum, nonsystemic fungi-cide used to prevent foliar diseases on vegetable, field, and ornamental crops (Meisterpro, 2007). Chlorothalonil is used in agricultural, home and garden, and industrial settings, primar-ily on peanuts, potatoes, fruit, and turf. Chlorothalonil was first registered for use on food crops in the United States in 1970 and is historically one of the most heavily used fungi-cides with U.S. applications estimated at 5,245 metric tons
Occurrence of Chlorothalonil, Its Transformation Products, and Selected Other Pesticides in Texas and Oklahoma Streams, 2003–2004
By William A. Battaglin, Kathryn Kuivila, Kim Winton, and Michael Meyer
2 Occurrence of Chlorothalonil, Its Transformation Products, and Other Pesticides in Texas and Oklahoma Streams
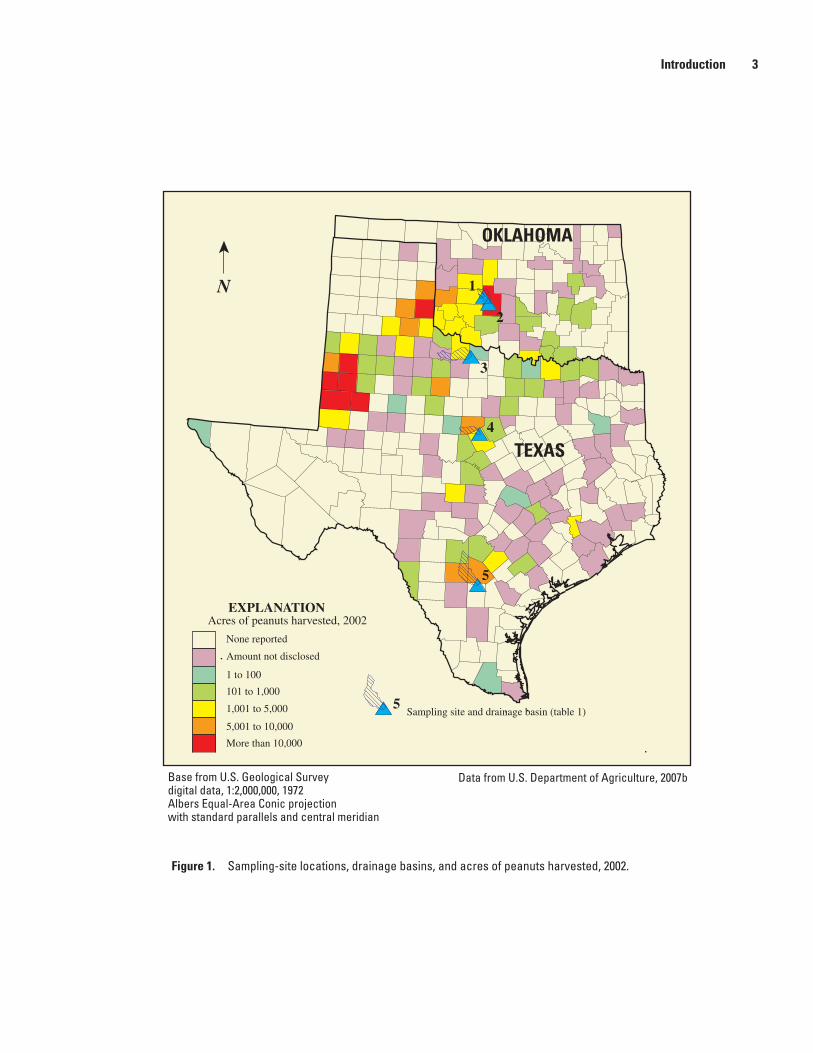
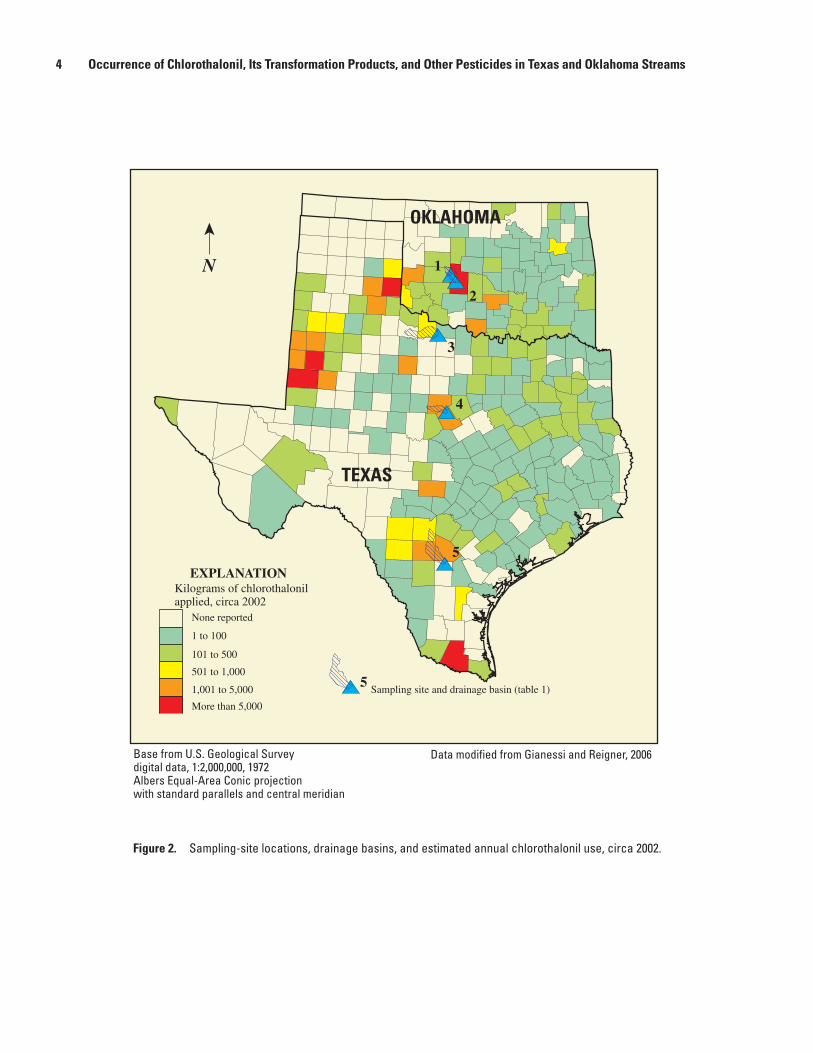
per year (mt/yr) in 1992, 5,404 mt/yr in 1997, and 3,936 mt/yr in 2002 (Gianessi and Reigner, 2006). In 2002, the esti-mated use of chlorothalonil on peanuts in Texas was 50.0 mt, and the total use on all agricultural products was 85.4 mt. In Oklahoma the estimated use of chlorothalonil on peanuts was 10.3 mt, whereas the total use on all agricultural products was 18.8 mt (Gianessi and Reigner, 2006). Acres of harvested peanuts in 2002 (U.S. Department of Agriculture, 2007b) and the estimated annual application of chlorothalonil circa 2002 (Gianessi and Reigner, 2006) are shown in figures 1 and 2.
Chlorothalonil has the potential to contaminate water bodies adjacent to its point of use by spray drift, runoff, or sed-iment transport. Chlorothalonil previously has been detected in surface water (Scott and others, 2002; Wauchope and others, 2004), rainfall (Sakai, 2002), and air samples (McConnell and others, 1998) generally adjacent to agricultural areas where it was applied. The U.S. Environmental Protection Agency classifies chlorothalonil as a probable carcinogen with very high toxicity to fish and aquatic invertebrates (U.S. Environ-mental Protection Agency, 1999) but low toxicity to birds and mammals. Chlorothalonil has three primary transformation products (TPs): 4-hydroxy chlorothalonil, diamide chlorotha-lonil, and 1-amide-4-hydroxy chlorothalonil. Chlorothalonil is resistant to degradation by hydrolysis, volatilization, and microbial activity but may adsorb to sediments. Chlorothalonil
TPs may be more persistent and mobile than chlorothalonil. The 4-hydroxy chlorothalonil TP is more toxic to birds but less toxic to fish and aquatic invertebrates than chlorothalonil (U.S. Environmental Protection Agency, 1999).
Sampling Sites and Sample Collection
Sampling sites (fig. 1, table 1) were selected on the basis of estimates of harvested peanut acreage (fig. 1), chlorotha-lonil use (fig. 2), watershed area, availability of streamflow data, and personnel safety. The five sites sampled on four streams in Texas and Oklahoma were part of a larger study by the USGS that included sites in Alabama, Georgia, and Florida (Scribner and others, 2006).
In general, samples were collected after the application of chlorothalonil on local peanut crops. Peanuts crops may be treated with chlorothalonil several times during the growing season. In several cases, samples were collected during or just after rainfall of sufficient intensity to produce runoff and a large increase in streamflow. Samples were collected using standardized protocols (Wilde and others, 1999) by wading or from bridges using the equal-width-increment method (Shelton, 1994). A complete description of sample-collection and quality-assurance protocols used for this study is provided in Scribner and others (2006). Site 1 was sampled three times
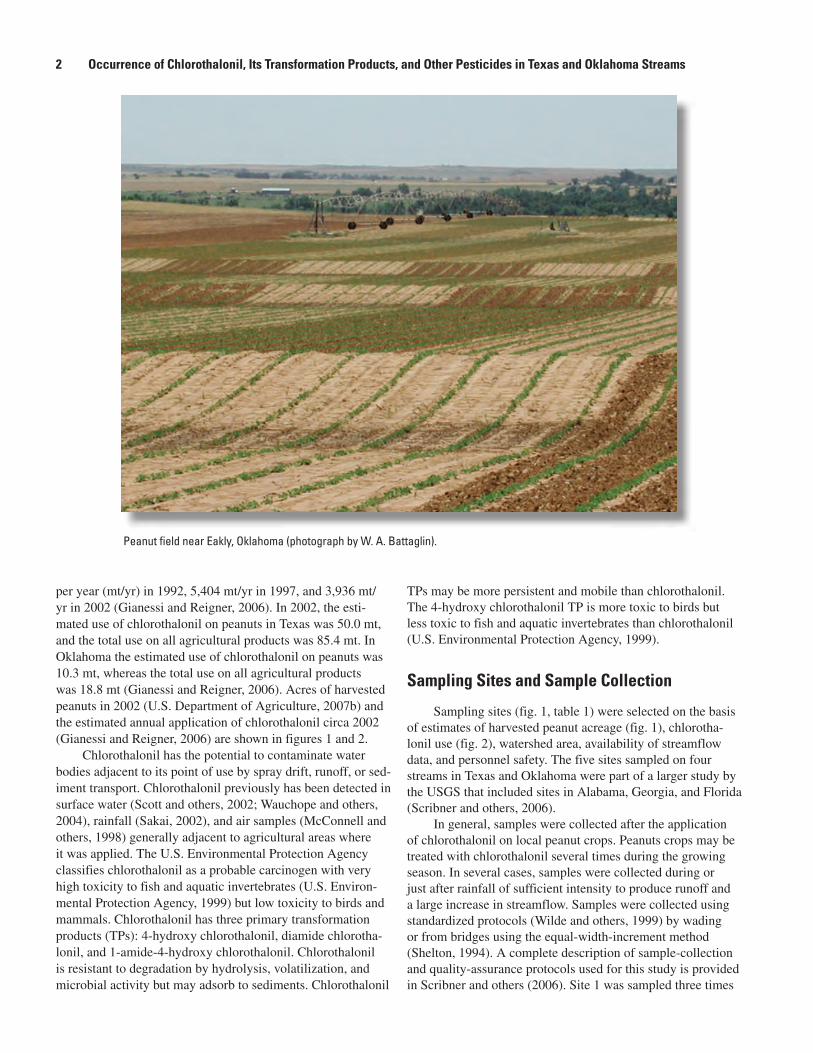
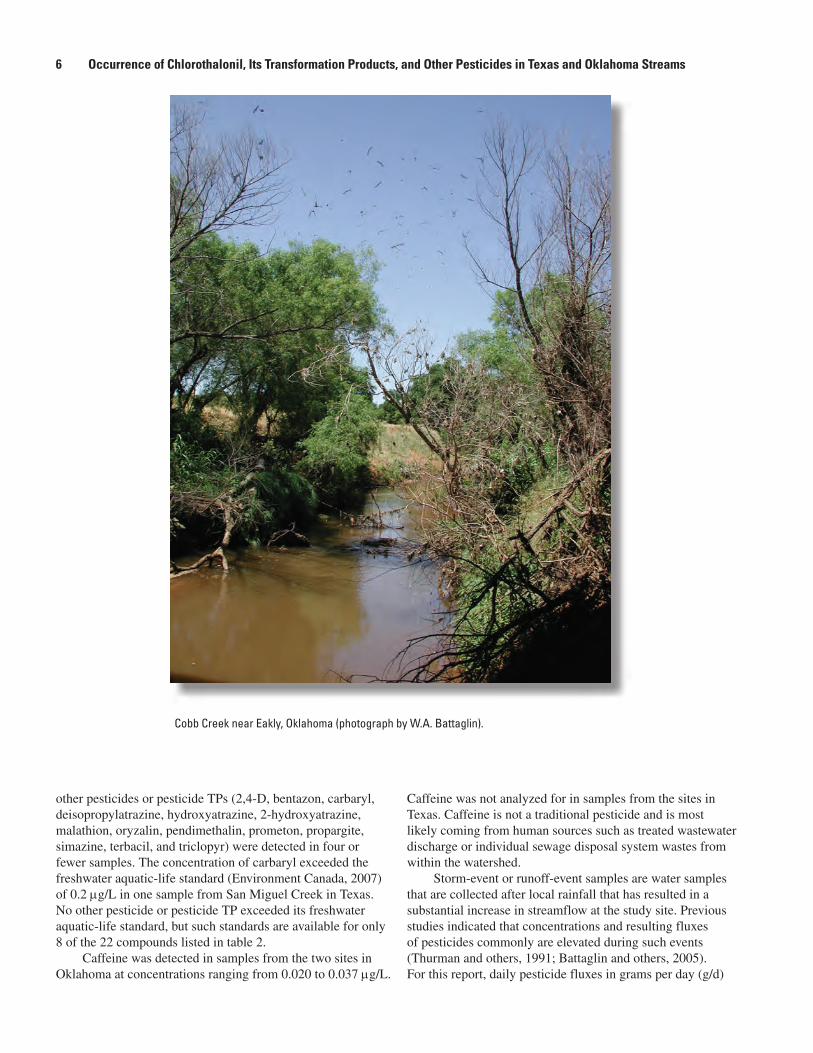
Peanut field near Eakly, Oklahoma (photograph by W. A. Battaglin).
Introduction 3
1
2
3
4
5
5
N
OKLAHOMA
TEXAS
EXPLANATIONAcres of peanuts harvested, 2002
None reported
Amount not disclosed
1 to 100
101 to 1,000
1,001 to 5,000
5,001 to 10,000
More than 10,000
Sampling site and drainage basin (table 1)
Data from U.S. Department of Agriculture, 2007bBase from U.S. Geological Surveydigital data, 1:2,000,000, 1972Albers Equal-Area Conic projectionwith standard parallels and central meridian
Figure 1. Sampling-site locations, drainage basins, and acres of peanuts harvested, 2002.
4 Occurrence of Chlorothalonil, Its Transformation Products, and Other Pesticides in Texas and Oklahoma Streams
1
2
3
4
5
5
N
OKLAHOMA
TEXAS
EXPLANATIONKilograms of chlorothalonilapplied, circa 2002
None reported
1 to 100
101 to 500
501 to 1,000
1,001 to 5,000
More than 5,000
Sampling site and drainage basin (table 1)
Data modified from Gianessi and Reigner, 2006Base from U.S. Geological Surveydigital data, 1:2,000,000, 1972Albers Equal-Area Conic projectionwith standard parallels and central meridian
Figure 2. Sampling-site locations, drainage basins, and estimated annual chlorothalonil use, circa 2002.
Occurrence of Chlorothalonil, Its Transformation Products, and Selected Other Pesticides 5
in 2003 and three times in 2004. Site 2 was sampled two times in 2003 and three times in 2004. Sites 3, 4, and 5 were each sampled three times in 2003 but were not sampled in 2004. Daily mean streamflow values used for the calculation of pesticide fluxes are from the USGS National Water Information System (NWIS) (2008).
A geographic information system (GIS) was used to manage the county-level information on crops and pesticide use for this study. The total use of chlorothalonil on all crops by county was calculated from data provided in Gianessi and Reigner (2006). An area-weighted sum algorithm programmed in the GIS (Battaglin and Goolsby, 1998) was used to estimate the amounts of pesticides used or areas of crops harvested within drainage basins associated with the sampling sites (table 1). The algorithm accounts for cases where an entire county is within a single drainage basin and where only a por-tion of a county is within a drainage basin.
Analytical Methods
Twenty samples were analyzed for chlorothalonil, three chlorothalonil TPs. Nineteen of those samples also were ana-lyzed for as many as 109 other pesticides or pesticide TPs. The exception was the July 14, 2003, sample from site 3, which only was analyzed for chlorothalonil and its three TPs. Chlo-rothalonil and its TPs were analyzed at the USGS Organic Geochemistry Research Laboratory in Lawrence, Kansas. The method utilizes solid-phase extraction, liquid chromatography/mass spectrometry, and atmospheric pressure chemical ioniza-tion or electrospray ionization (Scribner and others, 2006). The other 109 pesticides and TPs were analyzed at the USGS National Water Quality Laboratory in Denver, Colorado, using methods described by Zaugg and others (1995), Furlong and others (2001), and Madsen and others (2003).
Quality-assurance (QA) samples collected for this study included field blanks and spikes and field replicates. Results
for QA samples collected at Texas and Oklahoma sites are summarized here. Chlorothalonil and its TPs were not detected in any of the four blank samples, and concentrations in four pairs of field replicate and environmental samples were all less than the laboratory reporting level (0.050 µg/L). Percent recoveries of four field-spike samples ranged from 44 to 76 percent. Scribner and others (2006) provide a complete discussion of QA sample results for this study.
Occurrence of Chlorothalonil, Its Transformation Products, and Selected Other Pesticides
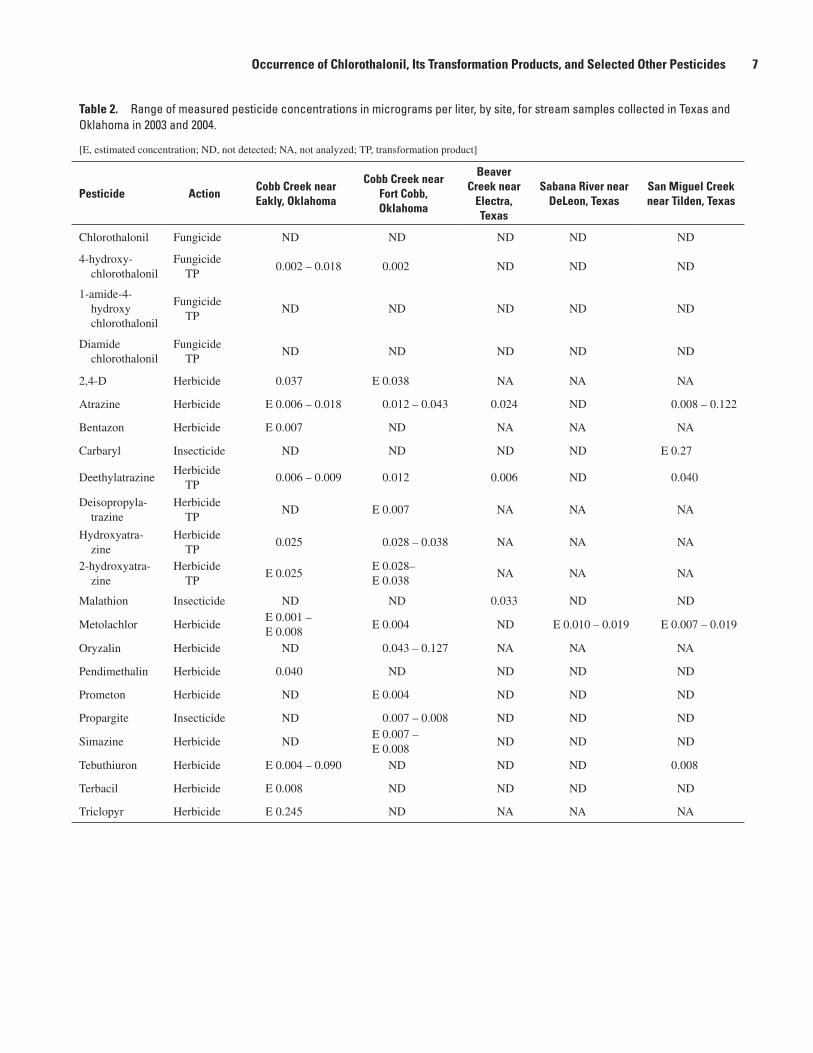
Chlorothalonil, 1-amide-4-hydroxy chlorothalonil, and diamide chlorothalonil were not detected in any of the 20 samples, but 4-hydroxy chlorothalonil was detected at both sites in Oklahoma (table 2). The drainage areas for these two sites include portions of counties with higher levels of chlo-rothalonil use than do the other three sites (fig. 2), and Cobb Creek at Fort Cobb, Oklahoma, has the most acres and the highest percentage of the watershed in peanuts of the five sites (table 1).
Atrazine, deethylatrazine, and metolachlor were each detected at four of the five sites (table 2). Atrazine was detected in 13 of 19 analyzed samples and had a maximum concentration of 0.122 µg/L. Deethylatrazine was detected in 10 of 19 analyzed samples and had a maximum concentration of 0.04 µg/L. Metolachlor was detected in 8 of 19 analyzed samples and had a maximum concentration of 0.019 µg/L. Atrazine is a herbicide used on corn crops; metolachlor is a herbicide used on peanuts, cotton, and corn; and deethylatrazine is an atrazine TP. Tebuthiuron was detected at one site in Oklahoma and one site in Texas. Tebuthiuron is a herbicide used on rangeland and noncropland. Fourteen
Table 1. Sampling-site names, site ids, drainage areas, acres of harvested peanuts (2002), and estimated chlorothalonil application (circa 2002).
[id, identification; km2, square kilometers; %, percent; USGS, U.S. Geological Survey]
Site id (number in figs. 1 and 2)
Site nameDrainage area (km2)
USGS gaging station id number
Acres of harvested peanuts (percentage
of drainage area)
Chlorothalonil applications
(kilograms active ingredient)
Oklahoma
1 Cobb Creek near Eakly, OK 342 07325800 480 (0.57%) 101
2 Cobb Creek near Fort Cobb, OK 795 07326000 4,900 (2.49%) 862
Texas
3 Beaver Creek near Electra, TX 1,689 07312200 1,550 (0.37%) 314
4 Sabana River near DeLeon, TX 684 08099300 1,740 (1.03%) 424
5 San Miguel Creek near Tilden, TX 2,028 08206700 3,640 (0.72%) 967
6 Occurrence of Chlorothalonil, Its Transformation Products, and Other Pesticides in Texas and Oklahoma Streams
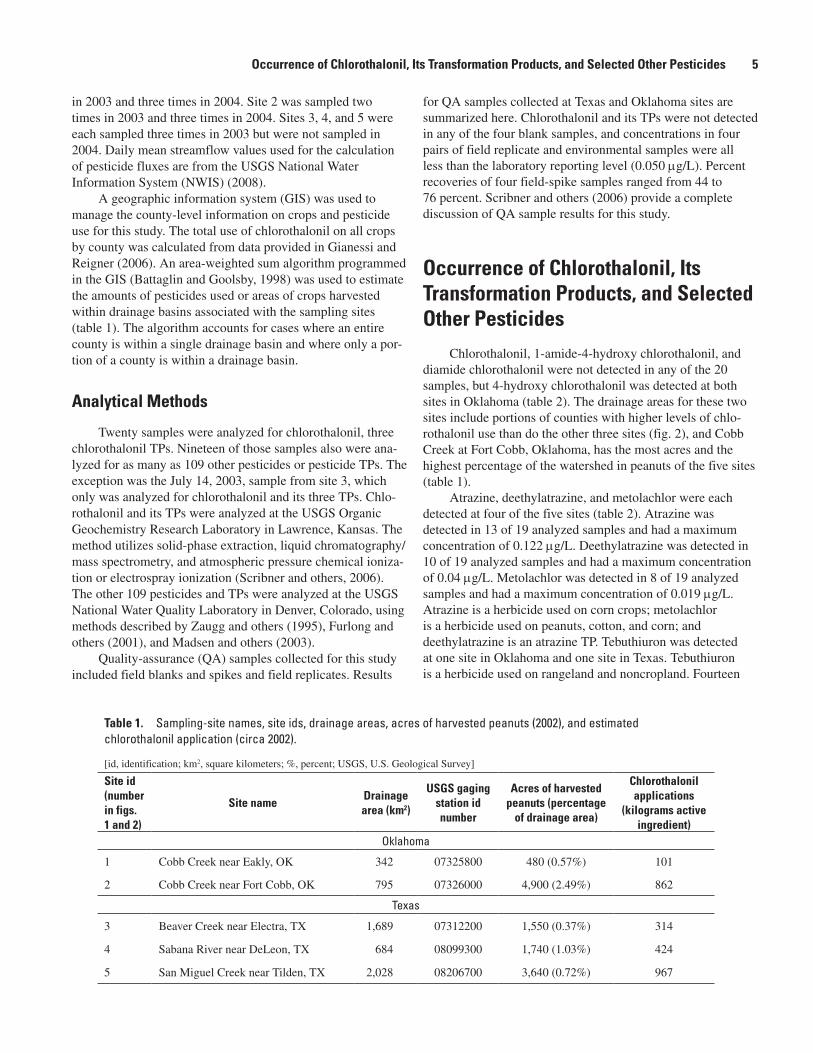
Cobb Creek near Eakly, Oklahoma (photograph by W.A. Battaglin).
other pesticides or pesticide TPs (2,4-D, bentazon, carbaryl, deisopropylatrazine, hydroxyatrazine, 2-hydroxyatrazine, malathion, oryzalin, pendimethalin, prometon, propargite, simazine, terbacil, and triclopyr) were detected in four or fewer samples. The concentration of carbaryl exceeded the freshwater aquatic-life standard (Environment Canada, 2007) of 0.2 µg/L in one sample from San Miguel Creek in Texas. No other pesticide or pesticide TP exceeded its freshwater aquatic-life standard, but such standards are available for only 8 of the 22 compounds listed in table 2.
Caffeine was detected in samples from the two sites in Oklahoma at concentrations ranging from 0.020 to 0.037 µg/L.
Caffeine was not analyzed for in samples from the sites in Texas. Caffeine is not a traditional pesticide and is most likely coming from human sources such as treated wastewater discharge or individual sewage disposal system wastes from within the watershed.
Storm-event or runoff-event samples are water samples that are collected after local rainfall that has resulted in a substantial increase in streamflow at the study site. Previous studies indicated that concentrations and resulting fluxes of pesticides commonly are elevated during such events (Thurman and others, 1991; Battaglin and others, 2005). For this report, daily pesticide fluxes in grams per day (g/d)
Occurrence of Chlorothalonil, Its Transformation Products, and Selected Other Pesticides 7
Table 2. Range of measured pesticide concentrations in micrograms per liter, by site, for stream samples collected in Texas and Oklahoma in 2003 and 2004.
[E, estimated concentration; ND, not detected; NA, not analyzed; TP, transformation product]
Pesticide ActionCobb Creek near Eakly, Oklahoma
Cobb Creek near Fort Cobb, Oklahoma
Beaver Creek near
Electra, Texas
Sabana River near DeLeon, Texas
San Miguel Creek near Tilden, Texas
Chlorothalonil Fungicide ND ND ND ND ND
4-hydroxy- chlorothalonil
Fungicide TP
0.002 – 0.018 0.002 ND ND ND
1-amide-4- hydroxy chlorothalonil
Fungicide TP
ND ND ND ND ND
Diamide chlorothalonil
Fungicide TP
ND ND ND ND ND
2,4-D Herbicide 0.037 E 0.038 NA NA NA
Atrazine Herbicide E 0.006 – 0.018 0.012 – 0.043 0.024 ND 0.008 – 0.122
Bentazon Herbicide E 0.007 ND NA NA NA
Carbaryl Insecticide ND ND ND ND E 0.27
DeethylatrazineHerbicide
TP0.006 – 0.009 0.012 0.006 ND 0.040
Deisopropyla-trazine
Herbicide TP
ND E 0.007 NA NA NA
Hydroxyatra-zine
Herbicide TP
0.025 0.028 – 0.038 NA NA NA
2-hydroxyatra-zine
Herbicide TP
E 0.025E 0.028– E 0.038
NA NA NA
Malathion Insecticide ND ND 0.033 ND ND
Metolachlor HerbicideE 0.001 – E 0.008
E 0.004 ND E 0.010 – 0.019 E 0.007 – 0.019
Oryzalin Herbicide ND 0.043 – 0.127 NA NA NA
Pendimethalin Herbicide 0.040 ND ND ND ND
Prometon Herbicide ND E 0.004 ND ND ND
Propargite Insecticide ND 0.007 – 0.008 ND ND ND
Simazine Herbicide NDE 0.007 – E 0.008
ND ND ND
Tebuthiuron Herbicide E 0.004 – 0.090 ND ND ND 0.008
Terbacil Herbicide E 0.008 ND ND ND ND
Triclopyr Herbicide E 0.245 ND NA NA NA
8 Occurrence of Chlorothalonil, Its Transformation Products, and Other Pesticides in Texas and Oklahoma Streams
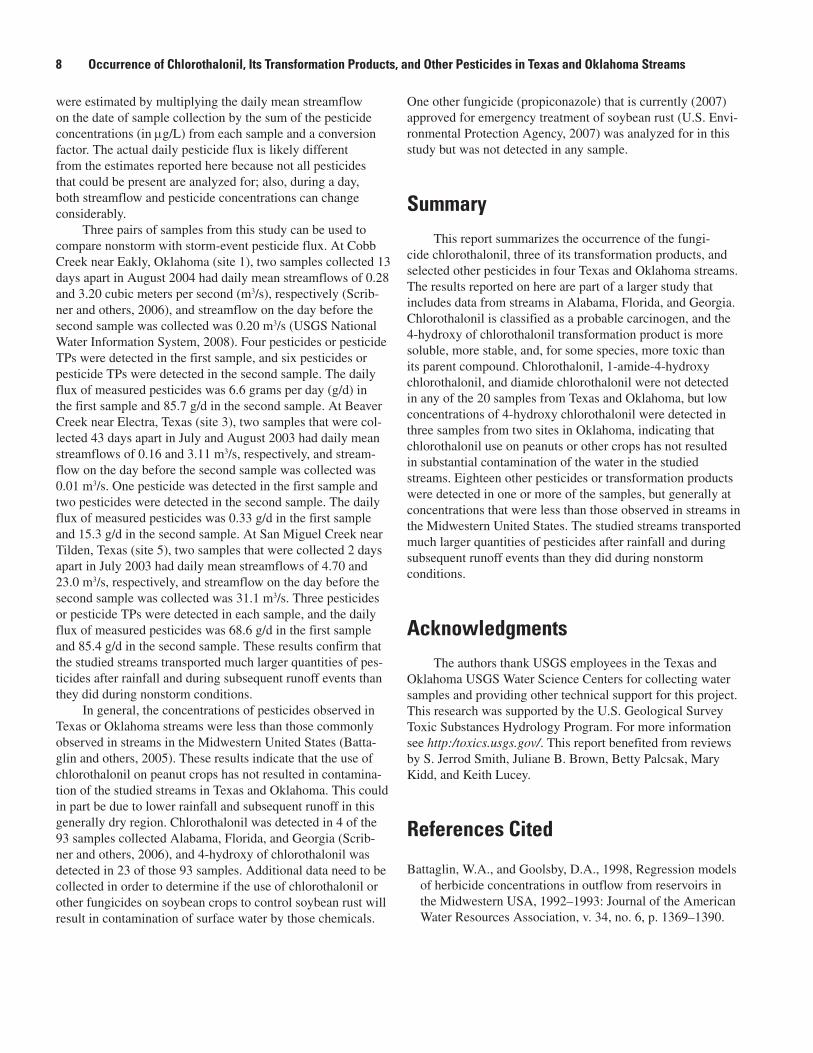
were estimated by multiplying the daily mean streamflow on the date of sample collection by the sum of the pesticide concentrations (in µg/L) from each sample and a conversion factor. The actual daily pesticide flux is likely different from the estimates reported here because not all pesticides that could be present are analyzed for; also, during a day, both streamflow and pesticide concentrations can change considerably.
Three pairs of samples from this study can be used to compare nonstorm with storm-event pesticide flux. At Cobb Creek near Eakly, Oklahoma (site 1), two samples collected 13 days apart in August 2004 had daily mean streamflows of 0.28 and 3.20 cubic meters per second (m3/s), respectively (Scrib-ner and others, 2006), and streamflow on the day before the second sample was collected was 0.20 m3/s (USGS National Water Information System, 2008). Four pesticides or pesticide TPs were detected in the first sample, and six pesticides or pesticide TPs were detected in the second sample. The daily flux of measured pesticides was 6.6 grams per day (g/d) in the first sample and 85.7 g/d in the second sample. At Beaver Creek near Electra, Texas (site 3), two samples that were col-lected 43 days apart in July and August 2003 had daily mean streamflows of 0.16 and 3.11 m3/s, respectively, and stream-flow on the day before the second sample was collected was 0.01 m3/s. One pesticide was detected in the first sample and two pesticides were detected in the second sample. The daily flux of measured pesticides was 0.33 g/d in the first sample and 15.3 g/d in the second sample. At San Miguel Creek near Tilden, Texas (site 5), two samples that were collected 2 days apart in July 2003 had daily mean streamflows of 4.70 and 23.0 m3/s, respectively, and streamflow on the day before the second sample was collected was 31.1 m3/s. Three pesticides or pesticide TPs were detected in each sample, and the daily flux of measured pesticides was 68.6 g/d in the first sample and 85.4 g/d in the second sample. These results confirm that the studied streams transported much larger quantities of pes-ticides after rainfall and during subsequent runoff events than they did during nonstorm conditions.
In general, the concentrations of pesticides observed in Texas or Oklahoma streams were less than those commonly observed in streams in the Midwestern United States (Batta-glin and others, 2005). These results indicate that the use of chlorothalonil on peanut crops has not resulted in contamina-tion of the studied streams in Texas and Oklahoma. This could in part be due to lower rainfall and subsequent runoff in this generally dry region. Chlorothalonil was detected in 4 of the 93 samples collected Alabama, Florida, and Georgia (Scrib-ner and others, 2006), and 4-hydroxy of chlorothalonil was detected in 23 of those 93 samples. Additional data need to be collected in order to determine if the use of chlorothalonil or other fungicides on soybean crops to control soybean rust will result in contamination of surface water by those chemicals.
One other fungicide (propiconazole) that is currently (2007) approved for emergency treatment of soybean rust (U.S. Envi-ronmental Protection Agency, 2007) was analyzed for in this study but was not detected in any sample.
SummaryThis report summarizes the occurrence of the fungi-
cide chlorothalonil, three of its transformation products, and selected other pesticides in four Texas and Oklahoma streams. The results reported on here are part of a larger study that includes data from streams in Alabama, Florida, and Georgia. Chlorothalonil is classified as a probable carcinogen, and the 4-hydroxy of chlorothalonil transformation product is more soluble, more stable, and, for some species, more toxic than its parent compound. Chlorothalonil, 1-amide-4-hydroxy chlorothalonil, and diamide chlorothalonil were not detected in any of the 20 samples from Texas and Oklahoma, but low concentrations of 4-hydroxy chlorothalonil were detected in three samples from two sites in Oklahoma, indicating that chlorothalonil use on peanuts or other crops has not resulted in substantial contamination of the water in the studied streams. Eighteen other pesticides or transformation products were detected in one or more of the samples, but generally at concentrations that were less than those observed in streams in the Midwestern United States. The studied streams transported much larger quantities of pesticides after rainfall and during subsequent runoff events than they did during nonstorm conditions.
AcknowledgmentsThe authors thank USGS employees in the Texas and
Oklahoma USGS Water Science Centers for collecting water samples and providing other technical support for this project. This research was supported by the U.S. Geological Survey Toxic Substances Hydrology Program. For more information see http:/toxics.usgs.gov/. This report benefited from reviews by S. Jerrod Smith, Juliane B. Brown, Betty Palcsak, Mary Kidd, and Keith Lucey.
References Cited
Battaglin, W.A., and Goolsby, D.A., 1998, Regression models of herbicide concentrations in outflow from reservoirs in the Midwestern USA, 1992–1993: Journal of the American Water Resources Association, v. 34, no. 6, p. 1369–1390.
References Cited 9
Battaglin, W.A., Kolpin, D.W., Scribner, E.A., Kuivila, K.M., and Sandstrom, M.W., 2005, Glyphosate, other herbicides, and transformation products in midwestern streams, 2002: Journal of the American Water Resources Association, v. 41, no. 2, p. 323–332.
Environment Canada, 2007, Canadian water quality guide-lines for the protection of aquatic life, 2007 update: accessed 02/2007 at http://www.ccme.ca/assets/pdf/ag/_summary_7.1_en.pdf
Furlong, E.T., Anderson, B., Werner, S., Soliven, P., Coffey, L., and Burkardt, M., 2001, Methods of analysis by the U.S. Geological Survey National Water Quality Labora-tory—Determination of pesticides in water by graphitized carbon-based solid-phase extraction and high-performance liquid chromatography/mass spectrometry: U.S. Geological Survey Water-Resources Investigations Report 2001–4134, 73 p.
Gianessi, L., and Reigner, N., 2006, Pesticide use in U.S. crop production 2002—With comparison to 1992 & 1997: Washington, D.C., CropLife Foundation, accessed 09/2007 at http://www.croplifefoundation.org/cpri_npud2002.htm
Madsen, J.E., Sandstrom, M., and Zaugg, S., 2003, Methods of analysis by the U.S. Geological Survey National Water Quality Laboratory—A method supplement for the determi-nation of fipronil and degradates in water by gas chromatog-raphy/mass spectrometry: U.S. Geological Survey Open-File Report 2002–462, 11 p.
McConnell, L.L., LeNoir, J., Datta, S., and Seiber, J., 1998, Wet deposition of current-use pesticides in the Sierra Nevada mountain range, California, USA: Environmental Toxicology and Chemistry, v. 17, no. 10, p. 1908–1916.
Meisterpro, 2007, Crop protection handbook 2007: Wil-loughby, Ohio, Meister Media Worldwide, not paginated.
National Agricultural Statistics Service, 2007, Agricultural chemical use database: accessed 09/2007 at http://www.pestmanagement.info/nass/ .
Sakai, Manabu, 2002, Determination of pesticides and chronic test with daphnia magna for rainwater samples: Journal of Environmental Science and Health, v. B37, no. 3, p. 247–254.
Scott, G.I., Fulton, M., Wirth, E., Chandler, G., Key, P., Daug-homah, J., Bearden, D., Chung, K., Strozier, E., DeLorenzo, M., Sivertsen, S., Dias, A., Sander, M., Macauley, J., Good-man, L., LaCroix, M., Thayer, G., and Kucklick, J., 2002, Toxicological studies in tropical ecosystems—An eco-toxicological risk assessment of pesticide runoff in South Florida estuarine ecosystems: Journal of Agricultural and Food Chemistry, v. 50, p. 4400–4408.
Scribner, E.A., Orlando, J., Battaglin, W., Sandstrom, M., Kuivila, K., and Meyer, M., 2006, Results of analyses of the fungicide chlorothalonil, its degradation products, and other selected pesticides at 22 surface-water sites in five south-ern States, 2003–2004: U.S. Geological Survey Open-File Report 2006–1207, 59 p.
Shelton, L.R., 1994, Field guide for collection and process-ing stream-water samples for the National Water-Quality Assessment Program: U.S. Geological Survey Open-File Report 94–455, 50 p.
Thurman, E.M., Goolsby, D.A., Meyer, M.T., and Kolpin, D.W., 1991, Herbicides in surface waters of the Midwestern United States—The effect of spring flush: Environmental Science and Technology, v. 25, p. 1794–1796.
U.S. Department of Agriculture, 2007a, United States soybean rust commentary (dated 9/21/2007): accessed 09/2007 at http://www.sbrusa.net/ .
U.S. Department of Agriculture, 2007b, 2002 Census of Agri-culture: Available at http://www.agcensus.usda.gov/ .
U.S. Environmental Protection Agency, 1999, U.S. EPA Office of Prevention, Pesticides, and Toxic Substances Reregistra-tion eligibility decision (RED) for chlorothalonil: Available at http://www.epa.gov/oppsrrd1/REDs/0097red.pdf
U.S. Environmental Protection Agency, 2007, Chemicals reg-istered for the treatment of soybean rust: accessed 11/2007 at http://www.epa.gov/oppfead1/cb/csb_page/updates/soybean_rust.htm
USGS National Water Information System, 2008, USGS surface-water data for the Nation: available at: http://waterdata.usgs.gov/nwis/sw
Wauchope, R.D., Johnson, W., and Sumner, H., 2004, Foliar and soil deposition of pesticide sprays in peanuts and their washoff and runoff under simulated worst-case rainfall conditions: Journal of Agricultural and Food Chemistry, v. 52, no. 23, p. 7056–7063.
Wilde, F.D., Radke, D., Gibs, J., and Iwatsubo, R., eds., 1999, National field manual for the collection of water quality data: U.S. Geological Survey Techniques of Water-Resources Investigations, book 9, chap. A2–A5.
Zaugg, S.D., Sandstrom, M., Smith, S., and Fehlberg, K., 1995, Methods of analysis by the U.S. Geological Survey National Water Quality Laboratory—Determination of pes-ticides in water by C-18 solid-phase extraction and capil-lary-column gas chromatography/mass spectrometry with selected-ion monitoring: U.S. Geological Survey Open-File Report 95–181, 60 p.