OCCIDENTAL PETROLEUM CORPORATION · Cautionary Statement Portions of this presentation contain...
26
OCCIDENTAL PETROLEUM CORPORATION BAML Global Energy Conference November 17, 2016
-
Upload
phungkhanh -
Category
Documents
-
view
218 -
download
0
Transcript of OCCIDENTAL PETROLEUM CORPORATION · Cautionary Statement Portions of this presentation contain...

OCCIDENTAL PETROLEUM CORPORATION
BAML Global Energy ConferenceNovember 17, 2016

Cautionary Statement
Portions of this presentation contain forward-looking statements and involve risks and uncertainties that couldmaterially affect expected results of operations, liquidity, cash flows and business prospects. Words such as"estimate," "project," "predict," "will," "would," "should," "could," "may," "might," "anticipate," "plan," "intend,""believe," "expect," "aim," "goal," "target," "objective," "likely" or similar expressions that convey theprospective nature of events or outcomes generally indicate forward-looking statements. Factors that maycause Occidental's results of operations and financial position to differ from expectations include but are notlimited to: global commodity pricing fluctuations; supply and demand considerations for Occidental’sproducts; higher-than-expected costs; the regulatory approval environment; reorganization or restructuring ofOccidental's operations; not successfully completing, or any material delay of, field developments, expansionprojects, capital expenditures, efficiency projects, acquisitions or dispositions; lower-than-expectedproduction from development projects or acquisitions; exploration risks; general economic slowdownsdomestically or internationally; political conditions and events; liability under environmental regulationsincluding remedial actions; litigation; disruption or interruption of production or manufacturing or facilitydamage due to accidents, chemical releases, labor unrest, weather, natural disasters, cyber attacks orinsurgent activity; failure of risk management; changes in law or regulations; or changes in tax rates. Youshould not place undue reliance on these forward-looking statements, which speak only as of the date of thispresentation. Unless legally required, Occidental does not undertake any obligation to update any forward-looking statements, as a result of new information, future events or otherwise. Material risks that may affectOccidental’s results of operations and financial position appear in Part 1, Item 1A “Risk Factors” ofOccidental's 2015 Form 10-K.
2

Overriding Goal is to Maximize Total Shareholder Return• We believe this can be achieved through a combination of:
• Oil and gas production growth of 5% to 8% per year over the long-term;− Executing on our capital program with a focus on growing our U.S. oil production
• Allocating and deploying capital with a focus on achieving well above cost-of-capital returns (ROE and ROCE);
– Return Targets*• Domestic – 15+%• International – 20+%
− Continued improvement in our capital and drilling efficiency− Start-up of long-term projects
• Providing consistent, annual dividend growth;
• Maintaining a strong balance sheet.
Key Messages & Strategy
3*Assumes moderate product prices

Cash Flow Priorities Favor Dividends
1. Base/Maintenance Capital
2. Dividends
3. Growth Capital
4. Acquisitions
5. Share Repurchases
4
Subject to Returns and
Market Conditions
• High quality oil and gas assets & other low capital intensity operations Improving free cash flow in other segments provides continued dividend support Significant exposure to a recovery in oil prices provides optionality for
dividend growth and/or acceleration of production growth
• Operational excellence On track to exceed high end of 4% - 6% production growth guidance for FY 2016 On track for 2016 capital budget of ~$3 billion
• Recent WI acquisitions in existing areas strengthen Permian position Operatorship provides opportunity to control pace and cost of drilling Significant value capture through operating & development cost synergies, well
productivity, application of D&C knowledge, and leveraging existing infrastructure Significant optionality and value through future upside and development flexibility
• Superior balance sheet and ample liquidity
5
Key Messages & Takeaways

Large Integrated MajorsCompany Market Cap ($B)XOM $358RDS $211CVX $203TOT $120BP $105ENI $51
Characteristics• Low or no growth• Higher returns• Stronger B/S; lower risk• Free cash flow• Consistent dividend growth
Unique Investment Proposition
Independent E&PsCompany Market Cap ($B)COP $57EOG $54APC $34PXD $30DVN $23APA $22
Characteristics• Generally higher growth• Lower returns• Weaker B/S; higher risk• Little or no free cash flow• Little or no dividends• Moved from gassy to oily
Oxy has positive elements of both groups, appealing to investors who seek a combination of moderate growth, above average returns and consistent dividend growth.
Oxy Uniquely
Positioned
$51 billion
6Updated as of 11/10/2016

Oil and Gas Focus Areas
Latin America
• Leading position in the Permian Basin.
• Permian Resources is a growth driver.
• Al Hosn Project, Oman and Qatar.
• Additional potential opportunities for growth with partner countries.
• Highest margin operations in Colombia.
• Additional opportunities for moderate growth with partner.
Quality assets position Oxy to grow
• Oil production• Earnings & Cash Flow
per share• ROCE• Dividend stream
OxyChemHigh FCF, moderate growth business.
Oxy MidstreamIntegrated pipeline ops & marketing designed to maximize realizations.
A Focused Business with High Quality Assets
7
MENA
United States

565600 – 605
2015 CoreProduction
Other DomesticDecline
PermianResources
Growth
Al Hosn & OmanBlock 62
2016E CoreProduction
Outlook
2017E CoreProduction
Outlook
• Expect to exceed the higher end of 2016 production guidance of 4% - 6% growth
– Record high production at Al Hosn and Oman– Permian Resources ~13% FY 2016 growth
• Anticipate production growth of 5% - 8% in 2017
>6% Core Assets
Production Growth in 2016
Company-wide Oil & Gas Production from Core Assets (MBOED)
8
Production Growth Exceeding Expectations
Note: Core assets exclude Bahrain, Iraq, Yemen, Williston and Piceance Basins
5 – 8% Production
Growth

9
Total Spend per BOE Has Declined
~$40.00
~$27.50
2014 2015 2016Target
2016 YTD
Total Spend per BOE = Capital Spending* + G&A + All Operating Costs
Global Oil & Gas Sales Volumes
• Internal performance metric to focus on operational efficiency, especially in consideration of the sharp decline in commodity prices
• Portion of management and employees incentive compensation is directly aligned with this performance metric
• Focuses on efficiency, improved margins, and free cash flow generation
• Designed to help manage reduction in overall spending while rewarding production growth
$28.50
~$62.00
* Excludes cost of acquisitions

• Cash balance of $3.2 billion at 9/30/2016
• Recently issued $1.5 billion in bonds with 10-year coupon at 3.00% and 30-year coupon at 4.10%
• Single ‘A’ credit ratings re-affirmed with stable outlook
• Additional sources of liquidity in 2017 - 2018 of ~$2 billion including:
Anticipated tax refund in 2017 Monetization of non-strategic corporate assets Portfolio management & optimization
10
Recent Debt Offering & Sources of Liquidity
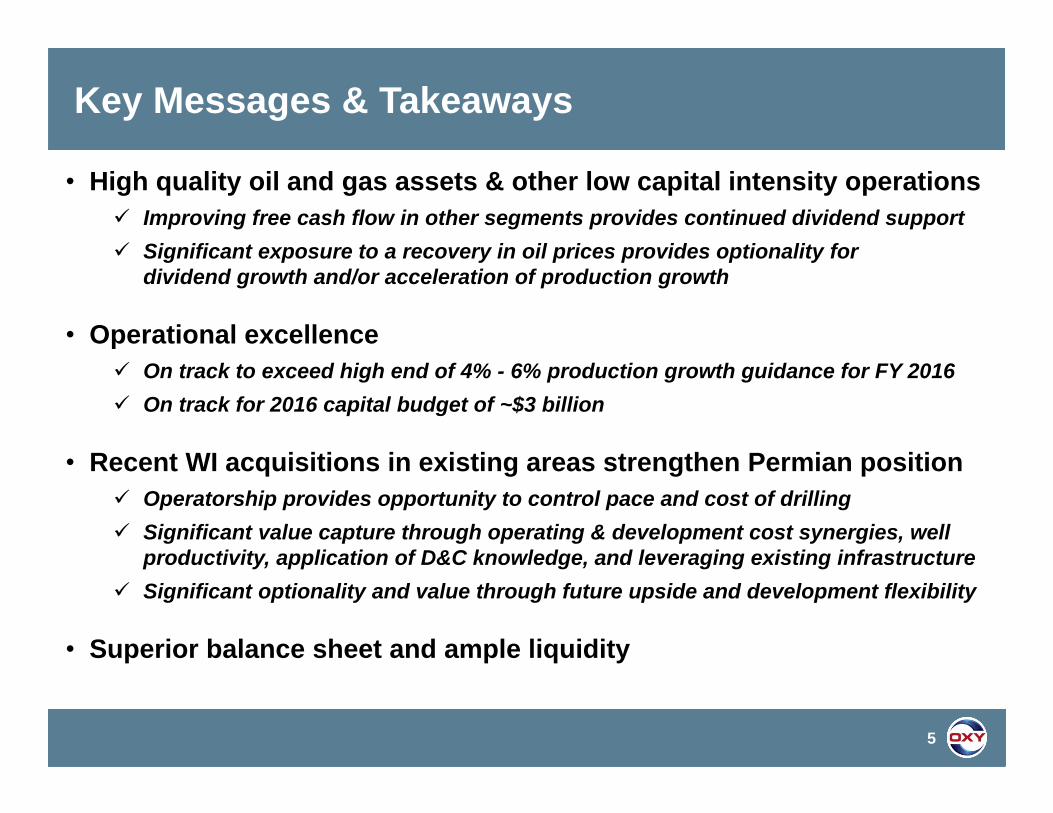
Maintenance Sustaining Growth
2016E 2017E
$3.3 - $3.8
<$3.0
11* Estimated capital budget required to keep production stable
Preliminary Capital Outlook($ in bln)
• Total sustaining and maintenance capital of ~$2.2 billion*
• Focused on return based capital for growth projects in Permian Resources
• Shorter cycle capital investments allow for flexibility to respond to any changing price environment
• If oil prices show downside volatility, can quickly adjust capital program below current outlook
Capital Flexibility to Pursue Growth
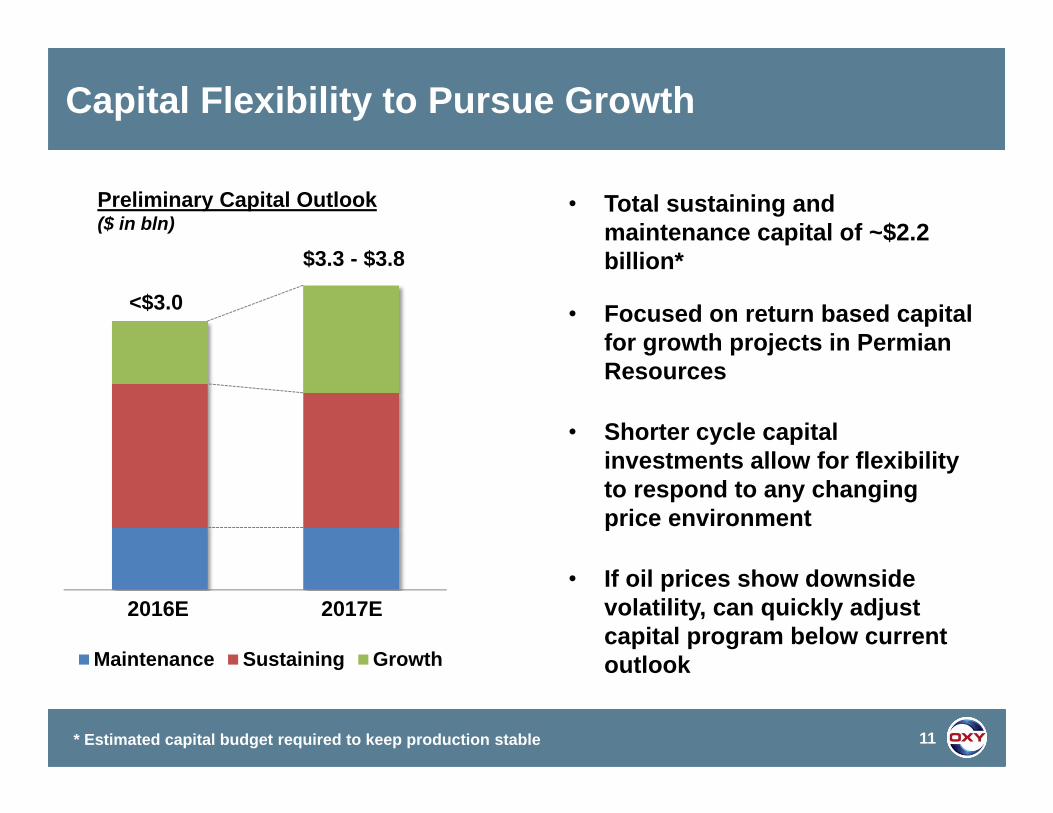
Core Countries• Oman: YTD record production of 95
MBOED through multiple onshore projects utilizing enhanced oil recovery, including steamfloods.
• Qatar: YTD production of 110 MBOED through multiple shallow-water EOR projects, Dolphin and ISSD record production
• UAE: YTD production of 61 MBOED from the Al Hosn gas project, exceeding performance expectations, including planned turnarounds
– Al Hosn 2017 production to increase to 65 – 70 MBOED
12
Middle East Update
Al Hosn Gas development
Al Hosn Gas Project
2017 Impact• Improved production and cost reductions at
Al Hosn and in Oman should increase free cash flow by ~$300+ MM
Achieved record production YTD 2016 in Oman, Qatar and the UAE

13
Midstream Update
Shipments from Ingleside export facility
2017 Impact• Free cash flow expected to improve $150 -
$200+ MM due to better marketing economics and ramp up of Ingleside oil storage and export facility
• Ample takeaway capacity and new outlet for Permian oil production
Business Segments• Gas Plants: Natural gas and CO2
gathering, compression and processing systems to control upstream costs
• Pipelines - Domestic: Take-away capacity via common carrier oil pipeline and storage systems, including Centurion pipeline, CO2 source fields and pipeline systems
• Pipelines - Foreign: Stable free cash flow from Dolphin natural gas pipeline
• Power Generation: Lower cost electricity through power and steam generating facilities
• Marketing & Trading: market production at highest realizations;includes Ingleside export facility

14
Chemicals Update
Ingleside ethylene cracker near completion
Integrated Value Chain• Chlorine: 60% Internal Use for VCM,
EDC, and Other Derivatives / 40% External Merchant Sales
• Vinyls: Demand driven by construction growth: PVC – sell 75% domestically and 25% exported; VCM – 50% internal use for PVC and 40% exported and 10% sold domestically;
• Caustic Soda: Leveraged to exports, manufacturing activity and chemicals demand: 95% sold externally; 40% exported; market prices now rising
• Natural Gas Inputs: Partial hedge of Oxy’s domestic natural gas production
2017 Impact• Expect free cash flow to increase by ~$400 MM
with lower capital expenditures, start up of ethylene cracker & product margin increases
• $10/ton of Caustic Netback = $30 MM cash flow• US infrastructure backlog a significant upside

Free Cash Flow Improvement
15
2017 vs 2016FCF Improvement
MENA ~$300 MMMidstream $150 - $200 MMChemicals ~$400 MMTotal $850 - $900 MM
• Improved market conditions, project start-ups and lower capital should increase free cash flow generation in 2017

EOR Business• YTD ‘16 Production - 144 MBOEPD• 1 million net acres• 1.9 Billion BOE remaining in reserves
and resourcesResources (Unconventional)• YTD ‘16 Production – 125 MBOEPD• 1.4 million net acres• 8,500 identified well locations* Midstream• 12 processing plants• ~2,900 miles of pipeline
– CO2 pipelines– Oil infrastructure and pipelines– Marketing business
Permian Basin Is The Core Domestic Asset
Oxy Acreage
Oil Pipelines
CO2 Pipelines
16* Based on 4Q15 metrics
Infrastructure difficult to duplicate

17
Growing the Greater Barilla Draw Area
• Recent acquisition enhances Occidental’s strong position in the Southern Delaware Basin− Part of a multi-year investment plan started in 2012− Area now encompasses ~100,000 net acres & 3,800+
hz locations
• Scale of contiguous position allows for synergies− Vast delineated area of subsurface characterization− Expanded best-in-class operating capabilities− Integrated infrastructure and supply chain leverage− Market access for rapid production growth
• Unconstrained high value growth potential
BEFORE
~63% Working Interest
~100% Working Interest
~26% Working Interest
AFTER
~26% Working Interest• Unique opportunity to increase working
interests and operatorship in Red Bull properties

Proven Economic
18
Multi-Bench Development PotentialBarilla Draw Type Log
Debris Flow
Target Formation
Recent Wells
Well #*Effective Lateral
Length (Feet)IP-30
(Boepd)
Avalon Potential
1st Bone Spring Evaluating
2nd Bone Spring Well #1Well #2
4,5144,947
762821
3rd Bone Spring Well #1 7,576 642
Wolfcamp A
Well #1Well #2Well #3Well #4Well #5
4,3967,7004,4074,3007,553
1,5642,2101,3041,8921,240
Wolfcamp DebrisFlow
Well #1Well #2Well #3Well #4
4,5006,5754,7764,681
1,9071,2471,3401,263
Wolfcamp B
Well #1Well #2Well #3Well #4
7,3776,9476,9357,376
1,1711,5131,1241,416
Wolfcamp C Well #1 4,251 937
* Wells include Oxy and acquisition acreageEvaluating
Potential

0
30
60
90
120
150
180
PriorOperator
OxyCurrent
OxyPotential
6 Mon
th Cum
ulative MBO
E
$‐
$2
$4
$6
$8
$10
$12
PriorOperator
OxyCurrent
OxyPotential
Total W
ell Cost ($M
M)
Well Productivity
19
Greater Barilla Draw Advantages
• 150,000+ BOPD Oil Pipeline takeaway
• 300+ MMCFD Gas Pipeline capacity
• 290,000+ BWPD Pipeline SWD Capacity
• 90 MW of Power from 5 Electrical Substations
• 52 consolidated CTB’s
• Integrated Artificial Lift systems
• 5+ Rig Development Potential• Oxy Drilling Dynamics
– Faster Drilling + Reduced Downtime– More Lateral Footage / Rig
• Completion Efficiencies
– Maximizing Stages per Day– Optimized Flow Back– Shared infrastructure
Well Cost* Infrastructure Cost
• Subsurface Expertise– Vertical Delineation History– 3D Seismic + Core– Expansive sub-basin characterization
area• Integrated Stimulation Designs
– Unique designs to fit geo-science and reservoir characteristics
• Optimal Full Section Spacing for value
7,500 ft Lateral7,500 ft Lateral
$7.8 - $8.5
0%
5%
10%
15%
20%
25%
30%
PriorOperator
OxyCurrent
OxyPotential
Facilities %
of D
evelop
men
t Cap
ex*Well cost includes drilling, completion, hook-up, initial flow-back, capitalized *overhead, and artificial lift

20
Acquisition Influence on Greater Barilla Draw
Drilling Pace CapabilityNet Acres
Net Production - BOEPD• Oxy’s development capability adds significant
value to the acquired assets
• Previously owned a 26% WI in the acquisition area
• Oxy operating adds over $600MM of Future NPV10* to the Greater Barilla Draw area
*Future NPV10 calculation assumes a modest 3 rig pace with $500K / well cost improvement, $0.50 / boe opex improvement and 10% well productivity improvement from the prior operator.
38,000
21
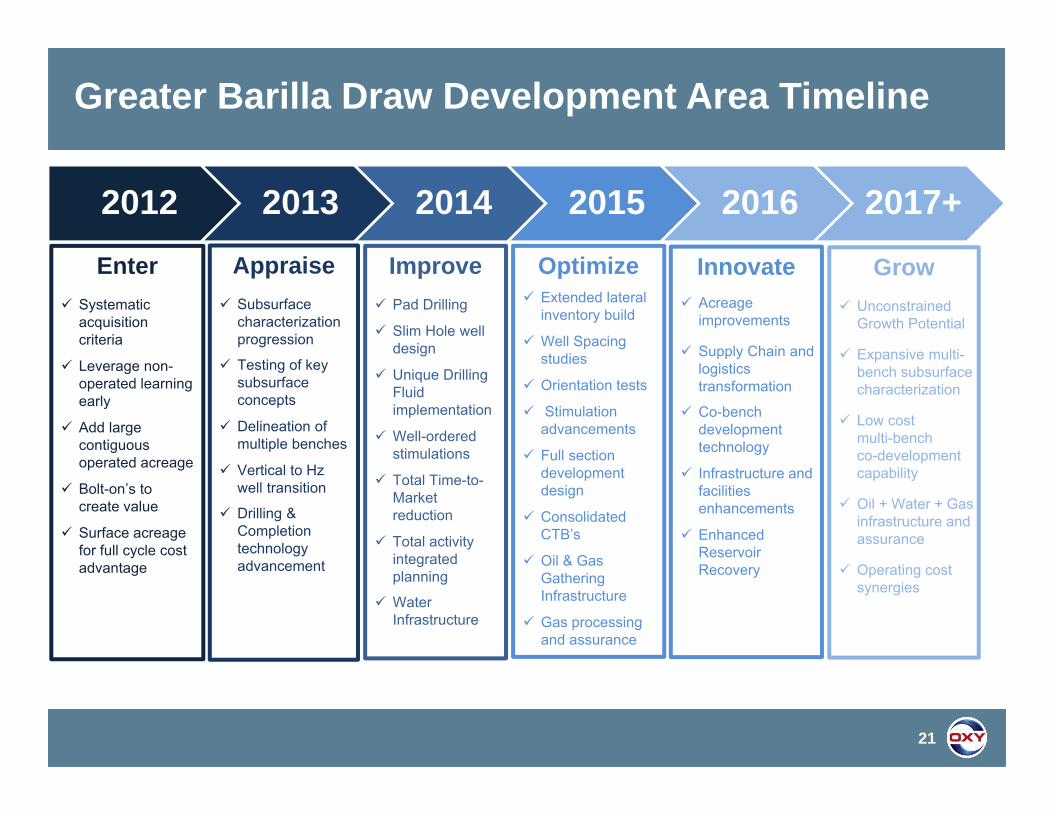
Greater Barilla Draw Development Area Timeline
2012 2013 2014 2015 2016 2017+Enter
Systematic acquisition criteria
Leverage non-operated learning early
Add large contiguous operated acreage
Bolt-on’s to create value
Surface acreage for full cycle cost advantage
Appraise Subsurface
characterization progression
Testing of key subsurface concepts
Delineation of multiple benches
Vertical to Hz well transition
Drilling & Completion technology advancement
Improve Pad Drilling
Slim Hole well design
Unique Drilling Fluid implementation
Well-ordered stimulations
Total Time-to-Market reduction
Total activity integrated planning
Water Infrastructure
Optimize Extended lateral
inventory build
Well Spacing studies
Orientation tests
Stimulation advancements
Full section development design
Consolidated CTB’s
Oil & Gas Gathering Infrastructure
Gas processing and assurance
Innovate Acreage
improvements
Supply Chain and logistics transformation
Co-bench development technology
Infrastructure and facilities enhancements
Enhanced Reservoir Recovery
Grow Unconstrained
Growth Potential
Expansive multi-bench subsurface characterization
Low cost multi-bench co-development capability
Oil + Water + Gas infrastructure and assurance
Operating cost synergies

22
Greater Barilla Draw Timeline
2013 - Appraise 2014 - Improve 2015 - Optimize2012 - Enter 2016 - Innovate• 1st WC A Hz well at
Lockridge
• Barilla Draw acquisition
• 1st WC B Hz well appraisal
• Operated and non-operated acquisitions
• 1st WC C and 3rd BS Hz appraisal wells
• Acquired core: WC A, WC B, 2nd and 3rd BS
• 5,000’ lateral <15 drilling days
• 1st 10,000’ Hz lateral
• Oxy/Enterprise JV gas plant
• Acreage swap & JVs for extended laterals
• 35,000 net acres acquisition
Existing Oxy 3D Seismic Surveys Proposed 2017 3D Seismic AcquisitionOutside OperatedOxy Operated
Collie Lockridge
Barilla Draw
Motorcycle (~25%)
Red Bull –North
(~63%)
Red Bull -South

Permian Resources Drives Oxy Production Growth
23
• Total Permian Resources production growth expected to be ~13% in 2016
• Increased activity expected in 4Q16 in preparation for 2017 growth
– 5 rigs drilling a mix of development and appraisal wells
– Production will start increasing again before year-end
4371
2014 2015 2016E 2017E
Oil NGL Gas
~124110
75
MBOED

24
Overall Permian Continues to Grow
2014 2015 2016E 2017E
Oil NGL Gas
~270
MBOED
255222
• Expect to increase to 8 rigs in 4Q16
• Successfully enhancing completion methods across Permian Resources acreage position
• Achieving better than expected results in both Permian businesses which will allow us to invest the savings into additional wells in each respective business
• Expect production growth in 2017 with added rigs in Permian Resources and continued investment in Permian EOR

Access to Multiple Markets Through Midstream Investments
Corpus Christi
Nederland
Mid‐Valley240 kb/d
McCamey
Crane
Midland
Houston
Wink
ColoradoCity
Ho‐Ho Pipeline
Oxy owned
Oxy is a major shipper
Cushing
HOFTCO Terminal
Ingleside Terminal
25
• Ample takeaway capacity to reach multiple markets and hubs to drive improved price realizations
• Blending capabilities allow for optimization