Observing Network Performance and Congestion on …file.scirp.org/pdf/JCC_2017070414454210.pdf ·...
24
Journal of Computer and Communications, 2017, 5, 43-66 http://www.scirp.org/journal/jcc ISSN Online: 2327-5227 ISSN Print: 2327-5219 DOI: 10.4236/jcc.2017.59004 July 5, 2017 Observing Network Performance and Congestion on Managing Assets with RFID and Cloud Computing Leandro Andrioli, Rodrigo da Rosa Righi, Cristiano André da Costa, Lucas Graebin Applied Computing Graduate Program, Universidade do Vale do Rio dos Sinos (Unisinos), São Leopoldo, RS, Brazil Abstract Today, we observe that more and more, radio frequency identification (RFID) technology has been used to identify and track objects in enterprises and in- stitutions. In addition, we also perceive the growing adoption of cloud com- puting, either public or private, to process and store data from the objects. In this context, the literature does not present an initiative that looks into the network on enterprise-cloud interactions, so neglecting network performance and congestion information when transmitting data to the cloud. Thus, we are presenting a model named ACMA—Automatic Control and Management of Assets. ACMA employs context awareness to control and monitor corporate assets in companies with multiple units. ACMA provides a centralized point of access in the cloud in which interested actors can get online data about each corporate asset. In particular, our scientific contribution consists in consider- ing network congestion to control dynamically the data updating interval from sensors to the cloud. The idea is to search for reliability and integrity of operations, without losing or corrupting data when updating the information to cloud. Thus, this article describes the ACMA model, its architecture, algo- rithms and features. In addition, we describe the evaluation methodology and the results obtained through experiments and simulations based on the de- veloped prototype. Keywords Internet of Things, RFID, Cloud Computing, Network Congestion, Adaptivity, Assets 1. Introduction In recent years, there has been an exponential growth in the use of radio fre- How to cite this paper: Andrioli, L., da Rosa Righi, R., da Costa, C.A. and Graebin, L. (2017) Observing Network Performance and Congestion on Managing Assets with RFID and Cloud Computing. Journal of Com- puter and Communications, 5, 43-66. https://doi.org/10.4236/jcc.2017.59004 Received: May 4, 2017 Accepted: July 2, 2017 Published: July 5, 2017 Copyright © 2017 by authors and Scientific Research Publishing Inc. This work is licensed under the Creative Commons Attribution International License (CC BY 4.0). http://creativecommons.org/licenses/by/4.0/ Open Access
-
Upload
nguyenhanh -
Category
Documents
-
view
221 -
download
0
Transcript of Observing Network Performance and Congestion on …file.scirp.org/pdf/JCC_2017070414454210.pdf ·...

Journal of Computer and Communications, 2017, 5, 43-66 http://www.scirp.org/journal/jcc
ISSN Online: 2327-5227 ISSN Print: 2327-5219
DOI: 10.4236/jcc.2017.59004 July 5, 2017
Observing Network Performance and Congestion on Managing Assets with RFID and Cloud Computing
Leandro Andrioli, Rodrigo da Rosa Righi, Cristiano André da Costa, Lucas Graebin
Applied Computing Graduate Program, Universidade do Vale do Rio dos Sinos (Unisinos), São Leopoldo, RS, Brazil
Abstract Today, we observe that more and more, radio frequency identification (RFID) technology has been used to identify and track objects in enterprises and in-stitutions. In addition, we also perceive the growing adoption of cloud com-puting, either public or private, to process and store data from the objects. In this context, the literature does not present an initiative that looks into the network on enterprise-cloud interactions, so neglecting network performance and congestion information when transmitting data to the cloud. Thus, we are presenting a model named ACMA—Automatic Control and Management of Assets. ACMA employs context awareness to control and monitor corporate assets in companies with multiple units. ACMA provides a centralized point of access in the cloud in which interested actors can get online data about each corporate asset. In particular, our scientific contribution consists in consider-ing network congestion to control dynamically the data updating interval from sensors to the cloud. The idea is to search for reliability and integrity of operations, without losing or corrupting data when updating the information to cloud. Thus, this article describes the ACMA model, its architecture, algo-rithms and features. In addition, we describe the evaluation methodology and the results obtained through experiments and simulations based on the de-veloped prototype.
Keywords Internet of Things, RFID, Cloud Computing, Network Congestion, Adaptivity, Assets
1. Introduction
In recent years, there has been an exponential growth in the use of radio fre-
How to cite this paper: Andrioli, L., da Rosa Righi, R., da Costa, C.A. and Graebin, L. (2017) Observing Network Performance and Congestion on Managing Assets with RFID and Cloud Computing. Journal of Com- puter and Communications, 5, 43-66. https://doi.org/10.4236/jcc.2017.59004 Received: May 4, 2017 Accepted: July 2, 2017 Published: July 5, 2017 Copyright © 2017 by authors and Scientific Research Publishing Inc. This work is licensed under the Creative Commons Attribution International License (CC BY 4.0). http://creativecommons.org/licenses/by/4.0/
Open Access

L. Andrioli et al.
44
quency identification sensors (RFID) [1]. RFID use radio waves to identify data in electronic tags attached to objects. This data is captured by a reader without the need of visual or physical contact [2]. Still, it should be noted that RFID have great sensitivity of tracking, which makes it possible to identify various objects faster than the traditional mode of bar code.
In addition to RFID, another technology that has emerged in recent years is cloud computing [3]. According to Mell and Grance [4], cloud computing offers a model that enables access to the network on-demand to a shared pool of com-puting resources. In this mode, you can pay only for the resources that were ac-tually used and you can provision and release them quickly and with minimal management effort. Thus, one can use it with an integrated RFID system, dras-tically reducing deployment costs can lead organizations to a reduction of up to 50% in IT spending if compared with traditional IT mode [5].
Together, RFID and cloud computing can be used under the control and management of assets. Initially, the asset management business was a support activity, constituting an auxiliary control system. Nowadays, this management is less aid and more active. When we build a proprietary asset management system in a broader context, with speed and reliability of the information obtained in each stage, the company’s management becomes simpler and more rational. This benefits the company with strategic and operational decisions, as well as contributes to sustainability of business. Moreover, the traditional mode of management of assets with bar code is a complex task that requires more team effort, since it is exercised by a person who collects the information. In this case, you cannot have the accuracy of the data collected, still requiring a high time for the conference [6].
In this field of business, one may utilize the advantages of RFID sensor tech-nology combined with the benefits of the cloud. However, there must be a con-cern with the possible massive volume of data generated by sensors. This is a gap still open in the literature and at the same time, it is very important, since the data generated by sensors can cause network congestion. This congestion can lead to slow network, packet loss and it can cause a negative impact on other important activities to the business [7]. It is fundamental to develop a feature that aims to integrity and reliability of information, but at the same time, does not overload the network causing congestion.
Considering the aforementioned context, this article has the following objec-tive: developing a context awareness using RFID as a solution for management and monitoring corporate assets considering network congestion to control, dy-namically, the update interval of the data from these sensors to the cloud. For this purpose, we present the ACMA model, which has as a main idea to act in congestion control network for communications from RFID readers to the ad-ministration point centralized in the cloud. In this sense, it aimed at offering greater availability and reliability to update the sensor data coming from com-panies. For this intention, ACMA presents an adaptive algorithm that controls

L. Andrioli et al.
45
the frequency range to update such data transparently to users. A prototype was developed and it was evaluated in a company which meets the requirements de-fined in the model. The qualitative and quantitative results demonstrate the fea-sibility of the proposed model and the benefits of using the adaptation for net-work data traffic.
To present and evaluate the ACMA model, this paper is organized in seven sections: (i) in Section 2 we examine the literature and state of the art in related works; (ii) the ACMA model is detailed in Section 3, exploring architectural de-tails, features and actors; (iii) Section 4 shows up design decisions for the im-plementation of the prototype; (iv) later in Section 5 we describe the evaluation methodology and scenarios for evaluation of the prototype; (v) in Section 6 the results are discussed; (vi) finally, Section 7 presents the relevant contributions and suggests opportunities for future work.
2. Related Work
In this section, we present four solutions related to the research topic. Therefore, we carried out searches with the following keywords: RFID, cloud computing, network congestion and Patrimonial Assets Control on a scientific basis as IEEE and ACM. The criteria for selection were the similarity with the model and the problem in question.
2.1. Research and Design of the Intelligent Inventory Management System Based on RFID
Jing and Tang [8] proposed an inventory management system based on RFID technology. After a literature review of the key technologies involved, it was de-fined the use of RFID-based Zigbee sensors, a networking standard intended for a set of high level communication protocols. Despite not having been effectively implemented, the proposed system was modeled to a network structure, speci-fied to the system modules and the diagram of application entities.
2.2. Web Based RFID Asset Management Solution Established on Cloud Services
Chattopadhyay et al. [9] presented a model of tracking system based on web ser-vices and cloud computing. After a review of the literature of the key technolo-gies involved, they elaborated the system architecture, showing the major mod-ules and the logical relationships involved. Based on the model, the authors de-veloped a prototype contemplating a web application for user interaction. In or-der to validate the model, performance tests were performed and processed along two fronts: (i) RFID system based on an application resident in the reader hardware; (ii) RFID system based on web service. Through these tests, it was concluded that for a low number of tags simultaneously and a high tolerance to delays in information, it is indicated using the application resident in the reader. In contrast, for large numbers of concurrent reads and low tolerance to delays in information, it is indicated using the system based on web service.
L. Andrioli et al.
46
2.3. Driving New Insights in Asset Utilisation by Utilising RFID Technology to Deliver Asset Status Updates in Real-Time
McGreen and Xie [10] suggested a real-time asset management system. The ar-ticle shows a model to capture, track and update data of assets, delivering this information to the user in real time. After a literature review on the RFID sensor technology, an architecture consisted of three layers is presented: hardware, middleware and applications business domains. It was defined that the focus for applying the model would be a hospital, considering that, in the United States, the number of corporate assets that disappear in hospitals is high. To evaluate the proposed architecture, the authors presented the Saint Michael’s Medical Center of New Jersey, USA using a monitoring system in real time to control as-sets. After an analysis, it is concluded that the information generated with the proposed model is able to deliver information with significant value, which is difficult or impossible to achieve with the traditional methods and asset man-agement techniques without the use of RFID in time real.
2.4. Congestion Control for Self Similar Traffic in Wireless Sensor Network
Dubey and Sinha [7] presented a technique for predicting congestion in the network, which bypasses congestion before the occurrence of further damage. After a brief presentation of the main concepts involved and the illustration of different congestion control algorithms, they presented the algorithm Conges-tion Prediction and Detection Control (CPDC). This algorithm uses a buffer ra-tio for the prediction and detection of congestion, i.e., after it detects a traffic jam, it sends notifications and reduces the traffic rate to minimize the negative effects caused by network congestion. The authors concluded through experi-ments and simulations that CPDC algorithm developed an improvement of 9.76% when compared to the other algorithms presented in the survey.
2.5. Comparison of Related Work
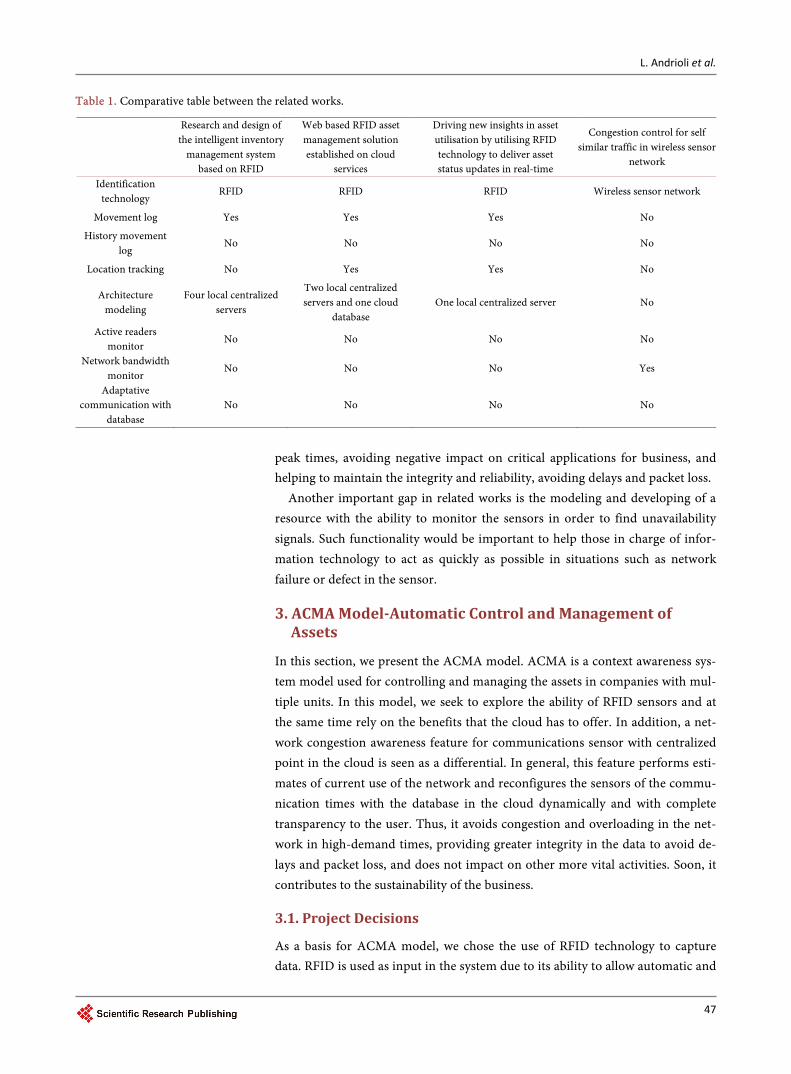
For a better understanding, Table 1 shows the relationship between the related works. Most of the analyzed studies developed a graphical interface for the local computers. Still, they presented as future work the development of a web appli-cation. Furthermore, only one of the works observed used the acquisition of in-formation to store a history of the movement. Thus, it is possible to identify the object from its source to its location.
It is observed that most of the related works propose the use of RFID tech-nology to monitor corporate assets, but there is not a concern with reliability and integrity issues in the transmitted data. Therefore, it opens an important gap in the network congestion that comes from the high volume of data generated by the sensors. For these reasons, we must develop an algorithm to perform esti-mates in current network usage with the ability to automatically reconfigure the communication times between the sensors and the database in a transparent way. Our algorithm reduces the impact that high network usage can generate at
L. Andrioli et al.
47
Table 1. Comparative table between the related works.
Research and design of the intelligent inventory
management system based on RFID
Web based RFID asset management solution established on cloud
services
Driving new insights in asset utilisation by utilising RFID technology to deliver asset status updates in real-time
Congestion control for self similar traffic in wireless sensor
network
Identification technology
RFID RFID RFID Wireless sensor network
Movement log Yes Yes Yes No
History movement log
No No No No
Location tracking No Yes Yes No
Architecture modeling
Four local centralized servers
Two local centralized servers and one cloud
database One local centralized server No
Active readers monitor
No No No No
Network bandwidth monitor
No No No Yes
Adaptative communication with
database No No No No
peak times, avoiding negative impact on critical applications for business, and helping to maintain the integrity and reliability, avoiding delays and packet loss.
Another important gap in related works is the modeling and developing of a resource with the ability to monitor the sensors in order to find unavailability signals. Such functionality would be important to help those in charge of infor-mation technology to act as quickly as possible in situations such as network failure or defect in the sensor.
3. ACMA Model-Automatic Control and Management of Assets
In this section, we present the ACMA model. ACMA is a context awareness sys-tem model used for controlling and managing the assets in companies with mul-tiple units. In this model, we seek to explore the ability of RFID sensors and at the same time rely on the benefits that the cloud has to offer. In addition, a net-work congestion awareness feature for communications sensor with centralized point in the cloud is seen as a differential. In general, this feature performs esti-mates of current use of the network and reconfigures the sensors of the commu-nication times with the database in the cloud dynamically and with complete transparency to the user. Thus, it avoids congestion and overloading in the net-work in high-demand times, providing greater integrity in the data to avoid de-lays and packet loss, and does not impact on other more vital activities. Soon, it contributes to the sustainability of the business.
3.1. Project Decisions
As a basis for ACMA model, we chose the use of RFID technology to capture data. RFID is used as input in the system due to its ability to allow automatic and

L. Andrioli et al.
48
accurate identification, reducing the possibility of errors in the assets control. When used in the monitoring and controlling of corporate assets, RFID can de-liver benefits: (i) reduction in the time of the reconciliation of assets; (ii) increase the safety and accuracy of the collected operations; (iii) greater assurance on compliance with tax obligations.
In order to search the system requirements to approach a real need for com-panies, we conducted a case study based on the needs of a company from Porto Alegre, Brazil. It is important to notice that the researcher keeps the company name confidential, due to company’s security policy as a way to maintain the confidentiality and protection of strategic information. This company is big and made up of multiple units, totaling approximately 3800 employees. In this study, we focus in the inventory area employees and assets, comprising the technical area of the company responsible for all process monitoring and asset manage-ment. Figure 1 shows the questionnaire applied in the company.
For the data storage, we chose to use a database in the cloud as a point of cen-tralized access. Thus, data is accessed globally and all branches can get informa-tion about the assets. Regarding the type of tags, the option is to use the type of passive UHF tags. It was chosen due to its low cost, small size and long life. Still, its detection radius RFID sensors reach a few meters away, providing detection requirements for the proposed model.
The model assumes that there are RFID readers distributed in and out of all enterprise environments. This way you can identify the objects that cross the sensor range. Each asset and subject to accounting in equity management process must have an RFID tag attached to each other, which must be main-tained throughout its life cycle. In the system, these assets must be registered with the tag code, cost center and business unit to which it belongs. As well as movements of the object between the different environments of the company, the system will be able to track its current location, and other important and re-levant attributes to the business context, as a sector and cost center.
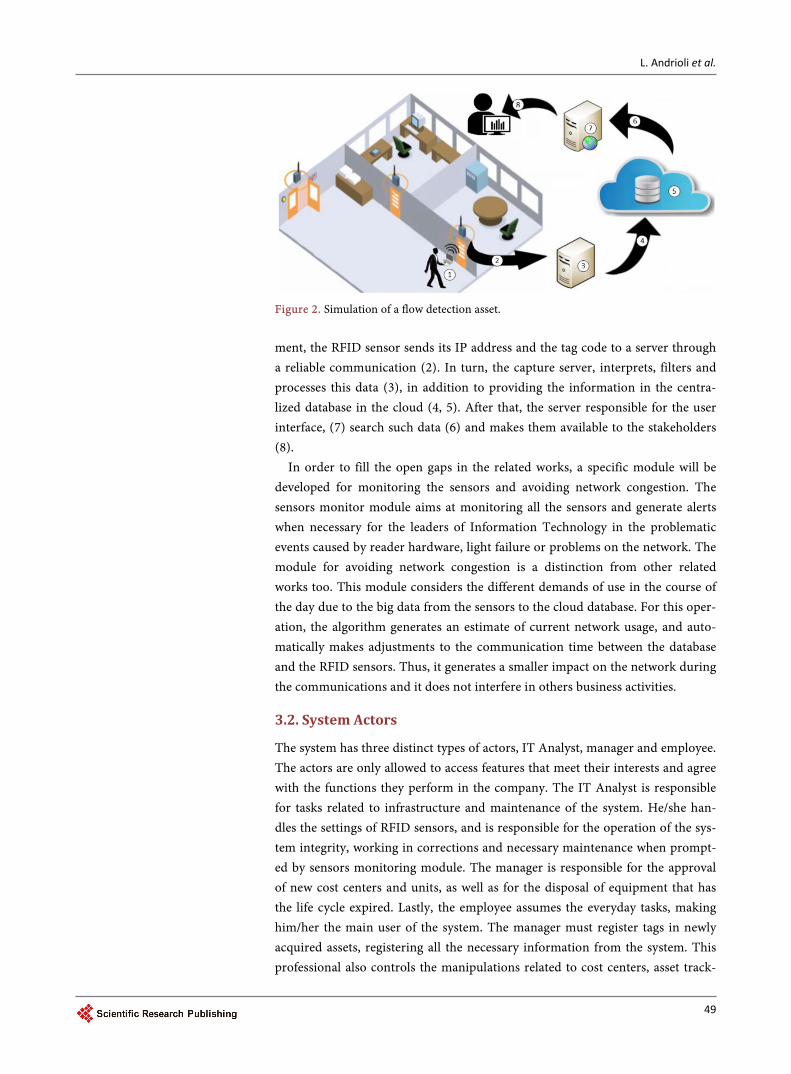
In Figure 2 we can see the detection flow of an asset. Upon approaching the entrance of the room, the tag attached to the object is detected (1). At this mo-
Figure 1. Requirements questionnaire applied in the company.
L. Andrioli et al.
49
Figure 2. Simulation of a flow detection asset. ment, the RFID sensor sends its IP address and the tag code to a server through a reliable communication (2). In turn, the capture server, interprets, filters and processes this data (3), in addition to providing the information in the centra-lized database in the cloud (4, 5). After that, the server responsible for the user interface, (7) search such data (6) and makes them available to the stakeholders (8).
In order to fill the open gaps in the related works, a specific module will be developed for monitoring the sensors and avoiding network congestion. The sensors monitor module aims at monitoring all the sensors and generate alerts when necessary for the leaders of Information Technology in the problematic events caused by reader hardware, light failure or problems on the network. The module for avoiding network congestion is a distinction from other related works too. This module considers the different demands of use in the course of the day due to the big data from the sensors to the cloud database. For this oper-ation, the algorithm generates an estimate of current network usage, and auto-matically makes adjustments to the communication time between the database and the RFID sensors. Thus, it generates a smaller impact on the network during the communications and it does not interfere in others business activities.
3.2. System Actors
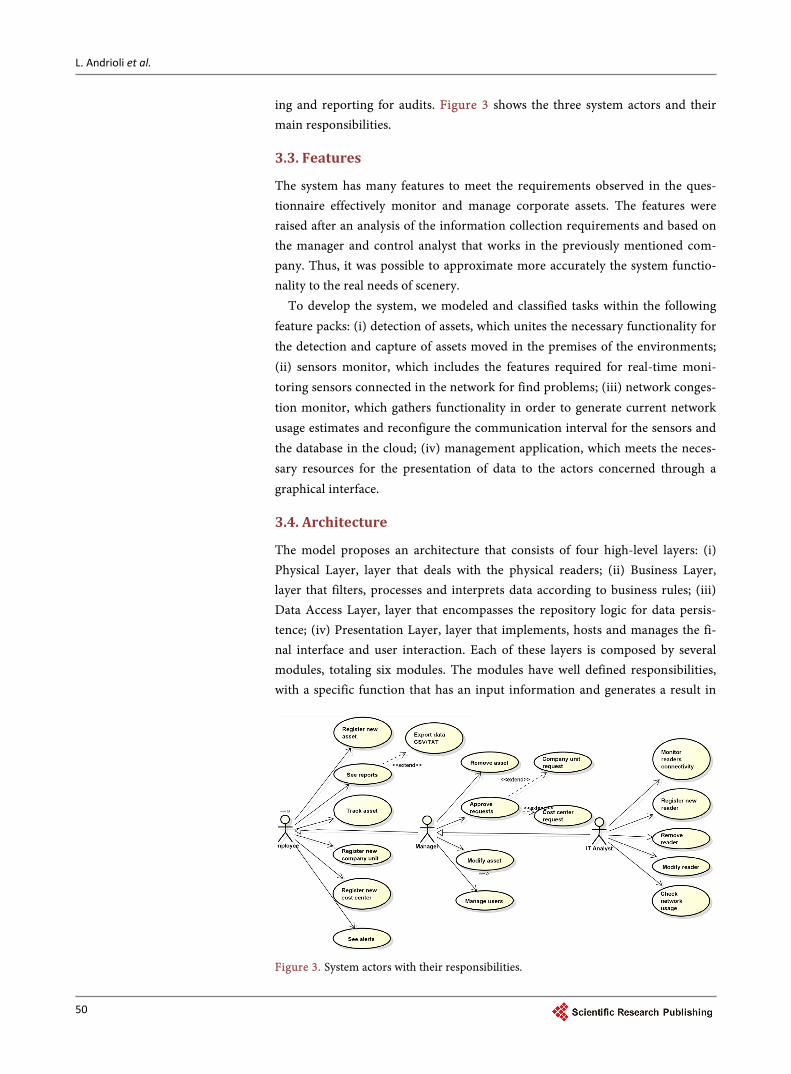
The system has three distinct types of actors, IT Analyst, manager and employee. The actors are only allowed to access features that meet their interests and agree with the functions they perform in the company. The IT Analyst is responsible for tasks related to infrastructure and maintenance of the system. He/she han-dles the settings of RFID sensors, and is responsible for the operation of the sys-tem integrity, working in corrections and necessary maintenance when prompt-ed by sensors monitoring module. The manager is responsible for the approval of new cost centers and units, as well as for the disposal of equipment that has the life cycle expired. Lastly, the employee assumes the everyday tasks, making him/her the main user of the system. The manager must register tags in newly acquired assets, registering all the necessary information from the system. This professional also controls the manipulations related to cost centers, asset track-
L. Andrioli et al.
50
ing and reporting for audits. Figure 3 shows the three system actors and their main responsibilities.
3.3. Features
The system has many features to meet the requirements observed in the ques-tionnaire effectively monitor and manage corporate assets. The features were raised after an analysis of the information collection requirements and based on the manager and control analyst that works in the previously mentioned com-pany. Thus, it was possible to approximate more accurately the system functio-nality to the real needs of scenery.
To develop the system, we modeled and classified tasks within the following feature packs: (i) detection of assets, which unites the necessary functionality for the detection and capture of assets moved in the premises of the environments; (ii) sensors monitor, which includes the features required for real-time moni-toring sensors connected in the network for find problems; (iii) network conges-tion monitor, which gathers functionality in order to generate current network usage estimates and reconfigure the communication interval for the sensors and the database in the cloud; (iv) management application, which meets the neces-sary resources for the presentation of data to the actors concerned through a graphical interface.
3.4. Architecture
The model proposes an architecture that consists of four high-level layers: (i) Physical Layer, layer that deals with the physical readers; (ii) Business Layer, layer that filters, processes and interprets data according to business rules; (iii) Data Access Layer, layer that encompasses the repository logic for data persis-tence; (iv) Presentation Layer, layer that implements, hosts and manages the fi-nal interface and user interaction. Each of these layers is composed by several modules, totaling six modules. The modules have well defined responsibilities, with a specific function that has an input information and generates a result in
Figure 3. System actors with their responsibilities.

L. Andrioli et al.
51
the output for the next module. Thus, together, the modules are responsible for all information processing flow, since its capture in RFID sensor to the end re-sult made available to interested actors through a Web application. Figure 4 shows the architecture and the relationships between the proposed modules.
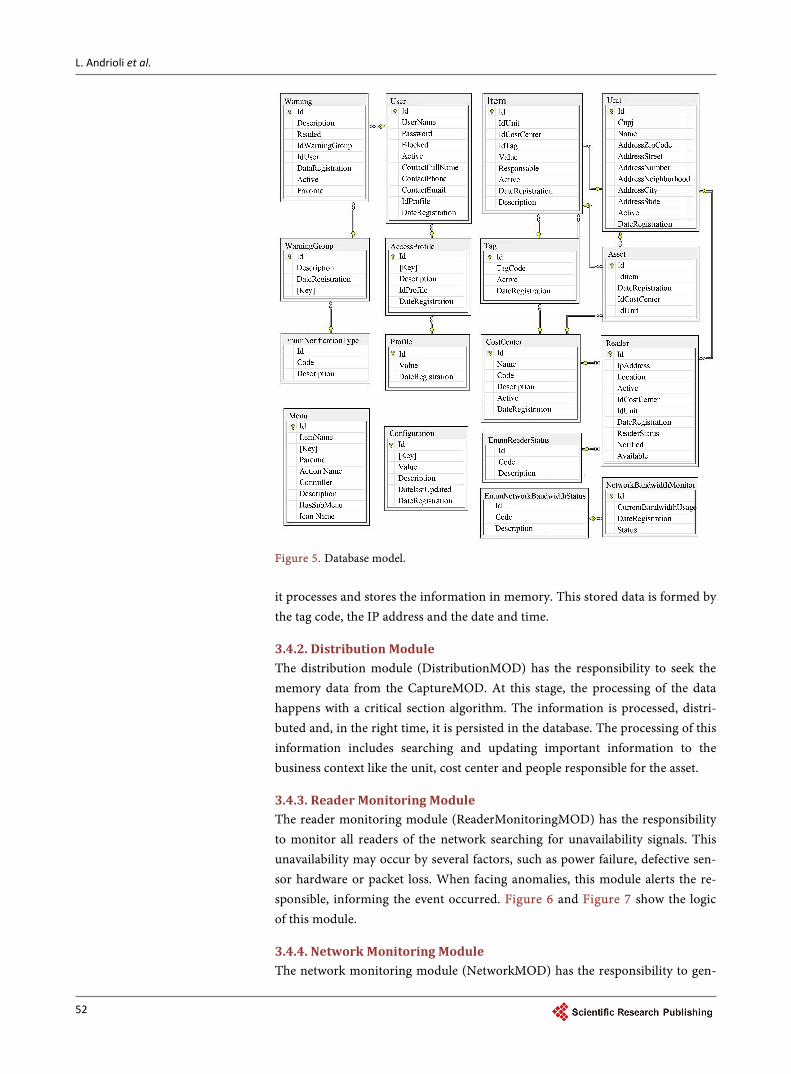
The operation main flow starts in capture module (CaptureMOD). Capture-MOD captures information from the RFID sensors and stores in memory as raw data. This data is read by the DistributionMOD, which distributes and sorts them into their system tables. From this point, two distinct streams are formed. The first is from the ReaderMonitoringMOD that performs processing in net-work sensors in order to detect downtime and alert those responsible. The second stream is performed by the NetworkMOD which generates estimates for the current network usage and performs the changes in communication metrics between the sensors and the cloud database. Finally, the data is available for ma-nipulation and visualization, and the actors concerned by WebApplicationMOD. In Figure 5 we can see the database model that allows the development of the proposed modules.
3.4.1. Capture Module The CaptureMOD has the responsibility to capture and interpret the data from the sensors. It must be performed quickly and efficiently to avoid bottlenecks due to the large volume of data received. To achieve this goal, this operation im-plements a standard of producer and consumer for reception and processing of data with a critical section algorithm for access to shared memory. The commu-nication between the sensors and the server is given through a reliable commu-nication. In this scenario, when CaptureMOD receives an event of captured tags,
Figure 4. Architectural model with the relationships between modules.
L. Andrioli et al.
52
Figure 5. Database model. it processes and stores the information in memory. This stored data is formed by the tag code, the IP address and the date and time.
3.4.2. Distribution Module The distribution module (DistributionMOD) has the responsibility to seek the memory data from the CaptureMOD. At this stage, the processing of the data happens with a critical section algorithm. The information is processed, distri-buted and, in the right time, it is persisted in the database. The processing of this information includes searching and updating important information to the business context like the unit, cost center and people responsible for the asset.
3.4.3. Reader Monitoring Module The reader monitoring module (ReaderMonitoringMOD) has the responsibility to monitor all readers of the network searching for unavailability signals. This unavailability may occur by several factors, such as power failure, defective sen-sor hardware or packet loss. When facing anomalies, this module alerts the re-sponsible, informing the event occurred. Figure 6 and Figure 7 show the logic of this module.
3.4.4. Network Monitoring Module The network monitoring module (NetworkMOD) has the responsibility to gen-

L. Andrioli et al.
53
Figure 6. Algorithm of the sensors monitoring manager.
Figure 7. Algorithm of the test routine for sensors connectivity. erate current use estimates of the network and adapt the communication time to update the sensor data to the database. When there is an increase in the network usage demand, the communication time decreases. By contrast, when a decrease in the network usage demand happened, the frequency in communication time increases. In this way, we seek to avoid network congestion, from the high vo-lume of data generated by the sensors, which can impact in other vital business activities. For this task, an adaptive algorithm was developed based on the con-cepts of the widely-used congestion control algorithm of the TCP protocol [11], [12]. The proposed algorithm analyzes the amount of network traffic that is generated and the current network usage estimates. Due to the current demand of network usage, the algorithm generates changes in the frequency of commu-nication time between the RFID sensors and cloud database. The whole process of analysis, estimation and reconfiguration of the communication occurs auto-matically and transparently to the user.
The algorithm is divided into two main stages. The first phase is the genera-tion of estimates related to network usage. A connection to the network interface is performed, as well as a calculation based on the number of packets sent and received. This information classifies the current state of the network as OK, warning or critical. Each of these states refers to a maximum percentage barrier and can be parametrized as a percentage value. This makes the algorithm more open for each specific need. The second phase is the communication time setting in the database. The algorithm starts at an exponential decrement phase in the communication time, very similar to exponential slow start of TCP protocol. Upon reaching the warning barrier, it starts the linear decrement phase in the
L. Andrioli et al.
54
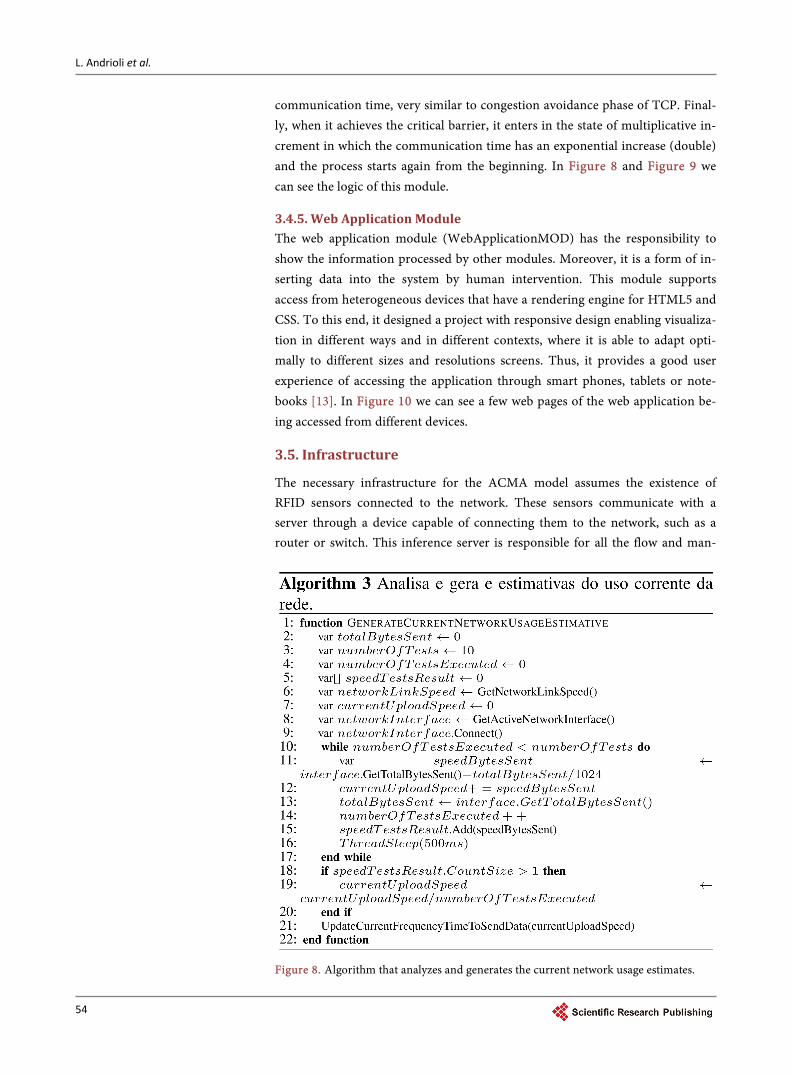
communication time, very similar to congestion avoidance phase of TCP. Final-ly, when it achieves the critical barrier, it enters in the state of multiplicative in-crement in which the communication time has an exponential increase (double) and the process starts again from the beginning. In Figure 8 and Figure 9 we can see the logic of this module.
3.4.5. Web Application Module The web application module (WebApplicationMOD) has the responsibility to show the information processed by other modules. Moreover, it is a form of in-serting data into the system by human intervention. This module supports access from heterogeneous devices that have a rendering engine for HTML5 and CSS. To this end, it designed a project with responsive design enabling visualiza-tion in different ways and in different contexts, where it is able to adapt opti-mally to different sizes and resolutions screens. Thus, it provides a good user experience of accessing the application through smart phones, tablets or note-books [13]. In Figure 10 we can see a few web pages of the web application be-ing accessed from different devices.
3.5. Infrastructure
The necessary infrastructure for the ACMA model assumes the existence of RFID sensors connected to the network. These sensors communicate with a server through a device capable of connecting them to the network, such as a router or switch. This inference server is responsible for all the flow and man-
Figure 8. Algorithm that analyzes and generates the current network usage estimates.

L. Andrioli et al.
55
Figure 9. Algorithm that suggests the communication time frequency of sensors with da-tabase.
Figure 10. Access from heterogeneous devices to the web presentation module. agement of local data generated by one unit company. It also communicates with the external network through a security firewall, and replicates the infor-mation generated in the unit company to the central point of the units in the cloud. All described modules are running in the inference server.
The actors involved only have access to their own features previously defined in the model. The access is realized through a web browser and the request for the information can come from an internal environment of the company (inter-nal network) or external environment (external network) by the information of their credentials. In Figure 11 we can see the hardware infrastructure model proposed for a company formed by N units.
4. Prototype Implementation
Among the various Database Management Systems (DBMS), the chosen one for implementation was SQL Server. We chose SQL Server because it uses SQL

L. Andrioli et al.
56
Figure 11. Infrastructure model proposed for a company formed by N units. DBMS that implements the concepts of atomicity, consistency, isolation and durability in their transactions, ensuring the integrity and reliability of data [14]. Another important point for the decision was the compatibility with different programming languages, the large amount of documentation available and the fact that it is already widely accepted in the market. Besides, it offers easy inte-gration with Microsoft platform, especially with the .NET Framework pro-gramming language (C#) and the cloud database in the Microsoft Azure1, that was defined for the development of the prototype.
The cloud database is available through the SQL Azure resources, which runs on the Windows Azure platform. It is a set of services that provides processing power and relational data storage in the cloud. SQL Azure was chosen because the application can take advantage of various resources available, such as persis-tence of centralized data and emission of performance reports. In addition, by opting for this cloud database, the focus of development turns to the application, since it is not necessary to worry about activities related to environmental infra-structure.
The language chosen for development of applications is C#, a strongly typed language, which follows the object-oriented model and is designed to run on the .NET platform. With this choice, the application stack is easily integrated, because all of the technologies are from Microsoft environments: the database (SQL Server), development language (C#) and the database server in the cloud (Windows Azure). The system was developed with a modular standard, seeking to reinforce concepts and best practices related to object orientation. It has a strong feature of low coupling and high cohesion, as well as being open to new implementations in the future, providing an easy maintenance and integration capacity for new plugins in the system.
5. Evaluation Methodology
This section details the research method used in the article and its stages. It is an applied research because it generates knowledge for practical application ad-
1http://azure.microsoft.com/.

L. Andrioli et al.
57
dressed to the solution of specific problems. The acquired knowledge can be ap-plied within a real context.
We used two different procedures, the literature and the case study. For the literature, the work is developed based on resources already developed, such as books and scientific periodicals. It is also a case study, because it has as a diffe-rentiation the ability to handle the variety of evidence that can be identified, such as interviews and observations. Thus, the researcher approaches a real con-text [15]. The case study consists of all the information collected from the ob-served company, through questionnaires, bringing the model closer to the soft-ware requirements of the reality of a corporation.
Regarding the data collection techniques, we use two different research me-thods: (i) the qualitative, based on the company scenario that meets the condi-tions set out in the model, using questionnaires as the direct source for data col-lection with the team responsible for the activity of assets control; (ii) the quan-titative, which involves numbers and statistics accomplished through perfor-mance and load tests [15].
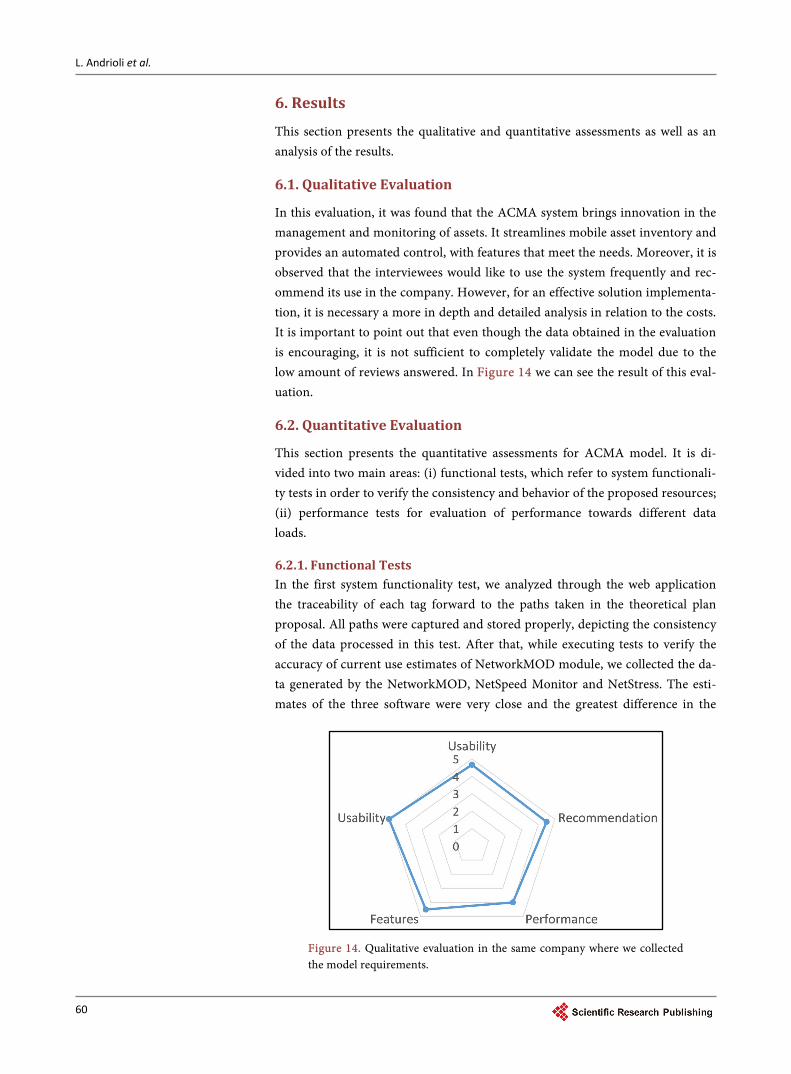
For the qualitative data, we applied a questionnaire in the same company where we sought for real needs for lifting the requirements for the application of monitoring assets. Before the application of the questionnaire, the ACMA sys-tem was presented for a manager and an analyst responsible for asset tracking activity in the company. Then we applied a questionnaire with eight questions that were classified into the following groups: usability (questions 1, 2 and 7); recommendation (questions 4 and 8); performance (question 6); features (ques-tion 5); quality (question 3). Figure 12 shows the questionnaire. The rating scale
Figure 12. Qualitative assessment questionnaire.
L. Andrioli et al.
58
used was Likert in which the interviewed specify their level of agreement with certain statements.
For quantitative evaluation of the developed prototype, it was necessary the configuration of three distinct environments: (i) the first one is in the cloud, where the display module (WebApplicationMOD) is hosted on IIS 7.0, support for MVC 5 and .NET Framework 4.5. The database is also hosted in the cloud through SQL Azure with the basic option that includes five DTU’s; (ii) the second environment is a local server, where the .NET Framework platform is configured, the basis for C# applications. It has an Intel Core i5 processor, 8GB memory with 1600 MHz, 256GB hard drive, operating system Windows Server. The CaptureMOD, DistributionMOD, NetworkMOD and ReaderMonitoring-MOD are running on that server; (iii) the latter is the environment for issuing information from the RFID sensors. For this task, we used the simulation plat-form RFID Rifidi where we simulated up tags GID-96 GEN2 and readers Alien ALR 9800.
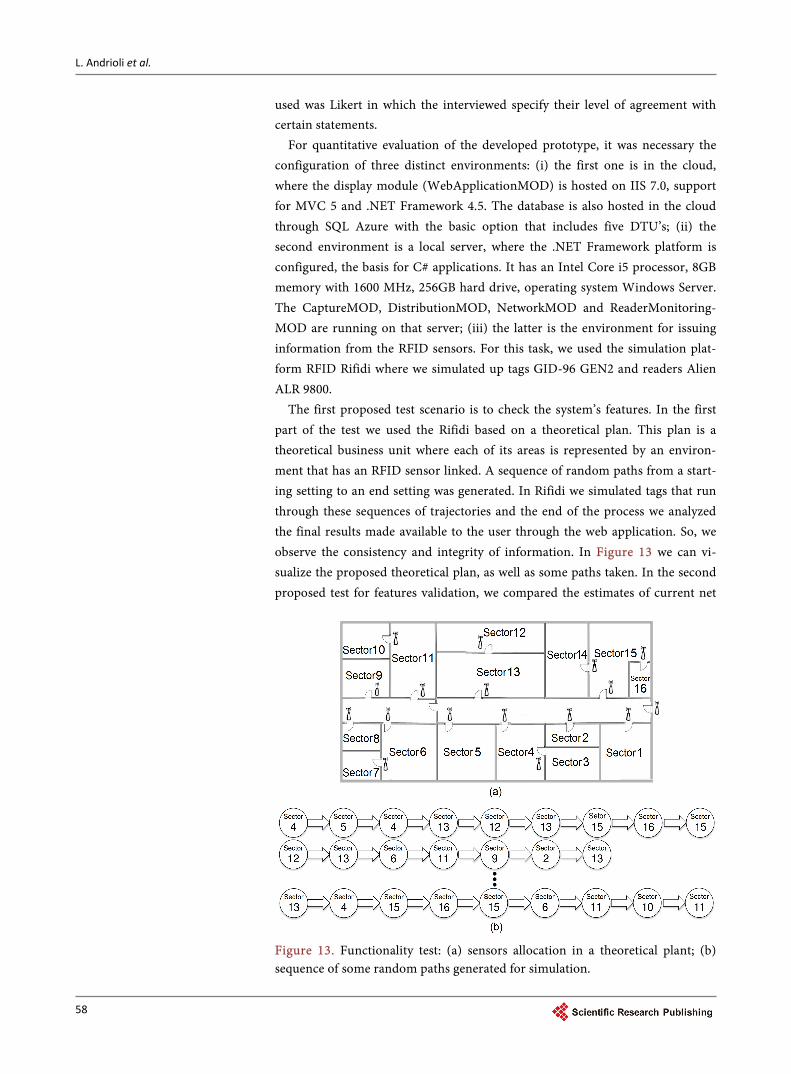
The first proposed test scenario is to check the system’s features. In the first part of the test we used the Rifidi based on a theoretical plan. This plan is a theoretical business unit where each of its areas is represented by an environ-ment that has an RFID sensor linked. A sequence of random paths from a start-ing setting to an end setting was generated. In Rifidi we simulated tags that run through these sequences of trajectories and the end of the process we analyzed the final results made available to the user through the web application. So, we observe the consistency and integrity of information. In Figure 13 we can vi-sualize the proposed theoretical plan, as well as some paths taken. In the second proposed test for features validation, we compared the estimates of current net
Figure 13. Functionality test: (a) sensors allocation in a theoretical plant; (b) sequence of some random paths generated for simulation.
L. Andrioli et al.
59
work usage generated by the NetwotkMOD of ACMA with NetSpeed Monitor2 and NetStress3. Both softwares have an acceptance in the market and have fea-tures for traffic analyzer with monitoring of traffic information in the network.
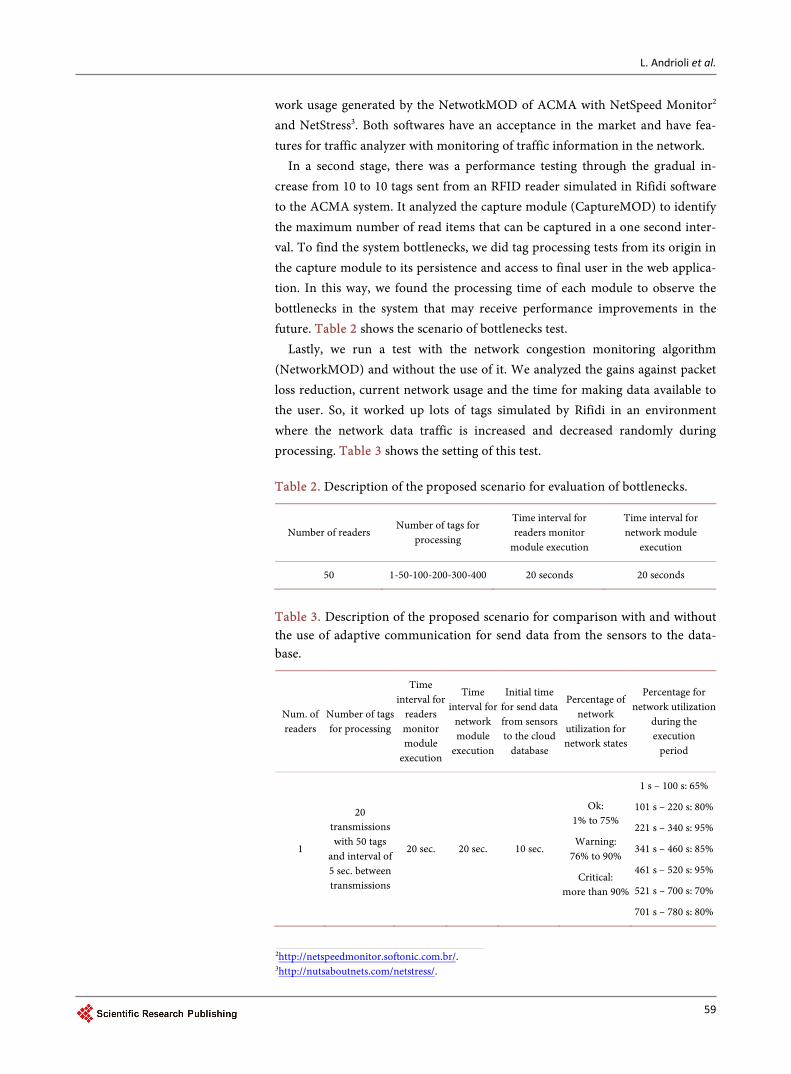
In a second stage, there was a performance testing through the gradual in-crease from 10 to 10 tags sent from an RFID reader simulated in Rifidi software to the ACMA system. It analyzed the capture module (CaptureMOD) to identify the maximum number of read items that can be captured in a one second inter-val. To find the system bottlenecks, we did tag processing tests from its origin in the capture module to its persistence and access to final user in the web applica-tion. In this way, we found the processing time of each module to observe the bottlenecks in the system that may receive performance improvements in the future. Table 2 shows the scenario of bottlenecks test.
Lastly, we run a test with the network congestion monitoring algorithm (NetworkMOD) and without the use of it. We analyzed the gains against packet loss reduction, current network usage and the time for making data available to the user. So, it worked up lots of tags simulated by Rifidi in an environment where the network data traffic is increased and decreased randomly during processing. Table 3 shows the setting of this test. Table 2. Description of the proposed scenario for evaluation of bottlenecks.
Number of readers Number of tags for
processing
Time interval for readers monitor
module execution
Time interval for network module
execution
50 1-50-100-200-300-400 20 seconds 20 seconds
Table 3. Description of the proposed scenario for comparison with and without the use of adaptive communication for send data from the sensors to the data-base.
Num. of readers
Number of tags for processing
Time interval for
readers monitor module
execution
Time interval for
network module
execution
Initial time for send data from sensors to the cloud
database
Percentage of network
utilization for network states
Percentage for network utilization
during the execution
period
1
20 transmissions with 50 tags
and interval of 5 sec. between transmissions
20 sec. 20 sec. 10 sec.
Ok: 1% to 75%
Warning: 76% to 90%
Critical: more than 90%
1 s – 100 s: 65%
101 s – 220 s: 80%
221 s – 340 s: 95%
341 s – 460 s: 85%
461 s – 520 s: 95%
521 s – 700 s: 70%
701 s – 780 s: 80%
2http://netspeedmonitor.softonic.com.br/. 3http://nutsaboutnets.com/netstress/.
L. Andrioli et al.
60
6. Results
This section presents the qualitative and quantitative assessments as well as an analysis of the results.
6.1. Qualitative Evaluation
In this evaluation, it was found that the ACMA system brings innovation in the management and monitoring of assets. It streamlines mobile asset inventory and provides an automated control, with features that meet the needs. Moreover, it is observed that the interviewees would like to use the system frequently and rec-ommend its use in the company. However, for an effective solution implementa-tion, it is necessary a more in depth and detailed analysis in relation to the costs. It is important to point out that even though the data obtained in the evaluation is encouraging, it is not sufficient to completely validate the model due to the low amount of reviews answered. In Figure 14 we can see the result of this eval-uation.
6.2. Quantitative Evaluation
This section presents the quantitative assessments for ACMA model. It is di-vided into two main areas: (i) functional tests, which refer to system functionali-ty tests in order to verify the consistency and behavior of the proposed resources; (ii) performance tests for evaluation of performance towards different data loads.
6.2.1. Functional Tests In the first system functionality test, we analyzed through the web application the traceability of each tag forward to the paths taken in the theoretical plan proposal. All paths were captured and stored properly, depicting the consistency of the data processed in this test. After that, while executing tests to verify the accuracy of current use estimates of NetworkMOD module, we collected the da-ta generated by the NetworkMOD, NetSpeed Monitor and NetStress. The esti-mates of the three software were very close and the greatest difference in the
Figure 14. Qualitative evaluation in the same company where we collected the model requirements.

L. Andrioli et al.
61
measurements has reached a range of 3%. Thus, this system functionality is con-sidered valid as regards the accuracy of the current network usage estimates. The full results of this test can be seen in Figure 15.
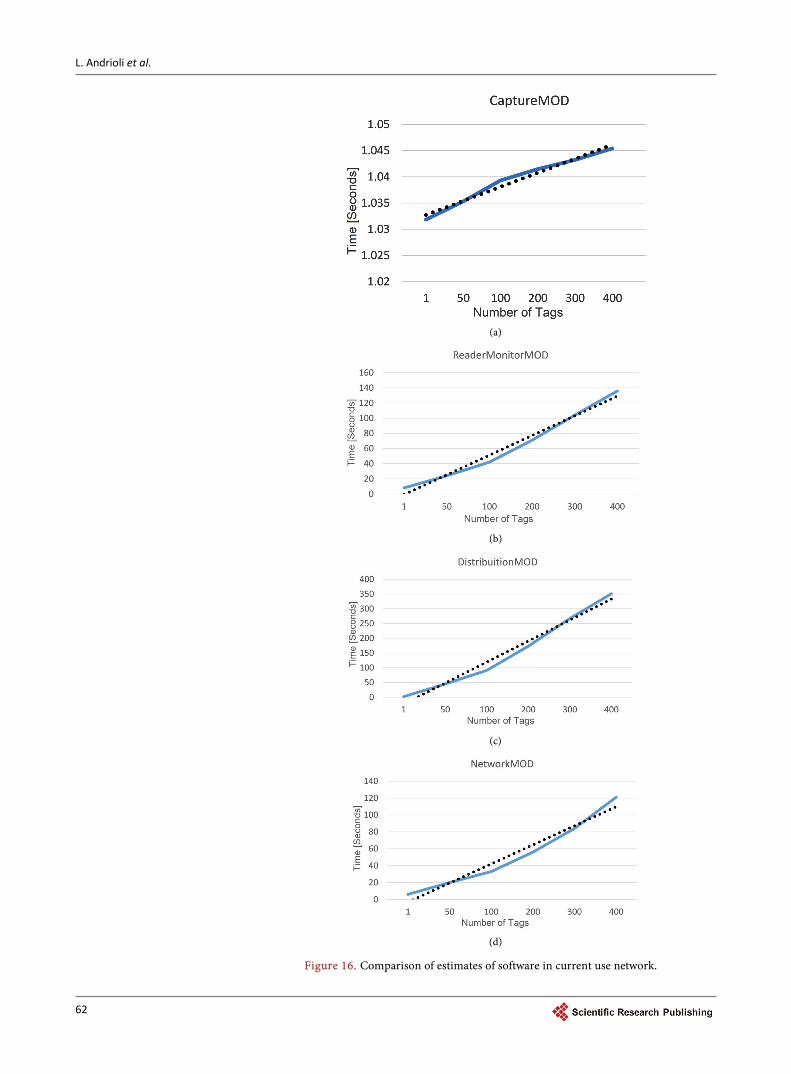
6.2.2. Performance Tests With the objective of analyzing the application performance, we captured the total execution time, in seconds, as the gradual increase in the amount of re-ceived tags in the application. It can be seen that the most effective module is CaptureMOD. In this module, there is a real need for high performance processing to provide the highest throughput possible for the data that is re-ceived. On the other hand, the formatting process ended up being costlier. The main factor for the longer processing time is explained by the need of consult-ing, processing, waiting the right time and distributing the data to several system tables. With that, it releases this data ready to be accessed by the web applica-tion. The results of these tests can be seen in Figure 16.
We have also conducted performance testing on the system to verify the ap-plication of the processing capacity within a given time interval. Therefore, we can estimate the maximum amount of tags to be captured by a particular group of readers in the same time interval. It was verified that the system is capable of capturing up to 900 tags in a range of a second in the communication of a group of readers with the application.
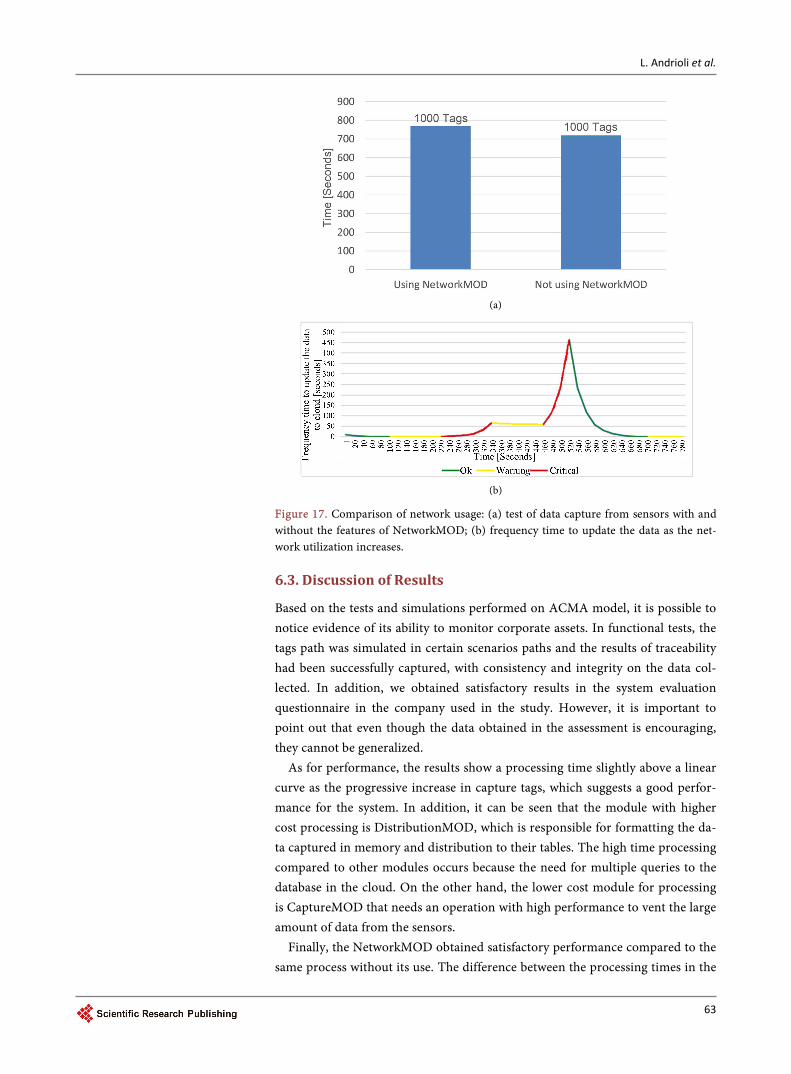
Finally, in the test of data capture from sensors to persistence in the database with and without the features of NetworkMOD, the processing with Network-MOD was 6% longer than the processing without its use. This difference is be-cause of NetworkMOD congestion control capabilities. At the time when the network utilization increases, the time of communication with the database in-creases, prolonging the time to update the data. As a benefit, there is the conges-tion avoidance and, as a result, the reduction of miscommunication, delays and packet loss. The full results of this test can be seen in Figure 17.
Figure 15. Comparison of estimates of software in current use network.
L. Andrioli et al.
62
(a)
(b)
(c)
(d)
Figure 16. Comparison of estimates of software in current use network.
L. Andrioli et al.
63
(a)
(b)
Figure 17. Comparison of network usage: (a) test of data capture from sensors with and without the features of NetworkMOD; (b) frequency time to update the data as the net-work utilization increases.
6.3. Discussion of Results
Based on the tests and simulations performed on ACMA model, it is possible to notice evidence of its ability to monitor corporate assets. In functional tests, the tags path was simulated in certain scenarios paths and the results of traceability had been successfully captured, with consistency and integrity on the data col-lected. In addition, we obtained satisfactory results in the system evaluation questionnaire in the company used in the study. However, it is important to point out that even though the data obtained in the assessment is encouraging, they cannot be generalized.
As for performance, the results show a processing time slightly above a linear curve as the progressive increase in capture tags, which suggests a good perfor-mance for the system. In addition, it can be seen that the module with higher cost processing is DistributionMOD, which is responsible for formatting the da-ta captured in memory and distribution to their tables. The high time processing compared to other modules occurs because the need for multiple queries to the database in the cloud. On the other hand, the lower cost module for processing is CaptureMOD that needs an operation with high performance to vent the large amount of data from the sensors.
Finally, the NetworkMOD obtained satisfactory performance compared to the same process without its use. The difference between the processing times in the
L. Andrioli et al.
64
proposed scenario was 6% better with its use. This difference happens due to its concern with network congestion. When the network usage increases, the fre-quency time for communication with the database decrease the time to update the data. Besides, we can see that with NetworkMOD we can get better quality in network usage avoiding a negative impact on other applications running on pa-rallel in the same network, because we have a reduction in delay and packet loss, contributing to the reliability and data integrity.
7. Conclusions
The adoption of an RFID system for control and monitoring of corporate assets has a positive impact on business. It contributes to the achievement of the objec-tives, increasing the company’s competitiveness, improving organizational effi-ciency and contributing to the sustainability of the business. In the literature, we studied and raised concepts and characteristics of RFID technology in the con-text of IoT. There was the possibility of using RFID sensors under control and monitoring of property assets. Thus, it is possible to improve the asset manage-ment by increasing speed in operations, as well as the accuracy and reliability of the information collected.
Different from the work proposed in [7] [8] [9] and [10], the proposed model does not just use the RFID technology for automatic identification of property assets and identification of the location and cost center, but also presents a dif-ferential adaptive algorithm to control the update interval of the data coming from RFID sensors. This algorithm is based on the TCP congestion control and is used here to obtain reliability and integrity and to avoid congestion in the network when data is being transferred from one company to the centralized administration point cloud. More precisely, ACMA is capable of generating cur-rent network usage estimates and performing adaptive and transparent reconfi-gurations in communication time between the RFID sensors and the database to avoid the occurrence of congestion.
Both quantitative and qualitative evaluation showed a positive feedback. De-spite of the fact that the quantitative assessment cannot be generalized due to the low number of questionnaires, we found encouraging results in which the ACMA system was recommended and performed with the necessary features for a correct and effective monitoring of corporate assets. As for performance test-ing, we obtained a performance situated slightly above the linear curve, with ca-pacity to process up to 900 tags per second, suggesting a sufficient capacity to control active. Using the proposed congestion prevention feature, no congestion occurred, and consequently, we avoided delay and packet loss during the process. ACMA is structured using well-defined modules, with high cohesion and low coupling, leaving the system open to new implementations in the future by inserting new features or plug ins. Finally, the web application was developed with a responsive design, aiming thus a better experience to the user who can access it from devices with different screen sizes and resolutions.
Regarding future works, it is possible to use other metrics besides communi-
L. Andrioli et al.
65
cation in adaptation algorithm so that the model reacts to processing overloads and network simultaneously. Also, it is possible to think of the use of a distri-buted database to solve the fault scalability and bottleneck in the system due to the centralized point in the cloud. Finally, we want to implement the ACMA system in a real business environment to collect data and assess the functioning over time.
Acknowledgements
This work was partially supported by the following Brazilian agencies: CNPq, FAPERGS and CAPES.
References [1] Swedberg, C. (2015) Target Announces Nationwide RFID Rollout. RFID Journal.
http://www.rfidjournal.com/articles/view?13060
[2] Zhang, M., Sun, F. and Cheng, X. (2012) Architecture of Internet of Things and Its Key Technology Integration Based-On RFID. Proceedings of Fifth International Symposium on Computational Intelligence and Design, Hangzhou, 28-29 October 2012, 294-297. https://doi.org/10.1109/iscid.2012.81
[3] Networking, C.V. (2016) Cisco Global Cloud Index: Forecast and Methodology 2015-2020 (White Paper). Cisco Public, San Jose.
[4] Mell, P.M. and Grance, T. (2011) SP 800-145. The NIST Definition of Cloud Com-puting. Technical Report. National Institute of Standards and Technology, Gai-thersburg.
[5] Supriya, B.A. and Djearamane, I. (2013) RFID Based Cloud Supply Chain Manage-ment. International Journal of Scientific & Engineering Research, 4, 2157-2159.
[6] Dresch, A., Efrom, D.R. and Grumovski, D. (2008) Sistema de Controle de Pa-trimônio via RFID. E-Tech Atualidades Tecnológicas para a Competitividade In-dustrial, 1, 47-57.
[7] Dubey, A.K. and Sinha, A. (2015) Congestion Control for Self Similar Traffic in Wireless Sensor Network. Proceedings of Eighth International Conference on Con-temporary Computing, Noida, 20-22 August 2015, 331-335. https://doi.org/10.1109/ic3.2015.7346702
[8] Jing, X. and Tang, P. (2013) Research and Design of the Intelligent Inventory Man-agement System Based on RFID. Proceedings of Sixth International Symposium on Computational Intelligence and Design, Hangzhou, 28-29 October 2013, 8-11. https://doi.org/10.1109/ISCID.2013.117
[9] Chattopadhyay, A., Prabhu, B.S. and Gadh, R. (2011) Web based RFID Asset Man-agement Solution Established on Cloud Services. Proceedings of 2011 IEEE Interna-tional Conference on RFID-Technologies and Applications, Sitges, 15-16 September 2011, 292-299. https://doi.org/10.1109/RFID-TA.2011.6068652
[10] McGreen, B. and Xie, Z. (2011) Driving New Insights in Asset Utilisation by Utilis-ing RFID Technology to Deliver Asset Status Updates in Real-Time. Proceedings of IET and IAM Asset Management Conference 2011, London, 30 November-1 De-cember 2011, 1-6.
[11] Bhargava, N., Bhargava, R., Mathuria, M., Gupta, S. and Jyotiyana, K.K. (2013) Analysis of Different Congestion Avoidance Algorithms. IRACST—International Journal of Computer Networks and Wireless Communications, 3, 32-36.
[12] Yang, P., Luo, W., Xu, L., Deogun, J. and Lu, Y. (2011) TCP Congestion Avoidance

L. Andrioli et al.
66
Algorithm Identification. Proceedings of 2011 31st International Conference on Distributed Computing Systems, Minneapolis, 20-24 June 2011, 310-321. https://doi.org/10.1109/ICDCS.2011.27
[13] Majid, E.S.A., Kamaruddin, N. and Mansor, Z. (2015) Adaptation of Usability Prin-ciples in Responsive Web Design Technique for E-Commerce Development. Pro-ceedings of 2015 International Conference on Electrical Engineering and Informat-ics, Denpasar, 19-21 August 2015, 726-729. https://doi.org/10.1109/ICEEI.2015.7352593
[14] Bartholomew, D. (2010) SQL vs. NoSQL. Linux Journal, 2010, 4.
[15] Gil, A.C. (2002) Como Elaborar Projetos de Pesquisa. São Paulo, 5, 61.
Submit or recommend next manuscript to SCIRP and we will provide best service for you:
Accepting pre-submission inquiries through Email, Facebook, LinkedIn, Twitter, etc. A wide selection of journals (inclusive of 9 subjects, more than 200 journals) Providing 24-hour high-quality service User-friendly online submission system Fair and swift peer-review system Efficient typesetting and proofreading procedure Display of the result of downloads and visits, as well as the number of cited articles Maximum dissemination of your research work
Submit your manuscript at: http://papersubmission.scirp.org/ Or contact [email protected]