Oban - Glasgow Rail Service Enhancements - Hitrans
60
Oban - Glasgow Rail Service Enhancements Demand Forecast and Economic Appraisal January 2009 Final Report
Transcript of Oban - Glasgow Rail Service Enhancements - Hitrans

Oban - Glasgow Rail Service Enhancements
Demand Forecast and Economic Appraisal
January 2009
Final Report

HITRANS Oban - Glasgow Rail Service Enhancements Demand Forecast and Economic Appraisal January 2009 Final Report
Halcrow Group Limited

Halcrow Group Limited Arndale House Otley Road Headingley Leeds LS6 2UL Tel +44 (0)113 220 8220 Fax +44 (0)113 274 2924 www.halcrow.com Halcrow Group Limited has prepared this report in accordance with the instructions of their client, HITRANS, for their sole and specific use. Any other persons who use any information contained herein do so at their own risk. © Halcrow Group Limited 2009
HITRANS Oban - Glasgow Rail Service Enhancements Demand Forecast and Economic Appraisal January 2009 Final Report
Halcrow Group Limited

Halcrow Group Limited Arndale House Otley Road Headingley Leeds LS6 2UL Tel +44 (0)113 220 8220 Fax +44 (0)113 274 2924 www.halcrow.com

HITRANS Oban - Glasgow Rail Service Enhancements Demand Forecast and Economic Appraisal
Contents Amendment Record This report has been issued and amended as follows: Issue Revision Description Date Signed
1 0 Draft Report 15/8/08 EGS / DP
2 0 Final Draft Report 13/1/09 EGS
3 0 Final Report 16/1/09 EGS

Contents
1 Study Background, Context and Objectives 1 1.2 Study Context 2 1.3 Study Overview 3 1.4 Methodology 4 1.5 Report Structure 5
2 Methodology 7 2.1 Introduction 7 2.2 Methodology: Demand Forecasting 7 2.3 MOIRA 7 2.4 Empirical Method 8 2.5 Growth Factors 8 2.6 Methodology: Economic Appraisal 10
3 Demand Forecasting 11 3.1 Introduction 11 3.2 Base Demand 11 3.3 Timetabled Service Enhancements 13 3.4 Assumptions 13 3.5 Demand Forecast 14 3.6 Empirical Assessment 21 3.7 Summary and Comments 22
4 Economic and Financial Appraisal 24 4.1 Introduction 24 4.2 Key Assumptions 24 4.3 Costs 25 4.4 Benefits and Revenues 26 4.5 Financial Appraisal 28 4.6 Economic Appraisal 30 4.7 Summary and Comments 37
5 Conclusions 38 5.1 Summary 38 5.2 Conclusions and Recommendations 39
6 Annex of Supplementary Information 40

6.1 List of Assumptions 40 6.2 NATA Tables 44

Doc No 1 Rev: 0 Date: October 2008 1 U:\Projects\CTDAKA - CTDAKZ\CTDAKI - Glasgow - Oban Service Enhancements\DOCS\Outgoing\20090115 Oban - Glasgow RSE Final Report + Covers.doc
1 Study Background, Context and Objectives
1.1.1 The Oban – Glasgow service operates on part of the West Highland line. The West Highland line runs from Glasgow Queen Street up to Crianlarich where it splits into two branches. One branch goes to Oban whereas the other heads northwards to Fort William and Mallaig. The service calls at a number of intermediate stations which serve settlements along the route. Figure 1.1 provides a map of the West Highland lines.
Figure 1-1: West Highland Lines
1.1.2 A summary of the current service provision follows:
• Three trains per day from Glasgow Queen Street to Oban and Fort William/Mallaig. Services are combined as far as Crianlarich, where the

Doc No 1 Rev: 0 Date: October 2008 2 U:\Projects\CTDAKA - CTDAKZ\CTDAKI - Glasgow - Oban Service Enhancements\DOCS\Outgoing\20090115 Oban - Glasgow RSE Final Report + Covers.doc
train is split, with one part continuing to Oban and the other to Fort William/Mallaig;
• Three trains per day between Oban and Fort William/Mallaig to Glasgow Queen Street, with the trains joining at Crianlarich to form a combined service continuing to Glasgow Queen Street; and,
• An additional early morning service between Arrochar and Glasgow Queen Street arriving in the peak hour.
1.1.3 There is an additional overnight sleeper service from London Euston which
operates up to Fort William and calls at a number of the intermediate stations on the Queen Street – Crianlarich stretch of the line.
1.1.4 There is a need for an increase in the number of services operating on the Oban – Glasgow route as populations have risen along this corridor. Oban is the largest settlement in Scotland served by the minimum rail service of three trains per day. In addition there is a high level of tourism in the area with Oban Tourist Information Centre being the busiest in Scotland after Edinburgh.
1.1.5 An increase in the number of rail services operating along the route will provide a number of benefits to residents along the corridor as well as to people from other parts of the country, especially tourists. The additional services will provide more commuting possibilities into Glasgow due to the wider spread of departures at both ends. At the Oban end of the line there will be more opportunities to link in to the ferry service from Oban to islands such as Mull and Barra.
1.1.6 A new timetable has been developed by Habtrans Consultancy Ltd (Habtrans) to take effect in December 2009 which will aim to improve the service frequency on the Oban – Glasgow line from 3 to 5 trains per day. This is in accordance with the HITRANS Regional Transport Strategy which states the improvement of public transport frequency as a goal. One of these additional services is an extension of the current early morning service between Arrochar and Glasgow Queen Street, providing commuting opportunities into Glasgow. The full details of the new timetable are given in a later section.
1.2 Study Context 1.2.1 In 2006, baseline rail traffic growth forecasts were published by the Highlands and
Islands Enterprise (HIE) in association with the Highland Rail Partnership, HITRANS and Transport Scotland. These forecasts were based upon population

Doc No 1 Rev: 0 Date: October 2008 3 U:\Projects\CTDAKA - CTDAKZ\CTDAKI - Glasgow - Oban Service Enhancements\DOCS\Outgoing\20090115 Oban - Glasgow RSE Final Report + Covers.doc
growth, developments, economic performance and plans for the level of future rail services. Both Optimistic (Higher) and Pessimistic (Lower) growth scenarios were produced up until 2020. These forecasts have previously been used by Halcrow as the basis for a number of studies examining the impact of improvements to the rail network in the Highlands of Scotland.
1.2.2 Last year Halcrow undertook a similar appraisal of proposed changes to the Far
North timetable. Work undertaken as part of this previous study has informed the current project.
1.3 Study Overview 1.3.1 HITRANS has commissioned Halcrow to undertake this study with the aim of
producing a forecast of the change in demand due to improving the timetable and to use this forecast to undertake a Transport Economic Efficiency (TEE) appraisal of the proposed timetable enhancements.
1.3.2 Whilst the TEE analysis is compliant with the Scottish Executive’s STAG
guidance, this study does not explicitly consider at this stage the Executive’s other objectives for transport investment: safety, environment, integration and social inclusion and accessibility.
1.3.3 The study examines the change in demand on both the Oban and Mallaig branches
of the West Highland lines. Higher and lower forecasts have been generated using the higher and lower growth scenarios developed for HIE. In line with previous studies, it is thought that the provision of an upper and lower range of forecasts will be more useful than a single central business case. Full TEE appraisal tables are provided for the scheme.

Doc No 1 Rev: 0 Date: October 2008 4 U:\Projects\CTDAKA - CTDAKZ\CTDAKI - Glasgow - Oban Service Enhancements\DOCS\Outgoing\20090115 Oban - Glasgow RSE Final Report + Covers.doc
1.4 Methodology 1.4.1 The MOIRA rail demand forecasting tool was used to estimate demand generated
by the timetable improvements. MOIRA is the industry standard forecasting tool and is based upon PDFH and LENNON data.
1.4.2 The standard PDFH elasticity based approach is not suitable for this study as
PDFH should only be used when looking at changes to regular services operating at a frequency of more than one train every 3 hours. The West Highlands timetable is not at this level and so MOIRA was used as the primary forecasting tool as recommended by PDFH.
1.4.3 In addition to the change in demand MOIRA also provides the scheme transport
benefits in terms of value of time saved. This time saving was the building block for undertaking the economic appraisal of the scheme.
1.4.4 An overview of the methodology is provided within Figure 1.2 and more detail is
given in Chapter 2.
Figure 1-2: Methodology Overview

Doc No 1 Rev: 0 Date: October 2008 5 U:\Projects\CTDAKA - CTDAKZ\CTDAKI - Glasgow - Oban Service Enhancements\DOCS\Outgoing\20090115 Oban - Glasgow RSE Final Report + Covers.doc
Timetable change
Change to operating costs
Assessed using MOIRA
Growth factors
Economic Appraisal
1.5 Report Structure 1.5.1 The rest of the report is made up of five more chapters as follows:
• Chapter Two contains the method;
• Chapter Three outlines the demand forecasting component of the study;
• Chapter Four contains the results of the economic and financial appraisal of the scheme;
• Chapter Five contains the conclusions of the study; and
• Chapter Six is an annex containing the updated underlying growth projections from the HIE study previously carried out by Halcrow1 as well as other assumptions and full NATA style tables.
1 Highlands and Islands Rail Traffic Growth Projections, 2005

Doc No 1 Rev: 0 Date: October 2008 6 U:\Projects\CTDAKA - CTDAKZ\CTDAKI - Glasgow - Oban Service Enhancements\DOCS\Outgoing\20090115 Oban - Glasgow RSE Final Report + Covers.doc

Doc No 1 Rev: 0 Date: October 2008 7 U:\Projects\CTDAKA - CTDAKZ\CTDAKI - Glasgow - Oban Service Enhancements\DOCS\Outgoing\20090115 Oban - Glasgow RSE Final Report + Covers.doc
2 Methodology
2.1 Introduction 2.1.1 This chapter outlines the approach and assumptions that were used to undertake
the study. 2.2 Methodology: Demand Forecasting 2.2.1 The first study task was to forecast the change in rail demand at each of the
stations affected by the timetable improvements. Increasing service frequency will mean that more demand is created for the services. This demand will come from two sources: firstly existing users of other modes switching to the rail service as it becomes more attractive; and secondly completely new trips will be generated.
2.2.2 Two methods were used to add confidence to the forecasts. The first method used
the forecasting tool MOIRA. The second method used an empirical approach based on work undertaken with historical timetables and passenger numbers in the North Highlands Timetable Improvements Study carried out by Halcrow in 2007. The two methods are discussed in more detail below.
2.3 MOIRA 2.3.1 MOIRA is a software package which is based upon LENNON data and the
principles within PDFH. It forecasts the change in demand resulting from improvements to existing timetables. MOIRA is the industry standard tool for undertaking such demand forecasts. The version of MOIRA used within this study contains the 2007/08 passenger numbers and existing timetables.
2.3.2 The proposed timetables were input into MOIRA and the software was run to
obtain a number of outputs. The key results given by MOIRA are the change in passenger numbers and revenue and the saving in generalised journey time resulting from improving the timetable.
2.3.3 The MOIRA model was only run for the weekday timetable and demand. The
summer version containing summer timetables and demand was run for the four months where the summer service operates. This was added to the results from running the winter timetable with winter demand.

Doc No 1 Rev: 0 Date: October 2008 8 U:\Projects\CTDAKA - CTDAKZ\CTDAKI - Glasgow - Oban Service Enhancements\DOCS\Outgoing\20090115 Oban - Glasgow RSE Final Report + Covers.doc
2.3.4 The research underlying MOIRA was undertaken on lines where the service operating frequency is at least one train every two hours. The recommendation is that MOIRA does not fully assess the impacts of the exact timings of services (i.e. for children travelling to school, ferry timings) and so the results are to be treated with caution when examining changes to infrequent services. To add confidence that MOIRA is forecasting correctly for the parts of the line where service frequencies are low a second empirical approach to demand forecasting was undertaken.
2.4 Empirical Method 2.4.1 Within the North Highlands Timetable Enhancement Study undertaken by
Halcrow in 2007 historical timetables and passenger numbers were examined to obtain an average uplift in demand resulting from an increase in service frequency on low frequency lines. Changes on the North Highland lines were used as the basis for this work and a figure of 5.4% uplift in demand for an increase in frequency of one train per day was obtained.
2.4.2 This increase was used within the current study to produce a second demand
forecast to back up the MOIRA work. 2007/08 LENNON data was used to create a matrix of trips within the West Highland lines. The increase in trip frequency between each of the station pairs was obtained and the appropriate uplift factor applied. This method was only applied to stations north of Helensburgh as service frequencies within the Glasgow area are much higher which means that the uplift factor is not suitable for use (as it is only applicable to low frequency lines).
2.5 Growth Factors 2.5.1 In 2005 Halcrow produced a set of rail growth projections for each of the lines in
the Highlands and Islands area. This study was commissioned by HIE and the factors have subsequently been used in a number of studies.
2.5.2 These factors are provided at a station level and under an optimistic and
pessimistic projection. As the factors were produced three years ago the forecasts were updated using more up to date GDP growth assumptions. Chapter 6 contains the growth projections for each of the stations on the West Highland Lines for both growth scenarios. The total growth figures are contained within Table 2.1.

Doc No 1 Rev: 0 Date: October 2008 9 U:\Projects\CTDAKA - CTDAKZ\CTDAKI - Glasgow - Oban Service Enhancements\DOCS\Outgoing\20090115 Oban - Glasgow RSE Final Report + Covers.doc
Table 2-1: Average Passenger Growth Rates
Year Pessimistic Annual
Growth Rate Optimistic Annual
Growth Rate 2005/06 2.8% 3.9% 2006/07 2.3% 3.3% 2007/08 1.5% 2.5% 2008/09 1.3% 2.3% 2009/10 2.3% 3.3% 2010/11 5.9% 10.2% 2011/12 2.3% 3.0% 2012/13 2.1% 2.8% 2013/14 1.9% 2.6% 2014/15 1.7% 2.3% 2015/16 1.7% 2.3% 2016/17 1.9% 2.4% 2017/18 2.2% 2.4% 2018/19 2.2% 2.4% 2019/20 2.2% 2.4%
15 Year % 40.3% 60.1%

Doc No 1 Rev: 0 Date: October 2008 10 U:\Projects\CTDAKA - CTDAKZ\CTDAKI - Glasgow - Oban Service Enhancements\DOCS\Outgoing\20090115 Oban - Glasgow RSE Final Report + Covers.doc
2.5.3 The growth factors were applied to the base year demand forecast to obtain the forecast of demand over the coming years. After 2020 it is assumed that no further growth occurs. This assumption was made to ensure that the appraisal results are robust.
2.6 Methodology: Economic Appraisal 2.6.1 The final stage of the methodology was to carry out an economic appraisal of the
proposed timetable enhancements and hence produce a Transport Economic Efficiency (TEE) table in line with STAG2.
2.6.2 In order to undertake this appraisal the costs and benefits of the improvements
were quantified. The quantifiable benefits come in the form of the generalised journey time saved, with new users obtaining half the benefits of existing users (following the rule of a half contained within STAG).
2.6.3 The additional costs of operating the new timetable are estimated to provide the
cost elements for the appraisal process. These costs are mainly taken from the Habtrans report and professional experience and fall into three categories:
• Mileage Based Costs: As there will be a higher annual rolling stock mileage
operating costs in the form of fuel and track access charges will increase accordingly.
• Train Lease Costs: An additional train will need to be leased during the winter months to operate the new timetable.
• Staffing Costs: The additional services will need to be staffed by additional drivers and conductors. This will lead to an increase in the annual wage costs.
2 Scottish Transport Appraisal Guidance

Doc No 1 Rev: 0 Date: October 2008 11 U:\Projects\CTDAKA - CTDAKZ\CTDAKI - Glasgow - Oban Service Enhancements\DOCS\Outgoing\20090115 Oban - Glasgow RSE Final Report + Covers.doc
3 Demand Forecasting
3.1 Introduction 3.1.1 A demand forecast has been prepared for all stations appearing in the West
Highlands timetable 2008 under both optimistic (higher) and pessimistic (lower) demand scenarios. The forecasts are derived using the methodology outlined in Chapter 2 of this report and incorporate the impact of the timetable change and underlying rail growth in the region.
3.2 Base Demand 3.2.1 It is necessary to prepare an accurate base case demand in order to effectively
forecast demand into the future. The industry standard LENNON ticket data was provided by First ScotRail for the purpose of this task, including ticket sales data for all stations within the study area to all other stations in the mainland UK.
3.2.2 The derived base demand data set includes flows to and from all stations within the study area and those to and from study area stations to all other stations in mainland Great Britain. Stations not in the study area are classified as ‘external stations’ in this report.
3.2.3 A simple process of removing double counted entries from the LENNON data and a summation was used to derive the total number of journeys between two stations. This data is then summed to provide total entries and exits at each station3.
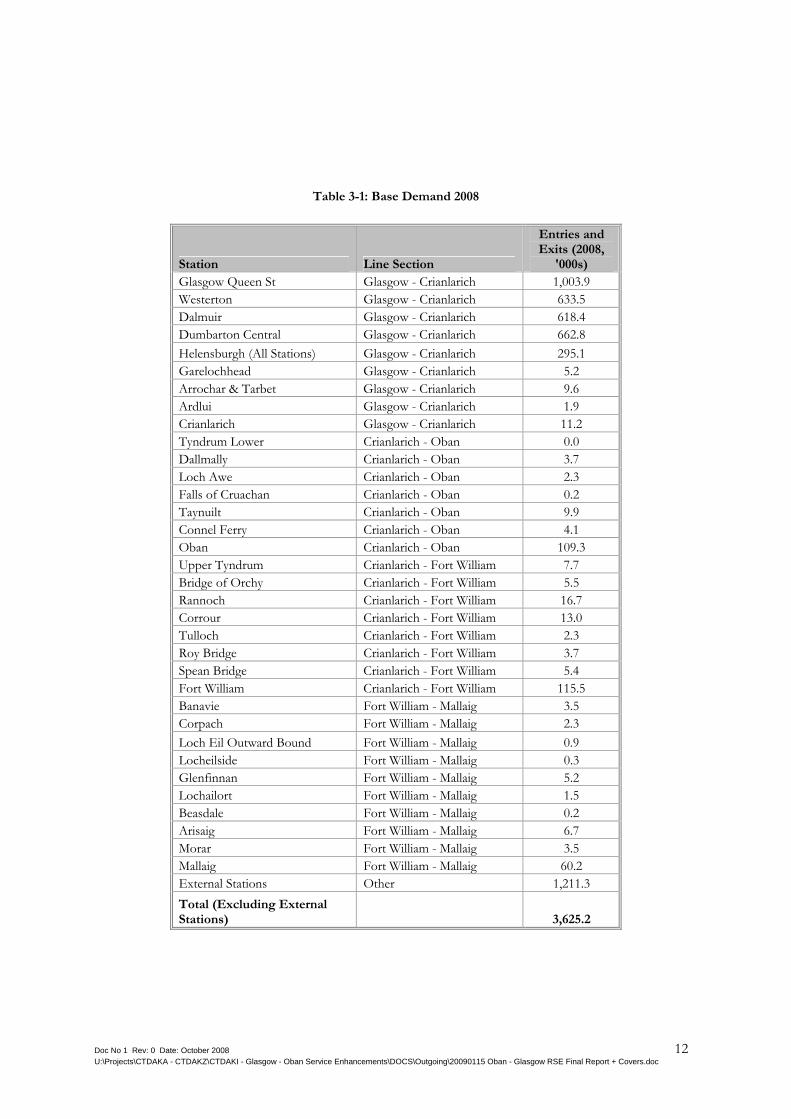
3.2.4 Table 3.1 shows the derived demand for each station in the study area. Note that demand at Tyndrum Lower and Upper Tyndrum has been estimated using the ratio 0.002:0.998.
3 Note that total boardings and alightings at a station may differ from entries and exits. This is because entries and exits do not account for interchange demand.
Doc No 1 Rev: 0 Date: October 2008 12 U:\Projects\CTDAKA - CTDAKZ\CTDAKI - Glasgow - Oban Service Enhancements\DOCS\Outgoing\20090115 Oban - Glasgow RSE Final Report + Covers.doc
Table 3-1: Base Demand 2008
Station Line Section
Entries and Exits (2008,
'000s) Glasgow Queen St Glasgow - Crianlarich 1,003.9 Westerton Glasgow - Crianlarich 633.5 Dalmuir Glasgow - Crianlarich 618.4 Dumbarton Central Glasgow - Crianlarich 662.8 Helensburgh (All Stations) Glasgow - Crianlarich 295.1 Garelochhead Glasgow - Crianlarich 5.2 Arrochar & Tarbet Glasgow - Crianlarich 9.6 Ardlui Glasgow - Crianlarich 1.9 Crianlarich Glasgow - Crianlarich 11.2 Tyndrum Lower Crianlarich - Oban 0.0 Dallmally Crianlarich - Oban 3.7 Loch Awe Crianlarich - Oban 2.3 Falls of Cruachan Crianlarich - Oban 0.2 Taynuilt Crianlarich - Oban 9.9 Connel Ferry Crianlarich - Oban 4.1 Oban Crianlarich - Oban 109.3 Upper Tyndrum Crianlarich - Fort William 7.7 Bridge of Orchy Crianlarich - Fort William 5.5 Rannoch Crianlarich - Fort William 16.7 Corrour Crianlarich - Fort William 13.0 Tulloch Crianlarich - Fort William 2.3 Roy Bridge Crianlarich - Fort William 3.7 Spean Bridge Crianlarich - Fort William 5.4 Fort William Crianlarich - Fort William 115.5 Banavie Fort William - Mallaig 3.5 Corpach Fort William - Mallaig 2.3 Loch Eil Outward Bound Fort William - Mallaig 0.9 Locheilside Fort William - Mallaig 0.3 Glenfinnan Fort William - Mallaig 5.2 Lochailort Fort William - Mallaig 1.5 Beasdale Fort William - Mallaig 0.2 Arisaig Fort William - Mallaig 6.7 Morar Fort William - Mallaig 3.5 Mallaig Fort William - Mallaig 60.2 External Stations Other 1,211.3 Total (Excluding External Stations) 3,625.2

Doc No 1 Rev: 0 Date: October 2008 13 U:\Projects\CTDAKA - CTDAKZ\CTDAKI - Glasgow - Oban Service Enhancements\DOCS\Outgoing\20090115 Oban - Glasgow RSE Final Report + Covers.doc
3.2.5 The totals in the table have been audited using the Office of the Rail Regulator’s (ORR) Station Usage data 2006-07. All stations can be broadly reconciled against these figures with the exception of Glasgow Queen Street and Helensburgh. The demand figures for these stations reported in Table 3.1 are considerably less than observed demand at these stations. This can be attributed to:
• Glasgow Queen Street: a file of LENNON data for this station was not provided and as such the demand figure in our base excludes trips from Glasgow to external stations;
• Helensburgh: tickets for this station are attributed to Helensburgh BR, Upper or Central in the LENNON data and in MOIRA. The discrepancy is likely to be caused by different allocation of these tickets to Helensburgh Upper and Helensburgh Central in MOIRA and in the LENNON data set. However, the lower figure reported in Table 3.1 is unlikely to have a detrimental effect on the output of the appraisal.
3.2.6 The base case provides a reference on which to forecast demand.
3.3 Timetabled Service Enhancements 3.3.1 The proposed timetable enhancements are taken from the Glasgow – Oban
Service Enhancements Study undertaken by Habtrans at the start of 2008. The timetable that has been tested within this study is Option 2b within that report.
3.3.2 The main proposed changes are the increase of services between Glasgow and Oban from three to five trains per day throughout the year. This provides a better spread of services throughout the day. An early morning arrival at Glasgow (an extension of the existing Arrochar to Glasgow Queen Street service) coupled with a late afternoon departure leads to more opportunities for commuting.
3.3.3 In addition the later evening departure from Glasgow improves connections from the south linking with services from Edinburgh and London.
3.4 Assumptions 3.4.1 The demand forecast has been prepared with the following assumptions:
• LENNON data is the most appropriate source of data to determine demand on each flow and therefore is used to produce a base demand matrix;

Doc No 1 Rev: 0 Date: October 2008 14 U:\Projects\CTDAKA - CTDAKZ\CTDAKI - Glasgow - Oban Service Enhancements\DOCS\Outgoing\20090115 Oban - Glasgow RSE Final Report + Covers.doc
• MOIRA is the most appropriate tool by which to determine demand change based on a timetable change and therefore is used to determine an uplift on the base demand for the timetable change;
• As MOIRA does not report all flows, a demand uplift is derived from the MOIRA output to be applied to base case demand to forecast the impact of the timetable change on demand;
• The appropriate service related demand uplift factor is applied to flows subsequent to the timetable change in a consistent manner;
• General demand growth is taken from Halcrow’s Highlands and Islands Rail Traffic Growth Projections report (2005) – updated for recent economic events – and applied to each flow based on the ‘producer’4 station. An optimistic scenario of higher demand growth and a pessimistic scenario of lower demand growth are forecast;
• Demand growth is assumed to be 0% per annum post-2020; and • Demand ramp up is not assessed.
3.5 Demand Forecast 3.5.1 The overall results of the demand forecast in the study region are reported in
Tables 3.2 and 3.3 for a selection of key years.
Table 3-2: Total Journeys in Study Area – Optimistic Demand
Journeys ('000s) - Optimistic Demand 2008 2009 2010 2015 2020 Total Journeys Do-Minimum 2,418 2,463 2,532 3,053 3,428 Central Case 2,418 2,463 2,544 3,067 3,444 Increment 0 0 12 14 16 CAGR Do-Minimum 1.85% 2.82% 3.81% 2.35% Central Case 1.85% 3.29% 3.81% 2.34%
4 The ‘producer’ is the station at which a single or return trip starts.

Doc No 1 Rev: 0 Date: October 2008 15 U:\Projects\CTDAKA - CTDAKZ\CTDAKI - Glasgow - Oban Service Enhancements\DOCS\Outgoing\20090115 Oban - Glasgow RSE Final Report + Covers.doc
Table 3-3: Total Journeys in Study Area - Pessimistic Demand
Journeys ('000s) - Pessimistic Demand 2008 2009 2010 2015 2020 Total Journeys Do-Minimum 2,418 2,447 2,501 2,868 3,184 Central Case 2,418 2,447 2,512 2,881 3,199 Increment 0 0 12 13 15 CAGR Do-Minimum 1.20% 2.18% 2.78% 2.11% Central Case 1.20% 2.65% 2.78% 2.11%
3.5.2 The tables show that demand is expected to grow between 1.8 and 3.8% annually between the years 2008 and 2020 in the optimistic demand scenario, representing an increase in demand over the base of 1,026,000. The result of the timetable change is a higher growth rate of 3.3% between 2009 and 2010, implying that the timetable increases the total number of journeys by 12,000 or 0.47%. Whilst the demand growth in general is less under the pessimistic demand scenario assumptions, the impact of the timetable change in similar at 0.47% between 2009 and 2010.
3.5.3 However, Tables 3.2 and 3.3 show the growth in the study area as a whole including flows that are only marginally affected or not affected at all by the timetable change. Tables 3.4 to 3.7 show the impact on station entries and exits5 of the timetable change on different sections of the study area rail network.
5 Note that station entries and exits are expected to be twice the number of journeys.

Doc No 1 Rev: 0 Date: October 2008 16 U:\Projects\CTDAKA - CTDAKZ\CTDAKI - Glasgow - Oban Service Enhancements\DOCS\Outgoing\20090115 Oban - Glasgow RSE Final Report + Covers.doc
Table 3-4: Station Entries and Exits ('000s) by Corridor – Optimistic Demand
Station Entries and Exits ('000s) - Optimistic Demand 2008 2009 2010 2015 2020 Do-Minimum - Entries and Exits Glasgow - Crianlarich 3,242 3,299 3,390 4,079 4,576 Crianlarich - Oban 129 132 137 168 188 Crianlarich - Fort William 170 174 180 216 244 Fort William - Mallaig 84 86 89 108 123 Other 1,211 1,234 1,269 1,534 1,725 Total 4,837 4,926 5,065 6,106 6,856 Optimistic Demand - Entries and Exits Glasgow - Crianlarich 3,242 3,299 3,404 4,096 4,595 Crianlarich - Oban 129 132 144 177 199 Crianlarich - Fort William 170 174 180 217 245 Fort William - Mallaig 84 86 89 108 123 Other 1,211 1,234 1,270 1,535 1,726 Total 4,837 4,926 5,088 6,134 6,888
Table 3-5: Change in Station Entries and Exits – Optimistic Demand
Change in Station Entries and Exits - Optimistic Demand 2008 2009 2010 2015 2020 Do-Minimum - Demand Growth Glasgow - Crianlarich 1.78% 2.75% 3.77% 2.33% Crianlarich - Oban 2.29% 3.24% 4.20% 2.30% Crianlarich - Fort William 2.28% 3.26% 3.79% 2.49% Fort William - Mallaig 2.32% 3.30% 4.02% 2.50% Other 1.87% 2.84% 3.87% 2.37% Total 1.85% 2.82% 3.81% 2.35% Optimistic Demand - Demand Growth Glasgow - Crianlarich 1.78% 3.18% 3.77% 2.33% Crianlarich - Oban 2.29% 9.06% 4.20% 2.30% Crianlarich - Fort William 2.28% 3.62% 3.79% 2.49% Fort William - Mallaig 2.32% 3.34% 4.02% 2.50% Other 1.87% 2.93% 3.87% 2.37% Total 1.85% 3.29% 3.81% 2.34%

Doc No 1 Rev: 0 Date: October 2008 17 U:\Projects\CTDAKA - CTDAKZ\CTDAKI - Glasgow - Oban Service Enhancements\DOCS\Outgoing\20090115 Oban - Glasgow RSE Final Report + Covers.doc
Table 3-6: Station Entries and Exits (‘000s) by Corridor - Pessimistic Demand
Station Entries and Exits ('000s) - Pessimistic Demand 2008 2009 2010 2015 2020 Do-Minimum - Entries and Exits Glasgow - Crianlarich 3,242 3,281 3,353 3,849 4,276 Crianlarich - Oban 129 131 135 157 174 Crianlarich - Fort William 170 172 175 197 216 Fort William - Mallaig 84 85 87 98 107 Other 1,211 1,226 1,252 1,436 1,593 Total 4,837 4,895 5,001 5,736 6,367 Pessimistic Demand - Entries and Exits Glasgow - Crianlarich 3,242 3,281 3,367 3,865 4,294 Crianlarich - Oban 129 131 142 166 184 Crianlarich - Fort William 170 172 176 197 217 Fort William - Mallaig 84 85 87 98 107 Other 1,211 1,226 1,253 1,437 1,595 Total 4,837 4,895 5,024 5,763 6,397
Table 3-7: Change in Station Entries and Exits - Pessimistic Demand
Change in Station Entries and Exits - Pessimistic Demand 2008 2009 2010 2015 2020 Do-Minimum - Demand Growth Glasgow - Crianlarich 1.22% 2.19% 2.80% 2.13% Crianlarich - Oban 1.56% 2.52% 3.08% 2.12% Crianlarich - Fort William 0.96% 1.94% 2.36% 1.95% Fort William - Mallaig 0.89% 1.88% 2.41% 1.92% Other 1.19% 2.16% 2.78% 2.10% Total 1.20% 2.18% 2.78% 2.11% Pessimistic Demand - Demand Growth Glasgow - Crianlarich 1.22% 2.61% 2.80% 2.13% Crianlarich - Oban 1.56% 8.30% 3.08% 2.12% Crianlarich - Fort William 0.96% 2.30% 2.36% 1.95% Fort William - Mallaig 0.89% 1.91% 2.41% 1.92% Other 1.19% 2.25% 2.78% 2.10% Total 1.20% 2.65% 2.78% 2.11%

Doc No 1 Rev: 0 Date: October 2008 18 U:\Projects\CTDAKA - CTDAKZ\CTDAKI - Glasgow - Oban Service Enhancements\DOCS\Outgoing\20090115 Oban - Glasgow RSE Final Report + Covers.doc
3.5.4 The tables show that the increase in demand reported in Tables 3.2 and 3.3 is driven mainly by increase in demand on the Crianlarich – Oban (8.3%/9.1% between 2009 and 2010) section of the network, as expected. This is because the service benefit is most pronounced for this section and implies that the timetable change is directly responsible for a 5.8% uplift in demand under both optimistic demand assumptions and pessimistic demand assumptions at the stations on the route. It is notable that a small increase in demand on all other sections is also forecast.
3.5.5 Tables 3.8 and 3.9 show the growth in station entries and exits at individual stations in the network for the two years either side of the timetable change.

Doc No 1 Rev: 0 Date: October 2008 19 U:\Projects\CTDAKA - CTDAKZ\CTDAKI - Glasgow - Oban Service Enhancements\DOCS\Outgoing\20090115 Oban - Glasgow RSE Final Report + Covers.doc
Table 3-8: Analysis of Station Entries and Exits by Station – Optimistic Demand
Station Entries and Exits
('000s) Growth Rates
Do-Minimum Optimistic Demand
Do-Minimum
Optimistic Demand
2009 2010 2010 2009/10 2009/10 Glasgow Queen St 1,022 1,050 1,058 2.77% 3.55% Westerton 644 660 660 2.59% 2.59% Dalmuir 629 645 647 2.61% 2.97% Dumbarton Central 676 695 695 2.91% 2.91% Helensburgh (All Stations) 301 310 311 3.00% 3.37% Garelochhead 5 5 6 3.00% 18.75% Arrochar & Tarbet 10 10 11 2.79% 10.51% Ardlui 2 2 2 3.00% 19.94% Crianlarich 11 12 13 3.06% 9.85% Tyndrum Lower 0 0 0 3.02% 7.24% Dallmally 4 4 4 3.08% 13.00% Loch Awe 2 2 3 2.96% 14.39% Falls of Cruachan 0 0 0 3.19% 7.60% Taynuilt 10 10 11 3.04% 11.52% Connel Ferry 4 4 5 3.23% 10.97% Oban 112 115 121 3.27% 8.52% Upper Tyndrum 8 8 8 3.02% 7.25% Bridge of Orchy 6 6 6 3.09% 2.84% Rannoch 17 18 18 3.22% 3.16% Corrour 13 14 14 3.19% 3.06% Tulloch 2 2 2 3.24% 3.16% Roy Bridge 4 4 4 3.32% 5.18% Spean Bridge 6 6 6 3.32% 5.48% Fort William 118 122 122 3.29% 3.42% Banavie 4 4 4 3.31% 3.73% Corpach 2 2 2 3.32% 3.62% Loch Eil Outward Bound 1 1 1 3.36% 3.15% Locheilside 0 0 0 3.27% 3.27% Glenfinnan 5 5 5 3.28% 3.11% Lochailort 2 2 2 3.33% 3.46% Beasdale 0 0 0 3.31% 3.31% Arisaig 7 7 7 3.32% 3.17% Morar 4 4 4 3.29% 2.43% Mallaig 62 64 64 3.30% 3.39% External Stations 1,234 1,269 1,270 2.84% 2.93%

Doc No 1 Rev: 0 Date: October 2008 20 U:\Projects\CTDAKA - CTDAKZ\CTDAKI - Glasgow - Oban Service Enhancements\DOCS\Outgoing\20090115 Oban - Glasgow RSE Final Report + Covers.doc
Table 3-9: Analysis of Station Entries and Exits by Stations -Pessimistic Demand
Station Entries and Exits
('000s) Growth Rates
Do-Minimum Pessimistic
Demand Do-
MinimumPessimistic
Demand 2009 2010 2010 2009/10 2009/10 Glasgow Queen St 1,017 1,039 1,047 2.23% 3.02% Westerton 641 655 655 2.14% 2.14% Dalmuir 626 640 642 2.18% 2.54% Dumbarton Central 671 685 685 2.15% 2.15% Helensburgh (All Stations) 299 306 307 2.22% 2.59% Garelochhead 5 5 6 2.38% 18.06% Arrochar & Tarbet 10 10 11 2.14% 9.82% Ardlui 2 2 2 2.28% 19.09% Crianlarich 11 12 12 2.28% 9.04% Tyndrum Lower 0 0 0 2.34% 6.53% Dallmally 4 4 4 2.45% 12.33% Loch Awe 2 2 3 2.39% 13.77% Falls of Cruachan 0 0 0 2.49% 6.89% Taynuilt 10 10 11 2.46% 10.90% Connel Ferry 4 4 5 2.58% 10.28% Oban 111 114 120 2.52% 7.74% Upper Tyndrum 8 8 8 2.34% 6.53% Bridge of Orchy 6 6 6 2.18% 1.93% Rannoch 17 17 17 1.66% 1.60% Corrour 13 13 13 1.98% 1.86% Tulloch 2 2 2 1.82% 1.74% Roy Bridge 4 4 4 1.83% 3.67% Spean Bridge 5 6 6 1.92% 4.05% Fort William 117 119 119 1.94% 2.07% Banavie 4 4 4 1.73% 2.15% Corpach 2 2 2 1.79% 2.08% Loch Eil Outward Bound 1 1 1 1.97% 1.77% Locheilside 0 0 0 1.72% 1.72% Glenfinnan 5 5 5 1.74% 1.57% Lochailort 2 2 2 1.89% 2.01% Beasdale 0 0 0 1.86% 1.86% Arisaig 7 7 7 1.86% 1.71% Morar 4 4 4 1.76% 0.92% Mallaig 61 62 62 1.91% 2.00% External Stations 1,226 1,252 1,253 2.16% 2.25%

Doc No 1 Rev: 0 Date: October 2008 21 U:\Projects\CTDAKA - CTDAKZ\CTDAKI - Glasgow - Oban Service Enhancements\DOCS\Outgoing\20090115 Oban - Glasgow RSE Final Report + Covers.doc
3.5.6 The table shows that the largest increases in demand are at stations between Helensburgh and Crianlarich and Crianlarich and Oban. This is consistent with the improvement in service provision. The largest increases in demand are closer to Glasgow, as trips to Glasgow represent that largest proportion of trips overall and the service improvement is greatest as a proportion of journey time closer to Glasgow. The increase in growth between Glasgow and Helensburgh and Crianlarich and Mallaig attributable to the service change are less pronounced due to the existing frequency of service and the proximity of the stations to the service change respectively.
3.6 Empirical Assessment 3.6.1 As discussed in the methodology in Chapter 2 an empirical method of applying a
demand uplift of 5.4% per frequency increase was used at each station. The percentage increase in demand forecast at each of the stations to the north of Helensburgh is given in Table 3.10 and compared with the forecast produced within MOIRA.
3.6.2 It can be seen that the two forecasts are in the same region with the MOIRA forecast being the more conservative of the two. As the issue would be that MOIRA might overestimate demand on low frequency lines this comparison provides confidence in the MOIRA demand figures.

Doc No 1 Rev: 0 Date: October 2008 22 U:\Projects\CTDAKA - CTDAKZ\CTDAKI - Glasgow - Oban Service Enhancements\DOCS\Outgoing\20090115 Oban - Glasgow RSE Final Report + Covers.doc
Table 3-10: Comparison of % Change in Demand Forecast by MOIRA and by the Empirical Approach
3.7 Summary and Comments 3.7.1 The results of the demand forecast imply an increase in the number of journeys
over the do-minimum of 12,000 in the first full year of operation, an increase of approximately 0.5% for the study area. This is the case in both the optimistic and pessimistic demand scenarios.
Forecast % Increase in Demand Station
MOIRAEmpirical Approach
Garelochhead 15.3% 10.2%Arrochar & Tarbet 7.5% 4.5%Ardlui 16.4% 12.5%Crianlarich 6.6% 5.8%Tyndrum Lower 4.1% 8.1%Dallmally 9.6% 10.8%Loch Awe 11.1% 10.5%Falls of Cruachan 4.3% 10.8%Taynuilt 8.2% 10.8%Connel Ferry 7.5% 10.6%Oban 5.1% 10.6%Upper Tyndrum 4.1% 8.1%Bridge of Orchy -0.2% 1.6%Rannoch -0.1% 0.3%Corrour -0.1% 2.7%Tulloch -0.1% 4.4%Roy Bridge 1.8% 5.4%Spean Bridge 2.1% 5.4%Fort William 0.1% 2.1%Banavie 0.4% 1.6%Corpach 0.3% 1.0%Loch Eil Outward Bound -0.2% 1.2%Locheilside 0.0% 0.1%Glenfinnan -0.2% 0.6%Lochailort 0.1% 0.9%Beasdale 0.0% 1.6%Arisaig -0.1% 1.0%Morar -0.8% 0.7%Mallaig 0.1% 1.3%Overall 2.5% 4.9%

Doc No 1 Rev: 0 Date: October 2008 23 U:\Projects\CTDAKA - CTDAKZ\CTDAKI - Glasgow - Oban Service Enhancements\DOCS\Outgoing\20090115 Oban - Glasgow RSE Final Report + Covers.doc
3.7.2 Demand is forecast to increase by approximately 7,000 station entries and exits per annum over the do-minimum at stations between Crianlarich and Oban, an uplift of approximately 5%. This figure is consistent with observed and forecast demand uplifts in other areas of the rail network.
3.7.3 The results presented above, specifically growth rates at the study area level and on the Glasgow to Crianlarich corridor, are biased slightly by missing and uncertain flows from Glasgow and Helensburgh, although this is not expected to have a detrimental affect on the appraisal.

Doc No 1 Rev: 0 Date: October 2008 24 U:\Projects\CTDAKA - CTDAKZ\CTDAKI - Glasgow - Oban Service Enhancements\DOCS\Outgoing\20090115 Oban - Glasgow RSE Final Report + Covers.doc
4 Economic and Financial Appraisal
4.1 Introduction 4.1.1 An economic and financial appraisal has been prepared to assess the impacts of the
proposed timetable change as discussed in Chapter 3. This appraisal has been developed using the optimistic and pessimistic demand forecasts presented in the previous section and the results of the MOIRA run, in accordance with the appraisal methodology recorded in Chapter 2. The appraisal is produced using guidance contained within the 2008 revised Scottish Transport Appraisal Guidance (STAG) and WebTAG.
4.2 Key Assumptions 4.2.1 As with all appraisals it has been necessary to define assumptions and a
methodology to apply these assumptions. Assumptions are taken from STAG or WebTAG and are reported in full in the annex of supplementary information.
4.2.2 Some of the key assumptions and methods are presented below:
• Appraisal: A standard 60 year appraisal is produced starting from the scheme opening year of 2010 (the timetable change is December 2009). Prices are 2002 market prices discounted using the standard rates to the current year, 2008;
• Costs: Service related costs are derived from the February 2008 Habtrans Consultancy report entitled ‘Glasgow – Oban Service Enhancements’. Other sources of information are HITRANS, First ScotRail, the Office of the Rail Regulator and the consultant’s experience. Costs are discussed in greater detail in the following sub-section;
• Scheme impacts: the magnitude of the impacts of the timetable change are derived using MOIRA and extend to demand change, value of travel time change and revenue change. As MOIRA outputs only demand data for flows where one of these aspects has changed, the MOIRA output has been used to derive marginal benefits and revenues to be applied to the base data;
• Financial impacts: the operator is assumed to absorb additional scheme costs and will be compensated for the change in their financial position by Transport Scotland;

Doc No 1 Rev: 0 Date: October 2008 25 U:\Projects\CTDAKA - CTDAKZ\CTDAKI - Glasgow - Oban Service Enhancements\DOCS\Outgoing\20090115 Oban - Glasgow RSE Final Report + Covers.doc
• Impacts as a result of mode switching: It is assumed that 75% of additional demand is car users switching to rail and 25% is induced. The station to station distance output from MOIRA is used as an estimate for the road distance between stations. Impacts associated with a reduction in car travel (including accident savings and indirect taxation) are derived per car kilometre avoided and included in the appraisal;
• Incidence of benefits: it is assumed that all rail users in the region are travelling as either a commuter or for leisure, implying no business user benefit.
4.3 Costs 4.3.1 The scheme involves a change to the timetable only and as such all scheme costs
are related to the additional requirements to operate the changed service. The following costs have been identified:
• Staff: the Habtrans report indicates that an additional 8 staff will be required, at a cost in 2008 prices of £350,000;
• Vehicle Leasing: through consultation with First ScotRail and HITRANS, it has been determined that the availability of rolling stock may be limited. Therefore, the cost to hire one additional Class 156 unit is included at an estimated £250,000 in 2008 prices;
• Variable costs: the enhanced service is expected to result in an additional 75,000 miles, with the following associated costs: • Fuel: at £0.35/mile in 2007 prices, estimated based on consultant’s
experience; • Variable usage charge: at £0.10/mile in 2004 prices, estimated for a
Class 156 using ORR’s Track Usage Price List 2004; • Capacity Charge: at £0.01/mile in 2004 prices, estimated for First
ScotRail using ORR’s List of Capacity Charge Rates 2004; • Fixed Track Access Charge: at £2.00/mile in 2007 prices, estimated
based on consultant’s experience; and • Access Charge Supplements: assumed to be not applicable.
4.3.2 Table 4.1 summarises the opening year costs of operating the additional service in
2008 prices and outturn costs. Note that these costs include 10% contingency on operating costs and are not market prices.

Doc No 1 Rev: 0 Date: October 2008 26 U:\Projects\CTDAKA - CTDAKZ\CTDAKI - Glasgow - Oban Service Enhancements\DOCS\Outgoing\20090115 Oban - Glasgow RSE Final Report + Covers.doc
Table 4-1: Summary of Opening Year Scheme Costs
Cost Item Units
Required
Unit Costs (2008 Prices,
'000s)
Total Cost (2008 Prices,
'000s) Outturn
Costs ('000s) Staff 8.00 48 385 410 Class 156 Units 0.67 275 183 195 Fuel 74,496 0 42 45 Variable Usage Charge 74,496 0 9 10 Capacity Charge 74,496 0 1 1 Fixed Track Access Charge 74,496 0 171 183 Access Charge Supplements 74,496 0 0 0 Total 792 844
4.3.3 The table shows that the total cost in 2008 prices is £790,000, with an expected outturn of £840,000. Staff costs contribute the most to the additional operating costs, with sizeable contributions associated with the lease of the additional Class 156 unit and the Fixed Track Access Charge.
4.3.4 Further cost related assumptions include:
• Inflation: costs are assumed to be constant in real terms over the appraisal period; and
• Optimism bias: as there is no investment or renewal cost element, optimism bias is applied at a rate of 0%.
4.4 Benefits and Revenues 4.4.1 Transport projects involving timetable changes are likely to result in the following
impacts:
• Travel time changes; • Farebox revenue changes; • Road vehicle kilometre changes, leading to:
• Changes in congestion levels; • Environmental impacts, including noise, air quality and climate
changes impacts; • Accident cost changes; • Changes in impacts to infrastructure;

Doc No 1 Rev: 0 Date: October 2008 27 U:\Projects\CTDAKA - CTDAKZ\CTDAKI - Glasgow - Oban Service Enhancements\DOCS\Outgoing\20090115 Oban - Glasgow RSE Final Report + Covers.doc
• Other transport impacts: • Changes in public transport reliability; • Option values;
• Wider economic impacts.
4.4.2 As part of this study, an attempt has been made to value the impact of travel time changes, farebox revenue changes, benefits as a result of changes in road vehicle usage and changes in public transport reliability. Wider economic impacts, which could be significant given the current poor service levels to Oban, are not estimated quantitatively but are commented upon in the Appraisal Summary Tables (ASTs).
4.4.3 Tables 4.2 and 4.3 summarise the impacts of the service enhancements in the opening year, excluding the impact on farebox revenue.
Table 4-2: Summary of Opening Year Benefits – Optimistic Demand
Optimistic Demand Value (£000s, 2008 Prices) % of Total Travel Time Savings 1,002 86.41%
Consumer Users 1,002 86.41% Business Users 0 0.00%
Vehicle Operating Costs 50 4.35% Consumer Users 50 4.35% Business Users 0 0.00%
External Impacts 107 9.24% Total 1,160 100.00%
Table 4-3: Summary of Opening Year Benefits - Pessimistic Demand
Pessimistic Demand Value (£000s, 2008 Prices) % of Total Travel Time Savings 989 86.41%
Consumer Users 989 86.41% Business Users 0 0.00%
Vehicle Operating Costs 50 4.35% Consumer Users 50 4.35% Business Users 0 0.00%
External Impacts 106 9.24% Total 1,144 100.00%

Doc No 1 Rev: 0 Date: October 2008 28 U:\Projects\CTDAKA - CTDAKZ\CTDAKI - Glasgow - Oban Service Enhancements\DOCS\Outgoing\20090115 Oban - Glasgow RSE Final Report + Covers.doc
4.4.4 Travel time savings account for 86% of the total annual scheme benefit, providing a benefit to society of £1 million in 2010. Of this, 5% (4% of total benefits) are decongestion benefits, arising as fewer people commute into Glasgow by car. Benefits attributable to a reduction in car kilometres and improvements in transport reliability contribute 14% to a total benefit in 2010 of £1.2 million. The magnitude of the benefits under the pessimistic demand assumptions are slightly lower as fewer passengers are forecast to benefit from the service enhancement.
4.4.5 Tables 4.4 and 4.5 show the expected revenue change in 2008 prices and outturn revenue.
Table 4-4: Opening Year Revenue – Optimistic Demand
Total Revenue (2008 Prices,
£'000s)
Outturn Revenue (£'000s)
Revenue (Increment) 357 381
Table 4-5: Opening Year Revenue - Pessimistic Demand
Total Revenue (2008 Prices,
£'000s)
Outturn Revenue (£'000s)
Revenue (Increment) 352 376
4.4.6 The table shows that the increase in revenue under the optimistic demand assumptions is approximately £360,000 in 2008 prices, or £380,000 in outturn revenue. Analysis of the MOIRA output reveals that the revenue per additional journey is £17 in 2008 prices. Revenue generated in the scenario with pessimistic demand growth is approximately 1.5% lower.
4.5 Financial Appraisal 4.5.1 Tables 4.6 and 4.7 report a comparison of costs and revenues for the two demand
scenarios.

Doc No 1 Rev: 0 Date: October 2008 29 U:\Projects\CTDAKA - CTDAKZ\CTDAKI - Glasgow - Oban Service Enhancements\DOCS\Outgoing\20090115 Oban - Glasgow RSE Final Report + Covers.doc
Table 4-6: Summary Financial Appraisal – Optimistic Demand
Value (£'000s) - Optimistic Demand 2010 2015 2020 2010-2020 2008 Prices Costs (Incremental) 792 792 792 8,713 Revenue (Incremental) 357 458 541 5,028 Surplus -435 -334 -251 -3,685 Outturn Costs (Incremental) 844 955 1,081 10,541 Revenue (Incremental) 381 552 738 6,138 Surplus -464 -403 -343 -4,403
Table 4-7: Summary Financial Appraisal - Pessimistic Demand
Value (£'000s) - Pessimistic Demand 2010 2015 2020 2010-2020 2008 Prices Costs (Incremental) 792 792 792 8,713 Revenue (Incremental) 352 428 500 4,717 Surplus -440 -364 -293 -3,996 Outturn Costs (Incremental) 844 955 1,081 10,541 Revenue (Incremental) 376 516 682 5,752 Surplus -469 -439 -399 -4,789
4.5.2 The tables show that the additional operating cost of the service enhancement clearly exceeds the additional revenue generated from the additional demand. In the opening year, 2010, the service would need to be supported by a subsidy of £0.45 million in 2008 prices under both demand assumptions. Although the subsidy required increases in outturn costs, the equivalent value in 2008 prices declines as the quantity of additional journeys over and above the do-minimum continues to increase. In total, the service would require a subsidy of £3.7 million under optimistic demand assumptions in 2008 prices over the 11 years 2010 to 2020. This figure increases to £4.0 million under the pessimistic demand assumptions.

Doc No 1 Rev: 0 Date: October 2008 30 U:\Projects\CTDAKA - CTDAKZ\CTDAKI - Glasgow - Oban Service Enhancements\DOCS\Outgoing\20090115 Oban - Glasgow RSE Final Report + Covers.doc
4.5.3 The revenue to cost ratio implied here is 0.44-0.45 in the opening year, implying that the scheme does not represent value for money from a financial perspective.
4.6 Economic Appraisal 4.6.1 Summary NATA appraisal tables are reported in Tables 4.8 and 4.9 and the
relevant sections of the STAG 2008 AST table are presented towards the end of this subsection. For completeness, a full set of WebTAG NATA tables are included in the annex of supplementary information towards the end of this report, providing a detailed breakdown of benefits and costs.
Table 4-8: Summary NATA Summary Table – Optimistic Demand
Optimistic Demand
(£m, 2002 Prices) Present Value Benefits 28.0
Consumer Users 24.1 Business Users 0.0 Private Sector Providers 0.0 Other 3.9
Present Value Costs 5.6 Local Government 0.0 Central Government 5.6
Net Present Value 22.4 Benefit:Cost 5.0
Table 4-9: Summary NATA Summary Table - Pessimistic Demand
Pessimistic Demand
(£m, 2002 Prices) Present Value Benefits 26.0
Consumer Users 22.4 Business Users 0.0 Private Sector Providers 0.0 Other 3.7
Present Value Costs 6.6 Local Government 0.0 Central Government 6.6
Net Present Value 19.4 Benefit:Cost 3.9

Doc No 1 Rev: 0 Date: October 2008 31 U:\Projects\CTDAKA - CTDAKZ\CTDAKI - Glasgow - Oban Service Enhancements\DOCS\Outgoing\20090115 Oban - Glasgow RSE Final Report + Covers.doc
4.6.2 The present value benefit of the scheme under the optimistic demand assumptions is £28.0 million in 2002 prices, and consists of:
• Travel time savings: £36.8 million; • Vehicle operating cost savings: £1.3 million; • User charge savings: (-)£14.1 million; • External benefits: £3.9 million.
4.6.3 The present value cost of the scheme is £5.6 million, and consists of:
• Subsidy payment: £5.0 million; and • Indirect taxation lost: £0.7 million.
4.6.4 Overall, the net present value of the scheme under the optimistic demand scenario is £22.4 million, yielding a benefit to cost ratio of 5.0. This implies that, for every £1.00 spent on the supporting the scheme, £5.00 of benefits will be returned.
4.6.5 The present value benefit of the scheme under the pessimistic demand scenario assumptions is £26.0 million in 2002 prices, and consists of:
• Travel time savings: £34.2 million; • Vehicle operating cost savings: £1.2 million; • User charge savings: (-)£13.1 million; • External benefits: £3.7 million.
4.6.6 The present value cost of the scheme is £6.6 million, and consists of:
• Subsidy payment: £6.0 million; and • Indirect taxation lost: £0.6 million.
4.6.7 Overall, in the pessimistic scenario the net present value of the scheme is £19.4 million, yielding a benefit to cost ratio of 3.9. This implies that, for every £1.00 spent on the supporting the scheme, £3.90 of benefits will be returned.
4.6.8 Under the guidelines contained within STAG, this result of the appraisals under optimistic and pessimistic demand growth show the scheme to represent excellent value for money and it is strongly recommended that this scheme is taken forward for further consideration.

Doc No 1 Rev: 0 Date: October 2008 32 U:\Projects\CTDAKA - CTDAKZ\CTDAKI - Glasgow - Oban Service Enhancements\DOCS\Outgoing\20090115 Oban - Glasgow RSE Final Report + Covers.doc
4.6.9 The results of the appraisal are summarised in the economy sections of the STAG 2008 ASTs below.
Table 4-10: Appraisal Summary Table – Optimistic Demand
Economy (Transport Economic Efficiency)
Sub-criterion Item Qualitative Information Quantitative Information
Travel Time
Travel time savings from reduced serviced intervals (95%) and a reduction in car journeys into Glasgow (5%)
£36.8 million
User Charges Increase in fares as rail patronage increases -£14.1 million
Vehicle Operating Costs
Reduction in car journeys as people switch modes to rail £1.3 million
User Benefits
Quality / Reliability Benefits
Reliability benefits from reduced travel times
£3.5 million
Investment Costs Not applicable for service enhancement £0
Operating & Maintenance Costs Additional rail operating costs. -£19.1 million
Revenues Increase in fares as rail patronage increases £14.1 million
Private Sector Operator Impacts
Grant/Subsidy payments
Required so net financial position of operator is neutral £ 5.0 million
Monetised summary £24.1 million (Excludes Reliability)
Monetary Impact Ratio 4.3 (Excludes Reliability)
Economy (Wider Economic Benefits)
Sub-criterion Item Qualitative information Quantitative information
Wider Economic Benefits
Agglomeration economies (WB1)
Small benefit for Glasgow/Crianlarich/Oban as centres of employment can be accessed by rail more frequently
Not assessed

Doc No 1 Rev: 0 Date: October 2008 33 U:\Projects\CTDAKA - CTDAKZ\CTDAKI - Glasgow - Oban Service Enhancements\DOCS\Outgoing\20090115 Oban - Glasgow RSE Final Report + Covers.doc
Increased output in perfectly competitive markets (WB3)
- Not assessed
Wider benefits arising from improved labour supply (WB4)
Greater access to employment opportunities in Glasgow likely to increase employment and opportunities to find higher paid work
Not assessed
Monetised summary Not assessed quantitatively
Monetary Impact Ratio Not assessed quantitatively
Economy (Economic Activity and Location Impacts)
Sub-criterion Item Qualitative Information Quantitative Information
Local Economic Impacts
Greater accessibility to employment opportunities in Glasgow and accessibility to region by tourists likely to improve local economy
Not assessed
National Economic Impacts
Increase in employment likely to increase national GDP.
Not assessed
Economic Activity and Location Impacts
Distributional Impacts Unemployment in region likely to improve with residents in region travelling to centres of employment. However, employment opportunities in region are likely to remain to be filled by existing residents
Not assessed
Cost to Public Sector
Item Qualitative information Quantitative information
Public Sector Investment Costs Not applicable for service enhancement schemes £0
Public Sector Operating & Maintenance Costs Service is operated privately £0
Grant/Subsidy Payments Support required to ensure financial position of -£5.0 million

Doc No 1 Rev: 0 Date: October 2008 34 U:\Projects\CTDAKA - CTDAKZ\CTDAKI - Glasgow - Oban Service Enhancements\DOCS\Outgoing\20090115 Oban - Glasgow RSE Final Report + Covers.doc
operator is neutral
Revenues Loss of parking revenue as a result of fewer car trips is not assessed £0
Taxation impacts Loss in fuel purchases as car users switch to rail -£0.7 million
Monetised Summary
Present Value of Transport Benefits Including external impacts reported in appraisal:
£24.1 million + £3.9 million = £28.0 million
Present Value of Cost to Government -£5.6 million
Net Present Value £22.4 million
Benefit-Cost to Government Ratio 5.0
Benefit-Cost to Government Ratio (including WEBs) Not assessed
Benefit-Cost to Funding Agency Ratio 5.5
Table 4-11: Appraisal Summary Table - Pessimistic Demand
Economy (Transport Economic Efficiency)
Sub-criterion Item Qualitative Information Quantitative Information
Travel Time
Travel time savings from reduced serviced intervals (95%) and a reduction in car journeys into Glasgow (5%)
£34.2 million
User Charges Increase in fares as rail patronage increases -£13.1 million
User Benefits
Vehicle Operating Costs
Reduction in car journeys as people switch modes to rail £1.2 million

Doc No 1 Rev: 0 Date: October 2008 35 U:\Projects\CTDAKA - CTDAKZ\CTDAKI - Glasgow - Oban Service Enhancements\DOCS\Outgoing\20090115 Oban - Glasgow RSE Final Report + Covers.doc
Quality / Reliability Benefits
Reliability benefits from reduced travel times
£3.2 million
Investment Costs Not applicable for service enhancement £0
Operating & Maintenance Costs Additional rail operating costs. -£19.1 million
Revenues Increase in fares as rail patronage increases £13.1 million
Private Sector Operator Impacts
Grant/Subsidy payments
Required so net financial position of operator is neutral £ 6.0 million
Monetised summary £22.4 million (Excludes Reliability)
Monetary Impact Ratio 3.4 (Excludes Relaibility)
Economy (Wider Economic Benefits)
Sub-criterion Item Qualitative information Quantitative information
Agglomeration economies (WB1)
Small benefit for Glasgow/Crianlarich/Oban as centres of employment can be accessed by rail more frequently
Not assessed
Increased output in perfectly competitive markets (WB3)
- Not assessed
Wider Economic Benefits
Wider benefits arising from improved labour supply (WB4)
Greater access to employment opportunities in Glasgow likely to increase employment and opportunities to find higher paid work
Not assessed
Monetised summary Not assessed quantitatively
Monetary Impact Ratio Not assessed quantitatively
Economy (Economic Activity and Location Impacts)
Sub-criterion Item Qualitative Information Quantitative Information
Economic Activity and Location Impacts
Local Economic Impacts
Greater accessibility to employment opportunities in Glasgow and accessibility to region by tourists likely to improve local economy
Not assessed

Doc No 1 Rev: 0 Date: October 2008 36 U:\Projects\CTDAKA - CTDAKZ\CTDAKI - Glasgow - Oban Service Enhancements\DOCS\Outgoing\20090115 Oban - Glasgow RSE Final Report + Covers.doc
National Economic Impacts
Increase in employment likely to increase national GDP.
Not assessed
Distributional Impacts Unemployment in region likely to improve with residents in region travelling to centres of employment. However, employment opportunities in region are likely to remain to be filled by existing residents
Not assessed
Cost to Public Sector
Item Qualitative information Quantitative information
Public Sector Investment Costs Not applicable for service enhancement schemes £0
Public Sector Operating & Maintenance Costs Service is operated privately £0
Grant/Subsidy Payments Support required to ensure financial position of operator is neutral -£6.0 million
Revenues Loss of parking revenue as a result of fewer car trips is not assessed £0
Taxation impacts Loss in fuel purchases as car users switch to rail -£0.6 million
Monetised Summary
Present Value of Transport Benefits Including external impacts reported in appraisal:
£22.4 million + £3.7 million = £26.0 million
Present Value of Cost to Government -£6.6 million
Net Present Value £19.4 million
Benefit-Cost to Government Ratio 3.9
Benefit-Cost to Government Ratio (including WEBs) Not assessed

Doc No 1 Rev: 0 Date: October 2008 37 U:\Projects\CTDAKA - CTDAKZ\CTDAKI - Glasgow - Oban Service Enhancements\DOCS\Outgoing\20090115 Oban - Glasgow RSE Final Report + Covers.doc
Benefit-Cost to Funding Agency Ratio 4.2
4.7 Summary and Comments 4.7.1 The results of the financial appraisal suggest that the scheme does not represent
value for money from a financial perspective, with a revenue to cost ratio in the opening year of 0.44-0.45. However, the economic appraisal of the scheme yields economic benefits of £22.4 million over the appraisal lifetime assuming optimistic growth and £19.4 million assuming pessimistic growth. The associated benefit cost ratios of 5.0 and 3.9 imply that the scheme represents excellent value for money and can be taken forward with a view to implementing the scheme.
4.7.2 However, the results of the appraisal are sensitive to the assumptions made, and some aspects in particular are simplified. This includes the assumed values for external impacts. If required, further consideration may be given to the size of these impacts, and how they are calculated to increase the robustness of the appraisal.
4.7.3 Overall, the use of MOIRA software and the high percentage of scheme benefits that are attributable to travel time savings ensure that the appraisal is robust. Appraising the scheme using only travel time savings and revenue and cost changes yields a benefit to cost ratio of approximately 3.2 (pessimistic) – 4.0 (optimistic), which implies excellent value for money.

Doc No 1 Rev: 0 Date: October 2008 38 U:\Projects\CTDAKA - CTDAKZ\CTDAKI - Glasgow - Oban Service Enhancements\DOCS\Outgoing\20090115 Oban - Glasgow RSE Final Report + Covers.doc
5 Conclusions
5.1 Summary 5.1.1 The preceding sections of this report present a demand forecast, economic and
financial appraisal of enhancing rail services between Oban and Glasgow. The appraisal is conducted in line with the latest Scottish Transport Appraisal Guidance (STAG).
5.1.2 Demand is forecast to increase in the study area by an additional 12,000 journeys in the scheme opening year of 2010, an increase of 0.5%, in both the optimistic and pessimistic demand scenarios. The increase in demand is greatest at stations between and including Garelochhead and Oban. Demand growth for this corridor is forecast to increase by 9.1% in the optimistic demand scenario between 2009 and 2010. Approximately 5.8% of this demand is as a result of the timetable change.
5.1.3 The financial assessment of the scheme shows that the operating costs exceed the revenue generated by additional and reassigned patronage by a ratio of approximately 2:1. In outturn costs and revenues, the financial support required for the service enhancement is forecast to be £0.45 million in both the optimistic and pessimistic demand growth scenarios, although this masks that the subsidy required in the pessimistic scenario is greater.
5.1.4 The results of the economic appraisal are as follows:
Table 5-1: Summary of Economic Appraisal Results
Optimistic Demand Pessimistic Demand Present Value Benefit (£m) 28.0 26.0 Present Value Cost (£m) 5.6 6.6 Net Present Value (£m) 22.4 19.4 Benefit:Cost 5.0 3.9
5.1.5 Overall, the service enhancements generate a positive return to investment, with net present values of £22.4 million in the optimistic demand growth scenario and

Doc No 1 Rev: 0 Date: October 2008 39 U:\Projects\CTDAKA - CTDAKZ\CTDAKI - Glasgow - Oban Service Enhancements\DOCS\Outgoing\20090115 Oban - Glasgow RSE Final Report + Covers.doc
£19.4 million in the pessimistic demand growth scenario. The benefit to cost ratios are 5.0 and 3.9 respectively.
5.2 Conclusions and Recommendations 5.2.1 Although the scheme will require additional subsidy support, the benefit to cost
ratios derived in the economic appraisal of the service enhancements with optimistic and pessimistic demand growth assumptions imply that the scheme represents excellent value for money. Although the appraisals are based in part on a number of simplifying assumptions, 81% of the benefits are rail user travel time savings, implying that the appraisal is robust. The use of MOIRA and LENNON data provides a level of confidence in the results obtained.
5.2.2 The strength of the service enhancements scheme is the relatively low cost of implementing the timetable change compared with the benefit to transport users in the study area. It is also highlighted that the scheme is likely to improve employment prospects in the region and afford tourists without a car easier access to the area. Therefore, there is a strong economic case for implementing this timetable change.
Doc No 1 Rev: 0 Date: October 2008 40 U:\Projects\CTDAKA - CTDAKZ\CTDAKI - Glasgow - Oban Service Enhancements\DOCS\Outgoing\20090115 Oban - Glasgow RSE Final Report + Covers.doc
6 Annex of Supplementary Information
6.1 List of Assumptions 6.1.1 The following provides a comprehensive list of assumptions used in the demand
forecast and the appraisal:
Demand
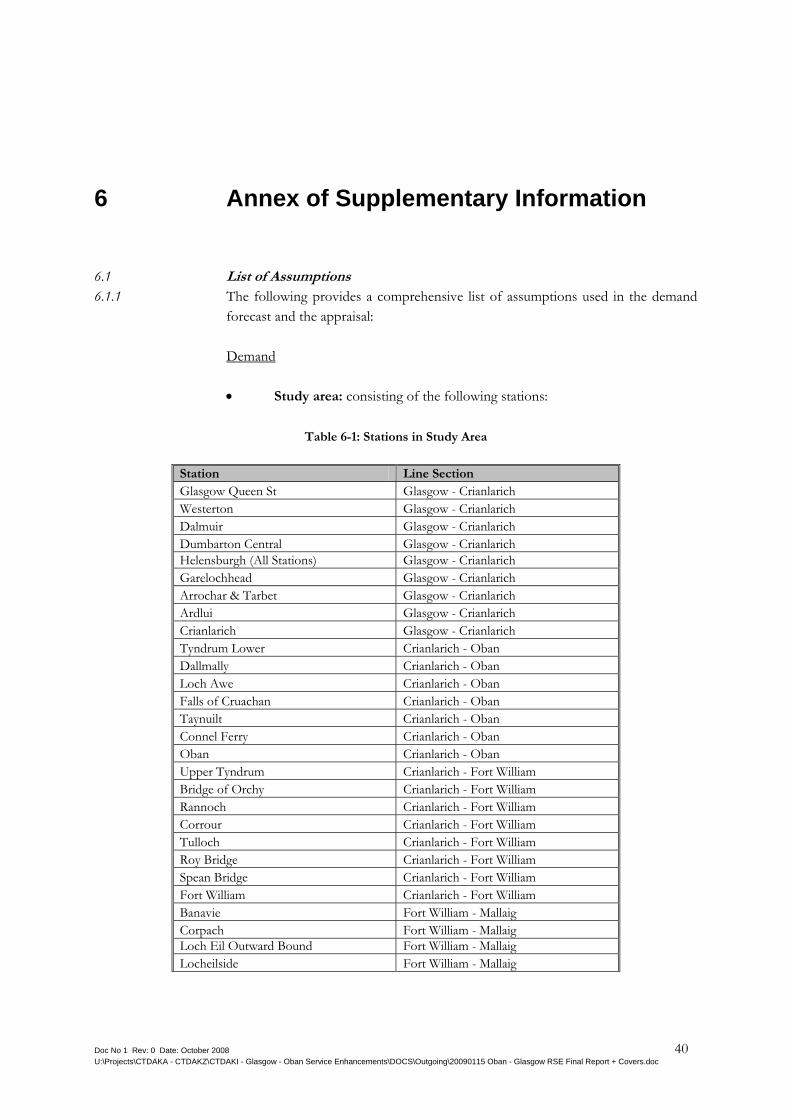
• Study area: consisting of the following stations:
Table 6-1: Stations in Study Area
Station Line Section Glasgow Queen St Glasgow - Crianlarich Westerton Glasgow - Crianlarich Dalmuir Glasgow - Crianlarich Dumbarton Central Glasgow - Crianlarich Helensburgh (All Stations) Glasgow - Crianlarich Garelochhead Glasgow - Crianlarich Arrochar & Tarbet Glasgow - Crianlarich Ardlui Glasgow - Crianlarich Crianlarich Glasgow - Crianlarich Tyndrum Lower Crianlarich - Oban Dallmally Crianlarich - Oban Loch Awe Crianlarich - Oban Falls of Cruachan Crianlarich - Oban Taynuilt Crianlarich - Oban Connel Ferry Crianlarich - Oban Oban Crianlarich - Oban Upper Tyndrum Crianlarich - Fort William Bridge of Orchy Crianlarich - Fort William Rannoch Crianlarich - Fort William Corrour Crianlarich - Fort William Tulloch Crianlarich - Fort William Roy Bridge Crianlarich - Fort William Spean Bridge Crianlarich - Fort William Fort William Crianlarich - Fort William Banavie Fort William - Mallaig Corpach Fort William - Mallaig Loch Eil Outward Bound Fort William - Mallaig Locheilside Fort William - Mallaig

Doc No 1 Rev: 0 Date: October 2008 41 U:\Projects\CTDAKA - CTDAKZ\CTDAKI - Glasgow - Oban Service Enhancements\DOCS\Outgoing\20090115 Oban - Glasgow RSE Final Report + Covers.doc
Station Line Section Glenfinnan Fort William - Mallaig Lochailort Fort William - Mallaig Beasdale Fort William - Mallaig Arisaig Fort William - Mallaig Morar Fort William - Mallaig Mallaig Fort William - Mallaig External Stations Other
• Study area: external stations are all those stations external to the study
area where flows to/from the study area start/end. The measure includes all trips of this type.
• Base demand: the base demand is derived from 2007/08 LENNON data. LENNON data reports all flows to/from study area stations and can be used to produce a matrix of demand for all flows within, from and to the study area;
• Rail demand growth: background rail patronage growth is taken from Halcrow Group Limited’s 2005 study Highlands and Islands Rail Traffic Growth Projections, updated in line with recent and forecast economic events. The high and low growth scenarios are used to inform the optimistic and pessimistic demand scenarios in the appraisal of Oban – Glasgow Rail Service Enhancements;
• Rail demand growth: background rail growth is applied at the ‘producer’ stations;
• Rail demand growth: growth is assumed to be 0% per annum post-2020; • Impact of service change on demand: MOIRA is used to forecast
summer and winter demand given the proposed timetable change. An uplift is derived at the flow level based on MOIRA’s base demand and MOIRA’s forecast demand and applied to the Halcrow’s base demand matrix, as defined above;
• Service change demand uplift: the demand uplift is assumed to be consistent as a proportion of demand throughout the appraisal period. This ignores the effect changing values of time has on mode choice and travel decisions;
Costs
• Staff costs: based on Habtrans Consultancy Limited’s February 2008 report Glasgow – Oban Service Enhancements, 8 additional staff are required at a cost of £350,000 in 2008 prices;

Doc No 1 Rev: 0 Date: October 2008 42 U:\Projects\CTDAKA - CTDAKZ\CTDAKI - Glasgow - Oban Service Enhancements\DOCS\Outgoing\20090115 Oban - Glasgow RSE Final Report + Covers.doc
• Leasing costs: based on consultation with HITRANS and First ScotRail , 1 additional Class 156 is required for the winter period at a cost of £250,000 * 0.67 in 2008 prices;
• Track access costs: based on Habtrans Consultancy Limited’s February 2008 report Glasgow – Oban Service Enhancements, the service enhancements will result in an additional 74,496 vehicle miles, with the following costs: • Fuel: at £0.35/mile in 2007 prices. Source: consultant’s
experience; • Variable Usage Charge: at £0.10/mile in 2004 prices. Source:
Office of the Rail Regulator’s Track Usage Price List 2004, for a Class 156;
• Capacity Charge: at £0.01/mile in 2004 prices. Source: Office of the Rail Regulator’s List of Capacity Charge Rates 2004, assuming 10% of vehicle miles are in Strathclyde PTE area;
• Fixed Track Access Charge: at £2.00/mile in 2006 prices, based on consultant’s experience;
• Contingency: contingency of 10% added to all operating costs; • Optimism bias: optimism bias is not included as there is no capital cost
expenditure; • Cost inflation: costs are assumed to remain constant in real terms over
the appraisal period. Deriving Scheme Impacts
• Travel time savings: a marginal value of travel time saved is derived at the flow level from MOIRA’s forecast travel time saving, MOIRA’s forecast demand and MOIRA’s base demand in both the summer and winter periods, and for existing and new users. The values derived are converted to total savings using Halcrow’s demand forecast;
• Revenue changes: a marginal revenue change is derived at the flow level from MOIRA’s forecast travel time saving, MOIRA’s forecast demand and MOIRA’s base demand in both the summer and winter periods, and for national rail and First Scotrail. The values derived are converted to total revenue change using Halcrow’s demand forecast;
• Road vehicle kilometres: rail distance is used as an estimator for road distance for each flow. Road vehicle distance change is derived using this figure, the incremental demand between the do-something and do-minimum, and an assumed split of demand abstracted from car.

Doc No 1 Rev: 0 Date: October 2008 43 U:\Projects\CTDAKA - CTDAKZ\CTDAKI - Glasgow - Oban Service Enhancements\DOCS\Outgoing\20090115 Oban - Glasgow RSE Final Report + Covers.doc
Economic and Financial Appraisal
• Scheme start date: December 2009; • Scheme opening: December 2009, scheme impacts from 1st January
2010; • Ramp up: not assessed; • Appraisal period: 60 years (STAG); • Price base: 2002 (STAG); • Present value year: 2008 (STAG); • Discount rates: 3.5% for first 30 years from scheme opening, 3%
thereafter (STAG); • Unit of account: market prices; • Market price correction: 1.209 (STAG); • Monetary standardisation: using RPI index, financial year Q1 prices,
calendar year Q2 prices. 2008 RPI value 216.8; • Outturn costs and revenues: RPI inflation assumed to be 3.5% in 2009,
3% in 2010 and returning to Bank of England’s target of 2.5% thereafter; • Revenue growth: rail fares assumed to increase by RPI + 1% per annum
in line with industry recommendations; • Fares base (in MOIRA): 2007; • Value of time: assumed from MOIRA results. Value of time is assumed
to grow from the MOIRA base of 2000 using growth rates reported in STAG;
• Trip purpose split (for the purposes of value of time growth): as defined in STAG for rail passengers, except that work-time trip purpose split assumed to be 0%;
• Abstraction: 75% car, 25% induced, based on consultant’s judgement; • Bus user charges: not assessed, as abstraction from bus assumed to be
0% • Freight: not assessed; • Decongestion: road journeys between Helensburgh and Glasgow
assumed to be congested (assumed 51km radial from Glasgow). Decongestion benefit £0.25/km in 2002 prices (based on previous studies) for congestion areas only – estimated to be 25% of all avoided vehicle kilometres. Assumed to increase by average value of time growth;
• Vehicle occupancy: 1.6 people per vehicle (STAG). Assumed constant through appraisal period;

Doc No 1 Rev: 0 Date: October 2008 44 U:\Projects\CTDAKA - CTDAKZ\CTDAKI - Glasgow - Oban Service Enhancements\DOCS\Outgoing\20090115 Oban - Glasgow RSE Final Report + Covers.doc
• Road vehicle operating cost: £0.07/km in 2002 prices, based on previous studies. Assumed to remain constant through appraisal period;
• Indirect taxation: £0.04/km in 2002 prices, based on previous studies. Assumed constant through appraisal period;
• Other road vehicle distance based impacts, assumed to remain constant through appraisal period: • Noise pollution: <£0.01/km in 2002 prices, based on previous
studies; • Local air quality: £0.01/km in 2002 prices, based on previous
studies; • Climate change: <£0.01/km in 2002 prices, based on previous
studies; • Accidents: £0.03/km in 2002 prices, based on previous studies; • Infrastructure: <£0.01/km in 2002 prices, based on previous
studies; • Journey ambience including crowding: not assessed; • Reliability: 10% of travel time savings (Consultant’s experience); • Option values: not assessed; • Wider economic benefits: not assessed quantitatively.
6.2 NATA Tables 6.2.1 A full set of NATA tables is presented below:

Doc No 1 Rev: 0 Date: October 2008 45 U:\Projects\CTDAKA - CTDAKZ\CTDAKI - Glasgow - Oban Service Enhancements\DOCS\Outgoing\20090115 Oban - Glasgow RSE Final Report + Covers.doc
Table 6-2: Transport Economic Efficiency Table – Optimistic Demand
TRANSPORT ECONOMIC EFFICIENCY
Oban - Glasgow Rail Service Enhancements - Optimistic Demand
£m in 2002 pricesCONSUMERS ALL MODES ROAD BUS & COACH RAIL TRAM OTHERUser Benefits Total Private Cars
and LGVsPassengers Passengers Passengers Walkers,
Cyclists Etc
Travel Time Savings £36.8 £1.9 £0.0 £34.9 £0.0 £0.0Amenity/Facility Benefits £0.0 £0.0 £0.0 £0.0 £0.0 £0.0Vehicle Operating Costs £1.3 £1.3 £0.0User Charges -£14.1 £0.0 £0.0 -£14.1 £0.0 £0.0During Construction & Maintenance £0.0 £0.0 £0.0 £0.0 £0.0 £0.0Total Impact on Consumers £24.1 £3.2 £0.0 £20.8 £0.0 £0.0
BUSINESS ALL MODES ROAD ROAD BUS & COACH RAIL TRAM OTHERUser Benefits Total Goods Vehicles Business Cars
and LGVsPassengers Passengers Passengers Walkers,
Cyclists Etc
Travel Time Savings £0.0 £0.0 £0.0 £0.0 £0.0 £0.0 £0.0Amenity/Facility Benefits £0.0 £0.0 £0.0 £0.0 £0.0 £0.0 £0.0Vehicle Operating Costs £0.0 £0.0 £0.0 £0.0User Charges £0.0 £0.0 £0.0 £0.0 £0.0 £0.0 £0.0During Construction & Maintenance £0.0 £0.0 £0.0 £0.0 £0.0 £0.0 £0.0Subtotal £0.0 £0.0 £0.0 £0.0 £0.0 £0.0 £0.0
BUSINESS ALL MODES ROAD BUS & COACH RAIL RAIL TRAM OTHERPrivate Sector Provider Impacts Total General Operators TOCs FOCs Operators Other Public
Transport
Revenue (Farebox) £14.1 £0.0 £0.0 £14.1 £0.0 £0.0 £0.0Revenue (Other) £0.0 £0.0 £0.0 £0.0 £0.0 £0.0 £0.0Operating Costs -£19.1 £0.0 £0.0 -£19.1 £0.0 £0.0 £0.0Renewal Costs £0.0 £0.0 £0.0 £0.0 £0.0 £0.0 £0.0Investment Costs £0.0 £0.0 £0.0 £0.0 £0.0 £0.0 £0.0Grant/Subsidy Payments £5.0 £0.0 £5.0 £0.0 £0.0 £0.0Subtotal £0.0 £0.0 £0.0 £0.0 £0.0 £0.0 £0.0
BUSINESS
Other Business Impacts
Developer/Other Contributions £0.0Subtotal £0.0Total Impact on Business £0.0
TOTAL
Present Value of Transport Economic Efficiency Benefits (PVB)
£24.1

Doc No 1 Rev: 0 Date: October 2008 46 U:\Projects\CTDAKA - CTDAKZ\CTDAKI - Glasgow - Oban Service Enhancements\DOCS\Outgoing\20090115 Oban - Glasgow RSE Final Report + Covers.doc
Table 6-3: Public Accounts Table – Optimistic Demand
PUBLIC ACCOUNTS
Oban - Glasgow Rail Service Enhancements - Optimistic Demand
£m in 2002 prices
ALL MODES ROADPUBLIC
TRANSPORT OTHER
LOCAL GOVERNMENT FUNDING Total Infrastructure All Modes Infrastructure
Revenue (Farebox) £0.0 £0.0 £0.0 £0.0Revenue (Other) £0.0 £0.0 £0.0 £0.0Operating Costs £0.0 £0.0 £0.0 £0.0Renewal Costs £0.0 £0.0 £0.0 £0.0Investment Costs £0.0 £0.0 £0.0 £0.0Developer & Other Contributions £0.0 £0.0 £0.0 £0.0Grant/Subsidy Payments £0.0 £0.0 £0.0 £0.0Total Local Government Funding £0.0 £0.0 £0.0 £0.0
ALL MODES ROADPUBLIC
TRANSPORT OTHER
CENTRAL GOVERNMENT FUNDING Total Infrastructure All Modes Infrastructure
Revenue (Farebox) £0.0 £0.0 £0.0 £0.0Revenue (Other) £0.0 £0.0 £0.0 £0.0Operating Costs £0.0 £0.0 £0.0 £0.0Renewal Costs £0.0 £0.0 £0.0 £0.0Investment Costs £0.0 £0.0 £0.0 £0.0Developer & Other Contributions £0.0 £0.0 £0.0 £0.0Grant/Subsidy Payments £5.0 £0.0 £5.0 £0.0Indirect Taxation £0.7 £0.7 £0.0 £0.0Total Central Government Funding £5.6 £0.7 £5.0 £0.0
TOTAL
Present Value of Costs (PVC) £5.6
Note: Costs to Government appear as positive numbers, benefits as negative numbers. This is contrary to the STAG approach.

Doc No 1 Rev: 0 Date: October 2008 47 U:\Projects\CTDAKA - CTDAKZ\CTDAKI - Glasgow - Oban Service Enhancements\DOCS\Outgoing\20090115 Oban - Glasgow RSE Final Report + Covers.doc
Table 6-4: Analysis of Monetised Costs and Benefits Table – Optimistic Demand
ANALYSIS OF MONETISED COSTS AND BENEFITS
Oban - Glasgow Rail Service Enhancements - Optimistic De
£m in 2002 pricesTRANSPORT ECONOMIC EFFICIENCY
Noise £0.1
Local Air Quality £0.3
Climate Change £0.1
Journey Ambience £0.0Accidents £0.0Consumer Users £24.1
Business Users and Providers £0.0Reliability £3.5
Wider Economic Benefits £0.0Infrastructure £0.0Option Values £0.0
Present Value of Benefits (PVB) £28.0
PUBLIC ACCOUNTS
Local Government Funding £0.0Central Government Funding £5.6
Present Value of Costs (PVC) £5.6
OVERALL IMPACTS
Net Present Value (NPV) £22.4
Benefit to Cost Ratio (BCR) 5.0

Doc No 1 Rev: 0 Date: October 2008 48 U:\Projects\CTDAKA - CTDAKZ\CTDAKI - Glasgow - Oban Service Enhancements\DOCS\Outgoing\20090115 Oban - Glasgow RSE Final Report + Covers.doc
Table 6-5: Transport Economic Efficiency Table - Pessimistic Demand
TRANSPORT ECONOMIC EFFICIENCY
Oban - Glasgow Rail Service Enhancements - Pessimistic Demand
£m in 2002 pricesCONSUMERS ALL MODES ROAD BUS & COACH RAIL TRAM OTHERUser Benefits Total Private Cars
and LGVsPassengers Passengers Passengers Walkers,
Cyclists Etc
Travel Time Savings £34.2 £1.8 £0.0 £32.4 £0.0 £0.0Amenity/Facility Benefits £0.0 £0.0 £0.0 £0.0 £0.0 £0.0Vehicle Operating Costs £1.2 £1.2 £0.0User Charges -£13.1 £0.0 £0.0 -£13.1 £0.0 £0.0During Construction & Maintenance £0.0 £0.0 £0.0 £0.0 £0.0 £0.0Total Impact on Consumers £22.4 £3.0 £0.0 £19.4 £0.0 £0.0
BUSINESS ALL MODES ROAD ROAD BUS & COACH RAIL TRAM OTHERUser Benefits Total Goods Vehicles Business Cars
and LGVsPassengers Passengers Passengers Walkers,
Cyclists Etc
Travel Time Savings £0.0 £0.0 £0.0 £0.0 £0.0 £0.0 £0.0Amenity/Facility Benefits £0.0 £0.0 £0.0 £0.0 £0.0 £0.0 £0.0Vehicle Operating Costs £0.0 £0.0 £0.0 £0.0User Charges £0.0 £0.0 £0.0 £0.0 £0.0 £0.0 £0.0During Construction & Maintenance £0.0 £0.0 £0.0 £0.0 £0.0 £0.0 £0.0Subtotal £0.0 £0.0 £0.0 £0.0 £0.0 £0.0 £0.0
BUSINESS ALL MODES ROAD BUS & COACH RAIL RAIL TRAM OTHERPrivate Sector Provider Impacts Total General Operators TOCs FOCs Operators Other Public
Transport
Revenue (Farebox) £13.1 £0.0 £0.0 £13.1 £0.0 £0.0 £0.0Revenue (Other) £0.0 £0.0 £0.0 £0.0 £0.0 £0.0 £0.0Operating Costs -£19.1 £0.0 £0.0 -£19.1 £0.0 £0.0 £0.0Renewal Costs £0.0 £0.0 £0.0 £0.0 £0.0 £0.0 £0.0Investment Costs £0.0 £0.0 £0.0 £0.0 £0.0 £0.0 £0.0Grant/Subsidy Payments £6.0 £0.0 £6.0 £0.0 £0.0 £0.0Subtotal £0.0 £0.0 £0.0 £0.0 £0.0 £0.0 £0.0
BUSINESS
Other Business Impacts
Developer/Other Contributions £0.0Subtotal £0.0Total Impact on Business £0.0
TOTAL
Present Value of Transport Economic Efficiency Benefits (PVB)
£22.4
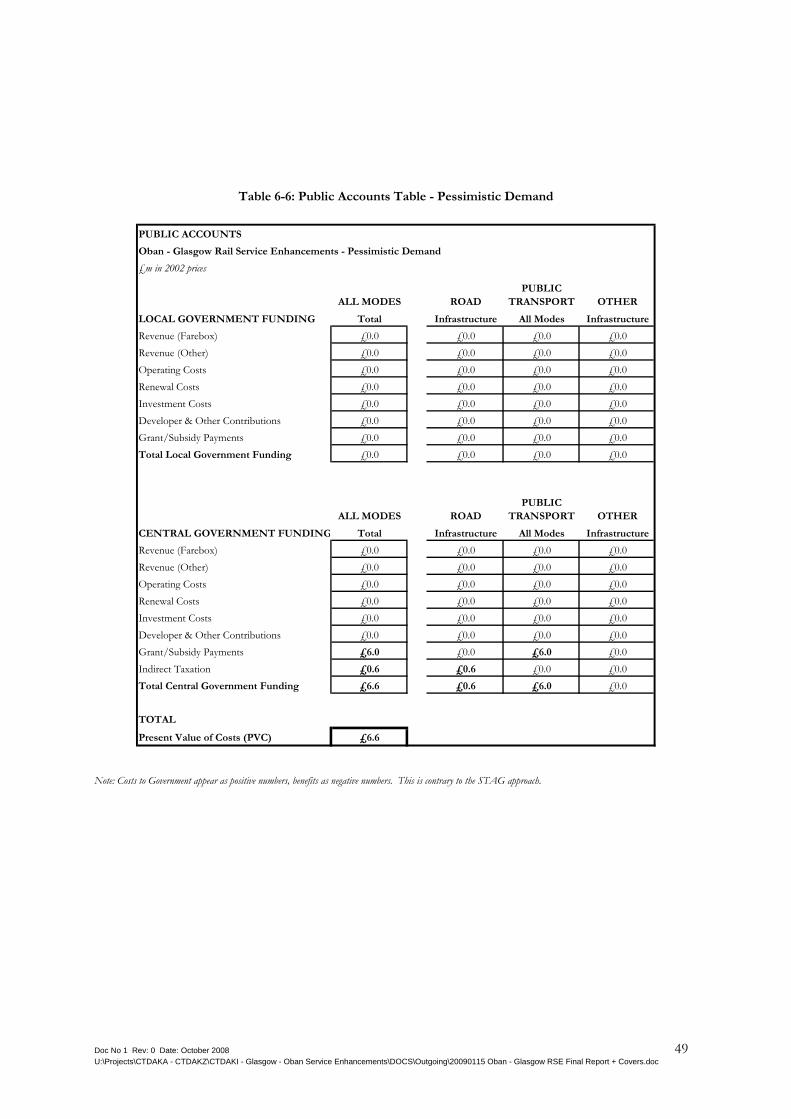
Doc No 1 Rev: 0 Date: October 2008 49 U:\Projects\CTDAKA - CTDAKZ\CTDAKI - Glasgow - Oban Service Enhancements\DOCS\Outgoing\20090115 Oban - Glasgow RSE Final Report + Covers.doc
Table 6-6: Public Accounts Table - Pessimistic Demand
PUBLIC ACCOUNTS
Oban - Glasgow Rail Service Enhancements - Pessimistic Demand
£m in 2002 prices
ALL MODES ROADPUBLIC
TRANSPORT OTHER
LOCAL GOVERNMENT FUNDING Total Infrastructure All Modes Infrastructure
Revenue (Farebox) £0.0 £0.0 £0.0 £0.0Revenue (Other) £0.0 £0.0 £0.0 £0.0Operating Costs £0.0 £0.0 £0.0 £0.0Renewal Costs £0.0 £0.0 £0.0 £0.0Investment Costs £0.0 £0.0 £0.0 £0.0Developer & Other Contributions £0.0 £0.0 £0.0 £0.0Grant/Subsidy Payments £0.0 £0.0 £0.0 £0.0Total Local Government Funding £0.0 £0.0 £0.0 £0.0
ALL MODES ROADPUBLIC
TRANSPORT OTHER
CENTRAL GOVERNMENT FUNDING Total Infrastructure All Modes Infrastructure
Revenue (Farebox) £0.0 £0.0 £0.0 £0.0Revenue (Other) £0.0 £0.0 £0.0 £0.0Operating Costs £0.0 £0.0 £0.0 £0.0Renewal Costs £0.0 £0.0 £0.0 £0.0Investment Costs £0.0 £0.0 £0.0 £0.0Developer & Other Contributions £0.0 £0.0 £0.0 £0.0Grant/Subsidy Payments £6.0 £0.0 £6.0 £0.0Indirect Taxation £0.6 £0.6 £0.0 £0.0Total Central Government Funding £6.6 £0.6 £6.0 £0.0
TOTAL
Present Value of Costs (PVC) £6.6
Note: Costs to Government appear as positive numbers, benefits as negative numbers. This is contrary to the STAG approach.

Doc No 1 Rev: 0 Date: October 2008 50 U:\Projects\CTDAKA - CTDAKZ\CTDAKI - Glasgow - Oban Service Enhancements\DOCS\Outgoing\20090115 Oban - Glasgow RSE Final Report + Covers.doc
Table 6-7: Analysis of Monetised Costs and Benefits Table - Pessimistic Demand
ANALYSIS OF MONETISED COSTS AND BENEFITS
Oban - Glasgow Rail Service Enhancements - Pessimistic D
£m in 2002 pricesTRANSPORT ECONOMIC EFFICIENCY
Noise £0.1
Local Air Quality £0.2
Climate Change £0.1
Journey Ambience £0.0Accidents £0.0Consumer Users £22.4
Business Users and Providers £0.0Reliability £3.2
Wider Economic Benefits £0.0Infrastructure £0.0Option Values £0.0
Present Value of Benefits (PVB) £26.0
PUBLIC ACCOUNTS
Local Government Funding £0.0Central Government Funding £6.6
Present Value of Costs (PVC) £6.6
OVERALL IMPACTS
Net Present Value (NPV) £19.4
Benefit to Cost Ratio (BCR) 3.9

Doc No 1 Rev: 0 Date: October 2008 51 U:\Projects\CTDAKA - CTDAKZ\CTDAKI - Glasgow - Oban Service Enhancements\DOCS\Outgoing\20090115 Oban - Glasgow RSE Final Report + Covers.doc
Table 6-8: West Highland Line Rail Traffic Growth Projections - Optimistic Demand

Doc No 1 Rev: 0 Date: October 2008 52 U:\Projects\CTDAKA - CTDAKZ\CTDAKI - Glasgow - Oban Service Enhancements\DOCS\Outgoing\20090115 Oban - Glasgow RSE Final Report + Covers.doc
Table 6-9: West Highland Line Rail Traffic Growth Projections - Pessimistic Demand

Doc No 1 Rev: 0 Date: October 2008 53 U:\Projects\CTDAKA - CTDAKZ\CTDAKI - Glasgow - Oban Service Enhancements\DOCS\Outgoing\20090115 Oban - Glasgow RSE Final Report + Covers.doc