NYMEX/COMEX Exchange Volume Report - Monthly · 3.5% fuel oil cid med swa 7d 40 48 -16.7% 60 -33.3...
23
NYMEX/COMEX Exchange Volume Report - Monthly Ag Products Futures COCOA TAS CJ 0 3 -100.0% 0 0.0% 5 86 -94.2% COFFEE KT 0 0 0.0% 0 0.0% 0 40 -100.0% COTTON TT 7 0 0.0% 9 -22.2% 20 16 25.0% SUGAR 11 YO 0 0 0.0% 0 0.0% 58 42 38.1% Energy Futures CRUDE OIL PHY CL 24,506,904 25,030,682 -2.1% 21,113,108 16.1% 256,133,753 262,212,356 -2.3% CRUDE OIL WS 0 6,854 -100.0% 0 0.0% 15,639 59,291 -73.6% MINY WTI CRUDE OIL QM 469,979 233,943 100.9% 298,906 57.2% 3,459,217 2,599,082 33.1% BRENT OIL LAST DAY BZ 2,269,787 1,440,978 57.5% 1,563,565 45.2% 17,894,597 18,974,911 -5.7% HEATING OIL PHY HO 3,966,113 3,849,612 3.0% 3,440,127 15.3% 38,522,103 36,542,513 5.4% HTG OIL BH 12 72 -83.3% 0 0.0% 96 340 -71.8% MINY HTG OIL QH 4 3 33.3% 7 -42.9% 40 28 42.9% RBOB PHY RB 4,626,302 3,734,544 23.9% 3,900,976 18.6% 42,255,446 42,825,091 -1.3% MINY RBOB GAS QU 4 4 0.0% 5 -20.0% 37 43 -14.0% NATURAL GAS HP 106,595 124,425 -14.3% 129,912 -17.9% 1,126,543 1,401,918 -19.6% LTD NAT GAS HH 461,203 266,133 73.3% 385,679 19.6% 3,548,583 2,910,615 21.9% MINY NATURAL GAS QG 47,272 24,478 93.1% 24,447 93.4% 274,874 243,223 13.0% PJM MONTHLY JM 0 0 0.0% 0 0.0% 0 120 -100.0% NATURAL GAS PHY NG 12,263,891 10,583,256 15.9% 9,776,577 25.4% 92,185,458 87,884,674 4.9% RBOB GAS RT 12 2,192 -99.5% 0 0.0% 14,386 24,696 -41.7% 3.5% FUEL OIL CID MED SWA 7D 40 48 -16.7% 60 -33.3% 612 965 -36.6% 3.5% FUEL OIL CIF BALMO S 8D 0 0 0.0% 0 0.0% 95 175 -45.7% AEP-DAYTON HUB DAILY VD 0 0 0.0% 0 0.0% 0 0 0.0% AEP-DAYTON HUB MTHLY VM 0 0 0.0% 0 0.0% 0 0 0.0% AEP-DAYTON HUB OFF-PEAK M VP 0 0 0.0% 0 0.0% 0 0 0.0% ALGON CITY GATES NAT GAS N7 0 0 0.0% 0 0.0% 0 0 0.0% ALGONQUIN CITYGATES BASIS B4 0 0 0.0% 0 0.0% 0 0 0.0% ANR LOUISIANA BASIS SWAP ND 0 0 0.0% 0 0.0% 0 0 0.0% ANR OKLAHOMA NE 0 0 0.0% 0 0.0% 0 0 0.0% APPALACHIAN COAL (PHY) QL 0 0 0.0% 0 - 0 0 0.0% ARGUS LLS VS. WTI (ARG) T E5 23,356 23,165 0.8% 12,328 89.5% 222,795 104,822 112.5% ARGUS PROPAN FAR EST INDE 7E 7,829 3,201 144.6% 6,308 24.1% 59,924 24,530 144.3% Commodity VOLUME OCT 2018 VOLUME OCT 2017 % CHG VOLUME SEP 2018 % CHG VOLUME Y.T.D 2018 VOLUME Y.T.D 2017 % CHG The information herein is taken form source believed to be reliable. However, it is intended for the purposes of information and education only and is not guaranteed by the CME Group as to accuracy, completeness, nor trading results and does not constitute advice or continue a solicitation of the purchase or sale of any futures or options. The Rules and Regulations of the CME Group should be consulted as the authoritative source on all current contract specifications and regulations. The open interest values are based on preliminary open interest values only.
Transcript of NYMEX/COMEX Exchange Volume Report - Monthly · 3.5% fuel oil cid med swa 7d 40 48 -16.7% 60 -33.3...
NYMEX/COMEX Exchange Volume Report - Monthly
Ag Products FuturesCOCOA TAS CJ 0 3 -100.0% 0 0.0% 5 86 -94.2%COFFEE KT 0 0 0.0% 0 0.0% 0 40 -100.0%COTTON TT 7 0 0.0% 9 -22.2% 20 16 25.0%SUGAR 11 YO 0 0 0.0% 0 0.0% 58 42 38.1%
Energy FuturesCRUDE OIL PHY CL 24,506,904 25,030,682 -2.1% 21,113,108 16.1% 256,133,753 262,212,356 -2.3%CRUDE OIL WS 0 6,854 -100.0% 0 0.0% 15,639 59,291 -73.6%MINY WTI CRUDE OIL QM 469,979 233,943 100.9% 298,906 57.2% 3,459,217 2,599,082 33.1%BRENT OIL LAST DAY BZ 2,269,787 1,440,978 57.5% 1,563,565 45.2% 17,894,597 18,974,911 -5.7%HEATING OIL PHY HO 3,966,113 3,849,612 3.0% 3,440,127 15.3% 38,522,103 36,542,513 5.4%HTG OIL BH 12 72 -83.3% 0 0.0% 96 340 -71.8%MINY HTG OIL QH 4 3 33.3% 7 -42.9% 40 28 42.9%RBOB PHY RB 4,626,302 3,734,544 23.9% 3,900,976 18.6% 42,255,446 42,825,091 -1.3%MINY RBOB GAS QU 4 4 0.0% 5 -20.0% 37 43 -14.0%NATURAL GAS HP 106,595 124,425 -14.3% 129,912 -17.9% 1,126,543 1,401,918 -19.6%LTD NAT GAS HH 461,203 266,133 73.3% 385,679 19.6% 3,548,583 2,910,615 21.9%MINY NATURAL GAS QG 47,272 24,478 93.1% 24,447 93.4% 274,874 243,223 13.0%PJM MONTHLY JM 0 0 0.0% 0 0.0% 0 120 -100.0%NATURAL GAS PHY NG 12,263,891 10,583,256 15.9% 9,776,577 25.4% 92,185,458 87,884,674 4.9%RBOB GAS RT 12 2,192 -99.5% 0 0.0% 14,386 24,696 -41.7%3.5% FUEL OIL CID MED SWA 7D 40 48 -16.7% 60 -33.3% 612 965 -36.6%3.5% FUEL OIL CIF BALMO S 8D 0 0 0.0% 0 0.0% 95 175 -45.7%AEP-DAYTON HUB DAILY VD 0 0 0.0% 0 0.0% 0 0 0.0%AEP-DAYTON HUB MTHLY VM 0 0 0.0% 0 0.0% 0 0 0.0%AEP-DAYTON HUB OFF-PEAK M VP 0 0 0.0% 0 0.0% 0 0 0.0%ALGON CITY GATES NAT GAS N7 0 0 0.0% 0 0.0% 0 0 0.0%ALGONQUIN CITYGATES BASIS B4 0 0 0.0% 0 0.0% 0 0 0.0%ANR LOUISIANA BASIS SWAP ND 0 0 0.0% 0 0.0% 0 0 0.0%ANR OKLAHOMA NE 0 0 0.0% 0 0.0% 0 0 0.0%APPALACHIAN COAL (PHY) QL 0 0 0.0% 0 - 0 0 0.0%ARGUS LLS VS. WTI (ARG) T E5 23,356 23,165 0.8% 12,328 89.5% 222,795 104,822 112.5%ARGUS PROPAN FAR EST INDE 7E 7,829 3,201 144.6% 6,308 24.1% 59,924 24,530 144.3%
CommodityVOLUME
OCT 2018VOLUME
OCT 2017 % CHGVOLUMESEP 2018 % CHG
VOLUMEY.T.D 2018
VOLUMEY.T.D 2017 % CHG
The information herein is taken form source believed to be reliable. However, it is intended for the purposes of information and education only and is not guaranteed by the CME Group as to accuracy, completeness, nor trading resultsand does not constitute advice or continue a solicitation of the purchase or sale of any futures or options. The Rules and Regulations of the CME Group should be consulted as the authoritative source on all current contractspecifications and regulations. The open interest values are based on preliminary open interest values only.
NYMEX/COMEX Exchange Volume Report - Monthly
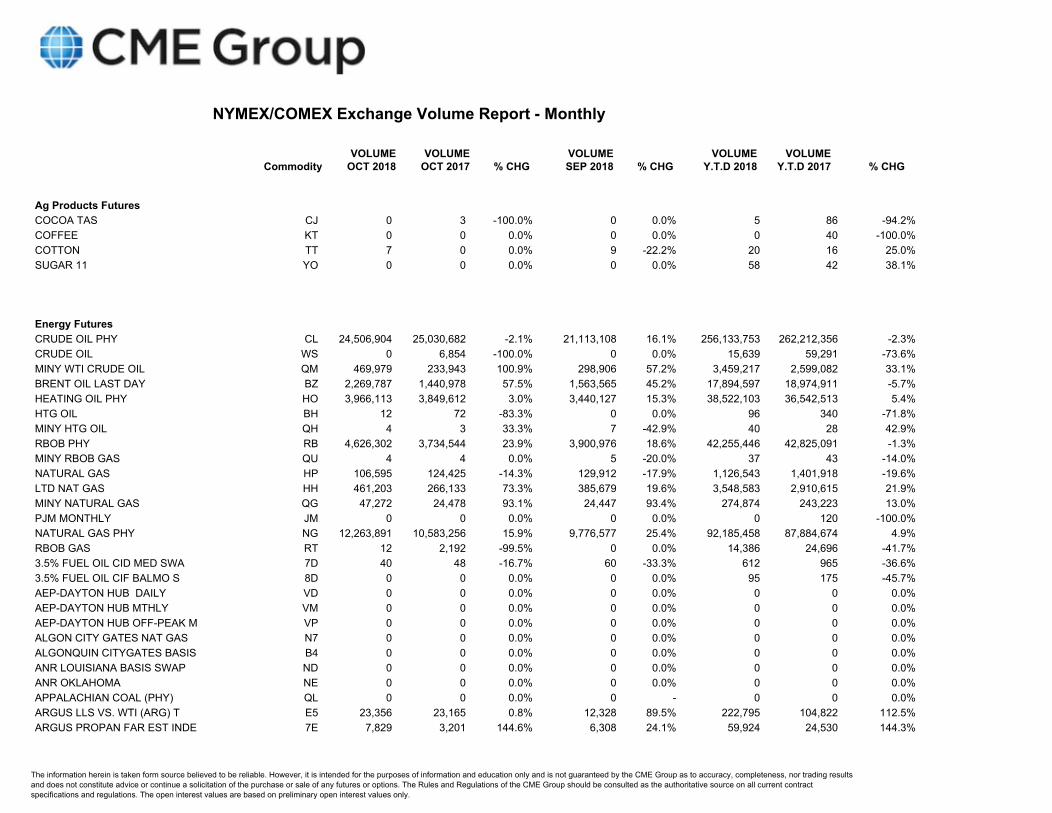
Energy FuturesARGUS PROPAN(SAUDI ARAMCO 9N 3,203 1,194 168.3% 4,662 -31.3% 28,419 10,390 173.5%AUSTRIALIAN COKE COAL ACT 0 0 - 0 0.0% 20 0 -AUSTRIALIAN COKE COAL ALW 0 0 0.0% 0 0.0% 0 1,003 -100.0%BRENT BALMO SWAP J9 0 0 0.0% 100 -100.0% 285 578 -50.7%BRENT CALENDAR SWAP CY 5,313 2,239 137.3% 2,810 89.1% 36,112 28,188 28.1%BRENT CFD SWAP 6W 0 0 - 0 0.0% 300 0 -BRENT FINANCIAL FUTURES BB 3,600 1,022 252.3% 2,000 80.0% 19,864 42,033 -52.7%BRENT FINANCIAL FUTURES MBC 0 0 0.0% 0 0.0% 127 0 0.0%BRENT FINANCIAL FUTURES MDB 0 0 0.0% 0 0.0% 224 278 -19.4%BRENT OIL LAST DAY BZL 0 0 0.0% 0 0.0% 0 0 0.0%BRENT OIL LAST DAY BZS 0 0 0.0% 0 0.0% 0 0 0.0%CAISO SP15 EZGNHUB5 MW P 9X 0 0 0.0% 0 0.0% 0 7,940 -100.0%CAISO SP15 EZGNHUB5 PEAK 9Z 0 0 0.0% 0 0.0% 0 0 0.0%CANADIAN LIGHT SWEET OIL CIL 0 30 -100.0% 0 0.0% 0 7,344 -100.0%CENTERPOINT BASIS SWAP PW 0 0 0.0% 0 0.0% 36 534 -93.3%CENTERPOINT EAST INDEX II 0 0 0.0% 0 - 0 0 0.0%CEU ENERGY DEB 0 0 - 111 -100.0% 3,102 0 -CEU ENERGY TTF 242 0 - 6,557 -96.3% 14,396 0 -CEU ENERGY UKG 327 0 - 5,342 -93.9% 46,381 0 -CHICAGO ETHANOL SWAP CU 77,796 131,831 -41.0% 85,728 -9.3% 967,391 1,137,683 -15.0%CHICAGO ULSD (PLATTS) SWA 4C 0 0 0.0% 0 0.0% 0 0 0.0%CHICAGO ULSD PL VS HO SPR 5C 325 45 622.2% 630 -48.4% 4,075 1,483 174.8%CHICAGO UNL GAS PL VS RBO 3C 0 0 0.0% 0 0.0% 950 0 0.0%CIG BASIS CI 25 0 0.0% 0 0.0% 221 726 -69.6%CIG ROCKIES NG INDEX SWA Z8 0 0 0.0% 0 0.0% 0 720 -100.0%CINERGY HUB OFF-PEAK MONT EJ 0 0 0.0% 0 0.0% 0 0 0.0%CINERGY HUB PEAK MONTH EM 0 0 0.0% 0 0.0% 0 0 0.0%CIN HUB 5MW D AH O PK K2 0 0 0.0% 0 0.0% 0 326,080 -100.0%CIN HUB 5MW D AH PK H5 846 508 66.5% 982 -13.8% 11,838 17,693 -33.1%CIN HUB 5MW REAL TIME O P H4 0 0 0.0% 0 0.0% 0 397,000 -100.0%CIN HUB 5MW REAL TIME PK H3 0 210 -100.0% 1,275 -100.0% 1,505 25,625 -94.1%COAL SWAP ACM 0 110 -100.0% 45 -100.0% 510 1,605 -68.2%COAL SWAP SSI 0 0 0.0% 0 0.0% 0 0 0.0%COLUMB GULF MAINLINE NG B 5Z 0 0 0.0% 0 0.0% 0 999 -100.0%COLUMBIA GULF MAIN NAT G L2 0 0 0.0% 0 - 0 0 0.0%COLUMBIA GULF ONSHORE GL 0 0 0.0% 0 0.0% 0 1,332 -100.0%
CommodityVOLUME
OCT 2018VOLUME
OCT 2017 % CHGVOLUMESEP 2018 % CHG
VOLUMEY.T.D 2018
VOLUMEY.T.D 2017 % CHG
The information herein is taken form source believed to be reliable. However, it is intended for the purposes of information and education only and is not guaranteed by the CME Group as to accuracy, completeness, nor trading resultsand does not constitute advice or continue a solicitation of the purchase or sale of any futures or options. The Rules and Regulations of the CME Group should be consulted as the authoritative source on all current contractspecifications and regulations. The open interest values are based on preliminary open interest values only.
NYMEX/COMEX Exchange Volume Report - Monthly
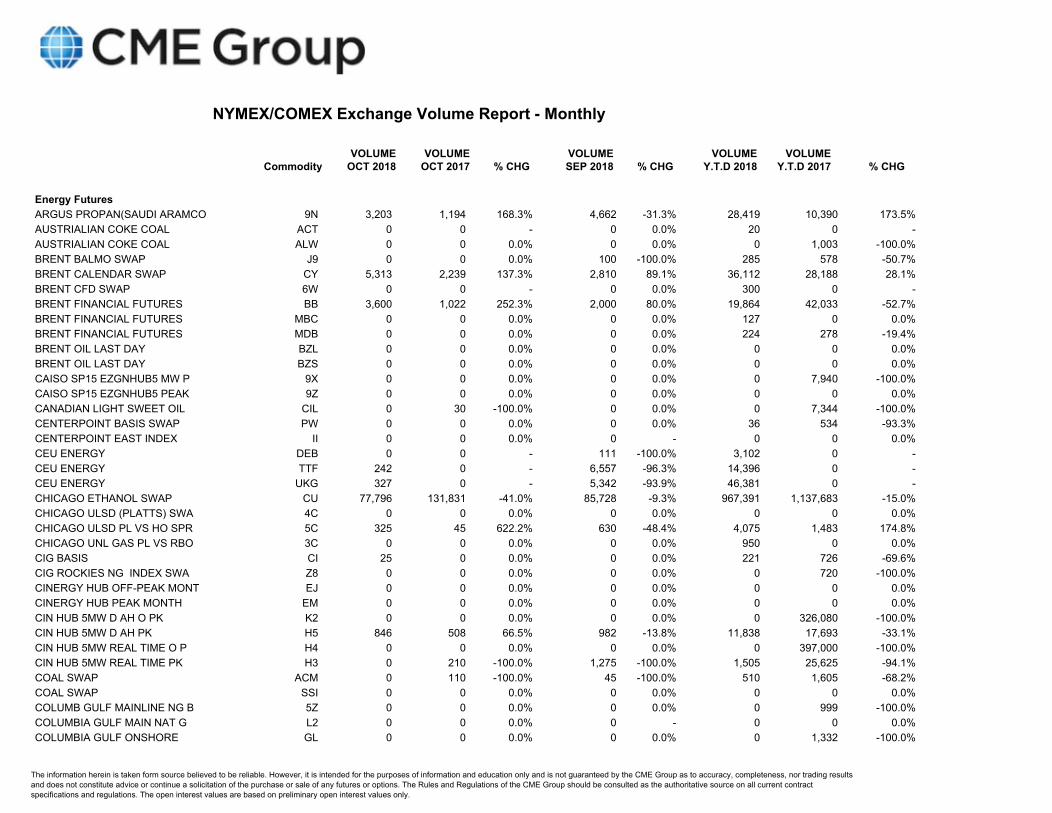
Energy FuturesCONWAY NATURAL GASOLINE (OPIS) SWAP 8L 114 263 -56.7% 127 -10.2% 1,738 2,830 -38.6%CONWAY NORMAL BUTANE (OPIS) SWAP 8M 90 605 -85.1% 135 -33.3% 2,761 7,965 -65.3%CONWAY PROPANE 5 DECIMALS SWAP 8K 16,869 7,336 129.9% 13,861 21.7% 161,274 88,467 82.3%CRUDE OIL CHB 0 0 0.0% 0 - 0 0 0.0%CRUDE OIL LPS 3,450 4,509 -23.5% 4,080 -15.4% 45,385 39,255 15.6%CRUDE OIL OUTRIGHTS 37 0 0 0.0% 0 - 0 0 0.0%CRUDE OIL OUTRIGHTS 42 223 0 0.0% 367 -39.2% 2,485 5,647 -56.0%CRUDE OIL OUTRIGHTS CC5 210 0 0.0% 90 133.3% 300 600 -50.0%CRUDE OIL OUTRIGHTS CPD 0 0 - 0 0.0% 2,956 0 -CRUDE OIL OUTRIGHTS CSN 0 0 0.0% 0 0.0% 0 30 -100.0%CRUDE OIL OUTRIGHTS CSW 0 350 -100.0% 720 -100.0% 2,285 2,550 -10.4%CRUDE OIL OUTRIGHTS DBL 0 0 0.0% 0 0.0% 99 1,625 -93.9%CRUDE OIL OUTRIGHTS FE 0 0 0.0% 0 0.0% 0 330 -100.0%CRUDE OIL OUTRIGHTS GSW 0 45 -100.0% 0 0.0% 105 155 -32.3%CRUDE OIL OUTRIGHTS HTT 53,916 44,615 20.8% 29,964 79.9% 491,448 167,385 193.6%CRUDE OIL OUTRIGHTS LSW 15 1,575 -99.0% 0 0.0% 335 2,910 -88.5%CRUDE OIL OUTRIGHTS SSW 0 90 -100.0% 0 0.0% 0 960 -100.0%CRUDE OIL OUTRIGHTS UMD 0 0 - 0 0.0% 4,800 0 -CRUDE OIL OUTRIGHTS UNS 0 0 - 0 0.0% 7,554 0 -CRUDE OIL OUTRIGHTS WCC 0 0 0.0% 0 0.0% 0 24,737 -100.0%CRUDE OIL OUTRIGHTS WCW 2,495 8,296 -69.9% 4,051 -38.4% 62,856 55,711 12.8%CRUDE OIL PHY CLL 0 0 0.0% 0 0.0% 0 0 0.0%CRUDE OIL SPRDS 38 0 0 0.0% 0 0.0% 2,055 0 0.0%CRUDE OIL SPRDS WTT 8,438 35,045 -75.9% 29,978 -71.9% 404,560 97,679 314.2%CRUDE OIL TRADE AT MARKER SINGAPORE CLS 0 0 0.0% 0 0.0% 0 0 0.0%DAILY PJM AOR 0 0 0.0% 0 0.0% 0 0 0.0%DAILY PJM IDO 0 0 0.0% 0 0.0% 0 0 0.0%DAILY PJM NOC 0 0 0.0% 0 0.0% 0 0 0.0%DAILY PJM PAP 0 0 0.0% 0 0.0% 0 0 0.0%DAILY PJM PEO 0 0 0.0% 0 0.0% 0 0 0.0%DAILY PJM PNO 0 0 0.0% 0 0.0% 0 0 0.0%DAILY PJM PNP 0 0 0.0% 0 0.0% 0 0 0.0%DAILY PJM PWO 0 0 0.0% 0 0.0% 0 0 0.0%DAILY PJM PWP 0 0 0.0% 0 0.0% 0 0 0.0%DAILY PJM WOR 0 0 0.0% 0 0.0% 0 0 0.0%DAILY PJM ZAO 0 0 0.0% 0 0.0% 0 0 0.0%
CommodityVOLUME
OCT 2018VOLUME
OCT 2017 % CHGVOLUMESEP 2018 % CHG
VOLUMEY.T.D 2018
VOLUMEY.T.D 2017 % CHG
The information herein is taken form source believed to be reliable. However, it is intended for the purposes of information and education only and is not guaranteed by the CME Group as to accuracy, completeness, nor trading resultsand does not constitute advice or continue a solicitation of the purchase or sale of any futures or options. The Rules and Regulations of the CME Group should be consulted as the authoritative source on all current contractspecifications and regulations. The open interest values are based on preliminary open interest values only.

NYMEX/COMEX Exchange Volume Report - Monthly
Energy FuturesDAILY PJM ZGO 0 0 0.0% 0 0.0% 0 0 0.0%DAILY PJM ZJO 0 0 0.0% 0 0.0% 0 0 0.0%DATED BRENT (PLATTS) DAILY SWAP 7G 0 0 0.0% 0 0.0% 0 1,400 -100.0%DATED TO FRONTLINE BRENT FY 150 500 -70.0% 75 100.0% 3,360 14,050 -76.1%DEMARC INDEX FUTURE DI 0 0 0.0% 0 - 0 0 0.0%DEMARC SWING SWAP DT 0 0 0.0% 0 - 0 0 0.0%DIESEL 10P BRG FOB RDM VS 7X 0 0 0.0% 0 0.0% 5 0 0.0%DIESEL 10PPM BARGES FOB B U7 0 0 0.0% 0 0.0% 0 3 -100.0%DLY GAS EURO-BOB OXY GBR 0 0 0.0% 0 - 0 0 0.0%DOMINION TRAN INC - APP I IH 0 0 0.0% 0 0.0% 0 0 0.0%DOMINION TRANSMISSION INC PG 0 93 -100.0% 0 0.0% 126 48,609 -99.7%DUBAI CRUDE OIL BALMO BI 0 0 0.0% 0 0.0% 125 0 0.0%DUBAI CRUDE OIL CALENDAR DC 47,370 4,950 857.0% 22,230 113.1% 84,502 77,774 8.7%DY EURO 3.5% FUEL OI RDA FOR 0 0 0.0% 0 0.0% 0 1,500 -100.0%EASTERN RAIL DELIVERY CSX QX 0 105 -100.0% 0 0.0% 245 4,840 -94.9%EAST/WEST FUEL OIL SPREAD EW 0 0 0.0% 0 0.0% 187 1,255 -85.1%EIA FLAT TAX ONHWAY DIESE A5 308 361 -14.7% 863 -64.3% 2,857 7,528 -62.0%ELEC ERCOT DLY OFF PK I4 0 0 - 0 0.0% 0 0 -ELEC ERCOT DLY OFF PK R4 0 0 0.0% 0 - 0 0 0.0%ELEC ERCOT DLY PEAK I3 0 0 - 0 0.0% 0 0 -ELEC ERCOT DLY PEAK I7 0 0 0.0% 0 0.0% 0 0 0.0%ELEC ERCOT DLY PEAK N1 0 0 0.0% 0 - 0 0 0.0%ELEC ERCOT DLY PEAK R1 0 0 0.0% 0 - 0 0 0.0%ELEC ERCOT OFF PEAK I2 0 0 - 0 0.0% 19,600 0 -ELEC FINSETTLED 47 0 0 0.0% 0 0.0% 0 0 0.0%ELEC FINSETTLED 49 0 0 0.0% 0 0.0% 0 0 0.0%ELEC MISO PEAK 4L 0 0 0.0% 0 0.0% 0 3,825 -100.0%ELEC MISO PEAK 55 0 0 0.0% 0 0.0% 0 0 0.0%ELEC NYISO OFF-PEAK 4M 0 0 0.0% 0 0.0% 0 70,200 -100.0%ELEC NYISO OFF-PEAK 58 0 0 0.0% 0 0.0% 0 0 0.0%ELECTRICITY ERCOT PEAK ERE 0 0 0.0% 0 0.0% 0 690 -100.0%ELECTRICITY OFF PEAK 46 0 0 0.0% 0 0.0% 0 0 0.0%ELECTRICITY OFF PEAK 4P 0 0 0.0% 0 - 0 0 0.0%ELECTRICITY OFF PEAK 50 0 0 0.0% 0 0.0% 0 0 0.0%ELEC WEST POWER OFF-PEAK MDA 0 0 0.0% 0 0.0% 0 0 0.0%ELEC WEST POWER PEAK MDC 0 0 0.0% 0 0.0% 0 1,540 -100.0%
CommodityVOLUME
OCT 2018VOLUME
OCT 2017 % CHGVOLUMESEP 2018 % CHG
VOLUMEY.T.D 2018
VOLUMEY.T.D 2017 % CHG
The information herein is taken form source believed to be reliable. However, it is intended for the purposes of information and education only and is not guaranteed by the CME Group as to accuracy, completeness, nor trading resultsand does not constitute advice or continue a solicitation of the purchase or sale of any futures or options. The Rules and Regulations of the CME Group should be consulted as the authoritative source on all current contractspecifications and regulations. The open interest values are based on preliminary open interest values only.

NYMEX/COMEX Exchange Volume Report - Monthly
Energy FuturesEL PASO PERMIAN INDEX SWA IL 0 0 0.0% 0 - 0 0 0.0%ERCOT DAILY 5MW PEAK ERW 0 0 0.0% 0 0.0% 0 0 0.0%ERCOT HOUSTON Z MCPE 5MW PEAK SWAP I1 0 0 0.0% 0 0.0% 1,950 3,880 -49.7%ERCOT NORTH ZMCPE 5MW OFFPEAK I8 0 0 0.0% 0 0.0% 0 0 0.0%ERCOT NORTH ZMCPE 5MW OFFPEAK SWAP I6 0 40,000 -100.0% 0 0.0% 19,600 75,920 -74.2%ERCOT NORTH ZMCPE 5MW PEAK I5 0 0 0.0% 0 0.0% 5,050 4,710 7.2%ETHANOL SWAP MT2 70 0 - 60 16.7% 400 0 -ETHANOL T2 FOB ROTT INCL DUTY SWAP Z1 4,996 4,787 4.4% 2,912 71.6% 31,351 38,486 -18.5%EURO 1% FUEL OIL NEW BALM KX 0 0 0.0% 8 -100.0% 33 18 83.3%EURO 3.5% FUEL OIL RDAM B KR 162 242 -33.1% 110 47.3% 5,439 4,137 31.5%EURO 3.5% FUEL OIL SPREAD FK 6 0 0.0% 0 0.0% 840 4,286 -80.4%EURO-DENOMINATED PETRO PROD NCP 0 0 0.0% 0 0.0% 640 1,514 -57.7%EURO GASOIL 10 CAL SWAP GT 0 0 0.0% 0 - 0 0 0.0%EURO GASOIL 10PPM VS ICE ET 0 0 0.0% 0 0.0% 370 425 -12.9%EUROPE 1% FUEL OIL NWE CA UF 60 20 200.0% 0 0.0% 426 709 -39.9%EUROPE 1% FUEL OIL RDAM C UH 0 0 0.0% 0 0.0% 3 39 -92.3%EUROPE 3.5% FUEL OIL MED UI 159 168 -5.4% 60 165.0% 987 1,381 -28.5%EUROPE 3.5% FUEL OIL RDAM UV 3,333 5,079 -34.4% 2,176 53.2% 73,890 69,388 6.5%EUROPEAN GASOIL (ICE) 7F 1,354 863 56.9% 670 102.1% 5,675 29,330 -80.7%EUROPEAN NAPHTHA BALMO KZ 447 187 139.0% 119 275.6% 2,855 3,521 -18.9%EUROPEAN NAPTHA CRACK SPR EN 15,958 4,039 295.1% 6,419 148.6% 94,868 67,788 39.9%EUROPE DATED BRENT SWAP UB 1,110 0 0.0% 1,090 1.8% 2,200 2,540 -13.4%EUROPE JET KERO NWE CALSW UJ 0 0 0.0% 0 0.0% 39 105 -62.9%EUROPE NAPHTHA CALSWAP UN 5,204 2,273 128.9% 2,979 74.7% 35,492 27,744 27.9%EURO PROPANE CIF ARA SWA PS 2,914 1,560 86.8% 1,393 109.2% 18,267 12,535 45.7%FL GAS ZONE 3 NAT GAS IND Q9 0 0 0.0% 0 - 0 0 0.0%FLORIDA GAS ZONE3 BASIS S FP 0 0 0.0% 0 0.0% 0 0 0.0%FREIGHT MARKETS FLP 565 166 240.4% 216 161.6% 1,848 1,604 15.2%FREIGHT MARKETS FRC 0 0 - 0 0.0% 600 0 -FREIGHT MARKETS FRS 0 0 - 0 0.0% 0 0 -FREIGHT MARKETS T2D 960 0 - 375 156.0% 3,458 0 -FREIGHT MARKETS TC6 0 0 - 0 0.0% 240 0 -FREIGHT MARKETS TD3 0 0 - 0 0.0% 30 0 -FREIGHT MARKETS TD8 150 0 - 0 - 150 0 -FUEL OIL CRACK VS ICE FO 2,815 3,161 -10.9% 1,168 141.0% 36,060 37,811 -4.6%FUEL OIL NWE CRACK VS ICE FI 0 0 0.0% 0 0.0% 171 0 0.0%
CommodityVOLUME
OCT 2018VOLUME
OCT 2017 % CHGVOLUMESEP 2018 % CHG
VOLUMEY.T.D 2018
VOLUMEY.T.D 2017 % CHG
The information herein is taken form source believed to be reliable. However, it is intended for the purposes of information and education only and is not guaranteed by the CME Group as to accuracy, completeness, nor trading resultsand does not constitute advice or continue a solicitation of the purchase or sale of any futures or options. The Rules and Regulations of the CME Group should be consulted as the authoritative source on all current contractspecifications and regulations. The open interest values are based on preliminary open interest values only.

NYMEX/COMEX Exchange Volume Report - Monthly
Energy FuturesFUEL OIL (PLATS) CAR CM 1W 0 20 -100.0% 0 0.0% 154 20 670.0%FUEL OIL (PLATS) CAR CN 1X 0 0 0.0% 0 0.0% 120 0 0.0%FUELOIL SWAP:CARGOES VS.B FS 96 137 -29.9% 140 -31.4% 2,114 2,803 -24.6%GAS EURO-BOB OXY NWE BARGES 7H 7,156 4,211 69.9% 6,960 2.8% 76,264 65,628 16.2%GAS EURO-BOB OXY NWE BARGES CRK 7K 21,056 15,154 38.9% 11,584 81.8% 185,372 191,346 -3.1%GASOIL 0.1 BRGS FOB VS IC 6V 0 0 0.0% 0 - 0 0 0.0%GASOIL 0.1 CIF MED SWAP Z4 0 0 0.0% 0 0.0% 0 0 0.0%GASOIL 0.1CIF MED VS ICE Z5 0 0 0.0% 0 0.0% 10 50 -80.0%GASOIL 0.1 CIF NWE VS ISE TU 0 0 0.0% 0 0.0% 0 0 0.0%GASOIL 0.1 CIF VS ICE GAS 8W 0 0 0.0% 0 0.0% 0 20 -100.0%GASOIL 0.1 CRG CIF NW VS 4V 0 0 0.0% 0 - 0 0 0.0%GASOIL 0.1 RDAM BRGS VS I WQ 0 24 -100.0% 0 0.0% 10 174 -94.3%GASOIL 0.1 ROTTERDAM BARG VL 15 10 50.0% 195 -92.3% 1,470 110 1,236.4%GASOIL 10P CRG CIF NW VS 3V 0 0 0.0% 0 0.0% 0 25 -100.0%GASOIL 10PPM CARGOES CIF TY 0 0 0.0% 0 - 0 0 0.0%GASOIL 10PPM VS ICE SWAP TP 0 0 0.0% 0 0.0% 12 712 -98.3%GASOIL BULLET SWAP BG 0 0 0.0% 0 0.0% 0 130 -100.0%GASOIL CALENDAR SWAP GX 0 0 0.0% 0 0.0% 54 244 -77.9%GASOIL CRACK SPREAD CALEN GZ 100 2,373 -95.8% 1,850 -94.6% 37,502 67,768 -44.7%GASOIL MINI CALENDAR SWAP QA 312 50 524.0% 270 15.6% 2,024 1,350 49.9%GASOLINE UP-DOWN BALMO SW 1K 0 0 0.0% 0 - 0 0 0.0%GROUP THREE ULSD (PLATTS) A7 0 0 0.0% 0 0.0% 205 125 64.0%GROUP THREE UNLEAD GAS (P A9 0 0 - 0 0.0% 425 0 -GRP THREE ULSD(PLT)VS HEA A6 3,515 5,710 -38.4% 4,200 -16.3% 35,433 42,295 -16.2%GRP THREE UNL GS (PLT) VS A8 3,485 2,410 44.6% 2,345 48.6% 21,607 10,134 113.2%GULF COAST 3% FUEL OIL BA VZ 1,162 531 118.8% 271 328.8% 12,899 11,605 11.2%GULF COAST GASOLINE CLNDR GS 0 0 0.0% 0 - 0 0 0.0%GULF COAST JET FUEL CLNDR GE 0 0 0.0% 39 -100.0% 1,195 943 26.7%GULF COAST JET VS NYM 2 H ME 22,133 26,746 -17.2% 40,890 -45.9% 364,631 427,714 -14.7%GULF COAST NO.6 FUEL OIL MF 42,559 38,929 9.3% 32,342 31.6% 547,278 510,266 7.3%GULF COAST NO.6 FUEL OIL MG 682 1,470 -53.6% 921 -26.0% 16,476 12,403 32.8%GULF COAST ULSD CALENDAR LY 431 491 -12.2% 863 -50.1% 3,319 5,520 -39.9%GULF COAST ULSD CRACK SPR GY 120 0 0.0% 0 0.0% 1,415 3,870 -63.4%HEATING OIL BALMO CLNDR S 1G 0 0 0.0% 20 -100.0% 243 830 -70.7%HEATING OIL CRCK SPRD BAL 1H 0 0 0.0% 0 - 0 0 0.0%HEATING OIL PHY HOL 0 0 0.0% 0 0.0% 0 0 0.0%
CommodityVOLUME
OCT 2018VOLUME
OCT 2017 % CHGVOLUMESEP 2018 % CHG
VOLUMEY.T.D 2018
VOLUMEY.T.D 2017 % CHG
The information herein is taken form source believed to be reliable. However, it is intended for the purposes of information and education only and is not guaranteed by the CME Group as to accuracy, completeness, nor trading resultsand does not constitute advice or continue a solicitation of the purchase or sale of any futures or options. The Rules and Regulations of the CME Group should be consulted as the authoritative source on all current contractspecifications and regulations. The open interest values are based on preliminary open interest values only.

NYMEX/COMEX Exchange Volume Report - Monthly
Energy FuturesHENRY HUB BASIS SWAP HB 16,658 1,712 873.0% 7,936 109.9% 32,088 52,732 -39.1%HENRY HUB FINANCIAL LAST NBP 522 1,482 -64.8% 3,831 -86.4% 26,818 2,495 974.9%HENRY HUB FINANCIAL LAST TTE 0 219 -100.0% 30 -100.0% 885 753 17.5%HENRY HUB INDEX SWAP FUTU IN 16,658 1,712 873.0% 7,936 109.9% 32,088 50,542 -36.5%HENRY HUB SWAP NN 164,419 149,205 10.2% 110,276 49.1% 1,681,751 1,866,087 -9.9%HENRY HUB SWING FUTURE SN 0 0 0.0% 0 - 0 0 0.0%HOUSTON SHIP CHANNEL BASI NH 0 0 0.0% 0 0.0% 0 3,777 -100.0%HOUSTON SHIP CHANNEL INDE IP 0 0 0.0% 0 - 0 0 0.0%HUSTN SHIP CHNL PIPE SWP XJ 0 0 0.0% 0 0.0% 0 719 -100.0%ICE BRENT DUBAI SWAP DB 9,840 17,829 -44.8% 7,627 29.0% 100,418 97,455 3.0%ICE GASOIL BALMO SWAP U9 0 0 0.0% 0 0.0% 0 9 -100.0%IN DELIVERY MONTH EUA 6T 1,248 0 0.0% 0 0.0% 1,248 2,850 -56.2%INDIANA MISO FAD 0 0 0.0% 0 0.0% 0 0 0.0%INDIANA MISO FTD 0 0 0.0% 0 0.0% 0 0 0.0%INDIANA MISO FTM 0 0 0.0% 0 0.0% 0 0 0.0%INDIANA MISO PDD 0 0 0.0% 0 0.0% 0 0 0.0%INDIANA MISO PDM 0 0 0.0% 0 - 0 0 0.0%INDIANA MISO PTD 0 0 0.0% 0 0.0% 0 0 0.0%INDIANA MISO PTM 0 0 0.0% 0 - 0 0 0.0%INDONESIAN COAL MCC 0 0 0.0% 0 0.0% 0 5 -100.0%INDONESIAN COAL ICI4 ICI 265 0 - 265 0.0% 1,515 0 -ISO NEW ENGLAND OFF-PEAK KI 0 0 0.0% 0 0.0% 0 0 0.0%ISO NEW ENGLAND PK LMP NI 0 0 0.0% 0 0.0% 0 10 -100.0%JAPAN C&F NAPHTHA CRACK S JB 40 562 -92.9% 0 0.0% 1,729 5,813 -70.3%JAPAN C&F NAPHTHA SWAP JA 2,863 1,104 159.3% 1,758 62.9% 21,110 15,210 38.8%JAPAN NAPHTHA BALMO SWAP E6 82 10 720.0% 28 192.9% 608 1,410 -56.9%JET AV FUEL (P) CAR FM ICE GAS SWAP 1V 0 24 -100.0% 0 0.0% 5 36 -86.1%JET BARGES VS ICE GASOIL JR 0 0 0.0% 0 - 0 0 0.0%JET CIF NWE VS ICE JC 0 59 -100.0% 12 -100.0% 642 975 -34.2%JET FUEL BRG FOB RDM VS I 9Q 0 0 0.0% 0 0.0% 0 5 -100.0%JET FUEL CRG CIF NEW VS I 6X 0 0 0.0% 0 0.0% 0 62 -100.0%JET FUEL UP-DOWN BALMO CL 1M 7,120 7,755 -8.2% 5,320 33.8% 60,197 72,261 -16.7%LA CARB DIESEL (OPIS) LX 0 0 0.0% 0 0.0% 0 0 0.0%LA CARB DIESEL (OPIS) SWA KL 240 25 860.0% 100 140.0% 2,970 1,995 48.9%LA CARBOB GASOLINE(OPIS)S JL 850 25 3,300.0% 100 750.0% 5,100 2,475 106.1%LA JET FUEL VS NYM NO 2 H MQ 0 0 0.0% 0 0.0% 0 25 -100.0%
CommodityVOLUME
OCT 2018VOLUME
OCT 2017 % CHGVOLUMESEP 2018 % CHG
VOLUMEY.T.D 2018
VOLUMEY.T.D 2017 % CHG
The information herein is taken form source believed to be reliable. However, it is intended for the purposes of information and education only and is not guaranteed by the CME Group as to accuracy, completeness, nor trading resultsand does not constitute advice or continue a solicitation of the purchase or sale of any futures or options. The Rules and Regulations of the CME Group should be consulted as the authoritative source on all current contractspecifications and regulations. The open interest values are based on preliminary open interest values only.
NYMEX/COMEX Exchange Volume Report - Monthly
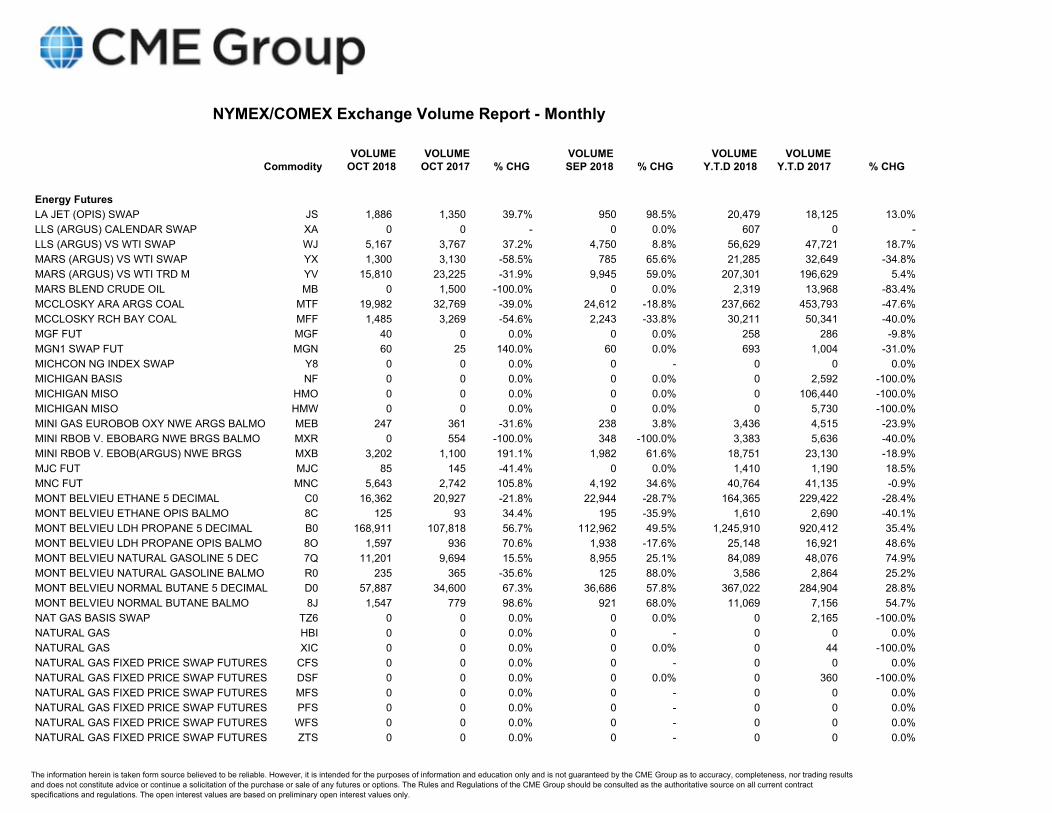
Energy FuturesLA JET (OPIS) SWAP JS 1,886 1,350 39.7% 950 98.5% 20,479 18,125 13.0%LLS (ARGUS) CALENDAR SWAP XA 0 0 - 0 0.0% 607 0 -LLS (ARGUS) VS WTI SWAP WJ 5,167 3,767 37.2% 4,750 8.8% 56,629 47,721 18.7%MARS (ARGUS) VS WTI SWAP YX 1,300 3,130 -58.5% 785 65.6% 21,285 32,649 -34.8%MARS (ARGUS) VS WTI TRD M YV 15,810 23,225 -31.9% 9,945 59.0% 207,301 196,629 5.4%MARS BLEND CRUDE OIL MB 0 1,500 -100.0% 0 0.0% 2,319 13,968 -83.4%MCCLOSKY ARA ARGS COAL MTF 19,982 32,769 -39.0% 24,612 -18.8% 237,662 453,793 -47.6%MCCLOSKY RCH BAY COAL MFF 1,485 3,269 -54.6% 2,243 -33.8% 30,211 50,341 -40.0%MGF FUT MGF 40 0 0.0% 0 0.0% 258 286 -9.8%MGN1 SWAP FUT MGN 60 25 140.0% 60 0.0% 693 1,004 -31.0%MICHCON NG INDEX SWAP Y8 0 0 0.0% 0 - 0 0 0.0%MICHIGAN BASIS NF 0 0 0.0% 0 0.0% 0 2,592 -100.0%MICHIGAN MISO HMO 0 0 0.0% 0 0.0% 0 106,440 -100.0%MICHIGAN MISO HMW 0 0 0.0% 0 0.0% 0 5,730 -100.0%MINI GAS EUROBOB OXY NWE ARGS BALMO MEB 247 361 -31.6% 238 3.8% 3,436 4,515 -23.9%MINI RBOB V. EBOBARG NWE BRGS BALMO MXR 0 554 -100.0% 348 -100.0% 3,383 5,636 -40.0%MINI RBOB V. EBOB(ARGUS) NWE BRGS MXB 3,202 1,100 191.1% 1,982 61.6% 18,751 23,130 -18.9%MJC FUT MJC 85 145 -41.4% 0 0.0% 1,410 1,190 18.5%MNC FUT MNC 5,643 2,742 105.8% 4,192 34.6% 40,764 41,135 -0.9%MONT BELVIEU ETHANE 5 DECIMAL C0 16,362 20,927 -21.8% 22,944 -28.7% 164,365 229,422 -28.4%MONT BELVIEU ETHANE OPIS BALMO 8C 125 93 34.4% 195 -35.9% 1,610 2,690 -40.1%MONT BELVIEU LDH PROPANE 5 DECIMAL B0 168,911 107,818 56.7% 112,962 49.5% 1,245,910 920,412 35.4%MONT BELVIEU LDH PROPANE OPIS BALMO 8O 1,597 936 70.6% 1,938 -17.6% 25,148 16,921 48.6%MONT BELVIEU NATURAL GASOLINE 5 DEC 7Q 11,201 9,694 15.5% 8,955 25.1% 84,089 48,076 74.9%MONT BELVIEU NATURAL GASOLINE BALMO R0 235 365 -35.6% 125 88.0% 3,586 2,864 25.2%MONT BELVIEU NORMAL BUTANE 5 DECIMAL D0 57,887 34,600 67.3% 36,686 57.8% 367,022 284,904 28.8%MONT BELVIEU NORMAL BUTANE BALMO 8J 1,547 779 98.6% 921 68.0% 11,069 7,156 54.7%NAT GAS BASIS SWAP TZ6 0 0 0.0% 0 0.0% 0 2,165 -100.0%NATURAL GAS HBI 0 0 0.0% 0 - 0 0 0.0%NATURAL GAS XIC 0 0 0.0% 0 0.0% 0 44 -100.0%NATURAL GAS FIXED PRICE SWAP FUTURES CFS 0 0 0.0% 0 - 0 0 0.0%NATURAL GAS FIXED PRICE SWAP FUTURES DSF 0 0 0.0% 0 0.0% 0 360 -100.0%NATURAL GAS FIXED PRICE SWAP FUTURES MFS 0 0 0.0% 0 - 0 0 0.0%NATURAL GAS FIXED PRICE SWAP FUTURES PFS 0 0 0.0% 0 - 0 0 0.0%NATURAL GAS FIXED PRICE SWAP FUTURES WFS 0 0 0.0% 0 - 0 0 0.0%NATURAL GAS FIXED PRICE SWAP FUTURES ZTS 0 0 0.0% 0 - 0 0 0.0%
CommodityVOLUME
OCT 2018VOLUME
OCT 2017 % CHGVOLUMESEP 2018 % CHG
VOLUMEY.T.D 2018
VOLUMEY.T.D 2017 % CHG
The information herein is taken form source believed to be reliable. However, it is intended for the purposes of information and education only and is not guaranteed by the CME Group as to accuracy, completeness, nor trading resultsand does not constitute advice or continue a solicitation of the purchase or sale of any futures or options. The Rules and Regulations of the CME Group should be consulted as the authoritative source on all current contractspecifications and regulations. The open interest values are based on preliminary open interest values only.

NYMEX/COMEX Exchange Volume Report - Monthly
Energy FuturesNATURAL GAS INDEX TZI 0 0 0.0% 0 0.0% 0 656 -100.0%NATURAL GAS PEN SWP NP 30,745 53,427 -42.5% 24,871 23.6% 335,558 841,648 -60.1%NEPOOL CNCTCT 5MW D AH O P3 0 0 0.0% 0 0.0% 0 0 0.0%NEPOOL CONECTIC 5MW D AH P2 0 0 0.0% 0 0.0% 0 0 0.0%NEPOOL INTR HUB 5MW D AH H2 31,565 0 0.0% 25,355 24.5% 136,440 235,140 -42.0%NEPOOL INTR HUB 5MW D AH U6 1,695 0 0.0% 6,640 -74.5% 12,711 17,275 -26.4%NEPOOL NE MASS 5MW D AH O P8 0 0 0.0% 0 0.0% 0 14,040 -100.0%NEPOOL NE MASS 5MW D AH P P7 0 0 0.0% 0 0.0% 0 765 -100.0%NEPOOL NEW HAMP 5MW D AH U2 0 0 0.0% 0 - 0 0 0.0%NEPOOL NEW HAMP 5MW D AH U3 0 0 0.0% 0 - 0 0 0.0%NEPOOL RHD ISLD 5MW D AH U4 0 0 0.0% 0 0.0% 0 0 0.0%NEPOOL RHODE IL 5MW D AH U5 0 0 0.0% 0 0.0% 0 0 0.0%NEPOOL SE MASS 5MW D AH O P5 0 0 0.0% 0 - 0 0 0.0%NEPOOL SE MASS 5MW D AH P P4 0 0 0.0% 0 - 0 0 0.0%NEPOOL W CNT MASS 5MW D A L9 0 0 0.0% 0 0.0% 0 0 0.0%NEPOOL W CNTR M 5MW D AH R6 0 0 0.0% 0 0.0% 0 0 0.0%NEW ENGLAND HUB PEAK DAIL CE 0 0 0.0% 0 0.0% 0 0 0.0%NEW YORK ETHANOL SWAP EZ 175 900 -80.6% 850 -79.4% 11,691 8,145 43.5%NEW YORK HUB ZONE G PEAK GN 0 0 0.0% 0 0.0% 0 0 0.0%NEW YORK HUB ZONE J PEAK JN 0 0 0.0% 0 0.0% 0 0 0.0%NGPL MID-CONTINENT NL 1,568 30 5,126.7% 1,480 5.9% 3,448 4,074 -15.4%NGPL MIDCONTINENT INDEX IW 0 0 0.0% 0 - 0 0 0.0%NGPL MIDCONTINENT SWING S PX 0 0 0.0% 0 - 0 0 0.0%NGPL TEX/OK PD 19,520 0 0.0% 2,280 756.1% 44,636 8,134 448.8%NGPL TEXOK INDEX OI 0 0 0.0% 0 - 0 0 0.0%N ILLINOIS HUB DAILY UD 0 0 0.0% 0 0.0% 0 0 0.0%N ILLINOIS HUB MTHLY UM 0 0 0.0% 0 0.0% 0 0 0.0%NO 2 UP-DOWN SPREAD CALEN UT 0 0 0.0% 425 -100.0% 2,983 3,659 -18.5%NORTHEN NATURAL GAS DEMAR PE 0 0 0.0% 0 0.0% 0 0 0.0%NORTHEN NATURAL GAS VENTU PF 0 0 0.0% 0 0.0% 100 84 19.0%NORTHERN ILLINOIS OFF-PEA UO 0 0 0.0% 0 0.0% 0 0 0.0%NORTHWEST ROCKIES BASIS S NR 0 0 0.0% 0 0.0% 0 3,088 -100.0%N ROCKIES PIPE SWAP XR 0 0 0.0% 0 0.0% 59 334 -82.3%NY1% VS GC SPREAD SWAP VR 165 2,126 -92.2% 300 -45.0% 13,398 21,972 -39.0%NY 2.2% FUEL OIL (PLATTS Y3 0 0 0.0% 0 0.0% 0 0 0.0%NY 3.0% FUEL OIL (PLATTS H1 0 0 0.0% 145 -100.0% 1,795 3,260 -44.9%
CommodityVOLUME
OCT 2018VOLUME
OCT 2017 % CHGVOLUMESEP 2018 % CHG
VOLUMEY.T.D 2018
VOLUMEY.T.D 2017 % CHG
The information herein is taken form source believed to be reliable. However, it is intended for the purposes of information and education only and is not guaranteed by the CME Group as to accuracy, completeness, nor trading resultsand does not constitute advice or continue a solicitation of the purchase or sale of any futures or options. The Rules and Regulations of the CME Group should be consulted as the authoritative source on all current contractspecifications and regulations. The open interest values are based on preliminary open interest values only.

NYMEX/COMEX Exchange Volume Report - Monthly
Energy FuturesNY HARBOR 1% FUEL OIL BAL VK 0 0 0.0% 0 0.0% 50 25 100.0%NY HARBOR HEAT OIL SWP MP 5,969 858 595.7% 1,062 462.1% 23,060 22,417 2.9%NY HARBOR LOW SULPUR GAS 1000MBBL NLS 0 0 0.0% 0 0.0% 2,845 4,273 -33.4%NY HARBOR RESIDUAL FUEL 1 MM 659 2,642 -75.1% 969 -32.0% 10,792 25,282 -57.3%NYH NO 2 CRACK SPREAD CAL HK 330 1,112 -70.3% 315 4.8% 8,042 13,614 -40.9%NY H OIL PLATTS VS NYMEX YH 0 0 0.0% 0 - 0 0 0.0%NYISO A KA 0 0 0.0% 0 0.0% 0 0 0.0%NYISO A OFF-PEAK KB 0 0 0.0% 0 0.0% 0 0 0.0%NYISO CAPACITY LHV 400 168 138.1% 0 0.0% 646 453 42.6%NYISO CAPACITY NNC 0 518 -100.0% 120 -100.0% 735 2,306 -68.1%NYISO CAPACITY NRS 60 954 -93.7% 0 0.0% 335 2,767 -87.9%NYISO G KG 0 0 0.0% 0 0.0% 0 0 0.0%NYISO G OFF-PEAK KH 0 0 0.0% 0 0.0% 0 0 0.0%NYISO J KJ 0 0 0.0% 0 0.0% 0 0 0.0%NYISO J OFF-PEAK KK 0 0 0.0% 0 0.0% 0 0 0.0%NYISO ZONE A 5MW D AH O P K4 44,264 0 0.0% 0 0.0% 44,264 32,760 35.1%NYISO ZONE A 5MW D AH PK K3 1,890 0 0.0% 0 0.0% 1,890 6,815 -72.3%NYISO ZONE C 5MW D AH O P A3 0 0 0.0% 0 0.0% 0 0 0.0%NYISO ZONE C 5MW D AH PK Q5 0 0 0.0% 0 0.0% 0 110 -100.0%NYISO ZONE G 5MW D AH O P D2 13,980 0 0.0% 0 0.0% 614,834 780,585 -21.2%NYISO ZONE G 5MW D AH PK T3 730 0 0.0% 1,510 -51.7% 20,524 55,044 -62.7%NYISO ZONE J 5MW D AH O P D4 0 0 0.0% 0 0.0% 0 226,600 -100.0%NYISO ZONE J 5MW D AH PK D3 0 0 0.0% 0 0.0% 0 24,975 -100.0%NY JET FUEL (PLATTS) HEAT OIL SWAP 1U 0 0 0.0% 0 - 0 0 0.0%NYMEX ALUMINUM FUTURES AN 0 0 0.0% 0 0.0% 0 0 0.0%NYMEX ULSD VS NYMEX HO UY 0 0 0.0% 0 0.0% 0 0 0.0%NY ULSD (ARGUS) VS HEATING OIL 7Y 0 0 0.0% 0 0.0% 213 8,232 -97.4%ONEOK OKLAHOMA NG BASIS 8X 0 600 -100.0% 1,240 -100.0% 2,704 1,788 51.2%ONTARIO POWER SWAPS OFD 0 0 0.0% 0 0.0% 0 0 0.0%ONTARIO POWER SWAPS OFM 0 0 0.0% 0 0.0% 0 0 0.0%ONTARIO POWER SWAPS OPD 0 0 0.0% 0 0.0% 10 505 -98.0%ONTARIO POWER SWAPS OPM 0 0 0.0% 0 0.0% 0 650 -100.0%PANHANDLE BASIS SWAP FUTU PH 0 0 0.0% 0 0.0% 275 3,060 -91.0%PANHANDLE INDEX SWAP FUTU IV 0 0 0.0% 0 - 0 0 0.0%PANHANDLE PIPE SWAP XH 0 2,364 -100.0% 0 0.0% 0 3,228 -100.0%PERMIAN BASIS SWAP PM 0 0 0.0% 0 0.0% 0 1,381 -100.0%
CommodityVOLUME
OCT 2018VOLUME
OCT 2017 % CHGVOLUMESEP 2018 % CHG
VOLUMEY.T.D 2018
VOLUMEY.T.D 2017 % CHG
The information herein is taken form source believed to be reliable. However, it is intended for the purposes of information and education only and is not guaranteed by the CME Group as to accuracy, completeness, nor trading resultsand does not constitute advice or continue a solicitation of the purchase or sale of any futures or options. The Rules and Regulations of the CME Group should be consulted as the authoritative source on all current contractspecifications and regulations. The open interest values are based on preliminary open interest values only.

NYMEX/COMEX Exchange Volume Report - Monthly
Energy FuturesPETROCHEMICALS 22 324 48 575.0% 240 35.0% 1,870 781 139.4%PETROCHEMICALS 32 109 142 -23.2% 120 -9.2% 1,583 1,050 50.8%PETROCHEMICALS 3NA 6 0 - 0 - 6 0 -PETROCHEMICALS 51 0 0 - 0 0.0% 23 0 -PETROCHEMICALS 8I 473 699 -32.3% 603 -21.6% 6,760 6,098 10.9%PETROCHEMICALS 91 649 307 111.4% 485 33.8% 4,321 2,253 91.8%PETROCHEMICALS HPE 0 0 0.0% 0 0.0% 0 0 0.0%PETROCHEMICALS JKM 2,330 60 3,783.3% 796 192.7% 12,344 560 2,104.3%PETROCHEMICALS LPE 0 0 0.0% 0 - 0 0 0.0%PETROCHEMICALS MAA 0 0 - 0 0.0% 50 0 -PETROCHEMICALS MAC 0 0 0.0% 0 0.0% 0 50 -100.0%PETROCHEMICALS MAE 290 110 163.6% 260 11.5% 2,042 410 398.0%PETROCHEMICALS MAS 170 60 183.3% 395 -57.0% 1,711 375 356.3%PETROCHEMICALS MBE 900 560 60.7% 940 -4.3% 8,530 12,060 -29.3%PETROCHEMICALS MNB 761 1,477 -48.5% 1,298 -41.4% 18,378 17,214 6.8%PETROCHEMICALS MPS 140 0 0.0% 120 16.7% 1,150 40 2,775.0%PETRO CRCKS & SPRDS ASIA JNC 0 0 0.0% 0 0.0% 0 150 -100.0%PETRO CRCKS & SPRDS ASIA STI 0 0 0.0% 0 0.0% 0 182 -100.0%PETRO CRCKS & SPRDS ASIA STR 0 0 0.0% 0 0.0% 100 264 -62.1%PETRO CRCKS & SPRDS ASIA STS 0 0 0.0% 0 0.0% 509 1,310 -61.1%PETRO CRCKS & SPRDS NA CRB 5,325 100 5,225.0% 5,560 -4.2% 22,890 2,430 842.0%PETRO CRCKS & SPRDS NA EXR 3,485 2,180 59.9% 2,957 17.9% 29,312 25,001 17.2%PETRO CRCKS & SPRDS NA FOC 150 0 0.0% 1,050 -85.7% 6,775 7,053 -3.9%PETRO CRCKS & SPRDS NA GBB 975 2,780 -64.9% 975 0.0% 12,285 11,628 5.7%PETRO CRCKS & SPRDS NA GCC 0 150 -100.0% 0 0.0% 1,740 1,310 32.8%PETRO CRCKS & SPRDS NA GCI 974 629 54.8% 540 80.4% 14,061 10,248 37.2%PETRO CRCKS & SPRDS NA GCM 0 0 0.0% 0 0.0% 163 59 176.3%PETRO CRCKS & SPRDS NA GCU 2,446 4,685 -47.8% 4,705 -48.0% 115,815 55,676 108.0%PETRO CRCKS & SPRDS NA GFC 0 0 0.0% 0 0.0% 40 535 -92.5%PETRO CRCKS & SPRDS NA HOB 72 1,500 -95.2% 564 -87.2% 8,669 29,729 -70.8%PETRO CRCKS & SPRDS NA KSD 0 0 0.0% 0 0.0% 0 75 -100.0%PETRO CRCKS & SPRDS NA MFR 0 0 0.0% 0 0.0% 4 0 0.0%PETRO CRCKS & SPRDS NA NFG 0 0 0.0% 0 0.0% 50 109 -54.1%PETRO CRCKS & SPRDS NA NYF 0 0 0.0% 0 0.0% 0 1,125 -100.0%PETRO CRCKS & SPRDS NA NYH 0 0 0.0% 0 0.0% 0 0 0.0%PETRO CRCKS & SPRDS NA RBB 5,535 8,373 -33.9% 5,497 0.7% 54,295 78,127 -30.5%
CommodityVOLUME
OCT 2018VOLUME
OCT 2017 % CHGVOLUMESEP 2018 % CHG
VOLUMEY.T.D 2018
VOLUMEY.T.D 2017 % CHG
The information herein is taken form source believed to be reliable. However, it is intended for the purposes of information and education only and is not guaranteed by the CME Group as to accuracy, completeness, nor trading resultsand does not constitute advice or continue a solicitation of the purchase or sale of any futures or options. The Rules and Regulations of the CME Group should be consulted as the authoritative source on all current contractspecifications and regulations. The open interest values are based on preliminary open interest values only.

NYMEX/COMEX Exchange Volume Report - Monthly
Energy FuturesPETRO CRCKS & SPRDS NA RVG 16,287 13,225 23.2% 10,750 51.5% 160,130 157,312 1.8%PETRO CRCKS & SPRDS NA SF3 0 0 0.0% 0 0.0% 321 15 2,040.0%PETRO CRK&SPRD EURO 1NB 1,258 975 29.0% 1,022 23.1% 18,091 12,574 43.9%PETRO CRK&SPRD EURO 1ND 0 200 -100.0% 0 0.0% 100 425 -76.5%PETRO CRK&SPRD EURO 43 45 401 -88.8% 390 -88.5% 3,414 3,355 1.8%PETRO CRK&SPRD EURO BFR 0 0 0.0% 0 0.0% 0 0 0.0%PETRO CRK&SPRD EURO BOB 1,371 978 40.2% 633 116.6% 16,736 18,199 -8.0%PETRO CRK&SPRD EURO EGB 0 0 0.0% 0 0.0% 0 5 -100.0%PETRO CRK&SPRD EURO EGN 0 0 0.0% 0 0.0% 0 18 -100.0%PETRO CRK&SPRD EURO EOB 9 0 0.0% 25 -64.0% 222 127 74.8%PETRO CRK&SPRD EURO EPN 1,685 486 246.7% 768 119.4% 9,793 4,660 110.2%PETRO CRK&SPRD EURO EVC 1,392 1,635 -14.9% 931 49.5% 19,994 23,357 -14.4%PETRO CRK&SPRD EURO FBT 0 0 0.0% 0 - 0 0 0.0%PETRO CRK&SPRD EURO FVB 0 0 0.0% 0 0.0% 30 0 0.0%PETRO CRK&SPRD EURO GCB 0 0 0.0% 0 0.0% 680 739 -8.0%PETRO CRK&SPRD EURO GOC 0 0 0.0% 0 0.0% 84 120 -30.0%PETRO CRK&SPRD EURO MGB 0 0 0.0% 30 -100.0% 110 70 57.1%PETRO CRK&SPRD EURO MUD 0 5 -100.0% 0 0.0% 163 888 -81.6%PETRO CRK&SPRD EURO NBB 20 0 0.0% 10 100.0% 182 134 35.8%PETRO CRK&SPRD EURO NOB 3,101 820 278.2% 1,894 63.7% 18,439 10,825 70.3%PETRO CRK&SPRD EURO SFB 0 0 0.0% 0 0.0% 125 178 -29.8%PETROLEUM PRODUCTS D46 0 0 0.0% 0 - 0 0 0.0%PETROLEUM PRODUCTS EWB 0 0 0.0% 0 0.0% 0 0 0.0%PETROLEUM PRODUCTS EWG 8,695 2,605 233.8% 6,571 32.3% 51,219 24,624 108.0%PETROLEUM PRODUCTS MBS 0 0 0.0% 0 0.0% 0 80 -100.0%PETROLEUM PRODUCTS MGS 0 0 0.0% 0 0.0% 0 20 -100.0%PETROLEUM PRODUCTS MHE 0 0 0.0% 0 - 0 0 0.0%PETROLEUM PRODUCTS MME 0 0 0.0% 0 0.0% 30 20 50.0%PETROLEUM PRODUCTS MPE 0 0 0.0% 0 0.0% 0 100 -100.0%PETROLEUM PRODUCTS VU 0 340 -100.0% 0 0.0% 1,044 3,014 -65.4%PETROLEUM PRODUCTS ASIA E6M 60 0 0.0% 20 200.0% 714 222 221.6%PETROLEUM PRODUCTS ASIA MJN 1,851 1,050 76.3% 1,750 5.8% 19,035 18,373 3.6%PETROLEUM PRODUCTS ASIA MSB 0 0 0.0% 0 0.0% 0 45 -100.0%PETRO OUTRIGHT EURO 0B 0 0 0.0% 0 0.0% 84 113 -25.7%PETRO OUTRIGHT EURO 0C 0 20 -100.0% 20 -100.0% 23 30 -23.3%PETRO OUTRIGHT EURO 0D 1,212 2,364 -48.7% 1,118 8.4% 13,101 23,472 -44.2%
CommodityVOLUME
OCT 2018VOLUME
OCT 2017 % CHGVOLUMESEP 2018 % CHG
VOLUMEY.T.D 2018
VOLUMEY.T.D 2017 % CHG
The information herein is taken form source believed to be reliable. However, it is intended for the purposes of information and education only and is not guaranteed by the CME Group as to accuracy, completeness, nor trading resultsand does not constitute advice or continue a solicitation of the purchase or sale of any futures or options. The Rules and Regulations of the CME Group should be consulted as the authoritative source on all current contractspecifications and regulations. The open interest values are based on preliminary open interest values only.

NYMEX/COMEX Exchange Volume Report - Monthly
Energy FuturesPETRO OUTRIGHT EURO 0E 0 56 -100.0% 40 -100.0% 238 4,096 -94.2%PETRO OUTRIGHT EURO 0F 220 594 -63.0% 346 -36.4% 5,131 10,900 -52.9%PETRO OUTRIGHT EURO 1T 0 0 0.0% 0 0.0% 39 102 -61.8%PETRO OUTRIGHT EURO 33 0 0 0.0% 0 0.0% 0 80 -100.0%PETRO OUTRIGHT EURO 5L 0 163 -100.0% 0 0.0% 224 709 -68.4%PETRO OUTRIGHT EURO 63 5 0 0.0% 0 0.0% 177 767 -76.9%PETRO OUTRIGHT EURO 6L 0 0 0.0% 0 0.0% 0 7 -100.0%PETRO OUTRIGHT EURO 7I 262 92 184.8% 317 -17.4% 1,161 1,157 0.3%PETRO OUTRIGHT EURO 7R 159 180 -11.7% 239 -33.5% 2,933 2,360 24.3%PETRO OUTRIGHT EURO 88 0 25 -100.0% 0 0.0% 105 60 75.0%PETRO OUTRIGHT EURO CBB 0 0 0.0% 0 0.0% 55 42 31.0%PETRO OUTRIGHT EURO CGB 0 25 -100.0% 0 0.0% 0 50 -100.0%PETRO OUTRIGHT EURO CPB 190 379 -49.9% 127 49.6% 3,326 2,848 16.8%PETRO OUTRIGHT EURO EFF 48 20 140.0% 0 0.0% 164 310 -47.1%PETRO OUTRIGHT EURO EFM 0 0 0.0% 0 0.0% 0 453 -100.0%PETRO OUTRIGHT EURO ENS 0 0 0.0% 40 -100.0% 145 180 -19.4%PETRO OUTRIGHT EURO ESB 0 0 0.0% 0 0.0% 0 69 -100.0%PETRO OUTRIGHT EURO EWN 893 807 10.7% 638 40.0% 7,143 7,106 0.5%PETRO OUTRIGHT EURO FBD 0 0 0.0% 0 0.0% 0 20 -100.0%PETRO OUTRIGHT EURO FLB 0 0 - 5 -100.0% 5 0 -PETRO OUTRIGHT EURO GES 0 0 - 0 0.0% 5 0 -PETRO OUTRIGHT EURO MBB 0 50 -100.0% 100 -100.0% 271 550 -50.7%PETRO OUTRIGHT EURO MBN 180 840 -78.6% 409 -56.0% 8,967 10,491 -14.5%PETRO OUTRIGHT EURO MEF 716 0 - 408 75.5% 1,139 0 -PETRO OUTRIGHT EURO SMU 0 0 0.0% 75 -100.0% 553 40 1,282.5%PETRO OUTRIGHT EURO T0 0 0 0.0% 0 0.0% 9 164 -94.5%PETRO OUTRIGHT EURO ULB 0 0 0.0% 0 0.0% 0 375 -100.0%PETRO OUTRIGHT EURO V0 0 0 0.0% 0 0.0% 980 150 553.3%PETRO OUTRIGHT EURO W0 0 0 0.0% 0 - 0 0 0.0%PETRO OUTRIGHT EURO X0 0 0 0.0% 116 -100.0% 116 0 0.0%PETRO OUTRIGHT NA FCB 64 223 -71.3% 152 -57.9% 808 1,836 -56.0%PETRO OUTRIGHT NA FOM 0 0 0.0% 8 -100.0% 8 50 -84.0%PETRO OUTRIGHT NA GBA 0 0 0.0% 0 - 0 0 0.0%PETRO OUTRIGHT NA GUD 0 0 0.0% 0 - 0 0 0.0%PETRO OUTRIGHT NA JE 0 0 0.0% 0 0.0% 69 420 -83.6%PETRO OUTRIGHT NA JET 4,270 1,015 320.7% 5,935 -28.1% 31,425 41,360 -24.0%
CommodityVOLUME
OCT 2018VOLUME
OCT 2017 % CHGVOLUMESEP 2018 % CHG
VOLUMEY.T.D 2018
VOLUMEY.T.D 2017 % CHG
The information herein is taken form source believed to be reliable. However, it is intended for the purposes of information and education only and is not guaranteed by the CME Group as to accuracy, completeness, nor trading resultsand does not constitute advice or continue a solicitation of the purchase or sale of any futures or options. The Rules and Regulations of the CME Group should be consulted as the authoritative source on all current contractspecifications and regulations. The open interest values are based on preliminary open interest values only.

NYMEX/COMEX Exchange Volume Report - Monthly
Energy FuturesPETRO OUTRIGHT NA JTB 2,090 1,413 47.9% 700 198.6% 6,650 3,438 93.4%PETRO OUTRIGHT NA MBL 0 0 0.0% 0 0.0% 40 266 -85.0%PETRO OUTRIGHT NA MEN 401 408 -1.7% 410 -2.2% 4,379 5,957 -26.5%PETRO OUTRIGHT NA MEO 3,298 3,423 -3.7% 2,539 29.9% 36,006 88,851 -59.5%PETRO OUTRIGHT NA MFD 0 0 0.0% 0 0.0% 100 203 -50.7%PETRO OUTRIGHT NA MMF 63 25 152.0% 56 12.5% 193 510 -62.2%PETRO OUTRIGHT NA NYT 0 0 0.0% 0 0.0% 0 625 -100.0%PETRO OUTRIGHT NA XER 0 0 0.0% 0 0.0% 300 0 0.0%PJM AD HUB 5MW REAL TIME V3 0 0 0.0% 13,365 -100.0% 41,397 273,469 -84.9%PJM AD HUB 5MW REAL TIME Z9 0 420 -100.0% 420 -100.0% 13,073 22,831 -42.7%PJM AECO DA OFF-PEAK X1 0 0 0.0% 0 0.0% 0 0 0.0%PJM AECO DA PEAK Y1 0 0 0.0% 0 0.0% 0 0 0.0%PJM APS ZONE DA OFF-PEAK W4 0 0 0.0% 0 0.0% 0 0 0.0%PJM APS ZONE DA PEAK S4 0 0 0.0% 0 0.0% 0 0 0.0%PJM ATSI ELEC MOD 0 0 0.0% 0 0.0% 0 46,800 -100.0%PJM ATSI ELEC MPD 0 0 0.0% 0 0.0% 0 2,550 -100.0%PJM BGE DA OFF-PEAK R3 0 0 0.0% 0 0.0% 0 0 0.0%PJM BGE DA PEAK E3 0 0 0.0% 0 0.0% 0 0 0.0%PJM COMED 5MW D AH O PK D9 0 0 0.0% 0 0.0% 0 85,390 -100.0%PJM COMED 5MW D AH PK D8 0 0 0.0% 0 0.0% 0 4,675 -100.0%PJM DAILY JD 0 0 0.0% 0 0.0% 0 0 0.0%PJM DAYTON DA OFF-PEAK R7 0 0 0.0% 0 0.0% 0 211,995 -100.0%PJM DAYTON DA PEAK D7 0 0 0.0% 0 0.0% 0 5,250 -100.0%PJM JCPL DA OFF-PEAK F2 0 0 0.0% 0 0.0% 0 0 0.0%PJM JCPL DA PEAK J2 0 0 0.0% 0 0.0% 0 0 0.0%PJM NI HUB 5MW REAL TIME B3 1,280 0 0.0% 0 0.0% 6,380 79,100 -91.9%PJM NI HUB 5MW REAL TIME B6 0 0 0.0% 5,925 -100.0% 5,925 1,700,530 -99.7%PJM NILL DA OFF-PEAK L3 770 2,427 -68.3% 0 0.0% 770 687,794 -99.9%PJM NILL DA PEAK N3 42 246 -82.9% 0 0.0% 64 39,332 -99.8%PJM OFF-PEAK LMP SWAP FUT JP 0 0 0.0% 0 0.0% 0 0 0.0%PJM PECO ZONE5MW PEAK CAL MO DAY AH 4N 0 0 0.0% 0 - 0 0 0.0%PJM PPL DA OFF-PEAK F5 0 0 0.0% 0 0.0% 0 0 0.0%PJM PPL DA PEAK L5 0 0 0.0% 0 0.0% 0 0 0.0%PJM PSEG DA OFF-PEAK W6 0 0 0.0% 0 0.0% 23,400 0 0.0%PJM PSEG DA PEAK L6 0 0 0.0% 0 0.0% 1,275 0 0.0%PJM WES HUB PEAK LMP 50 M 4S 0 0 0.0% 0 - 0 0 0.0%
CommodityVOLUME
OCT 2018VOLUME
OCT 2017 % CHGVOLUMESEP 2018 % CHG
VOLUMEY.T.D 2018
VOLUMEY.T.D 2017 % CHG
The information herein is taken form source believed to be reliable. However, it is intended for the purposes of information and education only and is not guaranteed by the CME Group as to accuracy, completeness, nor trading resultsand does not constitute advice or continue a solicitation of the purchase or sale of any futures or options. The Rules and Regulations of the CME Group should be consulted as the authoritative source on all current contractspecifications and regulations. The open interest values are based on preliminary open interest values only.

NYMEX/COMEX Exchange Volume Report - Monthly
Energy FuturesPJM WESTH DA OFF-PEAK E4 0 0 0.0% 0 0.0% 101,810 54,300 87.5%PJM WESTHDA PEAK J4 0 0 0.0% 0 0.0% 5,525 8,620 -35.9%PJM WESTH RT OFF-PEAK N9 39,200 0 0.0% 15,920 146.2% 349,120 2,158,295 -83.8%PJM WESTH RT PEAK L1 2,555 1,040 145.7% 10,666 -76.0% 59,191 203,991 -71.0%PLASTICS PGP 1,159 120 865.8% 140 727.9% 4,314 5,714 -24.5%PREMIUM UNLD 10P FOB MED 3G 79 140 -43.6% 280 -71.8% 2,392 671 256.5%PREMIUM UNLEAD 10PPM FOB 8G 0 0 0.0% 35 -100.0% 438 152 188.2%PREM UNL GAS 10PPM RDAM FOB BALMO 7N 0 0 0.0% 0 0.0% 80 7 1,042.9%PREM UNL GAS 10PPM RDAM FOB SWAP 7L 0 0 0.0% 140 -100.0% 326 37 781.1%PROPANE NON-LDH MB (OPIS) BALMO SWP 1S 170 63 169.8% 621 -72.6% 5,189 4,927 5.3%PROPANE NON-LDH MT. BEL (OPIS) SWP 1R 17,773 8,720 103.8% 15,272 16.4% 126,794 68,710 84.5%RBOB CALENDAR SWAP RL 7,181 5,166 39.0% 5,274 36.2% 58,539 72,014 -18.7%RBOB CRACK SPREAD RM 60 2,733 -97.8% 255 -76.5% 9,528 10,157 -6.2%RBOB CRACK SPREAD BALMO S 1E 0 0 0.0% 0 0.0% 0 0 0.0%RBOB GASOLINE BALMO CLNDR 1D 530 2,176 -75.6% 1,252 -57.7% 10,782 9,550 12.9%RBOB PHY RBL 0 0 0.0% 0 0.0% 0 0 0.0%RBOB (PLATTS) CAL SWAP RY 0 0 0.0% 0 - 0 0 0.0%RBOB SPREAD (PLATTS) SWAP RI 0 0 0.0% 0 0.0% 0 0 0.0%RBOB UP-DOWN CALENDAR SWA RV 0 0 0.0% 0 - 0 0 0.0%RBOB VS HEATING OIL SWAP RH 0 150 -100.0% 0 0.0% 1,975 16,870 -88.3%ROCKIES KERN OPAL - NW IN IR 0 0 0.0% 0 - 0 0 0.0%SAN JUAN BASIS SWAP NJ 0 0 0.0% 0 0.0% 58 2,254 -97.4%SAN JUAN PIPE SWAP XX 0 0 - 0 0.0% 360 0 -SINGAPORE 180CST BALMO BS 30 38 -21.1% 5 500.0% 473 572 -17.3%SINGAPORE 380CST BALMO BT 261 127 105.5% 132 97.7% 2,201 2,155 2.1%SINGAPORE 380CST FUEL OIL SE 6,031 8,044 -25.0% 5,841 3.3% 84,193 97,554 -13.7%SINGAPORE FUEL 180CST CAL UA 502 730 -31.2% 357 40.6% 8,056 10,526 -23.5%SINGAPORE FUEL OIL SPREAD SD 117 270 -56.7% 170 -31.2% 6,011 6,798 -11.6%SINGAPORE GASOIL MAF 723 0 - 575 25.7% 1,306 0 -SINGAPORE GASOIL MTB 15 112 -86.6% 15 0.0% 506 1,490 -66.0%SINGAPORE GASOIL MTS 4,981 3,078 61.8% 4,118 21.0% 47,222 48,161 -1.9%SINGAPORE GASOIL STL 0 0 0.0% 0 - 0 0 0.0%SINGAPORE GASOIL STZ 0 0 0.0% 0 0.0% 4,300 800 437.5%SINGAPORE GASOIL CALENDAR GDH 0 0 - 0 0.0% 50 0 -SINGAPORE GASOIL CALENDAR GDL 0 0 - 0 0.0% 250 0 -SINGAPORE GASOIL CALENDAR GHS 0 0 - 0 0.0% 0 0 -
CommodityVOLUME
OCT 2018VOLUME
OCT 2017 % CHGVOLUMESEP 2018 % CHG
VOLUMEY.T.D 2018
VOLUMEY.T.D 2017 % CHG
The information herein is taken form source believed to be reliable. However, it is intended for the purposes of information and education only and is not guaranteed by the CME Group as to accuracy, completeness, nor trading resultsand does not constitute advice or continue a solicitation of the purchase or sale of any futures or options. The Rules and Regulations of the CME Group should be consulted as the authoritative source on all current contractspecifications and regulations. The open interest values are based on preliminary open interest values only.
NYMEX/COMEX Exchange Volume Report - Monthly
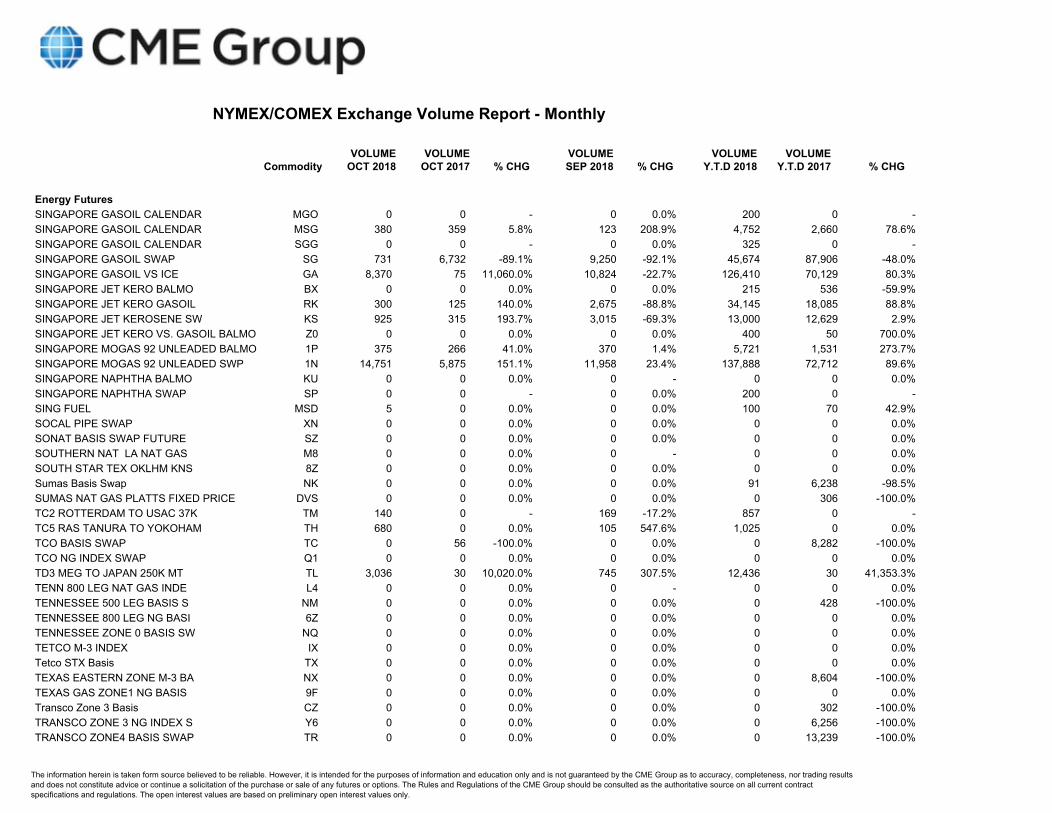
Energy FuturesSINGAPORE GASOIL CALENDAR MGO 0 0 - 0 0.0% 200 0 -SINGAPORE GASOIL CALENDAR MSG 380 359 5.8% 123 208.9% 4,752 2,660 78.6%SINGAPORE GASOIL CALENDAR SGG 0 0 - 0 0.0% 325 0 -SINGAPORE GASOIL SWAP SG 731 6,732 -89.1% 9,250 -92.1% 45,674 87,906 -48.0%SINGAPORE GASOIL VS ICE GA 8,370 75 11,060.0% 10,824 -22.7% 126,410 70,129 80.3%SINGAPORE JET KERO BALMO BX 0 0 0.0% 0 0.0% 215 536 -59.9%SINGAPORE JET KERO GASOIL RK 300 125 140.0% 2,675 -88.8% 34,145 18,085 88.8%SINGAPORE JET KEROSENE SW KS 925 315 193.7% 3,015 -69.3% 13,000 12,629 2.9%SINGAPORE JET KERO VS. GASOIL BALMO Z0 0 0 0.0% 0 0.0% 400 50 700.0%SINGAPORE MOGAS 92 UNLEADED BALMO 1P 375 266 41.0% 370 1.4% 5,721 1,531 273.7%SINGAPORE MOGAS 92 UNLEADED SWP 1N 14,751 5,875 151.1% 11,958 23.4% 137,888 72,712 89.6%SINGAPORE NAPHTHA BALMO KU 0 0 0.0% 0 - 0 0 0.0%SINGAPORE NAPHTHA SWAP SP 0 0 - 0 0.0% 200 0 -SING FUEL MSD 5 0 0.0% 0 0.0% 100 70 42.9%SOCAL PIPE SWAP XN 0 0 0.0% 0 0.0% 0 0 0.0%SONAT BASIS SWAP FUTURE SZ 0 0 0.0% 0 0.0% 0 0 0.0%SOUTHERN NAT LA NAT GAS M8 0 0 0.0% 0 - 0 0 0.0%SOUTH STAR TEX OKLHM KNS 8Z 0 0 0.0% 0 0.0% 0 0 0.0%Sumas Basis Swap NK 0 0 0.0% 0 0.0% 91 6,238 -98.5%SUMAS NAT GAS PLATTS FIXED PRICE DVS 0 0 0.0% 0 0.0% 0 306 -100.0%TC2 ROTTERDAM TO USAC 37K TM 140 0 - 169 -17.2% 857 0 -TC5 RAS TANURA TO YOKOHAM TH 680 0 0.0% 105 547.6% 1,025 0 0.0%TCO BASIS SWAP TC 0 56 -100.0% 0 0.0% 0 8,282 -100.0%TCO NG INDEX SWAP Q1 0 0 0.0% 0 0.0% 0 0 0.0%TD3 MEG TO JAPAN 250K MT TL 3,036 30 10,020.0% 745 307.5% 12,436 30 41,353.3%TENN 800 LEG NAT GAS INDE L4 0 0 0.0% 0 - 0 0 0.0%TENNESSEE 500 LEG BASIS S NM 0 0 0.0% 0 0.0% 0 428 -100.0%TENNESSEE 800 LEG NG BASI 6Z 0 0 0.0% 0 0.0% 0 0 0.0%TENNESSEE ZONE 0 BASIS SW NQ 0 0 0.0% 0 0.0% 0 0 0.0%TETCO M-3 INDEX IX 0 0 0.0% 0 0.0% 0 0 0.0%Tetco STX Basis TX 0 0 0.0% 0 0.0% 0 0 0.0%TEXAS EASTERN ZONE M-3 BA NX 0 0 0.0% 0 0.0% 0 8,604 -100.0%TEXAS GAS ZONE1 NG BASIS 9F 0 0 0.0% 0 0.0% 0 0 0.0%Transco Zone 3 Basis CZ 0 0 0.0% 0 0.0% 0 302 -100.0%TRANSCO ZONE 3 NG INDEX S Y6 0 0 0.0% 0 0.0% 0 6,256 -100.0%TRANSCO ZONE4 BASIS SWAP TR 0 0 0.0% 0 0.0% 0 13,239 -100.0%
CommodityVOLUME
OCT 2018VOLUME
OCT 2017 % CHGVOLUMESEP 2018 % CHG
VOLUMEY.T.D 2018
VOLUMEY.T.D 2017 % CHG
The information herein is taken form source believed to be reliable. However, it is intended for the purposes of information and education only and is not guaranteed by the CME Group as to accuracy, completeness, nor trading resultsand does not constitute advice or continue a solicitation of the purchase or sale of any futures or options. The Rules and Regulations of the CME Group should be consulted as the authoritative source on all current contractspecifications and regulations. The open interest values are based on preliminary open interest values only.

NYMEX/COMEX Exchange Volume Report - Monthly
Energy FuturesTRANSCO ZONE 4 NAT GAS IN B2 0 0 0.0% 0 0.0% 0 465 -100.0%TRANSCO ZONE 6 BASIS SWAP NZ 0 0 0.0% 0 0.0% 0 2,870 -100.0%TRANSCO ZONE 6 INDEX IT 0 0 0.0% 0 0.0% 0 856 -100.0%UCM FUT UCM 0 0 0.0% 0 0.0% 60 265 -77.4%ULSD 10PPM CIF MED BALMO X7 0 0 0.0% 0 - 0 0 0.0%ULSD 10PPM CIF MED SWAP Z6 0 0 0.0% 0 0.0% 0 30 -100.0%ULSD 10PPM CIF MED VS ICE Z7 0 0 0.0% 0 0.0% 14 66 -78.8%ULSD 10PPM CIF NW BALMO S B1 0 0 0.0% 0 0.0% 0 6 -100.0%ULSD 10PPM CIF VS ICE GAS 7V 0 0 0.0% 0 - 0 0 0.0%ULSD UP-DOWN BALMO SWP 1L 6,700 9,770 -31.4% 9,042 -25.9% 56,104 46,692 20.2%UP DOWN GC ULSD VS NMX HO LT 38,271 50,929 -24.9% 35,400 8.1% 327,620 474,669 -31.0%USGC UNL 87 CRACK SPREAD RU 0 0 0.0% 0 - 0 0 0.0%WAHA BASIS NW 0 0 0.0% 0 0.0% 3,201 6,064 -47.2%WAHA INDEX SWAP FUTURE IY 0 0 0.0% 0 0.0% 0 0 0.0%WESTERN RAIL DELIVERY PRB QP 0 180 -100.0% 0 0.0% 25 2,400 -99.0%WTI-BRENT BULLET SWAP BY 0 0 0.0% 0 0.0% 6,650 904 635.6%WTI-BRENT CALENDAR SWAP BK 17,795 31,694 -43.9% 46,550 -61.8% 315,150 171,366 83.9%WTI CALENDAR CS 40,550 34,612 17.2% 31,846 27.3% 336,439 368,837 -8.8%WTS (ARGUS) VS WTI SWAP FF 6,088 14,656 -58.5% 11,000 -44.7% 85,590 53,170 61.0%WTS (ARGUS) VS WTI TRD MT FH 720 2,230 -67.7% 0 0.0% 6,105 8,310 -26.5%
Energy Options12 MO GASOIL CAL SWAP SPR GXZ 0 0 0.0% 0 0.0% 0 630 -100.0%1 MO GASOIL CAL SWAP SPR GXA 0 0 0.0% 0 - 0 0 0.0%BRENT 1 MONTH CAL AA 0 0 - 0 0.0% 3,000 0 -BRENT CALENDAR SWAP BA 7,322 0 0.0% 139 5,167.6% 13,176 5,347 146.4%BRENT CRUDE OIL 12 M CSO 9Y 0 2,000 -100.0% 0 0.0% 2,000 2,000 0.0%BRENT CRUDE OIL 1 M CSO 9C 18,450 0 - 6,200 197.6% 410,488 0 -BRENT CRUDE OIL 6 M CSO 9L 0 0 - 0 0.0% 1,000 0 -BRENT OIL LAST DAY BE 33,388 986 3,286.2% 5,420 516.0% 299,720 35,572 742.6%BRENT OIL LAST DAY BZO 395,735 66,848 492.0% 247,851 59.7% 1,687,631 397,814 324.2%BRENT OIL LAST DAY OS 0 200 -100.0% 0 0.0% 1,190 3,844 -69.0%COAL API2 INDEX CLA 320 431 -25.8% 740 -56.8% 6,425 9,883 -35.0%COAL API2 INDEX CQA 25 145 -82.8% 0 0.0% 3,480 755 360.9%COAL API2 INDEX MTC 0 0 0.0% 0 0.0% 0 50 -100.0%
CommodityVOLUME
OCT 2018VOLUME
OCT 2017 % CHGVOLUMESEP 2018 % CHG
VOLUMEY.T.D 2018
VOLUMEY.T.D 2017 % CHG
The information herein is taken form source believed to be reliable. However, it is intended for the purposes of information and education only and is not guaranteed by the CME Group as to accuracy, completeness, nor trading resultsand does not constitute advice or continue a solicitation of the purchase or sale of any futures or options. The Rules and Regulations of the CME Group should be consulted as the authoritative source on all current contractspecifications and regulations. The open interest values are based on preliminary open interest values only.

NYMEX/COMEX Exchange Volume Report - Monthly
Energy OptionsCOAL API4 INDEX RLA 0 0 0.0% 0 0.0% 25 0 0.0%COAL API4 INDEX RQA 0 0 0.0% 0 0.0% 60 0 0.0%COAL SWAP CPF 0 0 0.0% 0 0.0% 0 180 -100.0%COAL SWAP RPF 0 60 -100.0% 0 0.0% 0 605 -100.0%CRUDE OIL 1MO WA 223,270 91,907 142.9% 86,595 157.8% 2,027,905 1,761,039 15.2%CRUDE OIL APO AO 19,147 42,720 -55.2% 43,146 -55.6% 433,796 479,855 -9.6%CRUDE OIL CALNDR STRIP 6F 0 0 - 0 0.0% 170 0 -CRUDE OIL OUTRIGHTS AH 8,000 0 0.0% 0 0.0% 8,000 0 0.0%CRUDE OIL OUTRIGHTS DBP 0 0 0.0% 0 0.0% 0 0 0.0%CRUDE OIL OUTRIGHTS WCI 390 2,530 -84.6% 0 0.0% 390 11,770 -96.7%CRUDE OIL PHY CD 1,500 3,550 -57.7% 300 400.0% 20,850 29,120 -28.4%CRUDE OIL PHY LC 16,765 3,800 341.2% 8,307 101.8% 104,211 232,827 -55.2%CRUDE OIL PHY LO 4,061,250 2,878,252 41.1% 3,208,213 26.6% 35,441,404 36,542,328 -3.0%CRUDE OIL PHY LO1 34,024 19,716 72.6% 13,353 154.8% 158,262 143,358 10.4%CRUDE OIL PHY LO2 22,560 14,942 51.0% 14,508 55.5% 158,586 123,833 28.1%CRUDE OIL PHY LO3 13,678 11,843 15.5% 14,409 -5.1% 106,667 82,735 28.9%CRUDE OIL PHY LO4 22,702 12,513 81.4% 17,766 27.8% 159,490 162,270 -1.7%CRUDE OIL PHY LO5 0 0 0.0% 0 0.0% 49,705 53,489 -7.1%ELEC FINSETTLED PML 0 0 0.0% 0 - 0 0 0.0%ELEC MISO PEAK 9T 0 0 0.0% 0 0.0% 0 820 -100.0%ETHANOL CE1 0 0 0.0% 0 0.0% 275 75 266.7%ETHANOL CE3 0 0 0.0% 0 0.0% 150 325 -53.8%ETHANOL SWAP CVR 3,777 7,744 -51.2% 1,615 133.9% 63,203 57,085 10.7%ETHANOL SWAP GVR 0 0 0.0% 450 -100.0% 3,118 1,580 97.3%EURO-DENOMINATED PETRO PROD NWE 0 0 0.0% 0 - 0 0 0.0%EUROPEAN JET KEROSENE NWE (PLATTS) A 30 0 0 0.0% 0 0.0% 0 0 0.0%GASOLINE GCE 0 0 0.0% 0 0.0% 0 0 0.0%HEATING OIL CRACK OPTIONS CH 0 0 0.0% 0 0.0% 0 100 -100.0%HEATING OIL CRK SPD AVG PRICE OPTIONS 3W 0 0 0.0% 0 0.0% 0 0 0.0%HEATING OIL PHY LB 270 25 980.0% 0 0.0% 1,020 2,728 -62.6%HEATING OIL PHY OH 30,558 39,166 -22.0% 24,946 22.5% 295,007 322,537 -8.5%HENRY HUB FINANCIAL LAST E7 3,501 5,638 -37.9% 8,069 -56.6% 43,935 38,676 13.6%HO 1 MONTH CLNDR OPTIONS FA 100 0 0.0% 0 0.0% 100 1,700 -94.1%HUSTN SHIP CHNL PIPE SWP PK 0 0 0.0% 0 - 0 0 0.0%LLS CRUDE OIL WJO 0 0 0.0% 0 0.0% 100 5,100 -98.0%LLS CRUDE OIL YVO 0 0 0.0% 0 0.0% 0 3,750 -100.0%
CommodityVOLUME
OCT 2018VOLUME
OCT 2017 % CHGVOLUMESEP 2018 % CHG
VOLUMEY.T.D 2018
VOLUMEY.T.D 2017 % CHG
The information herein is taken form source believed to be reliable. However, it is intended for the purposes of information and education only and is not guaranteed by the CME Group as to accuracy, completeness, nor trading resultsand does not constitute advice or continue a solicitation of the purchase or sale of any futures or options. The Rules and Regulations of the CME Group should be consulted as the authoritative source on all current contractspecifications and regulations. The open interest values are based on preliminary open interest values only.

NYMEX/COMEX Exchange Volume Report - Monthly
Energy OptionsMCCLOSKY ARA ARGS COAL MTO 0 160 -100.0% 35 -100.0% 290 1,450 -80.0%MCCLOSKY RCH BAY COAL MFO 70 0 0.0% 100 -30.0% 2,075 0 0.0%NATURAL GAS G10 0 0 0.0% 0 0.0% 0 450 -100.0%NATURAL GAS 1 M CSO FIN G4 50,700 54,284 -6.6% 32,093 58.0% 369,120 388,229 -4.9%NATURAL GAS 2 M CSO FIN G2 0 1,500 -100.0% 200 -100.0% 1,400 9,550 -85.3%NATURAL GAS 3 M CSO FIN G3 200 1,000 -80.0% 500 -60.0% 44,246 120,425 -63.3%NATURAL GAS 5 M CSO FIN G5 0 0 0.0% 0 0.0% 2,550 4,050 -37.0%NATURAL GAS 6 M CSO FIN G6 5,800 3,650 58.9% 7,650 -24.2% 84,400 50,670 66.6%NATURAL GAS OPTION ON CALENDAR STRP 6J 4,270 1,832 133.1% 1,064 301.3% 27,642 9,770 182.9%NATURAL GAS PHY KD 13,914 51,775 -73.1% 13,722 1.4% 195,549 403,030 -51.5%NATURAL GAS PHY LN 2,554,574 2,471,737 3.4% 1,952,979 30.8% 18,159,969 22,162,915 -18.1%NATURAL GAS PHY ON 247,661 225,661 9.7% 190,825 29.8% 1,814,563 1,961,512 -7.5%NATURAL GAS PHY ON1 0 0 0.0% 0 - 0 0 0.0%NATURAL GAS WINTER STRIP 6I 600 0 - 900 -33.3% 2,700 0 -NG HH 3 MONTH CAL IC 0 0 0.0% 0 - 0 0 0.0%N ROCKIES PIPE SWAP ZR 0 0 0.0% 236 -100.0% 2,016 4,030 -50.0%NY HARBOR HEAT OIL SWP AT 3,450 2,843 21.4% 2,456 40.5% 26,093 32,506 -19.7%NYISO ZONE G 5MW PEAK OPTIONS 9U 0 0 0.0% 0 0.0% 0 19,830 -100.0%NYMEX EUROPEAN GASOIL APO F7 0 0 0.0% 0 0.0% 0 0 0.0%NYMEX EUROPEAN GASOIL OPT F8 0 0 0.0% 0 - 0 0 0.0%PANHANDLE PIPE SWAP PU 0 5,760 -100.0% 0 0.0% 0 8,640 -100.0%PETROCHEMICALS 4H 1,347 834 61.5% 291 362.9% 6,652 7,734 -14.0%PETROCHEMICALS 4J 0 120 -100.0% 0 0.0% 1,350 2,945 -54.2%PETROCHEMICALS 4K 0 0 0.0% 0 0.0% 3,300 1,200 175.0%PETROCHEMICALS CPR 0 0 0.0% 0 0.0% 0 18 -100.0%PETRO OUTRIGHT EURO 8H 0 0 0.0% 0 0.0% 0 300 -100.0%PETRO OUTRIGHT NA DAP 0 0 - 192 -100.0% 192 0 -PJM MONTHLY JO 0 0 0.0% 0 - 0 0 0.0%PJM WES HUB PEAK CAL MTH 6OA 270 50 440.0% 130 107.7% 720 3,960 -81.8%PJM WES HUB PEAK CAL MTH JOA 0 0 0.0% 0 0.0% 880 0 0.0%PJM WES HUB PEAK LMP 50MW PMA 252 360 -30.0% 295 -14.6% 7,404 13,029 -43.2%RBOB 1MO CAL SPD OPTIONS ZA 0 600 -100.0% 0 0.0% 700 5,508 -87.3%RBOB CALENDAR SWAP RA 85 455 -81.3% 0 0.0% 1,050 2,815 -62.7%RBOB CRACK RX 2 0 - 0 - 2 0 -RBOB PHY OB 20,089 17,228 16.6% 9,047 122.1% 121,448 269,092 -54.9%RBOB PHY RF 0 200 -100.0% 0 0.0% 125 1,160 -89.2%
CommodityVOLUME
OCT 2018VOLUME
OCT 2017 % CHGVOLUMESEP 2018 % CHG
VOLUMEY.T.D 2018
VOLUMEY.T.D 2017 % CHG
The information herein is taken form source believed to be reliable. However, it is intended for the purposes of information and education only and is not guaranteed by the CME Group as to accuracy, completeness, nor trading resultsand does not constitute advice or continue a solicitation of the purchase or sale of any futures or options. The Rules and Regulations of the CME Group should be consulted as the authoritative source on all current contractspecifications and regulations. The open interest values are based on preliminary open interest values only.

NYMEX/COMEX Exchange Volume Report - Monthly
Energy OptionsROTTERDAM 3.5%FUEL OIL CL Q6 0 0 0.0% 0 0.0% 0 0 0.0%SAN JUAN PIPE SWAP PJ 31 360 -91.4% 236 -86.9% 2,149 3,240 -33.7%SHORT TERM C15 500 0 - 0 - 500 0 -SHORT TERM U11 0 180 -100.0% 0 0.0% 1,236 5,970 -79.3%SHORT TERM U12 150 125 20.0% 115 30.4% 1,100 4,604 -76.1%SHORT TERM U13 0 262 -100.0% 0 0.0% 400 2,557 -84.4%SHORT TERM U14 0 0 0.0% 0 0.0% 863 3,355 -74.3%SHORT TERM U15 0 0 0.0% 0 0.0% 797 4,725 -83.1%SHORT TERM U22 50 0 0.0% 0 0.0% 1,271 2,882 -55.9%SHORT TERM U23 0 600 -100.0% 0 0.0% 898 1,672 -46.3%SHORT TERM U24 0 650 -100.0% 0 0.0% 879 3,220 -72.7%SHORT TERM U25 50 200 -75.0% 0 0.0% 152 940 -83.8%SHORT TERM U26 0 0 0.0% 100 -100.0% 400 292 37.0%SHORT TERM NATURAL GAS U01 0 0 0.0% 200 -100.0% 550 3,315 -83.4%SHORT TERM NATURAL GAS U02 1,350 0 0.0% 0 0.0% 2,798 3,483 -19.7%SHORT TERM NATURAL GAS U03 100 0 0.0% 0 0.0% 1,529 2,220 -31.1%SHORT TERM NATURAL GAS U04 375 300 25.0% 0 0.0% 1,975 1,170 68.8%SHORT TERM NATURAL GAS U05 10 3,350 -99.7% 610 -98.4% 1,430 10,140 -85.9%SHORT TERM NATURAL GAS U06 0 1,010 -100.0% 625 -100.0% 1,500 8,045 -81.4%SHORT TERM NATURAL GAS U07 0 0 0.0% 0 0.0% 1,601 3,285 -51.3%SHORT TERM NATURAL GAS U08 100 0 0.0% 0 0.0% 1,477 4,470 -67.0%SHORT TERM NATURAL GAS U09 0 1,181 -100.0% 0 0.0% 1,534 4,781 -67.9%SHORT TERM NATURAL GAS U10 0 100 -100.0% 100 -100.0% 1,250 5,652 -77.9%SHORT TERM NATURAL GAS U16 0 2,775 -100.0% 0 0.0% 700 6,445 -89.1%SHORT TERM NATURAL GAS U17 0 885 -100.0% 0 0.0% 2,296 4,189 -45.2%SHORT TERM NATURAL GAS U18 150 510 -70.6% 100 50.0% 1,622 1,697 -4.4%SHORT TERM NATURAL GAS U19 100 375 -73.3% 25 300.0% 348 4,560 -92.4%SHORT TERM NATURAL GAS U20 0 298 -100.0% 550 -100.0% 1,425 3,528 -59.6%SHORT TERM NATURAL GAS U21 0 0 0.0% 0 0.0% 363 2,724 -86.7%SHORT TERM NATURAL GAS U27 0 0 0.0% 0 0.0% 425 1,870 -77.3%SHORT TERM NATURAL GAS U28 0 0 0.0% 0 0.0% 100 3,255 -96.9%SHORT TERM NATURAL GAS U29 0 0 0.0% 0 0.0% 460 435 5.7%SHORT TERM NATURAL GAS U30 0 355 -100.0% 0 0.0% 100 3,775 -97.4%SHORT TERM NATURAL GAS U31 0 500 -100.0% 0 0.0% 27 6,250 -99.6%SINGAPORE GASOIL CALENDAR M2 0 0 0.0% 0 0.0% 0 0 0.0%SINGAPORE JET FUEL CALEND N2 0 0 0.0% 0 0.0% 0 0 0.0%
CommodityVOLUME
OCT 2018VOLUME
OCT 2017 % CHGVOLUMESEP 2018 % CHG
VOLUMEY.T.D 2018
VOLUMEY.T.D 2017 % CHG
The information herein is taken form source believed to be reliable. However, it is intended for the purposes of information and education only and is not guaranteed by the CME Group as to accuracy, completeness, nor trading resultsand does not constitute advice or continue a solicitation of the purchase or sale of any futures or options. The Rules and Regulations of the CME Group should be consulted as the authoritative source on all current contractspecifications and regulations. The open interest values are based on preliminary open interest values only.

NYMEX/COMEX Exchange Volume Report - Monthly
Energy OptionsSOCAL PIPE SWAP ZN 0 0 0.0% 0 0.0% 0 0 0.0%WTI-BRENT BULLET SWAP BV 31,844 101,138 -68.5% 35,654 -10.7% 807,295 435,477 85.4%WTI CRUDE OIL 1 M CSO FI 7A 87,050 31,815 173.6% 39,700 119.3% 722,900 571,515 26.5%
Metals FuturesCOMEX GOLD GC 6,470,243 6,665,496 -2.9% 5,495,646 17.7% 69,818,341 58,992,246 18.4%NYMEX HOT ROLLED STEEL HR 9,665 7,107 36.0% 6,668 44.9% 100,378 53,100 89.0%NYMEX PLATINUM PL 383,720 344,217 11.5% 580,643 -33.9% 4,592,785 3,901,621 17.7%PALLADIUM PA 116,003 87,270 32.9% 89,368 29.8% 1,210,714 1,176,633 2.9%URANIUM UX 827 0 0.0% 1,298 -36.3% 4,279 4,474 -4.4%COMEX SILVER SI 1,793,534 1,826,444 -1.8% 1,648,326 8.8% 20,387,306 19,107,375 6.7%COMEX E-Mini GOLD QO 11,250 5,343 110.6% 11,095 1.4% 82,303 80,343 2.4%COMEX E-Mini SILVER QI 936 471 98.7% 795 17.7% 11,507 8,084 42.3%COMEX COPPER HG 2,625,852 2,410,657 8.9% 2,349,687 11.8% 28,757,243 21,705,911 32.5%COMEX MINY COPPER QC 415 459 -9.6% 260 59.6% 4,596 7,013 -34.5%ALUMINUM A38 72 0 0.0% 0 0.0% 72 30 140.0%ALUMINUM AEP 2,425 2,004 21.0% 360 573.6% 14,730 24,737 -40.5%ALUMINUM ALA 40 0 0.0% 150 -73.3% 5,515 5,350 3.1%ALUMINUM ALI 0 40 -100.0% 0 0.0% 0 5,755 -100.0%ALUMINUM AUP 8,603 7,853 9.6% 3,983 116.0% 87,362 71,585 22.0%ALUMINUM CUP 0 0 - 0 0.0% 205 0 -ALUMINUM EDP 3,770 180 1,994.4% 1,098 243.4% 15,491 9,150 69.3%ALUMINUM MJP 1,620 2,220 -27.0% 780 107.7% 11,835 13,868 -14.7%COPPER HGS 2,611 88 2,867.0% 1,096 138.2% 14,846 1,606 824.4%E-MICRO GOLD MGC 246,996 106,238 132.5% 166,039 48.8% 1,483,874 946,127 56.8%FERROUS PRODUCTS BUS 2,407 420 473.1% 1,501 60.4% 17,087 1,220 1,300.6%GOLD GPS 0 0 0.0% 0 0.0% 0 1 -100.0%Gold Kilo GCK 0 153 -100.0% 0 0.0% 136 3,276 -95.8%IRON ORE 62 CHINA PLATTS FUTURES PIO 0 0 0.0% 0 0.0% 0 8,562 -100.0%IRON ORE 62 CHINA TSI FUTURES TIO 4,792 1,062 351.2% 438 994.1% 37,753 83,674 -54.9%LNDN ZINC ZNC 4,601 20 22,905.0% 1,677 174.4% 10,544 115 9,068.7%METALS LED 0 0 0.0% 0 - 0 0 0.0%SILVER SIL 9,494 4,985 90.5% 7,226 31.4% 77,342 58,404 32.4%
CommodityVOLUME
OCT 2018VOLUME
OCT 2017 % CHGVOLUMESEP 2018 % CHG
VOLUMEY.T.D 2018
VOLUMEY.T.D 2017 % CHG
The information herein is taken form source believed to be reliable. However, it is intended for the purposes of information and education only and is not guaranteed by the CME Group as to accuracy, completeness, nor trading resultsand does not constitute advice or continue a solicitation of the purchase or sale of any futures or options. The Rules and Regulations of the CME Group should be consulted as the authoritative source on all current contractspecifications and regulations. The open interest values are based on preliminary open interest values only.

NYMEX/COMEX Exchange Volume Report - Monthly
Metals OptionsCOMEX COPPER HX 45,773 17,878 156.0% 38,861 17.8% 285,266 74,686 282.0%COMEX GOLD OG 1,173,373 804,590 45.8% 749,608 56.5% 9,891,383 8,406,972 17.7%COMEX SILVER SO 146,547 108,549 35.0% 151,172 -3.1% 1,563,448 1,222,207 27.9%COPPER H1E 12 0 - 6 100.0% 47 0 -COPPER H2E 23 0 - 6 283.3% 136 0 -COPPER H3E 6 0 - 6 0.0% 107 0 -COPPER H4E 0 0 - 13 -100.0% 169 0 -COPPER H5E 0 0 - 0 0.0% 12 0 -GOLD OG1 18,142 7,188 152.4% 10,868 66.9% 113,226 34,424 228.9%GOLD OG2 21,515 4,337 396.1% 8,112 165.2% 102,108 33,340 206.3%GOLD OG3 13,503 4,079 231.0% 6,166 119.0% 109,006 36,826 196.0%GOLD OG4 7,167 3,201 123.9% 13,538 -47.1% 71,820 19,739 263.8%GOLD OG5 0 0 0.0% 0 0.0% 26,028 9,631 170.3%HOT ROLLED COIL STEEL CALL OPTION HRO 0 330 -100.0% 0 0.0% 0 330 -100.0%IRON ORE 62 CHINA TSI CALL OPTION ICT 0 988 -100.0% 0 0.0% 200 16,810 -98.8%IRON ORE 62 CHINA TSI PUT OPTION ICT 0 1,700 -100.0% 0 0.0% 1,280 25,355 -95.0%NYMEX PLATINUM PO 2,900 2,035 42.5% 4,848 -40.2% 40,098 26,865 49.3%PALLADIUM PAO 1,098 8,908 -87.7% 2,086 -47.4% 27,735 58,224 -52.4%SILVER SO1 1,204 124 871.0% 738 63.1% 4,978 666 647.4%SILVER SO2 1,036 19 5,352.6% 738 40.4% 4,204 213 1,873.7%SILVER SO3 666 4 16,550.0% 850 -21.6% 6,024 589 922.8%SILVER SO4 385 59 552.5% 1,165 -67.0% 3,177 187 1,598.9%SILVER SO5 0 0 0.0% 0 0.0% 2,092 4 52,200.0%
TOTAL FUTURES GROUP
Ag Products Futures 7 3 133.3% 9 -22.2% 83 184 -54.9%
Energy Futures 50,103,240 46,479,305 7.8% 41,758,592 20.0% 468,894,192 475,517,998 -1.4%
Metals Futures 11,699,876 11,472,727 2.0% 10,368,134 12.8% 126,746,244 106,270,260 19.3%TOTAL FUTURES 61,803,123 57,952,035 6.6% 52,126,735 18.6% 595,640,519 581,788,442 2.4%
CommodityVOLUME
OCT 2018VOLUME
OCT 2017 % CHGVOLUMESEP 2018 % CHG
VOLUMEY.T.D 2018
VOLUMEY.T.D 2017 % CHG
The information herein is taken form source believed to be reliable. However, it is intended for the purposes of information and education only and is not guaranteed by the CME Group as to accuracy, completeness, nor trading resultsand does not constitute advice or continue a solicitation of the purchase or sale of any futures or options. The Rules and Regulations of the CME Group should be consulted as the authoritative source on all current contractspecifications and regulations. The open interest values are based on preliminary open interest values only.

NYMEX/COMEX Exchange Volume Report - Monthly
TOTAL OPTIONS GROUP
Energy Options 7,941,876 6,192,034 28.3% 5,992,757 32.5% 63,945,325 67,124,336 -4.7%
Metals Options 1,433,350 963,989 48.7% 988,781 45.0% 12,252,544 9,967,068 22.9%TOTAL OPTIONS 9,375,226 7,156,023 31.0% 6,981,538 34.3% 76,197,869 77,091,404 -1.2%
TOTAL COMBINED
Ag Products 7 3 133.3% 9 -22.2% 83 184 -54.9%
Energy 58,045,116 52,671,339 10.2% 47,751,349 21.6% 532,839,517 542,642,334 -1.8%
Metals 13,133,226 12,436,716 5.6% 11,356,915 15.6% 138,998,788 116,237,328 19.6%GRAND TOTAL 71,178,349 65,108,058 9.3% 59,108,273 20.4% 671,838,388 658,879,846 2.0%
CommodityVOLUME
OCT 2018VOLUME
OCT 2017 % CHGVOLUMESEP 2018 % CHG
VOLUMEY.T.D 2018
VOLUMEY.T.D 2017 % CHG
The information herein is taken form source believed to be reliable. However, it is intended for the purposes of information and education only and is not guaranteed by the CME Group as to accuracy, completeness, nor trading resultsand does not constitute advice or continue a solicitation of the purchase or sale of any futures or options. The Rules and Regulations of the CME Group should be consulted as the authoritative source on all current contractspecifications and regulations. The open interest values are based on preliminary open interest values only.