Pub Catchment Report - BS22 6UN - Star Pubs & Bars Catchment... · G27 Thriving Independence 35 0.5...
5
Number of Pubs Catchment Adults 18+ Catchment Adults 18+ Per Pub Target Customers % of Population Target Customers % of Population Target Customers % of Population Great Pub Great Food Gold 2,469 31.8 109 8,587 40.0 137 18,439 35.6 122 Great Pub Great Food Silver 4,916 63.3 138 15,231 70.9 154 30,722 59.4 129 Mainstream Pub with Food - Suburban Value 6,774 87.2 157 19,644 91.4 165 46,091 89.1 160 Mainstream Pub with Food - Suburban Aspiration 2,771 35.7 96 10,212 47.5 128 26,458 51.1 138 Mainstream Pub with Food - Country Value 909 11.7 95 2,553 11.9 96 5,409 10.5 85 Mainstream Pub with Food - Country Aspiration 738 9.5 77 1,638 7.6 62 3,478 6.7 54 Bit of Style 1,135 14.6 59 4,233 19.7 79 16,753 32.4 130 YPV Mainstream 193 2.5 122 193 0.9 44 452 0.9 43 YPV Premium 7 0.1 1 389 1.8 27 4,131 8.0 120 Community Wet 3,145 40.5 131 7,220 33.6 109 15,285 29.5 95 Total 18+ Population in Catchment 7,770 21,483 51,739 ABC1 91 96 92 C2DE 111 105 109 Standard Catchment Pub Channel Index Per Pub Analysis 1 Mile Catchment Mosaic Profile Social Grade Index Index 51.8 % Index 49.2 51,739 48.2 0.5 Mile Catchment % 50.8 1,110 1,056 Index Index % 10 Minute DT Catchment 0.5 Mile Catchment 1 Mile Catchment 10 Minute DT Catchment Index 1 Mile Catchment 48.9 51.1 Pub Catchment Report - BS22 6UN H Aspiring Homemakers E Senior Security F Suburban Stability 1,953 0.5 Mile Catchment 1 Mile Catchment 10 Minute DT Catchment 7 7,770 49 11 21,483 Experian Copyright 2016 1
Transcript of Pub Catchment Report - BS22 6UN - Star Pubs & Bars Catchment... · G27 Thriving Independence 35 0.5...

Number of Pubs
Catchment Adults 18+
Catchment Adults 18+ Per Pub
Target
Customers
% of
Population
Target
Customers
% of
Population
Target
Customers
% of
Population
Great Pub Great Food Gold 2,469 31.8 109 8,587 40.0 137 18,439 35.6 122
Great Pub Great Food Silver 4,916 63.3 138 15,231 70.9 154 30,722 59.4 129
Mainstream Pub with Food - Suburban Value 6,774 87.2 157 19,644 91.4 165 46,091 89.1 160
Mainstream Pub with Food - Suburban Aspiration 2,771 35.7 96 10,212 47.5 128 26,458 51.1 138
Mainstream Pub with Food - Country Value 909 11.7 95 2,553 11.9 96 5,409 10.5 85
Mainstream Pub with Food - Country Aspiration 738 9.5 77 1,638 7.6 62 3,478 6.7 54
Bit of Style 1,135 14.6 59 4,233 19.7 79 16,753 32.4 130
YPV Mainstream 193 2.5 122 193 0.9 44 452 0.9 43
YPV Premium 7 0.1 1 389 1.8 27 4,131 8.0 120
Community Wet 3,145 40.5 131 7,220 33.6 109 15,285 29.5 95
Total 18+ Population in Catchment 7,770 21,483 51,739
ABC1 91 96 92
C2DE 111 105 109
Standard Catchment Pub
Channel Index
Per Pub Analysis1 Mile Catchment Mosaic Profile
Social Grade Index
Index
51.8
% Index
49.2
51,739
48.2
0.5 Mile Catchment
%
50.8
1,110 1,056
Index
Index%
10 Minute DT Catchment
0.5 Mile Catchment 1 Mile Catchment 10 Minute DT Catchment
Index
1 Mile Catchment
48.9
51.1
Pub Catchment Report - BS22 6UN
H Aspiring Homemakers E Senior Security F Suburban Stability
1,953
0.5 Mile
Catchment
1 Mile
Catchment
10 Minute DT
Catchment
7
7,770
4911
21,483
Experian Copyright 2016 1

Copyright Experian Ltd, HERE 2015. Ordnance Survey © Crown copyright 2015 Copyright Experian Ltd, HERE 2015. Ordnance Survey © Crown copyright 2015
Catchment Mosaic Groups
Mosaic Groups in 0.5 and 1 Mile Catchment Areas Mosaic Groups in 10 minute DT Catchment Area
A City Prosperity B Prestige Positions C Country Living D Rural Reality E Senior Security
F Suburban Stability G Domestic Success H Aspiring Homemakers I Family Basics J Transient Renters
K Municipal Challenge L Vintage Value M Modest Traditions N Urban Cohesion O Rental Hubs
Site Catchment
Experian Copyright 2016 2

Mosaic Type ProfileCatchment
Adults 18+%
Catchment
Adults 18+%
Catchment
Adults 18+% Mosaic Type Profile
Catchment
Adults 18+%
Catchment
Adults 18+%
Catchment
Adults 18+%
A01 World-Class Wealth 0 0.0 0 0.0 0 0.0 I36 Solid Economy 71 0.9 435 2.0 1,110 2.1
A02 Uptown Elite 0 0.0 0 0.0 0 0.0 I37 Budget Generations 153 2.0 241 1.1 572 1.1
A03 Penthouse Chic 0 0.0 0 0.0 0 0.0 I38 Childcare Squeeze 50 0.6 208 1.0 307 0.6
A04 Metro High-Flyers 0 0.0 0 0.0 0 0.0 I39 Families with Needs 0 0.0 0 0.0 66 0.1
B05 Premium Fortunes 0 0.0 0 0.0 0 0.0 J40 Make Do & Move On 66 0.8 66 0.3 114 0.2
B06 Diamond Days 0 0.0 1 0.0 81 0.2 J41 Disconnected Youth 193 2.5 193 0.9 452 0.9
B07 Alpha Families 3 0.0 13 0.1 47 0.1 J42 Midlife Stopgap 229 2.9 1,170 5.4 3,095 6.0
B08 Bank of Mum and Dad 62 0.8 116 0.5 663 1.3 J43 Renting a Room 0 0.0 0 0.0 1,803 3.5
B09 Empty-Nest Adventure 329 4.2 789 3.7 1,160 2.2 K44 Inner City Stalwarts 0 0.0 0 0.0 0 0.0
C10 Wealthy Landowners 0 0.0 2 0.0 319 0.6 K45 Crowded Kaleidoscope 0 0.0 0 0.0 0 0.0
C11 Rural Vogue 0 0.0 1 0.0 234 0.5 K46 High Rise Residents 0 0.0 0 0.0 0 0.0
C12 Scattered Homesteads 0 0.0 2 0.0 101 0.2 K47 Streetwise Singles 37 0.5 37 0.2 83 0.2
C13 Village Retirement 0 0.0 15 0.1 49 0.1 K48 Low Income Workers 0 0.0 0 0.0 110 0.2
D14 Satellite Settlers 0 0.0 14 0.1 617 1.2 L49 Dependent Greys 147 1.9 147 0.7 451 0.9
D15 Local Focus 0 0.0 0 0.0 78 0.2 L50 Pocket Pensions 190 2.4 406 1.9 534 1.0
D16 Outlying Seniors 0 0.0 0 0.0 35 0.1 L51 Aided Elderly 183 2.4 264 1.2 1,030 2.0
D17 Far-Flung Outposts 0 0.0 0 0.0 0 0.0 L52 Estate Veterans 189 2.4 189 0.9 645 1.2
E18 Legacy Elders 86 1.1 230 1.1 1,190 2.3 L53 Seasoned Survivors 7 0.1 7 0.0 222 0.4
E19 Bungalow Heaven 600 7.7 1,922 8.9 3,746 7.2 M54 Down-to-Earth Owners 0 0.0 4 0.0 63 0.1
E20 Classic Grandparents 207 2.7 829 3.9 1,243 2.4 M55 Offspring Overspill 588 7.6 1,194 5.6 1,993 3.9
E21 Solo Retirees 505 6.5 813 3.8 1,207 2.3 M56 Self Supporters 160 2.1 264 1.2 638 1.2
F22 Boomerang Boarders 402 5.2 773 3.6 1,501 2.9 N57 Community Elders 0 0.0 0 0.0 0 0.0
F23 Family Ties 664 8.5 1,258 5.9 2,446 4.7 N58 Cultural Comfort 0 0.0 0 0.0 0 0.0
F24 Fledgling Free 309 4.0 602 2.8 884 1.7 N59 Asian Heritage 0 0.0 0 0.0 0 0.0
F25 Dependable Me 217 2.8 645 3.0 949 1.8 N60 Ageing Access 0 0.0 0 0.0 735 1.4
G26 Cafés and Catchments 0 0.0 0 0.0 0 0.0 O61 Career Builders 0 0.0 0 0.0 56 0.1
G27 Thriving Independence 35 0.5 102 0.5 594 1.1 O62 Central Pulse 0 0.0 0 0.0 0 0.0
G28 Modern Parents 348 4.5 1,700 7.9 2,326 4.5 O63 Flexible Workforce 0 0.0 0 0.0 21 0.0
G29 Mid-Career Convention 332 4.3 1,135 5.3 1,842 3.6 O64 Bus-Route Renters 6 0.1 259 1.2 3,723 7.2
H30 Primary Ambitions 238 3.1 1,670 7.8 2,852 5.5 O65 Learners & Earners 0 0.0 0 0.0 0 0.0
H31 Affordable Fringe 567 7.3 1,822 8.5 2,396 4.6 O66 Student Scene 0 0.0 0 0.0 0 0.0
H32 First-Rung Futures 596 7.7 1,023 4.8 1,496 2.9 U99 Unclassified 0 0.0 1 0.0 40 0.1
H33 Contemporary Starts 0 0.0 790 3.7 5,255 10.2 Total 7,770 21,483 51,739
H34 New Foundations 0 0.0 1 0.0 178 0.3
H35 Flying Solo 1 0.0 130 0.6 387 0.7
1 Mile
Catchment
10 Minute DT
Catchment
Adults 18+ by Mosaic Type in Each Catchment
0.5 Mile
Catchment
1 Mile
Catchment
10 Minute DT
Catchment
0.5 Mile
Catchment
Experian Copyright 2016 3

Experian Helpdesk: [email protected]
0115 968 5099
● Own tablets
● Search using online aggregators
● Cohabiting couples with children
● Aged 26-45
● Good household incomes
● Own with a mortgage
● 2 or 3 bedroom terraces or semis
● Family neighbourhoods
● Parents aged 41-55
● Adult children at home, often students
● Also have a child under 18
● Own semi or detached homes
● Supporting kids can cause money strains
● Technology for entertainment● Most likely to have small pets
● Families with school age children
● Married couples in 30s or 40s
● Have lived there 5 years or more
● Own semis in affordable suburbs
● School age children
● Many in receipt of Tax Credits
● Elderly couples and singles
● Own their bungalow outright
● Neighbourhoods of elderly people
● May research online
● Like buying in store
4. H30 Primary AmbitionsForward-thinking younger families who sought affordable homes in good suburbs which they may
now be out-growing
● Pre-pay mobiles, low spend
Top 5 Mosaic Types
Peace-seeking seniors appreciating the calm of bungalow estates designed for the elderly
Settled families with children owning modest, 3-bed semis in areas where there's more house for
less money
If you do not have log in details for Segmentation Portal then please contact the
Busy couples in modern detached homes juggling the demands of school-age children and
careers
Full visualisation of all types and groups are available in Segmentation Portal:
● Double income families
● Modern housing
● Good quality detached homes
1 Mile Catchment Mosaic Type Visualisation
3. G28 Modern Parents
2. H31 Affordable Fringe
1. E19 Bungalow Haven
www.segmentationportal.com
5. F23 Family TiesActive families with teens and adult children whose prolonged support is eating up household
resources
Experian Copyright 2016 4
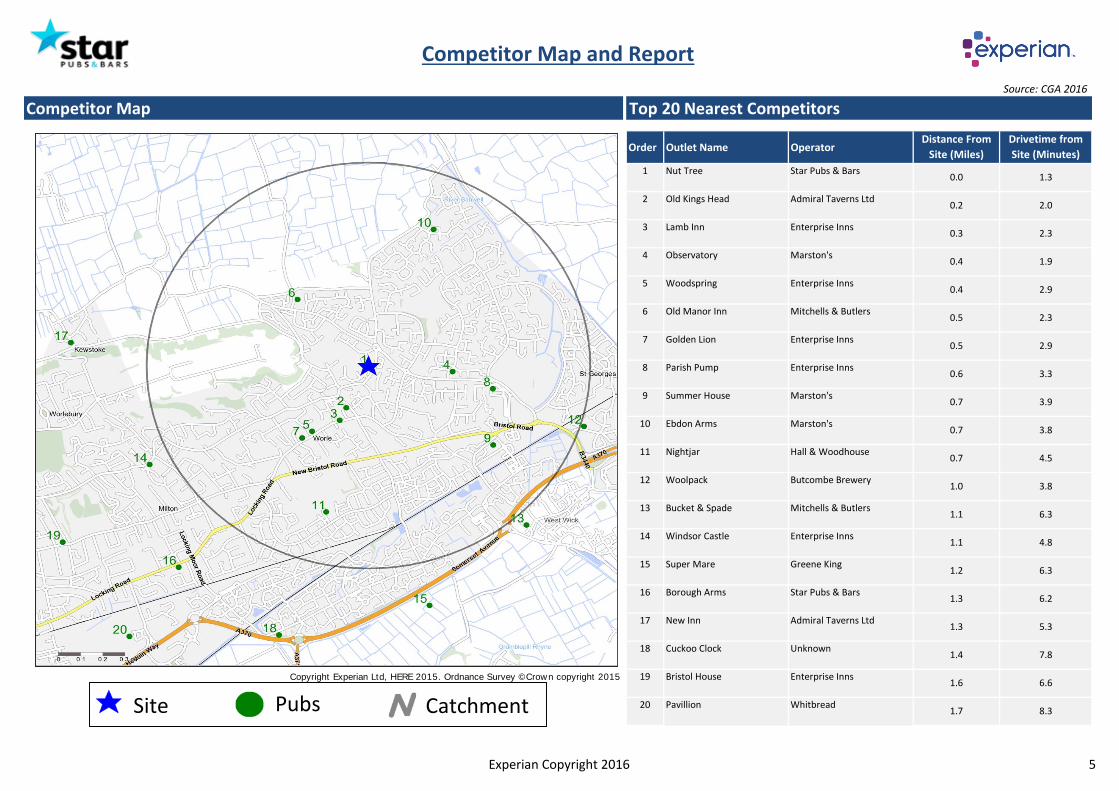
Source: CGA 2016
Competitor Map Top 20 Nearest Competitors
Order Outlet Name Operator
1
2
3
4
5
6
7
8
9
10
11
12
13
14
15
16
17
18
Copyright Experian Ltd, HERE 2015. Ordnance Survey © Crown copyright 2015 19
20
Unknown
Enterprise Inns
Whitbread
Mitchells & Butlers
Enterprise Inns
Greene King
Star Pubs & Bars
Admiral Taverns Ltd
Borough Arms
New Inn
Cuckoo Clock
Bristol House
Windsor Castle
Super Mare
Pavillion
Star Pubs & Bars
Admiral Taverns Ltd
Enterprise Inns
Marston's
Enterprise Inns
Mitchells & Butlers
Enterprise Inns
Enterprise Inns
Marston's
Marston's
Hall & Woodhouse
Butcombe Brewery
Nightjar
Woolpack
Bucket & Spade
Old Manor Inn
Golden Lion
Parish Pump
Summer House
Ebdon Arms
Nut Tree
Old Kings Head
Lamb Inn
Observatory
Woodspring
0.6
0.7
Distance From
Site (Miles)
0.0
0.2
0.3
0.4
6.6
Drivetime from
Site (Minutes)
1.7
1.1
1.1
1.2
1.3
1.3
0.7
0.7
1.0
1.4
1.6
0.4
0.5
0.5
4.8
6.3
6.2
5.3
7.8
Competitor Map and Report
8.3
1.3
2.0
2.3
1.9
2.9
2.3
2.9
3.3
3.9
3.8
4.5
3.8
6.3
Pubs Catchment Site
Experian Copyright 2016 5