Nutrition Webinar
32
Nutrition Webinar for FDOV/SDGP projects 25 & 28 November 2019 The Netherlands Working Group on international Nutrition, represented by Herbert Smorenburg Arine Valstar Marijke de Graaf
Transcript of Nutrition Webinar
Nutrition Webinar
for FDOV/SDGP projects
25 & 28 November 2019 The Netherlands Working Group on international Nutrition, represented by Herbert Smorenburg
Arine Valstar Marijke de Graaf
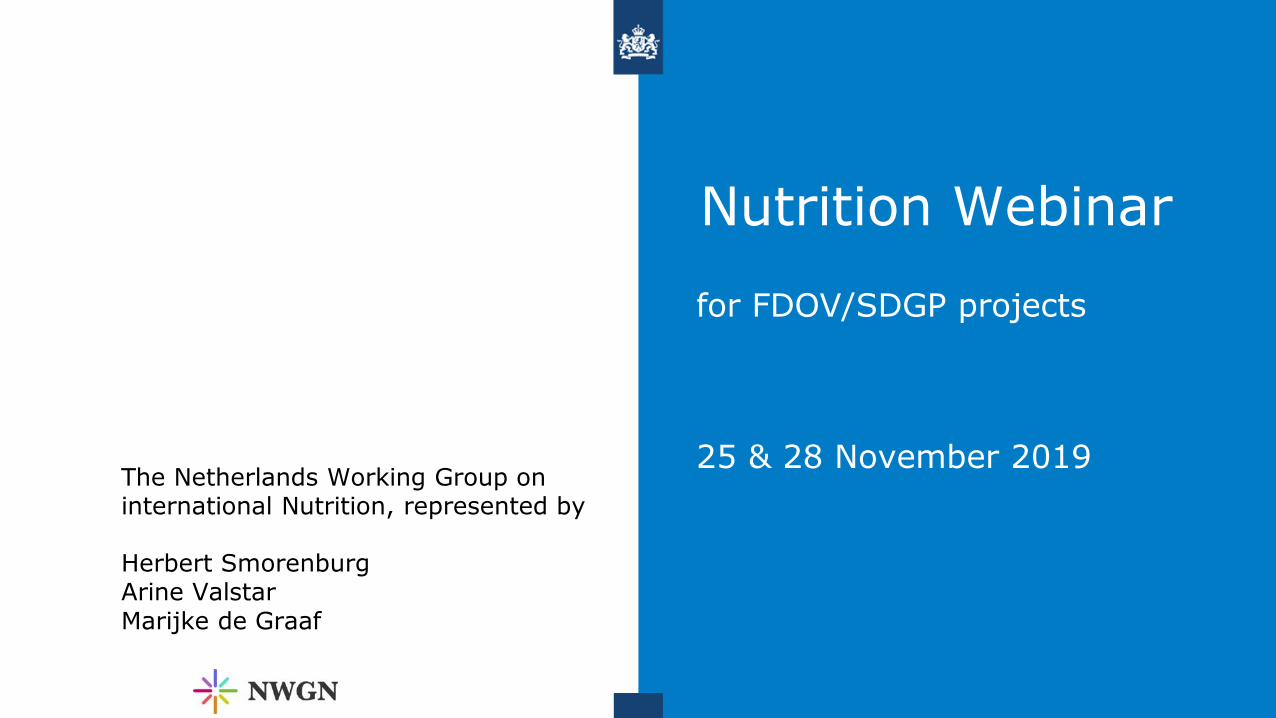
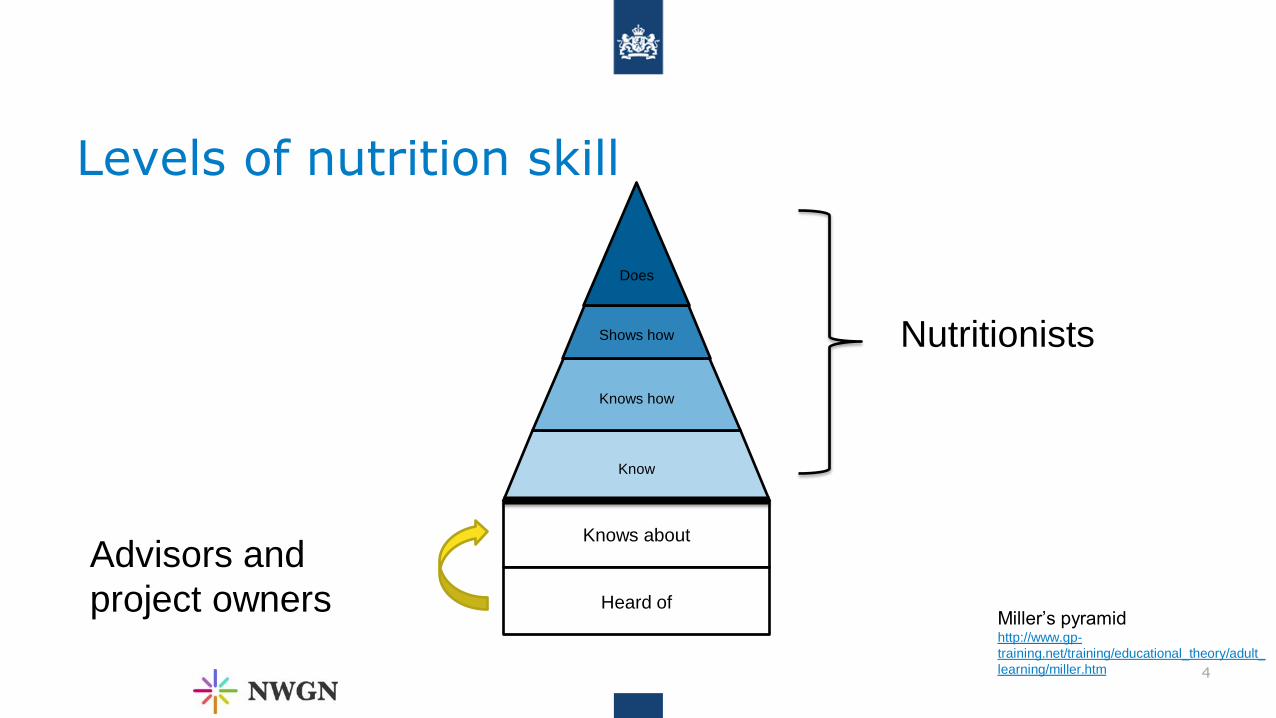
Levels of nutrition skill
2
Know
Knows how
Shows how
Does
Knows about
Heard of Miller’s pyramid http://www.gp-
training.net/training/educational_theory/adult_
learning/miller.htm
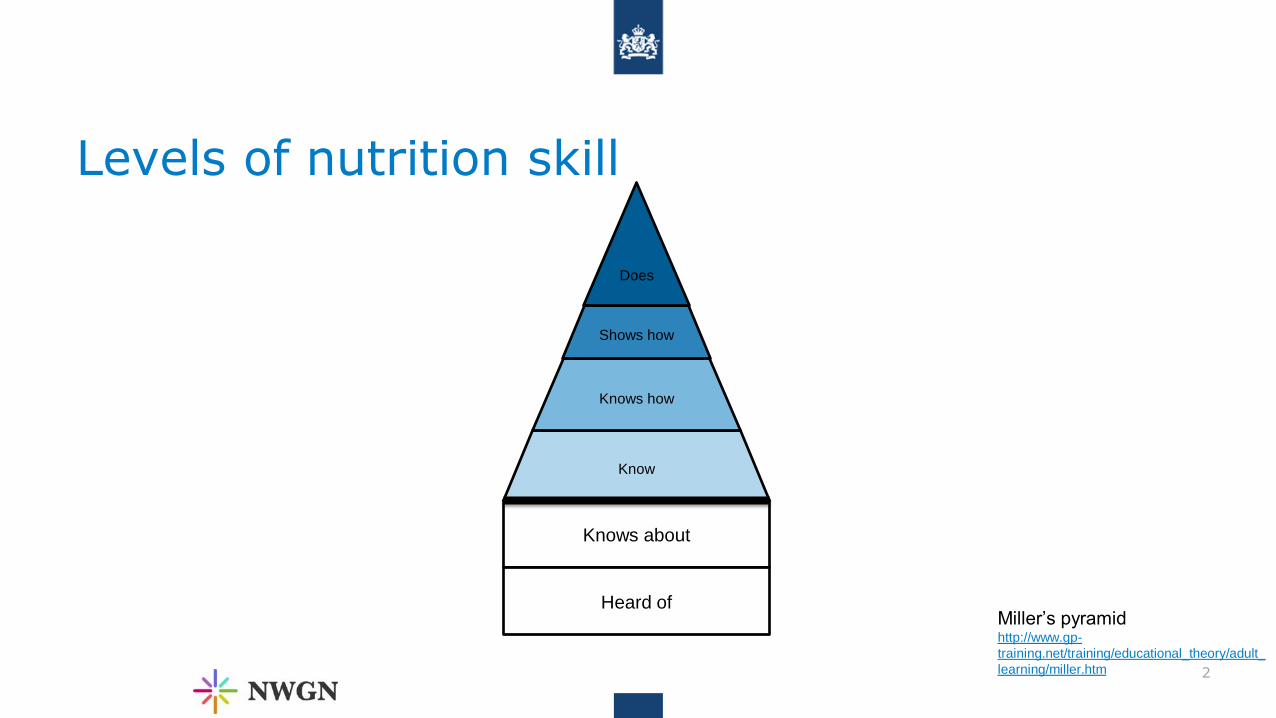
Poll – How do you see your Nutrition skills?
3
Know
Knows how
Shows how
Does
Knows about
Heard of Miller’s pyramid http://www.gp-
training.net/training/educational_theory/adult_
learning/miller.htm
Levels of nutrition skill
4
Know
Knows how
Shows how
Does
Knows about
Heard of
Nutritionists
Advisors and
project owners Miller’s pyramid http://www.gp-
training.net/training/educational_theory/adult_
learning/miller.htm

• 1 in 3 people worldwide are malnourished
• Leading cause of poor health
• Unhealthy diets pose a greater risk to morbidity and mortality than does unsafe sex, and alcohol, drug, and tobacco use combined.
• 6 of the top 10 risk factors are diet related
• Enormous economic and human capital costs
Why Nutrition?
5
Sources: see Reference slide
Occupational risks
High total cholesterol
Tobacco
Alcohol and drug use
High body mass index
High fasting plasma glucose
Air pollution
High systolic blood pressure
Dietary risks
Child and maternal malnutrition
The Global Burden of Disease:
6 of the top 10 Risk Factors for are Diet Related
DALYs
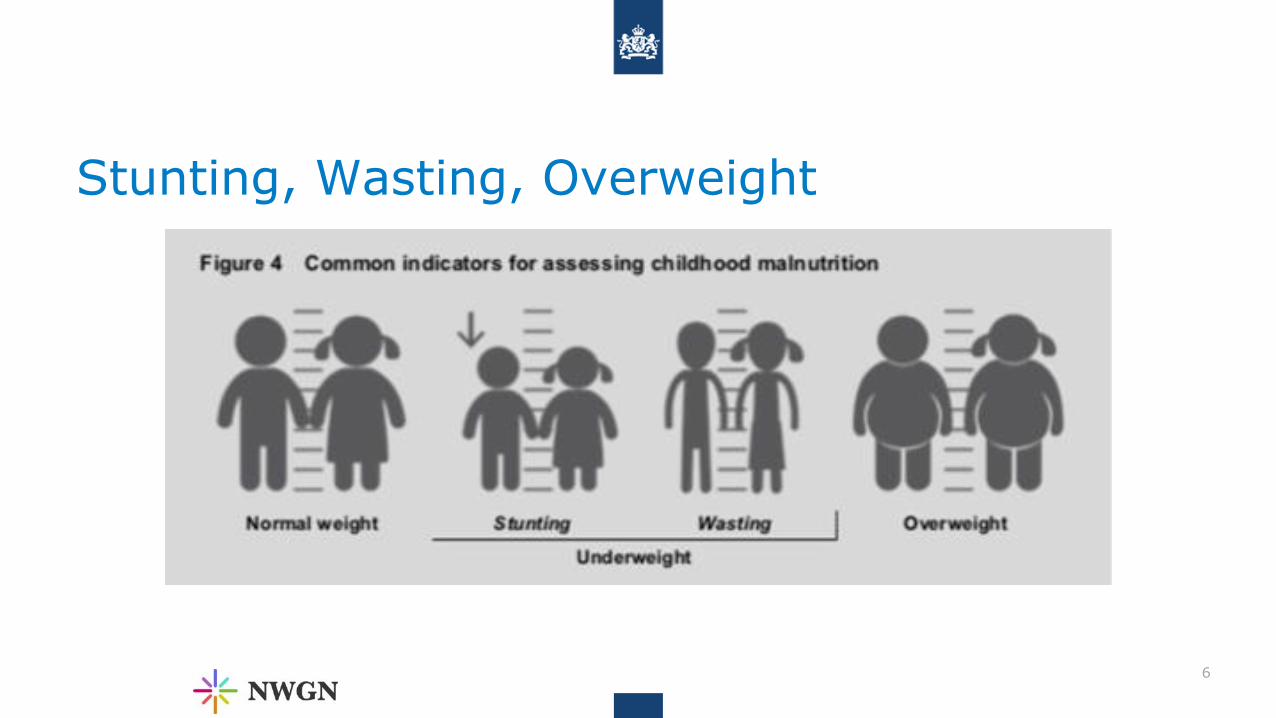
Stunting, Wasting, Overweight
6
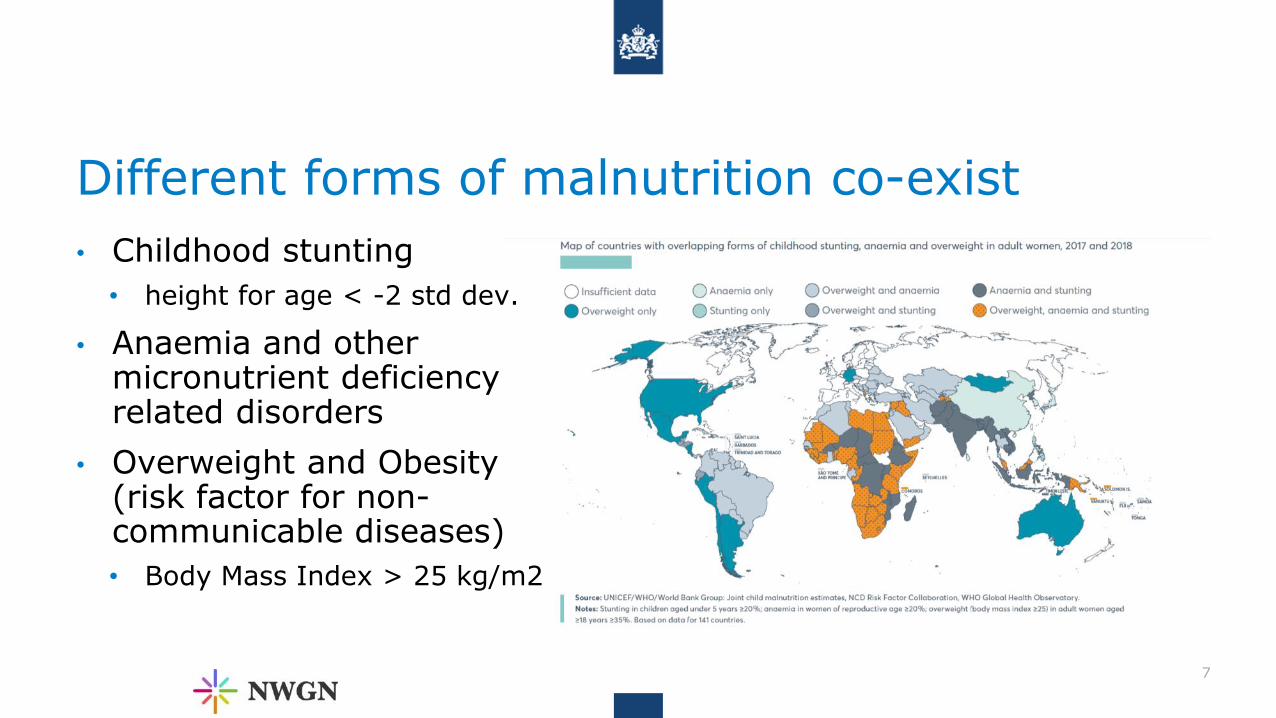
Different forms of malnutrition co-exist
7
• Childhood stunting
• height for age < -2 std dev.
• Anaemia and other micronutrient deficiency related disorders
• Overweight and Obesity (risk factor for non-communicable diseases)
• Body Mass Index > 25 kg/m2

Simplified Framework for Nutrition Improvement
Sources: see Reference slide
On-farm availability,
diversity and safety of
food
Income Food
environment in markets
Nutrition knowledge and norms
Women’s empowerment
(time, labour, assets, income
control)
Natural resource
management practices
OUTCOMES
Nutritional status
Food access Care practices Health and sanitation
environment
IMPACTS
Diet Health
Interventions

FDOV/SDGP: three clusters of pathways that may lead to nutrition improvement
9
Income
Diet
Access

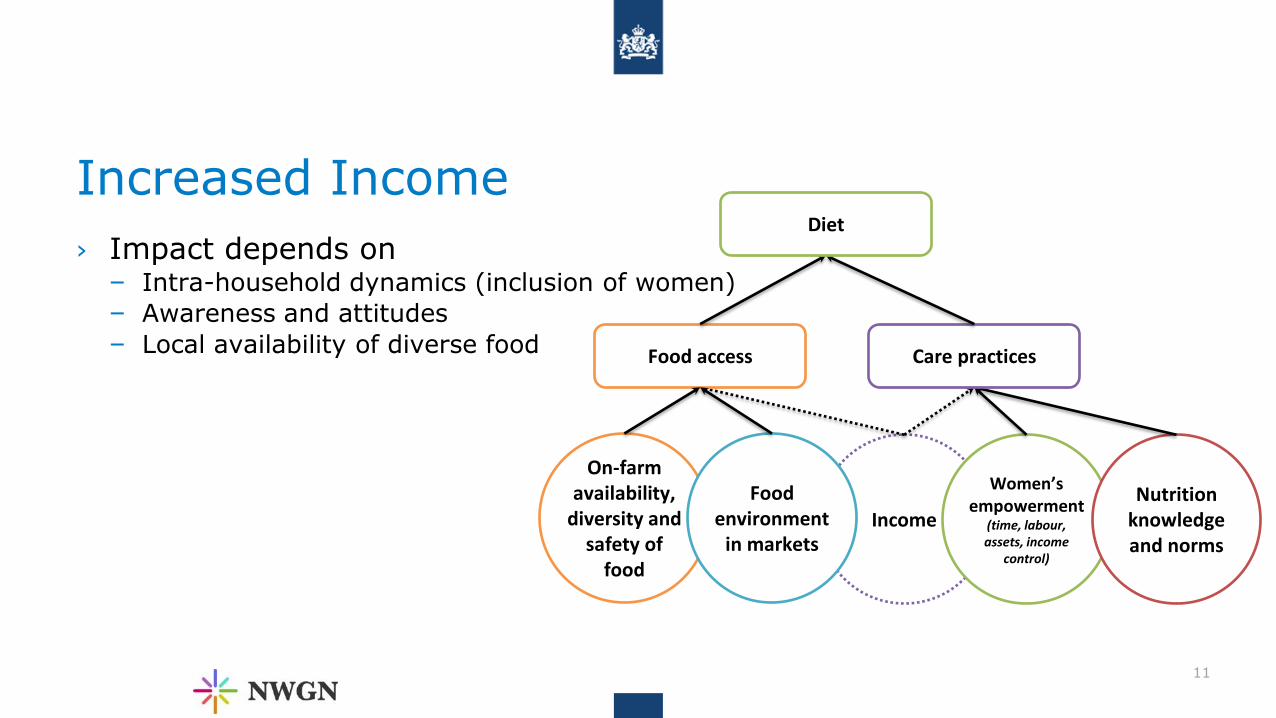
Increased Income
› Impact depends on – Intra-household dynamics (inclusion of women)
– Awareness and attitudes
– Local availability of diverse food
10
Increased Income
› Impact depends on – Intra-household dynamics (inclusion of women)
– Awareness and attitudes
– Local availability of diverse food
11
Income
Women’s empowerment
(time, labour, assets, income
control)
Nutrition knowledge and norms
Food access Care practices
Diet
On-farm availability,
diversity and safety of
food
Food environment
in markets
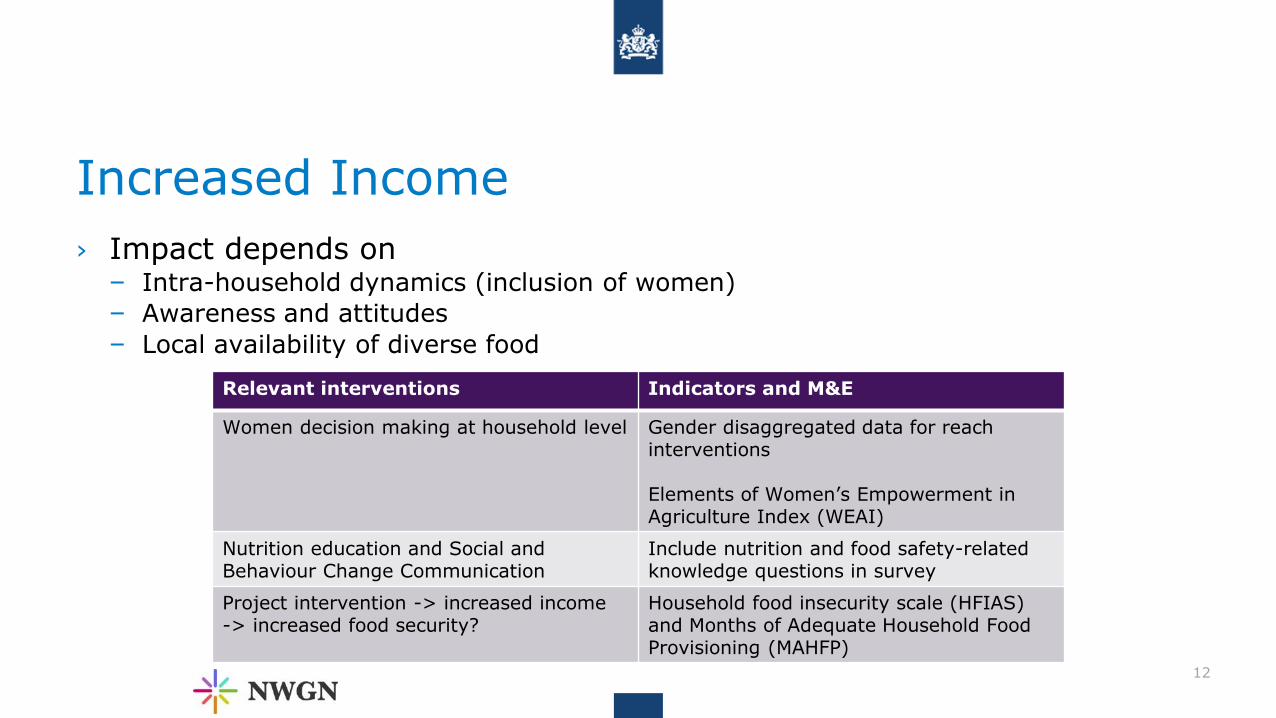
Increased Income
› Impact depends on – Intra-household dynamics (inclusion of women)
– Awareness and attitudes
– Local availability of diverse food
12
Relevant interventions Indicators and M&E
Women decision making at household level Gender disaggregated data for reach interventions Elements of Women’s Empowerment in Agriculture Index (WEAI)
Nutrition education and Social and Behaviour Change Communication
Include nutrition and food safety-related knowledge questions in survey
Project intervention -> increased income -> increased food security?
Household food insecurity scale (HFIAS) and Months of Adequate Household Food Provisioning (MAHFP)

Increased Access to a specific food crop
› Impact depends on:
– nutritional value
– dietary gap
– affordability and accessibility to target group throughout the year
13
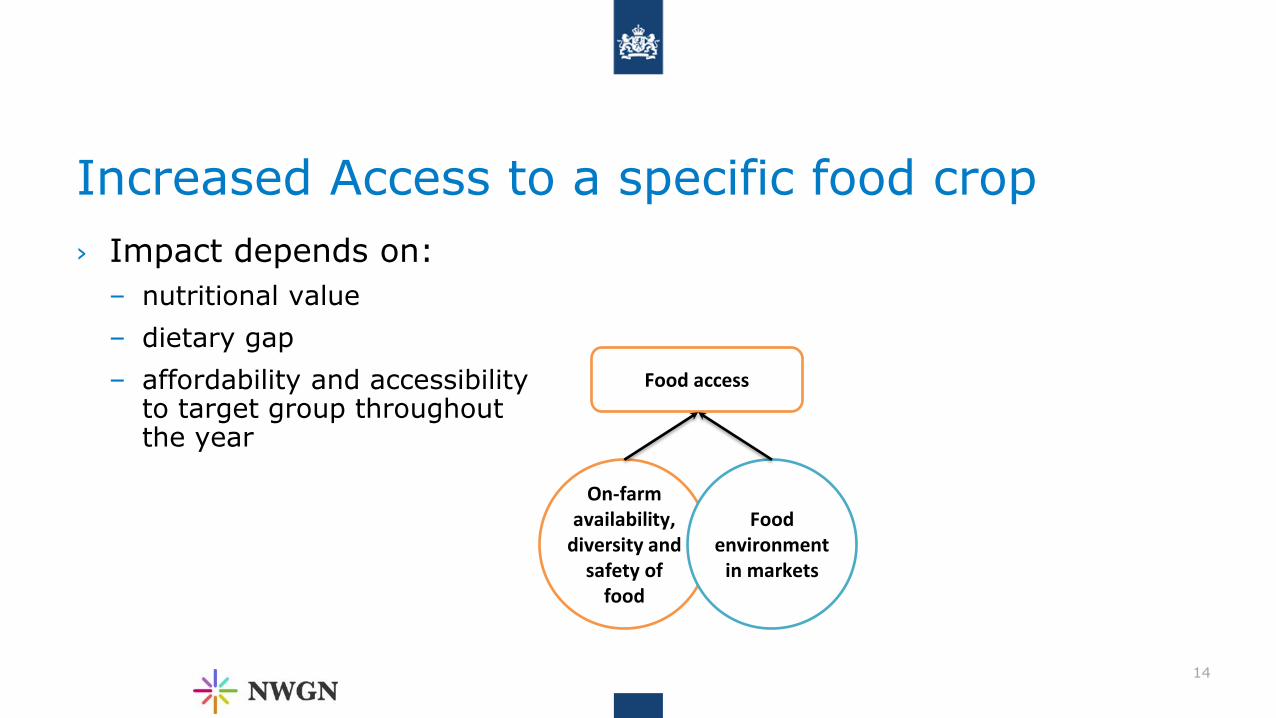
Increased Access to a specific food crop
› Impact depends on:
– nutritional value
– dietary gap
– affordability and accessibility to target group throughout the year
14
Food access
On-farm availability,
diversity and safety of
food
Food environment
in markets

Increased Access to a specific food crop
› Impact depends on:
– …
– and all factors mentioned before
15
On-farm availability,
diversity and safety of
food
Income Food
environment in markets
Nutrition knowledge and norms
Women’s empowerment
(time, labour, assets, income
control)
Food access Care practices
Diet

Increased Access to a specific food crop
› Impact depends on:
– nutritional value
– dietary gap
– affordability and accessibility to target group throughout the year
16
Relevant interventions Indicators and M&E
All mentioned for income + • All mentioned for income + • Reach to vulnerable groups (BoP, children, women,…) • Uptake of improved post-harvest and processing practices • Increased demand for, purchase and/or consumption of
nutritious crop • Food frequency questionnaire
In case of nutrient dense crops: • Adequate post-harvest handling and processing • Promotion of own consumption
In case of staple or non-food crops: • Alongside homestead food production

Improved diet
› Meaning: a diet that is safe, diverse, healthy and adequate. The diet should:
– cover all nutritional needs: energy, proteins, micronutrients , essential fats, fibre and water
– be suitable for the age of the targeted group
17

Dietary diversity: one dimension of diet quality
18
The ten food groups “counted” in the Minimum Dietary Diversity for Women
of Reproductive Age indicator are:
1. Grains, white roots and tubers, and plantains
2. Pulses (beans, peas and lentils)
3. Nuts and seeds
4. Dairy
5. Meat, poultry and fish
6. Eggs
7. Dark green leafy vegetables
8. Other vitamin A-rich fruits and vegetables
9. Other vegetables
10. Other fruits

Improved diet
19
On-farm availability,
diversity and safety of
food
Income Food
environment in markets
Nutrition knowledge and norms
Women’s empowerment
(time, labour, assets, income
control)
Food access Care practices
Diet

Improved diet
› Meaning: a diet that is safe, diverse, healthy and adequate. The diet should:
– cover all nutritional needs: energy, proteins, micronutrients , essential fats, fibre and water
– be suitable for the age of the targeted group
20
Relevant interventions Indicators and M&E
All mentioned for income and access + • All mentioned for income and access + • Minimum Acceptable Diet (MAD) for 6-24 months old
infants and children • Minimum Dietary Diversity (MDD-W) for women of
reproductive age
Participatory appraisal of dietary habits (involve people in assessing their own food and nutrition situation and identifying the causes of food and nutrition problems according to their perceptions)
Cooking / food processing demonstrations
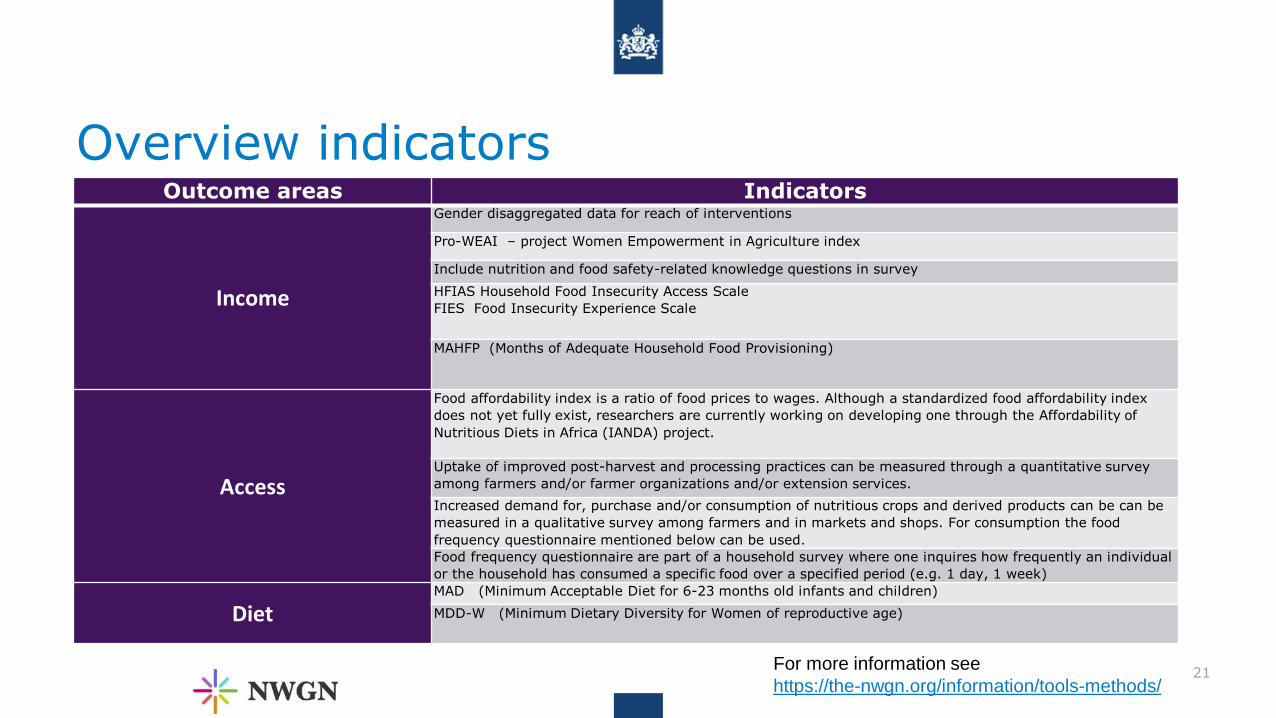
Overview indicators
21
Outcome areas Indicators
Income
Gender disaggregated data for reach of interventions
Pro-WEAI – project Women Empowerment in Agriculture index
Include nutrition and food safety-related knowledge questions in survey
HFIAS Household Food Insecurity Access Scale
FIES Food Insecurity Experience Scale
MAHFP (Months of Adequate Household Food Provisioning)
Access
Food affordability index is a ratio of food prices to wages. Although a standardized food affordability index
does not yet fully exist, researchers are currently working on developing one through the Affordability of
Nutritious Diets in Africa (IANDA) project.
Uptake of improved post-harvest and processing practices can be measured through a quantitative survey
among farmers and/or farmer organizations and/or extension services.
Increased demand for, purchase and/or consumption of nutritious crops and derived products can be can be
measured in a qualitative survey among farmers and in markets and shops. For consumption the food
frequency questionnaire mentioned below can be used.
Food frequency questionnaire are part of a household survey where one inquires how frequently an individual
or the household has consumed a specific food over a specified period (e.g. 1 day, 1 week)
Diet MAD (Minimum Acceptable Diet for 6-23 months old infants and children)
MDD-W (Minimum Dietary Diversity for Women of reproductive age)
For more information see
https://the-nwgn.org/information/tools-methods/

Example: RiceTechCambodia
› Organic rice value chain in Cambodia.
› Small-scale rice farmers will be reached
– receiving extensive training on organic agriculture and good agricultural practices.
– getting access to drying, storage and milling facilities
› Increases the quality of the rice products that can be sold and in this way increases the income of farmers.
22
Example: RiceTechCambodia
› Who has access to and decides how to spend the increased income? Women?
› Are diversified food sources locally available?
› Are they aware and willing to eat more diverse?
› Measuring HFIAS and MAHFP (base- & endline) provide insight in (perceived) income and food security situations.
23

Co-funded by:
Example: Vegetables for All Tanzania
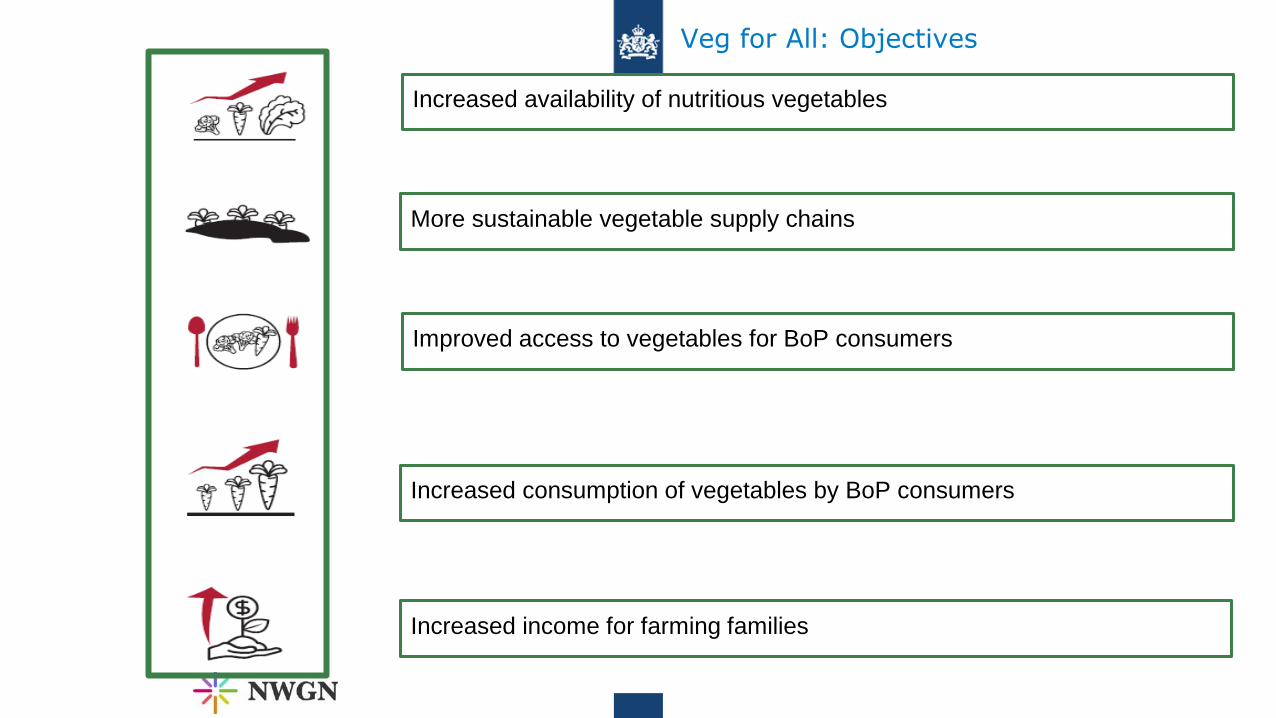
Increased availability of nutritious vegetables
More sustainable vegetable supply chains
Improved access to vegetables for BoP consumers
Increased consumption of vegetables by BoP consumers
Increased income for farming families
Veg for All: Objectives
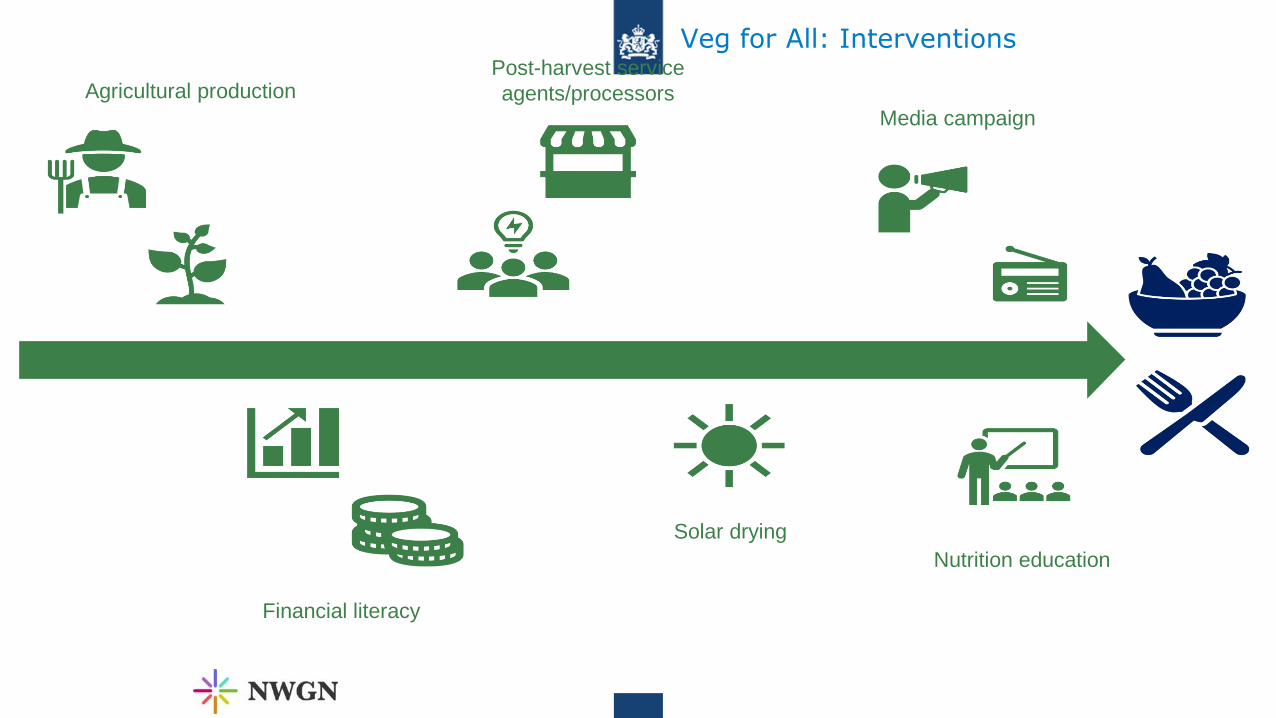
Agricultural production
Financial literacy
Post-harvest service
agents/processors
Solar drying
Media campaign
Nutrition education
Veg for All: Interventions
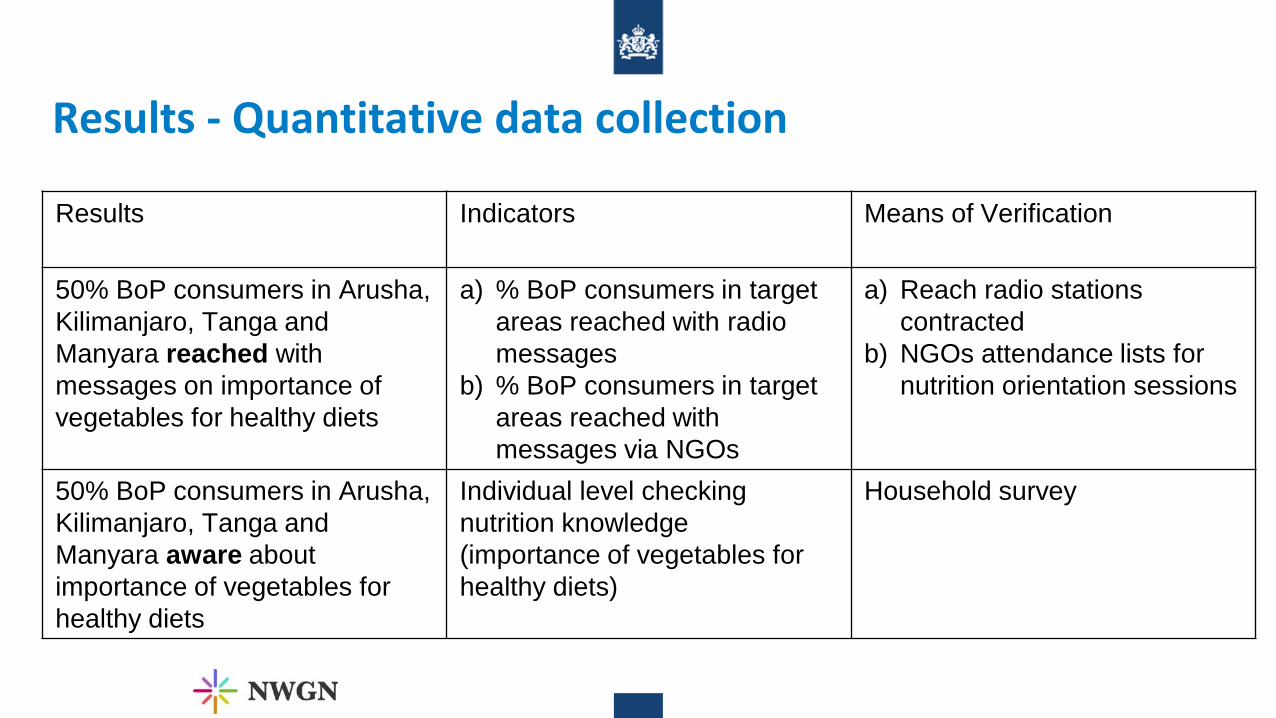
Results - Quantitative data collection
Results Indicators Means of Verification
50% BoP consumers in Arusha,
Kilimanjaro, Tanga and
Manyara reached with
messages on importance of
vegetables for healthy diets
a) % BoP consumers in target
areas reached with radio
messages
b) % BoP consumers in target
areas reached with
messages via NGOs
a) Reach radio stations
contracted
b) NGOs attendance lists for
nutrition orientation sessions
50% BoP consumers in Arusha,
Kilimanjaro, Tanga and
Manyara aware about
importance of vegetables for
healthy diets
Individual level checking
nutrition knowledge
(importance of vegetables for
healthy diets)
Household survey
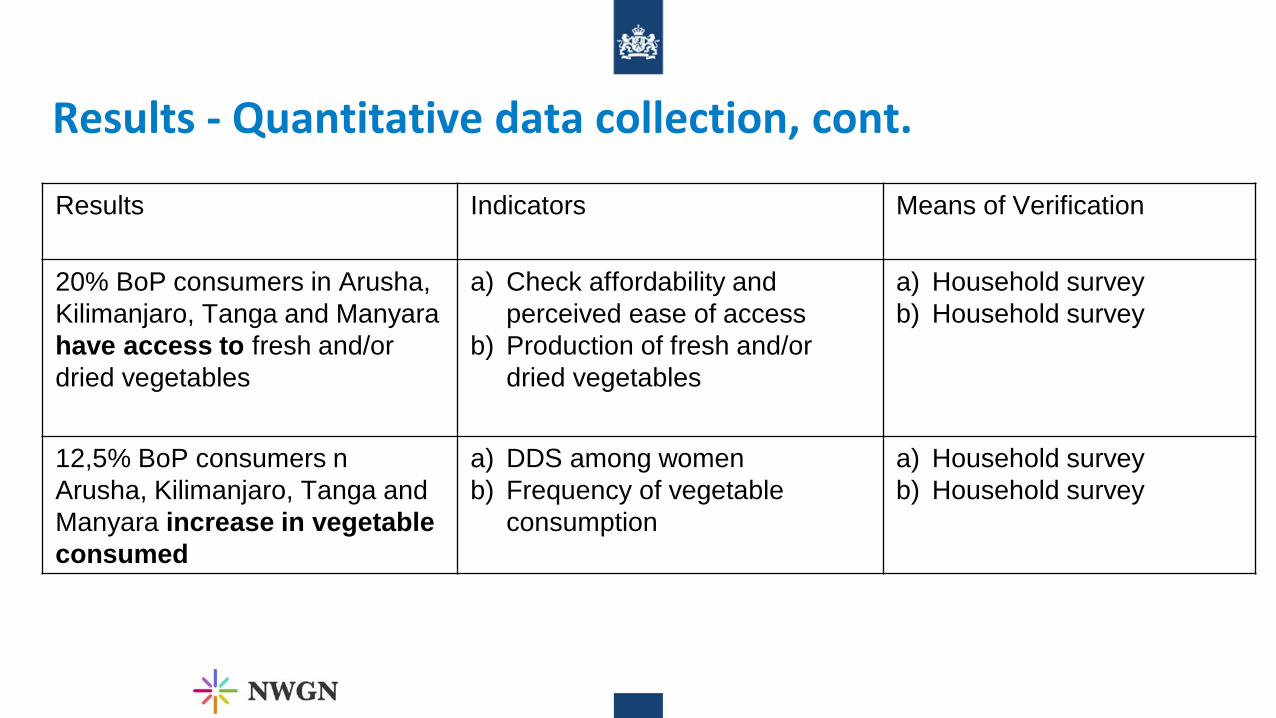
Results Indicators Means of Verification
20% BoP consumers in Arusha,
Kilimanjaro, Tanga and Manyara
have access to fresh and/or
dried vegetables
a) Check affordability and
perceived ease of access
b) Production of fresh and/or
dried vegetables
a) Household survey
b) Household survey
12,5% BoP consumers n
Arusha, Kilimanjaro, Tanga and
Manyara increase in vegetable
consumed
a) DDS among women
b) Frequency of vegetable
consumption
a) Household survey
b) Household survey
Results - Quantitative data collection, cont.

An alternative perspective: Workforce nutrition
› Workforce nutrition programmes
– Organised by employer
– Part of the solution to malnutrition
– Important for business returns and, ultimately, on GDP
– Most suitable where employer can organise interventions at the workplace and make these accessible to the entire workforce
› Interventions
– Healthy food at work
– Nutrition education
– Nutrition-focused health checks
– Breastfeeding support
30
Source: GAIN, Workforce Nutrition evidence briefs, 2019 https://nutritionconnect.org/resource-center/workforce-nutrition-evidence-briefs
References
31
› Why Nutrition?
Development Initiatives, 2018 Global Nutrition Report: Shining a light to spur action on nutrition. Bristol, UK, 2018. Institute for Health Metrics and Evaluation (IHME), University of Washington. GBD Compare Data Visualization. Seattle, USA, 2018. Available from http://vizhub.healthdata.org/gbd-compare. Global Panel on Agriculture and Food Systems for Nutrition. Cost of malnutrition, https://glopan.org/cost-of-malnutrition
Herforth, A. & Ballard, T. 2016. Nutrition indicators in agriculture projects: current measurements, priorities and gaps. Global Food Security. Available at: https://www.sciencedirect.com/science/article/pii/S2211912415300109
› Simplified Framework for Nutrition Improvement
GAIN, Workforce Nutrition evidence briefs, 2019 https://nutritionconnect.org/resource-center/workforce-nutrition-evidence-briefs
› Workforce nutrition

› All information available on NWGN website https://the-nwgn.org/information/tools-methods/
› Invitation to all of you to book an online (via Zoom), 1-hr consultation with us to discuss nutrition in the context of your project.
› Information about this webinar and further instructions how to approach us will be emailed to you.
› We hope that this will result in increased nutrition awareness in FDOV & SDGP projects and lead to tangible and measurable contributions towards improved nutrition.
What’s next?
32

Q&A
33