Numerical Simulation of Vortex Cavitation in a Three ... · Numerical Simulation of Vortex...
12
Tao Xing 1 Zhenyin Li 2 Steven H. Frankel 3 School of Mechanical Engineering, Purdue University, West Lafayette, IN 47907 Numerical Simulation of Vortex Cavitation in a Three- Dimensional Submerged Transitional Jet Vortex cavitation in a submerged transitional jet is studied with unsteady three- dimensional direct numerical simulations. A locally homogeneous cavitation model that accounts for non-linear bubble dynamics and bubble/bubble interactions within spherical bubble clusters is employed. The velocity, vorticity, and pressure fields are compared for both cavitating and noncavitating jets. It is found that cavitation occurs in the cores of the primary vortical structures, distorting and breaking up the vortex ring into several sections. The velocity and transverse vorticity in the cavitating regions are intensified due to vapor formation, while the streamwise vorticity is weakened. An analysis of the vor- ticity transport equation reveals the influence of cavitation on the relative importance of the vortex stretching, baroclinic torque, and dilatation terms. Statistical analysis shows that cavitation suppresses jet growth and decreases velocity fluctuations within the va- porous regions of the jet. DOI: 10.1115/1.1976742 1 Introduction Cavitation is a dynamic process involving the growth and col- lapse of gas cavities in liquids. The bubbles usually form and grow in regions of low pressure and then subsequently collapse when they are convected to regions of high pressure. If the bubble collapse occurs near a solid wall, asymmetries can result in the generation of extremely high pressure jets, which can cause con- siderable material damage or erosion. This problem is particularly important in hydraulic applications involving fluid machinery. Ad- ditionally, the alternating growth and collapse of bubbles associ- ated with cavitation can result in high-frequency pressure fluctua- tions, the generation of excessive noise, and vibration. The ability to understand and predict cavitation flow physics is important in fluid engineering. It is well known that there is a strong link between cavitation inception and turbulent flow structures 1. Evidence for this link exists in both wall-bounded flows, as well as free-shear flows 2. Billard et al. 3 presented further experimental evidence for this effect where they used a vortex turbulence generator upstream of a venturi to produce preturbulence and observed a delay in cavi- tation inception and a reduction in noise. This behavior was at- tributed to the generation of small-amplitude, high-frequency pressure fluctuations affecting bubble behavior, in particular the morphology of the cavities. In another study, Baur and Ngeter 4 studied the three-dimensional features of cavitation structures in a turbulent shear layer. They considered a channel flow with a rect- angular sill mounted upstream on the bottom wall of the channel. This produced separated flow and a turbulent shear layer down- stream in a similar manner to the turbulence generator used by Billard et al. 3. The shear layer produced a region of high tur- bulence and horseshoe-shaped cavitation tubes that they associ- ated with the bursting process in wall-bounded channel flows. For a given flow, the location of cavitation inception can be specified in different ways. In wall-bounded flows, such as Bil- lard’s studies on venturi, minimum pressure occurs at or close to a solid surface, according to the maximum-modulus theorem. How- ever, the most common exception to this rule is in vortex cavita- tion, where the unsteady effects and/or viscous effects associated with vortex shedding or turbulence cause deviation from the maximum-modulus theorem 5. In vortex cavitation, often associated with separated flows, cavitation occurs in the cores of eddies formed in the shear layer emanating from the separation point 2. This is due to these being regions of minimum pressure. Hence, flow separation and transi- tion to turbulence can have a considerable effect on cavitation. Even without flow separation, intense pressure fluctuations due to turbulence can influence the position of cavitation. In both cases, the temporal pressure fluctuations dictate the cavitation process. Gopalan et al. 6 found that the location and degree of cavita- tion was dependent on the nature of the vortical structures pro- duced in a submerged water jet. If the jet was deliberately tripped, cavitation occurred in the cores of the vortex rings which formed downstream x / D =2 of the nozzle. If the jet was not tripped, cavitation occurred in the cores of comparatively strong stream- wise vortex tubes just downstream x / D = 0.55 of the nozzle. As observed by Arndt 7, tripping the boundary layer of the jet ap- parently suppresses the secondary vortex cavitation. This mecha- nism of cavitation control is very similar to the one studied by Billard et al. 3. Sridhar and Katz et al. 8 have also shown that the presence of a few microscopic bubbles at very low void frac- tion can significantly affect the vortex dynamics within a water jet. Recent PIV particle imaging velocimetry measurements in a cavitating turbulent shear layer reported by Iyer and Ceccio 9 did not show a significant effect of cavitation on the vortical struc- ture of the jet but did show an increase in streamwise velocity fluctuations and a decrease in the maximum cross-stream fluctua- tions and Reynolds stresses due to cavitation. They speculated that the presence of cavitation in the cores of the streamwise vortices decreased the coupling between the streamwise and cross-stream velocity fluctuations. The effects of cavitation on vortex dynamics in a two- dimensional submerged planar laminar forced jet were studied 1 Ph.D., currently Postdoctoral Researcher at The University of Iowa 2 Doctoral student 3 Professor, Member ASME, corresponding author, E-mail: [email protected] Contributed by the Fluids Engineering Division for publication in the JOURNAL OF FLUIDS ENGINEERING. Manuscript received by the Fluids Engineering Divi- sion May 2, 2003; final manuscript received April 7, 2005. Associate Editor: Steven Ceccio. 714 / Vol. 127, JULY 2005 Copyright © 2005 by ASME Transactions of the ASME
Transcript of Numerical Simulation of Vortex Cavitation in a Three ... · Numerical Simulation of Vortex...
Tao Xing1
Zhenyin Li2
Steven H. Frankel3
School of Mechanical Engineering, PurdueUniversity, West Lafayette, IN 47907
Numerical Simulation of VortexCavitation in a Three-Dimensional SubmergedTransitional JetVortex cavitation in a submerged transitional jet is studied with unsteady three-dimensional direct numerical simulations. A locally homogeneous cavitation model thataccounts for non-linear bubble dynamics and bubble/bubble interactions within sphericalbubble clusters is employed. The velocity, vorticity, and pressure fields are compared forboth cavitating and noncavitating jets. It is found that cavitation occurs in the cores ofthe primary vortical structures, distorting and breaking up the vortex ring into severalsections. The velocity and transverse vorticity in the cavitating regions are intensified dueto vapor formation, while the streamwise vorticity is weakened. An analysis of the vor-ticity transport equation reveals the influence of cavitation on the relative importance ofthe vortex stretching, baroclinic torque, and dilatation terms. Statistical analysis showsthat cavitation suppresses jet growth and decreases velocity fluctuations within the va-porous regions of the jet. �DOI: 10.1115/1.1976742�
1 IntroductionCavitation is a dynamic process involving the growth and col-
lapse of gas cavities in liquids. The bubbles usually form andgrow in regions of low pressure and then subsequently collapsewhen they are convected to regions of high pressure. If the bubblecollapse occurs near a solid wall, asymmetries can result in thegeneration of extremely high pressure jets, which can cause con-siderable material damage or erosion. This problem is particularlyimportant in hydraulic applications involving fluid machinery. Ad-ditionally, the alternating growth and collapse of bubbles associ-ated with cavitation can result in high-frequency pressure fluctua-tions, the generation of excessive noise, and vibration. The abilityto understand and predict cavitation flow physics is important influid engineering.
It is well known that there is a strong link between cavitationinception and turbulent flow structures �1�. Evidence for this linkexists in both wall-bounded flows, as well as free-shear flows �2�.Billard et al. �3� presented further experimental evidence for thiseffect where they used a vortex �turbulence� generator upstream ofa venturi to produce preturbulence and observed a delay in cavi-tation inception and a reduction in noise. This behavior was at-tributed to the generation of small-amplitude, high-frequencypressure fluctuations affecting bubble behavior, in particular themorphology of the cavities. In another study, Baur and Ngeter �4�studied the three-dimensional features of cavitation structures in aturbulent shear layer. They considered a channel flow with a rect-angular sill mounted upstream on the bottom wall of the channel.This produced separated flow and a turbulent shear layer down-stream in a similar manner to the turbulence generator used byBillard et al. �3�. The shear layer produced a region of high tur-bulence and horseshoe-shaped cavitation tubes that they associ-ated with the bursting process in wall-bounded channel flows.
1Ph.D., currently Postdoctoral Researcher at The University of Iowa2Doctoral student3Professor, Member ASME, corresponding author, E-mail:
[email protected] by the Fluids Engineering Division for publication in the JOURNAL
OF FLUIDS ENGINEERING. Manuscript received by the Fluids Engineering Divi-sion May 2, 2003; final manuscript received April 7, 2005. Associate Editor: Steven
Ceccio.714 / Vol. 127, JULY 2005 Copyright © 20
For a given flow, the location of cavitation inception can bespecified in different ways. In wall-bounded flows, such as Bil-lard’s studies on venturi, minimum pressure occurs at or close to asolid surface, according to the maximum-modulus theorem. How-ever, the most common exception to this rule is in vortex cavita-tion, where the unsteady effects and/or viscous effects associatedwith vortex shedding or turbulence cause deviation from themaximum-modulus theorem �5�.
In vortex cavitation, often associated with separated flows,cavitation occurs in the cores of eddies formed in the shear layeremanating from the separation point �2�. This is due to these beingregions of minimum pressure. Hence, flow separation and transi-tion to turbulence can have a considerable effect on cavitation.Even without flow separation, intense pressure fluctuations due toturbulence can influence the position of cavitation. In both cases,the temporal pressure fluctuations dictate the cavitation process.
Gopalan et al. �6� found that the location and degree of cavita-tion was dependent on the nature of the vortical structures pro-duced in a submerged water jet. If the jet was deliberately tripped,cavitation occurred in the cores of the vortex rings which formeddownstream �x /D=2� of the nozzle. If the jet was not tripped,cavitation occurred in the cores of comparatively strong stream-wise vortex tubes just downstream �x /D=0.55� of the nozzle. Asobserved by Arndt �7�, tripping the boundary layer of the jet ap-parently suppresses the secondary vortex cavitation. This mecha-nism of cavitation control is very similar to the one studied byBillard et al. �3�. Sridhar and Katz et al. �8� have also shown thatthe presence of a few microscopic bubbles at very low void frac-tion can significantly affect the vortex dynamics within a waterjet.
Recent PIV �particle imaging velocimetry� measurements in acavitating turbulent shear layer reported by Iyer and Ceccio �9�did not show a significant effect of cavitation on the vortical struc-ture of the jet but did show an increase in streamwise velocityfluctuations and a decrease in the maximum cross-stream fluctua-tions and Reynolds stresses due to cavitation. They speculated thatthe presence of cavitation in the cores of the streamwise vorticesdecreased the coupling between the streamwise and cross-streamvelocity fluctuations.
The effects of cavitation on vortex dynamics in a two-
dimensional submerged planar laminar forced jet were studied05 by ASME Transactions of the ASME
numerically by Xing and Frankel �10�. A locally homogeneouscavitation model that accounts for nonlinear bubble dynamics andbubble/bubble interactions within spherical bubble clusters wasemployed �11�. The effects of varying key flow and cavitationmodel parameters on flow-cavitation interactions were investi-gated. The parameters varied included the cavitation number �ef-fectively the vapor pressure�, the bubble number density, thebubble-cluster radius, and the Reynolds number �limited by thetwo-dimensional assumption�. The results showed cavitation oc-curring in the cores of primary vortical structures when the localpressure fell below the vapor pressure. Low levels of void fractioncaused significant vortex distortion, with the details dependingupon the model parameters. For higher Reynolds numbers andsmall values of bubble cluster radius, cavitation inhibited vortexpairing and resulted in vortex splitting and intensification. All ofthese observations were in good qualitative agreement with previ-ous experimental and numerical studies. The vorticity transportequation was used to examine the mechanisms behind the effectsof cavitation on vortex structures and it was found that bothcavitation-induced dilatation and baroclinic torque terms played arole in vorticity generation. More details can be found in the re-cent paper by Xing and Frankel �10�. Three-dimensional simula-tions are required to simulate more complex cavitating flows.
In the recent review article by Arndt �7�, in reference to severalof the above studies, as well as others, it is stated that, “There isalso mounting evidence that vortex cavitation is a dominant factorin the inception process in a broad range of turbulent flows.” Healso states that, “while a vortex model for cavitation in jets doesnot exist, the mechanism of inception appears to be related to theprocess of vortex pairing.” Finally, he states that, “a new andimportant issue is that cavitation is not only induced in vorticalstructures but is also a mechanism for vorticity �turbulence� gen-eration.” Our previous two-dimensional results �10� seem to bearthis out but more work is needed before the ramifications of thisbecome apparent.
The objective of the present study is to conduct unsteady three-dimensional direct numerical simulations of a round transitionaljet and examine the effect of vapor formation due to cavitation onthe vortical structure of the jet. Our simulations predict cavitationoccurring in the core of the primary azimuthal vortical structures.The presence of low levels of vapor suppressed jet growth anddecreased velocity fluctuations in the vicinity of and downstreamof the cavitation regions of the jet. The rest of the paper presentsthe mathematical model, some details of the numerical methods, aproblem description, results, and finally some conclusions.
2 Mathematical ModelCavitating flows feature both incompressible and compressible
flow behaviors due to the presence of pure liquid in noncavitatingregion and mixed liquid and vapor in the cavitating regions. Thismakes the modeling and numerical methods challenging, espe-cially when a pure compressible formulation is applied. Kubota�11� avoids this problem by using the homogeneous incompress-ible formulation with variable density. This model was employedin this study for its significant improvement in the following threeways: nonlinear interaction between viscous flow and cavitationbubbles, consideration of the effects of bubble nuclei on cavitationinception and development, and ability to express unsteady char-acteristics of vortex cavitation. However, it should also be notedthat surface tension, thermal, and viscous effects have been ne-glected in the model and the constant bubble number density perunit volume has restricted this model to be only valid for low voidfraction flows.
The form of the Navier-Stokes equations, the local homoge-neous model �LHM� equation, and the definition of the fluid prop-erties, such as mixture density and viscosity, are identical to thoseapplied in Kubota’s study �11� and were presented more recentlyin Ref. �10�. The key equations are repeated here for complete-
ness.Journal of Fluids Engineering
The following form of the Navier-Stokes equations was consid-ered in this study:
��
�t+ � · ��V� = 0, �1�
���V��t
+ � · ��VV� = − � p + 2 � · ��S� −2
3� �� � · V� ,
�2�
where S is the strain-rate tensor. The density of the liquid-vaporbubble mixture is defined as
� = �1 − f����, �3�
where �� is the liquid density �the vapor density is assumed to benegligible compared to the liquid density� and f�, the local voidfraction, is defined as
f� = n4
3�R3 �4�
with 0� f��1, n is the bubble number density, and R is thebubble radius. The mixture viscosity is evaluated using
� = �1 − f���� + f���, �5�
where �� is the liquid viscosity and �� is the vapor viscosity, andboth are assumed constant.
The bubble number density is assumed constant in both spaceand time, which limits the accuracy of the model for large voidfractions by neglecting bubble coalescence and splitting. The Ray-leigh equation governs the dynamic behavior of a single bubble ina quiescent medium �5�. Because grid resolution in most numeri-cal simulations is insufficient to resolve individual bubbles,Kubota et al. modified the Rayleigh equation to account for inter-actions between bubbles �of the same radius, R�, which may occurat scales below the grid scale. The final equation, referred to as thelocal homogeneous model �LHM� equation is given as:
�1 + 2���r�2nR�RD2R
Dt2 + �3
2+ 4���r�2nR��DR
Dt�2
+ 2���r�2Dn
DtR2DR
Dt=
p� − p
��
, �6�
where D /Dt is the material derivative, �r is the bubble clusterradius �distance over which bubbles may interact with each otherin a given cluster�, and p� is the vapor pressure of the liquid for agiven temperature. Notice as the bubble cluster radius goes tozero, the Rayleigh equation for a single bubble is recovered andbubble-bubble interactions are no longer included in the equation.Recently, Delale et al. �12� have revised Kubota’s model and haveaddressed two important effects related to bubble/bubble interac-tions and viscous damping. In Kubota’s original model, the bubblecluster radius is chosen to be the grid size. In Delale et al., theyrelated the bubble cluster radius to the radius of the bubbleswithin the cluster itself �which is assumed the same for all bubbleswithin the cluster, but may grow or decay depending upon thelocal pressure� as follows:
�r = �R , �7�
where �=constant�1 �if �=1 then the classical Rayleigh equa-tion is recovered�. This model assumes that local number ofbubbles within a cluster is proportional to the local volume of abubble, and hence the local void fraction.
To couple the LHM equation for the bubble radius to theNavier-Stokes equations, Kubota et al. derived a quasi-Poissonequation for the pressure which is given below �for more details
see Ref. �11��JULY 2005, Vol. 127 / 715
�2p + �p� = ��V,V,�R
�t,R� + ���V,V� �8�
with
�p� = �L4n�R2 p� − p
�1 + 2���r�2nR�R�L�9�
and
��V,V,�R
�t,R� = − �L4n�R�R���V,V,
�R
�t,R� + 2� �R
�t�2�
�10�with
���V,V,�R
�t,R� =
�2R
�t2 − �p� �11�
and
�p� =p� − p
�1 + 2���r�2nR�R�L�12�
Maximum and minimum void fractions were specified to avoidpure liquid and vapor states with ==0 and the bubble radiusfixed. In the present implementation, a hyperbolic tangent func-tion was used to ensure a smooth variation between these twoextreme states. All quantities and equations were nondimension-alized by the liquid density and viscosity, the jet nozzle diameter,D, jet inlet velocity, U0, and dynamic pressure, ��U0
2. In the re-sults, all non-dimensional quantities will be indicated by an aster-isk, e.g., t* , x* , u*, etc..
The numerical methods employed in this study were modifiedfrom our previous work �10� with the main difference here beingrelated to how the quasi-Poisson equation for the pressure issolved in three dimensions. The details are described in the nextsection.
3 Numerical MethodsA well known difficulty in obtaining time-accurate solutions for
an incompressible flow is the lack of a time derivative term in thecontinuity equation. Therefore, satisfying mass conservation is akey issue in solving the incompressible Navier-Stokes equationsand a variety of different approaches have been pursued to addressthis issue. These approaches include the pressure-correction tech-nique based on the SIMPLE algorithm, as well as approacheswhich directly solve a Poisson equation for the pressure via itera-tive methods. Many previous studies have employed a staggered
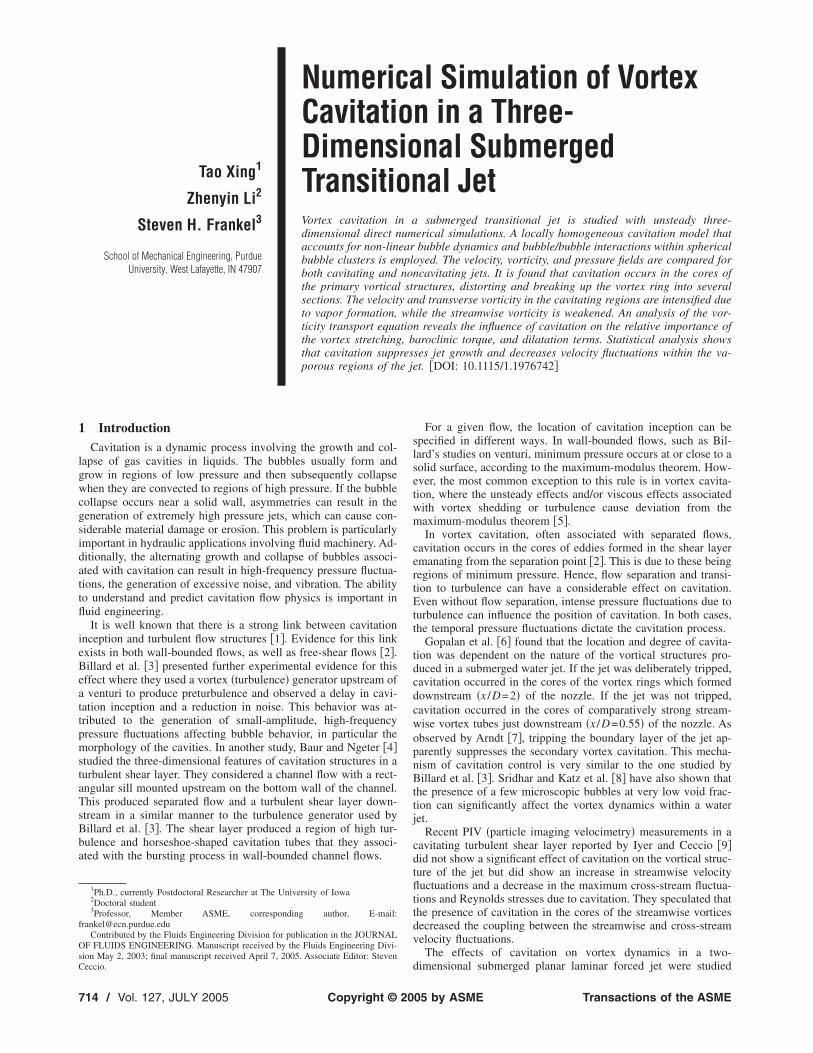
Fig. 1 Computational domain showing boundary surfaces andinflow plane
grid where velocity and pressure nodes are not collocated. This
716 / Vol. 127, JULY 2005
avoids the grid-scale �odd-even� oscillations in the pressure fieldassociated with pressure-velocity decoupling often encounteredwhen using non-staggered grids. This is a popular method, espe-cially when combined with the SIMPLE algorithm, because of itsstrongly elliptic nature which does not allow energy accumulationat the grid-scale wave number preventing grid-scale pressure os-cillations. However, there are difficulties in discretizing non-linearterms on non-uniform staggered grids and the amount of program-ming and computational cost are more than with a non-staggeredgrid.
The approach taken here employs a non-staggered grid andsolves the pressure Poisson equation using a compact fourth-orderaccurate scheme which tends to suppress the spatial odd-even de-coupling of the pressure-velocity fields �13�.
3.1 Fourth-Order Pressure-Correction Approach. Throughthe use of the fractional-step method formalism �first-order accu-rate in time �14��, Dormy �13� developed a new pressure correc-tion approach. Dormy derived this new scheme for totally incom-
Table 1 Description of the flow and cavitation parameters forthe simulation cases
Case � p� �r n Re R0
1 1.80 0.10 1.0 106 1500 1.33�10−3
2 0.60 0.70 1.0 106 1500 1.33�10−3
3 0.50 0.75 1.0 106 1500 1.33�10−3
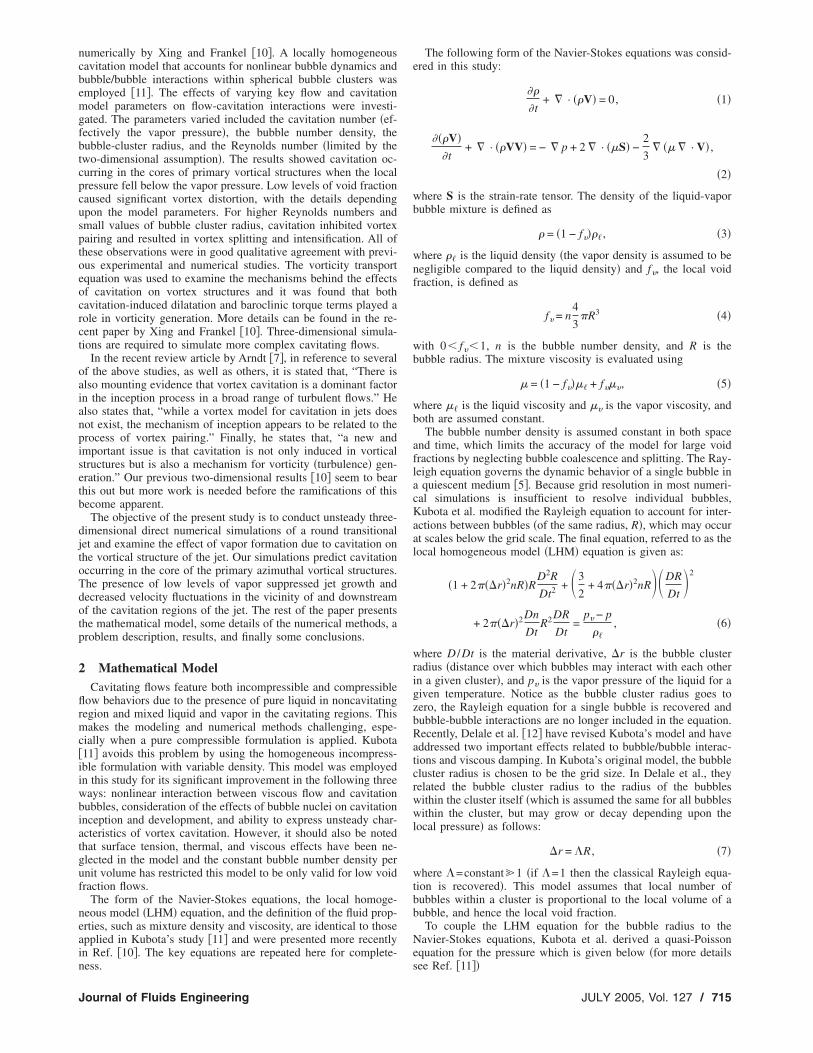
Fig. 2 Instantaneous isosurface of Q-criterion magnitude att*=22. The isolevel shown is 3.2. „a… �=1.8, „b… �=0.6, „c… �
=0.5.Transactions of the ASME
pressible flows. Here we attempt to apply Dormy’s methodologyfor the quasi-Poisson equation featured in the cavitation model ofKubota et al. �11�. Additional terms including the density and itstime derivative are associated with cavitation effects, such asbubble growth and collapse, on the pressure field. By droppingthese terms, the governing equations revert back to the form for atotally incompressible flow.
Consider a velocity field ��V�* which does not satisfy the con-tinuity equation �for instance, obtained by time advancing theNavier-Stokes equations without including the pressure gradient�.The objective is to project this onto a divergence-free field bysubtracting the gradient of a pressure-like variable � such that
�V = ��V�* − �h� , �13�
where V is the velocity field which satisfies the continuity equa-tion. Taking the divergence of this equation yields
�2h� = �h · ��V�*, �14�
where �2h is a second-order centered approximation of the La-placian skipping the neighboring points. The sparse nature of thisoperator leads to pressure oscillations. The remedy proposed byDormy is to introduce a fourth-order “compact equivalent” to theconservative discrete pressure equation.
The original non-compact formulation of the three-dimensional
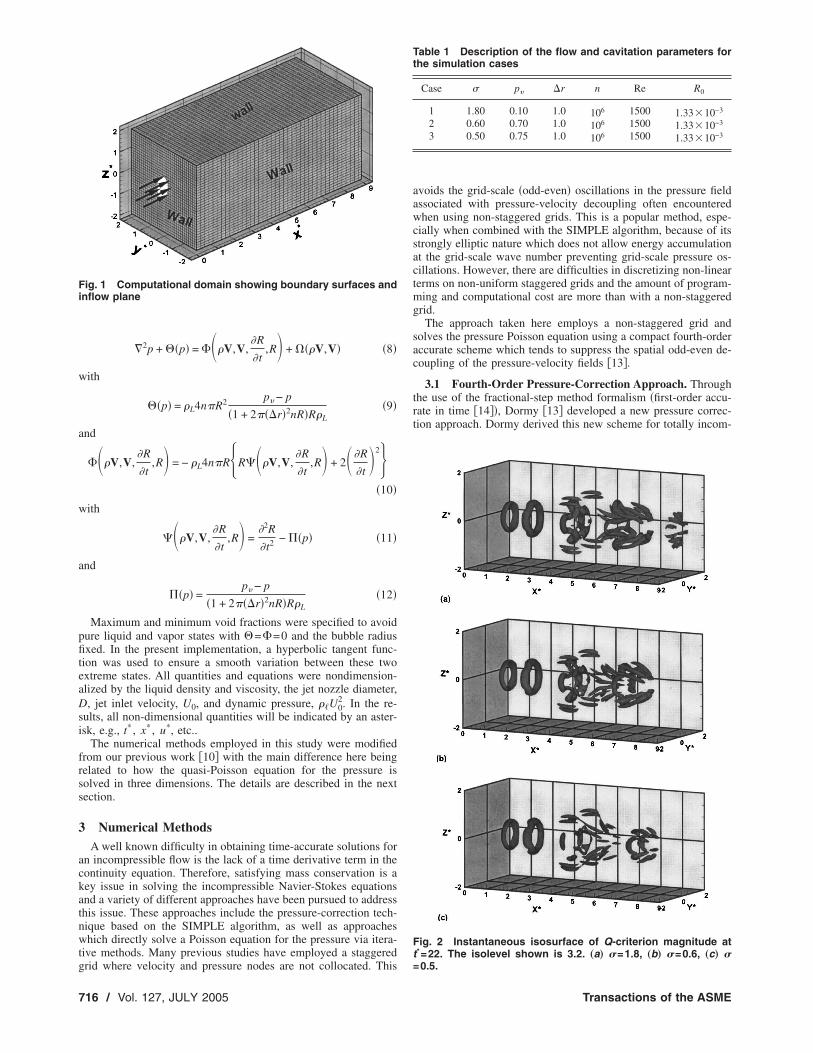
Fig. 3 Instantaneous isosurface of Q-criterion magnitude att*=26. The isolevel shown is 3.2. „a… �=1.8, „b… �=0.6, „c… �=0.5.
Poisson equation can be written as
Journal of Fluids Engineering
�2�
�x2 +hx
2
3
�4�
�x4 + O�hx4� +
�2�
�y2 +hy
2
3
�4�
�y4 + O�hy4� +
�2�
�z2 +hz
2
3
�4�
dz4
+ O�hz4� = �h · ��V�* +
��
�t. �15�
To solve this equation with fourth-order accuracy, Dormy pro-posed two-step approach that allows fourth-order accuracy at
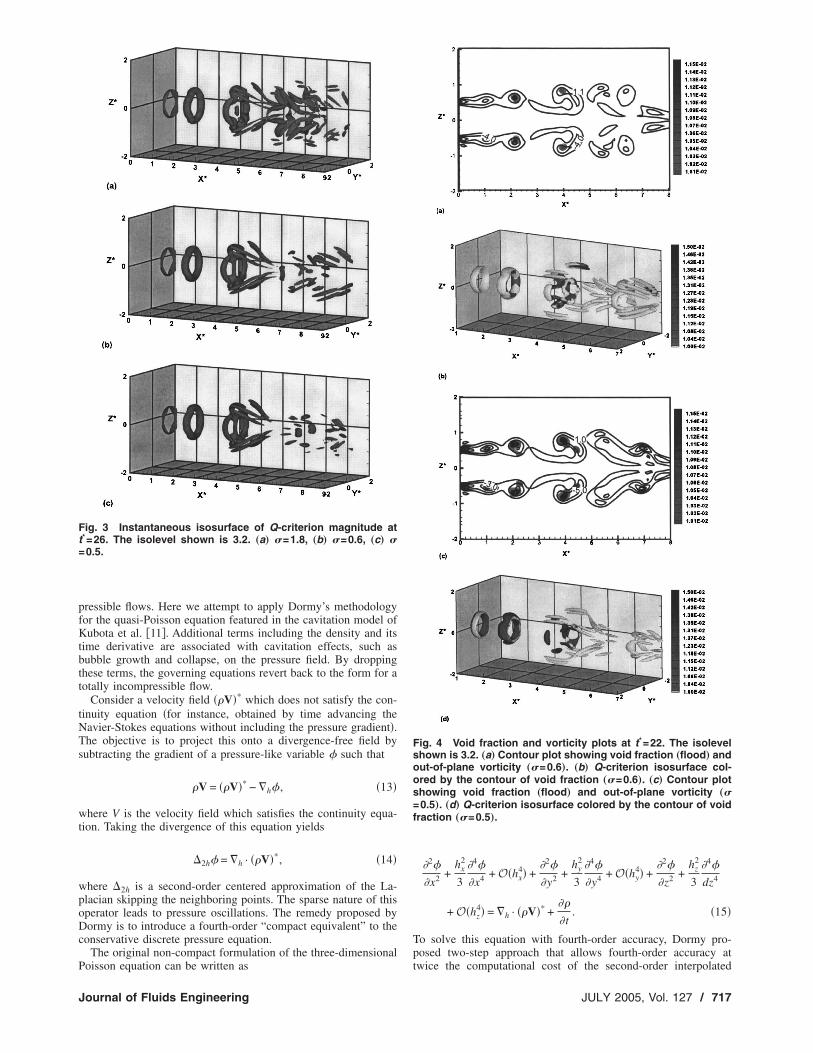
Fig. 4 Void fraction and vorticity plots at t*=22. The isolevelshown is 3.2. „a… Contour plot showing void fraction „flood… andout-of-plane vorticity „�=0.6…. „b… Q-criterion isosurface col-ored by the contour of void fraction „�=0.6…. „c… Contour plotshowing void fraction „flood… and out-of-plane vorticity „�=0.5…. „d… Q-criterion isosurface colored by the contour of voidfraction „�=0.5….
twice the computational cost of the second-order interpolated
JULY 2005, Vol. 127 / 717
scheme. The above equation can be approximated with four-orderaccuracy using a two-step method. The first step is a second-orderapproximation to the second-order truncation terms written as:
�h� = �hx2 �4
�x4 + hy2 �4
�y4 + hz2 �4
�z4��h · ��V�* +��
�t . �16�
The fourth-order central differences scheme was applied to calcu-late the right hand side of the above equation as shown here forsome function of f
fxxxxi=
f i−2 − 4f i−1 + 6f i − 4f i+1 + f i+2
�x2 . �17�
At the boundaries, a third-order extrapolation was used
fxxxxi=
6f i+1 + f i−1 − 4f i+2 + f i+3 − 4f i
�x2 , �18�
fxxxxi=
6f i−1 + f i+1 − 4f i−2 + f i−3 − 4f i
�x2 . �19�
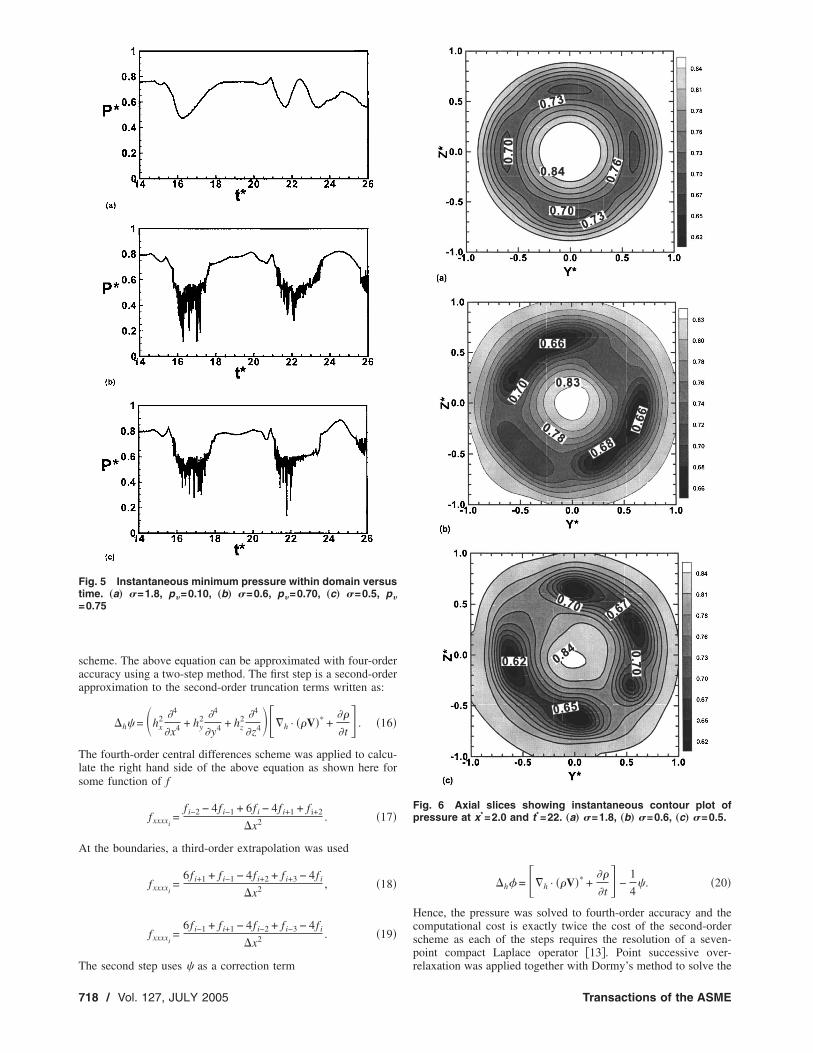
Fig. 5 Instantaneous minimum pressure within domain versustime. „a… �=1.8, p�=0.10, „b… �=0.6, p�=0.70, „c… �=0.5, p�
=0.75
The second step uses � as a correction term
718 / Vol. 127, JULY 2005
�h� = �h · ��V�* +��
�t −
1
4� . �20�
Hence, the pressure was solved to fourth-order accuracy and thecomputational cost is exactly twice the cost of the second-orderscheme as each of the steps requires the resolution of a seven-point compact Laplace operator �13�. Point successive over-
Fig. 6 Axial slices showing instantaneous contour plot ofpressure at x*=2.0 and t*=22. „a… �=1.8, „b… �=0.6, „c… �=0.5.
relaxation was applied together with Dormy’s method to solve the
Transactions of the ASME
three-dimensional Poisson equation. The convergence criterion se-lected was
max���P�� � 1 . D − 5, �21�
where �P is the residual of pressure in the iterations. A strictercriterion was tried and no significant differences between the re-sults were observed. It was also found that if the time step wassufficiently small, the Poisson equation converged quickly at each
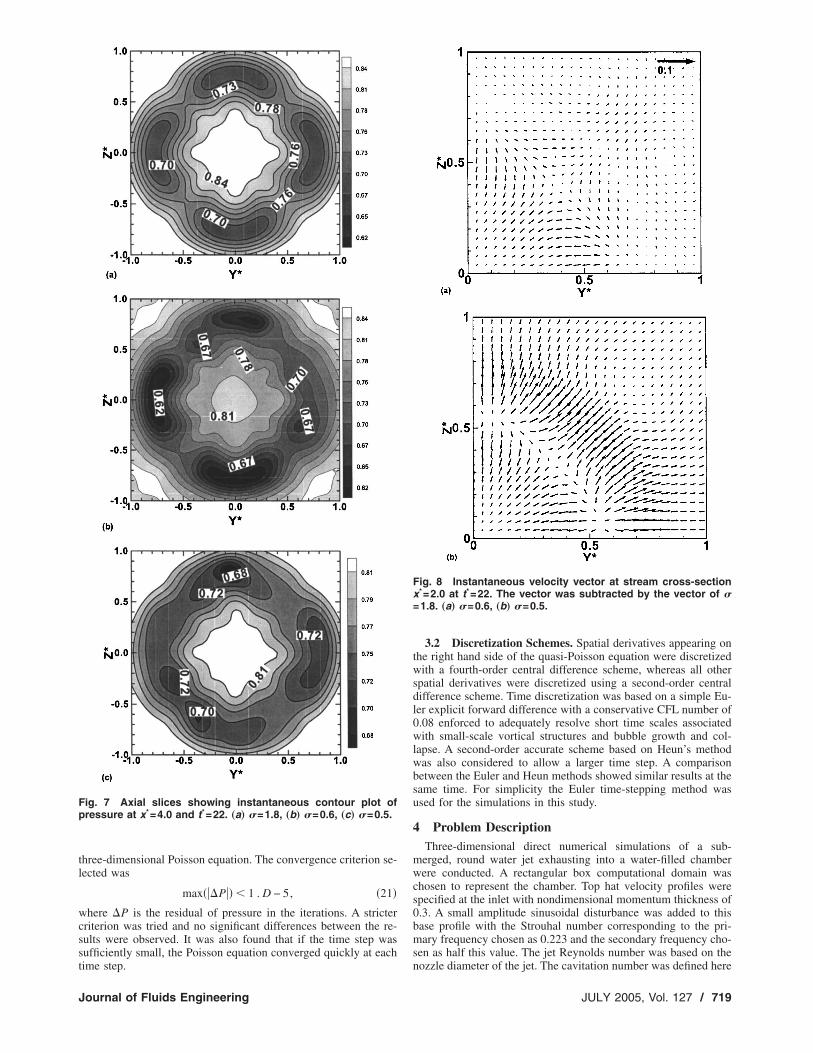
Fig. 7 Axial slices showing instantaneous contour plot ofpressure at x*=4.0 and t*=22. „a… �=1.8, „b… �=0.6, „c… �=0.5.
time step.
Journal of Fluids Engineering
3.2 Discretization Schemes. Spatial derivatives appearing onthe right hand side of the quasi-Poisson equation were discretizedwith a fourth-order central difference scheme, whereas all otherspatial derivatives were discretized using a second-order centraldifference scheme. Time discretization was based on a simple Eu-ler explicit forward difference with a conservative CFL number of0.08 enforced to adequately resolve short time scales associatedwith small-scale vortical structures and bubble growth and col-lapse. A second-order accurate scheme based on Heun’s methodwas also considered to allow a larger time step. A comparisonbetween the Euler and Heun methods showed similar results at thesame time. For simplicity the Euler time-stepping method wasused for the simulations in this study.
4 Problem DescriptionThree-dimensional direct numerical simulations of a sub-
merged, round water jet exhausting into a water-filled chamberwere conducted. A rectangular box computational domain waschosen to represent the chamber. Top hat velocity profiles werespecified at the inlet with nondimensional momentum thickness of0.3. A small amplitude sinusoidal disturbance was added to thisbase profile with the Strouhal number corresponding to the pri-mary frequency chosen as 0.223 and the secondary frequency cho-sen as half this value. The jet Reynolds number was based on the
Fig. 8 Instantaneous velocity vector at stream cross-sectionx*=2.0 at t*=22. The vector was subtracted by the vector of �=1.8. „a… �=0.6, „b… �=0.5.
nozzle diameter of the jet. The cavitation number was defined here
JULY 2005, Vol. 127 / 719
in terms of dimensional quantities as �= �p�− p�� /0.5��U02, where
p� is the chamber pressure. The cavitation number was varied bychanging the vapor pressure. The Reynolds number was definedas ��hU0 /�� and serves to determine the liquid viscosity. Theratio of the vapor to liquid viscosity was 0.00912 followingKubota et al.
A sketch of the computational domain is given in Fig. 1. Thecomputational domain extended from −2�y*�2 in the spanwisedirection, −2�z*�2 in the transverse direction, and 0�x*�8.9in the streamwise direction. The domain was discretized using auniform Cartesian mesh with 120�100�100 points. The use of auniform mesh avoids problems related to transforming the quasi-Poisson equation, involving computer memory and numerical ac-curacy, when using a non-uniform mesh.
No-slip velocity boundary conditions were enforced on thesides of the box, and the inflow plane except for the nozzle open-ing. Fourth-order extrapolation was used for the pressure on thewalls and outflow boundary
pimax,j = �104pimax−1,j − 114pimax−2,j + 56pimax−3,j − 11pimax−4,j�/35.
�22�The convective boundary condition was used for velocity at the
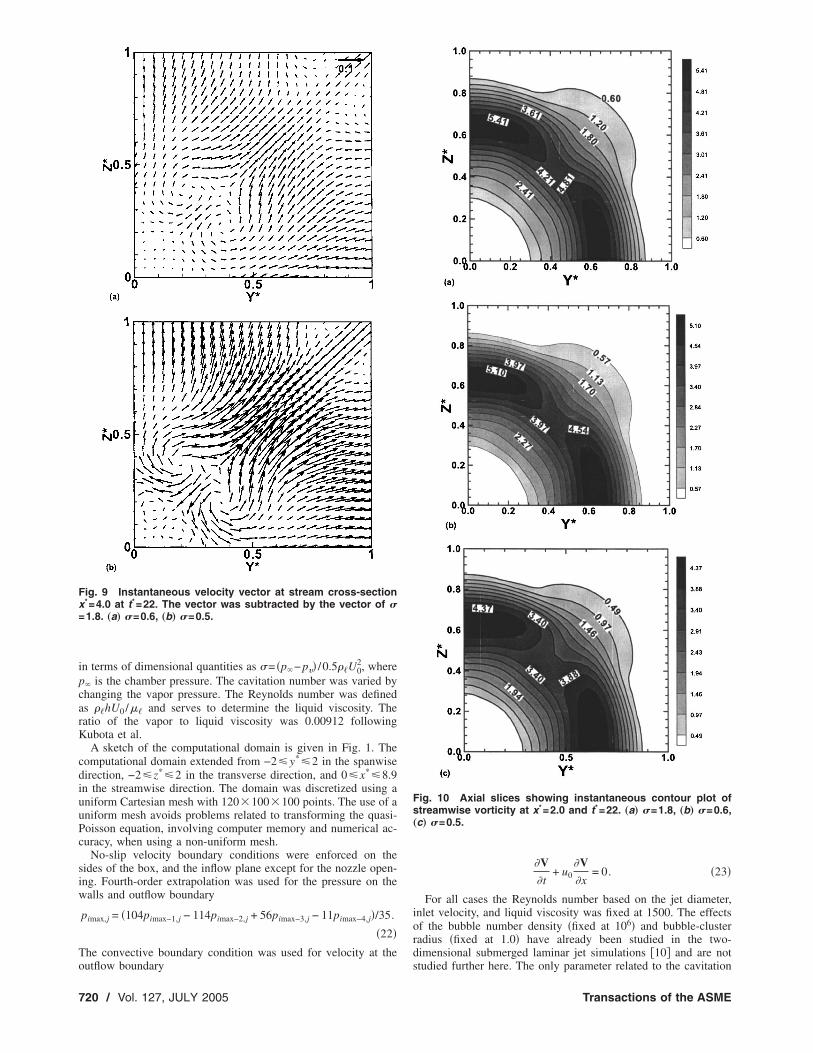
Fig. 9 Instantaneous velocity vector at stream cross-sectionx*=4.0 at t*=22. The vector was subtracted by the vector of �=1.8. „a… �=0.6, „b… �=0.5.
outflow boundary
720 / Vol. 127, JULY 2005
�V
�t+ u0
�V
�x= 0. �23�
For all cases the Reynolds number based on the jet diameter,inlet velocity, and liquid viscosity was fixed at 1500. The effectsof the bubble number density �fixed at 106� and bubble-clusterradius �fixed at 1.0� have already been studied in the two-dimensional submerged laminar jet simulations �10� and are not
Fig. 10 Axial slices showing instantaneous contour plot ofstreamwise vorticity at x*=2.0 and t*=22. „a… �=1.8, „b… �=0.6,„c… �=0.5.
studied further here. The only parameter related to the cavitation
Transactions of the ASME
model varied here is the cavitation number � �or equivalently thevapor pressure, p��. Three values of the cavitation number will beused to consider jets under non-cavitating ��=1.8, p�=0.1� andcavitating conditions ��=0.6, p�=0.7 and �=0.5, p�=0.75�. Allcases are summarized in Table 1 and were tested on IBMRISC/6000 SP POWER3+ thin nodes with 375 MHz CPU and 4GB memory.
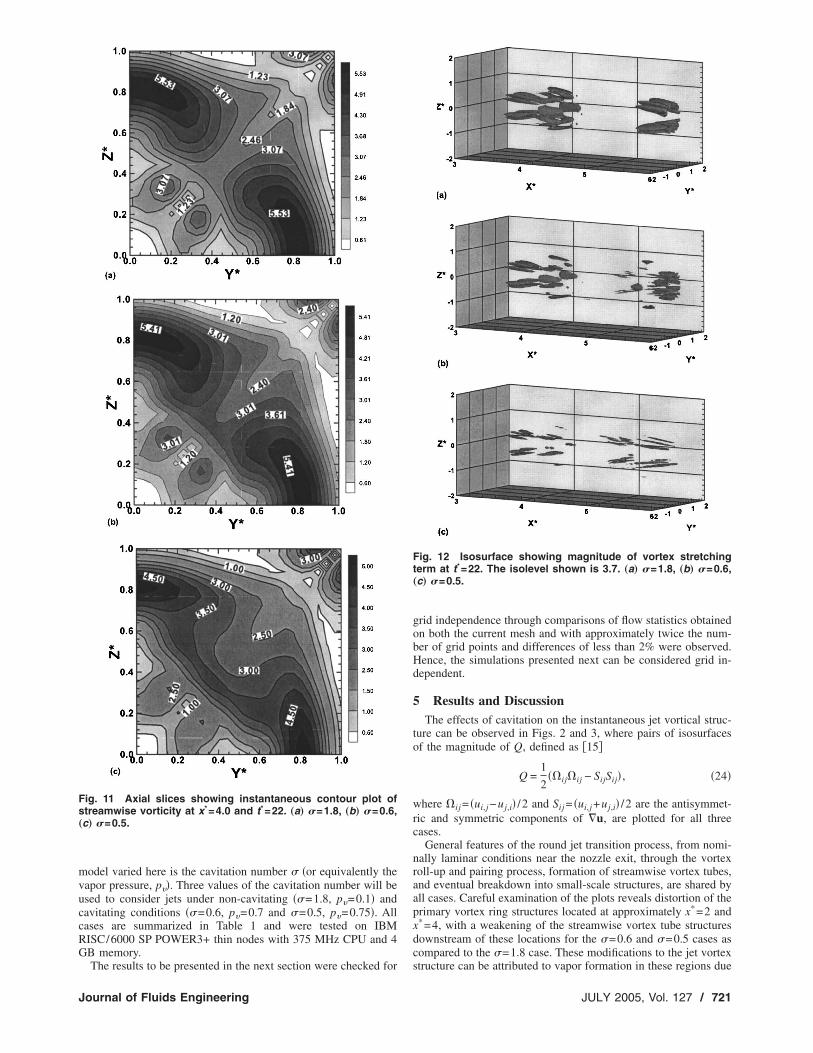
Fig. 11 Axial slices showing instantaneous contour plot ofstreamwise vorticity at x*=4.0 and t*=22. „a… �=1.8, „b… �=0.6,„c… �=0.5.
The results to be presented in the next section were checked for
Journal of Fluids Engineering
grid independence through comparisons of flow statistics obtainedon both the current mesh and with approximately twice the num-ber of grid points and differences of less than 2% were observed.Hence, the simulations presented next can be considered grid in-dependent.
5 Results and DiscussionThe effects of cavitation on the instantaneous jet vortical struc-
ture can be observed in Figs. 2 and 3, where pairs of isosurfacesof the magnitude of Q, defined as �15�
Q =1
2��ij�ij − SijSij� , �24�
where �ij = �ui,j −uj,i� /2 and Sij = �ui,j +uj,i� /2 are the antisymmet-ric and symmetric components of �u, are plotted for all threecases.
General features of the round jet transition process, from nomi-nally laminar conditions near the nozzle exit, through the vortexroll-up and pairing process, formation of streamwise vortex tubes,and eventual breakdown into small-scale structures, are shared byall cases. Careful examination of the plots reveals distortion of theprimary vortex ring structures located at approximately x*=2 andx*=4, with a weakening of the streamwise vortex tube structuresdownstream of these locations for the �=0.6 and �=0.5 cases ascompared to the �=1.8 case. These modifications to the jet vortex
Fig. 12 Isosurface showing magnitude of vortex stretchingterm at t*=22. The isolevel shown is 3.7. „a… �=1.8, „b… �=0.6,„c… �=0.5.
structure can be attributed to vapor formation in these regions due
JULY 2005, Vol. 127 / 721
to cavitation inception, as evidenced by superimposing instanta-neous void fraction and vorticity as shown in Fig. 4. The forma-tion of vapor in the cores of the primary vortex rings is clearlyvisible in Figs. 4�a� and 4�b�. Evidence of vapor formation down-stream of the primary vortex rings, in the vicinity of streamwisevortex tubes, can be seen in Fig. 4�c�, but not in Fig. 4�d� at thesimulation time shown.
Further evidence of cavitation inception and the unsteadybubble dynamics that result can be seen in Fig. 5, which plots atime history of the minimum pressure within the computationaldomain. This figure clearly shows that the local fluid pressuredrops below the specified vapor pressure for the two cavitatingcases, p�=0.7 and 0.75, at several times during the time spanshown, including the times corresponding to the instantaneousresults shown previously. The high-frequency fluctuations for the
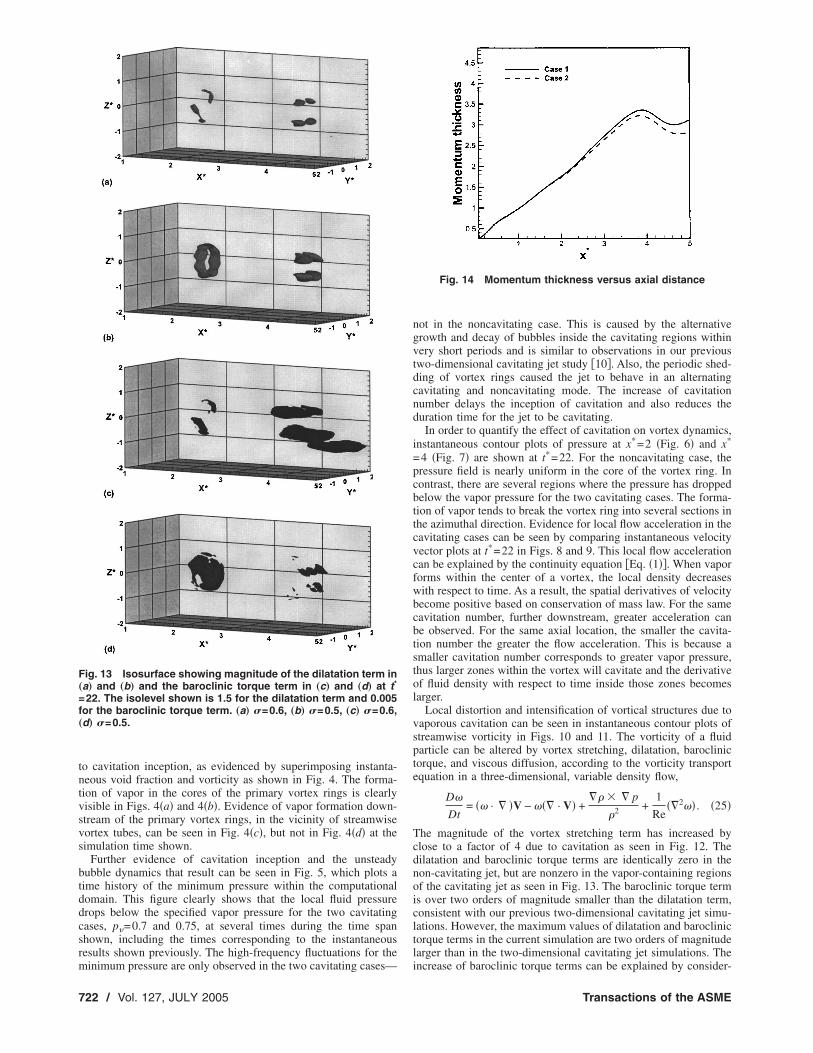
Fig. 13 Isosurface showing magnitude of the dilatation term in„a… and „b… and the baroclinic torque term in „c… and „d… at t*
=22. The isolevel shown is 1.5 for the dilatation term and 0.005for the baroclinic torque term. „a… �=0.6, „b… �=0.5, „c… �=0.6,„d… �=0.5.
minimum pressure are only observed in the two cavitating cases—
722 / Vol. 127, JULY 2005
not in the noncavitating case. This is caused by the alternativegrowth and decay of bubbles inside the cavitating regions withinvery short periods and is similar to observations in our previoustwo-dimensional cavitating jet study �10�. Also, the periodic shed-ding of vortex rings caused the jet to behave in an alternatingcavitating and noncavitating mode. The increase of cavitationnumber delays the inception of cavitation and also reduces theduration time for the jet to be cavitating.
In order to quantify the effect of cavitation on vortex dynamics,instantaneous contour plots of pressure at x*=2 �Fig. 6� and x*
=4 �Fig. 7� are shown at t*=22. For the noncavitating case, thepressure field is nearly uniform in the core of the vortex ring. Incontrast, there are several regions where the pressure has droppedbelow the vapor pressure for the two cavitating cases. The forma-tion of vapor tends to break the vortex ring into several sections inthe azimuthal direction. Evidence for local flow acceleration in thecavitating cases can be seen by comparing instantaneous velocityvector plots at t*=22 in Figs. 8 and 9. This local flow accelerationcan be explained by the continuity equation �Eq. �1��. When vaporforms within the center of a vortex, the local density decreaseswith respect to time. As a result, the spatial derivatives of velocitybecome positive based on conservation of mass law. For the samecavitation number, further downstream, greater acceleration canbe observed. For the same axial location, the smaller the cavita-tion number the greater the flow acceleration. This is because asmaller cavitation number corresponds to greater vapor pressure,thus larger zones within the vortex will cavitate and the derivativeof fluid density with respect to time inside those zones becomeslarger.
Local distortion and intensification of vortical structures due tovaporous cavitation can be seen in instantaneous contour plots ofstreamwise vorticity in Figs. 10 and 11. The vorticity of a fluidparticle can be altered by vortex stretching, dilatation, baroclinictorque, and viscous diffusion, according to the vorticity transportequation in a three-dimensional, variable density flow,
D�
Dt= �� · � �V − ��� · V� +
�� � � p
�2 +1
Re��2�� . �25�
The magnitude of the vortex stretching term has increased byclose to a factor of 4 due to cavitation as seen in Fig. 12. Thedilatation and baroclinic torque terms are identically zero in thenon-cavitating jet, but are nonzero in the vapor-containing regionsof the cavitating jet as seen in Fig. 13. The baroclinic torque termis over two orders of magnitude smaller than the dilatation term,consistent with our previous two-dimensional cavitating jet simu-lations. However, the maximum values of dilatation and baroclinictorque terms in the current simulation are two orders of magnitudelarger than in the two-dimensional cavitating jet simulations. The
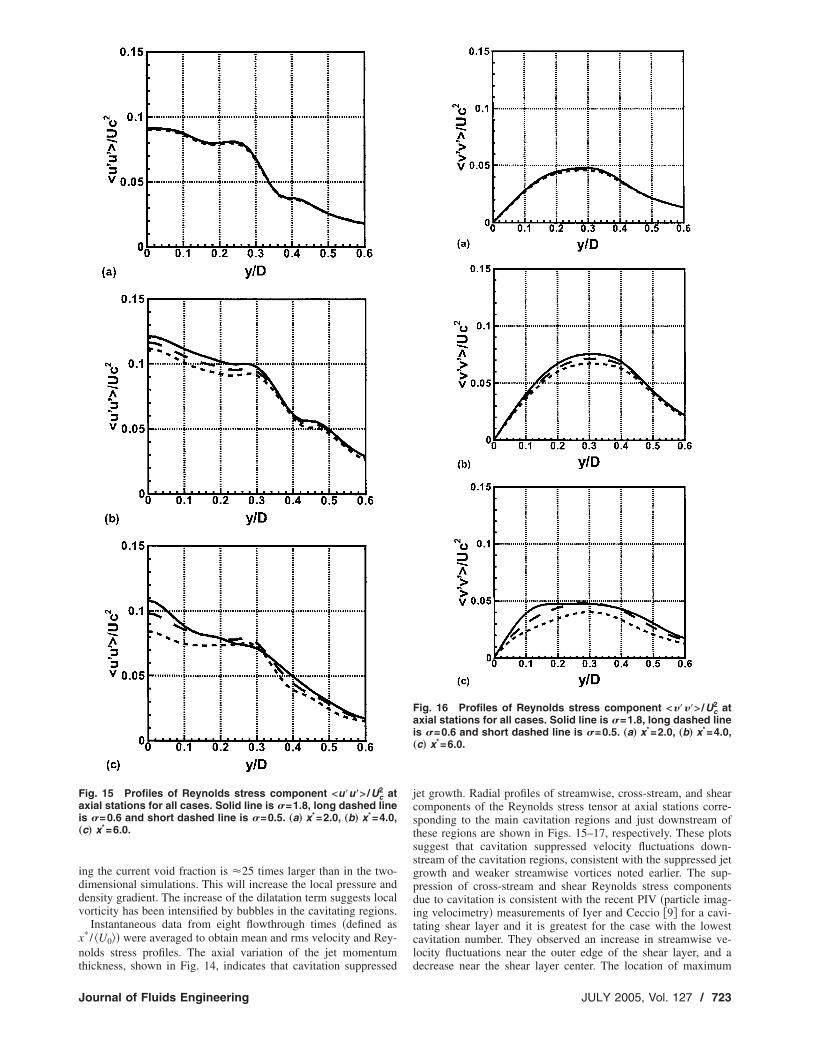
Fig. 14 Momentum thickness versus axial distance
increase of baroclinic torque terms can be explained by consider-
Transactions of the ASME
ing the current void fraction is �25 times larger than in the two-dimensional simulations. This will increase the local pressure anddensity gradient. The increase of the dilatation term suggests localvorticity has been intensified by bubbles in the cavitating regions.
Instantaneous data from eight flowthrough times �defined asx* / U0�� were averaged to obtain mean and rms velocity and Rey-nolds stress profiles. The axial variation of the jet momentum
Fig. 15 Profiles of Reynolds stress component <u�u�> /Uc2 at
axial stations for all cases. Solid line is �=1.8, long dashed lineis �=0.6 and short dashed line is �=0.5. „a… x*=2.0, „b… x*=4.0,„c… x*=6.0.
thickness, shown in Fig. 14, indicates that cavitation suppressed
Journal of Fluids Engineering
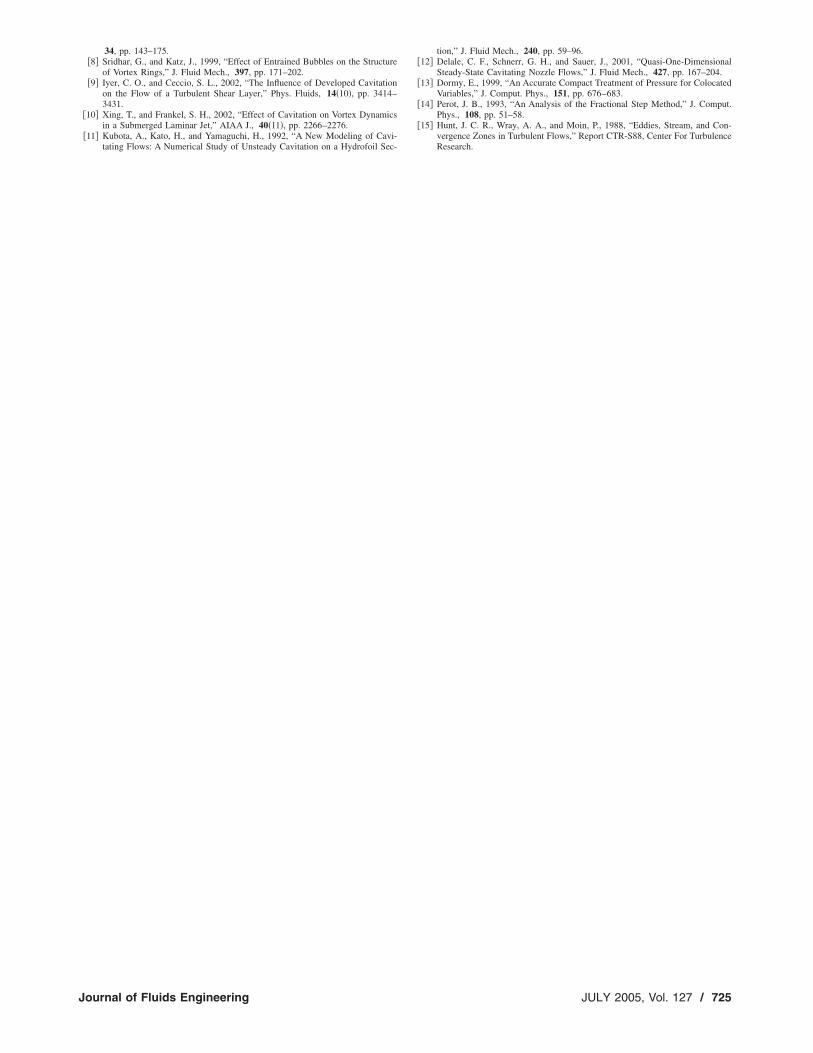
jet growth. Radial profiles of streamwise, cross-stream, and shearcomponents of the Reynolds stress tensor at axial stations corre-sponding to the main cavitation regions and just downstream ofthese regions are shown in Figs. 15–17, respectively. These plotssuggest that cavitation suppressed velocity fluctuations down-stream of the cavitation regions, consistent with the suppressed jetgrowth and weaker streamwise vortices noted earlier. The sup-pression of cross-stream and shear Reynolds stress componentsdue to cavitation is consistent with the recent PIV �particle imag-ing velocimetry� measurements of Iyer and Ceccio �9� for a cavi-tating shear layer and it is greatest for the case with the lowestcavitation number. They observed an increase in streamwise ve-locity fluctuations near the outer edge of the shear layer, and a
Fig. 16 Profiles of Reynolds stress component <����> /Uc2 at
axial stations for all cases. Solid line is �=1.8, long dashed lineis �=0.6 and short dashed line is �=0.5. „a… x*=2.0, „b… x*=4.0,„c… x*=6.0.
decrease near the shear layer center. The location of maximum
JULY 2005, Vol. 127 / 723
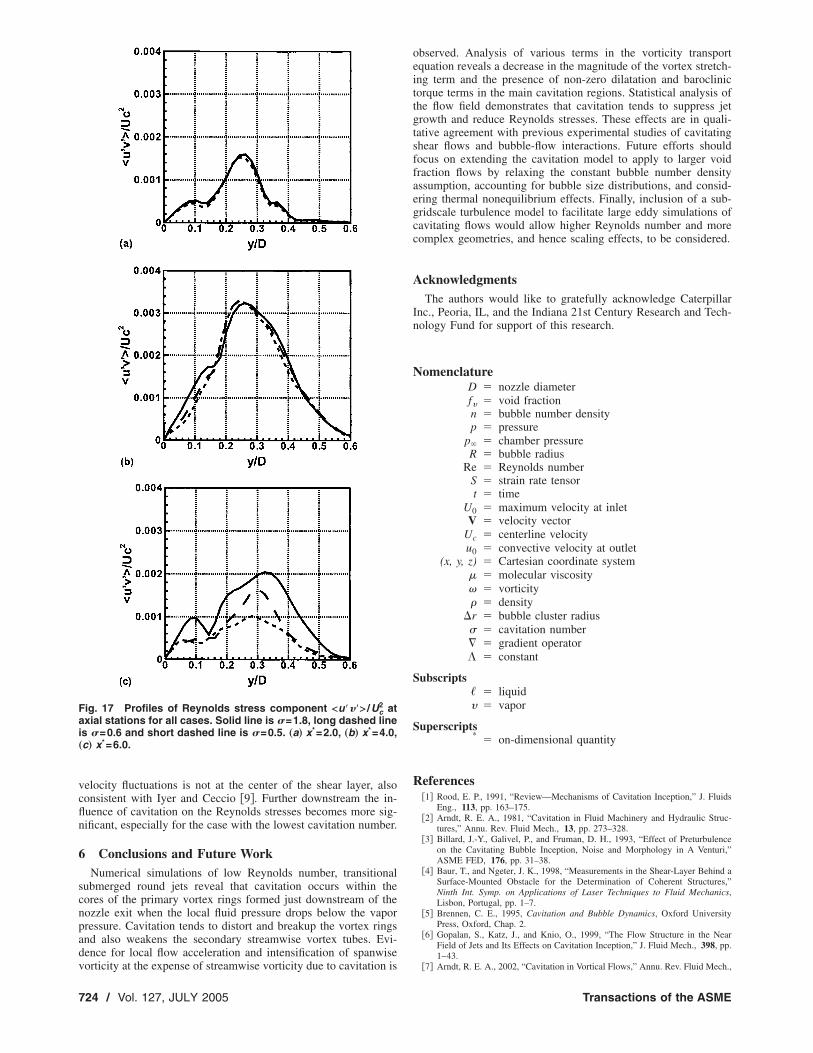
velocity fluctuations is not at the center of the shear layer, alsoconsistent with Iyer and Ceccio �9�. Further downstream the in-fluence of cavitation on the Reynolds stresses becomes more sig-nificant, especially for the case with the lowest cavitation number.
6 Conclusions and Future WorkNumerical simulations of low Reynolds number, transitional
submerged round jets reveal that cavitation occurs within thecores of the primary vortex rings formed just downstream of thenozzle exit when the local fluid pressure drops below the vaporpressure. Cavitation tends to distort and breakup the vortex ringsand also weakens the secondary streamwise vortex tubes. Evi-dence for local flow acceleration and intensification of spanwise
Fig. 17 Profiles of Reynolds stress component <u���> /Uc2 at
axial stations for all cases. Solid line is �=1.8, long dashed lineis �=0.6 and short dashed line is �=0.5. „a… x*=2.0, „b… x*=4.0,„c… x*=6.0.
vorticity at the expense of streamwise vorticity due to cavitation is
724 / Vol. 127, JULY 2005
observed. Analysis of various terms in the vorticity transportequation reveals a decrease in the magnitude of the vortex stretch-ing term and the presence of non-zero dilatation and baroclinictorque terms in the main cavitation regions. Statistical analysis ofthe flow field demonstrates that cavitation tends to suppress jetgrowth and reduce Reynolds stresses. These effects are in quali-tative agreement with previous experimental studies of cavitatingshear flows and bubble-flow interactions. Future efforts shouldfocus on extending the cavitation model to apply to larger voidfraction flows by relaxing the constant bubble number densityassumption, accounting for bubble size distributions, and consid-ering thermal nonequilibrium effects. Finally, inclusion of a sub-gridscale turbulence model to facilitate large eddy simulations ofcavitating flows would allow higher Reynolds number and morecomplex geometries, and hence scaling effects, to be considered.
AcknowledgmentsThe authors would like to gratefully acknowledge Caterpillar
Inc., Peoria, IL, and the Indiana 21st Century Research and Tech-nology Fund for support of this research.
NomenclatureD � nozzle diameterf� � void fractionn � bubble number densityp � pressure
p� � chamber pressureR � bubble radius
Re � Reynolds numberS � strain rate tensort � time
U0 � maximum velocity at inletV � velocity vector
Uc � centerline velocityu0 � convective velocity at outlet
(x, y, z) � Cartesian coordinate system� � molecular viscosity� � vorticity� � density
�r � bubble cluster radius� � cavitation number� � gradient operator� � constant
Subscripts� � liquid� � vapor
Superscripts* � on-dimensional quantity
References�1� Rood, E. P., 1991, “Review—Mechanisms of Cavitation Inception,” J. Fluids
Eng., 113, pp. 163–175.�2� Arndt, R. E. A., 1981, “Cavitation in Fluid Machinery and Hydraulic Struc-
tures,” Annu. Rev. Fluid Mech., 13, pp. 273–328.�3� Billard, J.-Y., Galivel, P., and Fruman, D. H., 1993, “Effect of Preturbulence
on the Cavitating Bubble Inception, Noise and Morphology in A Venturi,”ASME FED, 176, pp. 31–38.
�4� Baur, T., and Ngeter, J. K., 1998, “Measurements in the Shear-Layer Behind aSurface-Mounted Obstacle for the Determination of Coherent Structures,”Ninth Int. Symp. on Applications of Laser Techniques to Fluid Mechanics,Lisbon, Portugal, pp. 1–7.
�5� Brennen, C. E., 1995, Cavitation and Bubble Dynamics, Oxford UniversityPress, Oxford, Chap. 2.
�6� Gopalan, S., Katz, J., and Knio, O., 1999, “The Flow Structure in the NearField of Jets and Its Effects on Cavitation Inception,” J. Fluid Mech., 398, pp.1–43.
�7� Arndt, R. E. A., 2002, “Cavitation in Vortical Flows,” Annu. Rev. Fluid Mech.,
Transactions of the ASME
34, pp. 143–175.�8� Sridhar, G., and Katz, J., 1999, “Effect of Entrained Bubbles on the Structure
of Vortex Rings,” J. Fluid Mech., 397, pp. 171–202.�9� Iyer, C. O., and Ceccio, S. L., 2002, “The Influence of Developed Cavitation
on the Flow of a Turbulent Shear Layer,” Phys. Fluids, 14�10�, pp. 3414–3431.
�10� Xing, T., and Frankel, S. H., 2002, “Effect of Cavitation on Vortex Dynamicsin a Submerged Laminar Jet,” AIAA J., 40�11�, pp. 2266–2276.
�11� Kubota, A., Kato, H., and Yamaguchi, H., 1992, “A New Modeling of Cavi-tating Flows: A Numerical Study of Unsteady Cavitation on a Hydrofoil Sec-
Journal of Fluids Engineering
tion,” J. Fluid Mech., 240, pp. 59–96.�12� Delale, C. F., Schnerr, G. H., and Sauer, J., 2001, “Quasi-One-Dimensional
Steady-State Cavitating Nozzle Flows,” J. Fluid Mech., 427, pp. 167–204.�13� Dormy, E., 1999, “An Accurate Compact Treatment of Pressure for Colocated
Variables,” J. Comput. Phys., 151, pp. 676–683.�14� Perot, J. B., 1993, “An Analysis of the Fractional Step Method,” J. Comput.
Phys., 108, pp. 51–58.�15� Hunt, J. C. R., Wray, A. A., and Moin, P., 1988, “Eddies, Stream, and Con-
vergence Zones in Turbulent Flows,” Report CTR-S88, Center For TurbulenceResearch.
JULY 2005, Vol. 127 / 725