Numerical evaluation of the defrosting/defogging ...
11
International Journal of Automotive Engineering Vol. 5, Number 4, Dec 2015 Numerical evaluation of the defrosting/defogging performance of HVAC system in the main product of the national vehicle platform 1 2 3 4 4 1 Professor 2 Assistant professor and corresponding author 3 B.Sc. graduated in automotive engineering 4 M.Sc. automotive engineering student Automotive Engineering School, Iran University of Science and Technology, Abstract Due to the increasing development in various branches of the automotive industry, the need for a comfort climate in the cabin is more sensible. However, to achieve climate comfort, HVAC system consumes a considerable amount of engine power. Hence, improving HVAC system performance leads to more energy saving of the vehicle which is a critical factor for nowadays automotive. Besides, one crucial task of HVAC system is defrosting/defogging of windshield which is considered as a mandatory requirement in most countries. In the current study, the defrosting/defogging performance of HVAC system in the main product of national vehicle platform is numerically evaluated based on the ECE-78-715 legal requirement. For this purpose, after validation and mesh independency study, the transient air flow in three-dimensional cabin geometry is simulated by SSTk-ω turbulence model via ANSYS Fluent software and the windshield thermal condition is reported during defrosting/defogging. Besides, two national HVAC standards of AERC-10-01 and AERC-10-02 are also checked. The results demonstrate that HVAC system of the main product of the national vehicle platform can satisfactorily fulfill ECE-78-715, AERC-10-01 and AERC-10- 02. Keywords: defrosting/defogging performance; HVAC system; numerical evaluation; main product of the national vehicle platform; ECE-78-715. 1. Introduction Of the many demands placed on the automotive HVAC system, ensuring visibility through the windshield via defrosting/defogging is an important requirement for passenger safety [1]. Today’s enhancing computing processors facilitates three- dimensional numerical simulation of a vehicle cabin to investigate different functions of HVAC system such as windshield defrosting/defogging. Several CFD assessments of different features of automotive air conditioning system have been carried out recently [2-8]. However, numerical evaluation of defrosting/defogging performance is not reported numerously; In fact, due to more reliability of experimental evaluation, automotive manufacturers preferred it to gain more ensuring about deicing capability of HVAC systems. A numerical procedure for the prediction of transient defogging processes was described by Croce et al. [9]. The procedure computes the evolution of the water layer on an interface 2D grid, and the interaction with the flow solver is achieved through an exchange of boundary conditions. Thus, a high level of flexibility is granted, both in the choice of the flow solver and in the degree of interaction between the solver and the water layer routines. Aroussi et al. presented a numerical model and technique to simulate the turbulent fluid flow over and heat transfer through a model of vehicle windshield defrosting and demisting systems [10]. The simplified geometry and the dimensions of the numerical model are representative of vehicle system with accurate locations of the nozzles and outlet vents, including cabin features such as seating and the rear parcel shelf. The numerical results of their study compare favorably with measurements obtained from the actual vehicle by thermograph and hot bulb probe techniques. The findings highlight some of the drawbacks of the existing design of the windshield systems and show that the maximum flow rates occur in the vicinity of the lower part of the windshield, progressing from the defroster nozzle in the dashboard. M.H. Shojaeefard * , G.R. Molaeimanesh , N. Aghamirzaei , S. Ghezelbiglo , B. Zeinolabedini * Corresponding Author
Transcript of Numerical evaluation of the defrosting/defogging ...
International Journal of Automotive Engineering Vol. 5, Number 4, Dec 2015
Numerical evaluation of the defrosting/defogging
performance of HVAC system in the main product of the
national vehicle platform
1 2 3 4 4
1 Professor 2 Assistant professor and corresponding author 3 B.Sc. graduated in automotive engineering 4 M.Sc.
automotive engineering student Automotive Engineering School, Iran University of Science and Technology,
Abstract
Due to the increasing development in various branches of the automotive industry, the need for a comfort
climate in the cabin is more sensible. However, to achieve climate comfort, HVAC system consumes a
considerable amount of engine power. Hence, improving HVAC system performance leads to more energy
saving of the vehicle which is a critical factor for nowadays automotive. Besides, one crucial task of HVAC
system is defrosting/defogging of windshield which is considered as a mandatory requirement in most
countries. In the current study, the defrosting/defogging performance of HVAC system in the main product
of national vehicle platform is numerically evaluated based on the ECE-78-715 legal requirement. For this
purpose, after validation and mesh independency study, the transient air flow in three-dimensional cabin
geometry is simulated by SSTk-ω turbulence model via ANSYS Fluent software and the windshield
thermal condition is reported during defrosting/defogging. Besides, two national HVAC standards of
AERC-10-01 and AERC-10-02 are also checked. The results demonstrate that HVAC system of the main
product of the national vehicle platform can satisfactorily fulfill ECE-78-715, AERC-10-01 and AERC-10-
02.
Keywords: defrosting/defogging performance; HVAC system; numerical evaluation; main product of the national
vehicle platform; ECE-78-715.
1. Introduction
Of the many demands placed on the automotive
HVAC system, ensuring visibility through the
windshield via defrosting/defogging is an important
requirement for passenger safety [1]. Today’s
enhancing computing processors facilitates three-
dimensional numerical simulation of a vehicle cabin
to investigate different functions of HVAC system
such as windshield defrosting/defogging. Several
CFD assessments of different features of automotive
air conditioning system have been carried out recently
[2-8]. However, numerical evaluation of
defrosting/defogging performance is not reported
numerously; In fact, due to more reliability of
experimental evaluation, automotive manufacturers
preferred it to gain more ensuring about deicing
capability of HVAC systems.
A numerical procedure for the prediction of
transient defogging processes was described by Croce
et al. [9]. The procedure computes the evolution of
the water layer on an interface 2D grid, and the
interaction with the flow solver is achieved through
an exchange of boundary conditions. Thus, a high
level of flexibility is granted, both in the choice of the
flow solver and in the degree of interaction between
the solver and the water layer routines.
Aroussi et al. presented a numerical model and
technique to simulate the turbulent fluid flow over
and heat transfer through a model of vehicle
windshield defrosting and demisting systems [10].
The simplified geometry and the dimensions of the
numerical model are representative of vehicle system
with accurate locations of the nozzles and outlet
vents, including cabin features such as seating and the
rear parcel shelf.
The numerical results of their study compare
favorably with measurements obtained from the
actual vehicle by thermograph and hot bulb probe
techniques. The findings highlight some of the
drawbacks of the existing design of the windshield
systems and show that the maximum flow rates occur
in the vicinity of the lower part of the windshield,
progressing from the defroster nozzle in the
dashboard.
M.H. Shojaeefard * , G.R. Molaeimanesh , N. Aghamirzaei , S. Ghezelbiglo , B. Zeinolabedini
* Corresponding Author

2007 Numerical evaluation of the defrosting...
International Journal of Automotive Engineering Vol. 5, Number 4, Dec 2015
The windshield de-icing pattern analysis and
windshield deicing process analysis have been
discussed and validated by Farag and Huang [11].
Their results show reasonable agreement between the
CFD prediction and the test results. They
recommended to use the analysis in the early stages of
the program to optimize the defroster nozzle design to
shorten the development cycle. It is also
recommended that the windshield de-icing pattern
analysis be used during the refinement stage. The
authors recommend a mesh size study to analyze the
effect of the mesh size on the heat transfer
calculations.
Kumara and Roy [12] investigated the unsteady
process of melting of ice on the windshield using
solidification and melting model, which relates
enthalpy and porosity of ice, treated as mushy zone.
The main goal of their paper was to compare the
control parameters like impingement and sweep angle
for minimization of defrosting time for a given ice
and glass thickness. Parameters like enthalpy and
Nusselt number are used to understand the heat
transfer process. A comparative test using other
viable alternatives deicing methods of deicing are also
being attempted.
2. Governing equations
Computational fluid dynamics (CFD) is the
science of predicting flow characteristics, mass and
heat transfer, chemical reactions and other relating
phenomena using numerical solutions to solve
governing mathematical equations. These equations
include conservation of mass (continuity law),
conservation of momentum (Newton’s second law),
conservation of energy (first law of thermodynamics)
and the conservation of chemical species. If the
specific mass remains constant throughout the
domain, the flow can be considered incompressible.
Also the variation of viscosity can be ignored and
taken to be a constant. Since the air flow through
vehicle cabin can be considered incompressible, the
governing equations in the averaged form are as
follows:
a) Continuity equation:
0
i
i
x
U (1)
where Ui is the average velocity component in
direction i.
b) Momentum equations:
i
j
j
ieff
jij
jii
x
U
x
U
xx
p
x
UU
t
U
)()( (2)
where P is pressure and µeff is the effective
viscosity which equals:
tleff (3)
Where μt is the turbulent viscosity and using the
SST k-ω turbulent model, we can write:
),max( 21
1
SFa
kat
(4)
where S is strain rate and F2 is:
2
2*2 )500
,2
max(tanh
yy
kF
(5)
c) Turbulence equations [13,14]:
The transport equations for turbulence kinetic
energy (k) and turbulence frequency () are:
jtk
jk
jj
x
k
xkP
x
kU
t
k)(*
(6)
and
iijt
jjj
xx
kF
xxS
xU
t
1)1(2)( 21
22
(7)
where in Eqs. (6) and (7):
k
x
UP
j
iijk
*10,min
(8)
and
4
2
2
2*1
4),
500,
2max(mintanh
yCD
k
yy
kF
k
(9)
where:
10
2 10,1
2maxii
kxx
kCD
(10)
The constants in the above equations are:
44.0,9
521 (11)
0828.0,40
321 (12)

M.H. Shojaeefard, G.R. Molaeimanesh, N. Aghamirzaei, S. Ghezelbiglo, B. Zeinolabedini 2008
International Journal of Automotive Engineering Vol. 5, Number 4, Dec 2015
100
9* (13)
1,85.0 21 kk (14)
856.0,5.0 21 (15)
2. Numerical Method
To numerically solve the governing equations in a
physical domain, one of the three methods below is
chosen:
Finite difference method
Finite volume method
Finite element method
Due to its more flexibility, finite volume method
is usually adopted for solving fluid flow in a
computational domain. In this method, the integral
forms of conservation equations are solved for the
finite control volumes adjacent to each other. Finite
volume method is able to handle a variety of complex
geometry problems. ANSYS Fluent software which is
used in the current study is based on the finite volume
method.
In most engineering problems where natural
convection cannot be neglected, to estimate the
variations of density with temperature with a high
convergence rate the Boussinesque approximation
method [15] can be used. In this method, it is
assumed that the density of the fluid remains constant
in all governing equations, except in the volumetric
force term in the momentum equation in the direction
of the gravity which is:
gTTg 000 (16)
Where T0 is the reference temperature, ρ0 is the
flow density at T0 (constant), and β is the thermal
expansion coefficient. The thermal expansion
coefficient is set at 0.00335 in the current software.
3.1. Turbulent Model
In this study, the SST k-ω turbulent model is used
due to its high performance capability in flow
simulations in a wide range of Reynolds number and
also a relatively low computational cost for
simulation of turbulence. SST k-ω turbulence model
which is a two-equation Reynolds averaged Navier-
Stokes (RANS) turbulence model [16] has
advantageous features such as high prediction
capability, economical factor and more important than
anything else, acceptable accuracy in a wide range of
turbulence flows. This model is widely used in
engineering fluid flows including reverse pressure
gradient, airfoils and transient shock waves.
SST k-ω turbulence model is quite suitable for
boundary layer flows where it performs better than
the well-known k- model. In most of two-equation
models such as the k- turbulence model, turbulent
stress at the wake vicinity is over estimated, which
leads to weak performance. The main idea if SST k-ω
turbulence model is the combination of the capability
of the so-called k-ω turbulence in predicting flow
field near the solid boundary with the capability of k-
turbulence model in predicting high-Reynolds
number flow far away from the solid boundary.
3.2. Model Validation
In order to validate the employed software for the
simulation, it is necessary to compare the numerical
results with experimental data. The experimental data
adopted for validation belong to the two-dimension
simulation of Nielsen et al. [17] which is widely used
for validation of internal flow. The Nielsen et al. flow
field is shown in Fig.1 in which the Reynolds number
based on the inlet characteristics is set to 5000. The experimental data and the results of numerical
simulation via ANSYS Fluent are compared in two
horizontal lines of 028.0
H
y
and972.0
H
y
; and the two
vertical lines of 3
1
L
x
and 3
2
L
x
in Fig2 and Fig3,
respectively. As it is obvious, the difference of
experimental data and the numerical results is
acceptable.
4. Computation domain
The interior geometry of the main product of the
first national vehicle platform is modeled via CATIA
software. In order to reduce computational cost,
details of the interior have been neglected due to their
small effects on the outcome. It should be noted that
the cabin geometry considered in this simulation is
the volume inside the cabin containing fluid, from
which the volume of components such as the front or
rear row passenger seats is subtracted. In Fig.4 (b)
different parts of the model (seats, front and rear air
vents (registers), center console, parcel shelf,
windows, dashboard, roof, floor, firewall and doors)
are shown.

2009 Numerical evaluation of the defrosting...
International Journal of Automotive Engineering Vol. 5, Number 4, Dec 2015
The geometry of model studied experimentally by Nielsen et al. [17]
(a) 028.0H
y (b) 972.0
H
y
. Comparison of the numerical results with the experimental data from Nielsen et al. [17] for two horizontal lines (symbols: experimental data; solid line: the results of the present numerical study)
(a) 3
1
L
x (b) 3
2
L
x
Comparison of the numerical results with the experimental data from Nielsen et al. [17] for two vertical lines (symbols:

M.H. Shojaeefard, G.R. Molaeimanesh, N. Aghamirzaei, S. Ghezelbiglo, B. Zeinolabedini 2010
International Journal of Automotive Engineering Vol. 5, Number 4, Dec 2015
experimental data; solid line: the results of the present numerical study)
(a) Outer view
(b) Inner view
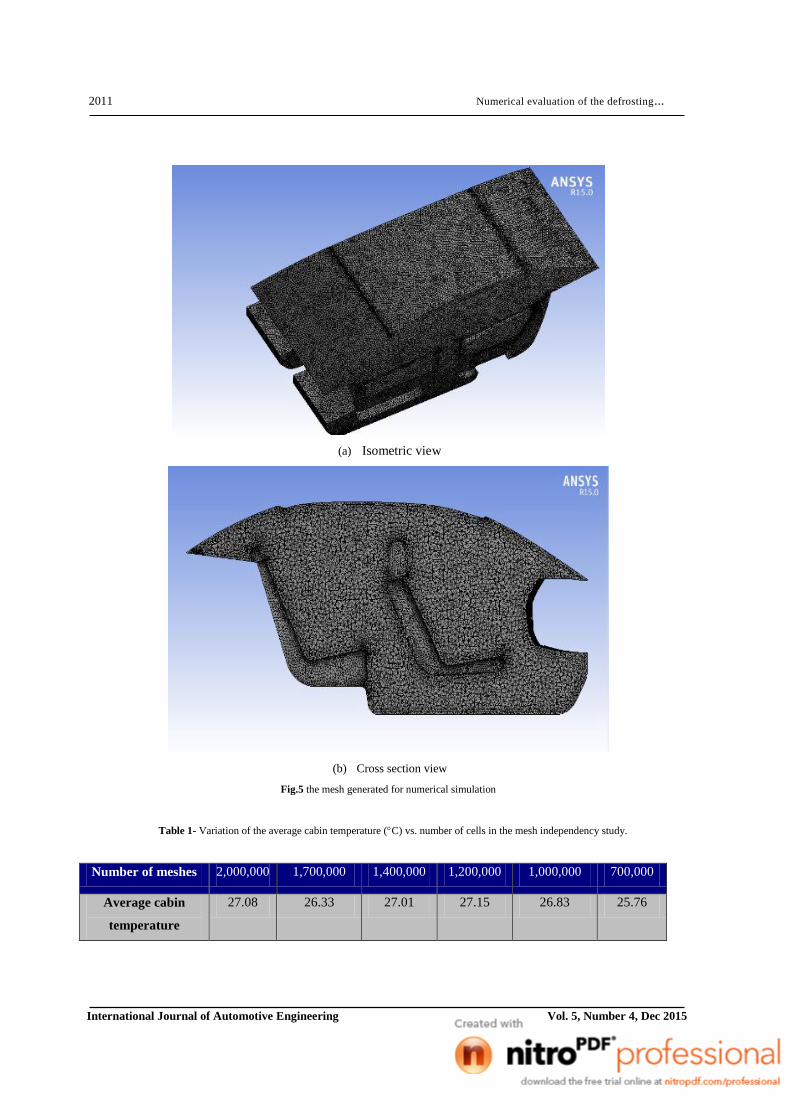
Fig4. The geometry of computational domain
An unstructured tetrahedral mesh is generated for
simulation of air flow in the computational domain
which can be seen in Fig. 5. The generated mesh
consists of approximately 1.4 million cells using path
conforming algorithm. It contains an average aspect
ratio of 1.8 and an average skewness of 0.23. The
maximum acceptable value for aspect ratio and
skewness is 5 and 0.33, respectively [18]. Their ideal
values are 1 and 0, respectively.
It is necessary to mentioned that the afore-
mentioned 1.4 million of cells is based on a mesh
independency study performed. In such a study,
various meshes with different number of cells are
simulated and the results are compared. There would
be an optimum number of cells that using less number
of cells could lead to incorrect results while applying
greater number of cells could lead to unnecessary
extended computational cost without any significant
accuracy improvement.
In order to achieve this optimum number, several
meshes have been simulated and the average air
temperature is reported as the determinative
parameter. In these simulations, the rear air vent on
the parcel shelf is opened to atmosphere while cool
air enters through the front and rear air registers with
the uniform velocity of 1.6 m/s.
The results can be seen in Table 1.
According to above statistical results, the variation
of cabin temperature for 1.4 million cells or more is
below 2.5%. Therefore in the following sections, the
number of cells used is set to 1.4 million. Other
parameters settings applied in the simulations are
presented in Table 2.
2011 Numerical evaluation of the defrosting...
International Journal of Automotive Engineering Vol. 5, Number 4, Dec 2015
(a) Isometric view
(b) Cross section view
Fig.5 the mesh generated for numerical simulation
Table 1- Variation of the average cabin temperature (C) vs. number of cells in the mesh independency study.
700,000 1,000,000 1,200,000 1,400,000 1,700,000 2,000,000 Number of meshes
25.76 26.83 27.15 27.01 26.33 27.08 Average cabin
temperature

M.H. Shojaeefard, G.R. Molaeimanesh, N. Aghamirzaei, S. Ghezelbiglo, B. Zeinolabedini 2012
International Journal of Automotive Engineering Vol. 5, Number 4, Dec 2015
Table 2- Parameters settings applied in the current simulations.
Operating Conditions
101325 Pa Operating Pressure
Enabled Gravity
288.16 Bossiness Parameter (operating temperature) [K]
Enabled Variable density parameter
Solar Load Model
Do Irradiation Model
Constant (200) Diffuse Solar Irradiation
Solar-Calculator Direct Solar Irradiation
Longitude=31.2
Latitude=48.4
Time zone(GMT)=4.5
Global Position
Day=23
Month=7
Time=13:00
Date and Time
Fair Weather Condition Solar Irradiation Method
1 Sunshine Factor
Pressure-Velocity Coupling
SIMPLE Model
Boundary Conditions
Dashboard Inlets
Velocity-Inlet Type
Intensity and Hydraulic Diameter Turbulence
5% Turbulent Intensity
Side: 0.07
Middle: 0.08 Hydraulic Diameter
Variable in different simulations Temperature [K]
Back Inlet
Velocity-Inlet Type
Intensity and Hydraulic Diameter Velocity specification Method
Magnitude and Direction Velocity Magnitude
0.7071 Direction X Component
0 Direction Y Component
0.7071 Direction Z Component
5% Turbulent Intensity
0.075 Hydraulic Diameter
Variable in different simulations Temperature
Outlet
Pressure Outlet Type
0(Constant) Gauge Pressure
300 Backflow Total Temperature [K]
Intensity and Hydraulic Diameter Turbulent Specification Method
5% Backflow Turbulent Intensity
0.05 Hydraulic Diameter

2013 Numerical evaluation of the defrosting...
International Journal of Automotive Engineering Vol. 5, Number 4, Dec 2015
5. Results and discussion
5.1. Air conditioning defrosting/defogging
performance evaluation
The conducted transient simulations based on 78-
318-EEC standard for different initial temperatures
and different time settings are presented in this
section. At first, defogging process is elucidated. The
titles of following subsections, (a) till (e), which are
according to different requirements of 78-318-EEC
represent the simulations performed.
Defogging of zone A of front windshield at
environment temperature of -3 C after 5 minutes
In this state, the initial temperature of the front
windshield and all other cabin components is set at -3
C. The temperature distribution contour on the
windshield after 5 minutes is shown in Fig6. As it can
be seen, the temperature of windshield on zone A (the
two trapezoidal shapes marked in this figure) is above
0 C which shows the ability of the designed HVAC
system in satisfying this requirement.
Defogging of the entire front windshield at
environment temperature of -3 C after 11 minutes
Shown in Fig7 is the temperature distribution
contour on the windshield after 11 minutes. As it is
obvious, the temperature of windshield is entirely
above 0 C which shows the ability of the designed
HVAC system in satisfying this requirement.
Fig6. Defogging of zone A of front windshield at environment temperature of -3 C after 5 minutes
Fig7. Defogging of the entire front windshield at environment temperature of -3 C after 11 minutes
M.H. Shojaeefard, G.R. Molaeimanesh, N. Aghamirzaei, S. Ghezelbiglo, B. Zeinolabedini 2014
International Journal of Automotive Engineering Vol. 5, Number 4, Dec 2015
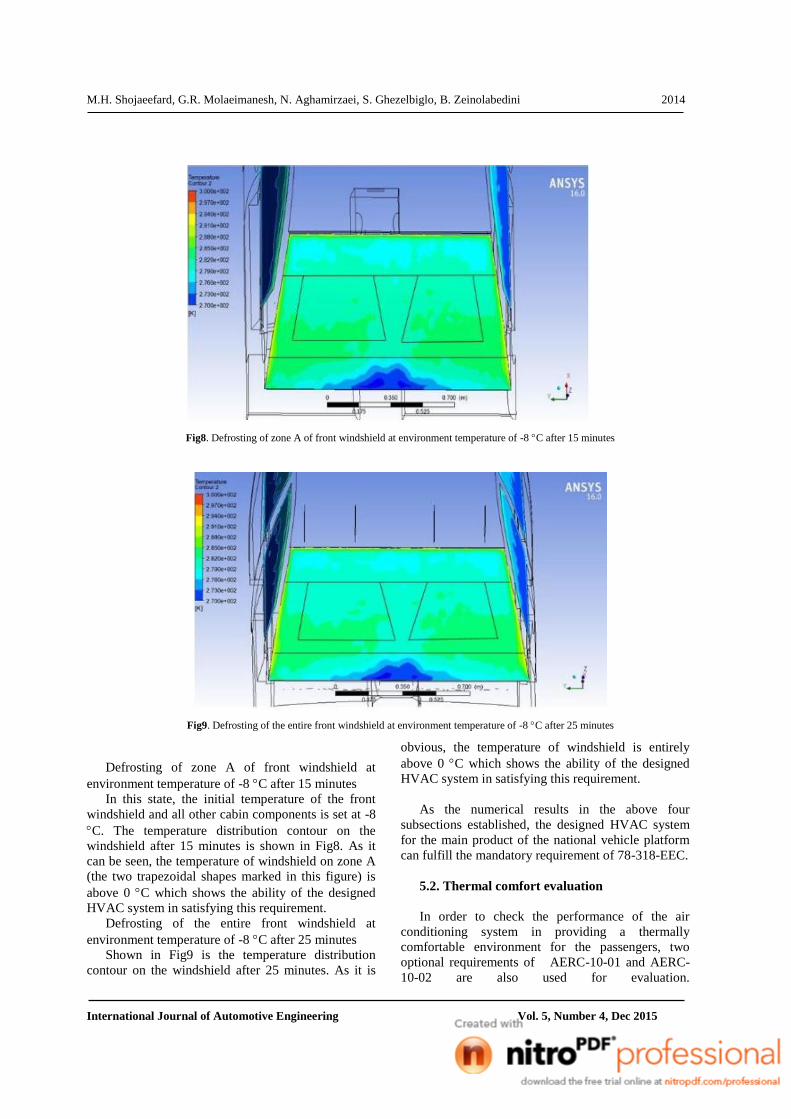
Fig8. Defrosting of zone A of front windshield at environment temperature of -8 C after 15 minutes
Fig9. Defrosting of the entire front windshield at environment temperature of -8 C after 25 minutes
Defrosting of zone A of front windshield at
environment temperature of -8 C after 15 minutes
In this state, the initial temperature of the front
windshield and all other cabin components is set at -8
C. The temperature distribution contour on the
windshield after 15 minutes is shown in Fig8. As it
can be seen, the temperature of windshield on zone A
(the two trapezoidal shapes marked in this figure) is
above 0 C which shows the ability of the designed
HVAC system in satisfying this requirement.
Defrosting of the entire front windshield at
environment temperature of -8 C after 25 minutes
Shown in Fig9 is the temperature distribution
contour on the windshield after 25 minutes. As it is
obvious, the temperature of windshield is entirely
above 0 C which shows the ability of the designed
HVAC system in satisfying this requirement.
As the numerical results in the above four
subsections established, the designed HVAC system
for the main product of the national vehicle platform
can fulfill the mandatory requirement of 78-318-EEC.
5.2. Thermal comfort evaluation
In order to check the performance of the air
conditioning system in providing a thermally
comfortable environment for the passengers, two
optional requirements of AERC-10-01 and AERC-
10-02 are also used for evaluation.
2015 Numerical evaluation of the defrosting...
International Journal of Automotive Engineering Vol. 5, Number 4, Dec 2015
AERC-10-01
AERC-10-01 is introduced by automotive
engineering research center (AERC) in the Iran
University of Science and Technology to evaluate the
heating performance of the HVAC unit. In this
requirement, the initial cabin temperature is set at -20
C. After initiating the heating operation of the
HVAC unit, the following demands should be
satisfied:
A) The average cabin temperature after 15 minutes
while the vehicle running at 40 km/h should reach 15
C.
B) The air temperature at the exhaust vent after 15
minutes while the vehicle running at 40 km/h should
reach 13.9 C.
C) The average cabin temperature after 30 minutes
while the vehicle running at 40 k/ph should reach 29
C.
D) The air temperature at the exhaust vent after 30
minutes while the vehicle running at 80 km/h should
reach 34C.
E) The air temperature at the exhaust vent while the
vehicle is running at a constant speed of 80 km/h and
after 10 minutes of idle should reach 32 C.
The numerical results demonstrate that all the
above mentioned criteria can be passed via the
designed HVAC system for the main product of the
first national platform. In fact, the average air
temperature of the cabin after 15 minutes, reaches
19.5 C which is well beyond the 15 C which
confirms the flawless performance of the designed
heating unit.
AERC-10-02
According to this criterion which is introduce by
AERC to evaluate the cooling capability of a HVAC
system, the initial cabin temperature is taken to be 52
C. After initiating the cooling operation of the
HVAC unit, the following demands should be
satisfied:
A) The average cabin temperature after 15
minutes while the vehicle running at 40 km/h should
reach 29 C.
B) The air temperature at the discharge vent after
10 minutes while the vehicle running at 40 km/h
should reach 20.6 C.
C) The average cabin temperature after 30
minutes which the vehicle running at 40 km/h should
reach 26 C.
D) The air temperature at the discharge vent after
30 minutes while the vehicle running at 80 km/h
should reach 25 C.
E) The air temperature at the discharge vent while
the vehicle is running at a constant speed of 80 km/h
and after 30 minutes of idle should reach 26 C.
The numerical results demonstrate that all the
above mentioned criteria can be passed via the
designed HVAC system for the main product of the
first national platform. In fact, the average air
temperature of the cabin after 15 minutes, reaches
28.33 C which is well beyond the 29 C which
confirms the acceptable performance of the designed
heating unit.
6. Conclusions
One of the main functions of an air conditioning
unit which is of great importance is
defogging/defrosting ability which is considered as a
mandatory requirement in many countries. The design
of the defogger and defroster depend on many factors
including the design of air ducts, air temperature, air
speed and turbulence level.
In this study, the capability HVAC system
designed for the main product of the national vehicle
platform in defrosting/defogging of windshield is
numerically evaluated by ECE-78-715 standard. The
air flow inside the cabin is simulated three-
dimensionally using ANSYS Fluent and via the SST
k-ω turbulent model. In this regard, validation and
mesh independency study are performed at first. The
results of simulations demonstrate that the designed
HVAC system for the main product of national
vehicle platform can fulfill the legal
defrosting/defogging requirement of 78-318-EEC.
Besides, to confirm the HAVC system capabilities in
providing thermal comfort, the heating and cooling
performances are evaluated via AERC-10-01 and
AERC-10-02 criteria, respectively which were
successfully established.

M.H. Shojaeefard, G.R. Molaeimanesh, N. Aghamirzaei, S. Ghezelbiglo, B. Zeinolabedini 2016
International Journal of Automotive Engineering Vol. 5, Number 4, Dec 2015
Reference
[1]. Kye-Kwangand, Choi, and Han Seong-Ryeol.
"Numerical Study for Connecter and Section
Shape of the Internal Heat Exchanger on
Automotive Air Conditioning." Indian Journal
of Science and Technology 8.S8 (2015): 144-
148.
[2]. Lee, G. H., and J. Y. Yoo. "Performance
analysis and simulation of automobile air
conditioning system." International journal of
refrigeration 23.3 (2000): 243-254.
[3]. Danca, Paul, Andreea Vartires, and Angel
Dogeanu. "An Overview of Current Methods
for Thermal Comfort Assessment in Vehicle
Cabin." Energy Procedia 85 (2016): 162-169.
[4]. Kader, MD Faisal, Mohammad Ali Jinnah, and
Kumbae Lee. "the effect of solar radiation on
automobile environment through natural
convection and mixed convection." Journal of
Engineering Science and Technology 7.5
(2012): 589-600.
[5]. R. Gordon, M. Imbabi, CFD simulation and
experimental validation of a new closed circuit
wind/water tunnel design, J. Fluids Eng. Trans.
ASME 120 (1998) 311-318.
[6]. R.H. Vaivads, D. Springford, G. Lemieux,
J.E.D. Gauthier, in: CFD Simulation of
Turbulence Reduction in a Wind Tunnel Using
Screens, the 1997 ASME Fluids Engineering
Division Summer Meeting, June 1997, pp. 1-5.
[7]. D.C. Cumberpatch, Climatic simulation in a
purpose-built wind tunnel, Proc. Inst. Mech.
Engrs., I Mech. E 201 (D4) (1987).
[8]. Ghani, SAA Abdul, A. Aroussi, and E. Rice.
"Simulation of road vehicle natural environment
in a climatic wind tunnel." simulation practice
and theory 8.6 (2001): 359-375.
[9]. Croce, G., et al. "A numerical procedure for
defogging process simulation in automotive
industry." International Conference on Heat and
Mass Transfer, Corfu, Greece, August. 2004.
[10]. Aroussi, A., A. Hassan, and Y. Morsi.
"Numerical simulation of the airflow over and
heat transfer through a vehicle windshield
defrosting and demisting system." Heat and
Mass Transfer 39.5-6 (2003): 401-405.
[11]. Farag, Ashraf, and Lin-Jie Huang. "CFD
Analysis and Validation of Automotive
Windshield De-Icing Simulation." SAE paper
2003-01 (2003): 1079.
[12]. Kumar, Haribalan, and Subrata Roy. "Improved
de-icing of an inclined windshield surface."
43rd AIAA Aerospace Sciences Meeting and
Exhibit. 2005.
[13]. Menter, F. R. (1993), "Zonal Two Equation k-ω
Turbulence Models for Aerodynamic Flows",
AIAA Paper 93-2906.
[14]. Menter, F. R. (1994), "Two-Equation Eddy-
Viscosity Turbulence Models for Engineering
Applications", AIAA Journal, vol. 32, no 8. pp.
1598-1605.
[15]. Incropera F.P., DeWitt D.P., Bergman T.L.,
Lavine A.S. (2007). Fundumentals of Heat and
Mass Trandfer, John Wiley and Sons, New
Jersey.
[16]. Wilcox D. C., "Turbulence Modeling for CFD",
DCW Industries, Inc., 1993.
[17]. Nielsen, P.V., Restivo, A., Whitelaw, J.H., .The
velocity characteristics of ventilated rooms,
Journal of Fluid Engineering, Vol.100, pp.291-
298, 1978.ANSYS User’s guide, R15.01.