November 3, 2017 KSB Pumps (KSBPUM) |...
12
November 3, 2017 ICICI Securities Ltd | Retail Equity Research Result Update Resurging topline growth encouraging… KSB Pumps (KSB) reported a stellar Q3CY17 performance with the company displaying higher double digit growth in topline (24%) after a long with a stable EBITDA margin profile of 10.5% Total standalone revenues came in at | 200.5 crore, up 24.1% YoY with pump sales at | 159 crore, up 22% YoY and valves sales at | 41 crore, up 53% YoY. Valves segment reported EBIT margins of 6.6% Standalone EBITDA in Q3CY17 came in at | 21.1 crore while PAT for the quarter was at | 11.6 crore, up 57.7% YoY KSB with the technology support from its parent i.e. KSB AG amid new manufacturing facility is best placed to capture the envisaged opportunity in the domestic refining segment (change in fuel efficiency) and increasing thrust on irrigation projects (lift irrigation) KSB has previously supplied pump to NPCIL. Hence, it be a key contender for supplying pumps for new nuclear power plants in India Monsoon 2017 satisfactory; ends at near normal (-5% of LPA) Monsoon 2017 began with bright, widespread distribution across India with rainfall in June at +4% LPA and July at +2% of LPA before slowing down in August (-13% of LPA) & September (-12% of LPA) to finally end the season at -5% of LPA. On spatial distribution front, monsoon 2017 was normal in southern, eastern India and below normal in northern, central India. However, the impact of near normal monsoon on farm income may be limited, given high irrigation penetration in key rainfall deficient agrarian states like Punjab (99%), Haryana (86%) and Uttar Pradesh (76%), auguring well for agri input companies, including KSB. Poised to gain amid government’s aim to double farm income by 2022 The central government has time and again reiterated its aim to double farm income by 2022. The same is envisaged to be attained through better productivity and enhanced farm realisations. Given the limitations of available land, better productivity is quite essential for augmenting farm income. Increasing the irrigation penetration (currently at ~45%) is a most sought after technique in augmenting farm productivity, which is more significant in the present times of uneven distribution of rainfall and increasing volatility over occurrence of monsoon. KSB is one of the leading pump manufacturers with quality product profile of energy efficient pumps and strong brand recall. Hence, it is expected to be a key beneficiary of increasing irrigation penetration domestically. Strong promoter group (KSB AG); levers to grow; retain BUY! KSB is a technology driven organisation with support from parent group i.e. KSB AG. It also has a healthy balance sheet with surplus cash on books. Being present only in the product business (not EPC), it witnessed efficient working capital cycle of ~50 days. It also realises healthy core RoICs of ~15%+. On the pumps division front, KSB realises ~35% of sales from the standard (product) pumps segment, which is used in agriculture. With the government’s thrust on augmenting irrigation penetration domestically using energy efficient (star rated) pumps, the outlook for this segment is robust. KSB realises the rest ~65% of sales from engineered pumps segment. Incremental capex execution by downstream oil & gas companies for upgradation of refineries provides a robust outlook for the engineered pumps segment. On a consolidated basis, we model sales, PAT CAGR of 10.8%, 19.6%, respectively, in CY17- 19E. We model a 180 bps improvement in EBITDA margins in the aforesaid period. We value KSB at 35x P/E on CY19E EPS of | 28.5. We arrive at a target price of | 1000 with a BUY rating on the stock. KSB Pumps (KSBPUM) | 850 Rating matrix Rating : Buy Target : | 1000 Target Period : 12-18 months Potential Upside : 18% What’s changed? Target Changed from | 850 to | 1000 EPS CY17E Changed from | 19.7 to | 19.9 EPS CY18E Changed from | 25.6 to | 24.6 EPS CY19E Introduced at | 28.5 Rating Unchaged Quarterly performance Q3CY17 Q3CY16 YoY (%) Q2CY17 QoQ (%) Revenue 200.5 161.6 24.1 210.3 -4.7 EBITDA 21.1 12.7 65.9 23.8 -11.4 EBITDA (%) 10.5 7.9 266 bps 11.3 -80 bps PAT 11.6 7.4 57.7 15.4 -24.7 Key financials | Crore CY16 CY17E CY18E CY19E Net Sales 817.6 885.7 981.1 1,087.4 EBITDA 99.1 106.8 131.3 150.7 Net Profit 65.3 69.2 85.7 99.1 EPS (|) 18.8 19.9 24.6 28.5 Valuation summary CY16 CY17E CY18E CY19E P/E 45.3 42.7 34.5 29.9 Target P/E 53.3 50.3 40.6 35.1 EV / EBITDA 27.9 25.6 20.8 17.7 P/BV 4.6 4.3 4.0 3.6 RoNW (%) 10.1 10.0 11.5 12.1 RoCE (%) 10.6 10.8 12.6 13.5 Stock data Particular Amount Market Capitalization | 2959 crore Total Debt (CY16) | 5.2 crore Cash and Investments (CY16) | 202.1 crore EV | 2762 crore 52 week H/L 930 / 560 Equity capital | 34.8 crore Face value | 10 MF Holding (%) 15.3 FII Holding (%) 3.7 Price performance Return % 1M 3M 6M 12M Kirloskar Brothers 6.4 2.5 -10.4 32.8 KSB Pumps 14.2 13.3 20.0 42.2 Roto Pumps 3.9 -4.8 66.9 45.4 Shakti Pumps -4.4 -3.5 91.2 228.7 WPIL 23.3 12.1 30.5 58.2 Research Analyst Chirag J Shah [email protected] Shashank Kanodia, CFA [email protected]
Transcript of November 3, 2017 KSB Pumps (KSBPUM) |...

November 3, 2017
ICICI Securities Ltd | Retail Equity Research
Result Update
Resurging topline growth encouraging…
KSB Pumps (KSB) reported a stellar Q3CY17 performance with the
company displaying higher double digit growth in topline (24%) after
a long with a stable EBITDA margin profile of 10.5%
Total standalone revenues came in at | 200.5 crore, up 24.1% YoY
with pump sales at | 159 crore, up 22% YoY and valves sales at | 41
crore, up 53% YoY. Valves segment reported EBIT margins of 6.6%
Standalone EBITDA in Q3CY17 came in at | 21.1 crore while PAT for
the quarter was at | 11.6 crore, up 57.7% YoY
KSB with the technology support from its parent i.e. KSB AG amid
new manufacturing facility is best placed to capture the envisaged
opportunity in the domestic refining segment (change in fuel
efficiency) and increasing thrust on irrigation projects (lift irrigation)
KSB has previously supplied pump to NPCIL. Hence, it be a key
contender for supplying pumps for new nuclear power plants in India
Monsoon 2017 satisfactory; ends at near normal (-5% of LPA)
Monsoon 2017 began with bright, widespread distribution across India
with rainfall in June at +4% LPA and July at +2% of LPA before slowing
down in August (-13% of LPA) & September (-12% of LPA) to finally end
the season at -5% of LPA. On spatial distribution front, monsoon 2017
was normal in southern, eastern India and below normal in northern,
central India. However, the impact of near normal monsoon on farm
income may be limited, given high irrigation penetration in key rainfall
deficient agrarian states like Punjab (99%), Haryana (86%) and Uttar
Pradesh (76%), auguring well for agri input companies, including KSB.
Poised to gain amid government’s aim to double farm income by 2022
The central government has time and again reiterated its aim to double
farm income by 2022. The same is envisaged to be attained through
better productivity and enhanced farm realisations. Given the limitations
of available land, better productivity is quite essential for augmenting
farm income. Increasing the irrigation penetration (currently at ~45%) is a
most sought after technique in augmenting farm productivity, which is
more significant in the present times of uneven distribution of rainfall and
increasing volatility over occurrence of monsoon. KSB is one of the
leading pump manufacturers with quality product profile of energy
efficient pumps and strong brand recall. Hence, it is expected to be a key
beneficiary of increasing irrigation penetration domestically.
Strong promoter group (KSB AG); levers to grow; retain BUY!
KSB is a technology driven organisation with support from parent group
i.e. KSB AG. It also has a healthy balance sheet with surplus cash on
books. Being present only in the product business (not EPC), it witnessed
efficient working capital cycle of ~50 days. It also realises healthy core
RoICs of ~15%+. On the pumps division front, KSB realises ~35% of
sales from the standard (product) pumps segment, which is used in
agriculture. With the government’s thrust on augmenting irrigation
penetration domestically using energy efficient (star rated) pumps, the
outlook for this segment is robust. KSB realises the rest ~65% of sales
from engineered pumps segment. Incremental capex execution by
downstream oil & gas companies for upgradation of refineries provides a
robust outlook for the engineered pumps segment. On a consolidated
basis, we model sales, PAT CAGR of 10.8%, 19.6%, respectively, in CY17-
19E. We model a 180 bps improvement in EBITDA margins in the
aforesaid period. We value KSB at 35x P/E on CY19E EPS of | 28.5. We
arrive at a target price of | 1000 with a BUY rating on the stock.
KSB Pumps (KSBPUM) | 850 Rating matrix
Rating : Buy
Target : | 1000
Target Period : 12-18 months
Potential Upside : 18%
What’s changed?
Target Changed from | 850 to | 1000
EPS CY17E Changed from | 19.7 to | 19.9
EPS CY18E Changed from | 25.6 to | 24.6
EPS CY19E Introduced at | 28.5
Rating Unchaged
Quarterly performance
Q3CY17 Q3CY16 YoY (%) Q2CY17 QoQ (%)
Revenue 200.5 161.6 24.1 210.3 -4.7
EBITDA 21.1 12.7 65.9 23.8 -11.4
EBITDA (%) 10.5 7.9 266 bps 11.3 -80 bps
PAT 11.6 7.4 57.7 15.4 -24.7
Key financials
| Crore CY16 CY17E CY18E CY19E
Net Sales 817.6 885.7 981.1 1,087.4
EBITDA 99.1 106.8 131.3 150.7
Net Profit 65.3 69.2 85.7 99.1
EPS (|) 18.8 19.9 24.6 28.5
Valuation summary
CY16 CY17E CY18E CY19E
P/E 45.3 42.7 34.5 29.9
Target P/E 53.3 50.3 40.6 35.1
EV / EBITDA 27.9 25.6 20.8 17.7
P/BV 4.6 4.3 4.0 3.6
RoNW (%) 10.1 10.0 11.5 12.1
RoCE (%) 10.6 10.8 12.6 13.5
Stock data
Particular Amount
Market Capitalization | 2959 crore
Total Debt (CY16) | 5.2 crore
Cash and Investments (CY16) | 202.1 crore
EV | 2762 crore
52 week H/L 930 / 560
Equity capital | 34.8 crore
Face value | 10
MF Holding (%) 15.3
FII Holding (%) 3.7
Price performance
Return % 1M 3M 6M 12M
Kirloskar Brothers 6.4 2.5 -10.4 32.8
KSB Pumps 14.2 13.3 20.0 42.2
Roto Pumps 3.9 -4.8 66.9 45.4
Shakti Pumps -4.4 -3.5 91.2 228.7
WPIL 23.3 12.1 30.5 58.2
Research Analyst
Chirag J Shah
Shashank Kanodia, CFA

ICICI Securities Ltd | Retail Equity Research Page 2
Variance analysis
Standalone Numbers Q3CY17 Q3CY17E Q3CY16 YoY (%) Q2CY17 QoQ (%) Comments
Sales 200.5 172.4 158.0 26.9 210.3 -4.7 Topline came in higher than our estimates tracking robust sales at both pumps
as well as valves segments
Other Operating Income 0.0 0.0 3.6 0.0
Total Operating Income 200.5 172.4 161.6 24.1 210.3 -4.7
Total Raw Material Expenses 96.2 79.3 68.6 40.2 103.6 -7.2 Raw material as a percentage of sales came in higher at 48%
Employee Cost 35.8 34.5 35.6 0.8 36.8 -2.7 Employee costs came in at 17.9% of sales
Other operating expense 47.4 41.4 44.7 6.0 46.1 2.9 Other expenses came in lower at 23.6% of sales
Total Expenditure 179.4 155.2 148.9 20.5 186.5 -3.8
EBITDA 21.1 17.2 12.7 65.9 23.8 -11.4
EBITDA Margin (%) 10.5 10.0 7.9 266 bps 11.3 -80 bps EBITDA margins largely came in on expected lines with the company
witnessing operating leverage benefits as fixed costs gets apportioned over a
higher sales base
Depreciation 7.6 8.7 7.3 4.3 7.4 2.7
Interest 0.6 0.1 0.3 103.7 0.1 292.9
Non Operating Expenses
Other Income 5.3 6.3 6.3 -16.1 7.1 -26.1 Other income came in lower-than-expected at | 5.3 crore
PBT 18.2 14.8 11.4 59.4 23.4 -22.1
Taxes 6.6 4.9 4.1 62.6 8.0 -17.1 Tax rate came in higher at 36%
PAT 11.6 9.9 7.4 57.7 15.4 -24.7
Key Metrics
Pumps Sales (| crore) 159 145 131 21.6 178 -10.6 Pumps sales for the quarter came in much ahead of our estimates at | 159
crore, up 21.6% YoY
Valves Sales (| crore) 41 27 27 52.6 32 27.2 The real surprise, however, was the valves segment wherein sales growth for
the quarter came in at 53% YoY with EBIT margins at 6.6%
Source: Company, ICICIdirect.com Research
Change in estimates
Consolidated CY19E
(| Crore) Old New % Change Old New % Change Introduced Comments
Revenues 884.1 885.7 0.2 980.4 981.1 0.1 1,087.4 Largely maintained our revenue estimates for CY17E-18E and introduced CY19E
estimates. We expect revenue to grow at a CAGR of 10.8% over CY17E-19E
EBITDA 106.0 106.8 0.8 136.1 131.3 -3.5 150.7
EBITDA Margin
(%)
12.0 12.1 7 bps 13.9 13.4 -50 bps 13.9 Incorporated the performance of 9MCY17 for CY17E estimates and revised
downward our estimates for CY18E. Introduced CY19E numbers
PAT 68.5 69.2 1.1 89.2 85.7 -3.9 99.1 Marginal revision in PAT estimates over CY17E-18E. Introduced CY19E
numbers
EPS (|) 19.7 19.9 1.1 25.6 24.6 -3.9 28.5
CY17E CY18E
Source: Company, ICICIdirect.com Research
Assumptions
CY13 CY14 CY15 CY16 CY17E CY18E CY19E CY17E CY18E Comments
Pump Sales 603.4 664.1 673.7 684.1 732.0 819.8 918.2 745.7 835.1 We expect pump sales at KSB to grow at a CAGR of 12% over
CY17-19E to | 918 crore in CY19E
Valve Sales 122.3 128.4 138.2 132.7 150.6 158.1 166.0 135.3 142.1 We expect valves sales at KSB to grow at a CAGR of 5% over
CY17-19E to | 166 crore in CY19E
PAT, MIL Control
Valves
9.6 6.6 4.6 4.9 5.4 6.2 7.2 5.4 6.2 We expect PAT at MIL to grow at a CAGR of 15% over CY17-19E
to | 7.2 crore in CY19E
EarlierCurrent
Source: Company, ICICIdirect.com Research

ICICI Securities Ltd | Retail Equity Research Page 3
Monsoon 2017 near normal at -5% of LPA
Early onset of rainfall on May 30 (usual onset date of June 1) coupled with
initial indicators like positive dipole movement in the Indian Ocean and
fading El Niño conditions in the Pacific Ocean led IMD to upgrade its initial
estimates (April 2017) from 96% of long period average (LPA) to 98% of
LPA (June 2017). Monsoon 2017 began with a bright and widespread
distribution across the country with rainfall in June coming in at +4% LPA
and July at +2% of LPA before fizzling out in August (-13% of LPA) and
September (-12% of LPA) to finally end the season at -5% of LPA.
Exhibit 1: Pan-India map (Monsoon 2017)
Source: Indian Meteorological Department (IMD), ICICIdirect.com Research
Despite general news flow, which speak of ~34% of districts pan India
receiving below normal monsoon in 2017 and consequent hit on rural
income, it should be pointed out that a similar situation also existed last
year (33% of districts receiving below normal rainfall) amid normal
monsoon conditions (-3% of LPA) leading to record 9% increase in
foodgrain production that ended at 138.5 million tonne (MT). Thus, we
expect the impact of near normal monsoon 2017 to be limited on farm
income and consequent rural demand. Also, reinforcing our view is high
irrigation penetration in key rainfall deficient agrarian states like Punjab
(99%), Haryana (86%) & Uttar Pradesh (76%). Further, reinforcing our
belief is robust two-wheeler & tractor sales in September 2017, which
rose 9% & 36%, respectively, partly due to re-stocking post GST and
partly due to underlying healthy demand prospects in the rural market.
Normal monsoons are significant, more so domestically, as
~55% of the Indian population is still dependent on agriculture
for livelihood amid ~45% irrigation penetration pan India
On the spatial distribution front, monsoon 2017 was normal in
the southern (at par with LPA) & eastern (-4% of LPA) part of
the country and below normal in northern (-10% of LPA) &
central (-6% of LPA) India
Initial foodgrain production numbers have already been
released by the central government. Kharif production is
expected to decline ~3% (on a higher base) to 134.7 MT

ICICI Securities Ltd | Retail Equity Research Page 4
Company Analysis
KSB Pumps, promoted by KSB AG (Germany), was established in 1960. It
set up a pump manufacturing facility at Pimpri, Pune (Maharashtra). The
company has been at the forefront of importing technology from its
parent for delivering cutting edge, high quality products in the domestic
market. Globally, KSB AG is one of the largest pump manufacturers with
sales in excess of €2.2 billion (~US$2.8 billion) out of the total pump
market, which is pegged at US$47 billion as of 2014. In India, KSB
supplies pumps and valves to all major industries viz. power, waste water
treatment, irrigation (agriculture), chemicals, etc. KSB’s products are used
for pumping, transportation and flow control of fluids, which include clean
or contaminated water, explosive fluids, corrosive and viscous fluids,
slurries and fluid/solid mixtures. In India, the company has a wide
distribution network that includes four zonal offices, 15 branch offices,
over 800 authorised dealers, four service stations, 110 authorised service
centres and 22 warehouses.
Indian pump market on strong footing
As per industry sources, the global pump market size is pegged at US$47
billion as of 2014 and is expected to reach US$56 billion in 2017, growing
at a CAGR of 6.0% in CY14-17E. The Indian pump market size is pegged
at ~| 8500 crore as of 2014 wherein a majority of it i.e. ~95% (~| 8000
crore) consists of centrifugal pumps (pumps used for increasing the flow
rate) while the remaining i.e. 5% (~| 500 crore) comprises positive
displacement pumps (pumps used for maintaining the flow rate). The
Indian pump market is expected to grow at a CAGR of 10% in FY14-17E
to | 11300 crore in FY17E.
The Indian pump market can also be segregated on the basis of end
usage. The main sectors in which pumps are used include: agriculture
(irrigation), building services, waste water/sewage management and
industrial uses (power, oil & gas, metals & mining, etc).
Exhibit 2: Indian pumps market segregation (value)
others, | 1105 cr,
13%
Metals & Mining, |
340 cr, 4%
Oil & Gas,| 680 cr,
8%
Power Generation, |
1020 cr, 12%
Water & Wastewater
, | 1445 cr, 17%
Building Services, |
1615 cr, 19%
Agriculture, | 2295
cr, 27%
Source: FICCI, Tata Strategic Management Group, ICICIdirect.com Research
Out of the above, agriculture and building services comprise the major
portion (46%) of the market by value i.e. ~| 4000 crore. This segment of
the pump market is highly fragmented and competitive in nature with a
whole lot of small & medium enterprises (SMEs) vying for the market pie.
On the other hand, the industrial sector constitutes the remaining 54% of
the market, which is pegged at ~| 4500 crore. It consists of sectors like
water/sewage treatment, power generation, oil & gas and metals &
mining. This segment of the pump market is technologically intensive and
hard for SMEs to penetrate. Companies like KSB and Kirloskar Brothers
are leaders in this segment in the listed space while ITT and Flowserve
are key players from the private space.
CAGR over 2014-17E: 6%
Global pumps market
47
56
40
45
50
55
60
2014 2017E
US
$ B
illion
Source: Ficci, TSMG, ICICIdirect.com Research
Indian pumps market
8500
11300
0
2000
4000
6000
8000
10000
12000
FY14 FY17E
| c
rore
Source: Ficci, TSMG, ICICIdirect.com Research
CAGR over 2014-17E: 6%
CAGR over FY14-17E: 10%

ICICI Securities Ltd | Retail Equity Research Page 5
Working capital discipline - strong positive
The working capital management of KSB is one of the best in the industry
wherein its net working capital days are well below 60 days whereas
majority of the industry players have working capital days at ~120 days.
In CY16, KSB’s net working capital days were comfortably at 52 days.
Exhibit 3: Net working capital days (KSB India)
85
68
42
54
44
5250 50 50
0
10
20
30
40
50
60
70
80
90
CY11
CY12
CY13
CY14
CY15
CY16
CY17E
CY18E
CY19E
days
Source: Company, ICICIdirect.com Research
Going forward, we have maintained the net working capital days of KSB
at 50 days over CY17E-19E. The working capital is likely to be controlled
as it has no exposure to the project/EPC business while the
management’s focus is on scaling up the product basket.
Valves segment; calibrated approach - chasing profitability not growth
KSB is also one of the leading manufacturers of industrial valves and
manufactures a wide range of on/off valves. Sales from the valve segment
have largely been flat over CY10-16 at | 133 crore in CY16 (| 103 crore in
CY08). On the profitability front, its EBIT margins are on a declining trend
with EBIT margins declining to negative 1.3% in CY14, a sharp drop from
the peak EBIT margins realised in CY11 at 11.2%. Despite being a reliable
brand in the valves market, the company’s profitability in this segment is
subdued due to the enhanced presence of the unorganised segment,
thereby resulting in fierce competition.
Exhibit 4: Valves segmental revenue, EBIT & EBIT % (Annual)
103
141
146
122
128
138
133
5.2
15.8
16
2
-2
8 1
5.0
11.2 10.9
1.6
-1.3
6.1
0.6
-20
0
20
40
60
80
100
120
140
160
CY10 CY11 CY12 CY13 CY14 CY15 CY16
| c
rore
-2
0
2
4
6
8
10
12
%
Sales EBIT EBIT %
Source: Company, ICICIdirect.com Research
The profitability in the valves segment during CY16 remained under
pressure as EBIT margins were a meagre 0.6% during the year. The
performance of this division is, however, quite volatile with company
reporting loss at the EBIT level in Q2CY17 vs. positive EBIT in previous
quarter. In Q3CY17, however, it reported EBIT margins of 6.6%. Going
forward, we expect valves sales to grow at a CAGR of 5% in CY17-19E to
| 166 crore in CY19E (|151 crore in CY17E).
Valves segment sales
138 133
151158
166
0
50
100
150
200
CY15 CY16 CY17E CY18E CY19E
| c
rore
Source: Company, ICICIdirect.com Research

ICICI Securities Ltd | Retail Equity Research Page 6
MIL Controls: Feather in the cap; small but key player
MIL Controls (MIL) is an associate company of KSB (ownership share
49%) and a subsidiary of the parent i.e. KSB AG (ownership share 51%)
involved in manufacturing high precision critical industrial control valves
in India. These valves find application in thermal & nuclear power plants,
exploration & production of oil, gas & oil products (petrochemicals) and
chemical industry (process industry), including fertilisers. KSB had made
an initial investment worth | 6.3 crore in MIL and is reaping rich returns
out of it. MIL’s contribution to KSB’s consolidated PAT in CY16 came in at
| 4.9 crore (78% RoI in CY16). We believe MIL, even though small, will
remain key and be a feather in KSB’s cap, going forward.
Exhibit 5: Financials- MIL
Particulars Units CY09 CY10 CY12 CY13 CY14 CY15
Net Sales | crore 77.1 95.2 137.3 132.6 118.0 117.8
EBITDA | crore 22.8 29.9 36.7 35.5 13.2 6.2
EBITDA Margin % 29.6 31.4 26.8 26.8 11.1 5.3
PAT | crore 13.8 18.5 22.6 21.0 15.3 10.7
PAT margins (%) % 17.9 19.4 16.5 15.8 13.0 9.1
Gross Block | crore 26.0 32.2 42.0 66.4 71.3 73.8
Asset Turnover x 3.0 3.0 3.3 2.0 1.7 1.6
Equity | crore 41.3 50.5 73.0 81.5 89.2 94.4
Debt | crore 0.0 0.0 0.0 0.0 0.0 0.0
ROCE % 51.6 61.6 44.7 39.6 0.0 0.0
ROE % 33.3 40.2 31.0 27.1 0.0 0.0
Source: Capitaline, ICICIdirect.com Research
Going forward, we build in 15% CAGR (CY17-19E) in its PAT contribution
to the consolidated numbers of KSB. We build in KSB’s share of PAT from
MIL at | 5.4 crore, | 6.2 crore & | 7.2 crore in CY17E, CY18E and CY19E
respectively. PAT in CY16 stood at | 4.9 crore.
Pump manufacturing facility for super critical power plants, essential step
in right direction!
The company is currently on the brink of commissioning its ambitious
capex programme wherein KSB intends to incur a capex of ~| 250 crore
in phases to set up of a manufacturing facility to manufacture pumps for
super critical power plants. KSB has already incurred a capex amounting
to ~| 25 crore as land cost for the same and expects to incur another
| 50-60 crore as the capex (plant & machinery) for the first phase of the
project in CY17E. The commencement of the first phase is expected in
H2CY17E. These products will be manufactured by the company as a part
of the "Make in India" initiative under a technology transfer and license
agreement with KSB AG, Germany.

ICICI Securities Ltd | Retail Equity Research Page 7
Consolidated revenues to grow at 10.8% CAGR in CY17E-19E
We expect KSB to clock modest revenue growth of 10.8% CAGR in CY17-
19E to | 1087 crore in CY18E (| 886 crore in CY17E). In the pumps
segment, revenues are expected to grow a CAGR of 12% in CY17E-19E to
| 918 crore in CY19E (| 732 crore in CY17E), primarily on the back of a
revival in industrial activity and increase in irrigation penetration
domestically. In the valves segment, sales are expected to grow at a
CAGR of 5% in CY17E-19E to | 166 crore in CY19E (| 151 crore in CY17E).
Exhibit 6: Consolidated revenue trend
821 828
886
981
1087
400
500
600
700
800
900
1000
1100
1200
CY15 CY16 CY17E CY18E CY19E
| c
rore
Source: Company, ICICIdirect.com Research
Exhibit 7: Revenue bifurcation (pumps vs. valves)
674 684732
820
918
138 133 151 158 166
0
200
400
600
800
1000
CY15 CY16 CY17E CY18E CY19E
| c
rore
Pumps Valves
Source: Company, ICICIdirect.com Research
Consolidated EBITDA, PAT to grow at 18.8%, 19.6% CAGR in CY17-19E
We expect consolidated EBITDA to grow at 18.8% CAGR in CY17-19E to
| 151 crore in CY19E, primarily on the back of an improvement in EBITDA
margins amounting to 180 bps over CY17-18E. EBITDA margins are
expected to improve from 12.1% in CY17E to 13.9% in CY19E. EBITDA
margins are expected to improve on the back of a revival of domestic
pumps demand with consequent benefits of operating leverage kicking in
for KSB. We expect PAT to grow at 19.6% CAGR in CY17E-19E to | 99
crore in CY19E.
Exhibit 8: EBITDA & EBITDA margins (%) trend
106
99
107 131 151
12.9
12.0
12.1
13.4
13.9
0
20
40
60
80
100
120
140
160
CY15 CY16 CY17E CY18E CY19E
| c
rore
11
11
12
12
13
13
14
14
15
%
EBITDA EBITDA Margins
Source: Company, ICICIdirect.com Research
Exhibit 9: PAT trend
6965
69
86
99
0
20
40
60
80
100
CY15 CY16 CY17E CY18E CY19E
| c
rore
Source: Company, ICICIdirect.com Research
CY17E-19E CAGR: 10.8% Pumps: CY17-19E CAGR: 12%
Valves: CY17-19E CAGR: 5%

ICICI Securities Ltd | Retail Equity Research Page 8
Outlook and valuation
KSB is a technology driven organisation with support from parent group
i.e. KSB AG. It also has a healthy balance sheet with surplus cash on the
books. Being present only in the product business (not EPC) it witnessed
efficient working capital cycle of ~50 days. It also realises healthy core
RoICs of ~15%+. On the pumps division front, KSB realises ~35% of
sales from standard (product) pumps segment which are used in
agriculture. With the government’s thrust in augmenting the irrigation
penetration domestically using energy efficient (star rated) pumps, the
outlook for this segment is robust. KSB realises the rest ~65% of sales
from the engineered pumps segment. Incremental capex execution by
downstream oil & gas companies for upgradation of refineries provides a
robust outlook for the engineered pumps segment. On a consolidated
basis, we model sales, PAT CAGR of 10.8%, 19.6%, respectively, in CY17-
19E. We model a 180 bps improvement in EBITDA margins in the
aforesaid period. We value KSB at 35x P/E on CY19E EPS of | 28.5. We
arrive at a target price of | 1000 with a BUY rating on the stock.
Exhibit 10: Two year forward P/E (KSB currently trading at 30.5x)
0
200
400
600
800
1000
1200
1400
Apr-07
Jan-08
Oct-08
Jul-09
Apr-10
Jan-11
Oct-11
Jul-12
Apr-13
Jan-14
Oct-14
Jul-15
Apr-16
Jan-17
Oct-17
(|
)
Price 43x 34x 26x 21x 17x 13x 9x
Source: Reuters, ICICIdirect.com Research
ICICI Securities Ltd | Retail Equity Research Page 9
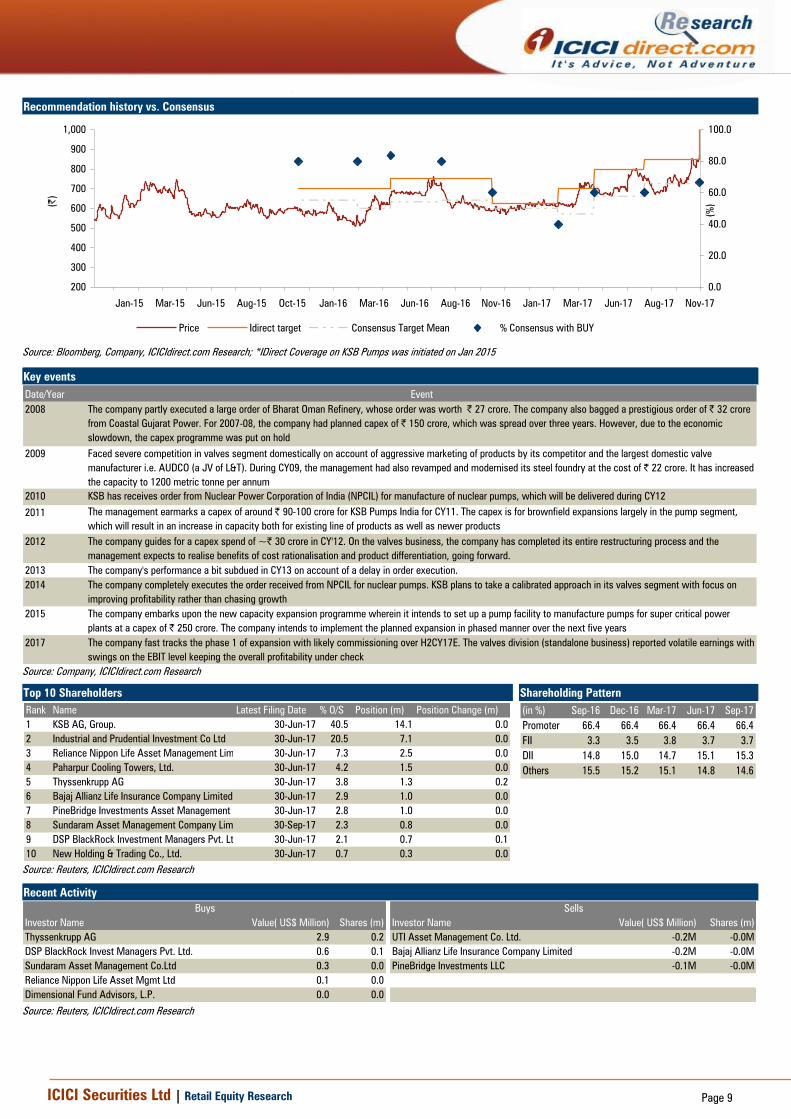
Recommendation history vs. Consensus
200
300
400
500
600
700
800
900
1,000
Nov-17Aug-17Jun-17Mar-17Jan-17Nov-16Aug-16Jun-16Mar-16Jan-16Oct-15Aug-15Jun-15Mar-15Jan-15
(|
)
0.0
20.0
40.0
60.0
80.0
100.0
(%
)
Price Idirect target Consensus Target Mean % Consensus with BUY
Source: Bloomberg, Company, ICICIdirect.com Research; *IDirect Coverage on KSB Pumps was initiated on Jan 2015
Key events
Date/Year Event
2008 The company partly executed a large order of Bharat Oman Refinery, whose order was worth | 27 crore. The company also bagged a prestigious order of | 32 crore
from Coastal Gujarat Power. For 2007-08, the company had planned capex of | 150 crore, which was spread over three years. However, due to the economic
slowdown, the capex programme was put on hold
2009 Faced severe competition in valves segment domestically on account of aggressive marketing of products by its competitor and the largest domestic valve
manufacturer i.e. AUDCO (a JV of L&T). During CY09, the management had also revamped and modernised its steel foundry at the cost of | 22 crore. It has increased
the capacity to 1200 metric tonne per annum
2010 KSB has receives order from Nuclear Power Corporation of India (NPCIL) for manufacture of nuclear pumps, which will be delivered during CY12
2011 The management earmarks a capex of around | 90-100 crore for KSB Pumps India for CY11. The capex is for brownfield expansions largely in the pump segment,
which will result in an increase in capacity both for existing line of products as well as newer products
2012 The company guides for a capex spend of ~| 30 crore in CY'12. On the valves business, the company has completed its entire restructuring process and the
management expects to realise benefits of cost rationalisation and product differentiation, going forward.
2013 The company's performance a bit subdued in CY13 on account of a delay in order execution.
2014 The company completely executes the order received from NPCIL for nuclear pumps. KSB plans to take a calibrated approach in its valves segment with focus on
improving profitability rather than chasing growth
2015 The company embarks upon the new capacity expansion programme wherein it intends to set up a pump facility to manufacture pumps for super critical power
plants at a capex of | 250 crore. The company intends to implement the planned expansion in phased manner over the next five years
2017 The company fast tracks the phase 1 of expansion with likely commissioning over H2CY17E. The valves division (standalone business) reported volatile earnings with
swings on the EBIT level keeping the overall profitability under check
Source: Company, ICICIdirect.com Research
Top 10 Shareholders Shareholding Pattern
Rank Name Latest Filing Date % O/S Position (m) Position Change (m)
1 KSB AG, Group. 30-Jun-17 40.5 14.1 0.0
2 Industrial and Prudential Investment Co Ltd 30-Jun-17 20.5 7.1 0.0
3 Reliance Nippon Life Asset Management Limited 30-Jun-17 7.3 2.5 0.0
4 Paharpur Cooling Towers, Ltd. 30-Jun-17 4.2 1.5 0.0
5 Thyssenkrupp AG 30-Jun-17 3.8 1.3 0.2
6 Bajaj Allianz Life Insurance Company Limited 30-Jun-17 2.9 1.0 0.0
7 PineBridge Investments Asset Management Company (India) Private Limited 30-Jun-17 2.8 1.0 0.0
8 Sundaram Asset Management Company Limited 30-Sep-17 2.3 0.8 0.0
9 DSP BlackRock Investment Managers Pvt. Ltd. 30-Jun-17 2.1 0.7 0.1
10 New Holding & Trading Co., Ltd. 30-Jun-17 0.7 0.3 0.0
(in %) Sep-16 Dec-16 Mar-17 Jun-17 Sep-17
Promoter 66.4 66.4 66.4 66.4 66.4
FII 3.3 3.5 3.8 3.7 3.7
DII 14.8 15.0 14.7 15.1 15.3
Others 15.5 15.2 15.1 14.8 14.6
Source: Reuters, ICICIdirect.com Research
Recent Activity
Investor Name Value( US$ Million) Shares (m) Investor Name Value( US$ Million) Shares (m)
Thyssenkrupp AG 2.9 0.2 UTI Asset Management Co. Ltd. -0.2M -0.0M
DSP BlackRock Invest Managers Pvt. Ltd. 0.6 0.1 Bajaj Allianz Life Insurance Company Limited -0.2M -0.0M
Sundaram Asset Management Co.Ltd 0.3 0.0 PineBridge Investments LLC -0.1M -0.0M
Reliance Nippon Life Asset Mgmt Ltd 0.1 0.0
Dimensional Fund Advisors, L.P. 0.0 0.0
Buys Sells
Source: Reuters, ICICIdirect.com Research

ICICI Securities Ltd | Retail Equity Research Page 10
Financial summary (Consolidated)
Profit and loss statement | Crore
(Year-end March) CY16 CY17E CY18E CY19E
Net Sales 817.6 885.7 981.1 1087.4
Other Operating Income 10.3 0.0 0.0 0.0
Total Operating Income 827.9 885.7 981.1 1087.4
Growth (%) 0.9 7.0 10.8 10.8
Raw Material Expenses 387.2 419.2 459.7 509.6
Employee Expenses 144.9 148.1 160.2 177.6
Other Operating Expense 196.8 211.7 229.8 249.4
Total Operating Expenditure 728.8 778.9 849.7 936.7
EBITDA 99.1 106.8 131.3 150.7
Growth (%) -6.5 7.8 23.0 14.7
Depreciation 29.4 31.1 35.3 38.3
Interest 1.7 3.5 0.8 0.8
Other Income 24.0 23.7 24.2 26.5
PBT 92.0 95.9 119.5 138.2
Exceptional Item 0.0 0.0 0.0 0.0
Total Tax 31.6 32.1 40.0 46.3
PAT 60.4 63.8 79.4 91.9
Profit from Associates 4.9 5.4 6.2 7.2
Reported Net Profit 65.3 69.2 85.7 99.1
Growth (%) -5.8 5.7 24.5 15.7
EPS (|) 18.8 19.9 24.6 28.5
Source: Company, ICICIdirect.com Research
Cash flow statement | Crore
(Year-end March) CY16 CY17E CY18E CY19E
Profit after Tax 65.3 69.2 85.7 99.1
Add: Depreciation 29.4 31.1 35.3 38.3
(Inc)/dec in Current Assets -56.1 5.8 -49.9 -59.6
Inc/(dec) in CL and Provisions 15.8 17.5 33.7 44.0
Others 1.7 3.5 0.8 0.8
CF from operating activities 56.1 127.0 105.5 122.5
(Inc)/dec in Investments -2.7 -2.4 -3.2 3.0
(Inc)/dec in Fixed Assets -56.4 -70.0 -70.0 -30.0
Others -2.4 0.0 0.0 0.0
CF from investing activities -61.5 -72.4 -73.2 -27.0
Issue/(Buy back) of Equity 0.0 0.0 0.0 0.0
Inc/(dec) in loan funds 3.9 0.0 0.0 0.0
Dividend paid & dividend tax -23.0 -25.1 -27.2 -29.2
Inc/(dec) in Share Cap 0.0 0.0 0.0 0.0
Others -1.7 -3.5 -0.8 -0.8
CF from financing activities -20.8 -28.5 -27.9 -30.0
Net Cash flow -26.2 26.0 4.3 65.5
Opening Cash 228.4 202.1 228.2 232.5
Closing Cash 202.1 228.2 232.5 298.0
Source: Company, ICICIdirect.com Research
Balance sheet | Crore
(Year-end March) CY16 CY17E CY18E CY19E
Liabilities
Equity Capital 34.8 34.8 34.8 34.8
Reserve and Surplus 610.3 654.4 713.0 782.8
Total Shareholders funds 645.1 689.3 747.8 817.6
Total Debt 5.2 5.2 5.2 5.2
Deferred Tax Liability 0.0 0.0 0.0 0.0
Minority Interest / Others 7.5 7.5 7.5 7.5
Total Liabilities 657.8 702.0 760.5 830.4
Assets
Gross Block 462.6 572.6 602.6 672.6
Less: Acc Depreciation 281.5 312.5 347.8 386.0
Net Block 181.1 260.1 254.8 286.6
Capital WIP 54.0 14.0 54.0 14.0
Total Fixed Assets 235.1 274.1 308.8 300.6
Liquid Investments 0.0 0.0 0.0 0.0
Other Investments 54.1 56.5 59.8 56.8
Goodwill on Consolidation 0.0 0.0 0.0 0.0
Inventory 211.9 218.4 241.9 268.1
Debtors 180.1 194.1 215.0 238.3
Loans and Advances 109.1 83.3 88.3 97.9
Other Current Assets 4.9 4.4 4.9 5.4
Cash 202.1 228.2 232.5 298.0
Total Current Assets 708.1 728.4 782.6 907.7
Creditors 275.0 291.2 322.5 357.5
Provisions 80.3 81.5 83.9 92.9
Current Liabilities & Prov 355.3 372.7 406.4 450.4
Net Current Assets 352.9 355.6 376.2 457.3
Others Assets 15.7 15.7 15.7 15.7
Application of Funds 657.8 702.0 760.5 830.4
Source: Company, ICICIdirect.com Research
Key ratios
(Year-end March) CY16 CY17E CY18E CY19E
Per share data (|)
EPS 18.8 19.9 24.6 28.5
Cash EPS 27.2 28.8 34.7 39.5
BV 185.3 198.0 214.8 234.9
DPS 5.5 6.0 6.5 7.0
Cash Per Share (Incl Invst) 58.1 65.5 66.8 85.6
Operating Ratios (%)
EBITDA Margin 12.0 12.1 13.4 13.9
PBT / Total Op. income 11.1 10.8 12.2 12.7
PAT Margin 7.9 7.8 8.7 9.1
Inventory days 94.6 90.0 90.0 90.0
Debtor days 80.4 80.0 80.0 80.0
Creditor days 122.7 120.0 120.0 120.0
Return Ratios (%)
RoE 10.1 10.0 11.5 12.1
RoCE 10.6 10.8 12.6 13.5
RoIC 18.1 17.1 21.0 22.4
Valuation Ratios (x)
P/E 45.3 42.7 34.5 29.9
EV / EBITDA 27.9 25.6 20.8 17.7
EV / Net Sales 3.4 3.1 2.8 2.5
Market Cap / Sales 3.6 3.3 3.0 2.7
Price to Book Value 4.6 4.3 4.0 3.6
Solvency Ratios
Debt/EBITDA 0.1 0.0 0.0 0.0
Debt / Equity 0.0 0.0 0.0 0.0
Current Ratio 1.4 1.3 1.4 1.4
Quick Ratio 0.8 0.8 0.8 0.8
Source: Company, ICICIdirect.com Research

ICICI Securities Ltd | Retail Equity Research Page 11
RATING RATIONALE
ICICIdirect.com endeavours to provide objective opinions and recommendations. ICICIdirect.com assigns
ratings to its stocks according to their notional target price vs. current market price and then categorises them
as Strong Buy, Buy, Hold and Sell. The performance horizon is two years unless specified and the notional
target price is defined as the analysts' valuation for a stock.
Strong Buy: >15%/20% for large caps/midcaps, respectively, with high conviction;
Buy: >10%/15% for large caps/midcaps, respectively;
Hold: Up to +/-10%;
Sell: -10% or more;
Pankaj Pandey Head – Research [email protected]
ICICIdirect.com Research Desk,
ICICI Securities Limited,
1st Floor, Akruti Trade Centre,
Road No 7, MIDC,
Andheri (East)
Mumbai – 400 093

ICICI Securities Ltd | Retail Equity Research Page 12
ICICIdirect.com Research Desk,
ICICI Securities Limited,
1st Floor, Akruti Trade Centre,
Road No 7, MIDC,
Andheri (East)
Mumbai – 400 093
ANALYST CERTIFICATION
We /I, Chirag Shah PGDBM; Shashank Kanodia CFA MBA (Capital Markets), Research Analysts, authors and the names subscribed to this report, hereby certify that all of the views expressed in this
research report accurately reflect our views about the subject issuer(s) or securities. We also certify that no part of our compensation was, is, or will be directly or indirectly related to the specific
recommendation(s) or view(s) in this report.
Terms & conditions and other disclosures:
ICICI Securities Limited (ICICI Securities) is a full-service, integrated investment banking and is, inter alia, engaged in the business of stock brokering and distribution of financial products. ICICI Securities
Limited is a Sebi registered Research Analyst with Sebi Registration Number – INH000000990. ICICI Securities is a wholly-owned subsidiary of ICICI Bank which is India’s largest private sector bank and has
its various subsidiaries engaged in businesses of housing finance, asset management, life insurance, general insurance, venture capital fund management, etc. (“associates”), the details in respect of whic h
are available on www.icicibank.com.
ICICI Securities is one of the leading merchant bankers/ underwriters of securities and participate in virtually all securities trading markets in India. We and our associates might have investment banking
and other business relationship with a significant percentage of companies covered by our Investment Research Department. ICICI Securities generally prohibits its analysts, persons reporting to analysts
and their relatives from maintaining a financial interest in the securities or derivatives of any companies that the analysts cover.
The information and opinions in this report have been prepared by ICICI Securities and are subject to change without any notice. The report and information contained herein is strictly confidential and
meant solely for the selected recipient and may not be altered in any way, transmitted to, copied or distributed, in part or in whole, to any other person or to the media or reproduced in any form, without
prior written consent of ICICI Securities. While we would endeavour to update the information herein on a reasonable basis, ICICI Securities is under no obligation to update or keep the information current.
Also, there may be regulatory, compliance or other reasons that may prevent ICICI Securities from doing so. Non-rated securities indicate that rating on a particular security has been suspended
temporarily and such suspension is in compliance with applicable regulations and/or ICICI Securities policies, in circumstances where ICICI Secur ities might be acting in an advisory capacity to this
company, or in certain other circumstances.
This report is based on information obtained from public sources and sources believed to be reliable, but no independent verification has been made nor is its accuracy or completeness guaranteed. This
report and information herein is solely for informational purpose and shall not be used or considered as an offer document or solicitation of offer to buy or sell or subscribe for securities or other financial
instruments. Though disseminated to all the customers simultaneously, not all customers may receive this report at the same time. ICICI Securities will not treat recipients as customers by virtue of their
receiving this report. Nothing in this report constitutes investment, legal, accounting and tax advice or a representation that any investment or strategy is suitable or appropriate to your specific
circumstances. The securities discussed and opinions expressed in this report may not be suitable for all investors, who must make their own investment decisions, based on their own investment
objectives, financial positions and needs of specific recipient. This may not be taken in substitution for the exercise of independent judgment by any recipient. The recipient should independently evaluate
the investment risks. The value and return on investment may vary because of changes in interest rates, foreign exchange rates or any other reason. ICICI Securities accepts no liabilities whatsoever for any
loss or damage of any kind arising out of the use of this report. Past performance is not necessarily a guide to future performance. Investors are advised to see Risk Disclosure Document to understand the
risks associated before investing in the securities markets. Actual results may differ materially from those set forth in projections. Forward-looking statements are not predictions and may be subject to
change without notice.
ICICI Securities or its associates might have managed or co-managed public offering of securities for the subject company or might have been mandated by the subject company for any other assignment
in the past twelve months.
ICICI Securities or its associates might have received any compensation from the companies mentioned in the report during the period preceding twelve months from the date of this report for services in
respect of managing or co-managing public offerings, corporate finance, investment banking or merchant banking, brokerage services or other advisory service in a merger or specific transaction.
ICICI Securities or its associates might have received any compensation for products or services other than investment banking or merchant banking or brokerage services from the companies mentioned
in the report in the past twelve months.
ICICI Securities encourages independence in research report preparation and strives to minimize conflict in preparation of research report. ICICI Securities or its associates or its analysts did not receive any
compensation or other benefits from the companies mentioned in the report or third party in connection with preparation of the research report. Accordingly, neither ICICI Securities nor Research Analysts
and their relatives have any material conflict of interest at the time of publication of this report.
It is confirmed that Chirag Shah PGDBM; Shashank Kanodia CFA MBA (Capital Markets) Research Analysts of this report have not received any compensation from the companies mentioned in the report
in the preceding twelve months.
Compensation of our Research Analysts is not based on any specific merchant banking, investment banking or brokerage service transactions.
ICICI Securities or its subsidiaries collectively or Research Analysts or their relatives do not own 1% or more of the equity securities of the Company mentioned in the report as of the last day of the month
preceding the publication of the research report.
Since associates of ICICI Securities are engaged in various financial service businesses, they might have financial interests or beneficial ownership in various companies including the subject
company/companies mentioned in this report.
It is confirmed that Chirag Shah PGDBM; Shashank Kanodia CFA MBA (Capital Markets), Research Analysts do not serve as an officer, director or employee of the companies mentioned in the report.
ICICI Securities may have issued other reports that are inconsistent with and reach different conclusion from the information presented in this report.
Neither the Research Analysts nor ICICI Securities have been engaged in market making activity for the companies mentioned in the report.
We submit that no material disciplinary action has been taken on ICICI Securities by any Regulatory Authority impacting Equity Research Analysis activities.
This report is not directed or intended for distribution to, or use by, any person or entity who is a citizen or resident of or located in any locality, state, country or other jurisdiction, where such distribution,
publication, availability or use would be contrary to law, regulation or which would subject ICICI Securities and affiliates to any registration or licensing requirement within such jurisdiction. The securities
described herein may or may not be eligible for sale in all jurisdictions or to certain category of investors. Persons in whose possession this document may come are required to inform themselves of and
to observe such restriction.