Narayankrupa Krupal Residential Project Haritage Prahalad Nagar Ahmedabad - 09811022205

Please refer to important disclosures at the end of this report
Equity Research October 5, 2017
ICICI Securities Limited is the author and distributor of this report
Top picks
Shree Cement
UltraTech Cement
Ambuja Cement
Ramco Cement
Cement
Cost escalations to impact profitability
Research Analysts:
Krupal Maniar, CFA [email protected] +91 22 6637 7254
Dharmesh Shah [email protected] +91 22 6637 7480
Cement companies under our coverage are likely to report average EBITDA/te decline of ~Rs100/te YoY and ~Rs240/te QoQ mainly led by cost escalations which could not be passed-on owing to seasonality. Total costs/te are expected to be up by 3-4% YoY and QoQ led by price increases in pet coke, diesel, slag, packing material etc. Average realisations are likely to be down ~4% QoQ in South and 2-3% QoQ in most other regions. On a YoY basis, realisations are expected to be up ~10% in West region, flat in South, and up ~2% in most other regions. Sand mining issues in Uttar Pradesh & Bihar and continued muted demand in Tamil Nadu impacted overall demand growth during Q2FY18. We estimate industry volumes to be up 4-5% YoY led by better demand in North, West and East regions. We believe news flow on volumes and prices would improve meaningfully over the next few months as construction activities resume post monsoon / festive season. Given the current low utilisation rate at ~70%, we believe peak EBITDA/te is unlikely to be realised any time before FY21-FY22E and the same is yet to be discounted. Any correction in cement stocks would be an opportunity to accumulate, in our view. SRCM, UTCEM, ACEM and TRCL remain our preferred picks in the sector.
Industry volumes likely up 4-5% YoY, implying utilisations of 64% - broadly flat
YoY. Volumes in South region are likely to be flat YoY as strong volume growth in
Andhra Pradesh / Telangana is offset by volumes decline in other southern states.
Rest of the regions have likely grown in mid-single digit YoY during Q2FY18. SRCM /
ACEM / DBEL / JKCE / JKLC are expected to report high single / low double-digit
volume growth. We factor low-single digit volume growth for UTCEM on an organic
basis and 19% YoY growth including that of JPA’s assets. While ACC is expected to
report mid-teen volume growth; ICEM / TRCL should report muted volume growth.
Average EBITDA/te likely down ~11% YoY / ~22% QoQ to Rs832/te. Average pan
India realisation is likely to be up ~1-2% YoY / down ~2-3% QoQ. Total costs/te is
expected to be up 3-4% YoY and QoQ led by price increases in pet coke, diesel, slag,
packing material etc (on YoY basis) and due to poor operating leverage in seasonally
weak quarter (on QoQ basis). Average EBITDA/te including other operating income
and government incentives for companies under our coverage is expected to decline
~Rs100/te YoY and ~Rs240/te QoQ.
Q2FY18 result picks: ACC (ADD), ACEM (BUY) and JKCE (BUY) are expected to
report healthy 18-28% YoY EBITDA growth during Q2FY18.
Quarterly summary
Company Sales EBITDA# PAT
JAS ’17*
% chg
JAS ’17*
% chg
JAS ’17*
% chg
(Rs mn) (YoY) (QoQ) (YoY) (QoQ) (YoY) (QoQ)
UTCEM^ 64,245 19.0 (1.7) 12,179 5.5 (21.9) 3,548 (41.0) (60.2)
ACC 28,645 15.8 (13.5) 3,486 27.4 (45.3) 1,441 75.7 (55.8)
ACEM^ 22,797 13.7 (19.3) 3,879 28.0 (40.4) 2,749 58.0 (29.9)
SRCM 21,572 7.5 (14.9) 5,257 (25.0) (26.2) 2,846 (48.0) (35.3)
DBEL 18,800 11.7 (8.7) 4,334 3.0 (22.1) 595 91.2 (63.7)
ICEM^ 12,630 NM (2.1) 1,749 NM (8.3) 185 NM (30.2)
TRCL 9,920 (2.0) (2.4) 2,620 (25.8) (9.8) 1,353 (34.6) (13.1)
JKCE 10,570 16.0 2.7 1,871 17.7 (5.4) 627 53.3 (21.0)
JKLC 7,367 12.4 (18.2) 792 (15.4) (34.2) 52 (79.1) (81.6)
ORCMNT 5,082 32.3 (10.6) 641 286.5 (45.2) 19 NM (95.2)
PRSC^ 12,167 4.2 (8.1) 634 9.7 (41.8) (143) (32.6) (185.9)
Total 213,794 13.5 (8.6) 37,443 (0.4) (27.2) 13,270 (22.9) (48.1)
*JAS: July-August-September’17; ^standalone; #including other operating income; Source: I-Sec research
INDIA

Cement ICICI Securities
2
Company-wise key highlights of Q2FY18
UTCEM’s standalone EBITDA including that of JPA’s assets likely to
increase ~6% YoY to Rs12.2bn. Grey cement volumes including clinker
expected to be up 19% YoY to 13.0mnte, while blended EBITDA/te down 12%
YoY to Rs914/te.
SRCM’s EBITDA including other operating income is likely to decline 25%
YoY to Rs5.3bn as 11% YoY volume growth and 1.8% increase in realisation
more than offset sharp increase in petcoke prices, freight cost and significant poor
performance in power segment.
ACEM’s EBITDA is likely to increase 28% YoY to Rs3.9bn. We expect 10%
YoY increase in volumes and ~3.6% YoY increase in realisation which is partly
offset by 1.5% YoY increase in cost/te. ACEM is likely to report consolidated
revenues / EBITDA / PAT of Rs51.4bn / Rs7.4bn / Rs3.5bn, respectively.
ACC’s EBITDA is likely to increase 27% YoY to Rs3.5bn. We expect 17% YoY
increase in volumes led by capacity expansion in East and flat grey cement
realisation on YoY basis.
DBEL’s EBITDA is expected to increase by 3% YoY to Rs4.3bn as 9% YoY
increase in volumes and ~4.5% YoY increase in realisation (including other
operating income) is partly offset by 2.7% YoY increase in cost/te. Interest cost is
expected to increase owing to hedging cost / buyer’s credit. Besides, the company
may report US$4.5mn in damages over coal import deal.
TRCL’s EBITDA is likely to decline by 26% YoY to Rs2.6bn owing to 6.5% YoY
decline in realisation and 6.7% YoY increase in cost/te.
ICEM’s EBITDA is expected to decline by 8.3% QoQ to Rs1.7bn led by 4%
QoQ decline in realisation partly offset by 1% QoQ increase in volumes and 2%
QoQ decline in cost/te. YoY numbers are not comparable due to merger of
Trinetra Cement and Trishul Concrete w.e.f Q4FY17.
JKCE’s EBITDA is expected to increase by ~18% YoY to Rs1.9bn led by 12%
YoY increase in volumes and 3.7% YoY increase in blended realisation, partly
offset by 3.1% YoY increase in cost/te.
JKLC’s EBITDA is likely to decline by 15% YoY to Rs792mn as 10.4% YoY
increase in volumes and 1.8% YoY increase in realisation more than offset by 6%
YoY increase in cost/te.
ORCMNT’s EBITDA is likely to increase by ~4x YoY to Rs641mn led by 15%
YoY increase in volumes and realisation owing to significant price increase in
West region.
PRSC’s EBITDA is likely to increase by 10% YoY to Rs634mn. We expect
volumes and realisation to increase by 6% YoY / 2.5% YoY, respectively. We
expect TBK business to continue to post EBIT losses (though down YoY and QoQ
basis) owing to weak operating performance.

Cement ICICI Securities
3
Table 1: Valuation summary
Company Reco Target Price
P/E (x) EV/EBITDA (x) EV/te (US$)
FY18E FY19E FY20E FY18E FY19E FY20E FY18E FY19E FY20E
UTCEM BUY 4,775 36.1 27.1 19.2 17.9 13.7 10.4 218 200 177 ACC* ADD 1,940 36.4 26.6 21.6 15.7 12.3 10.3 134 130 126 ACEM* BUY 310 36.7 26.3 21.7 16.7 12.7 10.6 159 155 151 SRCM BUY 21,850 37.7 28.3 22.0 22.3 17.1 13.1 309 259 226 DBEL ADD 2,885 41.0 29.1 22.3 14.0 12.0 10.3 196 183 170 TRCL BUY 800 25.0 21.2 17.1 14.7 12.9 10.3 191 177 147 JKCE BUY 1,220 20.8 15.7 12.0 10.5 8.8 7.3 126 123 119 ICEM ADD 225 23.0 15.3 11.9 9.0 7.4 6.3 85 82 78 JKLC BUY 530 27.7 15.0 9.9 11.7 8.2 6.1 84 79 73 ORCMNT ADD 180 23.1 14.4 10.3 9.9 7.7 6.0 85 81 76 PRSC ADD 130 46.1 25.7 16.4 12.0 9.3 7.2 132 119 105 GRASIM ADD 1,165 15.6 12.3 9.5 8.2 6.2 4.7 - - -
*December ending CY17E, CY18E, CY19E; Source: I-Sec research Note: We are not changing any reco, target and estimates in this report. We will review each stock individually after the quarterly results.
Table 2: Stock price performance
(%)
Absolute performance Relative to Sensex
1m 3m YoY 1m 3m YoY
UTCEM (5.0) (4.7) (3.4) (4.3) (5.8) (15.4) ACC (5.8) 6.6 3.8 (5.1) 5.5 (8.2) ACEM (3.0) 8.2 6.9 (2.3) 7.1 (5.0) SRCM 4.1 4.6 6.4 4.7 3.5 (5.5) DBEL (0.0) 5.6 42.9 0.7 4.5 30.9 ICEM (2.0) (11.4) 15.6 (1.3) (12.5) 3.7 TRCL (3.0) (0.7) 12.6 (2.4) (1.8) 0.6 JKCE (4.5) (0.8) 8.6 (3.8) (1.9) (3.4) JKLC (8.7) (17.0) (22.7) (8.1) (18.1) (34.6) ORCMNT (3.2) 1.5 (30.8) (2.5) 0.4 (42.8) PRSC (4.8) (17.9) (5.4) (4.1) (19.0) (17.4) GRASIM (1.6) 8.1 41.0 (1.0) 7.0 29.1
Source: Bloomberg
Table 3: Geographic breakup of market mix
UTCEM* ACC ACEM SRCM TRCL JKLC JKCE ICEM DBEL# ORCMNT PRSC
North 24 20 31 50 35 57 13 Central 15 22 8 23 6 14 75 East 17 25 23 27 30 24 5 60 25 West 25 13 36 35 14 12 10 50 South 19 20 2 70 15 70 30 50
Source: Company data, I-Sec research, *includes JPA, #Includes OCL India
Table 4: Industry volumes likely up 4-5% YoY
Volumes (mnte)* Q2FY18E Q2FY17 % YoY Q1FY18 % QoQ
UTCEM – Total 13.3 11.2 19.2 13.2 1.0 ACC 5.9 5.1 17.0 6.7 (12.0) ACEM 5.0 4.6 9.8 6.1 (17.2) SRCM 5.1 4.6 11.3 5.9 (13.7) DBEL 3.7 3.4 9.0 4.0 (6.6) ICEM – standalone 2.7 2.8 (3.8) 2.7 1.0 TRCL 2.1 2.0 4.0 2.2 (1.6) JKCE – Total 2.1 1.9 11.9 2.1 1.2 JKLC 1.9 1.7 10.4 2.3 (17.0) ORCMNT 1.4 1.2 15.0 1.4 (3.4) PRSC 1.2 1.2 5.7 1.5 (17.2) Total of above 44.5 39.6 12.3 48.0 (7.3) Industry 68.5 65.3 4.9 72.6 (5.6)
Source: Company data, *including clinker sale, I-Sec research
Cement ICICI Securities
4
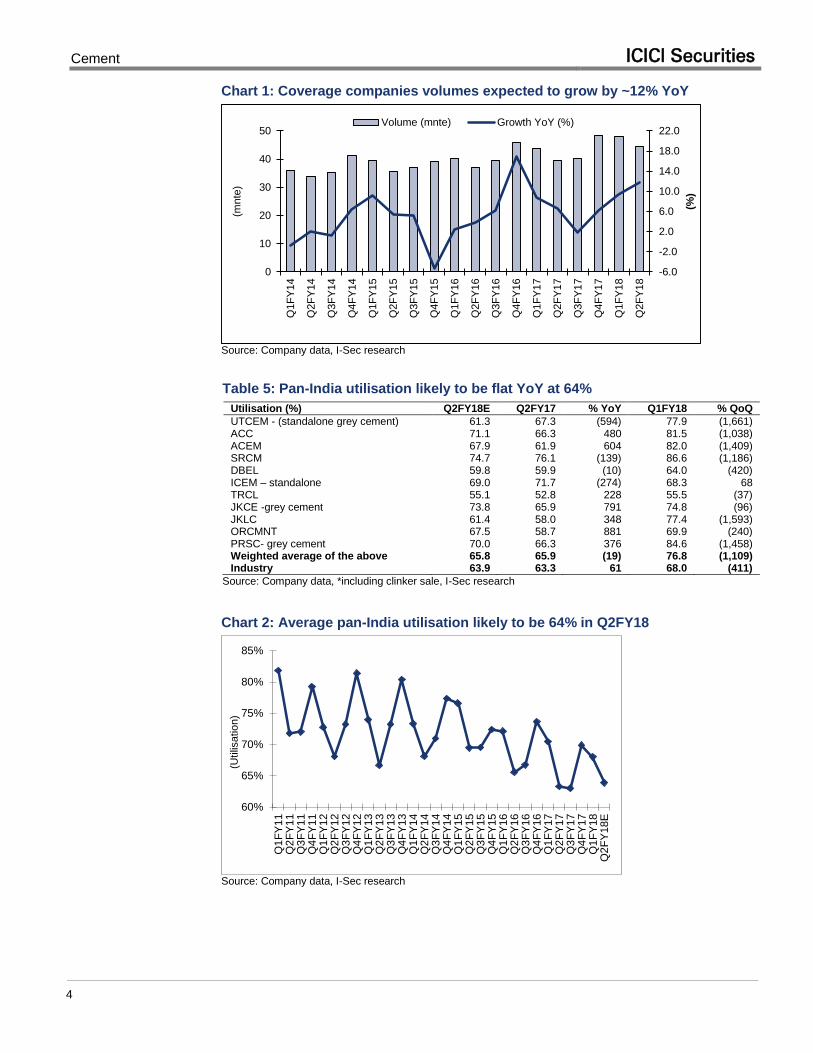
Chart 1: Coverage companies volumes expected to grow by ~12% YoY
-6.0
-2.0
2.0
6.0
10.0
14.0
18.0
22.0
0
10
20
30
40
50
Q1F
Y14
Q2F
Y14
Q3F
Y14
Q4F
Y14
Q1F
Y15
Q2F
Y15
Q3F
Y15
Q4F
Y15
Q1F
Y16
Q2F
Y16
Q3F
Y16
Q4F
Y16
Q1F
Y17
Q2F
Y17
Q3F
Y17
Q4F
Y17
Q1F
Y18
Q2F
Y18
(%)
(mnte
)
Volume (mnte) Growth YoY (%)
Source: Company data, I-Sec research
Table 5: Pan-India utilisation likely to be flat YoY at 64%
Utilisation (%) Q2FY18E Q2FY17 % YoY Q1FY18 % QoQ
UTCEM - (standalone grey cement) 61.3 67.3 (594) 77.9 (1,661) ACC 71.1 66.3 480 81.5 (1,038) ACEM 67.9 61.9 604 82.0 (1,409) SRCM 74.7 76.1 (139) 86.6 (1,186) DBEL 59.8 59.9 (10) 64.0 (420) ICEM – standalone 69.0 71.7 (274) 68.3 68 TRCL 55.1 52.8 228 55.5 (37) JKCE -grey cement 73.8 65.9 791 74.8 (96) JKLC 61.4 58.0 348 77.4 (1,593) ORCMNT 67.5 58.7 881 69.9 (240) PRSC- grey cement 70.0 66.3 376 84.6 (1,458) Weighted average of the above 65.8 65.9 (19) 76.8 (1,109) Industry 63.9 63.3 61 68.0 (411)
Source: Company data, *including clinker sale, I-Sec research
Chart 2: Average pan-India utilisation likely to be 64% in Q2FY18
60%
65%
70%
75%
80%
85%
Q1
FY
11
Q2
FY
11
Q3
FY
11
Q4
FY
11
Q1
FY
12
Q2
FY
12
Q3
FY
12
Q4
FY
12
Q1
FY
13
Q2
FY
13
Q3
FY
13
Q4
FY
13
Q1
FY
14
Q2
FY
14
Q3
FY
14
Q4
FY
14
Q1
FY
15
Q2
FY
15
Q3
FY
15
Q4
FY
15
Q1
FY
16
Q2
FY
16
Q3
FY
16
Q4
FY
16
Q1
FY
17
Q2
FY
17
Q3
FY
17
Q4
FY
17
Q1
FY
18
Q2
FY
18E
(Utilis
ation)
Source: Company data, I-Sec research

Cement ICICI Securities
5
Table 6: Realisation/te likely to decline 2.1% QoQ / increase 1.1% YoY
Realisation Q2FY18E Q2FY17 % YoY Q1FY18 % QoQ
UTCEM (grey cement) 4,270 4,161 2.6 4,407 (3.1) UTCEM (blended) 4,823 4,828 (0.1) 4,953 (2.6) ACC (grey cement) 4,468 4,466 0.0 4,597 (2.8) ACC (blended ) 4,829 4,877 (1.0) 4,915 (1.7) ACEM 4,535 4,376 3.6 4,651 (2.5) SRCM (excluding power) 4,042 3,969 1.8 4,146 (2.5) DBEL (excluding refractory)* 4,793 4,589 4.5 4,931 (2.8) ICEM (grey cement) 4,622 4,683 (1.3) 4,807 (3.8) TRCL (grey cement) 4,459 4,769 (6.5) 4,607 (3.2) JKCE (grey cement) 3,841 3,641 5.5 3,991 (3.7) JKCE (blended) 4,918 4,743 3.7 4,846 1.5 JKLC 3,885 3,816 1.8 3,944 (1.5) ORCMNT 3,764 3,273 15.0 4,065 (7.4) PRSC (grey cement) 3,984 3,887 2.5 4,065 (2.0) Weighted average (blended) 4,579 4,527 1.1 4,679 (2.1)
Source: Company data, I-Sec research; *including other operating income
Chart 3: Realisation/te likely to decline 2.1% QoQ / increase 1.1% YoY
(10.0)
(8.0)
(6.0)
(4.0)
(2.0)
0.0
2.0
4.0
6.0
8.0
10.0
4,000
4,200
4,400
4,600
4,800
Q1F
Y14
Q2F
Y14
Q3F
Y14
Q4F
Y14
Q1F
Y15
Q2F
Y15
Q3F
Y15
Q4F
Y15
Q1F
Y16
Q2F
Y16
Q3F
Y16
Q4F
Y16
Q1F
Y17
Q2F
Y17
Q3F
Y17
Q4F
Y17
Q1F
Y18
Q2F
Y18
(%)
(Rs/t
e)
Realisation Growth YoY (%)
Source: Company data, I-Sec research
Table 7: Cement prices in Q2FY18 likely increased 2.8% YoY
Cement price per bag of 50kg North East West Central South All-India
Avg. Q2FY18E 299 304 299 306 331 310 Avg. Q2FY17 294 296 273 301 330 301 YoY change (%) 1.5 2.6 9.5 1.9 0.3 2.8 Avg. Q1FY18 307 312 307 312 344 319 QoQ change (%) (2.7) (2.5) (2.4) (1.8) (3.7) (2.7)
Source: I-Sec research

Cement ICICI Securities
6
Chart 4: North India markets – price movement Chart 5: East India markets – price movement
220
240
260
280
300
320
Ap
r
May
Jun
Jul
Au
g
Se
p
Oct
No
v
Dec
Jan
Feb
Mar
(Rs/b
ag)
FY14 FY15 FY16
FY17 FY18
270
280
290
300
310
320
330
340
Ap
r
May
Jun
Jul
Au
g
Se
p
Oct
Nov
Dec
Jan
Feb
Mar
(Rs/b
ag)
FY14 FY15 FY16
FY17 FY18
Chart 6: South India markets – price movement Chart 7: West India markets – price movement
260
280
300
320
340
360
380
Ap
r
May
Jun
Jul
Au
g
Se
p
Oct
Nov
Dec
Jan
Feb
Mar
(Rs/b
ag)
FY14 FY15 FY16
FY17 FY18
240
250
260
270
280
290
300
310
320
330
Ap
r
May
Jun
Jul
Au
g
Se
p
Oct
Nov
Dec
Jan
Feb
Mar
(Rs/b
ag)
FY14 FY15 FY16
FY17 FY18
Chart 8: Central India markets – price movement Chart 9: All-India price movement
250
260
270
280
290
300
310
320
330
Ap
r
May
Jun
Jul
Au
g
Se
p
Oct
Nov
Dec
Jan
Feb
Mar
(Rs/b
ag)
FY14 FY15 FY16
FY17 FY18
270
280
290
300
310
320
330
Ap
r
May
Jun
Jul
Au
g
Se
p
Oct
Nov
Dec
Jan
Feb
Mar
(Rs/b
ag)
FY14 FY15 FY16
FY17 FY18
Source: Industry sources, I-Sec research
Cement ICICI Securities
7
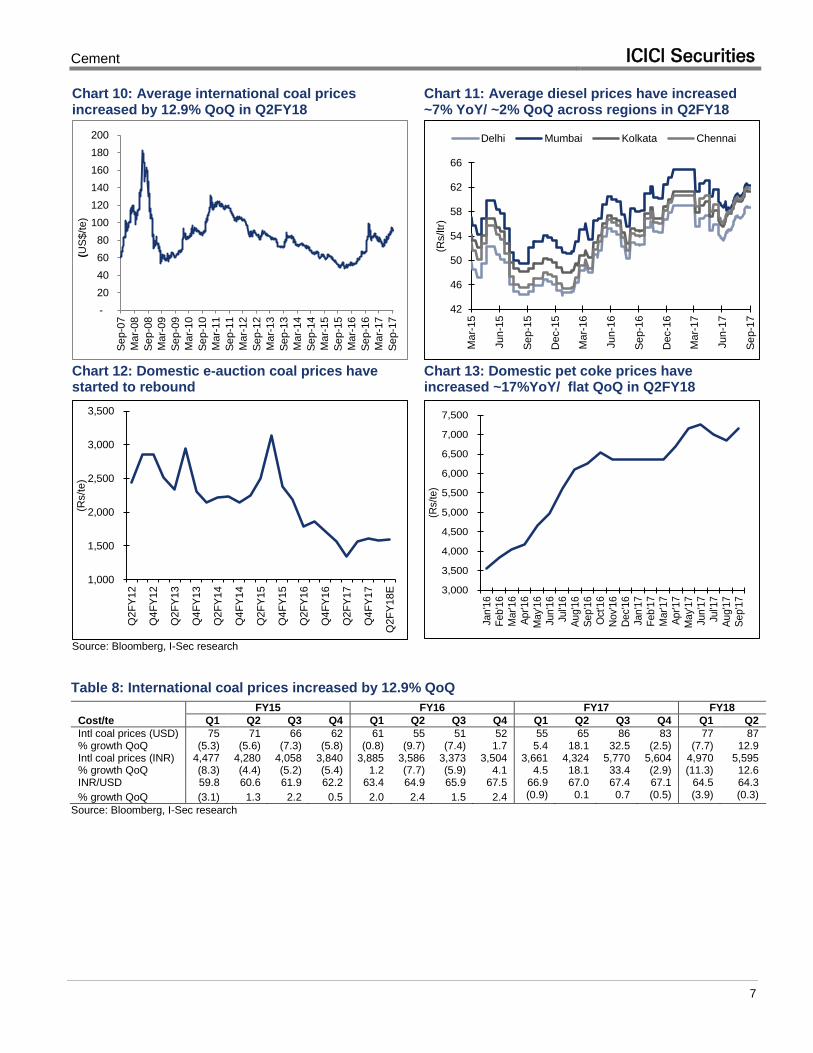
Chart 10: Average international coal prices increased by 12.9% QoQ in Q2FY18
Chart 11: Average diesel prices have increased ~7% YoY/ ~2% QoQ across regions in Q2FY18
-
20
40
60
80
100
120
140
160
180
200
Se
p-0
7
Ma
r-08
Se
p-0
8
Ma
r-09
Se
p-0
9
Ma
r-10
Se
p-1
0
Mar-
11
Se
p-1
1
Ma
r-12
Se
p-1
2
Ma
r-13
Se
p-1
3
Ma
r-14
Se
p-1
4
Ma
r-15
Se
p-1
5
Ma
r-16
Se
p-1
6
Ma
r-17
Se
p-1
7
(US
$/t
e)
42
46
50
54
58
62
66
Ma
r-15
Jun
-15
Se
p-1
5
Dec-1
5
Ma
r-16
Jun
-16
Se
p-1
6
Dec-1
6
Ma
r-17
Jun
-17
Se
p-1
7
(Rs/ltr
)
Delhi Mumbai Kolkata Chennai
Chart 12: Domestic e-auction coal prices have started to rebound
Chart 13: Domestic pet coke prices have increased ~17%YoY/ flat QoQ in Q2FY18
1,000
1,500
2,000
2,500
3,000
3,500
Q2F
Y12
Q4F
Y12
Q2F
Y13
Q4F
Y13
Q2F
Y14
Q4F
Y14
Q2F
Y15
Q4F
Y15
Q2F
Y16
Q4F
Y16
Q2F
Y17
Q4F
Y17
Q2
FY
18
E
(Rs/t
e)
3,000
3,500
4,000
4,500
5,000
5,500
6,000
6,500
7,000
7,500
Jan
'16
Feb'1
6
Mar'16
Ap
r'1
6
May'
16
Jun
'16
Jul'1
6
Au
g'1
6
Se
p'1
6
Oct
'16
Nov'1
6
Dec'1
6
Jan
'17
Feb'1
7
Mar'17
Ap
r'1
7
May'
17
Jun
'17
Jul'1
7
Au
g'1
7
Se
p'1
7
(Rs/t
e)
Source: Bloomberg, I-Sec research
Table 8: International coal prices increased by 12.9% QoQ
Cost/te
FY15 FY16 FY17 FY18
Q1 Q2 Q3 Q4 Q1 Q2 Q3 Q4 Q1 Q2 Q3 Q4 Q1 Q2
Intl coal prices (USD) 75 71 66 62 61 55 51 52 55 65 86 83 77 87 % growth QoQ (5.3) (5.6) (7.3) (5.8) (0.8) (9.7) (7.4) 1.7 5.4 18.1 32.5 (2.5) (7.7) 12.9 Intl coal prices (INR) 4,477 4,280 4,058 3,840 3,885 3,586 3,373 3,504 3,661 4,324 5,770 5,604 4,970 5,595 % growth QoQ (8.3) (4.4) (5.2) (5.4) 1.2 (7.7) (5.9) 4.1 4.5 18.1 33.4 (2.9) (11.3) 12.6 INR/USD 59.8 60.6 61.9 62.2 63.4 64.9 65.9 67.5 66.9 67.0 67.4 67.1 64.5 64.3
% growth QoQ (3.1) 1.3 2.2 0.5 2.0 2.4 1.5 2.4 (0.9) 0.1 0.7 (0.5) (3.9) (0.3)
Source: Bloomberg, I-Sec research

Cement ICICI Securities
8
Table 9: Average EBITDA/te expected to decline 10.6% YoY / 22.1% QoQ
EBITDA/te* Q2FY18E Q2FY17 % YoY Q1FY18 % QoQ
UTCEM (incl. white cement) 914 1,033 (11.5) 1,183 (22.7) ACC (incl. RMC) 588 540 8.9 945 (37.8) ACEM 772 662 16.6 1,073 (28.0) SRCM (cement only) 1,033 1,400 (26.2) 1,212 (14.8) DBEL (blended) 1,163 1,230 (5.5) 1,395 (16.7) ICEM (blended) 652 935 (30.3) 718 (9.2) TRCL(cement only) 1,035 1,545 (33.0) 1,249 (17.1) JKCE (incl. white cement) 870 827 5.2 931 (6.5) JKLC 418 545 (23.4) 527 (20.7) ORCMNT 475 141 236.1 836 (43.2) PRSC (grey cement) 546 441 23.8 769 (28.9) Weighted average 833 931 (10.6) 1,069 (22.1)
Source: Company data, I-Sec research *including other operating income
Chart 14: Average EBITDA/te expected to decline 10.6% YoY / 22.1% QoQ
(50.0)
(40.0)
(30.0)
(20.0)
(10.0)
0.0
10.0
20.0
30.0
40.0
400
600
800
1,000
1,200
Q1F
Y14
Q2F
Y14
Q3F
Y14
Q4F
Y14
Q1F
Y15
Q2F
Y15
Q3F
Y15
Q4F
Y15
Q1F
Y16
Q2F
Y16
Q3F
Y16
Q4F
Y16
Q1F
Y17
Q2F
Y17
Q3F
Y17
Q4F
Y17
Q1F
Y18
Q2F
Y18
(%)
(Rs/t
e)
EBITDA/te Growth YoY (%)
Source: Company data, I-Sec research

Cement ICICI Securities
9
Table 10: Volume growth assumptions over FY17-FY20
Total volumes (mnte) Growth YoY (%)
FY17 FY18E FY19E FY20E FY17 FY18E FY19E FY20E
UTCEM 53.6 62.3 70.3 78.1
1.2 16.3 12.8 11.2
ACC 23.2 25.3 26.1 27.0
(2.8) 9.0 3.3 3.3
ACEM 21.6 22.7 23.5 24.4
(1.1) 5.2 3.5 4.0
SRCM 20.6 23.1 26.4 30.3
8.4 12.3 14.0 15.0
DBEL 15.3 16.7 18.2 19.8
18.0 9.0 9.0 9.0
ICEM 11.0 11.7 12.6 13.4
10.1 6.1 8.0 6.1
JKCE 8.2 9.0 9.6 10.3
0.9 9.8 7.1 7.1
TRCL 8.3 8.9 9.6 10.6 16.0 7.0 7.0 11.0
JKLC 7.9 9.1 9.9 10.7
8.5 15.0 8.0 8.0
ORCMNT 5.6 5.8 6.2 6.7
25.7 4.8 7.0 7.0
PRSC 5.4 5.7 5.9 6.1
2.3 5.0 4.0 4.0
Total 180.7 200.3 218.2 237.4
4.5 10.9 8.9 8.8
Source: Company data, I-Sec research
Table 11: Realisation growth assumptions over FY17-FY20
Realisation (Rs/te) Growth YoY (%)
FY17 FY18E FY19E FY20E FY17 FY18E FY19E FY20E
UTCEM- grey cement 4,139 4,383 4,603 4,834
(0.0) 5.9 5.0 5.0
UTCEM- blended 4,685 4,903 5,082 5,276
(1.9) 4.6 3.7 3.8
ACC - blended 4,722 4,865 5,128 5,354
(1.5) 3.0 5.4 4.4
ACC - grey cement 4,377 4,510 4,753 4,964
(2.9) 3.0 5.4 4.4
ACEM 4,256 4,518 4,829 5,066
(0.5) 6.2 6.9 4.9
SRCM 3,747 4,167 4,366 4,562
7.3 11.2 4.8 4.5
DBEL - cement 4,557 4,922 5,094 5,272
(2.6) 8.0 3.5 3.5
ICEM 4,435 4,790 4,958 5,131
(1.9) 8.0 3.5 3.5
JKCE- blended 4,833 5,050 5,224 5,402 4.4 4.5 3.4 3.4
TRCL 4,641 4,641 4,792 4,936
(5.7) - 3.3 3.0
JKLC 3,676 3,989 4,228 4,460
2.2 8.5 6.0 5.5
ORCMNT 3,369 4,043 4,245 4,436
(0.9) 20.0 5.0 4.5
PRSC 3,703 4,037 4,259 4,493
(3.4) 9.0 5.5 5.5
Weighted average 3,899 4,144 4,337 4,517
(1.7) 6.3 4.7 4.2
Source: Company data, I-Sec research
Table 12: EBITDA/te growth assumptions over FY17-FY20
EBITDA/te* (Rs) Growth YoY (%)
FY17 FY18E FY19E FY20E FY17 FY18E FY19E FY20E
UTCEM- consol. 973 1,071 1,207 1,363
5.3 10.0 12.8 12.9 ACC 613 714 858 965
4.5 16.4 20.2 12.5
ACEM 780 886 1,132 1,279
11.1 13.5 27.8 13.0 SRCM 1,124 1,198 1,350 1,489
42.9 6.7 12.6 10.3
DBEL 1,244 1,336 1,406 1,482
2.1 7.4 5.2 5.4 ICEM 792 793 863 911
(6.5) 0.1 8.8 5.6
JKCE 934 1,000 1,088 1,170
44.6 7.1 8.8 7.5 TRCL 1,383 1,279 1,346 1,420 (9.0) (7.5) 5.3 5.5 JKLC 465 619 772 900
25.6 33.0 24.7 16.6
ORCMNT 321 755 867 973
(22.7) 135.5 14.7 12.3 PRSC 672 801 939 1,089
40.9 19.2 17.2 16.0
Weighted average 879 971 1,110 1,237
13.0 10.6 14.3 11.4
Source: Company data, I-Sec research; *including other operating income Note: We are not changing any reco, target and estimates in this report. We will review each stock individually after the quarterly results.

Cement ICICI Securities
10
UltraTech Cement (BUY) (QoQ chg: -4.7%; YTD: 19.8%)
Quarterly estimates (standalone)
(Rs mn, year ending March 31)
Q2FY18E# Q2FY17 % YoY Q1FY18 % QoQ
Volume sales (mnte) 13.3 11.2 19.2 13.2 1.0 Net realisation (Rs) 4,823 4,828 (0.1) 4,953 (2.6) Net sales 64,245 53,979 19.0 65,330 (1.7) EBITDA* 12,179 11,548 5.5 15,601 (21.9) EBITDA/te 914 1,033 (11.5) 1,183 (22.7) Recurring pre-tax income 5,104 8,767 (41.8) 12,870 (60.3) Recurring net income 3,548 6,011 (41.0) 8,906 (60.2) Ratios (%) EBITDA margins 19.0 21.4 23.9 Net profit margins 5.5 11.1 13.6
Source: Company data, I-Sec research; #including JPA; *including other operating income
ACC (ADD) (QoQ chg: 6.6%; YTD chg: 27.7%)
Quarterly estimates (consolidated)
(Rs mn, year ending December 31)
Q3CY17E Q3CY16 YoY (%) Q2CY17 QoQ (%)
Volume sales (mnte) 5.9 5.1 17.0 6.7 (12.0) Net cement realisation including RMC 4,829 4,877 (1.0) 4,915 (1.7) Net sales 28,645 24,728 15.8 33,125 (13.5) EBITDA* 3,486 2,737 27.4 6,368 (45.3) EBITDA / te 588 540 8.9 945 (37.8) Recurring pre-tax income 1,921 1,250 53.7 4,819 (60.1) Recurring net income 1,441 820 75.7 3,262 (55.8) Ratios (%) EBITDA margins 12.2 11.1 19.2 Net profit margins 5.0 3.3 9.8
Source: Company data, I-Sec research; *including other operating income
Ambuja Cements (BUY) (QoQ chg: 8.2%; YTD chg: 32.8%)
Quarterly estimates (standalone)
(Rs mn, year ending December 31)
Q3CY17E Q3CY16 YoY (%) Q2CY17 QoQ (%)
Volume including clinker 5.0 4.6 9.8 6.1 (17.2) Avg. realisation 4,535 4,376 3.6 4,651 (2.5) Net sales 22,797 20,043 13.7 28,233 (19.3) EBITDA* 3,879 3,032 28.0 6,510 (40.4) EBITDA/te 772 662 16.6 1,073 (28.0) Recurring pre-tax income 3,871 2,447 58.2 5,466 (29.2) Recurring net income 2,749 1,740 58.0 3,922 (29.9) Ratios (%) EBITDA margins 17.0 15.1 23.1 Net profit margins 12.1 8.7 13.9
Source: Company data, I-Sec research; *including other operating income
Price chart
Price chart
800
1,000
1,200
1,400
1,600
1,800
2,000
Oct-
14
Ap
r-1
5
Oct-
15
Ap
r-1
6
Oct-
16
Ap
r-17
Oct-
17
(Rs)
Price chart
125145165185205225245265285305
Oct-
14
Ap
r-15
Oct-
15
Ap
r-16
Oct-
16
Ap
r-17
Oct-
17
(Rs)

Cement ICICI Securities
11
Shree Cement (BUY) (QoQ chg: 4.6%; YTD chg: 28.3%)
Quarterly estimates (consolidated)
(Rs mn, year ending March 31)
Q2FY18E Q2FY17 % YoY Q1FY18 % QoQ
Net sales 21,572 20,068 7.5 25,363 (14.9) Net volumes (mnte) 5.1 4.6 11.3 5.9 (13.7) Realisation – cement 4,042 3,969 1.8 4,146 (2.5) EBITDA* 5,257 7,013 (25.0) 7,120 (26.2) EBITDA/te incl. power 1,035 1,536 (32.6) 1,209 (14.4) Recurring pre-tax income 3,570 5,740 (37.8) 5,466 (34.7) Recurring net income 2,846 5,475 (48.0) 4,401 (35.3) Ratios (%) EBITDA margins 24.4 34.9 28.1 Net profit margins 13.2 27.3 17.4
Source: Company data, I-Sec research; *including other operating income
Dalmia Bharat (ADD) (QoQ chg: 5.6%; YTD chg: 103.9%)
Quarterly estimates (consolidated)
(Rs mn, year ending March 31)
Q2FY18E Q2FY17 % YoY Q1FY18 % QoQ
Net sales 18,800 16,829 11.7 20,589 (8.7) Volume including clinker 3.7 3.4 9.0 4.0 (6.6) Realisation – cement* 4,793 4,589 2.5 4,931 (2.3) EBITDA 4,334 4,207 3.0 5,566 (22.1) EBITDA/te (blended) 1,163 1,230 (5.5) 1,395 (16.7) Recurring pre-tax income 1,094 1,125 (2.7) 2,617 (58.2) Recurring net income 595 311 91.2 1,639 (63.7) Ratios (%) EBITDA margins 23.1 25.0 27.0 Net profit margins 3.2 1.8 8.0
Source: Company data, I-Sec research; *including other operating income
India Cements (ADD) (QoQ chg: -11.4%; YTD chg: 5.6%)
Quarterly estimates (standalone)
(Rs mn, year ending March 31)
Q2FY18E Q2FY17 % YoY Q1FY18 % QoQ
Volume including clinker (mnte) 2.7 2.4 NM 2.7 1.0 Realisation – cement 4,622 4,683 NM 4,807 (3.8) Net sales 12,630 11,465 NM 12,901 (2.1) EBITDA 1,749 2,244 NM 1,908 (8.3) EBITDA/te (blended) 652 935 NM 718 (14.3) Recurring pre-tax income 267 917 NM 404 (33.9) Recurring net income 185 624 NM 264 (30.2) Ratios (%) EBITDA margins 13.8 19.6 14.8 Net profit margins 1.5 5.4 2.0
Source: Company data, I-Sec research; *YoY numbers are not comparable due to merger of Trinetra Cement and Trishul Concrete
Price chart
1,500
4,500
7,500
10,500
13,500
16,500
19,500
22,500
Oct-
14
Ap
r-15
Oct-
15
Ap
r-16
Oct-
16
Ap
r-17
Oct-
17
(Rs)
Price chart
0
500
1,000
1,500
2,000
2,500
3,000
Oct-
14
Ap
r-15
Oct-
15
Ap
r-16
Oct-
16
Ap
r-17
Oct-
17
(Rs)
Price chart
40
80
120
160
200
240
Oct-
14
Ap
r-15
Oct-
15
Ap
r-16
Oct-
16
Ap
r-17
Oct-
17
(Rs)

Cement ICICI Securities
12
The Ramco Cements (BUY) (QoQ chg: -0.7%; YTD chg: 28.6%)
Quarterly estimates (standalone)
(Rs mn, year ending March 31)
Q2FY18E Q2FY17 % YoY Q1FY18 % QoQ
Volume including clinker 2.1 2.0 4.0 2.2 (1.6) Realisation – cement 4,459 4,769 (6.5) 4,607 (3.2) Net sales 9,920 10,124 (2.0) 10,165 (2.4) EBITDA* 2,620 3,532 (25.8) 2,904 (9.8) EBITDA/te incl. power 1,238 1,736 (28.7) 1,351 (8.3) Recurring pre-tax income 1,804 2,637 (31.6) 2,082 (13.3) Recurring net income 1,353 2,070 (34.6) 1,558 (13.1) Ratios (%) EBITDA margins 26.4 34.9 28.6 Net profit margins 13.6 20.4 15.3
Source: Company data, I-Sec research; *including other operating income
JK Cement (BUY) (QoQ chg: -0.8%; YTD chg: 35.0%)
Quarterly estimates (standalone)
(Rs mn, year ending March 31)
Q2FY18E Q2FY17 % YoY Q1FY18 % QoQ
Volume incl. white cement 2.1 1.9 11.9 2.1 1.2 Blended realisation 4,918 4,743 3.7 4,846 1.5 Net sales 10,570 9,110 16.0 10,295 2.7 EBITDA* 1,871 1,589 17.7 1,977 (5.4) EBITDA/te 870 827 5.2 931 (6.5) Recurring pre-tax income 816 522 56.5 1,033 (21.0) Recurring net income 627 409 53.3 793 (21.0) Ratios (%) EBITDA margins 17.7 17.4 19.2 Net profit margins 5.9 4.5 7.7
Source: Company data, I-Sec research; *including other operating income
JK Lakshmi Cement (BUY) (QoQ chg: -17.0%; YTD chg: 12.4%)
Quarterly estimates (standalone)
(Rs mn, year ending March 31)
Q2FY18E Q2FY17 % YoY Q1FY18 % QoQ
Volume including clinker (mnte) 1.9 1.7 10.4 2.3 (17.0) Avg. realisation 3,885 3,816 1.8 3,944 (1.5) Net sales 7,367 6,556 12.4 9,011 (18.2) EBITDA* 792 937 (15.4) 1,203 (34.2) EBITDA/te 418 545 (23.4) 527 (20.7) Recurring pre-tax income 59 233 (74.6) 374 (84.2) Recurring net income 52 249 (79.1) 283 (81.6) Ratios (%) EBITDA margins 10.8 14.3 13.4 Net profit margins 0.7 3.8 3.1
Source: Company data, I-Sec research; *including other operating income
Price chart
50
150
250
350
450
550
650
750
850
Oct-
14
Ap
r-15
Oct-
15
Ap
r-16
Oct-
16
Ap
r-17
Oct-
17
(Rs)
Price chart
80
280
480
680
880
1080
1280
Oct-
14
Ap
r-15
Oct-
15
Ap
r-16
Oct-
16
Ap
r-17
Oct-
17
(Rs.)
Price chart
200
250
300
350
400
450
500
550
Oct-
14
Ap
r-15
Oct-
15
Ap
r-16
Oct-
16
Ap
r-17
Oct-
17
(Rs)

Cement ICICI Securities
13
Orient Cement (ADD) (QoQ chg: 1.5%; YTD chg: 26.0%)
Quarterly estimates (standalone)
(Rs mn, year ending March 31)
Q2FY18E Q2FY17 % YoY Q1FY18 % QoQ
Volume including clinker (mnte) 1.4 1.2 15.0 1.4 (3.4) Avg. realisation 3,764 3,273 15.0 4,065 (7.4) Net sales 5,082 3,843 32.3 5,682 (10.6) EBITDA* 641 166 286.5 1,169 (45.2) EBITDA/te 475 141 236.1 836 (43.2) Recurring pre-tax income 23 (488) NM 589 (96.0) Recurring net income 19 (294) NM 389 (95.2) Ratios (%) EBITDA margins 12.6 4.3 20.6 Net profit margins 0.4 (7.6) 6.9
Source: Company data, I-Sec research; *including other operating income
Prism Cement (ADD) (QoQ chg: -17.9%; YTD: 34.3%)
Quarterly estimates (standalone)
(Rs mn, year ending March 31)
Q2FY18E Q2FY17 % YoY Q1FY18 % QoQ
Volume sales (mnte) 1.2 1.2 5.7 1.5 (17.2) Net realisation (Rs)- Cement 3,984 3,887 2.5 4,065 (2.0) Net sales 12,167 11,674 4.2 13,243 (8.1) EBITDA* 634 578 9.7 1,089 (41.8) EBITDA/te- Cement 546 441 23.8 769 (28.9) Recurring pre-tax income (207) (213) NM 241 NM Recurring net income (143) (213) NM 167 NM Ratios (%) EBITDA margins 5.2 5.0 8.2 Net profit margins (1.2) (1.8) 1.3
Source: Company data, I-Sec research; *including other operating income
Price chart
20
70
120
170
220
270
Oct-
14
Ap
r-15
Oct-
15
Ap
r-16
Oct-
16
Ap
r-17
Oct-
17
(Rs)
Price chart
25
45
65
85
105
125
145
Oct-
14
Ap
r-15
Oct-
15
Ap
r-16
Oct-
16
Ap
r-17
Oct-
17
(Rs)

Cement ICICI Securities
14
In case of industry/sector reports or a report containing multiple stocks, the rating/recommendation for a particular stock may be based on the last released stock
specific report for that company.
This report may be distributed in Singapore by ICICI Securities, Inc. (Singapore branch). Any recipients of this report in Singapore should contact ICICI Securities,
Inc. (Singapore branch) in respect of any matters arising from, or in connection with, this report. The contact details of ICICI Securities, Inc. (Singapore branch) are as follows: Address: 10 Collyer Quay, #37-16 Ocean Financial Tower, Singapore - 049315, Tel: +65 6232 2451 and email: [email protected], [email protected].
"In case of eligible investors based in Japan, charges for brokerage services on execution of transactions do not in substance constitute charge for research
reports and no charges are levied for providing research reports to such investors."
New I-Sec investment ratings (all ratings based on absolute return; All ratings and target price refers to 12-month performance horizon, unless mentioned otherwise)
BUY: >15% return; ADD: 5% to 15% return; HOLD: Negative 5% to Positive 5% return; REDUCE: Negative 5% to Negative 15% return; SELL: < negative 15% return
ANALYST CERTIFICATION
We /I, Krupal Maniar, CA, CFA; Dharmesh Shah, CA Research Analysts, authors and the names subscribed to this report, hereby certify that all of the views expressed in this research report accurately reflect our views about the subject issuer(s) or securities. We also certify that no part of our compensation was, is, or will be directly or indirectly related to the specific recommendation(s) or view(s) in this report. Analysts are not registered as research analysts by FINRA and are not associated persons of the ICICI Securities Inc.
Terms & conditions and other disclosures:
ICICI Securities Limited (ICICI Securities) is a full-service, integrated investment banking and is, inter alia, engaged in the business of stock brokering and distribution of financial products. ICICI Securities Limited is a SEBI registered Research Analyst with SEBI Registration Number – INH000000990. ICICI Securities is a wholly-owned subsidiary of ICICI Bank which is India’s largest private sector bank and has its various subsidiaries engaged in businesses of housing finance, asset management, life insurance, general insurance, venture capital fund management, etc. (“associates”), the details in respect of which are available on www.icicibank.com.
ICICI Securities is one of the leading merchant bankers/ underwriters of securities and participate in virtually all securities trading markets in India. We and our associates might have investment banking and other business relationship with a significant percentage of companies covered by our Investment Research Department. ICICI Securities generally prohibits its analysts, persons reporting to analysts and their relatives from maintaining a financial interest in the securities or derivatives of any companies that the analysts cover.
The information and opinions in this report have been prepared by ICICI Securities and are subject to change without any notice. The report and information contained herein is strictly confidential and meant solely for the selected recipient and may not be altered in any way, transmitted to, copied or distributed, in part or in whole, to any other person or to the media or reproduced in any form, without prior written consent of ICICI Securities. While we would endeavour to update the information herein on a reasonable basis, ICICI Securities is under no obligation to update or keep the information current. Also, there may be regulatory, compliance or other reasons that may prevent ICICI Securities from doing so. Non-rated securities indicate that rating on a particular security has been suspended temporarily and such suspension is in compliance with applicable regulations and/or ICICI Securities policies, in circumstances where ICICI Securities might be acting in an advisory capacity to this company, or in certain other circumstances.
This report is based on information obtained from public sources and sources believed to be reliable, but no independent verification has been made nor is its accuracy or completeness guaranteed. This report and information herein is solely for informational purpose and shall not be used or considered as an offer document or solicitation of offer to buy or sell or subscribe for securities or other financial instruments. Though disseminated to all the customers simultaneously, not all customers may receive this report at the same time. ICICI Securities will not treat recipients as customers by virtue of their receiving this report. Nothing in this report constitutes investment, legal, accounting and tax advice or a representation that any investment or strategy is suitable or appropriate to your specific circumstances. The securities discussed and opinions expressed in this report may not be suitable for all investors, who must make their own investment decisions, based on their own investment objectives, financial positions and needs of specific recipient. This may not be taken in substitution for the exercise of independent judgment by any recipient. The recipient should independently evaluate the investment risks. The value and return on investment may vary because of changes in interest rates, foreign exchange rates or any other reason. ICICI Securities accepts no liabilities whatsoever for any loss or damage of any kind arising out of the use of this report. Past performance is not necessarily a guide to future performance. Investors are advised to see Risk Disclosure Document to understand the risks associated before investing in the securities markets. Actual results may differ materially from those set forth in projections. Forward-looking statements are not predictions and may be subject to change without notice.
ICICI Securities or its associates might have managed or co-managed public offering of securities for the subject company or might have been mandated by the subject company for any other assignment in the past twelve months.
ICICI Securities or its associates might have received any compensation from the companies mentioned in the report during the period preceding twelve months from the date of this report for services in respect of managing or co-managing public offerings, corporate finance, investment banking or merchant banking, brokerage services or other advisory service in a merger or specific transaction.
ICICI Securities or its associates might have received any compensation for products or services other than investment banking or merchant banking or brokerage services from the companies mentioned in the report in the past twelve months.
ICICI Securities encourages independence in research report preparation and strives to minimize conflict in preparation of research report. ICICI Securities or its associates or its analysts did not receive any compensation or other benefits from the companies mentioned in the report or third party in connection with preparation of the research report. Accordingly, neither ICICI Securities nor Research Analysts and their relatives have any material conflict of interest at the time of publication of this report.
It is confirmed that Krupal Maniar, CA, CFA; Dharmesh Shah, CA Research Analysts of this report have not received any compensation from the companies mentioned in the report in the preceding twelve months.
Compensation of our Research Analysts is not based on any specific merchant banking, investment banking or brokerage service transactions.
ICICI Securities or its subsidiaries collectively or Research Analysts or their relatives do not own 1% or more of the equity securities of the Company mentioned in the report as of the last day of the month preceding the publication of the research report.
Since associates of ICICI Securities are engaged in various financial service businesses, they might have financial interests or beneficial ownership in various companies including the subject company/companies mentioned in this report.
It is confirmed that Krupal Maniar, CA, CFA; Dharmesh Shah, CA Research Analysts do not serve as an officer, director or employee of the companies mentioned in the report.
ICICI Securities may have issued other reports that are inconsistent with and reach different conclusion from the information presented in this report.
Neither the Research Analysts nor ICICI Securities have been engaged in market making activity for the companies mentioned in the report.
We submit that no material disciplinary action has been taken on ICICI Securities by any Regulatory Authority impacting Equity Research Analysis activities.
This report is not directed or intended for distribution to, or use by, any person or entity who is a citizen or resident of or located in any locality, state, country or other jurisdiction, where such distribution, publication, availability or use would be contrary to law, regulation or which would subject ICICI Securities and affiliates to any registration or licensing requirement within such jurisdiction. The securities described herein may or may not be eligible for sale in all jurisdictions or to certain category of investors. Persons in whose possession this document may come are required to inform themselves of and to observe such restriction.
This report has not been prepared by ICICI Securities, Inc. However, ICICI Securities, Inc. has reviewed the report and, in so far as it includes current or historical information, it is believed to be reliable, although its accuracy and completeness cannot be guaranteed.


![Investors' Presentation - Q2FY 16 Business Update [Company Update]](https://static.fdocuments.us/doc/165x107/577ca70d1a28abea748c2bc2/investors-presentation-q2fy-16-business-update-company-update.jpg)