November 2019 effect New visionaries · New visionaries and the Chinese Century Billionaires...
32
a b Billionaire-controlled companies outperform • Transforming the business of global philanthropy From long-term vision to smart risk-taking • Five strong years close with a dip The billionaire effect Billionaires insights 2019 November 2019 Issue 6
Transcript of November 2019 effect New visionaries · New visionaries and the Chinese Century Billionaires...

New visionaries and the Chinese Century Billionaires insights 2018
ab
Billionaire-controlled companies outperform • Transforming the business of global philanthropy From long-term vision to smart risk-taking • Five strong years close with a dip
The billionaire effectBillionaires insights 2019
November 2019Issue 6

A few words about our research
This is the sixth of our reports on billionaire wealth, continuing our investigation into this historic era of wealth genera-tion. We have expanded the scope of our research to include an examination of the performance of billionaire-controlled companies and a survey of UBS advisors’ views on their billionaire clients’ current activities. Our research universe covers 2,101 billionaires from 43 countries in the Americas, EMEA and APAC, looking back over more than two decades. Our database includes the 43 largest billionaire markets, which account for around 98% of global billionaire wealth. Further, we’ve conducted over 25 interviews with billionaire advisors and further face-to-face interviews with more than 30 billion- aires. UBS and PwC advise a large number of the world’s wealthy, and have unique insights into their changing fortunes and needs. (For more information see our research methodology on page 30.)

Contents
5
6
10
17
20
28
Foreword
Executive summary
Section 1: The billionaire effect: driving outperformance
Section 2: Transforming the business of global philanthropy
Section 3: Five strong years close with a dip
Section 4:Looking ahead


The billionaire effect
The past 30 to 40 years stand out as a time of exceptional innovation in business. The pace of economic change has been faster than at any other time in history. A relatively small number of entrepreneurs have been the agents of that change, applying new technologies and business models.
Now in its fifth year, this report analyzes how these entrepreneurs’ businesses have excelled. Long-term vision, smart risk taking, business focus and determination have resulted in businesses that have tended to outperform others financially.
That is the “billionaire effect” and it continues to have a huge influence, especially in technology industries of the future and China’s fast-developing economy. As this report shows for the first time, you see it in the long-term outperformance of billionaire businesses. And a small but significant number of billionaires are working together to break new ground in philanthropy.
There was a dip in wealth in 2018, but in our view this should be set within the context of the broader trend of strong growth. Billionaire wealth dropped 4.3% globally, after five years when it grew by 34.5%.* As the center of economic ac-tivity shifts towards Asia, the region’s entrepreneurs are playing a strong role. There will be many more winners and losers in the years to come.
In this year’s report we have tried to break new ground in our own way. Our study of the performance of billionaire com-panies is unprecedented and quantifies their strong results. We also surveyed over 100 UBS advisors – all of whom work closely with billionaire clients – to gauge billionaire sentiment in more depth. Taken together with a comprehensive set of client interviews, this research reveals entrepreneurs reacting pragmatically to prevailing uncertainty in the economy and geopolitics.
As we look ahead to the next five years, it is difficult to predict the future. Our research tells us that leading entrepreneurs are primed for a more difficult environment. But what will remain constant is the billionaire effect – the ability to trans-form entire industries, to create large numbers of well-paid jobs, and to rally the world to find cures for diseases such as malaria.
UBS/PwC Billionaires insights 2019 5
Josef Stadler Group Managing Director Head Ultra High Net Worth UBS Global Wealth Management
John Mathews Group Managing DirectorHead Ultra High Net Worth AmericasUBS Global Wealth Management
Ravi Raju Group Managing DirectorHead Ultra High Net Worth Asia PacificUBS Global Wealth Management
Thomas J. HollyPartnerUS Asset & Wealth Management Sector Leader, PwC US
Dr. Marcel Tschanz Partner and Swiss Head Wealth Management, PwC Switzerland
Julia LeongPartnerPrivate Banking LeaderPwC Singapore
* Source: UBS/PwC Billionaires database.

Executive summary
Over the 15 years to the end of 2018, billionaire-controlled companies listed on the equity market returned 17.8% versus the 9.1% of the MSCI ACWI, almost twice the annualized average performance of the market.
Their companies are also more profitable, earning an average return on equity of 16.6% over the last 10 years, compared to the 11.3% of the MSCI ACWI.*
We call the tendency of billionaire-controlled companies to outperform the billionaire effect.
Why does it exist? In our view, billionaires have three dis-tinct personality traits that benefit businesses – smart risk- taking, business focus, and determination.
Additionally, like family businesses more generally, billion- aires’ enterprises tend to have a long-term strategy.
6 UBS/PwC Billionaires insights 2019
Billionaire-controlled companies outperform
Market return
17.8%
From long-term vision to smart risk-taking
Smart risk-taking
Business focus
Determination
* Source: UBS/PwC Billionaires database.

Fresh from creating pioneering businesses, a small but growing number of billionaires have become even more ambitious: they want to make the world a better place. They are using the same characteristics that drove their business success to address the UN’s 17 Sustainable Development Goals (SDGs).
“Impact” has become the key word for these leading entrepreneurs, who are seeking new ways to engineer far-reaching change.
Over the five years to the end of 2018, billionaire wealth grew by more than a third (34.5%), reaching a total of USD 8.5 trillion, USD 2.2 trillion higher than five years earlier.
In the same period, 589 individuals became billionaires, increasing the population by 38.9% to 2,101.
But in 2018 billionaire wealth dropped by 4.3%, or USD 388 billion, in the face of a strong US dollar, trade friction, fears of lower economic growth, and financial market volatility.*
UBS/PwC Billionaires insights 2019 7
Drop in wealth by
-4.3%
Transforming the business of global philanthropy Five strong years close with a dip
* Source: UBS/PwC Billionaires database.

Women became billionaires at a faster rate than men over the five years to the end of 2018.
The number of female billionaires increased by almost half (46%) in the period, rising from 160 to 233. Meanwhile, the number of men expanded by 39%.
We originally identified what we call the ”Athena factor“ in 2015, noting that between 1995 and 2014 the number of female billionaires grew by a factor of 6.6, while the number of men increased by a smaller factor of 5.2.*
Tech entrepreneurs are injecting dynamism into the global economy, beyond their own sector.
It is no accident that technology is the only industry where billionaire wealth increased in 2018, rising 3.4% to USD 1.3 trillion. Their net wealth has almost doubled over the last five years, growing 91.4%. Software, internet, and electronic equipment entrepreneurs have built powerful businesses over the past 30 years.
However, pioneers driving the future of subsectors such as e-commerce, fintech, ride-hailing, and data systems are emerging fast.*
The Athena factor revisited The rise of tech’s titans
8 UBS/PwC Billionaires insights 2019
Increase
Growth
46%
3.4%
* Source: UBS/PwC Billionaires database.

China’s entrepreneurs have become the world’s second largest billionaire group over the past five years, overtaking Russia’s. Wealth almost tripled, growing by 202.6% to reach USD 982.4 billion.
But in 2018, Chinese billionaires’ net worth declined by 12.3%. The number of Chinese billionaires fell by 48 to 325.
Beyond the headline there were bigger swings in billionaire net worth. In fact, 103 people’s wealth dipped below a billion dollars, while 56 made the threshold.*
China’s volatility
UBS/PwC Billionaires insights 2019 9
Growth
Net worth corrected
202.6%
12.3%
* Source: UBS/PwC Billionaires database.

Section 1:
The billionaire effect: driving outperformance
In the story of commercial endeavor, the 30–40 years since the 1980s stand out as an entrepreneurial age. Starting in the US in the 1980s and then moving to Asia from 2000, a small number of entrepreneurs have applied new technol- ogies and business models to change entire industries. The pace of economic change has been faster than at any other time in history.
These entrepreneurs have excelled at creating and steer-ing businesses that outperform. Along the way they have become billionaires.
It would seem intuitive that billionaires’ companies should continue to outperform after they have reached this level of wealth. Yet it’s by no means a given: after all, past per-formance is no guarantee of future success. How much is luck? How much is skill? At what point do entrepreneurs lose their drive?
But our analysis confirms that, on average, billionaires’ success does continue – in both public equity markets and private markets. In fact, billionaire-controlled businesses outperform by a surprisingly large margin.
We call this the billionaire effect.

1 Control is defined as owning 20% or more of the company and/or 30% or more of the voting rights. More subjectively, we have also included companies where the billionaire may not have this percent of equity or votes but evidently steers the business.
2 Equally-weighted billionaire index taking into consideration billionaire-controlled companies of 2003, 2008 and 2013, see explanation of section 1 research methodology on page 30.
Delivering twice the market returnOver the 15 years to the end of 2018, billionaire-controlled companies listed on the equity markets returned almost twice the average market performance.1 Their annualized performance was 17.8% versus 9.1% for the MSCI AC World Index.2
Self-made billionaires‘ companies outperformed their multi- generational peers by an average of just 1.4% annually over the 15 years, with the rate of their outperformance accelerating from 2011. When control remains in the family, outperformance seems to last.
While the billionaire effect was strongest in the US, it was closely followed by APAC, where the Chinese economy in particular is continually reinventing itself, letting some businesses expand exponentially while others falter. Con-sumers willingly embrace fresh concepts. New technology and business models quickly succeed, supplanting their predecessors. Europe has lagged behind slightly, yet billion- aire-controlled companies still outperformed significantly.
Billionaire-controlled public companies’ index vs. MSCI ACWI (2003–2018)
Ind
ex V
alu
e
1,600
1,500
1,400
1,300
1,200
1,100
1,000
900
800
700
600
500
400
300
200
100
0Annualized average return
Billionaire-controlled public companies MSCI ACWI
31 Dec 03 31 Dec 1131 Dec 07 31 Dec 1531 Dec 05 31 Dec 1331 Dec 09 31 Dec 17 31 Dec 19
+9.1%
UBS/PwC Billionaires insights 2019 11
+17.8%

Consistently more profitableFurthermore, looking at the companies controlled by bil- lionaires in 2018 – whether public or private – the profi-tability of billionaire-controlled companies far exceeds the average for the MSCI AC World Index. Overall, public and private billionaire companies’ average return on equity
(ROE) was 16.6% over the 10 years to the end of 2018. The MSCI AC World Index averaged 11.3%. During the study period, the ROE of all companies varied as interest rates fluctuated, causing the cost of capital to rise and fall.3
Profitability is highest in the consumer and retail, technol- ogy, and financial services sectors. By contrast, companies in entertainment and media, materials, and utilities have the lowest ROEs, perhaps unsurprisingly as media compa-nies have struggled against digital competition, materials businesses have experienced headwinds from depressed commodity prices, and utilities are facing stiffer competi-tion from new renewable energy sources.
But a small subset of billionaire businesses target growth in capital value rather than profitability. In a similar way to a number of loss-making tech businesses, some of which have recently launched IPOs, they are focusing on maximiz- ing their sale price. Some 27 of the 535 billionaire com-panies we analyzed were making a loss – a third of them (nine) from the tech sector.4
3 See explanation of section 1 research methodology on page 30.4 535 is the total number of companies for which data was available over the
study period (and after allowing for outliers) for the ROE analysis.
Ave
rag
e R
etu
rn o
n E
qu
ity
in %
Profitability performance – public vs. private companies (2009–2018)
22
20
18
16
14
12
10
8
6
4
2
0
Publicly listed (PL) billionaire-controlled (BC) Privately held (PH) billionaire-controlled (BC) MSCI ACWI
2009 2010 2011 2012 2013 2014 2015 2016 2017 2018
12.1
%
13.0
%
13.8
% 15.3
%16.9
%
Avg. PHBC ROE17.1%
Avg. PLBC ROE16.5%
Avg. MSCI ACWI ROE11.3%
17.1
%
10.2
%
9.8
%
12.1
%
11.9
%
10.6
%12.0
%
12.7
%
8.3
%
14.8
%
14.1
%
16.6
%
17.3
%
18.2
%
22.1
%
22.3
%
16.2
%
15.2
%
15.1
%
15.8
%
16.7
%
17.4
%18.7
18.7
%
13.3
%
12 UBS/PwC Billionaires insights 2019

Champions of IPOsEven as they cross from private to public ownership, billionaire businesses continue to be more profitable than non-billionaire-controlled ones. Our analysis shows bil-lionaires control 102 businesses that have publicly listed in the past 10 years. In the three years leading up to IPO, these businesses had an average ROE of 35.4%.
After listing, the ROE naturally declined substantially as the creation of new equity diluted profitability. Average ROE dropped to 17.3%, but then steadily recovered in the following years. For comparison, analysis of the broader IPO universe over the same 10 years shows average ROE dropping to 14.8% after IPO and then declining still further in the following years.5
With billionaire-controlled businesses performing so strong-ly, it is little wonder that most billionaires choose to keep control. Almost all of the 2,101 billionaires on our database still hold interests in businesses. Some 1,936 have holdings
in companies – in 65% of cases they have controlling stakes. Their holdings in public and private businesses are roughly equal in number.
5 Our database includes over 9,000 companies that listed through an IPO between 2008 and 2018.
Year +6
8.9
%
19.5
%
Year +5
8.7
%
17.7
%
Pre- and post-IPO performance analysis
Billionaire-controlled companies Non-billionaire controlled companies
Year +4
9.3%
16.7
%
Year +3
10.2
%
18.2
%
Year +2
10.8
%
17.7
%
Year +1
14.8
%17.3
%
Year–1
22.3
%
36.1
%
Year–2
22.0
%
31.6
%
Year–3
19.9
%
38.5
%
IPO Event
UBS/PwC Billionaires insights 2019 13
Billionaires have an obsessive business focus, constantly scanning the
world for new opportunities.
6 “Master architects of great wealth and lasting legacies”. UBC/PwC. 2015.
From long-term vision to smart risk-takingWhy is there a billionaire effect? In our view, billionaires’ businesses thrive on the three distinct personality traits that we identified in our first billionaire report.6 These are appetite for smart risk-taking, business focus, and determi-nation.
When it comes to taking risk, billionaire entrepreneurs have a very optimistic attitude, focusing on risks they understand and finding smart ways to reduce them. They have an obsessive business focus, constantly scanning the world for new opportunities. And they are highly resilient, undeterred by failures and roadblocks.
But like family businesses more generally, billionaires’ enter- prises tend to pursue a long-term strategy that benefits from an exceptional alignment between performance and management incentives, whether the founder remains in control or a CEO from outside the family is hired. That leads to laser-focused research and development, concen-trated on the products most likely to create future value, as well as continual investment in the workforce.
“Our CEO is not motivated by salary nor bonus. Instead he has full alignment with the best interests of the family, the stakeholders, and the company’s values,” explains the office of a Hong Kong real estate billionaire.
The result? Billionaire businesses often lead the way. They understand their customers and innovate relentlessly.
In the words of a Swedish tech entrepreneur: “We generate innovation to drive growth continuously. Our long-term planning, the involvement of stakeholders, and a customer- centric approach are at the core of our decision-making process.”
All our analysis leads to one conclusion: the outperfor-mance we call the “billionaire effect” depends on the entrepreneur keeping control, irrespective of whether the business is public or private.
14 UBS/PwC Billionaires insights 2019

Business focus

Impact entrepreneurs seek new ways to
engineer environmental and social change.

Section 2:
Transforming the business of global philanthropy
Having created pioneering businesses, a small but growing number of billionaire entrepreneurs have now become even more ambitious: they want to make the world a better place by making a significant positive social and environmental impact. The same characteristics that drove their business success are being used to address the UN’s 17 Sustainable Development Goals (SDGs).7
These entrepreneurs are seeking new ways to engineer far-reaching environmental and social change. For them the key word is “impact,” which describes the broader effect of a program or investment. For example, studies have shown that if you reduce infant mortality, the mac- roeconomic impact of this at scale is a rise in economic growth and well-being.8 Similarly, improved education has the same effect.
Across the world, billionaires now possess huge private wealth and only a small portion of that is dedicated to achieving impact through philanthropy or social finance. But, undeniably, growing numbers of billionaires are apply-ing both their talents and their treasure to achieving impact – in some cases with outstanding results.
Why is this exciting? Because after 30 years of success, ultrawealthy entrepreneurs have accumulated considerable assets; they have proven problem-solving and organizational skills; they are in positions of influence. Further, they can risk new approaches that might only see results over the long term.
These impact entrepreneurs are strategic, innovative, and collaborative. They aim to be catalysts for change, by de- veloping models that can spark systemic shifts if followed by others.
Early successes show what can be achieved as this trend continues.
New collaborators and catalysts for changeTraditional grant giving is evolving into strategic philanthro-py. It has quietly been notching up big successes, especially in curing global diseases. The Bill & Melinda Gates Founda-tion, reputed to be the world’s largest foundation with an endowment of USD 46.8 billion,9 is a frontrunner. Since its establishment in 2000, the foundation has contributed to the virtual eradication of polio globally, and of meningitis A in sub-Saharan Africa. Currently, its goal for malaria is nothing short of “a world free of malaria.” The founda-tion‘s goal is to be “catalytic in reducing the burden of malaria and accelerating progress toward eradication of the disease.”10 Working with others such as the World Health Organization and other donors from around the world, it is focusing on the areas where it can have the most impact in terms of saving lives, using data to help refine its activities.
Historically, philanthropists acted alone. Think of the gol-den age of industrialist philanthropy, shaped by Carnegie, Ford, and Rockefeller. Even now, charitable foundations generally (not just billionaire-related) operate their own programs and activities.11 But that is changing. Billionaire philanthropists in particular are realizing that the best results are achieved through collaboration – not only with other billionaires, but also with the NGOs, charities, and governmental organizations that have the expertise and access needed to drive change.
A domestic US example of collaboration is the San Diego Trafficking Prevention Collective. Two dozen philan-thropists, the UBS Optimus Foundation, school districts, governmental officials, and local organizations have come together to raise awareness of human trafficking in the Californian county, which ranks in the top 13 areas in the US for human trafficking.12
7 Estimated annual funding gap stands at USD 5–7 trillion.8 Gates Foundation annual letter 2014.
9 Bill & Melinda Gates Foundation factsheet. 10 Bill & Melinda Gates Foundation website.11 Global Philanthropy Report. Harvard Kennedy School, supported by UBS. 12 UBS Optimus Foundation has helped to fund this project.
UBS/PwC Billionaires insights 2019 17

There are also growing numbers of foundations across the world that are taking a collaborative and catalytic approach. The Children’s Investment Fund Foundation (CIFF), backed by a London hedge fund, is an example. It works with a range of partners to transform the lives of children and adolescents in developing countries, aiming to have a cata-lytic role and effect change at scale.
But this development is not limited to US or European foundations. Take the Yidan Prize, established in 2016 by Dr. Yidan Chen, a founder of Tencent Holdings. While not an example of collaboration, the prize aims to be a catalyst in making education fit for the challenges of the future. It has the bold mission of creating a better world through education. Giving out awards of HKD 60 million (about USD 7.8 million) annually, the prize rewards two things: outstanding research into education, and innovative ideas to tackle challenges in education.
Some billionaire philanthropists now believe that instead of reinventing the wheel by building their own organizations, it’s better to partner with specialist NGOs and charities, rewarding them for delivering outcomes such as higher rates of literacy. Charities are evolving accordingly to re-main competitive.
Architects of impactBillionaires are increasingly impartial about how they create impact. They may have different pools of capital, some for grants and others set aside to make a return from sustaina-ble investments.
Breakthrough Energy Ventures shows how a network of 21 well-known billionaires – ranging from Richard Branson to Jeff Bezos and from Jack Ma to Prince Al-Waleed bin Talal – is seeking to develop new clean energy technologies. The goal? To provide scalable and profitable tools that enable a carbonless future, achieving environmental impact while also making a competitive financial return. An example of a Breakthrough Energy Ventures investment is Fervo Energy, a start-up seeking to develop geothermal energy as a source of clean electricity.
On the frontier between philanthropy and investing are development impact bonds13, an evolving type of social finance. These bonds are backed by results-based contracts in which investors can realize a financial return tied to social impact, and outcome funders only pay for successful results.
While these impact bonds have raised only a small amount of money from billionaires so far, there is growing interest (see India’s children box). The International Committee of the Red Cross is a pioneer of impact bonds, launching the first humanitarian impact bond in 2017. This inaugural bond aims to transform the financing of vital services pro- vided to citizens disabled in conflict in Nigeria, Mali, and the Democratic Republic of Congo.
Illustrating his commitment to making an impact, a Dutch entrepreneur from the consumer and retail sector told us: “Society expects me to be a philanthropist with my money, but the motivation for my philanthropic activities comes from a sense of purpose and changing the status quo.”
Three key ingredientsThe future success of entrepreneurs in achieving the broad social and environmental impact that they seek may de-pend on:
I. New approaches that aim to create catalysts for change and to deliver positive impact on a significant scale.
II. Consistent, verifiable outcome/impact targets that show what is being achieved, encouraging more widespread participation among not just the wealthiest philanthro-pists but also a wide range of pension funds, founda-tions, etc.
III. Widespread advocacy of the merits of collaboration that brings together teams of different stakeholders and leads to support for this “impact-first” approach over the traditional “outputs-based” official aid models.
18 UBS/PwC Billionaires insights 2019
13 Development impact bonds are not financial products
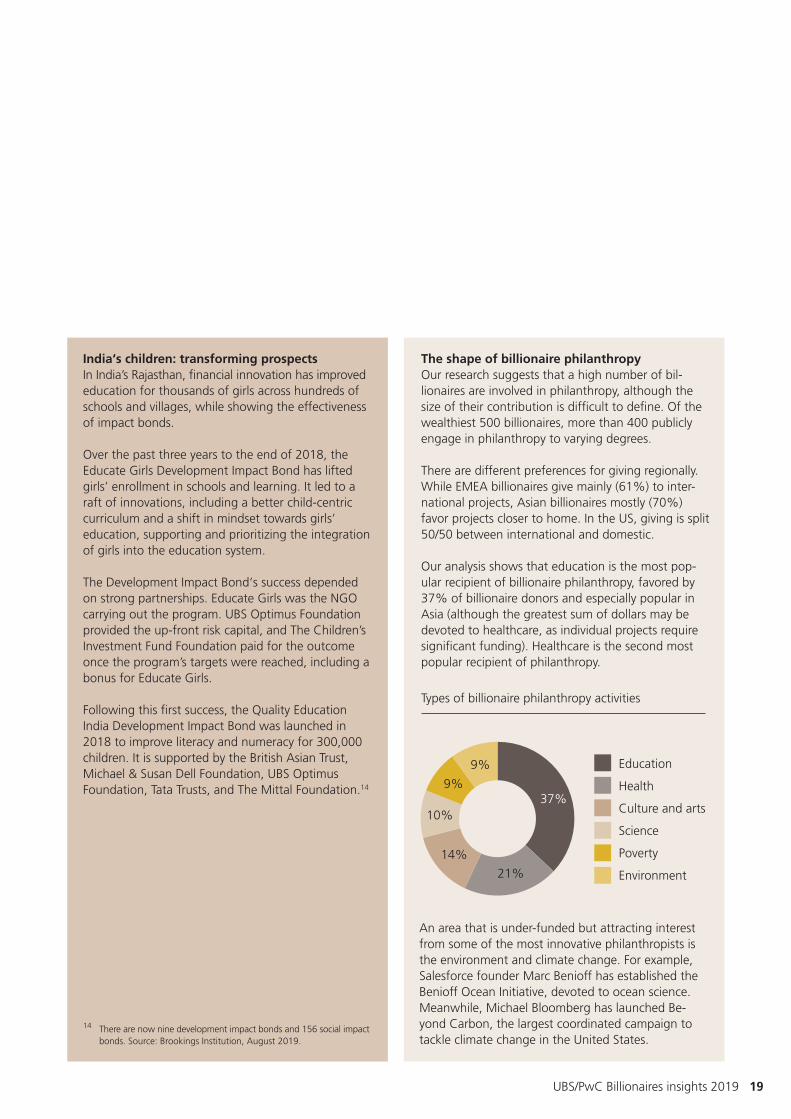
India‘s children: transforming prospectsIn India’s Rajasthan, financial innovation has improved education for thousands of girls across hundreds of schools and villages, while showing the effectiveness of impact bonds.
Over the past three years to the end of 2018, the Educate Girls Development Impact Bond has lifted girls’ enrollment in schools and learning. It led to a raft of innovations, including a better child-centric curriculum and a shift in mindset towards girls’ education, supporting and prioritizing the integration of girls into the education system.
The Development Impact Bond‘s success depended on strong partnerships. Educate Girls was the NGO carrying out the program. UBS Optimus Foundation provided the up-front risk capital, and The Children’s Investment Fund Foundation paid for the outcome once the program’s targets were reached, including a bonus for Educate Girls.
Following this first success, the Quality Education India Development Impact Bond was launched in 2018 to improve literacy and numeracy for 300,000 children. It is supported by the British Asian Trust, Michael & Susan Dell Foundation, UBS Optimus Foundation, Tata Trusts, and The Mittal Foundation.14
The shape of billionaire philanthropyOur research suggests that a high number of bil-lionaires are involved in philanthropy, although the size of their contribution is difficult to define. Of the wealthiest 500 billionaires, more than 400 publicly engage in philanthropy to varying degrees.
There are different preferences for giving regionally. While EMEA billionaires give mainly (61%) to inter-national projects, Asian billionaires mostly (70%) favor projects closer to home. In the US, giving is split 50/50 between international and domestic.
Our analysis shows that education is the most pop- ular recipient of billionaire philanthropy, favored by 37% of billionaire donors and especially popular in Asia (although the greatest sum of dollars may be devoted to healthcare, as individual projects require significant funding). Healthcare is the second most popular recipient of philanthropy.
An area that is under-funded but attracting interest from some of the most innovative philanthropists is the environment and climate change. For example, Salesforce founder Marc Benioff has established the Benioff Ocean Initiative, devoted to ocean science. Meanwhile, Michael Bloomberg has launched Be-yond Carbon, the largest coordinated campaign to tackle climate change in the United States.
14 There are now nine development impact bonds and 156 social impact bonds. Source: Brookings Institution, August 2019.
Types of billionaire philanthropy activities
Education
Health
Culture and arts
Science
Poverty
Environment
37%
21%
14%
10%
9%
9%
UBS/PwC Billionaires insights 2019 19
Section 3:
Five strong years close with a dip
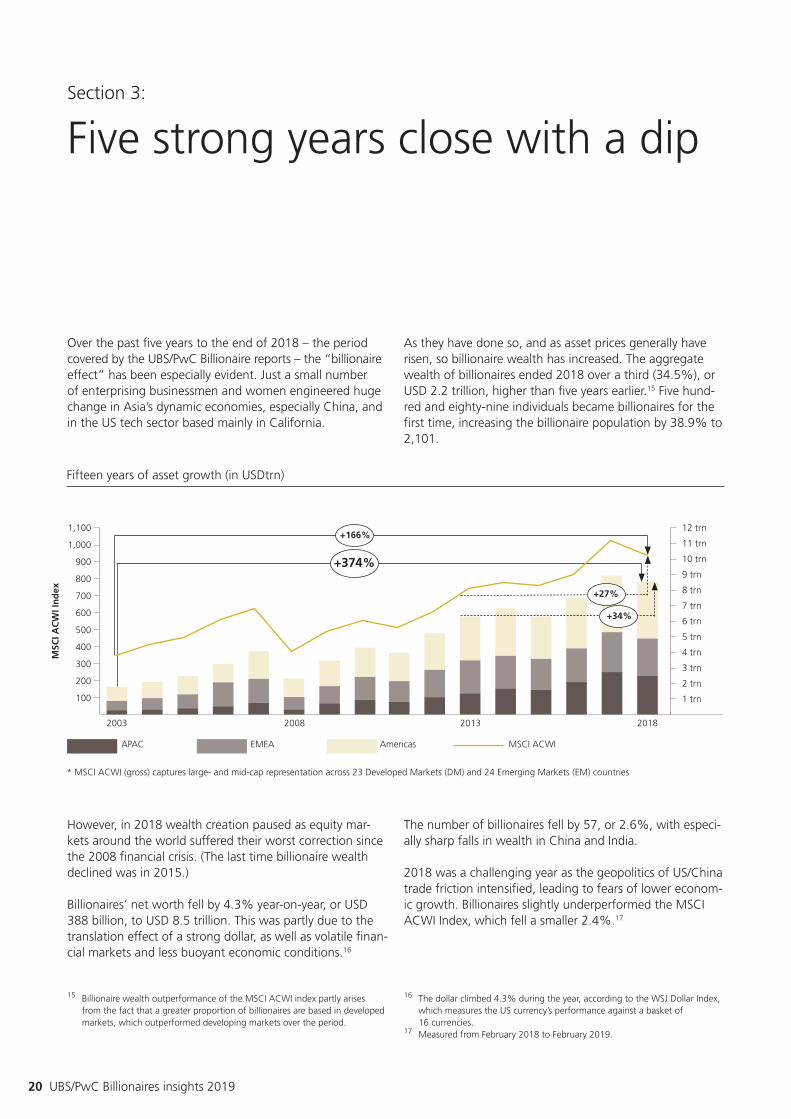
Over the past five years to the end of 2018 – the period covered by the UBS/PwC Billionaire reports – the “billionaire effect” has been especially evident. Just a small number of enterprising businessmen and women engineered huge change in Asia’s dynamic economies, especially China, and in the US tech sector based mainly in California.
As they have done so, and as asset prices generally have risen, so billionaire wealth has increased. The aggregate wealth of billionaires ended 2018 over a third (34.5%), or USD 2.2 trillion, higher than five years earlier.15 Five hund-red and eighty-nine individuals became billionaires for the first time, increasing the billionaire population by 38.9% to 2,101.
However, in 2018 wealth creation paused as equity mar-kets around the world suffered their worst correction since the 2008 financial crisis. (The last time billionaire wealth declined was in 2015.)
Billionaires’ net worth fell by 4.3% year-on-year, or USD 388 billion, to USD 8.5 trillion. This was partly due to the translation effect of a strong dollar, as well as volatile finan-cial markets and less buoyant economic conditions.16
The number of billionaires fell by 57, or 2.6%, with especi-ally sharp falls in wealth in China and India.
2018 was a challenging year as the geopolitics of US/China trade friction intensified, leading to fears of lower econom- ic growth. Billionaires slightly underperformed the MSCI ACWI Index, which fell a smaller 2.4%.17
15 Billionaire wealth outperformance of the MSCI ACWI index partly arises from the fact that a greater proportion of billionaires are based in developed markets, which outperformed developing markets over the period.
16 The dollar climbed 4.3% during the year, according to the WSJ Dollar Index, which measures the US currency’s performance against a basket of 16 currencies. 17 Measured from February 2018 to February 2019.
Fifteen years of asset growth (in USDtrn)
MSC
I AC
WI I
nd
ex
1,100
1,000
900
800
700
600
500
400
300
200
100
2003 2008 2013 2018
* MSCI ACWI (gross) captures large- and mid-cap representation across 23 Developed Markets (DM) and 24 Emerging Markets (EM) countries
MSCI ACWIEMEAAPAC Americas
+166%
+374%
12 trn
11 trn
10 trn
9 trn
8 trn
7 trn
6 trn
5 trn
4 trn
3 trn
2 trn
1 trn
+27%
+34%
20 UBS/PwC Billionaires insights 2019

Wealth creation paused in 2018

Billionaire wealth fell most sharply in the APAC region, with China particularly affected. APAC billionaire wealth correct- ed by 8.0%. The region was affected by slowing growth in China and rising US interest rates. Wealth in APAC ended 2018 at USD 2.5 trillion, down USD 217.6 billion. The net number of billionaires in the region fell by 7.4%, or 60, to 754. But that number masked considerable churn, as 169 people fell off the billionaire list and 110 new entrants emerged.18
Showing that the tough conditions were not limited to China and nearby economies, the representative of an In-dian consumer and retail billionaire said: “India’s economy went through financial stress, and consumer demand was subdued. Levels of trust dropped, and nobody is ready to lend anymore.”
EMEA billionaires saw their wealth fall by 6.8%, roughly twice the 3.5% currency depreciation of the euro versus the US dollar. Wealth shrank by USD 174.8 billion to USD 2.4 trillion. Here, the number of billionaires declined by 31, or 4.9%, to 598.
Only the Americas bucked the trend, lifted by the fortunes of US tech entrepreneurs – there were 89 US tech billion-
aires at the end of 2018, up from 70 in 2017. Billionaire wealth was broadly flat, with a marginal 0.1% increase of USD 4.4 billion to leave total wealth at USD 3.6 trillion. Across the Americas, the net number of billionaires rose by 33, or 4.8%, to stand at 749 by the year end.
China pauses after wealth triples in five yearsThe fortunes of China’s new business leaders are closely tied to those of its economy, which thrived over the past five years to the end of 2018 as the world’s center of eco-nomic activity shifted east. It was a time when the country’s steady urbanization continued, real estate prices boomed, the middle classes prospered, and consumer spending – much of it online – grew significantly (although consumer confidence fell after US/China trade friction ratcheted up). It was also the period when China‘s homegrown technol- ogy industries became globally important.
2018 was the year when China paused for reflection. The government sought to rein in financial leverage in the shadow banking system, tightening financial liquidity to certain industries of the private sector. It also tightened regulation over much of the new economy. The MSCI China Index fell by 18.8% (in USD), its worst performance since 2011. (For context, the index rose by 54.07% in 2017.)
Chinese billionaires’ net worth corrected by 12.3% (in USD). A depreciation in the Chinese yuan against the US dollar (by around 6%) accounts for roughly half of the decline, as currency markets fretted about the possible impact of deglobalization.
But seen over five years, 2018 was just a bump in the road. China’s entrepreneurs have quickly risen to become the world’s second largest billionaire group in this time (over- taking Russia). Their net wealth tripled, growing by 202.6%, and reaching USD 982.4 billion. At the end of 2018, China was home to almost an eighth of all billionai-res’ wealth worldwide.
18 Note: one billionaire changed nationality.
-4.3%
Self-made Multigenerational
2.94 2.75
5.97
2017 2018
5.78
8.91 8.53
Billionaire wealth dips (in USDtrn)
China’s entrepreneurs have quickly risen to become the
world’s second largest billionaire group in five years.
22 UBS/PwC Billionaires insights 2019

China‘s entrepreneurs: masters of risk in a developing economyIn the story of China’s overnight billionaires, the challenges of growing a business in a fast-developing economy are often missed.19 It’s said there that “a crisis is an opportunity riding a dangerous wind.” Hence, it’s accepted that great business success necessitates mastering calculated risk.
And so fast is the economy evolving that there is no such thing as a comfortable competitive advantage. Creative disruption of business happens with a feroci-ty not seen anywhere else.
2018 is a revealing snapshot. There were 325 China billionaires at the year end, down 48 on the previous year. Beyond the headline there were bigger swings in billionaire net worth. In fact, 103 people’s wealth dipped below a billion dollars, while 56 reached this threshold.20
19 While China is now the world’s largest economy at purchasing power parity (PPP), it lags the US and Europe in terms of GDP per capita. Sources: The Asian century is set to begin, Financial Times, March 26, 2019; IMF World Economic Outlook database.20 Note: one Chinese billionaire changed nationality.
China’s volatility: new entrants vs. drop-offs
20172016201520142013 2018
180
160
140
120
100
80
60
40
20
0
New Entrants Drop-offs

Tech creates industries of the futureTech entrepreneurs, mainly from the US, are injecting dyna-mism into the global economy far beyond their own sector. Our analysis shows that many are leveraging technology to enable new business models in sectors ranging from retail to transport to finance.
It’s no accident that tech stands out as the one industry where billionaire wealth increased in 2018, rising 3.4% to USD 1.3 trillion, mainly in the US. Such is the sector’s ener-gy that the number of billionaire-controlled tech compa-nies has almost doubled from 76 to 148 over the past five
years. By contrast, industrials was the worst performing – falling by 15.1% to USD 608.9 billion – against a backdrop of declining commodity prices.
By the end of 2018, tech billionaires’ assets totaled USD 1.3 trillion. Their net wealth has almost doubled over five years, growing by 91.4%. If tech billionaires’ wealth were a country, it would rank second only to the US. Looking back over five years, tech billionaires have driven almost a third of the growth in billionaire wealth. US tech billionaires accounted for more than half of that growth.
Number of billionaires across the regions 2017–2018
Pioneers of the future are bringing change across sectors.
24 UBS/PwC Billionaires insights 2019
Region SubregionNumber of
billionaires 2017Number of
billionaires 2018
Total aggregated wealth
2018 in USDbnAvg. age 2018
Share of female billionaires in %
APAC 814 754 2,491.9 62.35 8%
Greater China 475 436 1,387.7 58.94 8%
Oceania 43 36 114.4 67.78 19%
Southeast Asia 296 282 989.8 66.94 5%
EMEA 629 598 2,409.2 62.90 14%
Eastern Europe 163 151 543.1 56.96 5%
MENA 52 50 162.3 66.10 6%
Western Europe 414 397 1,703.8 64.79 18%
Americas 715 749 3,635.7 66.60 13%
North America 631 652 3,264.1 66.50 12%
Central and South America
84 97 371.6 67.27 13%
Total 2,158 2,101 8,536.8 64.03 11%

The software, internet, and electronic equipment entre-preneurs who have built powerful businesses over 30 years are still the wealthiest. Many of their businesses are phenomenal cash generators. Software, internet, and elect-ronic equipment billionaires still account for 62.2% of tech wealth, down from over three quarters (77.1%) five years earlier. However, new billionaires are emerging in sectors such as fintech and multimedia, where billionaire wealth has appreciated by 419% and 504% respectively over five years. Ten of the world’s top 20 tech billionaires are from the US and four from China. The others come from Germany, In-dia, and Japan; each are home to two of the top 20. Even so, pioneers of the future such as e-commerce, fintech, ride hailing, and data systems are making headway, as they stand to disrupt swathes of the global economy. Freshly
minted billionaires include Zhang Yiming, the Chinese internet entrepreneur who founded ByteDance, the social media group. He was the 14th wealthiest tech entre-preneur, after not appearing on the list at all five years ago. In the US, Travis Kalanick, the founder and former CEO of Uber, became a billionaire in 2014, as did Airbnb co-foun-ders Nathan Blecharczyk, Joe Gebbia, and Brian Chesky.
Arguably, some of them should be included in the media, transport, and hotels sector in the future, as they become forerunners of change in these sectors.
500
400
300
200
100
0
Tech subindustries development 2013–2018
* Other contains nonattributable categories (i.e. ride-hailing services, research institutes, data systems)
+36%
Electronicequipment
+53%
Software
+71%
Internetinformation
provider
+232%
E-commerce
+145%
Informationtechnology
+504%
Multimedia
-100
+162%
Semi-conductors
+419%
Financialtechnology
+378%
Other*
Tota
l wea
lth
in U
SDb
n
Gro
wth
in %
20182013
400
300
200
100
0
-9%
Telecomservices
Top growth
industries
UBS/PwC Billionaires insights 2019 25

We first identified the trend for female billionaires to out-pace men in our 2015 report, “The changing faces of bil-lionaires,” naming it the “Athena Factor” after the Greek goddess of wisdom, courage, and inspiration.21 In APAC, over half (57%) of female billionaires were entrepreneurs at the end of 2018.
Four in 10 of 2018’s self-made female billionaires built businesses in the consumer and retail sector. For instance, business partners Li Haiyan and Shu Ping became billion- aires after the 2018 IPO of their Haidilao hotpot restaurant chain, which is expanding outside China. In the US, Anas-tasia Soare, a Romanian-American businesswoman who founded the beauty brand Anastasia Beverly Hills, became a billionaire. Additionally, in Russia, Tatyana Bakalchuk, a former English teacher and mother of four, became a billionaire. While on maternity leave in 2004, she founded Wildberries, which has since become Russia’s largest online retailer.
21 Our research showed that the number of female billionaires grew by a factor of 6.6, from 22 in 1995 to 145 in 2014. The number of male billionaires grew by a relatively smaller factor of 5.2. (Note: the geo- graphical base of our database has expanded since 2014.)
Billionaires diversify for tougher times, say advisorsJust as the world’s economic headwinds blow harder and political volatility rises, so billionaires are prepar- ing by making some fundamental changes.
A survey of more than 100 UBS advisors – who between them work with more than 100 billionaires – showed that billionaires are making significant changes to their investment strategies. More than a fifth (22%) of advisors report that billionaire clients have altered their investment strategy in the last 12 months, with another 13% expecting clients to do so in the next 12.
Many have also sold businesses, and are planning to diversify their assets more widely. A third (33%) of advisors say that billionaire clients have sold busines-ses through trade sales or IPOs in the last 12 months, with 30% expecting them to do so in the next 12.
Our advisors see billionaire clients reacting to the current environment by investing the proceeds of business sales into a wide range of private market investments.
One fast-growing area of investment is sustainable investing. Sixteen percent of advisors say that their clients plan to increase sustainable and impact invest- ing over the next 12 months, up from the 7% that did so in the last 12 months.
Clearly times are getting tougher. Billionaires are acting accordingly, making fundamental changes in their businesses and investments. “I am not con-cerned about geopolitical tensions as much as I am about nationalism,” explains a French financial ser-vices billionaire. “I have assets globally, which assure my wellbeing. Diversification is a key element of my (investment) strategies.”
Almost 50% more female billionaires
+46%
36 4050
62
56 70 75 78 83
160192 189
211232
78 86 74 83 87
58
233
81
94
2013 2014
EMEAAPAC Americas
2015 2016 2017 2018
26
Women are joining the ranks of billionaires in
greater numbers.
26 UBS/PwC Billionaires insights 2019
“Athena factor” revisited: female billionaires have an edge Women are joining the ranks of billionaires in greater num-bers, even edging ahead of growth of male billionaires. Their number has grown by 46% in five years, from 160 to 233, as businesswomen have become increasingly success- ful. By comparison, the number of male billionaires has expanded more slowly by a lower 39%. Female billionaires’ assets have expanded by over a quarter (26%) to USD 871.2 billion, lifted mainly by progress in Asia.


Section 4:
Looking ahead
Over the years since the financial crisis, entrepreneurs thrived at a time of increasing free trade and inflating asset prices. Rising corporate earnings and low interest rates stoked the value of companies in public and private markets as well as other assets such as real estate. Yet with trade friction escalating and the economic cycle aging, the outlook now appears less certain.
Billionaire entrepreneurs are pragmatic about operating in all economic and market circumstances. Yet they strike a note of caution. In the words of one Southeast Asian billionaire, “I am concerned about the supply chain being disrupted. Companies will think twice about things, about where to be. Safety and fall back options are key. Global growth will fall, as will commodity prices.”
That said, the billionaire effect we have identified in this report will continue, even if the focus of entrepreneurial activity shifts to digital, material, or biological technologies or towards Asia.
What of billionaire philanthropy? Here, a small number of billionaires have made a substantial impact. There are signs that the level of billionaire activity may be increasing follow- ing the accumulation of wealth over the past 30–40 years of the entrepreneurial age. It only takes a few committed individuals to make a big difference.
28 UBS/PwC Billionaires insights 2019

Just a small number of committed billionaires
can make a substantial
impact.

Research methodology for section 1
To conduct the research in section one, we first needed to identify the companies controlled by billionaires. Taking the 2,101 billionaires in our database at the end of 2018, we identified those companies that they controlled, using the following definition of control:• 20% or more of a company’s equity;• 30% or more of a company’s voting rights;• despite having less than 20% of the equity and 30%
of voting rights, the billionaire evidently steers the company.
Goals and scopeWe set out to assess the performance of billionaire-controlled companies in three ways:• Through stock performance in public equity markets
(by creating an index)• By comparing the profitability of billionaire-controlled
companies under different ownership models;• Analyzing the pre- and post-IPO profitability.See below for methodologies in each of these three areas of analysis.
Stock performance on public equity marketsWe identified publicly listed companies controlled by billion- aires at the end of the years 2003, 2008, 2013 and 2018, narrowing this selection further to companies that repre-sent a respective billionaire‘s primary source of wealth.
From this selection, the stock performance data was collec-ted for 604 companies from 1 January 2003 to 31 Decem-ber 2018, using Bloomberg as data source. We calculated the average annualized returns for the companies selected in 2003, 2008 and 2013, and constructed an index that switches the universe every five years to the new set of billionaire-controlled companies in order to reduce the selection bias.
The index has been adjusted to reflect the sector and region- al weightings of the MSCI ACWI.
The MSCI ACWI is a market capitalization weighted index designed to provide a broad measure of equity-market performance throughout the world. The MSCI ACWI is
maintained by Morgan Stanley Capital International (MSCI) and is comprised of stocks from 23 developed countries and 24 emerging markets.
We focused on the returns of an equal-weighted portfolio rather than on a capitalization-weighted portfolio.
In terms of numbers of companies in scope, both universes of constituents (billionaire companies and the MSCI ACWI) increased over the past 15 years. The number of billionaire companies, however, increased significantly more in terms of percentage points.
Profitability under different ownership models For this analysis, we looked at the companies controlled by the billionaires in our 2018 list and included privately held companies. We selected 535 companies judged to be bil-lionaires’ primary sources of wealth and for which data was available for the 10 years from 2008 to 2018. We calculat- ed the average return on equity (ROE) per year, excluding the outliers, and ensuring that the data collected covered all regions and all sectors. We then compared ROE against the average for the MSCI ACWI.
Pre-/post-IPO profitability We identified 102 billionaire-controlled companies (exclud- ing outliers) that, based on Bloomberg data, have floated on public equity markets in the 10 years from 2009 to 2019. We calculated the average ROEs for these companies in the three years before initial public offering (IPO) and up to six years after. Average ROE was compared with that for 9,069 non-billionaire-controlled companies that had an IPO from January 2009 until July 2019.
30 UBS/PwC Billionaires insights 2019
Disclaimer
This document has been prepared by UBS Switzerland AG and is for personal use only.
This document and the information contained herein are provided solely for information purposes to specific clients/prospects and shall not be regarded as investment research. It does not constitute an offer, recommendation or a solicitation of an offer to buy or sell any security, investment instrument, product or other specific service, or recommendation or introduction of any specific investment instrument or financial services or to effect any transactions or to conclude any legal act of any kind whatsoever. Certain services and products are subject to legal restrictions and/or license or permission requirements and cannot therefore be offered worldwide on an unrestricted basis. No offer of any interest in any product will be made in any jurisdiction in which the offer, solicitation or sale is not permitted, or to any person to whom it is unlawful to make such offer, solicitation or sale. Information contained in this document has not been tailored to the specific investment objectives, personal and financial circumstances or particular needs of any recipient. Certain investments may not be suitable for all investors. UBS Group AG and its subsidiaries (hereinafter UBS) strongly recommend to all persons considering the information in this document to obtain appropriate independent investment, legal, tax and other professional advice. Neither UBS nor any of its employees provide tax or legal advice. Nothing in this document shall constitute investment, legal or tax advice.
Although all information and opinions expressed in this document were obtained from sources believed to be reliable and in good faith, no representation or warranty, express or implied, is made as to its accuracy, sufficiency, completeness or reliability, nor is it intended to be a complete statement or summary of the developments referred to in it. All information and opinions expressed in this document are subject to change without notice and may differ or be contrary to opinions expressed by other business areas or divisions of UBS or PwC. UBS and PwC are under no obligation to update or keep current the information contained herein. Any charts and scenarios are for illustrative purposes only. Historical performance is no guarantee for and is not an indication of future perfor-mance. Some charts and/or performance figures may not be based on complete 12-month periods which may reduce their comparability and significance.
This document may not be redistributed or reproduced in whole or in part wit-hout the prior written permission of PwC and UBS, and no liability whatsoever for the actions of third parties in this respect is accepted. To the extent permitted by law, neither UBS, PwC nor any of their directors, employees or agents accept or assume any liability, responsibility or duty of care for any consequences of you or anyone else acting, or refraining to act, in reliance on the information contained in this document or for any decision based on it.
UBS Financial Services Inc. is a subsidiary of UBS AG. Member FINRA/SIPC. In providing wealth management services to clients, we offer both investment advi-sory and brokerage services which are separate and distinct and differ in material ways. For information, including the different laws and contracts that govern, visit ubs.com/workingwithus.
PwC is not affiliated with UBS.
© PwC 2019. All rights reserved. PwC refers to the PwC network and/or one or more of its member firms, each of which is a separate legal entity. Please see www.pwc.com/structure for further details.
© UBS 2019. The key symbol and UBS are among the registered and unregis-tered trademarks of UBS. All rights reserved.
For further information please contactStephanie Tobler MucznikManager Integrated Communications, PwC Switzerland+41 58 792 18 16, [email protected]
Andrea Colosio ADV FS Consulting, PwC Switzerland+41 58 792 40 19, [email protected]
Oliver GadneyMedia Relations, UBS+44 20 756 89982, [email protected]
84578E
UBS/PwC Billionaires insights 2019 31

ubs.com/billionairespwc.ch/billionaires
New visionaries and the Chinese Century Billionaires insights 2018
ab