November, 2013 Next steps – Need to look at new assessment rubric and start looking at monitoring...
26
November, 2013 • Next steps – Need to look at new assessment rubric and start looking at monitoring measurable objectives, identifying sub groups and targeted strategies
-
Upload
blanche-roberts -
Category
Documents
-
view
216 -
download
0
Transcript of November, 2013 Next steps – Need to look at new assessment rubric and start looking at monitoring...

November, 2013
• Next steps– Need to look at new assessment rubric and start
looking at monitoring measurable objectives, identifying sub groups and targeted strategies

Naples Elementary School
SY 12-13 CSI Status Report | End of Year Data Review

Goal 1: Reading Comprehension• Goal 1 (G1): All students at Naples Elementary School will improve in reading
comprehension by making connections• Measurable Objectives:
• M1: 75% of Second, Third, Fourth, Fifth and Sixth grade students will Demonstrate a proficiency in reading comprehension in English Language Arts by 06/07/2013 as measured by achievement at or above the ‘Proficient’ Lexile range on the Scholastic Reading Inventory (BoY, Mod, EoY).
• M2: 75% of Fourth, Fifth and Sixth grade students will Demonstrate a proficiency in reading comprehension in English Language Arts by 06/07/2013 as measured by achieving 75% mastery on the Reading Street Baseline local assessment. (Pilot)
• M3: 75% of Kindergarten, First, Second and Third grade students will Demonstrate a proficiency in Reading Comprehension by making connections in English Language Arts by 06/07/2013 as measured by Instructional level achievement ‘At or Above the Standard’ on the Benchmark Assessment System (BoY, Mid, EoY).
• M4: 75% of Third, Fourth, Fifth and Sixth grade students will Demonstrate a proficiency in Reading Comprehension in English Language Arts by 06/07/2013 as measured by achievement ‘At or Above the Standard’ (51st-99th % tile) on the TerraNova Reading Subtest (March).

Goal 1
Data Points from School Profile• Terra Nova Multiple Assessments 3rd Edition:
Reading Subtest • SRI Lexiles (SRI)• Developmental Reading Assessment (DRA)

TMNA 3rd Edition Reading
SY
Grade Subject N
% Above Standard (76th-
99th %tile)
% At the Standard (51st-
75th %tile)
% Partially Met the Standard
(26th-50th %tile)
% Below the Standard (1st-
25th %tile)Median Percentile
% At/Above Standard
2008-2009 3 Reading 118 42 31 15 12 73 732009-2010 3 Reading 128 35 36 20 9 66 712010-2011 3 Reading 108 34 38 19 9 69 722011-2012 3 Reading 102 35 37 15 14 66 722008-2009 4 Reading 133 34 32 26 8 61 662009-2010 4 Reading 106 32 38 26 4 64 702010-2011 4 Reading 108 31 32 29 8 59 632011-2012 4 Reading 111 40 37 19 5 70 772008-2009 5 Reading 127 43 31 20 6 69 742009-2010 5 Reading 124 34 34 22 10 66 682010-2011 5 Reading 102 37 41 16 6 68 782011-2012 5 Reading 103 34 41 18 7 65 752008-2009 6 Reading 103 45 33 15 8 72 782009-2010 6 Reading 126 44 38 15 3 73 822010-2011 6 Reading 108 42 34 19 6 71 762011-2012 6 Reading 97 42 37 16 5 71 79
ReadingSY 11-12 3rd grade had 14% of students in the bottom quarter.
At/Above standard range in grades 4-6 are above 75% of students, 3rd grade is high still at 72%.
Longitudinal changes
3rd grade has maintained a relatively high (above 8%) percentage of students in the bottom quarter.
4th and 5th grade performance fluctuates over the four years. 6th grade has maintained very high percentage of students above the 50th percentile with
all four years equal to or greater than 75%.

Scholastic Reading Inventory End of Year Lexiles
Grade
SY 11-12 SY 10-11
N Mean N Mean
02 101 545 107 437
03 92 651 103 701
04 111 846 82 807
05 96 937 98 952
06 88 1032 109 1017
Grade DoDEA ‘At the Standard’ Lexile Levels
4 600L to 900L
5 700L to 1000L
6 800L to 1050L
Findings: •Grades 4-6 are within DoDEA’s end of year ‘at the standard’ ranges.•Mean scores are very close to the range upper limit.•Mean scores for grades 2, 4, 6 improved from the previous year whereas grades 3 and 5 declined.

Goal 2: Math• Goal 2 (G2): All students at Naples Elementary School will improve their
understanding of math number sense and operational concepts• Measurable Objectives:• M1: 75% of Kindergarten, First and Second grade students will Demonstrate a
proficiency in number sense and operational concepts in Mathematics by 06/07/2013 as measured by 75% correct on the Everday Mathematics Assessments (BoY, Mid, EoY).
• M2: 75% of Third, Fourth and Fifth grade students will Demonstrate a proficiency in number sense and operational concepts in Mathematics by 06/07/2013 as measured by 75% correct on the EnVision Math Assessments (BoY, Mi, EoY).
• M3: 75% of Sixth grade students will Demonstrate a proficiency in number sense and operational concepts in Mathematics by 06/07/2013 as measured by 75% correct on the 7th Grade Placement Test.
• M4: 75% of Third, Fourth, Fifth and Sixth grade students will Demonstrate a proficiency in number sense and operational concepts in Mathematics by 06/07/2013 as measured by achievement ‘At or Above the Standard’ (51st-99th % tile) on the TerraNova Math Subtest (March).

Goal 2
Data Points from School Profile • Terra Nova Multiple Assessments 3rd Edition:
Math Subtest (3rd-6th)• Grade Level Curriculum Baseline Assessments (K-
6th)• Teacher Perception Survey
TNMS 3rd Edition Math
SY
Grade Subject N
% Above Standard
(76th-99th %tile)
% At the Standard
(51st-75th %tile)
% Partially Met the Standard
(26th-50th %tile)
% Below the Standard (1st-
25th %tile)Median Percentile
% At/Above Standard
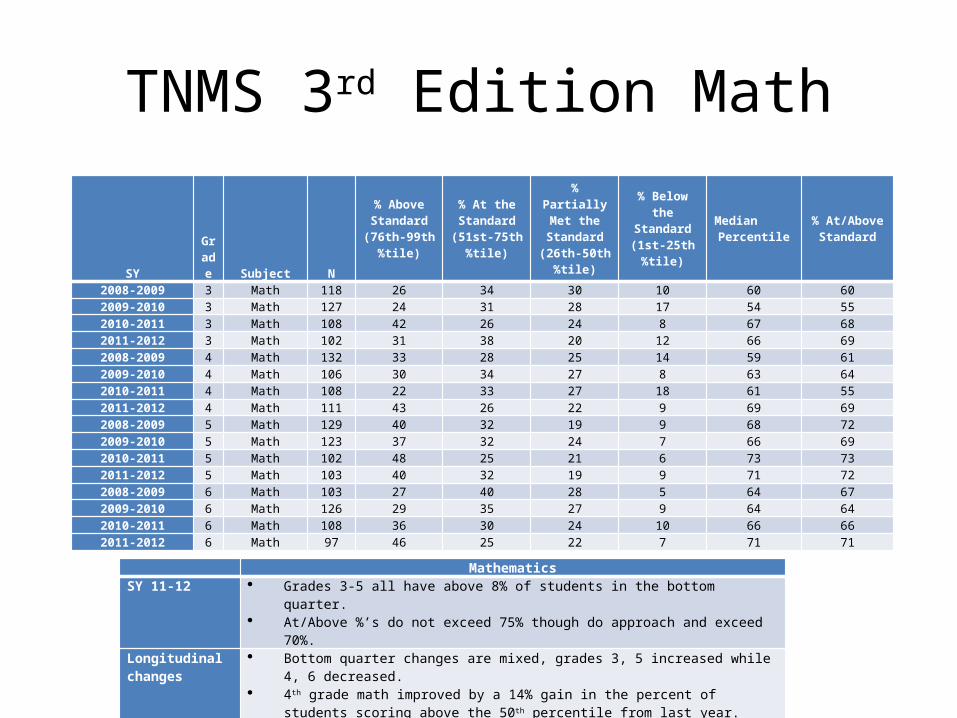
2008-2009 3 Math 118 26 34 30 10 60 602009-2010 3 Math 127 24 31 28 17 54 552010-2011 3 Math 108 42 26 24 8 67 682011-2012 3 Math 102 31 38 20 12 66 692008-2009 4 Math 132 33 28 25 14 59 612009-2010 4 Math 106 30 34 27 8 63 642010-2011 4 Math 108 22 33 27 18 61 552011-2012 4 Math 111 43 26 22 9 69 692008-2009 5 Math 129 40 32 19 9 68 722009-2010 5 Math 123 37 32 24 7 66 692010-2011 5 Math 102 48 25 21 6 73 732011-2012 5 Math 103 40 32 19 9 71 722008-2009 6 Math 103 27 40 28 5 64 672009-2010 6 Math 126 29 35 27 9 64 642010-2011 6 Math 108 36 30 24 10 66 662011-2012 6 Math 97 46 25 22 7 71 71
MathematicsSY 11-12 Grades 3-5 all have above 8% of students in the bottom quarter.
At/Above %’s do not exceed 75% though do approach and exceed 70%.Longitudinal changes
Bottom quarter changes are mixed, grades 3, 5 increased while 4, 6 decreased. 4th grade math improved by a 14% gain in the percent of students scoring above the 50th
percentile from last year. All grade levels appear to have performance fluctuations on the % At/Above Standard
indicator. 3rd and 4th grade do have consistently high percentages of students in the bottom quarter.

Local Math Curriculum TestGrade N Mean
K 104 89
1 106 82
2 104 73
3 92 74
4 107 73
5 107 81
6 90 65
Findings: Percent correct performance is highest among grades K, 1, and 5.Grades 2-4 is relatively average.Grade 6 is barely passing.
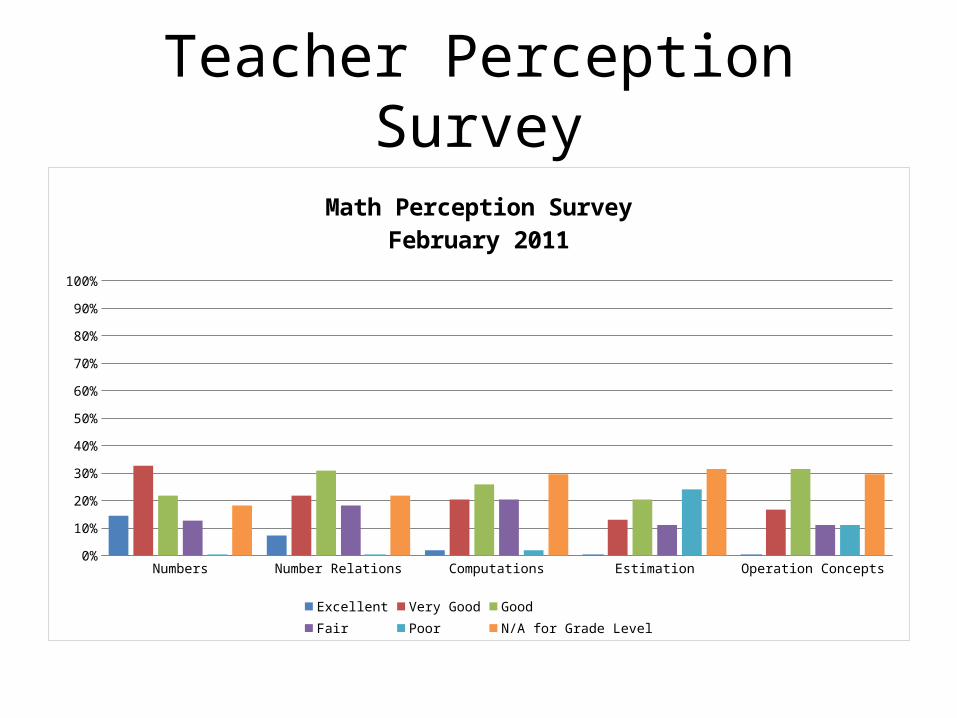
Teacher Perception Survey
Numbers Number Relations Computations Estimation Operation Concepts0%
10%
20%
30%
40%
50%
60%
70%
80%
90%
100%
Math Perception SurveyFebruary 2011
Excellent Very Good Good Fair Poor N/A for Grade Level
2012-2013 Data
Local and System-Wide Assessment Results and Analysis.

G1 M1: 75% of Second, Third, Fourth, Fifth and Sixth grade students will Demonstrate a proficiency in reading comprehension in English Language Arts by 06/07/2013 as measured by achievement at or above the ‘Proficient’ Lexile range on the Scholastic Reading Inventory (BoY, Mid, EoY).
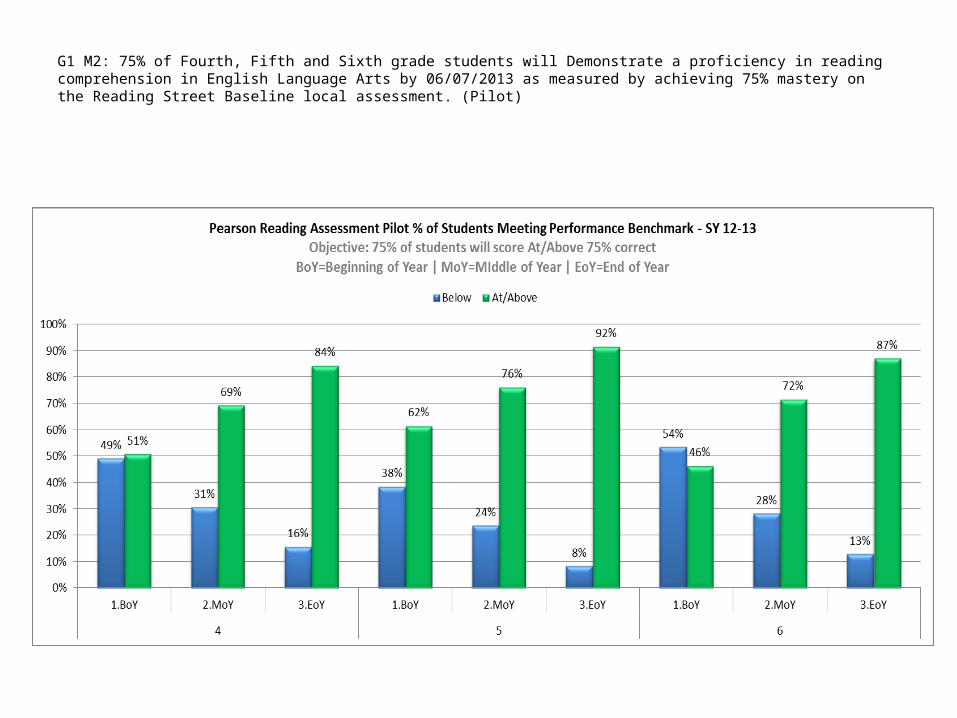
G1 M2: 75% of Fourth, Fifth and Sixth grade students will Demonstrate a proficiency in reading comprehension in English Language Arts by 06/07/2013 as measured by achieving 75% mastery on the Reading Street Baseline local assessment. (Pilot)

G1 M3: 75% of Kindergarten, First, Second and Third grade students will Demonstrate a proficiency in Reading Comprehension by making connections in English Language Arts by 06/07/2013 as measured by Instructional level achievement ‘At or Above the Standard’ on the Benchmark Assessment System (BoY, Mod, EoY).

G1 M4: 75% of Third, Fourth, Fifth and Sixth grade students will Demonstrate a proficiency in Reading Comprehension in English Language Arts by 06/07/2013 as measuredby achievement ‘At or Above the Standard’ (51st-99th % tile) on the TerraNova Reading Subtest (March).
3 4 5 6Naples ES
0
25
50
75
100
73
66
7478
71 70 68
82
72
63
78 7672
77 7579
7370
75
81
Reading - 2008-2009 Reading - 2009-2010 Reading - 2010-2011 Reading - 2011-2012 Reading - 2012-2013

November, 2013• A next step for your team/school is to start really looking at
subgroups....for example, looking at students on the bubble and what Strategy/Strategies can help them. Look at writing an Objective that focuses on reducing the number in the bottom quarter or 3rd quarter.
• Or, look at student performance by grade level and determine if a Measurable Objective for different grade levels is necessary. I don't necessarily see any glaring areas for this except with TN Reading (3rd versus 6th disparity).
• Some of your Measurable Objectives look like they may need to be raised b/c of the % already meeting them.

G2 M1: 75% of Kindergarten, First and Second grade students will Demonstrate a proficiency in number sense and operational concepts in Mathematics by 06/07/2013 as measured by 75% correct on the Everyday Mathematics Assessments (BoY, MoY, EoY).
1.BoY 2.MoY 3.EoY 1.BoY 2.MoY 3.EoY 1.BoY 2.MoY 3.EoY1 2 K
0%
10%
20%
30%
40%
50%
60%
70%
80%
90%
100%100%
95%
32%
99%
76%
30%
95%
55%
14%
0%5%
68%
1%
24%
70%
5%
45%
86%
Local Math Assessment % of Students Meeting Performance Benchmark - SY 12-13
Objective : 75% of students will score At/Above 75% correctBoY=Beginning of Year | MoY=MIddle of Year | EoY=End of Year
Below 75% correct At/Above 75%

G2 M2: 75% of Third, Fourth and Fifth grade students will Demonstrate a proficiency in number sense and operational concepts in Mathematics by 06/07/2013 as measured by 75% correct on the enVision Math Assessments (BoY, MoY, EoY).
1.BoY 2.MoY 3.EoY 1.BoY 2.MoY 3.EoY 1.BoY 2.MoY 3.EoY3 4 5
0%
10%
20%
30%
40%
50%
60%
70%
80%
90%
100% 96%
84%
36%
97%
71%
47%
97%
84%
50%
4%
16%
64%
3%
29%
53%
3%
16%
50%
Local Math Assessment % of Students Meeting Performance Benchmark – SY 12-13
Objective : 75% of students will score At/Above 75% correctBoY=Beginning of Year | MoY=MIddle of Year | EoY=End of Year
Below 75% correct At/Above 75%

G2 M3: 75% of Sixth grade students will Demonstrate a proficiency in number sense and operational concepts in Mathematics by 06/07/2013 as measured by 75% correct on the 7th Grade Placement Test.
1.BoY 2.MoY 3.EoY6
0%
10%
20%
30%
40%
50%
60%
70%
80%
90%
100% 94%
80%
55%
6%
20%
45%
Local Math Assessment % of Students Meeting Performance Benchmark - SY 12-13
Objective : 75% of students will score At/Above 75% correctBoY=Beginning of Year | MoY=MIddle of Year | EoY=End of Year
Below 75% correct At/Above 75%

G2 M4: 75% of Third, Fourth, Fifth and Sixth grade students will Demonstrate a proficiency in number sense and operational concepts in Mathematics by 06/07/2013 as measured by achievement ‘At or Above the Standard’ (51st-99th % tile) on the TerraNova Math Subtest (March).
3 4 5 6Naples ES
0
25
50
75
100
60 61
7267
55
6469
6468
55
73
6669 69
72 7175 74 75
82
Math - 2008-2009 Math - 2009-2010 Math - 2010-2011 Math - 2011-2012 Math - 2012-2013

Specific Measurable Objective Findings:Objective Did not Meet Met/Exceeded
G1.M1 None 2nd, 3rd, 4th, 5th & 6th
G1.M2* None 4th, 5th and 6thG1.M3 Kinder, 1st, 2nd,
3rdNone
G1.M4** 3rd and 4th 5th and 6th G2.M1 1st and 2nd KinderG2.M2 3rd, 4th and 5th NoneG2.M3 6th NoneG2.M4 4th 3rd, 5th and 6th
• *For G1.M2-2012-2013 was our pilot year for the Reading Streets Benchmark assessment. A select group of teachers at each grade level volunteered. After reviewing the EoY data, the 4th, 5th, 6th grade team will decide if a second data piece is needed.
• ** For G1.M4 – Kinder and 1st were close to meeting the benchmark. It should also be noted that all grade levels made significant improvement when comparing their EoY scores with BoY scores.

Overall Success for Goal 11. All grade levels scores on the BAS and SRI increased from the BoY to EoY of the 2012-2013
school year. On the SRI, the second, third, fourth, fifth and sixth grade students met the objective.
2. As for increases across years (EoY to EoY), on the TNMA-Reading, the percentage of 6th graders in the top quarters increased consistently from 2011-2013 while 3rd grade’s percentage in the top quarters increased from 2012 to 2013. On the BAS, the percentage of Second and Third graders at or above the standard increased from 2012 to 2013. On the SRI, the second and fourth grade average scores have increased over the last three years (i.e. 2011 to 2013). While 3rd grade’s average score has increased over the last two years (i.e. 2012 to 2013).
3. Making Connections through Guided Discussion and Guided Reading was implemented at all grade levels. Teachers were given a Needs Assessment to pinpoint Professional Development needs and this was used to plan Professional Development which focused on the current research and teaching best practices. “Mentor teachers” were identified and used to facilitate lessons and provide support for teachers in the implementation of strategies. Classroom teachers were given many opportunities to learn how to use assessment data to guide instruction. Teachers are becoming more proficient with using data to identify student trends and develop appropriate instructional next-steps. Some grade levels have imbedded data discussions as a part of monthly meetings.

Overall Success for Goal 21. All grade levels scores on the local math assessments increased from the BoY to
EoY of the 2012-2013 school year. 2. As for increases across years (EoY to EoY), on the TNMA-Math, the percentage of 3 rd
, 4th and 6th graders in the top quarters increased consistently from 2011-2013. 3. A Needs Assessment was given to teachers at the start of school year 12-13 to
identify Professional Development needs. Professional Development focused on the current research and best practices regarding math centers and using math manipulatives. “Mentor teachers” were identified and used to facilitate lessons and provide support for teachers in the implementation of strategies. Classroom teachers were provided with many opportunities to learn how to use assessment data to guide instruction. Classroom teachers are becoming more proficient with using data to identify student trends and develop appropriate instructional next-steps. Some grade levels have imbedded data discussions as a part of monthly meetings. A Math Coach was utilized by all classroom teachers to develop lessons that afford opportunities for students to move from the concrete to abstract through the use of manipulatives and visual representation. Many classroom teachers have become more consistent with the use of math manipulatives to enhance student learning.

Overall Areas of Need
1. None of our grade levels BoY to the EoY local assessment scores decreased for the 2012-2013 school year.
2. On the SRI, the 5th and 6th grade EoY scores in 2012 to 2013 decreased. On the BAS, the Kinder and 1st grade scores decreased from 2012 to 2013. On the TNMA-Reading the percentage of students in the top quarter for 4th grade decreased and there was no change for 5th grade from 2012 to 2013.
3. Teachers will benefit from continued Professional Development opportunities in the implementation of Guided Reading/Guided Discussion and the use of Math Manipulatives. Continued practice with administration and scoring of the BAS assessment will improve fidelity of this assessment tool. Fewer students were able enrolled in support program due a reduction of ISSP staff.

Action to take
• For SMART Goals 1 and 2 an extensive professional development calendar has been developed to include opportunities for teacher to increase understanding/use of school-wide strategies, data driven instruction, and use of technology to increase learner outcomes.
• A mentoring program has been implemented to provide understanding of School Vision, SMART Goals, and consistent implementation of strategies in the classroom.