Application of Tomosynthesis for Novel Coronavirus Pneumonia

Shen et al. Ann. Intensive Care (2021) 11:121 https://doi.org/10.1186/s13613-021-00907-4
RESEARCH
Novel phenotypes of coronavirus disease: a temperature-based trajectory modelYanfei Shen1†, Dechang Chen2†, Xinmei Huang3†, Guolong Cai1, Qianghong Xu1, Caibao Hu1, Jing Yan1* and Jiao Liu3,4*
Abstract
Background: Coronavirus disease has heterogeneous clinical features; however, the reasons for the heterogeneity are poorly understood. This study aimed to identify clinical phenotypes according to patients’ temperature trajectory.
Method: A retrospective review was conducted in five tertiary hospitals in Hubei Province from November 2019 to March 2020. We explored potential temperature-based trajectory phenotypes and assessed patients’ clinical out-comes, inflammatory response, and response to immunotherapy according to phenotypes.
Results: A total of 1580 patients were included. Four temperature-based trajectory phenotypes were identified: normothermic (Phenotype 1); fever, rapid defervescence (Phenotype 2); gradual fever onset (Phenotype 3); and fever, slow defervescence (Phenotype 4). Compared with Phenotypes 1 and 2, Phenotypes 3 and 4 had a significantly higher C-reactive protein level and neutrophil count and a significantly lower lymphocyte count. After adjusting for confounders, Phenotypes 3 and 4 had higher in-hospital mortality (adjusted odds ratio and 95% confidence interval 2.1, 1.1–4.0; and 3.3, 1.4–8.2, respectively), while Phenotype 2 had similar mortality, compared with Phenotype 1. Corti-costeroid use was associated with significantly higher in-hospital mortality in Phenotypes 1 and 2, but not in Pheno-types 3 or 4 (p for interaction < 0.01). A similar trend was observed for gamma-globulin.
Conclusions: Patients with different temperature-trajectory phenotypes had different inflammatory responses, clini-cal outcomes, and responses to corticosteroid therapy.
Keywords: COVID-19, Temperature, Mortality, Inflammatory response, Corticosteroids
© The Author(s) 2021. Open Access This article is licensed under a Creative Commons Attribution 4.0 International License, which permits use, sharing, adaptation, distribution and reproduction in any medium or format, as long as you give appropriate credit to the original author(s) and the source, provide a link to the Creative Commons licence, and indicate if changes were made. The images or other third party material in this article are included in the article’s Creative Commons licence, unless indicated otherwise in a credit line to the material. If material is not included in the article’s Creative Commons licence and your intended use is not permitted by statutory regulation or exceeds the permitted use, you will need to obtain permission directly from the copyright holder. To view a copy of this licence, visit http:// creat iveco mmons. org/ licen ses/ by/4. 0/.
BackgroundCoronavirus disease (COVID-19) is a global health threat that has caused more than one million deaths worldwide. Concerted efforts have been made to evaluate effective therapies, such as use of corticosteroids [1, 2] and statins [3, 4]. However, the effectiveness of various therapies is unclear.
Evidence has indicated that COVID-19 is a heteroge-neous disease [5, 6] characterized by different inflamma-tory responses. For instance, the clinical course of most COVID-19 patients is relatively mild or asymptomatic, while some patients develop severe clinical complications [7]. Despite the heterogeneity within COVID-19 cases, most clinical trials have focused on a one-size-fits-all treatment approach, which may partly explain the incon-sistencies in the results between studies. Early identifica-tion of different clinical phenotypes may contribute to improving medical interventions and prognosis [8, 9].
Fever occurs in 88.7% of COVID-19 patients at the time of hospital admission [10, 11]. Thermoregulation disorder (i.e., hypothermia or fever) is associated with different clinical outcomes [12–16] and immunological
Open Access
*Correspondence: [email protected]; [email protected]†Yanfei Shen, Dechang Chen and Xinmei Huang—co-first authors1 Department of Intensive Care, Zhejiang Hospital, Hangzhou, Zhejiang, China4 Department of Critical Care Medicine, Ruijin Hospital, Shanghai Jiao Tong University School of Medicine, No. 197 Ruijin 2nd Road, Shanghai 200025, ChinaFull list of author information is available at the end of the article

Page 2 of 11Shen et al. Ann. Intensive Care (2021) 11:121
status [17–19]. However, one common limitation of pre-vious studies is that only static temperature values were used, which failed to reflect the dynamic body tempera-ture change in clinical practice.
Thus, using a temperature-based trajectory model [20], we conducted a multicenter cohort study to explore the effects of potential body temperature-based trajectories using longitudinal temperature monitoring data. The purpose of this study was to investigate the heterogene-ity between different trajectories from the perspective of clinical outcomes, inflammatory markers, and response to immunotherapy.
Material and methodsStudy participantsThe study was performed in five tertiary hospitals in Hubei Province in China: Union Jiangbei Hospital, Wuhan No.9 Hospital, Wuhan No.4 Hospital, Wuhan Jinyintan Hospital, and Huangshi Central Hospital. All patients admitted to these hospitals from November 20, 2019 to March 20, 2020 were screened. Patients who met the following inclusion criteria were included: (1) a diagnosis of COVID-19 according to the World Health Organization guidelines; and (2) age over 18 years. Patients without records of their body temperature were excluded. This study was approved by the ethics com-mittees of each of the five hospitals. The requirement for patient informed consent was waived owing to the retro-spective study design.
Data collectionWe collected data from electronic medical records of each center, including those on demographics, comor-bidities, laboratory results, transfer, disease severity, use of immunotherapy (such as corticosteroids, gamma-glob-ulin, and interferon), and clinical outcomes. Data were extracted on each patient’s maximum daily body tem-perature during the first 5 days after hospital admission and used for trajectory modeling. Authors Q.X. and C.H. were responsible for data verification.
Outcome definitionThis study aimed to investigate the heterogeneous features of temperature-trajectory phenotypes from three perspectives: the clinical outcome, inflammatory response, and response to immunotherapy. In-hospital mortality was the primary clinical outcome. Other clini-cal outcomes such as intubation rate, acute respiratory distress syndrome (ARDS), intensive care unit (ICU) admission, and length of hospitalization and ICU stay were secondary outcomes. Lymphocyte count, neu-trophil count, and C-reactive protein (CRP) level were used as markers of the immune response. Finally, we
evaluated the responses to corticosteroids, gamma-glob-ulin, and interferon therapies as measures of the response to immunotherapy for each temperature-trajectory phenotype.
Management of missing dataIn this study, most of the continuous variables had less than 5% of values missing. Missing values were replaced by the mean or median value in the analysis. Variables with more than 20% of values missing were not imputed. Four missing values of sex were replaced by the default value (zero, regarded as male).
Sensitivity analysisTo test the robustness of our findings, we also con-structed another trajectory model based on the maxi-mum temperature records within 3 days after admission. The consistency of the discriminability of these two mod-els was investigated.
Statistical analysisCategorical variables are summarized as proportions, and the difference was tested using the Chi-square or Fisher’s exact tests. Continuous variables are summarized as the mean ± standard deviation or the median and interquar-tile range, according to the distribution, and were com-pared using t tests or Wilcoxon rank-sum tests.
Group-based trajectory modeling is a growth mixture modeling method that is used to map the progression of symptoms and assess heterogeneous responses to clini-cal interventions [20]. In this study, the maximum daily body temperature within 5 days after hospital admis-sion was used to build the trajectory models, identifying patients with a similar temperature trajectory. The “traj” statistical application in Stata software was used to fit a censored normal model. The development trajectories of body temperature were explored when they were divided into one, two, three, and four trajectories. Evaluation of model fitting was based on the following standards: (1) the Bayesian information criterion was used to deter-mine the number of trajectories; (2) the log Bayes factor was used to determine whether the complex or the sim-ple model should be used; and (3) the average posterior probability was used to evaluate the posterior probability that each individual was assigned to the corresponding temperature-trajectory phenotype, using an acceptable value of 0.7.
The multivariable logistic regression model was built as follows: variables with p < 0.2 in the univariate compari-sons were included in the initial model and a backward stepwise approach was applied to exclude confound-ers with p > 0.10; however, variables with a great impact on the coefficient of temperature-trajectory phenotypes

Page 3 of 11Shen et al. Ann. Intensive Care (2021) 11:121
(> 10%) were retained in the final model. The variance inflation factor method was used to test multicollinearity, and a bootstrap technique using 1000 resamples was used to test model stability. Stratified analyses of the predicted marginal effects of immunotherapy were also performed according to the temperature-trajectory phenotype. Two-tailed p values < 0.05 were considered statistically signifi-cant. All statistical analyses were performed using Stata 14.0 (College Station, TX, USA).
ResultsBaseline characteristics of survivors and non‑survivorsA total of 1580 patients were included in this study, with an overall mortality rate of 16.4% (Table 1). Their mean age was 57 years, and 53.1% were male. Compared with the survivors, the non-survivors had a significantly stronger inflammatory response, such as higher white blood cell and neutrophil counts, higher CRP levels, and lower lymphocyte counts. The non-survivors were more likely to receive immunotherapy, such as the use of corti-costeroids, gamma-globulin, and interferon.
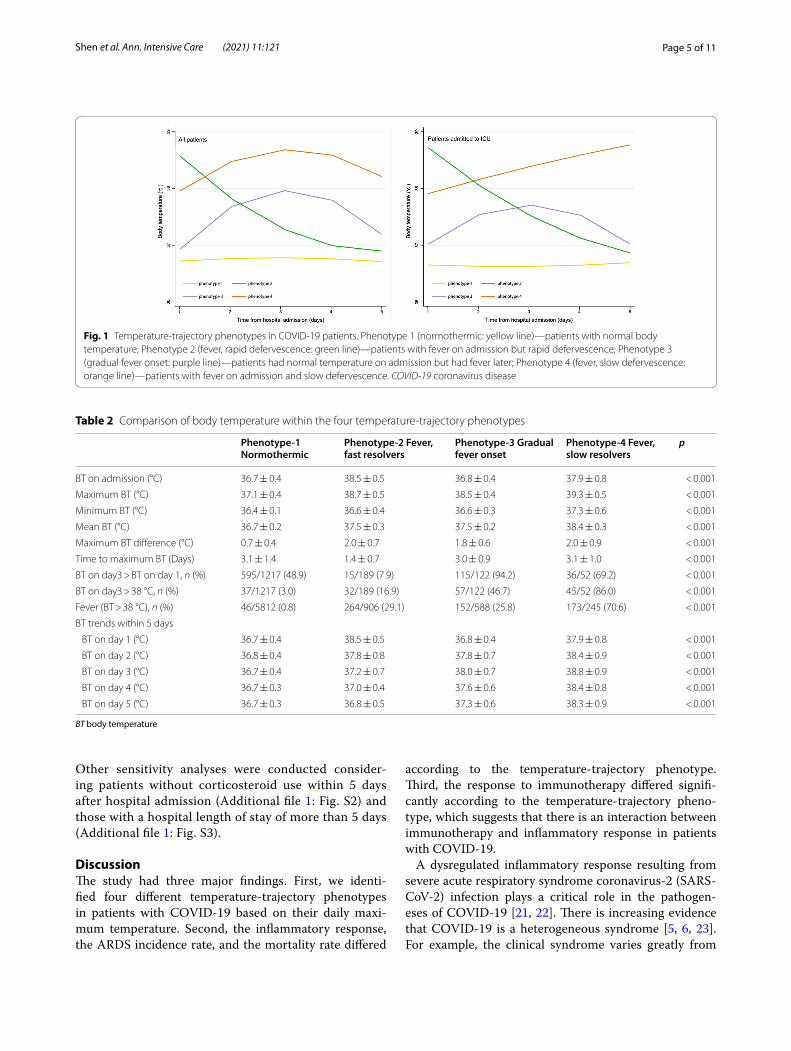
Selection of temperature‑based trajectory modelsThe phenotype selection process of the trajectory model is shown in Table S1 [see Additional file 1]. Based on the Bayesian information criterion and log Bayes factor, a tra-jectory model with four phenotypes was adopted (shown in Fig. 1): Phenotype 1 (normothermic), patients with a normal body temperature (n = 1217); Phenotype 2 (fever, rapid defervescence), patients with fever on admission but rapid defervescence (n = 189); Phenotype 3 (grad-ual fever onset), patients with a normal temperature on admission who developed a fever later (n = 122); and Phenotype 4 (fever, slow defervescence), patients with fever on admission and slow defervescence (n = 52). Each of the four temperature trajectories was found to be the product of a unique quadratic function describing tem-perature as a function of time. Temperature trajectories were also modeled in patients admitted to the ICU. The overall trajectories remained stable.
Body temperature characteristics within phenotypesMost of the patients with Phenotype 1 had normal body temperature records, and only 3% of these patients still had fever (temperature > 38 °C) on day 3 (Table 2). The maximum body temperature of patients with Phenotype 2 was similar to that of patients with Phenotypes 3 and 4 (38.7, 38.5, and 39.3 °C, respectively). However, compared with those in Phenotypes 3 and 4, the time to maximum body temperature was significantly shorter in patients with Phenotype 2 (3.0 ± 0.9, 3.1 ± 1.0, and 1.4 ± 0.7, respectively, p < 0.001); the proportion of patients with persistent fever (body temperature on day 3 > body
temperature on day 1) was significantly lower (15/189 [7.9%], 115/122 [94.2%], and 36/52 [69.2%], p < 0.001) in Phenotype 3. The detailed body temperature profiles are shown in Table 2.
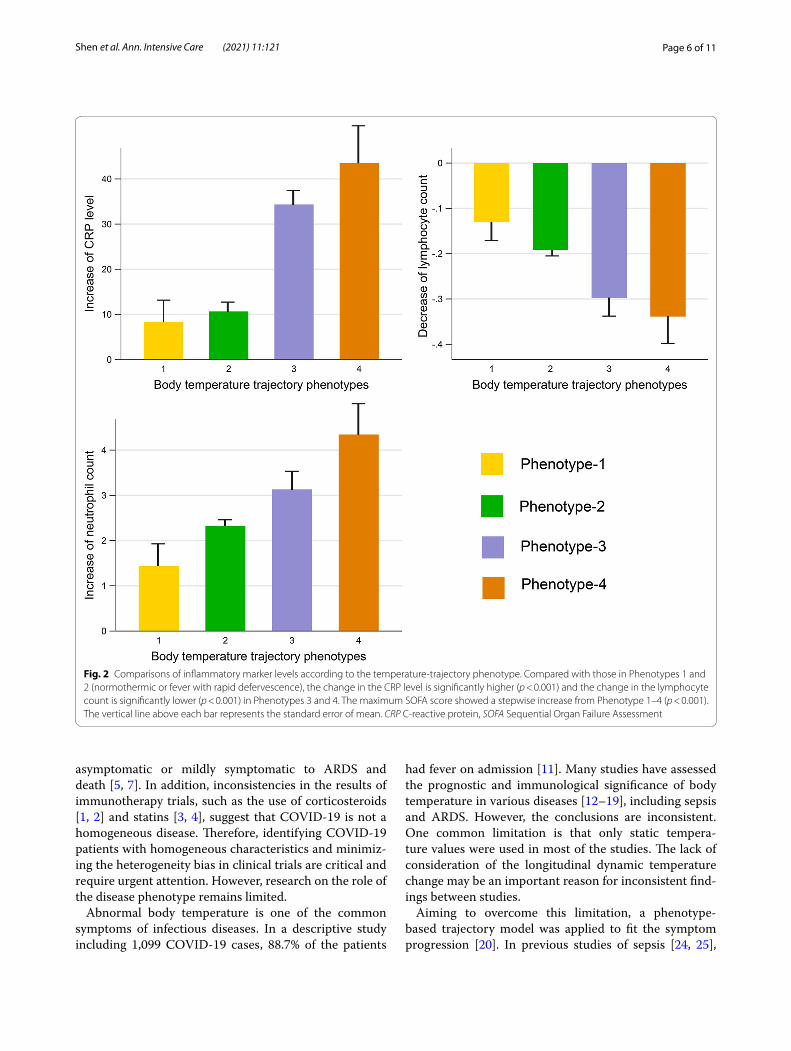
Inflammatory response according to phenotypesThe changes in serum CRP levels and neutrophil and lymphocyte counts, which were used as indicators of the inflammatory response, are shown in Fig. 2 and Table 3. Compared with those in Phenotype 1 (normo-thermic) and Phenotype 2 (fever, rapid defervescence), the CRP level and the neutrophil count significantly increased (p < 0.001), while the lymphocyte count sig-nificantly decreased (p < 0.001) in Phenotype 3 (gradual fever onset) and Phenotype 4 (fever, slow defervescence). Other detailed comparisons are provided in Table 3.
Clinical outcomes according to phenotypesThe comparisons of clinical outcomes between these four phenotypes are shown in Table 3. The crude in-hospital mortality, ARDS incidence, and hospital length of stay gradually increased from Phenotype 1 (normothermic) to Phenotype 4 (fever, slow defervescence). In the mul-tivariable logistic regression model (Table 4), the odds ratio (OR) for mortality relative to Phenotype 1 (normo-thermic) was significantly higher in patients with Phe-notype 3 (gradual fever onset, OR: 2.1, 95% confidence interval [CI]: 1.1–4.0) and Phenotype 4 (fever, slow defer-vescence, OR: 3.3, 95% CI: 1.4–8.2), but not Phenotype 2 (fever, rapid defervescence, OR: 1.2, 95% CI: 0.7–2.2). This trend remained stable when tested using bootstrap-ping with 1,000 resamples.
Response to immunotherapy according to phenotypesData on prescriptions of corticosteroids, gamma-globu-lin, and interferon in the 5 days after hospital admission were extracted and defined as immunotherapy. The dif-ferential response to immunotherapy according to the temperature-trajectory phenotype and the predicted marginal effects are shown in Fig. 3. Corticosteroid use was significantly associated with increased hospital mor-tality in patients with Phenotype 1 (normothermic) and Phenotype 2 (fever, rapid defervescence) (OR: 4.7, 95% CI: 3.2–6.8; and OR: 4.7, 95% CI: 2.1–10.4, respectively), while this association was not significant in patients with Phenotypes 3 and 4 (p for interaction < 0.01). A similar trend was observed for gamma-globulin; however, the difference in the effect size between the four phenotypes was not significant (p for interaction > 0.05). The effec-tiveness of interferon therapy was consistent across all four phenotypes.

Page 4 of 11Shen et al. Ann. Intensive Care (2021) 11:121
Sensitivity analysisAnother trajectory model was built based on temper-ature records within 3 days after hospital admission
(Additional file 1: Fig. S1). This new model classified 92% of the patients into the same groups as the origi-nal model, confirming that the classification using temperature-based trajectory model was stable.
Table 1 Comparison of baseline characteristics between survivors and non-survivors
COPD chronic obstructive pulmonary disease, PaO2/FiO2 ratio of partial pressure of arterial oxygen to fraction of inspired oxygen, SOFA Sequential Organ Failure Assessment, ARDS acute respiratory distress syndrome, ICU intensive care unit
Demographics Survivors (n = 1357) Non‑survivors (n = 223) All patients (n = 1580) p
Age (years) 56.2 ± 13.9 67.1 ± 12.4 57.7 ± 14.2 < 0.001
Male [n (%)] 703 (51.8) 136 (60.9) 839 (53.1) 0.011
Comorbidities
Hypertension [n (%)] 322 (23.7) 75 (33.6) 397 (25.1) 0.002
Diabetes mellitus [n (%)] 141 (10.3) 43 (19.2) 184 (11.6) < 0.001
Chronic heart diseases [n (%)] 77 (5.6) 27 (12.1) 104 (6.5) < 0.001
COPD [n (%)] 15 (1.1) 11 (4.9) 26 (1.6) < 0.001
Chronic renal diseases [n (%)] 27 (2.0) 7 (3.1) 34 (2.1) 0.273
Malignant tumor [n (%)] 31 (2.3) 14 (6.2) 45 (2.8) < 0.001
Laboratory and disease severity indexes
Initial white blood cell count (10^9/L) 6.6 ± 3.2 10.2 ± 5.2 7.1 ± 3.7 < 0.001
Maximum white blood cell count (10^9/L) 7.8 ± 3.6 16.5 ± 8.8 9.0 ± 5.6 < 0.001
Initial neutrophil count (10^9/L) 4.6 ± 2.6 8.3 ± 4.8 5.1 ± 3.3 < 0.001
Maximum neutrophil count (10^9/L) 5.7 ± 3.3 14.1 ± 8.0 6.9 ± 5.2 < 0.001
Initial lymphocyte cell count (10^9/L) 1.2 ± 0.6 0.8 ± 0.6 1.1 ± 0.6 < 0.001
Minimum lymphocyte cell count (10^9/L) 1.0 ± 0.6 0.5 ± 0.4 0.9 ± 0.6 < 0.001
Initial hemoglobin level (g/dl) 122.6 ± 16.7 119.9 ± 19.1 122.2 ± 17.1 0.025
Initial platelet count (10 /L) 224 ± 89 166 ± 73 216 ± 89 < 0.001
Initial albumin level (g/L) 33.9 ± 4.3 30.4 ± 4.2 33.4 ± 4.5 < 0.001
Initial serum creatinine (mmol/l) 72.1 ± 33.1 96.3 ± 78.6 75.5 ± 43.3 < 0.001
PaO2/FiO2 283 ± 128 170 ± 146 266 ± 137 < 0.001
Initial CRP level (mmol/L) 29 ± 35 (n = 30) 84 ± 49 (n = 43) 36 ± 41 (n = 343) < 0.001
Maximum CRP level (mmol/L) 38 ± 41 (n = 30) 118 ± 46 (n = 43) 48 ± 49 (n = 343) < 0.001
SOFA score on admission [median (IQR)] 1 (0–2) 3 (1–4) 1 (0–2) < 0.001
Maximum SOFA score [median (IQR)] 1 (0–2) 6 (4–9) 1 (0–2) < 0.001
Study center 0.011
Union Jiangbei Hospital 160 (11.7) 35 (15.6) 195 (12.3)
Wuhan No.9 Hospital 138 (10.1) 25 (11.2) 163 (10.3)
Wuhan No.4 Hospital 42 (3.1) 11 (4.9) 53 (3.3)
Wuhan Jinyintan Hospital 1003 (73.9) 145 (65.0) 1148 (72.6)
Huangshi central Hospital 14 (1.0) 7 (3.1) 21 (1.3)
Immunotherapy
Corticosteroid therapy [n (%)] 300 (22.1) 117 (52.4) 417 (26.3) < 0.001
Interferon therapy [n (%)] 198 (14.5) 34 (15.2) 232 (13.8) 0.798
Gamma-globulin therapy [n (%)] 270 (19.8) 88 (39.4) 358 (21.3) < 0.001
Clinical outcomes
ARDS [n (%)] 180 (13.2) 197 (88.3) 377 (23.8) < 0.001
Mechanical ventilation [n (%)] 26 (1.9) 78 (34.9) 104 (6.5) < 0.001
Duration of mechanical ventilation (days) 10.3 ± 3.7 5.6 ± 4.6 6.7 ± 4.8 < 0.001
Hospital length of stay (days) 13.5 ± 7.1 10.5 ± 7.0 13.0 ± 7.1 < 0.001
ICU admission [n (%)] 164 (12.1) 109 (48.8) 273 (17.2) < 0.001
ICU length of stay (days) 10.4 ± 10.3 8.3 ± 7.3 9.6 ± 9.3 0.064
Page 5 of 11Shen et al. Ann. Intensive Care (2021) 11:121
Other sensitivity analyses were conducted consider-ing patients without corticosteroid use within 5 days after hospital admission (Additional file 1: Fig. S2) and those with a hospital length of stay of more than 5 days (Additional file 1: Fig. S3).
DiscussionThe study had three major findings. First, we identi-fied four different temperature-trajectory phenotypes in patients with COVID-19 based on their daily maxi-mum temperature. Second, the inflammatory response, the ARDS incidence rate, and the mortality rate differed
according to the temperature-trajectory phenotype. Third, the response to immunotherapy differed signifi-cantly according to the temperature-trajectory pheno-type, which suggests that there is an interaction between immunotherapy and inflammatory response in patients with COVID-19.
A dysregulated inflammatory response resulting from severe acute respiratory syndrome coronavirus-2 (SARS-CoV-2) infection plays a critical role in the pathogen-eses of COVID-19 [21, 22]. There is increasing evidence that COVID-19 is a heterogeneous syndrome [5, 6, 23]. For example, the clinical syndrome varies greatly from
Fig. 1 Temperature-trajectory phenotypes in COVID-19 patients. Phenotype 1 (normothermic: yellow line)—patients with normal body temperature; Phenotype 2 (fever, rapid defervescence: green line)—patients with fever on admission but rapid defervescence; Phenotype 3 (gradual fever onset: purple line)—patients had normal temperature on admission but had fever later; Phenotype 4 (fever, slow defervescence: orange line)—patients with fever on admission and slow defervescence. COVID-19 coronavirus disease
Table 2 Comparison of body temperature within the four temperature-trajectory phenotypes
BT body temperature
Phenotype‑1 Normothermic
Phenotype‑2 Fever, fast resolvers
Phenotype‑3 Gradual fever onset
Phenotype‑4 Fever, slow resolvers
p
BT on admission (°C) 36.7 ± 0.4 38.5 ± 0.5 36.8 ± 0.4 37.9 ± 0.8 < 0.001
Maximum BT (°C) 37.1 ± 0.4 38.7 ± 0.5 38.5 ± 0.4 39.3 ± 0.5 < 0.001
Minimum BT (°C) 36.4 ± 0.1 36.6 ± 0.4 36.6 ± 0.3 37.3 ± 0.6 < 0.001
Mean BT (°C) 36.7 ± 0.2 37.5 ± 0.3 37.5 ± 0.2 38.4 ± 0.3 < 0.001
Maximum BT difference (°C) 0.7 ± 0.4 2.0 ± 0.7 1.8 ± 0.6 2.0 ± 0.9 < 0.001
Time to maximum BT (Days) 3.1 ± 1.4 1.4 ± 0.7 3.0 ± 0.9 3.1 ± 1.0 < 0.001
BT on day3 > BT on day 1, n (%) 595/1217 (48.9) 15/189 (7.9) 115/122 (94.2) 36/52 (69.2) < 0.001
BT on day3 > 38 °C, n (%) 37/1217 (3.0) 32/189 (16.9) 57/122 (46.7) 45/52 (86.0) < 0.001
Fever (BT > 38 °C), n (%) 46/5812 (0.8) 264/906 (29.1) 152/588 (25.8) 173/245 (70.6) < 0.001
BT trends within 5 days
BT on day 1 (°C) 36.7 ± 0.4 38.5 ± 0.5 36.8 ± 0.4 37.9 ± 0.8 < 0.001
BT on day 2 (°C) 36.8 ± 0.4 37.8 ± 0.8 37.8 ± 0.7 38.4 ± 0.9 < 0.001
BT on day 3 (°C) 36.7 ± 0.4 37.2 ± 0.7 38.0 ± 0.7 38.8 ± 0.9 < 0.001
BT on day 4 (°C) 36.7 ± 0.3 37.0 ± 0.4 37.6 ± 0.6 38.4 ± 0.8 < 0.001
BT on day 5 (°C) 36.7 ± 0.3 36.8 ± 0.5 37.3 ± 0.6 38.3 ± 0.9 < 0.001
Page 6 of 11Shen et al. Ann. Intensive Care (2021) 11:121
asymptomatic or mildly symptomatic to ARDS and death [5, 7]. In addition, inconsistencies in the results of immunotherapy trials, such as the use of corticosteroids [1, 2] and statins [3, 4], suggest that COVID-19 is not a homogeneous disease. Therefore, identifying COVID-19 patients with homogeneous characteristics and minimiz-ing the heterogeneity bias in clinical trials are critical and require urgent attention. However, research on the role of the disease phenotype remains limited.
Abnormal body temperature is one of the common symptoms of infectious diseases. In a descriptive study including 1,099 COVID-19 cases, 88.7% of the patients
had fever on admission [11]. Many studies have assessed the prognostic and immunological significance of body temperature in various diseases [12–19], including sepsis and ARDS. However, the conclusions are inconsistent. One common limitation is that only static tempera-ture values were used in most of the studies. The lack of consideration of the longitudinal dynamic temperature change may be an important reason for inconsistent find-ings between studies.
Aiming to overcome this limitation, a phenotype-based trajectory model was applied to fit the symptom progression [20]. In previous studies of sepsis [24, 25],
Fig. 2 Comparisons of inflammatory marker levels according to the temperature-trajectory phenotype. Compared with those in Phenotypes 1 and 2 (normothermic or fever with rapid defervescence), the change in the CRP level is significantly higher (p < 0.001) and the change in the lymphocyte count is significantly lower (p < 0.001) in Phenotypes 3 and 4. The maximum SOFA score showed a stepwise increase from Phenotype 1–4 (p < 0.001). The vertical line above each bar represents the standard error of mean. CRP C-reactive protein, SOFA Sequential Organ Failure Assessment

Page 7 of 11Shen et al. Ann. Intensive Care (2021) 11:121
Bhavani et al. constructed four trajectories based on longitudinal temperature data in sepsis and found that both the inflammatory markers and mortality rate were significantly different. In a recent study of COVID-19 [26], the authors identified four temperature trajectories, each presenting with a distinct prognosis. This research appears similar to our study. However, several differences should be noted. First, in Bhavani et al.’s study [24–26], the trajectories were constructed based on all tempera-ture records, which reduced the temperature feature of each trajectory. For example, in patients with intermit-tent fever, the temperature trajectory would be lowered to fit all temperature records (both normal and elevated
temperature values). This may be the reason for the small temperature difference between the four temperature trajectories in Bhavani et al.’s [26] study. Establishing a temperature trajectory based on all temperature records may reduce the temperature features of each phenotype, increase the difficulty in identification, and limit the clini-cal application. In the current study, the temperature-tra-jectory phenotypes were constructed based on maximum daily temperature, which presented with more signifi-cant temperature features. Bhavani et al. [26] reported that, compared with a temperature trajectory of a rap-idly decreasing fever, temperature trajectories of fever, normothermia, and hypothermia were associated with a
Table 3 Comparison of patient characteristics, therapy, and outcome within the four temperature-trajectory phenotypes
CRP C-reactive protein, SOFA Sequential Organ Failure Assessment, ARDS acute respiratory distress syndrome
Variables Phenotype‑1 Normothermic (n = 1217)
Phenotype‑2 Fever, fast resolvers (n = 189)
Phenotype‑3 Gradual fever onset (n = 122)
Phenotype‑4 Fever, slow resolvers (n = 52)
p
Demographic data
Age [n (%)] 57.7 ± 14.6 58.1 ± 13.4 57.7 ± 12.2 55.2 ± 13.0 0.639
Male [n (%)] 603 (49.5) 117 (61.9) 74 (60.6) 44 (84.6) < 0.001
Hypertension [n (%)] 314 (25.8) 37 (19.5) 34 (27.8) 12 (23.0) 0.262
Diabetes mellitus [n (%)] 145 (11.9) 20 (10.5) 13 (10.6) 6 (11.5) 0.938
Chronic heart diseases [n (%)] 90 (7.3) 7 (3.7) 6 (4.9) 1 (2.0) 0.100
Severity of COVID-19 < 0.001
Mild [n (%)] 846 (69.5) 105 (55.5) 64 (52.4) 26 (50.0)
Severe [n (%)] 251 (20.6) 50 (26.4) 27 (22.1) 12 (21.4)
Critical [n (%)] 120 (9.8) 34 (17.9) 31 (25.4) 14 (26.9)
Inflammatory markers
Initial neutrophil count (10^9/L) 5.0 ± 3.2 5.8 ± 3.5 5.5 ± 3.7 4.7 ± 3.5 < 0.001
Maximum neutrophil count (10^9/L) 6.4 ± 4.9 8.1 ± 5.7 8.7 ± 6.1 9.1 ± 3.9 < 0.001
Change of neutrophil count (10^9/L) 1.4 ± 3.4 2.3 ± 4.4 3.1 ± 4.6 4.3 ± 5.2 < 0.001
Initial lymphocyte count (10^9/L) 1.2 ± 0.6 1.0 ± 0.6 1.0 ± 0.5 0.9 ± 0.5 < 0.001
Minimum lymphocyte count (10^9/L) 1.0 ± 0.6 0.8 ± 0.5 0.7 ± 0.4 0.6 ± 0.3 < 0.001
Change of lymphocyte count (10^9/L) − 0.13 ± 0.30 − 0.19 ± 0.41 − 0.30 ± 0.40 − 0.34 ± 0.44 < 0.001
Initial CRP level (mmol/L) 30 ± 39 (n = 250) 54 ± 42 (n = 47) 40 ± 44 (n = 33) 62 ± 52 (n = 13) < 0.001
Maximum CRP level (mmol/L) 39 ± 45 64 ± 43 75 ± 57 105 ± 53 < 0.001
Change of CRP level (mmol/L) 8 ± 24 10 ± 24 34 ± 37 43 ± 41 < 0.001
Initial SOFA score 1 (0–2) 2 (1–2) 1 (0–1) 2 (1–2.5) < 0.001
Maximum SOFA score 1 (0–2) 2 (1–3) 2 (1–4) 2 (1–4) < 0.001
Immunotherapy
Corticosteroid therapy [n (%)] 314 (25.8) 94 (49.7) 49 (40.1) 32 (61.5) < 0.001
Gamma-globulin therapy [n (%)] 257 (21.1) 70 (37.0) 54 (44.2) 25 (48.0) < 0.001
Interferon therapy [n (%)] 187 (15.3) 22 (11.6) 18 (14.7) 5 (9.6) 0.405
Clinical outcomes
In-hospital death [n (%)] 138 (11.3) 39 (20.6) 31 (25.4) 15 (28.8) < 0.001
ARDS [n (%)] 249 (20.4) 65 (34.3) 44 (36.0) 19 (36.5) < 0.001
Intubation [n (%)] 61 (5.0) 24 (12.7) 11 (9.0) 8 (15.4) < 0.001
Duration of mechanical ventilation (days) 6.7 ± 5.2 7.1 ± 5.4 5.9 ± 4.1 6.2 ± 5.5 0.905
Hospital length of stay (days) 12.4 ± 6.8 14.7 ± 8.2 15.2 ± 7.3 16.8 ± 7.6 < 0.001

Page 8 of 11Shen et al. Ann. Intensive Care (2021) 11:121
Table 4 Association between in-hospital death and temperature-trajectory phenotype in logistic regression models
Three logistic models were used to evaluate the association between in-hospital death and four body temperature trajectory groups. Compared to the normothermic group, there was a trend toward increasing risk of in-hospital death from fever, fast resolvers to fever, and slow resolvers. Bootstrapping (1000 resamples) were used for calculating 95% CI in Model 3 and the results remained stable
aOR adjusted odds ratio, APACHE II acute physiology and chronic health evaluation; CI confidence interval, WBC white blood cell
Model 1 Model 2 Model 3
Crude OR (95% CI) p Multivariable logistic model aOR (95% CI)
p Multivariable logistic model with 1000 bootstraps, aOR (95% CI)
p
Normothermic Ref. – Ref. – Ref. –
Fever, fast resolvers 2.0 (1.3–3.0) < 0.001 1.2 (0.7–2.2) 0.377 1.2 (0.6–2.2) 0.364
Gradual fever onset 2.6 (1.7–4.1) < 0.001 2.1 (1.1–4.0) 0.021 2.1 (1.1–3.9) 0.013
Fever, slow resolvers 3.2 (1.6–3.9) < 0.001 3.3 (1.4–8.2) 0.005 3.4 (1.3–8.5) 0.007
Age > 65 (years) 3.4 (2.2–5.1) < 0.001 3.4 (2.1–5.3) < 0.001
Vasopressor use 3.1 (2.0–4.7) < 0.001 3.0 (1.9–4.8) < 0.001
Maximum creatinine level 1.01 (1.00–1.01) < 0.001 1.01 (1.00–1.01) 0.010
Maximum WBC count 1.2 (1.1–1.3) < 0.001 1.2 (1.2–1.3) < 0.001
APACHE II score 1.2 (1.1–1.3) < 0.001 1.3 (1.1–1.4) < 0.001
Fig. 3 The predicted marginal effect of immunotherapy in each temperature-trajectory phenotype. Corticosteroid use was associated with significantly increased in-hospital mortality in Phenotypes 1 and 2, while this association was not significant in Phenotypes 3 and 4 (p for interaction < 0.01). A similar trend was observed for gamma-globulin; however, the difference in effect size between the four temperature-trajectory phenotypes was not significant (p for interaction > 0.05). The effectiveness of interferon therapy was consistent for all four phenotypes

Page 9 of 11Shen et al. Ann. Intensive Care (2021) 11:121
higher mortality. However, we found that compared with those in normothermic patients, the crude estimates of clinical outcomes such as the incidence of ARDS, intu-bation rate, mortality rate, and ICU admission rate were significantly higher in patients with fever. After adjusting for confounders, the temperature-trajectory phenotypes of patients with fever of gradual onset or fever with slow defervescence remained associated with increased mor-tality, while the phenotype of fever with rapid deferves-cence did not. In addition, we were also concerned that the temperature trajectories may be affected by corticos-teroid use, hospital discharge, or death within 5 days of admission. However, in the sensitivity analyses excluding these patients, the results remained stable.
The exact mechanism cannot be inferred from our study owing to the retrospective design. However, we noted that the CRP level and neutrophil count increased and the lymphocyte count decreased stepwise from Phe-notypes 1 to 4. In COVID-19, both the lymphocyte count and the CRP level have been reported to be inflamma-tory markers for poor outcomes [27–30]. Therefore, the high CRP level and the low lymphocyte count in Pheno-types 3 and 4 may indicate relatively strong inflammatory response, which partly account for the high mortality in these groups.
In addition, studies have shown that corticoster-oids [1] and gamma-globulin [31, 32] therapies have an anti-inflammatory effect in many conditions. As a non-specific immunomodulator, gamma-globulin can affect lymphocyte differentiation, inhibit cytokine production, and suppress the inflammatory response [33, 34]. How-ever, evidence of the effectiveness of gamma-globulin in COVID-19 is inconsistent. For example, one study [35] including 37 severe COVID-19 patients found that a combination of methylprednisolone and immunoglobu-lin could improve the prognosis of COVID-19 patients, while another study [36] found that immunoglobulin therapy did not improve in-hospital mortality rates or the need for mechanical ventilation in patients with severe COVID-19. Similarly, the results of different studies of corticosteroid use in COVID-19 showed inconsistent results. Some studies [1, 37] found that corticosteroid use was effective in patients with COVID-19, while other studies [2, 38] found that corticosteroid use was ineffec-tive. In the current study, the effectiveness of corticoster-oids and gamma-globulin therapy differed significantly between phenotypes with low (Phenotypes 1 and 2) and high (Phenotypes 3 and 4) inflammatory responses. Notably, although owing to the retrospective study design, the measurement of effectiveness of these thera-pies may have been biased by their close association with disease severity, owing to their selective use in clinical practice (e.g., corticosteroids are more commonly used
in patients with the severe disease) [39], our findings still suggest a different response to immunotherapies therapy within different phenotypes. This needs to be considered in future trials.
LimitationsOur study had several limitations. First, using 5 days as the cutoff point was somewhat arbitrary. Therefore, in the sensitivity analysis, we also assessed a trajectory model based on data within 3 days after admission (Addi-tional file 1: Fig. S1), and the classification of phenotypes remained stable. Second, various inflammatory markers have been reported in COVID-19. However, only CRP levels, neutrophil counts, and lymphocyte counts were included as inflammatory markers in the current study, owing to limited data on other inflammatory markers. More studies are needed to further explore the rela-tionship between other inflammatory markers, such as interleukins and tumor necrosis factor alpha, and tem-perature-trajectory phenotypes. Third, the association between immunotherapy and mortality in each temper-ature-trajectory phenotype may be biased owing to the greater likelihood of using these therapies in COVID-19 patients with more severe disease. However, the hetero-geneous response to immunotherapy in patients with high and low inflammation phenotypes should be con-sidered in future studies. Fourth, the number of patients with Phenotype 4 was relatively small. Therefore, a vali-dation cohort was not used in the current study. Further studies are needed to verify our findings.
ConclusionWe found that compared with normothermic patients and those with rapid fever defervescence, patients with gradual fever onset or slow defervescence temperature trajectories had a greater inflammatory response and higher mortality. There was a significant difference in response to immunotherapy among patients with differ-ent temperature-trajectory phenotypes. COVID-19 is a heterogeneous disease, and more studies are still needed to identify phenotypes with homogeneous features to improve the selection of medical interventions and the outcomes of COVID-19.
AbbreviationsARDS: Acute respiratory distress syndrome; COVID-19: Coronavirus disease; CRP: C-reactive protein; SARS-CoV-2: Acute respiratory syndrome coronavirus 2.
Supplementary InformationThe online version contains supplementary material available at https:// doi. org/ 10. 1186/ s13613- 021- 00907-4.
Page 10 of 11Shen et al. Ann. Intensive Care (2021) 11:121
Additional file 1: Table S1. Selection of different group-based temperature-trajectory phenotypes. Fig. S1. Four temperature trajectory phenotypes in COVID-19 patients based on daily maximum temperature data within 3 days. Fig. S2. Four trajectory phenotypes in COVID-19 patients without corticosteroid use within 5 days after hospital admission. Fig. S3. Four trajectory phenotypes in COVID-19 patients with hospital length of stay ≥ 5 days
AcknowledgementsNone.
Authors’ contributionsJL and JY designed the study. QX, CH and XH collected and verified all data. DC, YS and GC analyzed the data and prepared the figures. DC and JL wrote the draft of the manuscript. DC, JY and XH made critical revision to reviewer’s comments. All the authors gave final approval of the version to be published and agreed to be accountable for all aspects of the work in ensuring that questions related to the accuracy or integrity of any part of the work. All authors read and approved the final manuscript.
FundingThis work was supported by the Zhejiang medical and health science and technology project (NO. 2021KY001) to author Y.S.
Availability of data and materialsThe full dataset is available from the corresponding author upon reasonable request.
Declarations
Ethics approval and consent to participateThe ethics committees of each of the five hospitals approved this study, and patient informed consent was waived due to the retrospective nature of the study.
Consent for publicationNot applicable.
Competing interestsAll the authors have no conflict of interest.
Author details1 Department of Intensive Care, Zhejiang Hospital, Hangzhou, Zhejiang, China. 2 Department of Intensive Care, Ruijin Hospital, Shanghai Jiao Tong University School of Medicine, Shanghai, China. 3 Department of Internal Medicine, The Second Affiliated Hospital, Zhejiang University School of Medicine, Hang-zhou, Zhejiang, China. 4 Department of Critical Care Medicine, Ruijin Hospital, Shanghai Jiao Tong University School of Medicine, No. 197 Ruijin 2nd Road, Shanghai 200025, China.
Received: 22 April 2021 Accepted: 21 July 2021
References 1. RECOVERY Collaborative Group, Horby P, Lim WS, Emberson JR, Mafham
M, Bell JL, Linsell L, Staplin N, Brightling C, Ustianowski A, et al. Dexa-methasone in hospitalized patients with Covid-19—preliminary report. N Engl J Med. 2020;43:183.
2. Jeronimo CMP, Farias MEL, Val FFA, Sampaio VS, Alexandre MAA, Melo GC, Safe IP, Borba MGS, Abreu-Netto RL, Maciel ABS, et al. Methylprednisolone as adjunctive therapy for patients hospitalized with COVID-19 (Metcovid): a randomised, double-blind, phase IIb Placebo-Controlled Trial. Clin Infect Dis. 2020. https:// doi. org/ 10. 1093/ cid/ ciaa1 177.
3. Masana L, Correig E, Rodriguez-Borjabad C, Anoro E, Arroyo JA, Jerico C, Pedragosa A, Miret M, Naf S, Pardo A, et al. Effect of statin therapy on
SARS-CoV-2 infection-related. Eur Heart J Cardiovasc Pharmacother. 2020. https:// doi. org/ 10. 1093/ ehjcvp/ pvaa1 28.
4. Cariou B, Goronflot T, Rimbert A, Boullu S, Le May C, Moulin P, Pichelin M, Potier L, Smati S, Sultan A, et al. Routine use of statins and increased mortality related to COVID-19 in inpatients with type 2 diabetes: results from the CORONADO study. Diabetes Metab. 2020. https:// doi. org/ 10. 1016/j. diabet. 2020. 10. 001.
5. Soy M, Keser G, Atagunduz P, Tabak F, Atagunduz I, Kayhan S. Cytokine storm in COVID-19: pathogenesis and overview of anti-inflammatory agents used in treatment. Clin Rheumatol. 2020;39(7):2085–94.
6. Soldati G, Giannasi G, Smargiassi A, Inchingolo R, Demi L. Contrast-enhanced ultrasound in patients with COVID-19: pneumonia, acute respiratory distress syndrome, or something else? J Ultrasound Med. 2020. https:// doi. org/ 10. 1002/ jum. 15338.
7. Tang D, Comish P, Kang R. The hallmarks of COVID-19 disease. PLoS Pathog. 2020;16(5):e1008536.
8. Subbarao K, Mahanty S. Respiratory virus infections: understanding COVID-19. Immunity. 2020;52(6):905–9.
9. Liang W, Yao J, Chen A, Lv Q, Zanin M, Liu J, Wong S, Li Y, Lu J, Liang H, et al. Early triage of critically ill COVID-19 patients using deep learning. Nat Commun. 2020;11(1):3543.
10. Evans SS, Repasky EA, Fisher DT. Fever and the thermal regulation of immunity: the immune system feels the heat. Nat Rev Immunol. 2015;15(6):335–49.
11. Guan WJ, Ni ZY, Hu Y, Liang WH, Ou CQ, He JX, Liu L, Shan H, Lei CL, Hui DSC, et al. Clinical Characteristics of Coronavirus Disease 2019 in China. N Engl J Med. 2020;382(18):1708–20.
12. Shimazui T, Nakada TA, Walley KR, Oshima T, Abe T, Ogura H, Shiraishi A, Kushimoto S, Saitoh D, Fujishima S, et al. Significance of body tempera-ture in elderly patients with sepsis. Crit Care. 2020;24(1):387.
13. Shen Y, Lou Y, Zhu S. Hyperthermia is a predictor of high mortality in patients with sepsis. Crit Care. 2020;24(1):543.
14. Kushimoto S, Gando S, Saitoh D, Mayumi T, Ogura H, Fujishima S, Araki T, Ikeda H, Kotani J, Miki Y, et al. The impact of body temperature abnormali-ties on the disease severity and outcome in patients with severe sepsis: an analysis from a multicenter, prospective survey of severe sepsis. Crit Care. 2013;17(6):R271.
15. Lee BH, Inui D, Suh GY, Kim JY, Kwon JY, Park J, Tada K, Tanaka K, Ietsugu K, Uehara K, et al. Association of body temperature and antipyretic treatments with mortality of critically ill patients with and without sepsis: multi-centered prospective observational study. Crit Care. 2012;16(1):R33.
16. Peres Bota D, Lopes Ferreira F, Melot C, Vincent JL. Body temperature alterations in the critically ill. Intensive Care Med. 2004;30(5):811–6.
17. Rehman T, deBoisblanc BP. Persistent fever in the ICU. Chest. 2014;145(1):158–65.
18. Wiewel MA, Harmon MB, van Vught LA, Scicluna BP, Hoogendijk AJ, Horn J, Zwinderman AH, Cremer OL, Bonten MJ, Schultz MJ, et al. Risk factors, host response and outcome of hypothermic sepsis. Crit Care. 2016;20(1):328.
19. Garami A, Steiner AA, Romanovsky AA. Fever and hypothermia in sys-temic inflammation. Handb Clin Neurol. 2018;157:565–97.
20. Nagin DS, Odgers CL. Group-based trajectory modeling in clinical research. Annu Rev Clin Psychol. 2010;6:109–38.
21. Coperchini F, Chiovato L, Croce L, Magri F, Rotondi M. The cytokine storm in COVID-19: An overview of the involvement of the chemokine/chemokine-receptor system. Cytokine Growth Factor Rev. 2020;53:25–32.
22. Merad M, Martin JC. Pathological inflammation in patients with COVID-19: a key role for monocytes and macrophages. Nat Rev Immunol. 2020;20(6):355–62.
23. Shi Y, Wang Y, Shao C, Huang J, Gan J, Huang X, Bucci E, Piacentini M, Ippolito G, Melino G. COVID-19 infection: the perspectives on immune responses. Cell Death Differ. 2020;27(5):1451–4.
24. Bhavani SV, Wolfe KS, Hrusch CL, Greenberg JA, Krishack PA, Lin J, Lecompte-Osorio P, Carey KA, Kress JP, Coopersmith CM, et al. Tempera-ture trajectory subphenotypes correlate with immune responses in patients with sepsis. Crit Care Med. 2020;48(11):1645–53.
25. Bhavani SV, Carey KA, Gilbert ER, Afshar M, Verhoef PA, Churpek MM. Identifying novel sepsis subphenotypes using temperature trajectories. Am J Respir Crit Care Med. 2019;200(3):327–35.
26. Bhavani SV, Huang ES, Verhoef PA, Churpek MM. Novel temperature trajectory subphenotypes in COVID-19. Chest. 2020;158(6):2436–9.
Page 11 of 11Shen et al. Ann. Intensive Care (2021) 11:121
27. Liu Y, Pan Y, Hu Z, Wu M, Wang C, Feng Z, Mao C, Tan Y, Liu Y, Chen L, et al. Thymosin alpha 1 reduces the mortality of severe coronavirus disease 2019 by restoration of lymphocytopenia and reversion of exhausted T cells. Clin Infect Dis. 2020;71(16):2150–7.
28. Huang I, Pranata R. Lymphopenia in severe coronavirus disease-2019 (COVID-19): systematic review and meta-analysis. J Intensive Care. 2020;8:36.
29. Wang F, Nie J, Wang H, Zhao Q, Xiong Y, Deng L, Song S, Ma Z, Mo P, Zhang Y. Characteristics of peripheral lymphocyte subset alteration in COVID-19 pneumonia. J Infect Dis. 2020;221(11):1762–9.
30. Luo X, Zhou W, Yan X, Guo T, Wang B, Xia H, Ye L, Xiong J, Jiang Z, Liu Y, et al. Prognostic value of C-reactive protein in patients with coronavirus 2019. Clin Infect Dis. 2020;71(16):2174–9.
31. Asano T, Ogawa S. Expression of monocyte chemoattractant protein-1 in Kawasaki disease: the anti-inflammatory effect of gamma globulin therapy. Scand J Immunol. 2000;51(1):98–103.
32. Xu N, Xu J, Li H, Qian L, Qiao L. Analysis of curative effects of human gamma globulin on bacterial pneumonia in pediatric patients. Pak J Pharm Sci. 2019;32:2385–90.
33. Diebel LN, Liberati DM, Diglio CA, Brown WJ. Immunoglobulin a modulates inflammatory responses in an in vitro model of pneumonia. J Trauma. 2005;59(5):1099–106.
34. Kato K, Sakamoto T, Ito K. Gamma-globulin inhibits superantigen-induced lymphocyte proliferation and cytokine production. Allergol Int. 2007;56(4):439–44.
35. He S, Fang L, Xia L, Lin S, Ye J, Luo D. Clinical characteristics and early interventional responses in patients with severe COVID-19 pneumonia. Comput Math Methods Med. 2021;2021:6676987.
36. Hou X, Tian L, Zhou L, Jia X, Kong L, Xue Y, Hao H, Meng X, Zhang F, Dong X. Intravenous immunoglobulin-based adjuvant therapy for severe COVID-19: a single-center retrospective cohort study. Virol J. 2021;18(1):101.
37. Fadel R, Morrison AR, Vahia A, Smith ZR, Chaudhry Z, Bhargava P, Miller J, Kenney RM, Alangaden G, Ramesh MS, et al. Early short-course corticosteroids in hospitalized patients with COVID-19. Clin Infect Dis. 2020;71(16):2114–20.
38. Tomazini BM, Maia IS, Cavalcanti AB, Berwanger O, Rosa RG, Veiga VC, Avezum A, Lopes RD, Bueno FR, Silva M, et al. Effect of dexamethasone on days alive and ventilator-free in patients with moderate or severe acute respiratory distress syndrome and COVID-19: the CoDEX randomized clinical trial. JAMA. 2020;324(13):1307–16.
39. Shen Y, Cai G, Zhu S. Inconsistent evidence of corticosteroid use in differ-ent respiratory disorders. Clin Infect Dis. 2020. https:// doi. org/ 10. 1093/ cid/ ciaa1 439.
Publisher’s NoteSpringer Nature remains neutral with regard to jurisdictional claims in pub-lished maps and institutional affiliations.