Novartis Annual Report 2020
300
Annual Report 2020
Transcript of Novartis Annual Report 2020

Annual Report 2020


Annual Report 2020
I
Chairman’s letterThe COVID-19 pandemic in 2020 created massive soci-etal, economic and healthcare challenges. Novartis took careful steps to protect our associates, maintain supplies of medicines to pa tients and ensure business continuity, helping us also meet the needs and in terests of our healthcare partners, stake holders and shareholders.
These actions enabled Novartis to na vi gate the pandemic and paved the way for future growth. We increased sales and operating profit in 2020, generated good cash flows and continued to innovate. We absorbed the economic shock without resorting to government support or divi-dend cuts, and we committed to no COVID-19-related job losses during the year. Our performance de monstrates our strong operational resilience and ability to cater to diverse patient needs in challenging situations.
Even as the healthcare landscape changed, we launched new pro ducts and strengthened our foothold in the bio-similars arena. Our new launches included the multiple sclerosis medicine Kesimpta and the lung cancer treat-ment Tabrecta. We supported these market entries through digital platforms. Biosimilars, meanwhile, benefited from increased demand amid a continued focus on healthcare costs.
Our research and development acti vities remained robust. We leveraged remote monitoring technology to en sure patient safety while keeping the majority of our clinical trials on track. We also enhanced internal and external collaboration to bolster our medical pipe line. Going forward, we will continue to pursue our sci-ence-based innovation strategy, focusing on fast-grow-ing areas of healthcare, including oncology, cardiology and lung diseases.
We also participated in cross-industry collaborations to fight the pandemic and took steps to support patients in low-income and lower-middle-income countries through a dedicated generic medicines portfolio as well as the creation of a relief fund for affected communities. These efforts are designed to help mitigate the effects of the pandemic in the months and years to come, especially in the most vulnerable re gions of the world, where healthcare- related challenges can have undue long-term societal and economic consequences.
Demonstrating the Board of Directors’ and manage-ment’s attention to the growing importance of our environ mental, social and governance (ESG) agenda, we further reduced our environmental footprint, expanded our
global health efforts and strengthened our governance framework. We consider these steps essential to con-tribute to efforts led by the United Nations to fight pov-erty and climate change, and work toward the creation of more equitable societies.
With the goal of strengthening our reputation and pro-tecting the interests of patients, stakeholders and share-holders, we also overhauled our third-party risk manage-ment to establish stricter controls of our supplier network. Our new Code of Ethics, crowdsourced by associates and rolled out in 2020, is aimed at integrating ethics more closely into business decision-making. These steps are helping Novartis make progress to ward its ambition to be one of the world’s most trusted healthcare partners.
I thank you for the confidence you have placed in our company and am pleased to be able to propose a divi-dend in crease of 2% to CHF 3.00 at the next Annual Gen-eral Meeting.
Sincerely,
Joerg ReinhardtChairman of the Board of Directors

II
CEO’s letter2020 was a unique year in the long history of Novartis, as the COVID-19 pandemic challenged us to deliver on our purpose despite immense challenges to healthcare systems and society. Our company has the utmost respect and gratitude for healthcare professionals around the world who are caring for patients, as well as for scientists who are finding ways to end the pandemic.
As we review our performance for the year, I feel proud of the resilience and agility of our people who continued to make progress in reimagining medi cine. In challenging circumstances, they maintained the supply of Novartis medicines to patients around the world while advancing our pipeline and pivoting to new ways of engaging with customers and each other.
We continued to make progress on our strategic priori-ties. We delivered new innovative medicines for patients, including a treatment for relapsing forms of multiple scle-rosis and a first-in-class siRNA cholesterol-lowering treatment. We continued to develop and build out our pipeline, which remains one of the most valuable in the industry. We’re especially optimistic about our mid- to late-stage pipeline, tracking five promising assets in our Oncology pipeline, six in our Pharma ceuticals pipeline, and an additional five medicines that are already approved and that we believe can be further applied to expanded areas of treatment.
Our ongoing commitments to operational excellence and our digital transformation were critical to our success. We managed disruptions to our development programs, with our early investments in data science and technol-ogy helping to keep the majority of our clinical trials on track. As most of the world went into lockdown, we mit-igated the disruption as much as we could by shifting to digital launches. We kept our supply stable while continu-ing to transform our production network to prepare for future growth.
We also continued to make progress in building trust with society. We announced new, ambitious targets regarding access to medicine and global health, and we issued a sustainability-linked bond to reinforce our commitment to achieving them. We also strengthened our environmental targets, launched a new Code of Ethics, and followed through on our promise to settle legacy legal matters from years prior.
Culture underpinned all of our efforts. The pandemic con-nected associates even more strongly to our purpose, created new demands for learning, and demonstrated the benefits of empowered working. We launched a new working model in 2020 designed to provide associates with greater flexibility while ensuring we continue to drive innovation and performance.
I’m also proud of the ways Novartis contributed to the global pandemic response. Through Sandoz, Novartis was the first company to commit to keeping the prices of essential generic medicines stable. We launched a first- of-its-kind not-for-profit portfolio of medicines to treat symptoms of COVID-19. And we played our part in the scientific effort to find treatments for the disease. Across the industry, we are sharing our scientific find-ings and our research and manufacturing capa city while committing to equitable distribution of diagnostics, ther-apeutics and vaccines. Many more response efforts are outlined in this report.
Delivering on our strategy supported our financial per-formance in 2020. Although the pandemic affected demand in some therapeutic areas, strength in key prod-ucts helped us post net sales of USD 48.7 billion, up 3%, measured in constant currencies (cc). Our core operat-ing income rose 13% (cc) to USD 15.4 billion.
As I write this letter at the end of 2020, the world remains in the grip of COVID-19. Yet we have reasons to be opti-mistic. The pandemic has demonstrated what is possible when human resilience and collaborative science rise to the occasion. Novartis will continue to deliver on our pur-pose to reimagine medicine by developing transforma-tive new treatments and finding innovative solutions to the world’s most pressing healthcare challenges.
Sincerely,
Vas NarasimhanChief Executive Officer
2
Table of contents
Table of contentsIntroduction and use of certain terms .................................................................................................................................................................4Forward-looking statements ...................................................................................................................................................................................5PART I 7Item 1. Identity of Directors, Senior Management and Advisers ...................................................................................................7Item 2. Offer Statistics and Expected Timetable ...................................................................................................................................8Item 3. Key Information ........................................................................................................................................................................................9 3.A Selected financial data .........................................................................................................................................................................9 3.B Capitalization and indebtedness ..................................................................................................................................................10 3.C Reasons for the offer and use of proceeds ...........................................................................................................................10 3.D Risk factors .............................................................................................................................................................................................11Item 4. Information on the Company ..........................................................................................................................................................23 4.A History and development of Novartis ........................................................................................................................................23 4.B Business overview ...............................................................................................................................................................................23 Innovative Medicines ..........................................................................................................................................................................24 Sandoz ...................................................................................................................................................................................................... 43 4.C Organizational structure .................................................................................................................................................................. 48 4.D Property, plants and equipment .................................................................................................................................................. 48Item 4A. Unresolved Staff Comments ..........................................................................................................................................................50Item 5. Operating and Financial Review and Prospects ..................................................................................................................51 5.A Operating results..................................................................................................................................................................................51 5.B Liquidity and capital resources .....................................................................................................................................................77 5.C Research and development, patents and licenses .............................................................................................................86 5.D Trend information .................................................................................................................................................................................86 5.E Off-balance sheet arrangements ................................................................................................................................................86 5.F Tabular disclosure of contractual obligations .......................................................................................................................87Item 6. Directors, Senior Management and Employees ..................................................................................................................88 6.A Directors and senior management .............................................................................................................................................88 6.B Compensation .......................................................................................................................................................................................89 6.C Board practices..................................................................................................................................................................................125 6.D Employees ............................................................................................................................................................................................161 6.E Share ownership................................................................................................................................................................................161Item 7. Major Shareholders and Related Party Transactions ....................................................................................................162 7.A Major shareholders ..........................................................................................................................................................................162 7.B Related party transactions ...........................................................................................................................................................163 7.C Interests of experts and counsel ..............................................................................................................................................163Item 8. Financial Information .......................................................................................................................................................................164 8.A Consolidated statements and other financial information ...........................................................................................164 8.B Significant changes .........................................................................................................................................................................165Item 9. The Offer and Listing ......................................................................................................................................................................166 9.A Offer and listing details ..................................................................................................................................................................166 9.B Plan of distribution ............................................................................................................................................................................166 9.C Markets ...................................................................................................................................................................................................166 9.D Selling shareholders ........................................................................................................................................................................166 9.E Dilution ....................................................................................................................................................................................................166 9.F Expenses of the issue ....................................................................................................................................................................166Item 10. Additional Information .....................................................................................................................................................................167 10.A Share capital ........................................................................................................................................................................................167 10.B Memorandum and articles of association ............................................................................................................................167 10.C Material contracts .............................................................................................................................................................................170 10.D Exchange controls............................................................................................................................................................................ 171 10.E Taxation .................................................................................................................................................................................................. 171 10.F Dividends and paying agents ...................................................................................................................................................... 174
* “Item 5. Operating and Financial Review and Prospects” together with the sections on compounds in development and selected development projects of our divisions (see “Item 4. Information on the Company—Item 4.B Business overview”) constitute the Operating and Financial Review (“Lagebericht”), as defined by the Swiss Code of Obligations.
*
*

3
Table of contents
10.G Statement by experts .....................................................................................................................................................................175 10.H Documents on display ....................................................................................................................................................................175 10.I Subsidiary information ....................................................................................................................................................................175Item 11. Quantitative and Qualitative Disclosures About Market Risk ....................................................................................176Item 12. Description of Securities Other Than Equity Securities...............................................................................................177 12.A Debt securities ...................................................................................................................................................................................177 12.B Warrants and rights..........................................................................................................................................................................177 12.C Other securities .................................................................................................................................................................................177 12.D American Depositary Shares ......................................................................................................................................................177PART II 179Item 13. Defaults, Dividend Arrearages and Delinquencies ..........................................................................................................179Item 14. Material Modifications to the Rights of Security Holders and Use of Proceeds .............................................180Item 15. Controls and Procedures ..............................................................................................................................................................181Item 16A. Audit Committee Financial Expert ...........................................................................................................................................182Item 16B. Code of Ethics ....................................................................................................................................................................................183Item 16C. Principal Accountant Fees and Services ..............................................................................................................................184Item 16D. Exemptions from the Listing Standards for Audit Committees ................................................................................185Item 16E. Purchases of Equity Securities by the Issuer and Affiliated Purchasers .............................................................186Item 16F. Change in Registrant’s Certifying Accountant ..................................................................................................................187Item 16G. Corporate Governance ..................................................................................................................................................................188Item 16H. Mine Safety Disclosure ..................................................................................................................................................................189PART III 190Item 17. Financial Statements.......................................................................................................................................................................190Item 18. Financial Statements.......................................................................................................................................................................191Item 19. Exhibits ...................................................................................................................................................................................................192

4
Introduction and use of certain terms
Introduction and use of certain terms
Novartis AG and its consolidated affiliates publish consolidated financial statements expressed in US dollars. Our consolidated financial statements responsive to Item 18 of this Annual Report on Form 20-F (Annual Report) are prepared in accordance with International Financial Reporting Standards (IFRS) as issued by the International Accounting Standards Board (IASB). “Item 5. Operating and Financial Review and Prospects,” together with the sections on products in development and key development projects of our businesses (see “Item 4. Information on the Company—Item 4.B. Business overview”), constitute the Operating and Financial Review (“Lagebericht”), as defined by the Swiss Code of Obligations.
Unless the context requires otherwise, the words “we,” “our,” “us,” “Novartis,” “Group,” “Company,” and similar words or phrases in this Annual Report refer to Novartis AG and its consolidated affiliates. However, each Group company is legally separate from all other Group companies and manages its business independently through its respective board of directors or similar supervisory body or other top local management body, if applicable. Each executive identified in this Annual Report reports directly to other executives of the Group company that employs the executive, or to that Group company’s board of directors.
In this Annual Report, references to “US dollars,” “USD” or “$” are to the lawful currency of the United States of America, references to “CHF” are to Swiss francs, and references to “euro” or “EUR” are to the lawful currency of 27 member states participating in the European Union; references to the “United States” or to “US” are to the United States of America, references to the “European Union” or to “EU” are to the European Union and its 27 member states, references to “Latin America” are to Central and South America, including the Caribbean, and references to “Australasia” are to Australia, New Zealand, Melanesia, Micronesia and Polynesia, unless the context otherwise requires; references to the “EC” are to the European Commission; references to “associates” are to employees of our affiliates; references to the “SEC” are to the US Securities and Exchange Commission; references to the “FDA” are to the US Food and Drug Administration; references to the “EMA” are to the European Medicines Agency, an agency of the EU, and references to the “CHMP” are to the Committee for Medicinal Products for Human Use of the EMA; references to “ADR” or “ADRs” are to Novartis American Depositary Receipts, and references to “ADS” or “ADSs” are to Novartis American Depositary Shares; references to the “NYSE” are to the New York Stock Exchange, and references to “SIX” are to the SIX Swiss Exchange; references to “ECN” are to the Executive Com-mittee of Novartis; references to “GSK” are to GlaxoSmithKline plc, references to “AAA” are to Advanced Acceler-ator Applications S.A., references to “Novartis Gene Therapies” are to Novartis Gene Therapies, Inc. (formerly AveXis), and references to “Endocyte” are to Endocyte, Inc.
All product names appearing in italics are trademarks owned by or licensed to Group companies. Product names identified by a “®” or a “™” are trademarks that are not owned by or licensed to Group companies and are the prop-erty of their respective owners.

5
Forward-looking statements
Forward-looking statements
This Annual Report contains certain forward-looking statements within the meaning of Section 27A of the Securi-ties Act of 1933, as amended, Section 21E of the Securities Exchange Act of 1934, as amended (the “Exchange Act”), and the United States Private Securities Litigation Reform Act of 1995, as amended. Other written materials filed with or furnished to the SEC by Novartis, as well as other written and oral statements made to the public, may also contain forward-looking statements. Forward-looking statements can be identified by words such as “poten-tial,” “expected,” “will,” “planned,” “pipeline,” “outlook,” “may,” “could,” “would,” “anticipate,” “seek,” or similar terms, or by express or implied discussions regarding potential new products, potential new indications for existing prod-ucts, or regarding potential future revenues from any such products; or regarding the potential outcome, or finan-cial or other impact on Novartis, of the acquisition of The Medicines Company, and other transactions described; or regarding the potential impact of share buybacks; or regarding potential future sales or earnings of the Group or any of its divisions or potential shareholder returns; or regarding potential future credit ratings of the Group; or by discussions of strategy, plans, expectations or intentions. Such forward-looking statements are based on the current beliefs and expectations of management regarding future events, and are subject to significant known and unknown risks and uncertainties. Should one or more of these risks or uncertainties materialize, or should under-lying assumptions prove incorrect, actual results may vary materially from those set forth in the forward-looking statements. You should not place undue reliance on these statements.
In particular, our expectations could be affected by, among other things:
• Uncertainties regarding the success of key products and commercial priorities;
• Global trends toward healthcare cost-containment, including ongoing government, payer and general public pric-ing and reimbursement pressures and requirements for increased pricing transparency;
• Uncertainties in the research and development of new healthcare products, including clinical trial results and additional analysis of existing clinical data;
• Our ability to obtain or maintain proprietary intellectual property protection, including the ultimate extent of the impact on Novartis of the loss of patent protection and exclusivity on key products that commenced in prior years and is expected to continue this year;
• The potential that the strategic benefits, operational efficiencies or opportunities expected from our recent trans-actions or our organizational, structural and cultural transformations may not be realized or may take longer to realize than expected;
• Our performance on environmental, social and governance measures;
• Uncertainties in the development or adoption of potentially transformational technologies and business models;
• Uncertainties regarding potential significant breaches of information security or disruptions of our information technology systems;
• Our reliance on outsourcing key business functions to third parties;
• Our ability to attract, integrate and retain key personnel and qualified individuals;
• Uncertainties regarding actual or potential legal proceedings, including, among others, litigation and other legal disputes with respect to our recent transactions, product liability litigation, litigation and investigations regarding sales and marketing practices, intellectual property disputes and government investigations generally;
• Regulatory actions or delays or government regulation generally, including potential regulatory actions or delays with respect to the development of the products described in this Annual Report;
• Our ability to comply with data privacy laws and regulations, and uncertainties regarding potential significant breaches of data privacy;
• Safety, quality, data integrity or manufacturing issues;

6
Forward-looking statements
• General political, economic and business conditions, including the effects of and efforts to mitigate pandemic diseases such as COVID-19;
• The impact of pandemic diseases such as COVID-19 on enrollment in, initiation and completion of our clinical tri-als in the future, and research and development timelines;
• Uncertainties involved in predicting shareholder returns;
• Uncertainties regarding the effects of recent and anticipated future changes in tax laws and their application to us;
• Uncertainties regarding future global exchange rates; and
• Uncertainties regarding future demand for our products.
Some of these factors are discussed in more detail in this Annual Report, including under “Item 3. Key Information—Item 3.D. Risk factors,” “Item 4. Information on the Company,” and “Item 5. Operating and Financial Review and Prospects.” Should one or more of these risks or uncertainties materialize, or should underlying assumptions prove incorrect, actual results may vary materially from those described in this Annual Report as anticipated, believed, estimated or expected. We provide the information in this Annual Report as of the date of its filing. We do not intend, and do not assume any obligation, to update any information or forward-looking statements set out in this Annual Report as a result of new information, future events or otherwise.

Item 1. Identity of Directors, Senior Management and Advisers
7
PART I
Item 1. Identity of Directors, Senior Management and AdvisersNot applicable.

Item 2. Offer Statistics and Expected Timetable
8
Item 2. Offer Statistics and Expected TimetableNot applicable.

Item 3. Key Information
9
Item 3. Key Information3.A Selected financial data
The selected financial information set out below has been extracted from our consolidated financial state-ments prepared in accordance with International Finan-cial Reporting Standards (IFRS) as issued by the Inter-national Accounting Standard Board (IASB). Our consolidated financial statements for the years ended
December 31, 2020, 2019 and 2018, are included in “Item 18. Financial Statements” in this Form 20-F.
All financial data should be read in conjunction with “Item 5. Operating and Financial Review and Prospects.” All financial data presented in this Form 20-F are quali-fied in their entirety by reference to the consolidated financial statements and their notes.
Year ended December 31,
(USD millions, except per share information) 2020 2019 2018 2017 2016
INCOME STATEMENT DATA1
Net sales to third parties from continuing operations 48 659 47 445 44 751 42 338 41 975
Operating income from continuing operations 10 152 9 086 8 403 8 702 8 248
Income from associated companies 673 659 6 438 1 108 703
Interest expense – 869 – 850 – 932 – 750 – 675
Other financial income and expense – 78 45 186 42 – 385
Income before taxes from continuing operations 9 878 8 940 14 095 9 102 7 891
Taxes – 1 807 – 1 793 – 1 295 – 1 603 – 1 095
Net income from continuing operations 8 071 7 147 12 800 7 499 6 796
Net (loss) / income from discontinued operations before gain
on distribution of Alcon Inc. to Novartis shareholders – 101 – 186 204 – 98
Gain on distribution of Alcon Inc. to Novartis AG shareholders 4 691
Net income/(loss) from discontinued operations 4 590 – 186 204 – 98
Group net income 8 071 11 737 12 614 7 703 6 698
Attributable to:
Shareholders of Novartis AG 8 072 11 732 12 611 7 703 6 712
Non-controlling interests – 1 5 3 0 – 14
Basic earnings per share (USD)
Continuing operations 3.55 3.12 5.52 3.20 2.86
Discontinued operations 2.00 – 0.08 0.08 – 0.04
Total 3.55 5.12 5.44 3.28 2.82
Diluted earnings per share (USD)
Continuing operations 3.52 3.08 5.46 3.17 2.84
Discontinued operations 1.98 – 0.08 0.08 – 0.04
Total 3.52 5.06 5.38 3.25 2.80
Cash dividends2 6 987 6 645 6 966 6 495 6 475
Cash dividends per share in CHF3 3.00 2.95 2.85 2.80 2.75
Personnel cost from continuing operations4, 5 13 898 13 843 13 515 12 009 11 950
Full-time equivalent associates of continuing operations at year-end5 105 794 103 914 104 780 102 467 99 747
1 Continuing operations include the businesses of the Innovative Medicines and Sandoz Divisions and Corporate activities. Discontinued operations included the Alcon business, which was divested in 2019. To reflect these transactions, Novartis reported the Group’s financial results for 2020 to 2016 as “continuing operations” and “discontinued operations,” as required by IFRS.
2 Cash dividends represent cash payments in the applicable year that generally relates to earnings of the previous year.3 Cash dividends per share represent dividends proposed that relate to earnings of the current year. Dividends for 2016 through 2019 were approved at the respective AGMs, and
dividends for 2020 will be proposed to the Annual General Meeting on March 2, 2021, for approval.4 Personnel cost include wages, salaries, allowances, commissions and bonuses to staff, overtime, awards, holiday pay, severance payments and social welfare expenses.5 Own employees

Item 3. Key Information
10
Year ended December 31,
(USD millions) 2020 2019 2018 2017 2016
BALANCE SHEET DATA
Cash, cash equivalents, and marketable securities
and derivative financial instruments 11 563 11 446 15 964 9 485 7 777
Inventories 7 131 5 982 6 956 6 867 6 255
Other current assets 10 979 11 235 11 836 11 856 10 899
Non-current assets 102 386 88 866 110 000 104 871 105 193
Assets of disposal group held for sale1 841 807
Total assets 132 059 118 370 145 563 133 079 130 124
Trade accounts payable 5 403 5 424 5 556 5 169 4 873
Other current liabilities 27 656 22 809 24 000 18 234 17 336
Non-current liabilities 42 334 34 555 37 264 35 449 33 024
Liabilities of disposal group held for sale1 31 51
Total liabilities 75 393 62 819 66 871 58 852 55 233
Equity attributable to shareholders
of Novartis AG 56 598 55 474 78 614 74 168 74 832
Non-controlling interests 68 77 78 59 59
Total equity 56 666 55 551 78 692 74 227 74 891
Total liabilities and equity 132 059 118 370 145 563 133 079 130 124
Net assets 56 666 55 551 78 692 74 227 74 891
Outstanding share capital 860 856 875 869 896
Total outstanding shares (millions) 2 257 2 265 2 311 2 317 2 374
1 In 2019 and 2018, the disposal group held for sale related to the assets and liabilities of the planned divestment of the Sandoz US dermatology business and generic US oral solids
portfolio to Aurobindo Pharma USA Inc., as announced on September 6, 2018. In March 2020, Novartis took the decision to retain these businesses. (see “Item 18. Financial Statements—Note 2. Significant transactions”).
Cash dividends per shareCash dividends are translated into US dollars at the Bloomberg Market System Rate on the payment date. Because we pay dividends in Swiss francs, exchange rate fluctuations will affect the US dollar amounts received by holders of ADRs. Total dividend Total dividend
Month and per share per share
Year earned year paid (CHF) (USD)
2016 March 2017 2.75 2.72
2017 March 2018 2.80 2.94
2018 March 2019 2.85 2.84
2019 March 2020 2.95 3.12
2020 1 March 2021 3.00 3.40 2
1 Dividend to be proposed at the Annual General Meeting on March 2, 2021, and to be distributed from March 8, 2021.2 Translated into US dollars at the December 31, 2020, rate of USD 1.135 to the Swiss franc. This translation is an example only, and should not be construed as a representation that
the Swiss franc amount represents, or has been or could be converted into US dollars at that or any other rate.
3.B Capitalization and indebtedness
Not applicable.
3.C Reasons for the offer and use of proceeds
Not applicable.

Item 3. Key Information
11
3.D Risk factors
Our businesses face significant risks and uncertainties. You should carefully consider all of the information set forth in this Annual Report and in other documents we file with or furnish to the SEC, including the following risk factors, before deciding to invest in or to maintain an investment in any Novartis securities. Our business, as well as our reputation, financial condition, results of oper-ations, and share price, could be materially adversely affected by any of these risks, as well as other risks and uncertainties not currently known to us or not currently considered material.
Strategic risks
Key products and commercial priorities
Risk description Failure to deliver key commercial priorities and success-fully launch new products
Context and potential impact Our ability to maintain and grow our business and to replace revenue and income lost to generic, biosimilar and other competition depends heavily on the commer-cial success of our new or existing key products. The commercial success of these products could be impacted at any time by a number of factors, including pressure from new or existing competitive products, changes in the prescribing habits of healthcare professionals, unex-pected side effects or safety signals, supply chain issues or other product shortages, pricing pressure, regulatory proceedings, changes in labeling, loss of intellectual property protection, and global pandemics. In addition, our revenue and margins could be significantly impacted by the timing and rate of commercial acceptance of new products.
We face competition from scientific advances and other company’s new products. Healthcare profession-als, patients and payers may choose competitor prod-ucts instead of ours for various reasons, including if they perceive them to be better in terms of efficacy, safety, cost, convenience or other reasons. The commercial success of our key products and launches in the face of increasing competition and pressures on pricing requires significant attention and management focus. Such com-petitive products could significantly affect the revenue from our products and our results of operations. This impact could also be compounded to the extent such competition results in us making significant additional investments in research and development, marketing or sales.
Pricing, reimbursement and access
Risk descriptionPricing and reimbursement pressure, including access to healthcare
Context and potential impact Our businesses experience significant pressures on the pricing of our products and on our ability to obtain and maintain satisfactory rates of reimbursement for our products by governments, insurers and other payers. These pressures have many sources, including growth of healthcare costs as a percentage of gross domestic product; funding restrictions and policy changes; man-agement of the COVID-19 pandemic and its impact on healthcare spending; and public controversies, political debate, investigations and legal proceedings regarding pharmaceutical pricing. Pressures on pricing may nega-tively impact, in parallel, both our product pricing and our market access.
In addition, we face numerous cost-containment measures imposed by governments and other payers, including government-imposed industrywide price reductions, mandatory pricing systems, reference pric-ing systems, payers limiting access to treatments based on cost-benefit analyses, imports of drugs from low-er-cost countries to higher-cost countries, shifting of the payment burden to patients through higher co-payments and co-pay accumulator programs, limiting physicians’ ability to choose among competing medicines, manda-tory substitution of generic drugs for the patented equiv-alent, pressure on physicians to reduce the prescribing of patented prescription medicines, increasing pressure on intellectual property protections, and growing require-ments for increased transparency on pricing. For more information on price controls, see “Item 4. Information on the Company—Item 4.B Business overview—Innovative Medicines—Price controls.”
These challenges are expected to continue to increase in 2021 and beyond as healthcare investment into the management of the COVID-19 pandemic contin-ues; political pressures mount; and healthcare payers around the globe, including government-controlled health authorities, insurance companies and managed care organizations, step up initiatives to reduce the over-all cost of healthcare, restrict access to higher-priced new medicines, increase the use of generics, and impose overall price cuts. These factors may materially affect our ability to achieve value-based prices and maintain an acceptable return on our investments in the research and development of our products, and may impact our ability to research and develop new products.
In addition, our Sandoz Division has faced and may in the future face strong competition from other generic and biosimilar pharmaceutical companies, which aggres-sively compete for market share, including through sig-nificant price competition. Such competitive actions may increase the costs and risks associated with our efforts to introduce and market generic and biosimilar products, may delay the introduction or marketing of such prod-ucts, and may further limit the prices at which we are able to sell these products. In particular, in the US in past years, industrywide price competition among generic pharmaceutical companies and consolidation of buyers caused significant declines in sales and profits of Sandoz.

Item 3. Key Information
12
Research and development
Risk descriptionFailure or delay in the research and development of new products or new indications for existing products
Context and potential impactWe engage in extensive and costly research and devel-opment activities, both through our own internal resources and through collaborations with third parties, in an effort to identify and develop new products and new indications for existing products that address unmet and changing medical needs and are commercially suc-cessful. Our ability to grow our business; to replace sales lost due to branded competition, entry of generics, or other reasons; and to bring to market products that take advantage of new and potentially disruptive technolo-gies, including cell, gene and radioligand therapies, depends in significant part upon the success of these efforts.
Research and development of new products of our Innovative Medicines Division, including the research and development of our cell and gene therapies, is a costly, lengthy and uncertain process. Because intellectual property protections are limited in scope and duration, the longer it takes to develop a product, the less time there may be for us to recoup our research and devel-opment costs before loss of exclusivity. Failure can occur at any point in the process, including in later stages after substantial investment. In spite of such substantial invest-ment, there can be no guarantee that our research and development activities will produce commercially suc-cessful new products that will enable us to replace rev-enue and income lost to competition and to grow our business. See also “Item 4. Information on the Com-pany—Item 4.B Business overview—Innovative Medicines—Research and development” with regards to the research and development efforts of our Innovative Medicines Division.
New products must undergo intensive preclinical and clinical testing, and must be approved by means of highly complex, lengthy and expensive approval processes that can vary from country to country. Further, regulatory authorities continue to establish new and increasingly rigorous and time-consuming requirements for approval and reimbursement of new products and new indications. Similarly, the post-approval regulatory burden has also increased. These requirements make the maintenance of regulatory approvals for our products increasingly expensive, and further heighten the risk of recalls, prod-uct withdrawals, loss of market share, and loss of reve-nue and profitability. The clinical testing, regulatory pro-cesses and post-approval activities described above become more difficult during pandemics, such as the COVID-19 pandemic. This is primarily due to challenges related to recruiting, enrolling and treating patients in clinical trials. In addition, travel restrictions resulting from pandemics make it more difficult for regulatory authori-ties to inspect sites. For a further description of the research and development and approval processes for the products of our Innovative Medicines Division, see the sections headed “Research and development” and “Regulation” included in the description of our Innovative Medicines Division under “Item 4. Information on the
Company—Item 4.B Business overview—Innovative Medicines.”
Our Sandoz Division has made, and expects to con-tinue to make, significant investments in the development of biotechnology-based, “biologic” medicines intended for sale as bioequivalent or “biosimilar” versions of cur-rently marketed biotechnology products. While the development of such products typically is significantly less costly and complex than the development of the equivalent originator medicines, it is nonetheless signifi-cantly more costly and complex than that for typical small-molecule generic products. See also “Item 4. Infor-mation on the Company—Item 4.B Business overview—Sandoz—Development and registration” with regards to the research and development efforts of our Sandoz Divi-sion. In addition, many countries do not yet have fully developed legislative or regulatory pathways to facilitate the development of biosimilars and permit their sale in a manner in which they are readily substitutable alterna-tives to the originator product. Further delays or difficul-ties in the development or marketing of biosimilars could put at risk the significant investments that Sandoz has made, and will continue to make, in its Biopharmaceuti-cals business. Failure to successfully develop and mar-ket biosimilars could have a material adverse effect on the success of the Sandoz Division and the Group as a whole. For more information about the approval pro-cesses that must be followed to market Sandoz Division products, see “Item 4. Information on the Company—Item 4.B Business overview—Sandoz—Regulation.”
Further, our research and development activities must be conducted in an ethical and compliant manner. Among other things, we are concerned with patient safety, data privacy, Current Good Clinical Practices (cGCP) requirements, data integrity, the fair treatment of patients, and animal welfare. Should we fail to prop-erly manage such issues, we risk injury to third parties, damage to our reputation, negative financial conse-quences as a result of potential claims for damages, sanctions and fines, and the potential that investments in research and development activities could have no benefit to the Group. Research to find new targets for drug discovery and the therapeutic agents to treat unmet medical needs is made more difficult during pandemics, such as the COVID-19 pandemic. This is primarily due to safety-related restrictions on the ability of laboratory sci-entists to work in research laboratories, and impacts our ability to collaborate with academic and commercial research organizations facing similar challenges and restrictions.
Intellectual property
Risk descriptionExpiry, assertion or loss of intellectual property protec-tion
Context and potential impactMany products of our Innovative Medicines Division are protected by intellectual property rights, which may pro-vide us with exclusive rights to market those products for a limited time and enable us to sustainably finance our research and development. However, the strength and duration of those rights can vary significantly from

Item 3. Key Information
13
product to product and country to country, and they may be successfully challenged by third parties or govern-mental authorities.
Loss of intellectual property protection and the intro-duction of generic or biosimilar competition for a pat-ented branded medicine typically result in a significant and rapid reduction in net sales and operating income for the branded product, because generic or biosimilar manufacturers typically offer their versions at sharply lower prices. Such competition can occur after success-ful challenges to intellectual property rights or the reg-ular expiration of the patent term or other intellectual property rights. Such competition can also result from the entry of generic or biosimilar versions of another medicine in the same therapeutic class as one of our drugs or in a competing therapeutic class, from a Dec-laration of Public Interest or the compulsory licensing of our drugs by governments, or from a general weakening of intellectual property and governing laws in certain countries around the world. In addition, generic or bio-similar manufacturers may sometimes conduct so-called “launches at risk” of products that are still under legal challenge for infringement, or whose patents are still under legal challenge for validity, before final resolution of legal proceedings.
We also rely in all aspects of our businesses on unpat-ented proprietary technology, know-how, trade secrets and other confidential information, which we seek to pro-tect through various measures, including confidentiality agreements with licensees, employees, third-party col-laborators, and consultants who may have access to such information. If these agreements are breached or our other protective measures should fail, then our con-tractual or other remedies may not be adequate to cover our losses.
We may also be subject to assertions of intellectual property rights against our innovative medicines by third parties. If successful, these actions may involve payment of damages, for example for patent infringement, and may also involve injunctive relief requiring removal of a product from the market (or removing a therapeutic indi-cation from the product’s approved labeling) for some period of time or throughout the life of the asserted intel-lectual property right. These damages or an injunction may have a material impact on our operating income and net sales.
In any given year, we may experience a potentially significant impact on our net sales from products that have already lost intellectual property protections, as well as products that may lose protection during the year. Because we may have substantially reduced marketing and research and development expenses related to products that are in their final years of exclusivity, the initial loss of protection for a product during a given year could also have an impact on our operating income for that year in an amount corresponding to a significant portion of the product’s lost sales. The magnitude of the impact of generic or biosimilar competition on our income could depend on a number of factors, including, with respect to income in a given year, the time of year at which the generic or biosimilar competitor is launched; the ease or difficulty of manufacturing a competitor prod-uct and obtaining regulatory approval to market it; the number of generic or biosimilar competitor products
approved, including whether, in the US, a single compet-itor is granted an exclusive marketing period; whether an authorized generic is launched; the geographies in which generic or biosimilar competitor products are approved, including the strength of the market for generic or bio-similar pharmaceutical products in such geographies, and the comparative profitability of branded pharmaceu-tical products in such geographies; and our ability to suc-cessfully develop and launch profitable new products to replace the income lost to generic or biosimilar compe-tition. For more information on the patent and generic competition status of our Innovative Medicines Division products, see “Item 4. Information on the Company—Item 4.B Business overview—Innovative Medicines—Intellec-tual property.”
Alliances, acquisitions and divestments
Risk descriptionFailure to identify external business opportunities or real-ize the expected benefits from our strategic acquisitions or divestments
Context and potential impactAs part of our strategy, from time to time we acquire and divest products or entire businesses, and enter into stra-tegic alliances and collaborations. For example, in 2020 we completed the acquisitions of The Medicines Com-pany and the Japanese operations and associated assets of Aspen Global Incorporated. This strategy depends in part on our ability to identity strategic exter-nal business opportunities and to move forward with such opportunities on acceptable terms.
Once a strategic transaction is agreed upon with a third party, we may not be able to complete the transac-tion in a timely manner or at all, nor can we be sure that pre-transaction due diligence will identify all possible issues that might arise during and after the transaction. Our efforts on such transactions can also divert man-agement’s attention from our existing businesses.
Further, after an acquisition, efforts to develop and market acquired products, to integrate the acquired busi-ness or to achieve expected synergies may fail or may not fully meet expectations, as a result of difficulties in retaining key personnel, customers and suppliers; failure to obtain marketing approval or reimbursement within expected time frames or at all; differences in corporate culture, standards, controls, processes and policies; or other factors. Acquisitions can also result in liabilities being incurred that were not known at the time of acqui-sition, or the creation of tax or accounting issues. Acquired businesses are not always in full compliance with legal, regulatory or Novartis standards, including, for example, Current Good Manufacturing Practices (cGMP) or cGCP standards, which can be costly and time-consuming to remedy. Also, our strategic alliances and collaborations with third parties may not achieve their intended goals and objectives within expected time frames, or at all.
Similarly, we cannot ensure that we will be able to successfully divest or spin off businesses or other assets that we have identified for this purpose, or that any com-pleted divestment or spin-off will achieve the expected strategic benefits, operational efficiencies or opportuni-

Item 3. Key Information
14
ties, or that the divestment or spin-off will ultimately max-imize shareholder value.
Environmental, social and governance matters
Risk descriptionUnsuccessful management of environmental, social and governance matters
Context and potential impactIncreasingly, in addition to financial results, companies are being judged by performance on a variety of envi-ronmental, social and governance (ESG) matters, which can contribute to the long-term sustainability of compa-nies’ performance. An inability to successfully perform on ESG matters can result in negative impacts to our reputation, recruitment, retention, operations, financial results, and the price of our shares.
A variety of organizations measure the performance of companies on ESG topics, and the results of these assessments are widely publicized. In addition, invest-ment in funds that specialize in companies that perform well in such assessments are increasingly popular, and major institutional investors have publicly emphasized the importance of such ESG measures in making their investment decisions. Topics taken into account in such assessments include, among others, the unintentional costs or benefits of our actions on third parties not involved in such actions, which may impact society and the environment, such as with respect to climate change, the degradation of biodiversity, and inequality in society. In particular, the resulting costs of such actions may in the long-term impact our operations and ability to achieve our strategic goals, ultimately resulting in broader neg-ative impacts on the value of Novartis. Therefore, the role of our Board of Directors and executive officers in super-vising various sustainability issues is becoming increas-ingly important. In addition to the topics typically consid-ered in such assessments in the healthcare industry, the public’s ability to access our medicines is particularly important. If our advocacy and lobbying efforts are not aligned with our publicly stated ESG targets, our perfor-mance on ESG assessments may be negatively impacted.
We actively manage a broad range of such ESG mat-ters, taking into consideration their expected impact on the sustainability of our business over time, and the potential impact of our business on society and the envi-ronment. However, in light of investors’ increasing focus on ESG matters and rapidly changing views on accept-able levels of action across a range of topics, there can be no certainty that we will manage such issues suc-cessfully, or that we will successfully meet society’s or investors’ expectations as to our proper role.
Organizational, structural and cultural transformations
Risk description Failure to successfully achieve our organizational, struc-tural and cultural transformations
Context and potential impactFrom time to time we reassess our business organiza-tion to ensure we have the optimal structure with which
to execute our strategy. This resulted in our decision to centralize and optimize our manufacturing and business services organizations, which is currently being effected through a series of complex initiatives. For example, our Novartis Technical Operations organizational unit is cur-rently undergoing a transformation to change its oper-ating model by building two global operations centers that will allow our manufacturing sites to focus on their core activity, which is the manufacture of our medicines. This structural transformation is expected to be com-pleted over the next 24 months, and a failure to complete this transformation in the expected time frame, or at all, could negatively impact our operations. We are also undertaking a cultural transformation to an “inspired, curious and unbossed” organization, which is a core organizational imperative. Inability to successfully imple-ment this cultural change may result in cynicism and dis-engagement of our associates, as well as impede our ability to retain key talent in strategically important areas.
These organizational changes are being implemented in parallel and have interdependencies that could nega-tively impact each other and their timing of implementa-tion. The overall extent and pace of organizational change, and the additional workload and complexity for our employees in some areas, could trigger uncertainty, stress and fatigue among employees, potentially result-ing in instability within the organization that may lead to failure in delivering the desired organizational changes. As a result, the expected benefits of these organizational changes may never be fully realized or may take longer to realize than expected.
Digitalization and emerging business models
Risk descriptionMissed opportunities in digitalization and emerging busi-ness models
Context and potential impact Rapid progress in medical and digital technologies and in the development of new business models is substan-tially transforming our industry and is creating new busi-nesses and new opportunities for improving patient care and increasing revenue and profit, while sometimes quickly rendering established businesses uncompetitive or obsolete. Such transformations, both positive and negative, may impact our businesses. For example, numerous technology companies are seeking to enter the healthcare field, which generates opportunities for partnerships and alliances for us that may accelerate innovation and complement our current capabilities, although we also may be impacted by potential innovative technological advances among our existing competitors, through partnerships and alliances with technology com-panies or otherwise.
To take advantage of these opportunities, we are implementing a digital transformation strategy, with the goal of becoming an industry leader in leveraging advanced analytics and digital technologies. We expect to invest substantial resources into efforts to improve the way we use data in drug discovery and development; to improve the ways we engage with patients, doctors and other stakeholders; and to automate business pro-cesses. Our success in these efforts will depend on many

Item 3. Key Information
15
factors, including data quality, technology architecture, entering into successful partnerships and alliances with technology companies, a cultural change among our employees, attracting and retaining employees with appropriate skills and mindsets, and successfully inno-vating across a variety of technology fields. The COVID-19 pandemic has accelerated our digital transformation, including in the ways we engage and interact with our stakeholders, bring our products to market, and meet the needs of patients. These initiatives include the devel-opment and implementation of personalized engage-ment models enabled by digital technologies, the demand for which has increased in response to the COVID-19 pandemic. Our digital transformation efforts have started to gain significant traction, but we do not yet know whether they will be sustainable as they are scaled and made a part of our normal business operations. There is also no guarantee that these efforts will succeed, that we will successfully implement our digital transformation strategy, or that we will be able to do so within our bud-get or in the expected time frame.
At the same time, other technology companies with specialized expertise or business models and substan-tial resources are entering the healthcare field, from research and development to pharmaceutical distribu-tion and delivery of care. These new entrants could dis-rupt our relationships with patients, healthcare profes-sionals, customers, distributors and suppliers, with unknown potential consequences for us. Such new com-petitors may impact our share of the healthcare value chain, or successfully develop products or technologies that could make our products or business models uncom-petitive or obsolete. The risks described above may result in our business being supplanted in whole or in part by new competitors with disruptive new technolo-gies or business models.
Operational risks
Cybersecurity and IT systems
Risk description Cybersecurity breaches and catastrophic loss of IT sys-tems
Context and potential impactWe are heavily dependent on critical, complex and inter-dependent information technology (IT) systems, includ-ing internet-based systems to support our business pro-cesses. We also have outsourced significant parts of our IT infrastructure to third-party providers, and we cur-rently use these providers to perform business-critical IT services for us. We are therefore vulnerable to cyber-security attacks and incidents on such networks and systems, whether our own or those of the third-party providers we contract, and we have experienced and may in the future experience such cybersecurity threats and attacks. Cybersecurity threats and attacks take many forms, and the size, age and complexity of our IT systems make them potentially vulnerable to external and internal security threats; outages; malicious intru-sions and attacks; cybercrimes, including state-spon-sored cybercrimes; malware; misplaced or lost data; pro-
gramming or human errors; or other similar events. In the context of the COVID-19 pandemic, the risk of such threats and attacks has increased, as virtual and remote working has become more widely used, and sensitive data is accessed by employees working in less secure, home-based environments. In addition, due to our reli-ance on third-party providers, we have experienced and may in the future experience interruptions, delays or out-ages in IT service availability due to a variety of factors outside of our control, including technical failures, natu-ral disasters, fraud, or security attacks experienced by or caused by the third-party provider. Interruptions in the service provided by these third parties could affect our ability to perform critical tasks.
A significant information security or other event, such as a disruption or loss of availability of one or more of our IT systems, whether managed by us or a third-party service provider, has previously and could in the future negatively impact important business processes, such as the conduct of scientific research and clinical trials, the submission of data and information to health author-ities, our manufacturing and supply chain processes, our shipments to customers, our compliance with legal obli-gations, and communication between employees and with third parties. IT issues have previously and could in the future also lead to the compromise of trade secrets or other intellectual property that could be sold and used by competitors to accelerate the development or man-ufacturing of competing products; to the compromise of personal financial and health information; and to the compromise of IT security data such as usernames, passwords and encryption keys, as well as security strat-egies and information about network infrastructure, which could allow unauthorized parties to gain access to additional systems or data. In addition, malfunctions in software or medical devices that make significant use of IT could lead to a risk of direct harm to patients.
Although we have experienced some of the events described above, to date they have not had a material impact on our operations. Nonetheless, the occurrence of any of the events described above in the future could disrupt our business operations and result in enforce-ment actions or liability, including potential government fines and penalties, claims for damages, and shareholder litigation or allegations that the public health, or the health of individuals, has been harmed.
Any significant events of this type could require us to expend significant resources beyond those we already invest to remediate any damage, to further modify or enhance our protective measures, and to enable the con-tinuity of our business.
Third-party management
Risk descriptionFailure to maintain adequate governance and oversight over third-party relationships, and failure of third parties to meet their contractual, regulatory or other obligations
Context and potential impactWe outsource the performance of certain key business functions to third parties, and invest a significant amount of effort and resources into doing so, including to man-age and oversee such third parties. Such outsourced
Item 3. Key Information
16
functions include research and development collabora-tions, manufacturing operations, warehousing and dis-tribution activities, certain finance functions, sales and marketing activities, data management and others. Some of these third parties, particularly those in developing countries, do not have internal compliance systems com-parable to those within our organization.
Our reliance on outsourcing and third parties for the research and development, sales or manufacturing of our products poses certain risks, including misappropri-ation of our intellectual property, failure of the third party to comply with regulatory and quality assurance require-ments, unexpected supply disruptions, breach of the research and development or manufacturing agreement by the third party, and the unexpected termination or nonrenewal of the agreement by the third party.
In addition, governments and the public expect com-panies like Novartis to take responsibility for and report on compliance with various human rights, responsible sourcing and environmental practices, as well as other actions of their third-party contractors around the world.
Ultimately, if third parties fail to meet their obligations to us, we may lose our investment in the collaborations or fail to receive the expected benefits of our agreements with such third parties. In addition, should any of these third parties fail to comply with the law or our standards, or should they otherwise act inappropriately in the course of their performance of services for us, there is a risk that we could be held responsible for their acts, that our reputation may suffer, and that penalties may be imposed upon us.
Manufacturing and product quality
Risk description Inability to ensure proper controls in product develop-ment and product manufacturing, and failure to comply with applicable regulations and standards
Context and potential impactThe development and manufacture of our products is complex and heavily regulated by governmental health authorities around the world. Whether or not our prod-ucts and the related raw materials are developed and manufactured at our own manufacturing sites or by third parties, we must ensure that all development and man-ufacturing processes comply with regulatory require-ments as well as our own quality standards. Failure to comply with regulatory requirements has resulted in, and may in the future result in, warning letters, suspension of manufacturing, seizure of products, injunctions, prod-uct recalls, failure to secure product approvals, or debar-ment.
In recent years, global health authorities have sub-stantially intensified their scrutiny of manufacturers’ compliance with regulatory requirements. Any significant failure by us or our third-party suppliers to comply with regulatory requirements, or with health authorities’ expectations, may create the need to suspend clinical trials, shut down production facilities or production lines, and recall commercial products. A failure to fully comply with regulatory requirements could also lead to a delay in the approval of new products, an inability to ship or
import our products, and significant penalties and repu-tational harm.
Talent management
Risk description Inability to attract, integrate and retain key personnel and qualified individuals
Context and potential impactWe rely on a diverse, capable workforce across our busi-nesses and functions. Novartis invests in attracting, recruiting, developing and retaining highly skilled individ-uals to achieve our business objectives. The loss of key personnel – including senior members of our scientific and management teams, high-quality researchers and development specialists, and skilled personnel in key markets – could delay or prevent the achievement of our major business objectives.
Our future growth will demand that we retain talented associates and leaders while also recruiting new talent who bring new skills and perspectives. The market for skilled labor has become increasingly competitive. We are experiencing challenges in attracting skilled talent in several areas, including in our Oncology business unit and for our chimeric antigen receptor T-cell (CAR-T) therapies, gene therapies and radioligand therapy prod-ucts. The supply of new talent is especially limited in many of the geographies that are expected to be sources of growth for Novartis, including Emerging Growth Mar-kets such as China, where there is a limited pool of exec-utives and functional experts with the experience needed to work successfully in a global organization like Novartis. The geographic mobility of talent worldwide is decreas-ing, with ample career opportunities available closer to home to talented individuals in developed and develop-ing countries. This decrease in mobility may be wors-ened by anti-immigrant sentiments in many countries, and laws discouraging immigration.
The constraints associated with lockdowns and social distancing during the COVID-19 pandemic com-plicated and initially slowed our talent acquisition activ-ities. The necessity to adopt remote working across a portion of the workforce has accelerated our transition toward a new working model, in which a number of our associates have the flexibility to determine where, when and how they work. Our transition toward a more flexi-ble working model accelerated our efforts to expand our sources to recruit talent from an increasingly global pool. We aspire to become less inhibited by job location requirements or candidate mobility preferences when searching for the highest caliber talent to fill openings. However, these efforts may not achieve the intended results in any particular time frame, or at all, or may have unanticipated negative consequences, including possi-ble negative impacts on company culture and productiv-ity. In addition, in many of the specialized fields from which we draw talent, such as clinical development, bio-sciences, chemistry, drug manufacturing and IT, and in many senior leadership positions, high demand will con-tinue to limit the pool of external talent and increase the risk of turnover.

Item 3. Key Information
17
Legal and compliance
Risk description Challenges in keeping up with legal and regulatory requirements, and evolving societal expectations
Context and potential impactWe are obligated to comply with the laws of all of the countries in which we operate and sell products with respect to an extremely wide and growing range of activ-ities. Such legal requirements are extensive and com-plex.
The laws and regulations relevant to the healthcare industry and applicable to us are broad in scope and are subject to change and evolving interpretations, which could require us to incur substantial costs associated with compliance or to alter one or more of our business practices. For example, we have been, are currently and may in the future be subject to various significant legal proceedings, such as private party litigation, government investigations and law enforcement actions worldwide. These types of matters may take various forms based upon evolving government enforcement and private party litigation priorities, and could include matters per-taining to pricing; bribery and corruption; trade regula-tion and embargo legislation; product liability; commer-cial disputes; employment and wrongful discharge; antitrust; securities; government benefit programs; reim-bursement; rebates; healthcare fraud; sales and market-ing practices; insider trading; occupational health and safety; environmental regulations; tax; cybersecurity; data privacy; regulatory interactions; and intellectual property. Such activities can involve criminal proceed-ings, and can retroactively challenge practices previously considered to be legal.
There is also a risk that governance for our medical and patient support activities, and our interactions with governments, public officials/institutions, healthcare professionals, healthcare organizations and patient organizations may be inadequate or fail, or that we may undertake activities based on improper or inadequate scientific justification.
Our Sandoz Division may from time to time seek approval to market a generic version of a product before the expiration of patents claimed by the marketer of the patented product. We do this in cases where we believe the relevant patents are invalid or unenforceable, or would not be infringed by our generic product. As a result, affiliates of our Sandoz Division frequently face patent litigation, and in certain circumstances, we may make the business decision to market a generic product even though patent infringement actions are still pending. Should we elect to do so and conduct a so-called “launch at risk,” we could face substantial damages if the final court decision is adverse to us.
Legal proceedings and investigations are inherently unpredictable, and large judgments sometimes occur. As a consequence, we may in the future incur judgments that could involve large payments, including the poten-tial repayment of amounts allegedly obtained improperly, and other penalties, including treble damages. In addi-tion, such legal proceedings and investigations, even if meritless, may affect our reputation, may create a risk of potential exclusion from government reimbursement
programs in the US and other countries, and may lead to civil litigation. As a result, having taken into account all relevant factors, we have in the past and may again in the future enter into major settlements of such claims without bringing them to final legal adjudication by courts or other such bodies, despite having potentially signifi-cant defenses against them, in order to limit the risks they pose to our business and reputation. Such settle-ments may require us to pay significant sums of money and to enter into corporate integrity or similar agree-ments, which are intended to regulate company behav-ior for extended periods.
For information on significant legal matters pending against us, see “Item 18. Financial Statements—Note 22. Provisions and other non-current liabilities” and “Item 18. Financial Statements—Note 28. Commitments and con-tingencies.”
New requirements may also be imposed on us as a result of changing government and societal expectations regarding the healthcare industry, and acceptable cor-porate behavior generally. For example, we are faced with laws and regulations requiring changes in how we do business, including with respect to disclosures con-cerning our interactions with healthcare professionals, healthcare organizations and patient organizations. These laws and regulations include requirements that we disclose payments or other transfers of value made to healthcare professionals and organizations, as well as information relating to the costs and prices for our prod-ucts, which represent evolving standards of acceptable corporate behavior. These requirements may incur sig-nificant costs, including substantial time and additional resources, that are necessary to bring our interactions with healthcare professionals and organizations into compliance with these evolving standards.
In addition to legal and regulatory requirements, as a company we aim to meet the evolving societal expecta-tions of the public and our investors regarding ethical behavior and the increasing importance placed on ESG matters.
To help us in our efforts to comply with the many requirements that impact us, we have a significant global ethics and compliance program in place, and we devote substantial time and resources to efforts to ensure that our business is conducted in a lawful and publicly accept-able manner. Despite our efforts, an actual or alleged failure to comply with law or with heightened public expectations could lead to substantial liabilities that may not be covered by insurance, or to other significant losses.
Data privacy
Risk descriptionNoncompliance with personal data protection laws and regulations
Context and potential impactWe operate in an environment that relies on the collec-tion, processing, analysis and interpretation of large sets of patients’ and other individuals’ personal information, including via social media and mobile technologies. Also, the operation of our business requires data to flow freely across borders of numerous countries in which there are
Item 3. Key Information
18
different, and potentially conflicting, frequently changing data privacy laws in effect. For example, the EU General Data Protection Regulation (GDPR), which took effect in May 2018; the California Consumer Privacy Act, which took effect in January 2020; and Brazil’s General Per-sonal Data Protection Law, which entered into force in September 2020, impose stringent requirements on how we and third parties with whom we contract collect, share, export or otherwise process personal informa-tion, and provide for significant penalties for noncompli-ance. Further examples of countries with data-specific requirements governing where data is stored and whether it can be transferred outside the country are Russia and China. Breaches of our systems or those of our third-party contractors, or other failures to protect the data we collect from misuse or breach by third par-ties, could expose such personal information to unau-thorized persons.
Any event involving the substantial loss of personal information, use of personal information without a legal basis, or other privacy violations could give rise to sig-nificant liability, reputational harm, damaged relation-ships with business partners, and potentially substantial monetary penalties under laws enacted or being enacted around the world. Such events could also lead to restric-tions on our ability to use personal information and/or transfer personal information across country borders. In addition, there is a trend of increasing divergence of data privacy legal frameworks, not only across these frame-works but also within individual legal frameworks them-selves. This divergence may constrain the implementa-tion of global business processes and may lead to different approaches on the use of health data for sci-entific research, which may have a negative impact on our business and operations.
Supply chain
Risk descriptionInability to maintain continuity of product supply
Context and potential impactMany of our products are produced using technically complex manufacturing processes and require a supply of highly specialized raw materials. For some of our prod-ucts and raw materials, we may rely on a single source of supply. In addition, we manufacture and sell a number of sterile products, biologic products, and products involving advanced therapy platforms, such as CAR-T therapies, gene therapies and radioligand therapy prod-ucts, all of which are particularly complex and involve highly specialized manufacturing technologies. Because the production process for some of our products is com-plex, there is a risk of production failures, which may result in supply interruptions or product recalls due to defective product being distributed to the market.
In addition, due to the inherent complexities of our production processes, we are required to plan our pro-duction activities well in advance. If we suffer from third-party raw material shortages, underestimate market demand for a product, or fail to accurately predict when a new product will be approved for sale, then we may not be able to produce sufficient product to meet demand. These issues could be made worse during a pandemic
like the COVID-19 pandemic, and can lead to (i) a sud-den increase in demand for selected medicinal products, resulting in the short-term unavailability of raw material; (ii) logistical and supply challenges that may lead to our inability to ship products from one place to another due to restrictions imposed as a result of a pandemic, which can impact transportation and warehousing costs; or (iii) our inability to properly operate a production site due to restrictions imposed as the result of a pandemic.
Our or our third-party suppliers’ inability to manage such issues could lead to shutdowns, to product short-ages, or to our being entirely unable to supply products to patients for an extended period of time. Further, because our products are intended to promote the health of patients, such shortages or shutdowns could endan-ger our reputation and have led to, and could continue to lead to, significant losses of sales revenue, potential litigation or allegations that the public health, or the health of individuals, has been harmed.
Falsified medicines
Risk descriptionImpact on patient safety and reputational and financial harm to Novartis and our products
Context and potential impact We continue to be challenged by the vulnerability of dis-tribution channels to falsified medicines, which include counterfeit, stolen, tampered and illegally diverted medicines under the definition of the World Health Orga-nization. The COVID-19 pandemic has substantially increased the presence of falsified medicines in the mar-kets affected and on the internet. Falsified medicines pose patient safety risks and can be seriously harmful or life-threatening. Reports of adverse events related to falsified medicines and increased levels of falsified medicines in the healthcare system affect patient confi-dence in our genuine medicines and in healthcare sys-tems in general. These events could also cause us sub-stantial reputational and financial harm, and potentially lead to litigation if the adverse event from the falsified medicine is mistakenly attributed to the genuine one. Sto-len or illegally diverted medicines, which are then not properly stored and are later sold through unauthorized channels, could adversely impact patient safety, our rep-utation and our business. Further, there is a direct finan-cial loss when, for example, falsified medicines replace sales of genuine medicines, or genuine medicines are recalled following discovery of falsified products.
Emerging risks
Geo-political and socio-economic threats
Risk descriptionNegative impact of geo- and socio-political threats and economic instability
Context and potential impactUnpredictable political conditions currently exist in var-ious parts of the world, including a backlash in certain areas against free trade; anti-immigrant sentiment;

Item 3. Key Information
19
anti-corporatist sentiment; social unrest; fears of terror-ism; risk of direct conflicts between nations; a global pan-demic; and economic downturn.
The imposition of tariffs, including those imposed by the US and China, and the possibility of additional tariffs or other trade restrictions relating to trade between the US and other countries, could have a material negative impact on our business. Given that the status of trade negotiations remains subject to change, we cannot be certain of the nature or extent of the potential impact on our business. For example, if tariffs on pharmaceutical products or active pharmaceutical ingredients (APIs) were increased, this could impact the profitability of our products and disrupt our supply chain. Increasing oppo-sition to free trade may increase the risks we face in our efforts to improve and harmonize standards in regulation and intellectual property.
Furthermore, significant conflicts continue in certain parts of the world. Collectively, such unstable conditions could, among other things, disturb the international flow of goods and increase the costs and difficulties of inter-national transactions, which could significantly impact time to market and our ability to supply our products to patients in an undisrupted fashion, and further erode reimbursement levels for innovative therapies.
In addition, local economic conditions may adversely affect the ability of payers, as well as our distributors, customers, suppliers and service providers, to pay for our products, or otherwise to buy necessary inventory or raw materials, and to perform their obligations under agreements with us. Although we make efforts to moni-tor these third parties’ financial condition and their liquid-ity, our ability to do so is limited, and some of them may become unable to pay their bills in a timely manner, or may even become insolvent. These risks may be elevated with respect to our interactions with fiscally challenged government payers, or with third parties with substantial exposure to such payers.
Our business may be impacted by economic and financial conditions directly affecting consumers. Given that in many countries, patients directly pay a large por-tion of their own healthcare costs, there is a risk that consumers may cut back on prescription drugs due to financial constraints.
At the same time, significant changes and potential future volatility in the financial markets, in the consumer and business environment, in the competitive landscape, and in the global political and security landscape make it increasingly difficult for us to predict our revenues and earnings. As a result, any revenue or earnings guidance or outlook that we have given or might give may be over-taken by events, or may otherwise turn out to be inaccu-rate. Though we endeavor to give reasonable estimates of future revenues and earnings at the time we give such guidance, based on then-current knowledge and condi-tions, there is a risk that such guidance or outlook will turn out to be incorrect.
Financial market issues may also result in a lower return on our financial investments, and a lower value on some of our assets. Alternatively, inflation could accel-erate, which could lead to higher interest rates, increas-ing our costs of raising capital. Uncertainties around future central bank and other economic policies in the US and EU, as well as high debt levels in certain other
countries, could also impact world trade. Sudden increases in economic, currency or financial market vol-atility in different countries have also impacted, and may continue to unpredictably impact, our business or results of operations, including the conversion of our operating results into our reporting currency, the US dollar, as well as the value of our investments in our pension plans.
For a discussion of effect of price controls on our business, see “Item 4. Information on the Company—Item 4.B—Business overview—Innovative Medicines—Price controls.” See also “Item 5. Operating and Financial Review and Prospects—Item 5.B Liquidity and capital resources—Effects of currency fluctuations,” “Item 5. Operating and Financial Review and Prospects—Item 5.B Liquidity and capital resources—Condensed consoli-dated balance sheets,” “Item 18. Financial Statements—Note 15. Trade receivables” and “Item 18. Financial State-ments—Note 29. Financial instruments—additional disclosures.”
Social media and digital engagement
Risk descriptionInappropriate or illegal use of social media, interactive internet platforms or mobile applications
Context and potential impactOur increasing use of social media, interactive internet platforms and other mobile applications (together, digi-tal engagement platforms) carries risks related to poten-tial violations of rules regulating the promotion of pre-scription medicines and the potential disclosure of confidential information, trade secrets, or loss of other intellectual property. As a result of the COVID-19 pan-demic, the use and rate of adoption of digital engage-ment platforms is increasing and expanding into new uses that may have unforeseen impacts and conse-quences on our business.
There continue to be uncertainties as to the rules that apply to such communications and as to the interpreta-tions that health authorities will apply in this context, and as a result, despite our efforts to comply with applicable rules, there is a risk that our use of digital engagement platforms may cause us to be found in violation of appli-cable regulations.
For example, patients may use digital engagement platforms to comment on the effectiveness of a product or to report an adverse event, which may result in a fail-ure to follow applicable adverse event reporting obliga-tions if such platforms are not properly monitored. In addition, our associates may use digital engagement platforms inappropriately, for example to discuss our products or confidential projects, which may lead to a disclosure of confidential information, trade secrets, or loss of other intellectual property, and may give rise to liability or incur other harm to our business. Further, large numbers of or highly visible negative posts or comments about us or our executives could damage our reputation.
Global ERP implementation
Risk descriptionInability to implement and properly operate our new global enterprise resource planning (ERP) system

Item 3. Key Information
20
Context and potential impactWe rely on various information and other business sys-tems to leverage data in order to operate our complex global business. We are currently in the design and plan-ning phase for the implementation of a new global ERP system that seeks to simplify, standardize and digitize processes in our commercial and finance functions as well as our Novartis Technical Operations unit to help ensure efficient and compliant business operations as well as the availability of high-quality data necessary to aid our decision-making. We expect the planning, design and build phase to continue through 2021, with the first implementations of our new ERP system expected to begin in the second half of 2022. We expect our new ERP system to be fully implemented by 2027, when our current system is no longer supported by the software provider. Implementing and operating a new ERP system involves certain risks, including a failure of the new sys-tem to operate as expected, a failure to properly inte-grate with other systems we use, potential loss of data or information, compliance issues, cost overruns and delays, and operational disruptions. Any disruptions or malfunctions of our new ERP system could cause criti-cal information we use to be delayed, defective, cor-rupted, inadequate or inaccessible. In addition, if the design or implementation of our new ERP system is defi-cient, it could adversely affect our operations, and could negatively impact the effectiveness of our internal con-trols.
General risks
Indebtedness
Risk descriptionOur indebtedness could adversely affect our operations
Context and potential impactAs of December 31, 2020, we had USD 26.3 billion of non-current financial debt, and USD 9.8 billion of current financial debt. Our current and long-term debt requires us to dedicate a portion of our cash flow to service inter-est and principal payments and, if interest rates rise, this amount may increase. As a result, our existing debt may limit our ability to use our cash flow to fund capital expen-ditures, to engage in transactions, or to meet other cap-ital needs, or otherwise may place us at a competitive disadvantage relative to competitors that have less debt. Our debt could also limit our flexibility to plan for and react to changes in our business or industry, and increase our vulnerability to general adverse economic and indus-try conditions, including changes in interest rates or a downturn in our business or the economy. We may also have difficulty refinancing our existing debt or incurring new debt on terms that we would consider to be com-mercially reasonable, if at all.
Intangible assets and goodwill
Risk descriptionIntangible assets and goodwill resulting in significant impairment charges
Context and potential impactWe carry a significant amount of goodwill and other intangible assets on our consolidated balance sheet, pri-marily due to acquisitions, including, in particular, sub-stantial goodwill and other intangible assets obtained through acquisitions, including most recently through our acquisitions of The Medicines Company, Xiidra, Endo-cyte, Novartis Gene Therapies (formerly AveXis), AAA, and certain oncology products from GSK. As a result, we may incur significant impairment charges in the future if the fair value of the intangible assets and the group-ings of cash-generating units containing goodwill would be less than their carrying value on the Group’s consol-idated balance sheet at any point in time.
We regularly review for impairment our long-lived intangible and tangible assets, including identifiable intangible assets, investments in associated companies, and goodwill. Any significant impairment charges could have a material adverse effect on our results of opera-tions and financial condition. In 2020, for example, we recorded intangible asset impairment charges of USD 914 million.
For a detailed discussion of how we determine whether an impairment has occurred, what factors could result in an impairment, and the impact of impairment charges on our results of operations, see “Item 5. Oper-ating and Financial Review and Prospects—Item 5.A Operating results—Critical accounting policies and esti-mates—Impairment of goodwill, intangible assets and property, plant and equipment,” “Item 18. Financial State-ments—Note 1. Significant accounting policies” and “Item 18. Financial Statements—Note 11. Goodwill and intangi-ble assets.”
Tax laws and developments
Risk descriptionChanges in tax laws or their application
Context and potential impactOur multinational operations are taxed under the laws of the countries and other jurisdictions in which we oper-ate. Changes in tax laws or in their application could lead to an increased risk of international tax disputes and an increase in our effective tax rate, which could adversely affect our financial results. The integrated nature of our worldwide operations can produce conflicting claims from revenue authorities in different countries as to the profits to be taxed in the individual countries, including potential disputes relating to the prices our subsidiaries charge one another for intercompany transactions, known as transfer pricing. The majority of the jurisdic-tions in which we operate have double tax treaties with other foreign jurisdictions, which provide a framework for mitigating the impact of double taxation on our rev-enues and capital gains. However, mechanisms devel-oped to resolve such conflicting claims are largely untried and can be expected to be very lengthy. Accruals for tax contingencies are made based on past experience, inter-pretations of tax law, and judgments about potential actions by tax authorities; however, due to the complex-ity of tax contingencies, the ultimate resolution of any tax matter may result in payments materially different from the amounts accrued.

Item 3. Key Information
21
In 2019, the Organization for Economic Co-operation and Development (OECD) launched a new initiative on behalf of the G20 to minimize profit shifting by working toward a global tax framework that ensures that corpo-rate income taxes are paid where consumption takes place and also introduces a global standard on minimum taxation combined with new tax dispute resolution pro-cesses. The respective principles are currently being evaluated.
The EU also adopted a new Directive on Administra-tive Cooperation (DAC6) in 2018, which seeks additional reporting since July 2020. Recently, the EU announced it will introduce new centralized taxation powers to address the financial impact of the COVID-19 pandemic. In addition, the European Commission continues to extend the application of its policies seeking to limit fis-cal aid by member states to particular companies, and the related investigation of the member states’ practices regarding the issuance of rulings on tax matters relating to individual companies.
In Switzerland, the Basel-Stadt Cantonal Tax Reform was approved by voters in February 2019, with parts ret-roactive from January 1, 2019. In May 2019, Swiss voters approved the Swiss Federal Tax Reform. With the enact-ment of this tax reform, new elements were introduced into law as of January 1, 2020.
Although we have taken steps to be in compliance with evolving initiatives like that of the OECD, the EU and of Switzerland, and will continue to do so, significant uncertainties remain as to the outcome of our efforts.
For more information, see “Item 18. Financial State-ments—Note 12. Deferred tax assets and liabilities.”
Foreign currency exchange rates
Risk descriptionNegative effect on financial results due to foreign cur-rency exchange rate fluctuations
Context and potential impactChanges in exchange rates between the US dollar, our reporting currency, and other currencies can result in significant increases or decreases in our reported sales, costs and earnings as expressed in US dollars, and in the reported value of our assets, liabilities and cash flows.
In addition to ordinary market risk, there is a risk that countries could take affirmative steps that could signifi-cantly impact the value of their currencies. Such steps could include “quantitative easing” measures and poten-tial withdrawals by countries from common currencies. In addition, countries facing local financial difficulties, including countries experiencing high inflation rates and highly indebted countries facing large capital outflows, may impose controls on the exchange of foreign cur-rency. Currency exchange controls could limit our ability to distribute retained earnings from our local affiliates, or to pay intercompany payables due from those coun-tries.
Despite measures undertaken to reduce or hedge against foreign currency exchange risks, because a sig-nificant portion of our earnings and expenditures are in currencies other than the US dollar, including expendi-tures in Swiss francs that are significantly higher than our revenue in Swiss francs, any such exchange rate vol-
atility may negatively and materially impact our results of operations and financial condition, and may impact the reported value of our net sales, earnings, assets and liabilities. In addition, the timing and extent of such vola-tility can be difficult to predict. Further, depending on the movements of particular foreign exchange rates, we may be materially adversely affected at a time when the same currency movements are benefiting some of our com-petitors.
For more information on the effects of currency fluc-tuations on our consolidated financial statements and on how we manage currency risk, see “Item 5. Operat-ing and Financial Review and Prospects—Item 5.B Liquid-ity and capital resources—Effects of currency fluctua-tions” and “Item 18. Financial Statements—Note 29. Financial instruments—additional disclosures.”
Key customers
Risk descriptionOngoing consolidation among our distributors and retail-ers, and the concentration of credit risk
Context and potential impact Increasingly, a significant portion of our global sales is made to a relatively small number of drug wholesalers, retail chains and other purchasing organizations. For example, our three most important customers globally accounted for approximately 17%, 11% and 6%, respec-tively, of net sales in 2020. The largest trade receivables outstanding were for these three customers, amounting to 14%, 12% and 6%, respectively, of the Group’s trade receivables at December 31, 2020. The trend has been toward further consolidation among distributors and retailers. As a result, we may be affected by fluctuations in the buying patterns of such customers. Furthermore, these customers are gaining additional purchasing lever-age, increasing the pricing pressures facing our busi-nesses. These pressures can particularly impact our Sandoz Division, the generic products of which can often be obtained from numerous competitors. Moreover, we are exposed to a concentration of credit risk as a result of this concentration among our customers. If one or more of our major customers experienced financial dif-ficulties, the effect on us would be substantial, and could include a substantial loss of sales and an inability to col-lect amounts owed to us.
Environmental matters
Risk descriptionImpact of environmental liabilities
Context and potential impactThe environmental laws of various jurisdictions impose actual and potential obligations on us to investigate and remediate contaminated sites, including in connection with activities in the past by businesses that are no lon-ger part of Novartis. In some cases, these remediation efforts may take many years. While we have set aside substantial provisions for known worldwide environmen-tal liabilities that are probable and estimable, there is no guarantee that additional costs will not be incurred beyond the amounts for which we have provided in the

Item 3. Key Information
22
Group consolidated financial statements. If environmen-tal contamination related to our facilities or products adversely impacts third parties or if we fail to properly manage the safety of our facilities, including the safety of our associates and contractors, and the environmen-tal risks, we may face substantial costs and other expenses, and be required to further increase our pro-visions for environmental liabilities.
See also “Item 4. Information on the Company—Item 4.D Property, plants and equipment” and “Item 18. Finan-cial Statements—Note 20. Provisions and other non-cur-rent liabilities.”
Climate change
Risk descriptionClimate change and increased risk of major natural disas-ters
Context and potential impactNovartis is exposed to both physical risks and transition risks (which include financial, credit rating and mar-ket-driven risks) associated with climate change, which could be either acute/short-term or chronic/long-term.
Extreme weather events and changing weather pat-terns have become more common. As a result, we are potentially exposed to increased extreme weather and associated risks such as hurricanes, tornadoes, droughts or floods, or other events that result from the impact of climate change on the environment, such as loss of bio-diversity, sea level rise or wildfires.
For example, some of our production facilities that depend on the availability of significant water supplies are located in areas where water is increasingly scarce. Other facilities are located in places that, because of increasingly violent weather events, sea level rise, or both, are increasingly at risk of substantial flooding. In regions where this risk is present, it impacts not only our own operations but also our distributed supply chain. Such events could result in increased costs, business interruptions, destruction of facilities, and loss of life.
Climate change may trigger the adoption of new reg-ulatory requirements across the globe. Such legislation could include increased requirements to invest in tech-nology to reduce energy use, water use and greenhouse gas emissions, beyond what we expect to invest in our existing plans. In addition, legislation could include car-bon pricing, climate risk disclosure mandates, and changes in zoning or building codes to increase climate resilience. The combined impact of these transition risks
could increase our direct operating costs and result in the same impact across our supply chain.
In addition, our corporate headquarters, the head-quarters of our Innovative Medicines and Sandoz Divi-sions, and certain of our major Innovative Medicines Divi-sion production and research facilities are located near earthquake fault lines in Basel, Switzerland. Other major facilities are located near major earthquake fault lines in various locations around the world. In the event of a major earthquake, we could experience business interruptions, destruction of facilities, and loss of life.
Pension plans
Risk descriptionInaccuracies in the assumptions and estimates used to calculate our pension plan and other post-employment obligations
Context and potential impactWe sponsor pension and other post-employment bene-fit plans in various forms that cover a significant portion of our current and former associates. For post-employ-ment plans with defined benefit obligations, we are required to make significant assumptions and estimates about future events in calculating the expense and the present value of the liability related to these plans. These include assumptions about the discount rates we apply to estimate future defined benefit obligations and net periodic pension expense, as well as rates of future pen-sion increases. In addition, our actuarial consultants pro-vide our management with historical statistical informa-tion, such as withdrawal and mortality rates in connection with these estimates.
Assumptions and estimates we use may differ mate-rially from the actual results we experience due to chang-ing market and economic conditions, higher or lower withdrawal rates, and longer or shorter life spans of par-ticipants, among other factors. Depending on events, such differences could have a material effect on our total equity and may require us to make additional contribu-tions to our pension funds.
For more information on obligations under retirement and other post-employment benefit plans and underly-ing actuarial assumptions, see “Item 5. Operating and Financial Review and Prospects—Item 5.A Operating results—Critical accounting policies and estimates— Retirement and other post-employment benefit plans” and “Item 18. Financial Statements—Note 25. Post-em-ployment benefits for associates.”

Item 4. Information on the Company
23
Item 4. Information on the Company4.A History and development of Novartis
Novartis AG
Novartis AG was incorporated on February 29, 1996, under the laws of Switzerland as a stock corporation (“Aktiengesellschaft”) with an indefinite duration. On December 20, 1996, our predecessor companies, Ciba-Geigy AG and Sandoz AG, merged into this new entity, creating Novartis. We are domiciled in and gov-erned by the laws of Switzerland. Our registered office is located at the following address:
Novartis AGLichtstrasse 35CH-4056 Basel, SwitzerlandTelephone: +41-61-324-1111Web: www.novartis.com
Novartis is a multinational group of companies special-izing in the research, development, manufacturing and marketing of a broad range of innovative pharmaceuticals and cost-saving generic medicines. Novartis AG, our Swiss holding company, owns, directly or indirectly, all of our significant operating companies. For a list of our significant operating subsidiaries, see “Item 18. Financial Statements—Note 32. Principal Group subsidiaries and associated companies.”
For a description of important corporate developments since January 1, 2018, see “Item 18. Financial State-ments—Note 2. Significant Transactions.”
The SEC maintains an internet site at http://www.sec.gov that contains reports, information statements, and other information regarding issuers that file electroni-cally with the SEC.
4.B Business overview
Overview
Our purpose is to reimagine medicine to improve and extend people’s lives. We use innovative science and technology to address some of society’s most challeng-ing healthcare issues. We discover and develop break-through treatments and find new ways to deliver them to as many people as possible. We also aim to reward those who invest their money, time and ideas in our company. Our vision is to be a trusted leader in changing the prac-tice of medicine. Our strategy is to build a leading, focused medicines company powered by advanced ther-apy platforms and data science. As we implement our strategy, we have five priorities to shape our future and help us continue to create value for our company, our shareholders and society: unleash the power of our peo-ple, deliver transformative innovation, embrace opera-tional excellence, go big on data and digital, and build trust with society.
In 2020, Novartis achieved net sales from continuing operations of USD 48.7 billion, while net income from continuing operations amounted to USD 8.1 billion, and total net income amounted to USD 8.1 billion. Headquar-tered in Basel, Switzerland, our Group companies employed approximately 106 000 full-time equivalent associates as of December 31, 2020. Our products are sold in approximately 155 countries around the world.
The Group comprises two global operating divisions:
• Innovative Medicines: innovative patent-protected pre-scription medicines
For a description of our Innovative Medicines Division, see “—Innovative Medicines—Overview” below.
• Sandoz: generic pharmaceuticals and biosimilarsFor a description of our Sandoz Division, see “—Sandoz” below.
Our divisions are supported by the following organiza-tional units: the Novartis Institutes for BioMedical Research (NIBR), Global Drug Development (GDD), Novartis Technical Operations (NTO) and Novartis Busi-ness Services (NBS). The financial results of these orga-nizational units are included in the results of the divisions for which their work is performed. For more information about NIBR, see “—Innovative Medicines—Research and development—Research program” below. For more information about GDD, see “—Innovative Medicines—Research and development—Development program” below. For more information about NTO, see “—Item 4.D Property, plants and equipment.” For more information about NBS, see “Item 18. Financial Statements—Note 3. Segmentation of key figures 2020, 2019 and 2018.”
Corporate activities
We separately report the results of Corporate activities. The financial results of our Corporate activities include the costs of the Group headquarters and those of cor-porate coordination functions in major countries. In addi-

Item 4. Information on the Company
24
tion, Corporate includes other items of income and expense that are not attributable to specific segments, such as certain revenues from intellectual property rights and certain expenses related to post-employment
benefits, environmental remediation liabilities, charita-ble activities, donations and sponsorships.
Innovative Medicines
Overview
Our Innovative Medicines Division is a world leader in offering patent-protected medicines to patients and phy-sicians. The Innovative Medicines Division researches, develops, manufactures, distributes and sells patented pharmaceuticals, and is composed of two global busi-ness units: Novartis Oncology and Novartis Pharmaceuticals.
The Novartis Oncology business unit is responsible for the commercialization of products in the areas of can-cer and hematologic disorders. The Novartis Pharmaceuticals business unit is organized into the fol-lowing global business franchises responsible for the commercialization of various products in their respec-tive therapeutic areas: Immunology, Hepatology and Der-matology; Ophthalmology; Neuroscience; Cardiovascu-lar, Renal and Metabolism; Respiratory; and Established Medicines.
The Innovative Medicines Division is the larger of our two divisions in terms of consolidated net sales. It reported consolidated net sales of USD 39.0 billion in 2020, which represented 80% of the Group’s net sales.
The product portfolio of the Innovative Medicines Division includes a significant number of key marketed products, many of which are among the leaders in their respective therapeutic areas.
Innovative Medicines Division productsThe following summaries describe certain key marketed products in our Innovative Medicines Division, listed according to year-end net sales within each franchise. While we typically seek to sell our marketed products throughout the world, not all products and indications are available in every country. Therefore, the indications described in these summaries may vary by country. In addition, a product may be available under different brand names depending on country and indication. Some of the products described below have lost patent pro-tection or are otherwise subject to generic competition. Others are subject to patent challenges by potential generic competitors. Please see “—Intellectual property” for general information on intellectual property and reg-ulatory data protection, and for further information on the status of patents and exclusivity for Innovative Medicines Division products.
Key marketed productsNovartis Oncology business unitOncology
• Tasigna (nilotinib) is an oral tyrosine kinase inhibitor targeting the BCR-ABL protein. It is approved in the US, the EU and other countries to treat:• Patients with Philadelphia chromosome-positive
chronic myeloid leukemia (Ph+ CML) in the chronic and/or accelerated phase who are resistant or intol-erant to existing treatment. Ph+ CML is a cancer that starts in the blood-forming cells of bone marrow
• Newly diagnosed adults and children with Ph+ CML in the chronic phase
• Promacta/Revolade (eltrombopag) is a once-daily oral thrombopoietin receptor agonist that works by stimu-lating bone marrow cells to produce platelets. It is approved in the US, the EU and other countries to treat:• Immune thrombocytopenia (ITP) in patients who have
had an insufficient response to or have failed previ-ous therapies. ITP is a bleeding disorder caused by an unusually low number of platelets
• Thrombocytopenia in patients with chronic hepatitis C to allow them to initiate and maintain interfer-on-based therapy
• Patients with severe aplastic anemia (SAA). SAA is a condition in which the body does not produce enough blood cells
Promacta/Revolade is marketed under a research, development and license agreement between Novartis and RPI Finance Trust (dba Royalty Pharma), as assignee of Ligand Pharmaceuticals.
• Tafinlar + Mekinist (dabrafenib + trametinib) is an oral combination therapy. Tafinlar and Mekinist are kinase inhibitors of the BRAF and MEK1/2 proteins, respec-tively, approved in combination in the US, the EU and other countries to treat patients who have certain types of cancer with a change in the BRAF gene (called a BRAF V600 mutation), including: • Adults with unresectable or metastatic melanoma
with a BRAF V600 mutation. Melanoma is a form of skin cancer; unresectable melanoma cannot be removed with surgery, and metastatic melanoma has spread to other parts of the body. Tafinlar and Mekinist are also approved as single agents for this indication
• Adults with stage III melanoma with a BRAF V600 mutation as an adjuvant treatment (following surgery)
• Adults with advanced non-small cell lung cancer (NSCLC) with a BRAF V600 mutation. NSCLC is the most common type of lung cancer

Item 4. Information on the Company
25
• Adults with locally advanced or metastatic anaplas-tic thyroid cancer with a BRAF V600 mutation and no satisfactory treatment options. Anaplastic thyroid cancer is a rare and aggressive form of thyroid can-cer
Approved indications vary by country. Novartis has worldwide exclusive rights to develop, manufacture and commercialize trametinib granted by Japan Tobacco Inc.
• Sandostatin SC (octreotide acetate for injection) and Sandostatin LAR (octreotide acetate for injectable sus-pension) are somatostatin analogs approved in the US, the EU and other countries to treat:• Adults with acromegaly that is inadequately con-
trolled by surgery or radiotherapy. Acromegaly is a chronic disease caused by the oversecretion of growth hormone
• Patients with certain symptoms associated with car-cinoid tumors and other types of functional gastro-intestinal and pancreatic neuroendocrine tumors
Sandostatin LAR is also approved in the EU and other countries to treat patients with advanced neuroendo-crine tumors of the midgut or of unknown primary tumor origin.
• Jakavi (ruxolitinib) is an oral inhibitor of the JAK1 and JAK2 tyrosine kinases. It is the first therapy approved in the EU and other countries to treat: • Adults with myelofibrosis (MF), including primary
myelofibrosis, post-polycythemia vera myelofibrosis and post-essential thrombocythemia myelofibrosis. MF is a rare blood cancer characterized by abnor-mal blood cell production and scarring in the bone marrow, which can lead to an enlarged spleen
• Adults with polycythemia vera (PV) who are resistant or intolerant to a medication called hydroxyurea. PV is a rare blood cancer in which the bone marrow pro-duces too many red blood cells, resulting in serious problems like clots
Novartis licensed ruxolitinib from Incyte Corporation for development and commercialization in the indica-tions of oncology, hematology and graft-versus-host disease outside the US. Incyte Corporation markets ruxolitinib as Jakafi® in the US.
• Gleevec/Glivec (imatinib mesylate/imatinib) is an oral tyrosine kinase inhibitor approved in the US, the EU and other countries to treat patients with certain types of cancer, including:• Patients with Philadelphia chromosome-positive
chronic myeloid leukemia (Ph+ CML) in the chronic, accelerated or blast crisis (acute) phase. Ph+ CML is a cancer that starts in the blood-forming cells of bone marrow
• Adults and children with Philadelphia chromo-some-positive acute lymphoblastic leukemia (Ph+ ALL). Ph+ ALL is a rare subtype of the most common childhood cancer
• Adults with KIT (CD117)-positive gastrointestinal stromal tumors (GISTs). GISTs are tumors found in the digestive system
• Adults with advanced hypereosinophilic syndrome (HES) and/or chronic eosinophilic leukemia (CEL) who have a rearrangement of two genes called FIP1L1 and PDGFR-alpha. HES and CEL are closely related diseases in which the body produces too many eosinophils (a type of white blood cell)
• Adults with myelodysplastic syndromes (MDS) and myeloproliferative disorders (MPD). MDS and MPD are a group of diseases of the blood and bone mar-row
• Adults with aggressive systemic mastocytosis (ASM) and dermatofibrosarcoma protuberans (DFSP) when surgery is not possible or the disease has spread. ASM is a form of mast cell disease, and DFSP is a rare skin cancer
Approved indications vary by country.
• Afinitor/Votubia (everolimus) is an oral inhibitor of the mTOR pathway. Afinitor is approved in the US, the EU and other countries to treat patients with certain types of cancer, including:• Postmenopausal women with advanced hormone
receptor-positive (HR+)/human epidermal growth factor receptor 2-negative (HER2-) breast cancer, in combination with the medicine exemestane, when certain other medicines have not worked. HR+/HER2- breast cancer is the most common subtype of breast cancer
• Adults with neuroendocrine tumors of the pancreas, and non-symptomatic neuroendocrine tumors of the stomach and intestine (gastrointestinal) or lung that have progressed and cannot be treated with surgery
Everolimus is also approved as Afinitor/Afinitor Disperz in the US and other countries, and as Votubia (tablets and dispersible tablets) in the EU, to treat certain patients with a genetic condition called tuberous scle-rosis complex (TSC), including:• Adults with TSC and angiomyolipoma (a kidney
tumor) when the tumor does not require immediate surgery
• Adults and children with TSC and subependymal giant cell astrocytoma (a brain tumor) when the tumor cannot be removed completely by surgery
Approved indications vary by country. Everolimus is available under the trade names Zortress/Certican for use in transplantation, and is exclusively licensed to Abbott Laboratories and sublicensed to Boston Scien-tific for use in drug-eluting stents.
• Kisqali (ribociclib) is an oral cyclin-dependent kinase inhibitor approved in the US, the EU and other coun-tries to treat: • Pre-, peri- and postmenopausal women with hor-
mone receptor-positive (HR+)/human epidermal growth factor receptor 2-negative (HER2-) locally advanced or metastatic breast cancer, in combina-tion with an aromatase inhibitor as initial endo-

Item 4. Information on the Company
26
crine-based therapy. HR+/HER2- breast cancer is the most common subtype of breast cancer
• Postmenopausal women with HR+/HER2- locally advanced or metastatic breast cancer, in combina-tion with fulvestrant, as first- or second-line therapy
Kisqali was developed by the Novartis Institutes for BioMedical Research under a research collaboration with Astex Pharmaceuticals.
• Kymriah (tisagenlecleucel) suspension for intravenous infusion is a CD19-directed genetically modified autol-ogous chimeric antigen receptor T-cell (CAR-T) ther-apy. It is approved in the US, the EU and other coun-tries to treat: • Patients up to 25 years old with B-cell acute lympho-
blastic leukemia (ALL) that is refractory or in second or later relapse. ALL is a cancer of the lymphocytes, a type of white blood cell involved in the body’s immune system
• Adults with relapsed or refractory diffuse large B-cell lymphoma (DLBCL) after two or more lines of sys-temic therapy. DLBCL is the most common form of non-Hodgkin lymphoma and a cancer of the B-lym-phocytes
• Lutathera (lutetium Lu 177 dotatate/lutetium (177Lu) oxo-dotreotide) is an intravenous targeted radioligand ther-apy approved in the US, the EU and other countries to treat:• Adults with somatostatin receptor-positive gastro-
enteropancreatic neuroendocrine tumors (GEP-NETs). GEP-NETs are rare tumors found in the diges-tive tract, including the foregut, midgut and hindgut
• Piqray (alpelisib) is an oral kinase inhibitor approved in the US, the EU and other countries to treat:• Postmenopausal women, and men, with PIK3CA-mu-
tated, hormone receptor-positive (HR+)/human epi-dermal growth factor receptor 2-negative (HER2-) locally advanced or metastatic breast cancer, in com-bination with fulvestrant, after disease progression following endocrine therapy as monotherapy (EU), or after disease progression on or following endo-crine therapy (US). HR+/HER2- breast cancer is the most common subtype of breast cancer
• Adakveo (crizanlizumab) is a humanized monoclonal antibody that binds to P-selectin, a cell adhesion pro-tein that plays a central role in the multicellular inter-actions that can lead to vaso-occlusion in sickle cell disease (SCD). Delivered via intravenous infusion, Adakveo is approved in the US, the EU and other coun-tries to:• Prevent or reduce the frequency of vaso-occlusive
crises (VOCs), or pain crises, in patients aged 16
years and older with SCD. SCD is a group of inher-ited blood disorders in which the body makes abnor-mally shaped red blood cells that become sticky and can block blood vessels, leading to unpredictable, painful VOCs
Novartis Pharmaceuticals business unitImmunology, Hepatology and Dermatology1
• Cosentyx (secukinumab) is an injectable fully human monoclonal antibody that specifically inhibits interleu-kin-17A (IL-17A), a cytokine involved in several immuno-logical diseases. It is approved in the US, the EU and other countries to treat:• Patients with moderate-to-severe plaque psoriasis.
Psoriasis is a debilitating systemic inflammatory dis-ease that is characterized by the appearance of raised, red patches on the skin
• Adults with active ankylosing spondylitis (AS). AS is a long-term inflammatory disease that is character-ized by chronic back pain and is generally visible on X-rays
• Adults with active non-radiographic axial spondy-loarthritis (nr-axSpA). nr-axSpA is a long-term inflam-matory disease that is characterized by chronic back pain and is not visible on X-rays
• Adults with active psoriatic arthritis (PsA). PsA is a type of inflammatory arthritis that results in swollen and painful joints and tendons
Ophthalmology
• Lucentis (ranibizumab) is a recombinant, humanized, high-affinity antibody fragment that binds to vascular endothelial growth factor A (VEGF-A), a protein that can cause the growth of blood vessels in the eye, potentially leading to vision loss. Lucentis is an anti-VEGF therapy that is injected into the eye. It is approved in the EU and other countries to treat patients with cer-tain eye conditions, including:• Adults with neovascular (wet) age-related macular
degeneration (AMD). Wet AMD develops when abnormal blood vessels grow under the macula and leak blood and other fluids in the back of the eye, which can scar the macula
• Adults with proliferative diabetic retinopathy, non-pro-liferative diabetic retinopathy and/or diabetic macu-lar edema. These conditions are complications of diabetes
• Adults with visual impairment due to macular edema secondary to retinal vein occlusion (branch RVO or central RVO). Retinal vein occlusion is a blockage of the branch or central retinal vein, which carry blood away from the retina
1 Xolair sales for all indications are reported in the Respiratory franchise.

Item 4. Information on the Company
27
Approved indications vary by country. Lucentis is licensed from Genentech, and Novartis holds the rights to commercialize the product outside the US. Genen-tech holds the rights to commercialize Lucentis in the US. For further information, see “Item 18. Financial Statements—Note 27. Transactions with related par-ties—Roche Holding AG.”
• Xiidra (lifitegrast 0.5%), an LFA-1 antagonist, is a pre-scription eye drop designed to reduce inflammation by blocking the interaction of two key proteins. It is approved in the US and other countries to treat:• The signs and symptoms of dry eye disease in adults
• Beovu (brolucizumab) is the first humanized sin-gle-chain antibody fragment approved for clinical use. Beovu acts as an anti-VEGF agent and is administered via injection. It is approved in the US, the EU and other countries to treat:• Patients with neovascular (wet) age-related macular
degeneration (AMD). Wet AMD develops when abnormal blood vessels grow under the macula and leak blood and other fluids in the back of the eye, which can scar the macula
Neuroscience
• Gilenya (fingolimod) is an oral sphingosine-1-phos-phate (S1P) receptor modulator that crosses the blood-brain barrier to bind to the S1P receptors based in the central nervous system. It is approved: • In the US to treat adults and children aged 10 years
and older with relapsing forms of multiple sclerosis, including clinically isolated syndrome, relapsing-re-mitting multiple sclerosis (RRMS) and active second-ary progressive multiple sclerosis (SPMS). Multiple sclerosis is a disease in which the immune system attacks the protective covering of nerves (known as myelin)
• In the EU to treat adults and children aged 10 years and older who have highly active RRMS despite treat-ment with at least one disease-modifying agent, or who have rapidly evolving severe RRMS
Gilenya is licensed from Mitsubishi Tanabe Pharma Corporation.
• Zolgensma (onasemnogene abeparvovec) is a one-time intravenous gene therapy designed to address the genetic root cause of spinal muscular atrophy (SMA) by replacing the function of the missing or nonworking SMN1 gene. Zolgensma delivers a new working copy of the SMN1 gene into a patient’s cells. It is approved in the US, the EU and other countries to treat:• Babies and young children who have SMA and a bial-
lelic mutation in the SMN1 gene. SMA is a rare, genetic neuromuscular disease resulting in the pro-gressive and irreversible loss of motor neurons, which causes muscle weakness and atrophy
• Mayzent (siponimod) is an oral, selective sphin-gosine-1-phosphate (S1P) receptor modulator that selectively binds to S1P1 and S1P5 receptors and pen-etrates the central nervous system, where it may impact
central nervous system inflammation and repair mech-anisms. It is approved:• In the US and other countries to treat adults with
relapsing forms of multiple sclerosis, including clini-cally isolated syndrome, relapsing-remitting multiple sclerosis (RRMS) and active secondary progressive multiple sclerosis (SPMS). Multiple sclerosis is a dis-ease in which the immune system attacks the pro-tective covering of nerves (known as myelin)
• In the EU and other countries to treat adults with active SPMS
Approved indications vary across other countries.
• Kesimpta (ofatumumab) is an anti-CD20 monoclonal antibody that enables the targeted depletion of B-cells, specifically in lymph nodes. Kesimpta is self-adminis-tered as a once-monthly injection via the Sensoready autoinjector pen. It is approved in the US to treat:• Adults with relapsing forms of multiple sclerosis,
including clinically isolated syndrome, relapsing-re-mitting multiple sclerosis (RRMS) and active second-ary progressive multiple sclerosis (SPMS). Multiple sclerosis is a disease in which the immune system attacks the protective covering of nerves (known as myelin)
Ofatumumab was originally developed by Genmab and licensed to GlaxoSmithKline (GSK). Novartis obtained the rights to ofatumumab from GSK across all indica-tions.
Cardiovascular, Renal and Metabolism
• Entresto (sacubitril/valsartan) is an oral, first-in-class angiotensin receptor/neprilysin inhibitor. Entresto enhances the protective effects of a hormone system called the natriuretic peptide system, and simultane-ously suppresses the harmful effects of a hormone sys-tem called the renin-angiotensin-aldosterone system. It is approved in the US, the EU and other countries to treat:• Adults who have symptomatic chronic heart failure
with reduced ejection fraction (HFrEF). HFrEF is a disease in which the heart cannot pump enough blood
• Children aged 1 year and older who have symptom-atic heart failure with systemic left ventricular dys-function. This is a disease in which the heart cannot pump enough blood
Approved indications vary by country.
• Leqvio (inclisiran) is an injectable small-interfering RNA that reduces LDL cholesterol in patients with athero-sclerotic cardiovascular disease. Leqvio is adminis-tered twice a year, following an initial dose and a dose at three months. It is approved in the EU to treat:• Adults with primary hypercholesterolemia (high cho-
lesterol) or mixed dyslipidemia, in combination with maximally tolerated statin therapy. Mixed dyslipid-emia is a disorder characterized by elevated levels of LDL cholesterol and triglycerides, and decreased levels of HDL cholesterol

Item 4. Information on the Company
28
Novartis obtained global rights to develop, manufac-ture and commercialize inclisiran under a license and collaboration agreement with Alnylam Pharmaceuticals, Inc.
Respiratory
• Xolair (omalizumab) is an injectable prescription medicine and the only approved antibody designed to target and block immunoglobulin E (IgE). It is approved in the US, the EU and other countries to treat:• Adults and children aged 6 years and older with mod-
erate-to-severe, or severe, persistent allergic asthma • Adults and children aged 12 years and older with
chronic spontaneous urticaria/chronic idiopathic urticaria (hives)
• Adults with nasal polyps or chronic rhinosinusitis with nasal polyps (CRSwNP). CRSwNP is a chronic inflam-mation of the nose and the sinuses with the presence of benign lesions (nasal polyps) on the lining of the nasal sinuses or nasal cavity
Approved indications vary by country. Xolair is provided as lyophilized powder for reconstitution, and as liquid formulation in a pre-filled syringe. Novartis co-pro-motes Xolair with Genentech in the US and shares a portion of operating income, but Novartis does not record any US sales. Novartis records all sales of Xolair outside the US. For further information, see “Item 18. Financial Statements—Note 27. Transactions with related parties—Roche Holding AG.”
Established Medicines
• Galvus (vildagliptin) is an oral inhibitor of the DPP-4 enzyme approved in the EU and other countries to treat: • Adults with type 2 diabetes that is inadequately con-
trolled by diet and exercise. It can be used as mono-therapy; in dual combination with metformin, a sulfo-nylurea or a thiazolidinedione (antidiabetic medicines); in triple combination with metformin and a sulfony-lurea; and as an add-on to insulin with or without met-formin
An oral single-pill combination of vildagliptin and met-formin, marketed as Eucreas/GalvusMet, is also approved in the EU and other countries to treat adults with type 2 diabetes.
• Diovan (valsartan) is an oral angiotensin II receptor blocker (ARB) approved in the US, the EU and other countries to treat:• Adults and children with high blood pressure • Adults with heart failure
• Adults with certain types of heart failure following a heart attack
An oral single-pill combination of valsartan and hydro-chlorothiazide, marketed as Diovan HCT/Co-Diovan, is also approved in the US, the EU and other countries to treat high blood pressure.
Compounds in developmentThe following table provides an overview of the key Innovative Medicines Division projects currently in the Confirmatory Development stage and may also describe certain projects in the Exploratory Development stage. Projects typically enter Confirmatory Development and become the responsibility of our Global Drug Develop-ment organization during Phase II testing. (For more information about our drug development program, see “—Research and development—Development program.”) Projects are listed in alphabetical order by compound code, or by product name where applicable. Projects include those seeking to develop potential uses of new molecular entities as well as potential additional indica-tions or new formulations for already marketed products. The table below, entitled “Projects removed from the development table since 2019,” highlights changes to the table entitled “Selected development projects” from the previous year.
The year that each project entered the current phase of development refers to the year of the first patient’s first visit in the first clinical trial of that phase. For proj-ects in Phase II, the year refers to the first patient’s first visit in the first Phase II trial, which can happen prior to the Confirmatory Development stage. We previously reported the current phase based on the year in which the decision to enter the phase was made, and as a result, there may be variations between the reported phases in this year’s table versus last year’s table. Certain previ-ously disclosed projects, noted below, have not yet achieved “first patient, first visit” in any Phase I-III study for the reported indication and route of administration. We have included these projects in the table to maintain continuity with last year’s disclosures, and have dis-closed them using the reporting criteria from last year.
A reference to a project being in registration means that an application has been submitted to a health author-ity for marketing approval. Compounds and new indica-tions in development are subject to required regulatory approvals and, in certain instances, contractual limita-tions. These compounds and indications are in various stages of development throughout the world. It may not be possible to obtain regulatory approval for any or all of the new compounds and new indications referred to in this Form 20-F in any country or in every country. See “—Regulation” for further information on the approval process.

Item 4. Information on the Company
29
Selected development projects Year project entered Formulation/ current Planned filingCompound/ Common Mechanism Business route of development dates/currentproduct name of action Potential indication franchise administration phase phase
ABL001 asciminib BCR-ABL inhibitor Chronic myeloid leukemia, 3rd line Oncology Oral 2017 2021/III
ACZ885 canakinumab IL-1 beta inhibitor Non-small cell lung cancer, 2nd line Oncology Subcutaneous injection 2019 2021/III
Non-small cell lung cancer, 1st line Oncology Subcutaneous injection 2018 2021/III
Non-small cell lung cancer, adjuvant Oncology Subcutaneous injection 2018 2023/III
AVXS-101 onasemno- Survival motor neuron Spinal muscular atrophy Neuroscience Intrathecal injection 2018 TBC based on(OAV101) gene abepar- (SMN) gene therapy (IT formulation)1 FDA feedback/ vovec I/II
AVXS-201 TBD Methyl-CpG binding Rett syndrome Neuroscience Intrathecal injection 2018 ≥2025/I(OAV201) protein 2 (MECP2) gene therapy
Beovu brolucizumab VEGF inhibitor Diabetic macular edema Ophthalmology Intravitreal injection 2018 2021/III
Retinal vein occlusion Ophthalmology Intravitreal injection 2019 2023/III
Diabetic retinopathy2 Ophthalmology Intravitreal injection 2020 2023/III
BYL719 alpelisib PI3K-alpha inhibitor PIK3CA-related overgrowth spectrum Oncology Oral 2020 2021/II
Triple negative breast cancer Oncology Oral 2020 2023/III
Human epidermal growth factor Oncology Oral 2020 ≥2025/III receptor 2-positive (HER2+) advanced breast cancer3
Ovarian cancer Oncology Oral 20194 2023/III
Head and neck squamous cell carcinoma, Oncology Oral 20196 ≥2025/III 2nd and 3rd line5
CEE321 TBD Pan-JAK inhibitor Atopic dermatitis Immunology, Topical 20197 ≥2025/I Hepatology and Dermatology
CFZ5338 iscalimab CD40 inhibitor Renal transplantation Immunology, Intravenous infusion 2018 ≥2025/II Hepatology and Dermatology
Liver transplantation Immunology, Intravenous infusion 2019 ≥2025/II Hepatology and Dermatology
Sjögren’s syndrome Immunology, Intravenous infusion 2019 ≥2025/II Hepatology and Dermatology
Coartem artemether + PGH-1 Malaria, uncomplicated (<5 kg patients)9 Established Oral 2020 2024/III lumefantrine Medicines
Cosentyx secukinumab IL-17A inhibitor Ankylosing spondylitis head-to-head study Immunology, Subcutaneous injection 2017 2022/III versus Sandoz biosimilar Hyrimoz Hepatology and (adalimumab) Dermatology
Hidradenitis suppurativa Immunology, Subcutaneous injection 2019 2022/III Hepatology and Dermatology
Giant cell arteritis Immunology, Subcutaneous injection 2019 2024/II Hepatology and Dermatology
Lichen planus Immunology, Subcutaneous injection 2020 ≥2025/II Hepatology and Dermatology
Lupus nephritis10 Immunology, Subcutaneous injection 2020 ≥2025/III Hepatology and Dermatology
Psoriatic arthritis (IV formulation)11 Immunology, Intravenous infusion 2019 2022/III Hepatology and Dermatology
Ankylosing spondylitis (IV formulation)12 Immunology, Intravenous infusion 2019 2023/III Hepatology and Dermatology
CSJ117 TBD TSLP inhibitor Asthma13 Respiratory Inhalation 2020 ≥2025/II
ECF843 TBD rh-Lubricin Dry eye Ophthalmology Topical 2020 2023/II
1 Preclinical studies to address partial clinical hold are on track. The FDA has acknowledged the potential of AVXS-101 IT in this patient population and recommends a pivotal confirmatory study, to be initiated after partial clinical hold is lifted.
2 Previously disclosed as proliferative diabetic retinopathy3 Previously disclosed as hormone receptor-negative (HR-)/human epidermal growth factor receptor 2-positive (HER2+) advanced breast cancer4 Reflects the year in which the decision to enter the disclosed phase was made; “first patient, first visit” has not yet occurred5 Previously disclosed as head and neck squamous cell carcinoma6 Reflects the year in which the decision to enter the disclosed phase was made; “first patient, first visit” has not yet occurred7 Reflects the year in which the decision to enter the disclosed phase was made; “first patient, first visit” has not yet occurred8 The renal transplantation and liver transplantation indications were previously disclosed as solid organ transplantation. This has since split into two separate projects.9 Project added to selected development projects table in 2020 – entered Confirmatory Development10 Project added to selected development projects table in 2020 – entered Confirmatory Development11 Project added to selected development projects table in 2020 – in Confirmatory Development12 Project added to selected development projects table in 2020 – in Confirmatory Development13 Previously disclosed as severe asthma

Item 4. Information on the Company
30
Year project entered Formulation/ current Planned filingCompound/ Common Mechanism Business route of development dates/currentproduct name of action Potential indication franchise administration phase phase
Entresto valsartan and Angiotensin receptor/ Chronic heart failure with preserved Cardiovascular, Oral 2020 US registration sacubitril neprilysin inhibitor ejection fraction Renal (as sodium and Metabolism salt complex)
Post-acute myocardial infarction Cardiovascular, Oral 2016 2021/III Renal and Metabolism
Jakavi ruxolitinib JAK1/2 inhibitor Acute graft-versus-host disease Oncology Oral 2017 2021/III
Chronic graft-versus-host disease Oncology Oral 2017 2021/III
KAE609 cipargamin PfATP4 inhibitor Malaria, uncomplicated14 Established Oral 2017 ≥2025/II Medicines
Malaria, severe15 Established Oral 201916 ≥2025/II Medicines
KAF156 ganaplacide Imidazolopiperazines Malaria, uncomplicated17 Established Oral 2017 ≥2025/II derivative Medicines
Kisqali ribociclib CDK4 inhibitor Hormone receptor-positive Oncology Oral 2018 2023/III (HR+)/human epidermal growth factor receptor 2-negative (HER2-) early breast cancer (adjuvant)18
KJX83919 inclisiran siRNA Hyperlipidemia Cardiovascular, Subcutaneous injection 2020 EU approved (regulation of LDL-C) Renal US20
and Metabolism
Secondary prevention of cardiovascular Cardiovascular, Subcutaneous injection 2018 ≥2025/III events in patients with elevated levels Renal of LDL-C and Metabolism
Kymriah tisagen- CD19 CAR-T Relapsed/refractory follicular lymphoma Oncology Intravenous infusion 2018 2021/II lecleucel
Relapsed/refractory diffuse large B-cell Oncology Intravenous infusion 2019 2021/III lymphoma in 1st relapse
LJC242 tropifexor, FXR agonist and Nonalcoholic steatohepatitis Immunology, Oral 2018 ≥2025/II cenicriviroc CCR2 inhibitor Hepatology and (in fixed-dose Dermatology combination)
LJN452 tropifexor, FXR agonist and Nonalcoholic steatohepatitis Immunology, Oral 2019 ≥2025/II licogliflozin SGLT1/2 inhibitor Hepatology and (in fixed-dose Dermatology combination)
LMI070 branaplam SMN2 RNA splicing Spinal muscular atrophy Neuroscience Oral 2015 ≥2025/II modulator
LNP023 iptacopan CFB inhibitor IgA nephropathy Cardiovascular, Oral 2018 2023/II Renal and Metabolism
C3 glomerulopathy Cardiovascular, Oral 2019 2023/II Renal and Metabolism
Paroxysmal nocturnal hemoglobinuria Cardiovascular, Oral 2018 2023/II Renal and Metabolism
Membranous nephropathy Cardiovascular, Oral 2019 ≥2025/II Renal and Metabolism
LOU064 remibrutinib BTK inhibitor Chronic spontaneous urticaria Immunology, Oral 2019 ≥2025/II Hepatology and Dermatology
Sjögren’s syndrome21 Immunology, Oral 2019 ≥2025/II Hepatology and Dermatology
Lutathera lutetium Radioligand therapy Gastroenteropancreatic Oncology Intravenous infusion 2020 2023/III Lu 177 targeting SSTR neuroendocrine tumors, dotatate/ 1st line in G2/3 tumors22 lutetium (177Lu) oxodotreotide
14 Previously disclosed as malaria15 Previously disclosed as severe malaria16 Reflects the year in which the decision to enter the disclosed phase was made; “first patient, first visit” has not yet occurred17 Previously disclosed as malaria18 Previously disclosed as HR+/HER2- breast cancer (adjuvant)19 Approved in the EU as Leqvio for primary hypercholesterolemia and mixed dyslipidemia20 Novartis received a complete response letter (CRL) from the FDA due to unresolved facility inspection-related conditions at a third-party manufacturing facility in Europe. The FDA
has not raised any concerns related to the efficacy or safety of inclisiran. A response to the CRL is planned to be submitted in Q2-Q3 2021.21 Project added to selected development projects table in 2020 – in Confirmatory Development22 Project added to selected development projects table in 2020 – entered Confirmatory Development
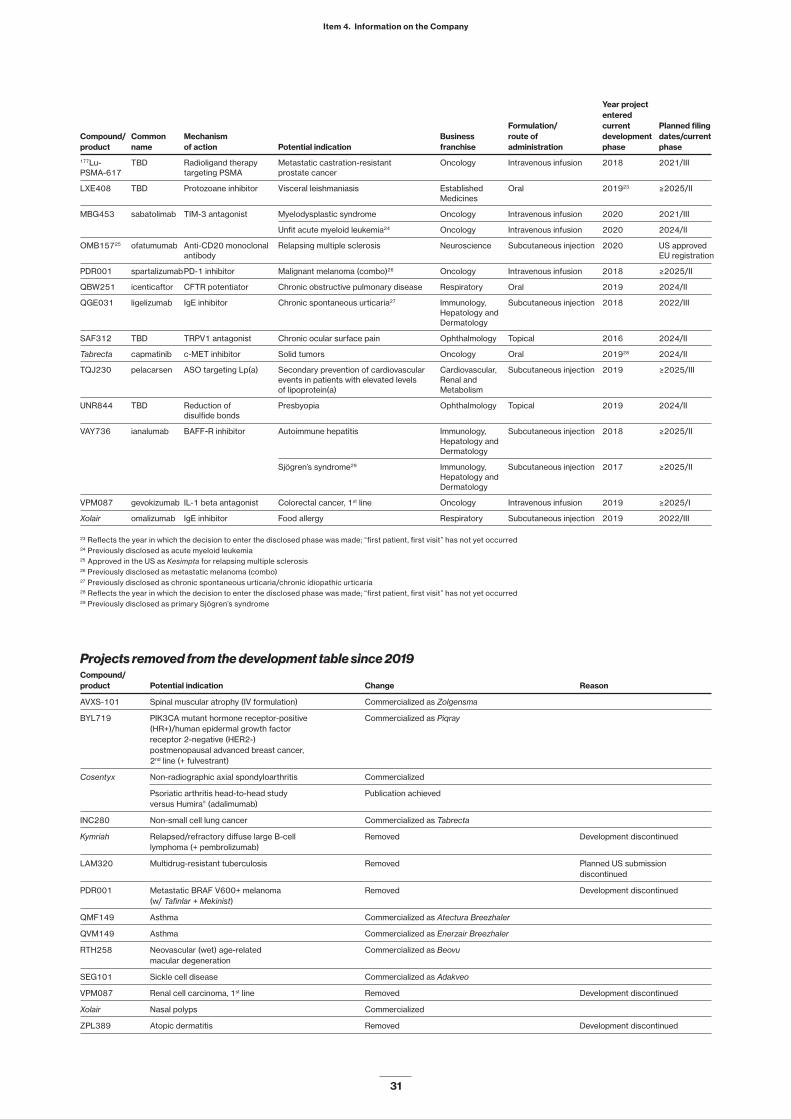
Item 4. Information on the Company
31
Year project entered Formulation/ current Planned filingCompound/ Common Mechanism Business route of development dates/currentproduct name of action Potential indication franchise administration phase phase
177Lu- TBD Radioligand therapy Metastatic castration-resistant Oncology Intravenous infusion 2018 2021/IIIPSMA-617 targeting PSMA prostate cancer
LXE408 TBD Protozoane inhibitor Visceral leishmaniasis Established Oral 201923 ≥2025/II Medicines
MBG453 sabatolimab TIM-3 antagonist Myelodysplastic syndrome Oncology Intravenous infusion 2020 2021/III
Unfit acute myeloid leukemia24 Oncology Intravenous infusion 2020 2024/II
OMB15725 ofatumumab Anti-CD20 monoclonal Relapsing multiple sclerosis Neuroscience Subcutaneous injection 2020 US approved antibody EU registration
PDR001 spartalizumab PD-1 inhibitor Malignant melanoma (combo)26 Oncology Intravenous infusion 2018 ≥2025/II
QBW251 icenticaftor CFTR potentiator Chronic obstructive pulmonary disease Respiratory Oral 2019 2024/II
QGE031 ligelizumab IgE inhibitor Chronic spontaneous urticaria27 Immunology, Subcutaneous injection 2018 2022/III Hepatology and Dermatology
SAF312 TBD TRPV1 antagonist Chronic ocular surface pain Ophthalmology Topical 2016 2024/II
Tabrecta capmatinib c-MET inhibitor Solid tumors Oncology Oral 201928 2024/II
TQJ230 pelacarsen ASO targeting Lp(a) Secondary prevention of cardiovascular Cardiovascular, Subcutaneous injection 2019 ≥2025/III events in patients with elevated levels Renal and of lipoprotein(a) Metabolism
UNR844 TBD Reduction of Presbyopia Ophthalmology Topical 2019 2024/II disulfide bonds
VAY736 ianalumab BAFF-R inhibitor Autoimmune hepatitis Immunology, Subcutaneous injection 2018 ≥2025/II Hepatology and Dermatology
Sjögren’s syndrome29 Immunology, Subcutaneous injection 2017 ≥2025/II Hepatology and Dermatology
VPM087 gevokizumab IL-1 beta antagonist Colorectal cancer, 1st line Oncology Intravenous infusion 2019 ≥2025/I
Xolair omalizumab IgE inhibitor Food allergy Respiratory Subcutaneous injection 2019 2022/III
23 Reflects the year in which the decision to enter the disclosed phase was made; “first patient, first visit” has not yet occurred24 Previously disclosed as acute myeloid leukemia25 Approved in the US as Kesimpta for relapsing multiple sclerosis26 Previously disclosed as metastatic melanoma (combo)27 Previously disclosed as chronic spontaneous urticaria/chronic idiopathic urticaria28 Reflects the year in which the decision to enter the disclosed phase was made; “first patient, first visit” has not yet occurred29 Previously disclosed as primary Sjögren’s syndrome
Projects removed from the development table since 2019Compound/ product Potential indication Change Reason
AVXS-101 Spinal muscular atrophy (IV formulation) Commercialized as Zolgensma
BYL719 PIK3CA mutant hormone receptor-positive Commercialized as Piqray (HR+)/human epidermal growth factor receptor 2-negative (HER2-) postmenopausal advanced breast cancer, 2nd line (+ fulvestrant)
Cosentyx Non-radiographic axial spondyloarthritis Commercialized
Psoriatic arthritis head-to-head study Publication achieved versus Humira® (adalimumab)
INC280 Non-small cell lung cancer Commercialized as Tabrecta
Kymriah Relapsed/refractory diffuse large B-cell Removed Development discontinued lymphoma (+ pembrolizumab)
LAM320 Multidrug-resistant tuberculosis Removed Planned US submission discontinued
PDR001 Metastatic BRAF V600+ melanoma Removed Development discontinued (w/ Tafinlar + Mekinist)
QMF149 Asthma Commercialized as Atectura Breezhaler
QVM149 Asthma Commercialized as Enerzair Breezhaler
RTH258 Neovascular (wet) age-related Commercialized as Beovu macular degeneration
SEG101 Sickle cell disease Commercialized as Adakveo
VPM087 Renal cell carcinoma, 1st line Removed Development discontinued
Xolair Nasal polyps Commercialized
ZPL389 Atopic dermatitis Removed Development discontinued

Item 4. Information on the Company
32
Principal markets
The Innovative Medicines Division sells products in approximately 140 countries worldwide. Net sales are primar-ily concentrated in the US and Europe. The following table sets forth the aggregate 2020 net sales of the Innovative Medicines Division by region:
Innovative Medicines 2020 net sales to third parties
USD millions %
United States 14 342 37
Europe 13 484 35
Asia, Africa, Australasia 8 718 22
Canada and Latin America 2 469 6
Total 39 013 100
Of which in Established Markets 1 29 643 76
Of which in Emerging Growth Markets 1 9 370 24
1 Emerging Growth Markets comprise all markets other than the Established Markets of the US, Canada, Western Europe, Japan, Australia and New Zealand.
Many of our Innovative Medicines Division products are used for chronic conditions that require patients to con-sume the product over long periods of time, ranging from months to years. However, certain of our marketed prod-ucts and development projects, such as cell and gene therapies, are administered only once. Net sales of the vast majority of our products are not subject to material changes in seasonal demand.
Production
Our primary goal is to ensure the uninterrupted, timely and cost-effective supply of products that meet all prod-uct specifications and quality standards. The manufac-turing of our products is highly regulated by governmen-tal health authorities around the world, including the FDA and EMA. In addition to regulatory requirements, many of our products involve technically complex manufactur-ing processes or require highly specialized raw materi-als.
In 2020, we established five integrated manufactur-ing and supply platforms: large molecules, small mole-cules, Sandoz Technical Operations, cell and gene ther-apy, and local market manufacturing. We manufacture our products across these platforms at facilities world-wide, producing active pharmaceutical ingredients in our own facilities or purchasing them from third-party sup-pliers (see also “—Item 4.D Property, plants and equip-ment”). In our manufacturing network, we maintain state-of-the-art processes, with quality as a priority, and require our suppliers to adhere to the same high stan-dards we expect from our own people and processes. Those processes include chemical and biological syn-theses; sterile processing, including CAR-T cell process-ing; and formulation and packaging. We are constantly working to improve our existing manufacturing pro-cesses, to develop new and innovative technologies, and to review and adapt our manufacturing network to meet our needs and those of our patients and customers.
We produce raw materials for manufacturing in-house or we purchase them from a number of third-party sup-pliers. Where possible, we maintain multiple supply sources so that the business is not dependent on a sin-gle or limited number of suppliers. However, our ability to do so may at times be limited by regulatory or other
requirements. We monitor market developments that could have an adverse effect on the supply of essential materials. Our suppliers of raw materials are required to comply with applicable regulations and Novartis quality standards.
Because the manufacturing of our products is com-plex and highly regulated by governmental health author-ities, supply is never guaranteed. If we or our third-party suppliers fail to comply with applicable regulations, then there could be a product recall or other disruption to our production activities. We have experienced supply inter-ruptions for our products in the past, and there can be no assurance that supply will not be interrupted again in the future. However, we have implemented a global man-ufacturing strategy to maximize business continuity in case of such events.
Marketing and sales
The Innovative Medicines Division serves customers with 24 432 field force representatives, as of December 31, 2020, including supervisors and administrative person-nel. These trained representatives present the therapeu-tic risks and benefits of our products to physicians, phar-macists, hospitals, insurance groups, managed care organizations and other healthcare professionals. In the US, Novartis advertises certain products via digital and traditional media channels, including the internet, televi-sion, newspapers and magazines. Novartis also pursues co-promotion/co-marketing opportunities as well as licensing and distribution agreements with other com-panies in various markets.
The marketplace for healthcare is evolving: Customer groups beyond prescribers have increasing influence on treatment decisions and guidelines, while patients con-

Item 4. Information on the Company
33
tinue to become more informed stakeholders in their healthcare decisions and look for solutions to meet their changing needs. Novartis is responding by adapting our business practices to engage appropriately with patients, customer groups and other stakeholders, including by delivering innovative solutions to drive education, access and improved patient care.
The COVID-19 pandemic has accelerated additional changes related to marketing and sales techniques in the healthcare industry. For example, many healthcare professionals have increased their use of virtual plat-forms when interacting with pharmaceutical companies, and prefer to receive information in a more convenient and personalized way. In response, Novartis has expe-dited the planned implementation of a new customer engagement model, which combines traditional face-to-face visits with digital methods of engaging healthcare professionals. We are similarly changing our approach to engaging healthcare systems, payers and other health-care providers.
Although specific distribution patterns vary by coun-try, Novartis generally sells its prescription drugs primar-ily to wholesale and retail drug distributors, hospitals, clinics, government agencies and managed healthcare providers. The growing number of so-called “specialty” drugs in our portfolio has resulted in increased engage-ment with specialty pharmacies. In the US, specialty pharmacies continue to grow as a distribution channel for specialty products. Most specialty drugs can only be dispensed through specialty pharmacies that are wholly owned by national pharmacy benefit managers.
In the US, the US Centers for Medicare & Medicaid Services (CMS) is the largest single payer for healthcare services as a result of continuing changes in healthcare economics and an aging population. In addition, both commercial and government-sponsored managed care organizations continue to be among the largest groups of payers for healthcare services in the US. In other coun-tries, national health services are often the only signifi-cant payer for healthcare services. In an effort to control prescription drug costs, almost all managed care orga-nizations and national health services use formularies that list specific drugs that may be reimbursed and/or the level of reimbursement for each drug. Managed care organizations and national health services also increas-ingly use cost-benefit analyses to determine whether or not newly approved drugs will be added to a formulary and/or the level of reimbursement for that drug, and to determine whether or not to continue to reimburse exist-ing drugs. We have dedicated teams that actively seek to optimize patient access, including formulary positions, for our products.
The trend toward consolidation among distributors and retailers of Innovative Medicines Division products continues in the US and internationally, both within coun-try and across countries. This has increased our cus-tomers’ purchasing leverage and resulted in increased pricing pressure on our products. Moreover, we are exposed to increased concentration of credit risk as a result of the consolidation among our customers.
Drug pricing is an increasingly prominent issue in many countries as healthcare spending continues to rise. This issue has received significant attention in the US (please see “—Price controls” for further information). At
Novartis, we are increasing our efforts to enable patient access through innovative pricing and access initiatives in the US, Europe and other markets. These include con-tract structures such as pay-over-time and out-come-based agreements.
In 2019, Novartis Gene Therapies (formerly AveXis) formed an agreement with Accredo Health Group, Inc. in the US to offer a pay-over-time option of up to five years for Zolgensma to help ease possible short-term budget constraints for customers. Novartis Gene Ther-apies also offers payers outcome-based agreements for Zolgensma based on measures included in the clinical trial program, and has these agreements in place with both commercial and Medicaid contracts. In these agree-ments, if a patient has a significant negative outcome during a five-year period, Novartis Gene Therapies reim-burses a percentage of the cost of the therapy relative to the time passed. Following conditional approval of Zolgensma in Europe in 2020, Novartis Gene Therapies established “Day One” early access agreements in mul-tiple European countries. These agreements support early patient access by allowing a variety of customiz-able options, including retroactive rebates, deferred pay-ments, installment options and outcome-based rebates.
Additionally, Novartis has established an out-come-based framework in the US for one of the approved indications of Kymriah, whereby the product invoice is linked to a successful outcome for each patient at an agreed milestone. Novartis also offers outcome-based agreements for approved indications of Kymriah and Luxturna in certain countries other than the US. These typically involve a full upfront payment of the product with a partial refund in case of failed outcomes, or install-ment payments based on successful patient outcomes at agreed milestones.
Competition
The global pharmaceutical market is highly competitive. We compete against other major international corpora-tions that have substantial financial and other resources, as well as against smaller companies that operate region-ally or nationally. Competition within the industry is intense and extends across a wide range of activities, including pricing, product characteristics, customer ser-vice, sales and marketing, and research and develop-ment.
Like other companies selling patented pharma-ceuticals, Novartis faces challenges from companies selling competing patented products. Generic forms of our products may follow the expiry of intellectual prop-erty protection, and generic companies may also gain entry to the market through successfully challenging our intellectual property rights. We use legally permissible measures to defend those rights. See also “—Intellectual property” below. We also may face competition from over-the-counter (OTC) products that do not require a prescription from a physician.
There is ongoing consolidation in the pharmaceuti-cal industry. At the same time, new entrants are looking to use their expertise to establish or expand their pres-ence in healthcare, including technology companies

Item 4. Information on the Company
34
seeking to benefit from the increasing importance of data and data management in our industry.
Research and development
The discovery and development of a new drug usually requires approximately 10 to 15 years from the initial research to bringing a drug to market. This includes approximately six to eight years from Phase I clinical tri-als to market entry. At each of these steps, there is a substantial risk that a compound will not meet the requirements to progress further. In such an event, we may be required to abandon the development of a com-pound in which we have made a substantial investment.
We manage our research and development expendi-tures across our entire portfolio in accordance with our strategic priorities. We make decisions about whether or not to proceed with development projects on a proj-ect-by-project basis. These decisions are based on the project’s potential to meet a significant unmet medical need or to improve patient outcomes, the strength of the science underlying the project, and the potential of the project (subject to the risks inherent in pharmaceutical development) to generate significant positive financial results for the Company. Once a management decision has been made to proceed with the development of a particular molecule, the level of research and develop-ment investment required will be driven by many factors. These include the medical indications for which it is being developed, the number of indications being pursued, whether the molecule is of a chemical or biological nature, the stage of development, and the level of evi-dence necessary to demonstrate clinical efficacy and safety.
Research programOur research program is conducted by the Novartis Insti-tutes for BioMedical Research (NIBR), which is the research and early development innovation engine of Novartis. NIBR is responsible for the discovery of new medicines for diseases with unmet medical need. We focus our work in areas where we believe we can have the most impact for patients. This requires the hiring and retention of highly talented employees, a focus on fun-damental disease mechanisms that are relevant across different disease areas, continuous improvement in tech-nologies for drug discovery and potential therapies, close alliances with clinical colleagues, and the estab-lishment of strategic external alliances.
Approximately 5 600 full-time-equivalent scientists, physicians and business professionals work at NIBR sites in Basel, Switzerland; Cambridge, Massachusetts; East Hanover, New Jersey; San Diego, California; Emeryville, California; and Shanghai, China. They con-tribute to research into disease areas such as cardiovas-cular and metabolic diseases, neuroscience, oncology, muscle disorders, ophthalmology, autoimmune diseases and respiratory diseases. Research at the Friedrich Miescher Institute and the Genomics Institute of the Novartis Research Foundation focuses on basic genetic and genomic research, and the Novartis Institute for Tropical Diseases (NITD), in Emeryville, California,
focuses on discovering new medicines to fight tropical diseases, including malaria and cryptosporidiosis.
All drug candidates go through proof-of-concept tri-als to enable an early assessment of the safety and effi-cacy of the drug while collecting basic information on pharmacokinetics and tolerability, and adhering to the guidance for early clinical testing set forth by health authorities. Following proof of concept, our Global Drug Development unit conducts confirmatory trials on the drug candidates.
In July 2018, we announced the decision to exit anti-bacterial and antiviral research. While the science for these programs is compelling, we decided to prioritize our resources in other areas where we believe we are better positioned to develop innovative medicines that will have a positive impact for patients. Since then, we have executed three out-licensing deals with Gilead Sci-ences, Boston Pharmaceuticals and Amplyx Pharmaceuticals for assets from our infectious diseases portfolio. However, in response to the COVID-19 pan-demic, we started a robust and collaborative drug dis-covery effort to develop an antiviral molecule to poten-tially treat all coronaviruses, including the virus that causes COVID-19. This longer-term effort with the Uni-versity of California, Berkeley, and other pharmaceutical companies will target the self-replication machinery that coronaviruses share.
In 2020, we discontinued early discovery research at NIBR’s Shanghai site and focused our research and development activities there on expanding the scale and scope of our early clinical development and later-stage clinical trial operations to help accelerate the develop-ment of new medicines.
Development programOur Global Drug Development (GDD) organization over-sees drug development activities for our Innovative Medicines Division. GDD works collaboratively with NIBR to execute our overall pipeline strategy. The GDD orga-nization includes centralized global functions such as Regulatory Affairs and Global Development Operations, and global Development Units aligned with our business franchises. GDD was created to improve resource allo-cation, technology implementation and process stan-dardization to further increase innovation. GDD includes approximately 11 000 full-time equivalent associates worldwide.
The traditional model of development consists of three phases:Phase I: The first clinical trials of a new compound – generally performed in a small number of healthy human volunteers – to assess the drug’s safety profile, includ-ing the safe dosage range. These trials also determine how a drug is absorbed, distributed, metabolized and excreted, and the duration of its action.Phase II: Clinical studies performed with patients who have the target disease, with the aim of continuing the Phase I safety assessment in a larger group, assessing the efficacy of the drug in the patient population, and determining the appropriate doses for further evaluation.Phase III: Large-scale clinical studies with several hun-dred to several thousand patients, which are conducted
Item 4. Information on the Company
35
to establish the safety and efficacy of the drug in spe-cific indications for regulatory approval. Phase III trials may also be used to compare a new drug against a cur-rent standard of care to evaluate the overall benefit-risk relationship of the new medicine.
In each of these phases, physicians monitor volunteer patients closely to assess the potential new drug’s safety and efficacy.
Though we use this traditional model, we have tai-lored the development process to be simpler, more flex-ible and efficient. We divide the development process into two stages: Exploratory Development to establish proof of concept, followed by Confirmatory Development to confirm the concept in large numbers of patients. Exploratory Development consists of clinical proof-of-concept (PoC) studies, which are small clinical trials (typ-ically involving in the range of between five and 15 patients) that combine elements of traditional Phase I/II testing. NIBR conducts these customized trials, which are designed to give early insights into issues such as safety, efficacy and toxicity for a drug in a given indica-tion. Once a positive proof of concept has been estab-lished, the drug moves to the Confirmatory Development stage and becomes the responsibility of GDD. Confir-matory Development has elements of traditional Phase II/III testing and includes trials aimed at confirming the safety and efficacy of the drug in the given indication, leading up to submission of a dossier to health authori-ties for approval. This stage can also include trials that compare the drug to the current standard of care for the disease in order to evaluate the drug’s overall benefit-risk profile. Further, with new treatment approaches such as gene therapy for rare diseases, elements of Exploratory and Confirmatory Development may be combined and suffice for registration under certain conditions such as high unmet medical need and clinical data showing highly favorable benefit-risk. In these cases, additional post-ap-proval studies may be required by the regulatory author-ities to continue to gather important data to further sup-port approval.
The vast amount of data that must be collected and evaluated makes clinical testing the most time-consum-ing and expensive part of new drug development. The next stage in the drug development process is to seek registration for the new drug. For more information, see “—Regulation.”
Our Innovation Management Board (IMB) manages our activities at each phase of clinical development. The IMB is responsible for all major aspects of our develop-ment portfolio and oversees our drug development bud-get as well as major project phase transitions and mile-stones following a positive proof-of-concept outcome, including transitions to Confirmatory Development and the decision to submit a regulatory application to the health authorities. The IMB is also responsible for the endorsement of overall development strategy, the endorsement of development project priorities, and deci-sions on project discontinuations. Our Chief Executive Officer chairs the IMB, and other representatives from Novartis senior management, with expertise spanning multiple fields, are among its core and extended mem-bership.
Alliances and acquisitionsOur Innovative Medicines Division enters into business development agreements with other pharmaceutical and biotechnology companies and with academic and other institutions to develop new products and access new markets. We license products that complement our cur-rent product line and are appropriate to our business strategy. We focus on strategic alliances and acquisition activities for key disease areas and indications that we expect to be growth drivers in the future. We review prod-ucts and compounds we are considering licensing, using the same criteria that we use for our own internally dis-covered drugs.
In January 2021, we announced a strategic collabo-ration agreement to in-license tislelizumab from an affil-iate of BeiGene, Ltd. in major markets outside of China. Tislelizumab is an anti-PD-1 monoclonal antibody spe-cifically designed to minimize binding to FcyR on mac-rophages, which accelerates the potential for Novartis to enter the large and growing checkpoint inhibitor field. Closing of this transaction is subject to expiration or early termination of the waiting period under the Hart-Scott-Rodino Antitrust Improvements Act. For additional infor-mation, see “Item 18. Financial Statements—Note 28. Commitments and contingencies—Research and devel-opment commitments.”
For additional information, see “Item 18. Financial Statements—Note 2. Significant transactions.”
Regulation
The international pharmaceutical industry is highly reg-ulated. Regulatory authorities around the world admin-ister numerous laws and regulations regarding the test-ing, approval, manufacturing, importing, labeling and marketing of drugs, and review the safety and efficacy of pharmaceutical products. Extensive controls exist on the non-clinical and clinical development of pharmaceu-tical products. These regulatory requirements, and the implementation of them by local health authorities around the globe, are a major factor in determining whether a substance can be developed into a marketable product, and the amount of time and expense associated with that development.
Health authorities, including those in the US and the EU, have high standards of technical evaluation. The introduction of new pharmaceutical products generally entails a lengthy approval process. Products must be authorized or registered prior to marketing, and such authorization or registration must subsequently be main-tained. In recent years, the registration process has required increased testing and documentation for the approval of new drugs, with a corresponding increase in the expense of product introduction.
To register a pharmaceutical product, a registration dossier containing evidence establishing the safety, effi-cacy and quality of the product must be submitted to regulatory authorities. Generally, a therapeutic product must be registered in each country in which it will be sold. In every country, the submission of an application to a regulatory authority does not guarantee that approval to market the product will be granted. Although the criteria

Item 4. Information on the Company
36
for the registration of therapeutic drugs are similar in most countries, the formal structure of the necessary registration documents and the specific requirements, including risk tolerance, of the local health authorities can vary significantly from country to country. Even if a drug is registered and marketed in one country, the reg-istration authority in another country may request addi-tional information from the pharmaceutical company prior to registration or even reject the product. A drug may be approved for different indications in different countries.
The registration process generally takes between six months and several years, depending on the country, the quality of the data submitted, the efficiency of the regis-tration authority’s procedures, and the nature of the product. Many countries provide for accelerated pro-cessing of registration applications for innovative prod-ucts of particular therapeutic interest. In recent years, the US and the EU have made efforts to harmonize reg-istration requirements in order to achieve shorter devel-opment and registration times for medical products. However, the requirement in many countries to negoti-ate selling prices or reimbursement levels with govern-ment regulators and other payers can substantially extend the time until a product may finally be available to patients.
The following provides a summary of the regulatory processes in the principal markets served by Innovative Medicines Division affiliates:
United StatesIn the US, applications for drug registration are submit-ted to and reviewed by the FDA. The FDA regulates the testing, manufacturing, labeling and approval for market-ing of pharmaceutical products intended for commer-cialization in the US. The FDA continues to monitor the safety of pharmaceutical products after they have been approved for sale in the US market. The pharmaceutical development and registration process is typically inten-sive, lengthy and rigorous. When a pharmaceutical com-pany has gathered data that it believes sufficiently demonstrates a drug’s safety, efficacy and quality, then the company may file a New Drug Application (NDA) or Biologics License Application (BLA), as applicable, for the drug. The NDA or BLA must contain all the scientific information that has been gathered about the drug. This typically includes information regarding the clinical expe-riences of patients tested in the drug’s clinical trials. A Supplemental New Drug Application (sNDA) or BLA amendment must be filed for new indications for a pre-viously approved drug.
Once an application is submitted, the FDA assigns reviewers from its staff, including experts in biopharma-ceutics, chemistry, clinical microbiology, pharmacology/toxicology, and statistics. After a complete review, these content experts provide written evaluations of the NDA or BLA. These recommendations are consolidated and are used by senior FDA staff in its final evaluation of the NDA or BLA. Based on that final evaluation, the FDA then provides to the NDA or BLA’s sponsor an approval, or a “complete response” letter if the NDA or BLA applica-tion is not approved. If not approved, the letter will state the specific deficiencies in the NDA or BLA that need to
be addressed. The sponsor must then submit an ade-quate response to the deficiencies in order to restart the review procedure.
Once the FDA has approved an NDA, BLA, sNDA or BLA amendment, the company can make the new drug available for physicians and other healthcare providers to prescribe. The drug owner must submit periodic reports to the FDA, including any cases of adverse reac-tions. For some medications, the FDA requires additional post-approval studies (Phase IV) to evaluate long-term effects or to gather information on the use of the prod-uct under specified conditions.
Throughout the life cycle of a product, the FDA requires compliance with standards relating to good lab-oratory, clinical and manufacturing practices. The FDA also requires compliance with rules pertaining to the manner in which we may promote our products.
European UnionIn the EU, there are three main procedures for applica-tion for authorization to market pharmaceutical products in more than one EU member state at the same time: the centralized procedure, the mutual recognition procedure and the decentralized procedure. It is also possible to obtain a national authorization for products intended for commercialization in a single EU member state only, or for additional indications for licensed products. The pro-cedure used for first authorization must continue to be followed for subsequent changes, e.g., to add an indica-tion for a licensed product.
Under the centralized procedure, applications are made to the EMA for an authorization that is valid for the European Union (all member states). The centralized pro-cedure is mandatory for all biotechnology products; new chemical entities in cancer, neurodegenerative disor-ders, diabetes, AIDS, autoimmune diseases and other immune dysfunctions; advanced therapy medicines, such as gene therapy, somatic cell therapy and tis-sue-engineered medicines; and orphan medicines (medicines for rare diseases). It is optional for other new chemical entities, innovative medicinal products, and medicines for which authorization would be in the inter-est of public health. When a pharmaceutical company has gathered data that it believes sufficiently demon-strates a drug’s safety, efficacy and quality, the company may submit an application to the EMA. The EMA then receives and validates the application, and the special-ized committee for human medicines, the CHMP, appoints a rapporteur and co-rapporteur to review it. The entire review cycle must be completed within 210 days, although there is a “clock stop” at Day 120 to allow the company to respond to questions set forth in the rapporteur and co-rapporteur’s assessment report. When the compa-ny’s complete response is received by the EMA, the clock restarts on Day 121. If there are further aspects of the dossier requiring clarification, the CHMP will issue fur-ther questions at Day 180, and may also request an oral explanation, in which case the sponsor must not only respond to the further questions but also appear before the committee to justify its responses. On Day 210, the CHMP will take a vote to recommend the approval or non-approval of the application, and their opinion is transferred to the EC. The final EC decision under this

Item 4. Information on the Company
37
centralized procedure is a decision that is applicable to all member states. This decision occurs 60 days, on aver-age, after a positive CHMP recommendation.
Under both the mutual recognition procedure (MRP) and the decentralized procedure (DCP), the assessment is led by one member state, called the reference mem-ber state (RMS) which then liaises with other member states, known as the concerned member states. In the MRP, the company first obtains a marketing authoriza-tion in the RMS, which is then recognized by the con-cerned member states in 90 days. In the DCP, the appli-cation is done simultaneously in the RMS and all concerned member states. During the DCP, the RMS drafts an assessment report within 120 days. Within an additional 90 days, the concerned member states review the application and can issue objections or requests for additional information. On Day 90, each concerned mem-ber state must be assured that the product is safe and effective, and that it will cause no risks to the public health. Once an agreement has been reached, each member state grants national marketing authorizations for the product.
After receiving the marketing authorizations, the company must submit periodic safety reports to the rel-evant health authority (EMA for the centralized proce-dure, national health authorities for DCP or MRP). In addi-tion, pharmacovigilance measures must be implemented and monitored, including the collection, evaluation and expedited reporting of adverse events, and updates to risk management plans. For some medications, post-ap-proval studies (Phase IV) may be imposed to comple-ment available data with additional data to evaluate long-term effects (called a Post-Approval Safety Study, or PASS) or to gather additional efficacy data (called a Post-Approval Efficacy Study, or PAES).
European marketing authorizations have an initial duration of five years. The holder of the marketing autho-rization must actively apply for its renewal after this first five-year period. As part of the renewal procedure, the competent authority will perform a full benefit-risk review of the product. Should the authority conclude that the benefit-risk balance is no longer positive, the marketing authorization can be suspended or revoked. Once renewed, the marketing authorization is valid for an unlim-ited period. If the holder does not apply for renewal, the marketing authorization automatically lapses. Any mar-keting authorization that is not followed within three years of its granting by the actual placing on the market of the corresponding medicinal product ceases to be valid.
Price controls
In most of the markets where we operate, the prices of pharmaceutical products are subject to both direct and indirect price controls and to drug reimbursement pro-grams with varying price control mechanisms. Due to increasing political pressure and governmental budget constraints, we expect these mechanisms to remain robust – and potentially even to be strengthened – and to have a continued negative influence on the prices we are able to charge for our products.
Direct governmental efforts to control pricesUnited States: In the US, former President Donald Trump and congressional leaders declared the reduction of drug prices a key priority in 2020. Former President Trump signed an executive order that included a most favored nation (MFN) policy limiting prices in Medicare parts B and D to no greater than those paid by devel-oped countries outside the US, and his administration finalized the rule to begin implementing a seven-year demonstration project for the MFN in Medicare Part B on January 1, 2021. However, lawsuits were filed in sev-eral US states, and the district courts granted orders delaying implementation. The Biden administration will likely determine next steps. Former President Trump also signed an executive order allowing US states to develop plans for the importation of drugs from Canada and per-mit personal importation from countries outside the US. These state plans must be approved by the US Depart-ment of Health and Human Services (HHS) prior to imple-mentation. However, a lawsuit was filed against HHS challenging the importation of certain prescription drugs from Canada without drug manufacturer authorization or oversight, and in parallel, the Canadian government blocked the distribution of certain medicines outside Canada to avoid shortages within the country. It is antic-ipated that focus on drug pricing will continue at the fed-eral level in 2021. Further, by December 31, 2020, 18 US states had passed legislation intended to impact pricing or requiring price transparency reporting, with five of these states also allowing for price control review boards. The disclosure requirements vary by state. Many states require multiple types of reporting, including for new drug applications, new drug launches, prior notice of price increases, and quarterly or annual reporting. It is expected in 2021 that state legislatures will continue to focus on drug pricing and that similar bills will be passed in more states.
Europe: In Europe, our operations are subject to signif-icant price and marketing regulations. Many govern-ments are introducing healthcare reforms in a further attempt to curb increasing healthcare costs. In some member states, these include reforms to permit the reim-bursed use of off-label medicines, despite the presence of licensed alternatives on the market. In the EU, govern-ments influence the price of pharmaceutical products through their control of national healthcare systems that fund a large part of the cost of such products to patients. The downward pressure on healthcare costs in general in the EU, particularly with regard to prescription drugs, is intense. Increasingly strict analyses are applied when evaluating the entry of new products, and as a result, access to innovative medicines is limited based on strict cost-benefit assessments. In addition, prices for mar-keted products are referenced within member states and across international borders, further impacting individ-ual EU member state pricing. Member states also col-laborate to enhance pricing transparency and have started conducting joint health technology assessments, joint pricing negotiations and/or joint purchasing. As an additional control for healthcare budgets, some EU coun-tries have passed legislation to impose further manda-tory rebates for pharmaceutical products and/or finan-

Item 4. Information on the Company
38
cial claw-backs on the pharmaceutical industry. The calculation of these rebates and claw-backs may lack transparency in some cases and can be difficult to pre-dict.
Regulations favoring generics and biosimilarsIn response to rising healthcare costs, most govern-ments and private medical care providers have estab-lished reimbursement schemes that favor the substitu-tion of generic pharmaceuticals for more expensive brand-name pharmaceuticals. All US states have generic substitution statutes. These statutes permit or require the dispensing pharmacist to substitute a less expensive generic drug instead of an original drug. Other countries, including many European countries, have similar laws. We expect that the pressure for generic substitution will continue to increase. In addition, the US, the EU and other jurisdictions are increasingly crafting laws and regula-tions encouraging the development of biosimilar versions of biologic drugs, which can also be expected to have an impact on pricing.
Cross-border salesPrice controls in one country can have an impact in other countries as a result of cross-border sales. In the EU, products that we have sold to customers in countries with stringent price controls can be legally resold to cus-tomers in other EU countries at a lower price than the price at which the product is otherwise available in the importing country (known as parallel trade). In North America, products that we have sold to customers in Canada – which has relatively stringent price controls – are sometimes resold into the US, again at a lower price than the price at which the product is otherwise sold in the US. Such imports from Canada and other countries into the US are currently illegal. However, given the increased focus on pharmaceutical prices in the US, the former Trump administration, certain members of the US Congress, and several US states continued to explore regulatory and legislative ways to allow the safe impor-tation of pharmaceutical products into the US from select countries, including Canada. Six US states have enacted drug importation laws, but the Secretary of HHS must certify that each state’s importation plan is safe and cost-effective before it can be implemented.
We expect that pressures on pricing will continue worldwide and will likely increase. Because of these pressures, there can be no certainty that in every instance we will be able to charge prices for a product that, in a particular country or in the aggregate, would enable us to earn an adequate return on our investment in that product.
Intellectual property
We attach great importance to intellectual property (IP) rights – including patents, trademarks, copyrights, know-how, trade secrets and regulatory data protection – as essential to our purpose of reimagining medicine to improve and extend people’s lives, and to protect our investment in research and development, manufacturing and marketing. The IP system provides a means to attract the investments needed to conduct and sustainably
finance innovative R&D, and to manage the risks inher-ent in our work. For example, we seek IP protection under applicable laws for significant product developments in major markets. Among other things, patents may cover the products themselves, including the product’s active ingredient or ingredients and its formulation. Patents may cover processes for manufacturing a product, including processes for manufacturing intermediate substances used in the manufacture of the product. Patents may also cover particular uses of a product, such as its use to treat a particular disease, or its dosage regimen. In addition, patents may cover tests for certain diseases or biomark-ers – which can improve patient outcomes when admin-istered with certain drugs – as well as assays, research tools and other techniques used to identify new drugs. The protection afforded, which may vary from country to country, depends upon the type of patent, its duration and its scope of coverage.
In the US and other countries, the law recognizes that product development and review by the FDA and other health authorities can take an extended period, and per-mits an extension of patent term for a period related to the time taken for the conduct of clinical trials and for the health authority’s review. However, the length of this extension and the patents to which it applies cannot be known in advance and can only be determined after the product is approved. In practice, it is not uncommon for patent term extensions (PTEs) to not fully account for the time it took to develop the product and receive mar-keting authorization. As a result, for example, it is rarely the case that a product’s active ingredient(s) will have a full patent term at the time the product is approved by the FDA and other health authorities.
In addition to patent protection, various countries offer regulatory data protection (RDP) or marketing exclusivities for a prescribed period of time. RDP is a dis-tinct type of IP right providing exclusivity that precludes a potential competitor from filing a regulatory applica-tion that relies on the sponsor’s clinical trial data, or that precludes the regulatory authority from approving the application for a set period of time. The RDP period can vary depending upon the type of data included in the sponsor’s application. When it is available, market exclu-sivity, unlike RDP, may preclude a competitor from obtain-ing marketing approval for a product even if a competi-tor’s application relies on its own data. RDP and market exclusivity periods generally run from the date a product is approved, and so their expiration dates cannot be known with certainty until the product approval date is known and exclusivity has been granted by the relevant authorities.
United StatesPatentsIn the US, a patent issued for an application filed today will receive a term of 20 years from the earliest applica-tion filing date, subject to potential patent term adjust-ments for delays in patent issuance based upon certain delays in prosecution by the United States Patent and Trademark Office (USPTO). A US pharmaceutical patent that claims a product, method of treatment using a prod-uct, or method of manufacturing a product may also be eligible for a PTE. This type of extension may only extend the patent term for a maximum of five years, and may not

Item 4. Information on the Company
39
extend the patent term beyond 14 years from regulatory approval. Only one patent may be extended for any prod-uct based on FDA review.
RDP and market exclusivitySeparate from patent exclusivities, the FDA may provide RDP or market exclusivity, which runs in parallel to any patent protection.
• A new small-molecule active pharmaceutical ingredi-ent receives five years of RDP, during which time a com-petitor generally may not submit or obtain approval of an application to the FDA based on a sponsor’s clini-cal data.
• For a small-molecule active pharmaceutical ingredient, the FDA may also request that a sponsor conduct pedi-atric studies and, in exchange, it will grant an additional six-month period of pediatric market exclusivity if the FDA accepts the data, the sponsor makes a timely application for approval for pediatric treatment, and the sponsor has either a patent-based or regulato-ry-based exclusivity period for the product that can be extended.
• Orphan drug exclusivity provides seven years of mar-ket exclusivity for drugs designated by the FDA as orphan drugs, meaning drugs that treat rare diseases. During this period, a potential competitor generally may not market the same or similar drug for the same indi-cation even if the competitor’s application does not rely on data from the sponsor.
• A new biologic active pharmaceutical ingredient receives 12 years of market exclusivity, during which time a competitor generally may not market the same or similar drug.
European communityPatentsPatent applications in Europe may be filed in the Euro-pean Patent Office (EPO) or in a particular country or countries. The EPO system permits a single application to be granted for the EU plus other non-EU countries such as Switzerland and Turkey. When the EPO grants a patent, it is then validated in the countries that the pat-ent owner designates. The term of a patent granted by the EPO or a European country office is generally 20 years from the earliest application filing date. Phar-maceutical patents can be granted a further period of exclusivity under the Supplementary Protection Certifi-cate (SPC) system. SPCs are designed, in part, to account for the time it took to receive marketing authorization of a product by the European health authorities. An SPC may be granted to provide, in combination with the pat-ent, up to 15 years of exclusivity from the date of the first European marketing authorization. However, an SPC cannot last longer than five years. The SPC duration may be extended by a further six months if the product is the subject of an agreed pediatric investigation plan. The post-grant phase of patents, including the SPC system, is currently administered on a country-by-country basis under national laws that, while differing, are intended to (but do not always) have the same effect.
RDP and market exclusivitySeparate from patent exclusivities, the EU provides a system of regulatory data protection for authorized human medicines that runs in parallel to any patent pro-tection. The system for drugs being approved today is usually referred to as “8+2+1” because it provides an ini-tial period of eight years of data protection, during which a competitor cannot rely on the relevant data; a further period of two years of market exclusivity, during which the data can be used to support applications for market-ing authorization but a competitive product cannot be launched; and a possible one-year extension of the mar-ket exclusivity period if, during the initial eight-year data exclusivity period, the sponsor registered a new thera-peutic indication with “significant clinical benefit.” This system applies both to national and centralized authori-zations.
The EU also has an orphan drug exclusivity system for medicines. If a medicine is designated as an orphan drug, then it benefits from 10 years of market exclusivity after it is authorized, during which time an application for the same or similar medicine for the same indication will not generally be accepted or granted. Under certain cir-cumstances, this exclusivity can be extended with a two-year pediatric extension.
Third-party patents and challenges to intellectual propertyThird parties can challenge our IP, including patents, pat-ent term extensions, RDP and marketing exclusivities (such as pediatric extensions and orphan drug exclusiv-ity), through various proceedings. For example, patents in the US can be challenged in the USPTO through var-ious proceedings, including Inter Partes Review (IPR) and Post-Grant Review (PGR) proceedings. They may also be challenged through patent infringement litigation under the Abbreviated New Drug Application (ANDA) provisions of the Hatch-Waxman Act or under the Bio-logics Price Competition and Innovation Act (BPCIA). In the EU, patents may be challenged through oppositions in the EPO, or national patents may be challenged in national courts or national patent offices. The outcomes of such challenges can be difficult to predict.
In addition to directly challenging our IP rights, in some circumstances a competitor may be able to mar-ket a generic version of one of our products by, for exam-ple, designing around our patents or marketing the generic product for non-patent-protected indications. Despite RDP, a competitor could opt to incur the costs of conducting its own clinical trials and preparing its own regulatory application, and avoid our RDP altogether. There is a risk that some countries may seek to impose limitations on or seek not to recognize the availability of IP rights for pharmaceutical products, or limit the extent to which such rights may be enforced. Also, even though we may own, co-own or in-license patents protecting our products, and conduct freedom-to-operate analyses, a third party may nevertheless assert that one of our prod-ucts infringes a third-party patent for which we do not have a license.
As a result, there can be no assurance that our IP rights will protect our products or that we will be able to avoid adverse effects from the loss of IP protection or from third-party patents in the future.

Item 4. Information on the Company
40
Intellectual property protection for certain key marketed products and compounds in developmentWe present below additional details regarding IP protec-tion for certain Innovative Medicines Division products. For each, we identify issued, unexpired patents by gen-eral subject matter and, in parentheses, years of expiry in, if relevant, the US and the EU. The identified patents are owned, co-owned or exclusively in-licensed by Novartis and relate to at least one dosage strength of the product or to the method of treatment or its use as it is currently approved and marketed or, in the case of a compound in development, as it is currently submitted to the FDA and/or the EMA for approval. Identification of an EU patent refers to national patents in EU countries and/or to the national patents that have been derived from a patent granted by the EPO. Novartis may own, co-own, control or have rights to additional patents, for example, relating to compound forms, methods of treat-ment or use, formulations, devices, processes, synthe-sis, purification and detection.
We identify unexpired RDP periods and, in parenthe-ses, years of expiry if the relevant marketing authoriza-tions have been authorized or granted. We identify cer-tain unexpired patent term extensions and marketing exclusivities and, in parentheses, years of expiry if they are granted; their subject matter scope may be limited and is not specified. Marketing exclusivities and patent term extensions include orphan drug exclusivity (ODE), pediatric exclusivity (PE), patent term extension (PTE) and supplementary protection certificate (SPC). We des-ignate them as “pending” if they have been applied for but not granted and include years of expiry if estimable. Such pending applications may or may not ultimately be granted.
In the case of the EU, identification of a patent, sup-plementary protection certificate, marketing exclusivity or regulatory data protection means grant, authorization and maintenance in at least one country. However, it could be pending, not granted, or found invalid in others.
For each product below, we indicate whether there is current generic or biosimilar competition for one or more product versions in one or more approved indica-tions in either the US or the EU, if IP is otherwise dis-closed. We identify certain enforcement actions, or ongoing challenges to the disclosed IP that have not been finally resolved, including IPRs or PGRs if instituted by the USPTO. Challenges identified as being in admin-istrative entities, such as national patent offices, include judicial appeals from decisions of those entities. Reso-lution of challenges to the disclosed IP, which in the EU may involve IP in one or more EU countries, may include settlement agreements under which Novartis permits or does not permit future launch of generic versions of our products before expiration of that IP. We identify certain material terms of such settlement agreements where they could have a material adverse effect on our busi-ness. In other cases, such settlement agreements may contain confidentiality obligations restricting what may be disclosed.
For additional information regarding commercial arrangements with respect to these products, see “—Key marketed products.”
Novartis Oncology business unitOncology• Tasigna. US: Patent on compound (2023), PE (2024);
three patents on salt forms (2026, 2027, 2028), three PEs (2027, 2028, 2029); patent on polymorph com-pound form (2026), PE (2027); two patents on capsule form (2026, 2027), two PEs (2027, 2028); patent on method of treatment (2032), PE (2032). EU: Patent on compound (2023); patent on salt form (2026); patent on polymorph compound form (2026); patent on cap-sule form (2027); patent on method of treatment (2030). There is no generic competition in the US or the EU. In the US, generic manufacturers have filed ANDAs challenging certain patents other than the com-pound patent. In the EU, the method-of-treatment pat-ent and the capsule form patent are being opposed in the EPO.
• Promacta/Revolade. US: Patent on compound (2021), PTE (2022), PE (2023); two patents on compound (2021, 2021), two PEs (2021, 2021); patent on throm-bocytopenia use (2021), PE (2021); patent on method of enhancing platelet production (2021), PE (2021); pat-ent on method of enhancing platelet production using salt (2023), PE (2023); patent on salt form and throm-bocytopenia use (2025), PE (2026); five patents on tab-let formulations of different dose strengths (2027) (5), five PEs (2028) (5); ODE on severe aplastic anemia patients with an insufficient response to immunosup-pressive therapy (2021), PE (2022); ODE on severe aplastic anemia patients in combination with standard immunosuppressive therapy (2025). EU: Patent on compound (2021), SPC (2025), PE (2025); patent on salt form (2023); patent on formulation (2027); patent on severe aplastic anemia use (2028); patent on severe aplastic anemia dosing regimen (2030). There is no generic competition in the US or the EU. In the US, generic manufacturers have filed ANDAs challenging certain patents other than the compound patent. In the EU, the formulation patent is being opposed in the EPO.
• Tafinlar and Mekinist.
Tafinlar. US: Two patents on compound (2030, 2030); patent on method of treatment (2029). EU: Patent on compound (2029); RDP (2023). There is no generic competition in the US or the EU.
Mekinist. US: Patent on compound (2025), PTE (2027); patent on method of treatment (2025); four patents on formulation (2032) (4). EU: Patent on compound (2025), SPC (2029); patent on formulation (2031); RDP (2025). There is no generic competition in the US or the EU.
Use of Mekinist with Tafinlar or Tafinlar with Mekinist. US: Patent on combination (2030); two patents on method of use of combination (2025, 2030); ODE on melanoma with certain mutations (2021); ODE on non-small cell lung cancer (2024); ODE on adjuvant treatment of melanoma (2025); ODE on anaplastic thy-roid cancer (2025). EU: Patent on combination (2030);

Item 4. Information on the Company
41
RDP (2025). There is no generic competition in the US or the EU.
• Sandostatin SC and Sandostatin LAR.
Sandostatin SC. There is no such patent protection in the US or the EU. There is generic competition in the US and the EU.
Sandostatin LAR. There is no such patent protection in the US or the EU. There is generic competition in some EU markets but no generic competition in the US.
• Jakavi. EU: Patent on compound (2026), SPC (2027); patent on salt form (2028); patent on compound for polycythemia vera (PV) use (2026); patent on salt form for PV use (2028); RDP (2023). There is no generic competition in the EU. In the EU, the salt form patent and the patent on salt form for PV use are being opposed in the EPO.
• Gleevec/Glivec. US: Patent on gastrointestinal stromal tumor (GIST) use (2021), PE (2022). EU: Patent on GIST use (2021); patent on tablet formulation (2023). There is generic competition in the US and the EU. National enforcement and validity actions are also ongoing on the GIST use patent in certain EU countries.
• Afinitor/Votubia and Afinitor Disperz/Votubia dispers-ible tablets. US: Patent on dispersible tablet formula-tion (2022), PE (2023); patent on tuberous sclerosis complex (TSC)/subependymal giant cell astrocytoma (SEGA) use (2022), PE (2022); patent on breast can-cer use (2022), PE (2022); patent on renal cell carci-noma use (2025), PE (2026); patent on pancreatic neu-roendocrine tumor use (2028); ODE for Afinitor on neuroendocrine tumors of gastrointestinal or lung ori-gin (2023); ODE for Afinitor Disperz on tuberous scle-rosis (2025). EU: Two patents on dispersible tablet for-mulation (2022, 2022); patent on breast cancer use (2022); patent on renal cell carcinoma use (2022); pat-ent on neuroendocrine tumors of pancreatic origin use (2022); patent on neuroendocrine tumors of lung ori-gin use (2022); patent on TSC/SEGA, TSC/renal angi-omyolipoma and TSC/seizures use (2027); ODE (Votubia, tuberous sclerosis) (2023). There is generic competition in the EU, and in the US for the three low-er-dosage strengths for Afinitor. In the US, Novartis has resolved patent litigation relating to Afinitor, which may result in further generic competition prior to the expi-ration in February 2022 of the breast cancer use pat-ent. Also in the US, Novartis has resolved patent litiga-tion relating to Afinitor Disperz, which may result in generic competition prior to the expiration in February 2022 of the TSC use patent. In the EU, the breast can-cer use patent, the TSC/SEGA, TSC/renal angiomyo-lipoma and TSC/seizures use patent, the renal cell car-cinoma use patent, and the use patents on neuroendocrine tumors of pancreatic origin and of lung origin are being opposed in the EPO. National enforce-ment and validity actions are also ongoing on some of these patents in certain EU countries.
• Kisqali. US: Three patents on compound (2028, 2030, 2031), PTE pending (2031); three patents on methods of treatment (2029, 2029, 2031); patent on salt form (2031); RDP (2022). EU: Patent on compound (2027); patent on compound (2029), SPC (2032); patent on salt form (2031); patent on methods of use (2029); RDP (2027). There is no generic competition in the US or the EU.
• Kymriah. US: Seven patents on cells and/or pharma-ceutical compositions comprising the cells (2031) (7); four patents on methods of use of cells and/or phar-maceutical compositions comprising the cells (2031) (4); RDP (2029), PE (2030); ODE for relapsed or refrac-tory (r/r) pediatric acute lymphoblastic leukemia (2024), PE (2025); ODE for r/r diffuse large B-cell lymphoma (2025), PE (2025). EU: Patent on methods of use (2031), SPC (2033); RDP (2028); ODE (2028), PE (2030). There is no generic competition in the US or the EU.
• Lutathera. US: Patent on formulation (2038); patent on formulation process (2038); RDP (2023); ODE (2025). EU: RDP (2027); ODE (2027). There is no generic com-petition in the US or the EU.
• Piqray. US: Patent on compound (2029); patent on com-pound and use (2030), PTE pending (2033); RDP (2024). EU: Patent on compound and use (2029), SPC (2034); RDP (2030). There is no generic competition in the US or the EU.
• Adakveo. US: Patent on composition of matter (2028), PTE pending (2032); patent on methods of treatment (2027); RDP (2031), PE (2032); ODE (2026). EU: Pat-ent on composition of matter (2027); patent on disso-ciation use (2031); RDP (2030); ODE (2030). There is no generic competition in the US or the EU.
Novartis Pharmaceuticals business unitImmunology, Hepatology and Dermatology• Cosentyx. US: Patent on composition of matter (2026),
PTE (2029); patent on psoriasis use (2032); patent on ankylosing spondylitis use (2033); RDP (2027). EU: Pat-ent on composition of matter (2025), SPC (2030), PE (2030); patent on psoriasis use (2031); RDP (2026). There is no generic competition in the US or the EU.
Ophthalmology• Lucentis. EU: Patent on composition of matter (2018),
SPC (2022), PE (2022). There is no generic competi-tion in the EU. In the EU, the pre-filled syringe patent is being opposed in the EPO.
• Xiidra. US: Patent on compound (2024); three patents on compound and use (2024, 2024, 2025); patent on formulation (2024); five patents on method of treatment (2024, 2024, 2026, 2029, 2029); two patents on poly-morph compound form (2029, 2029); RDP (2021). PTE pending. There is no generic competition in the US. Xiidra is not marketed in the EU. In the US, the com-pound, compound and use, formulation, method of treatment, and polymorph compound form patents are being challenged in ANDA proceedings against a generic manufacturer.

Item 4. Information on the Company
42
• Beovu. US: Patent on composition of matter (2029), PTE pending (2033); patent on method of treatment (2029); patent on nucleic acid molecule (2029); patent on antibodies (2023); patent on dosing regimen (2035); RDP (2031). EU: Two patents on composition of matter (2029, 2029), SPC (2034); patent on antibodies (2023); RDP (2030). There is no generic competition in the US or the EU.
Neuroscience• Gilenya. US: Patent on dosage regimen (2027), PE
(2027); patent on 0.25 mg formulation (2032), PE (2032); patent on method of treatment (2027); RDP for pediatric use and 0.25 mg (2021), PE (2021). EU: Pat-ent on formulation (2024), SPC (2026); patent on 0.25 mg formulation (2032); RDP (2022). There is no generic competition in the US or the EU. In the US, the dosage regimen patent is being challenged in ANDA proceed-ings against a generic manufacturer and was upheld as being valid and infringed. The decision has been appealed. In parallel, an appeal against a USPTO deci-sion upholding that patent in IPR proceedings is ongo-ing. Novartis is also enforcing the method of treatment patent against a generic manufacturer. Novartis has entered into settlement agreements with a number of manufacturers that had filed ANDAs to market a generic version of 0.5 mg Gilenya. Under the confidential terms of these settlements, these ANDA filers will be able to launch a generic version of 0.5 mg Gilenya on an agreed-upon date that is prior to the expiration of the dosage regimen patent.
• Zolgensma. US: Three patents on vector (2024, 2024, 2026); two patents on methods of treatment (2028, 2028); ODE for spinal muscular atrophy (SMA) in patients less than 2 years old with biallelic mutations in the SMN1 gene (2026); RDP (2031). EU: Two patents on vector (2024, 2028); two patents on methods of use (2028, 2028); ODE for SMA in patients with a biallelic mutation in the SMN1 gene, or patients with a biallelic mutation in the SMN1 gene and up to three copies of the SMN2 gene (2030); RDP (2030). There is no generic competition in the US or the EU.
• Mayzent. US: Patent on compound (2024); patent on treatment initiation use (2030); RDP (2024). PTE pend-ing. EU: Patent on compound (2024); patent on solid form (2029); patent on treatment initiation use (2029), SPC (2034); patent on formulation (2032); RDP (2030). There is no generic competition in the US or the EU.
• Kesimpta. US: Patent on compound (2031); RDP (2021). EU: Three patents on compound (2023) (3); two pat-ents on formulation (2028, 2028); patent on dosing regimen (2037). There is no generic competition in the US. Kesimpta is not currently marketed in the EU.
Cardiovascular, Renal and Metabolism• Entresto. US: Four patents on combination (2023) (4),
four PEs (2023 (3), 2024); two patents on complex (2026, 2027), two PEs (2027, 2027); RDP for new pedi-atric patient population (2022), PE (2023). PTE pend-ing. EU: Patent on combination (2023), SPC (2028); two patents on complex (2026, 2026), two SPCs (2030, pending 2030); patent on method of use (2034); RDP (2025). There is no generic competition in the US or the EU. In the US, two combination patents and the two complex patents are being challenged in ANDA proceedings against generic manufacturers. In the EU, the two complex patents and the use patent are being opposed in the EPO.
• Leqvio. US: Patent on composition of matter (2034), anticipated PTE (2035); patent on dosing regimen (2036). EU: Patent on composition of matter (2033), anticipated SPC (2035); RDP (2030). There is no generic competition in the EU. Leqvio is not currently marketed in the US.
Respiratory• Xolair. US: Two patents on syringe formulation (2021,
2025). EU: Two patents on syringe formulation (2021, 2024). There is no generic competition in the US or the EU.
Established Medicines• Galvus and Eucreas. EU: Patent on compound (2019),
SPC (2022); patent on combination (2021), SPC (2022); patent on Galvus formulation (2025); patent on Eucreas formulation (2026). Galvus/Eucreas is not marketed in the US. There is generic competition for Galvus and Eucreas in some EU countries. The EU Galvus formu-lation patent is being opposed in the EPO.
• Diovan and Co-Diovan/Diovan HCT. Diovan: There is no such patent protection for Diovan in the US or the EU. There is generic competition in the US and the EU. Co-Diovan/Diovan HCT: There is no such patent pro-tection for Co-Diovan/Diovan HCT in the US or the EU. There is generic competition in the US and the EU.
Compounds in development We provide patent information for non-marketed com-pounds in development that have been submitted to the FDA and/or the EMA for registration but have not yet been approved by either agency. We currently do not have any non-marketed compounds in development that have been submitted for registration but have not yet been approved by either agency.

Item 4. Information on the Company
43
Sandoz
Our Sandoz Division is a global leader in generic pharmaceuticals and biosimilars, and sells products in well over 100 countries. In 2020, the Sandoz Division achieved consolidated net sales of USD 9.6 billion, rep-resenting 20% of the Group’s total net sales. Sandoz develops, manufactures and markets finished dosage form medicines as well as intermediary products includ-ing active pharmaceutical ingredients.
Sandoz is organized globally into three franchises: Retail Generics, Anti-Infectives and Biopharmaceuticals. In Retail Generics, Sandoz develops, manufactures and markets active ingredients and finished dosage forms of small-molecule pharmaceuticals to third parties across a broad range of therapeutic areas, as well as finished dosage form anti-infectives sold to third parties. In Anti-Infectives, Sandoz manufactures and supplies active pharmaceutical ingredients and intermediates – mainly antibiotics – for internal use by Retail Generics and for sale to third-party customers. In Biopharmaceu-ticals, Sandoz develops, manufactures and markets pro-tein- or other biotechnology-based products, including biosimilars, and provides biotechnology manufacturing services to other companies.
The Sandoz strategic ambition is to be the world’s leading and most valued generics company (including biosimilars). Our divisional strategy focuses on three areas: developing a broad and consistent pipeline of off-patent launches across key geographies and across a broad range of therapeutic areas; positioning Sandoz to be “first in” by having a strong pipeline with a focus on being first to market and “last out” by way of competitive costs and stable supply; and instilling a true “generic mindset,” with a focus on priorities, simple and rapid deci-sion-making, and focused resource allocation.
Sandoz is the global market leader in biosimilars, with a total of eight approved and marketed products, and a pipeline of over 15 molecules. In addition to internally developed projects, our biosimilar portfolio comprises publicly announced commercialization agreements with BioCon, Gan & Lee, EirGenix and Polpharma Biologics. Availability of our biosimilars varies by country.
Sandoz is also the global market leader in generic antibiotics. Its Kundl, Austria, manufacturing site is the hub of the last vertically integrated antibiotics produc-tion chain in Europe, which offers certain competitive advantages including added supply chain resilience.
On January 31, 2020, we closed the previously announced acquisition of the Japanese business of Aspen Global Incorporated, consisting of off-patent branded medicines with a focus on anesthetics and spe-cialty brands.
We received a CRL from the FDA in 2018 for our sub-mission for a generic form of fluticasone propionate and salmeterol inhalation powder, for oral inhalation (GSK’s Advair®). In January 2020, we decided to discontinue the generic Advair® development program in the US, follow-ing a detailed review of the latest data read-outs.
On March 2, 2020, we announced a resolution with the US Department of Justice (DOJ) Antitrust Division concerning the DOJ’s antitrust investigation into the US generic drug industry. For more information, see “Item 18. Financial Statements—Note 20. Provisions and other non-current liabilities.”
In 2018, Novartis announced an agreement to sell selected portions of its Sandoz US portfolio, specifically the Sandoz US dermatology business and generic US oral solids portfolio, to Aurobindo Pharma USA Inc., for USD 0.8 billion in cash and potential earn-outs. On April 2, 2020, Novartis announced the mutual agreement with Aurobindo to terminate the sale agreement, as approval from the US Federal Trade Commission for the transac-tion was not obtained within anticipated timelines. Sandoz continues to operate its oral solids and derma-tology businesses as well as its dermatology develop-ment center as part of the Sandoz US business.
On July 27, 2020, Sandoz and the Austrian govern-ment announced a planned combined investment of more than EUR 150 million to enhance the long-term competitiveness and supply resilience of European pro-duction for key antibiotics.
Key marketed products
The Sandoz global portfolio covers a wide range of therapeutic areas. The following are some of the Sandoz key marketed products in each of its franchises (availability varies by market):
Retail GenericsProduct Originator drug Description
Amoxicillin/clavulanic acid Augmentin® Antibiotic
Zoledronic acid Aclasta Osteoporosis treatment
Acetylcysteine Various Mucolytic agent
Tacrolimus Various Immunosuppressive agent

Item 4. Information on the Company
44
Anti-InfectivesActive ingredients Description
Oral and sterile penicillins Anti-infectives
Oral and sterile cephalosporins Anti-infectives
Clavulanic acid and mixtures with clavulanic acid ß-lactam inhibitors
Classical and semisynthetic macrolides Anti-infectives
Intermediates Description
Various cephalosporin intermediates Anti-infectives
Macrolide base intermediates Anti-infectives
Various crude compounds produced by fermentation Cyclosporine, ascomycin, rapamycin, mycophenolic acid, etc.
BiopharmaceuticalsProduct Originator drug Description
Omnitrope Genotropin® Recombinant human growth hormone to treat growth disorders and growth hormone deficiency
Binocrit and Epoetin alfa Hexal Eprex®/Erypo® Recombinant protein (erythropoiesis-stimulating) agent to treat anemia
Zarzio, Zarxio and Filgrastim Hexal Neupogen® Recombinant protein (granulocyte colony-stimulating factor (GCSF), short-acting) used in oncology
Glatopa Copaxone® Treatment for relapsing forms of multiple sclerosis (MS)
Erelzi 1 Enbrel® Fusion protein (TNF-α receptor) to treat multiple immune-mediated inflammatory diseases
Rixathon MabThera® Chimeric monoclonal antibody (directed against CD20 protein on B-cells) to treat blood cancers and immunological diseases
Hyrimoz Humira® Monoclonal antibody (TNF-α antibody) to treat multiple immune-mediated inflammatory diseases
Zessly Remicade® Monoclonal antibody (TNF-α antibody) to treat multiple immune-mediated inflammatory diseases
Ziextenzo Neulasta® PEGylated form of a recombinant human granulocyte colony- stimulating factor (GCSF) (long-acting) to reduce duration of chemotherapy-induced neutropenia and incidence of chemotherapy-induced febrile neutropenia
1 Approved in the US in 2016. Launch in the US pending final resolution of litigation with Amgen, which markets Enbrel®. The US District Court of New Jersey ruled against Sandoz in August 2019, which was upheld on appeal; Sandoz is now considering its further appeal options.
Selected development projects – Biosimilars in Phase III development and registrationThe following table describes Sandoz biosimilar projects that are in Phase III clinical trials (including filing prepa-ration) and registration:Project/ Common Route of product name Mechanism of action Potential indication/indications Therapeutic areas administration Current phase
GP2017 adalimumab TNF-α antibody Arthritides (rheumatoid arthritis, ankylosing Immunology Subcutaneous EU approved spondylitis, psoriatic arthritis), plaque psoriasis US approved1
and others (same as originator)
GP2411 2 denosumab Anti-RANKL Osteoporosis, treatment-induced bone loss, Endocrinology, Subcutaneous Phase III monoclonal antibody metastases to bone, giant cell tumor Neurology (indications vary in US and EU)
EGI014A1 3 trastuzumab Anti-HER2 recombinat Breast and gastric tumors Oncology Intravenous Phase III IgG1, humanized monoclonal antibody
DST356A1 4 natalizumab Anti-α4 integrin Monotherapy for relapsing-remitting forms of Neurology, Intravenous Phase III monoclonal antibody multiple sclerosis (RRMS); in US, second-line Immunology (US only) treatment for active Crohn’s disease
1 Launched as Hyrimoz in the EU in October 2018. Also in October 2018, we announced a global resolution of all intellectual property-related litigation with AbbVie concerning adalimumab. Under the terms of the agreement, AbbVie grants us a non-exclusive license to AbbVie’s intellectual property relating to Humira®, beginning on certain dates in certain countries in which AbbVie has intellectual property. We are not entitled to launch Hyrimoz in the US until the second half of 2023.
2 Development in collaboration with Hexal AG.3 Development in collaboration with EirGenix, Inc.4 Development in collaboration with Polpharma Biologics.

Item 4. Information on the Company
45
Principal markets
The two largest generics markets in the world – the US and Europe – are the principal markets for Sandoz. The following table sets forth the aggregate 2020 net sales of Sandoz by region:
Sandoz 2020 net sales to third parties
USD millions %
Europe 5 231 54
United States 2 142 22
Asia, Africa, Australasia 1 501 16
Canada and Latin America 772 8
Total 9 646 100
Of which in Established Markets 1 7 089 73
Of which in Emerging Growth Markets 1 2 557 27
1 Emerging Growth Markets comprise all markets other than the Established Markets of the US, Canada, Western Europe, Japan, Australia and New Zealand.
Many Sandoz products are used for chronic conditions that require patients to consume the product over long peri-ods of time, from months to years. Sales of our anti-infective products and over-the-counter cough and cold prod-ucts are subject to seasonal variation. Sales of the vast majority of our other products are not subject to material changes in seasonal demand.
Production
For information on the production of our products, see “—Item 4.B Business overview—Innovative Medicines—Production.”
In September 2020, as part of a broader reorganiza-tion of Novartis Technical Operations (NTO), we estab-lished the Sandoz Technical Operations (STO) platform within NTO. STO will focus on producing generic medicines for Sandoz, as well as related external supply operations and supply chain.
Due to impurities found in the active ingredient batches sourced from third-party manufacturers, we recalled Sandoz valsartan, losartan and irbesartan prod-ucts in the second half of 2018 and first quarter of 2019, and ranitidine film-coated tablets in the second half of 2019, from several markets, in line with our quality stan-dards for all of our marketed products. The discovery of nitrosamines in some types of drug products led sev-eral health regulators (e.g., EMA, FDA and others) to con-duct a detailed analysis of these impurities in affected medicinal products. Novartis works with health authori-ties around the world to continuously review all chemi-cal and biological human medicines for the possible presence of nitrosamines. The EMA, FDA and other health authorities have provided guidance to the phar-maceutical industry to prevent unacceptable levels of nitrosamines in medicines. The EMA review is due to conclude in March 2021 for chemical human medicines and in July 2021 for biological human medicines.
Marketing and sales
Sandoz sells a broad portfolio of products, including the products of our Retail Generics franchise and biosimi-lars, to wholesalers, pharmacies, hospitals and other healthcare outlets. Sandoz adapts its marketing and
sales approach to local decision-making processes, depending on the structure of the market in each coun-try.
In response to rising healthcare costs, many govern-ments and private medical care providers, such as health maintenance organizations, have instituted reimburse-ment schemes that favor the substitution of bioequiva-lent generic versions of originator pharmaceutical prod-ucts, such as those sold by our Retail Generics franchise. In the US, statutes have been enacted by all states that permit or require pharmacists to substitute a less expen-sive generic product for the brand-name version of a drug that has been prescribed to a patient. Generic use is growing in Europe, but penetration rates in many EU countries (as a percentage of volume) remain well below those in the US.
Recent trends have been toward continued consoli-dation among distributors and retailers of Sandoz prod-ucts, both in the US and internationally, which has increased our customers’ purchasing leverage.
Legislative or regulatory changes can have a signifi-cant impact on our business in a country. For more infor-mation on such changes, see ““—Item 4.B Business over-view—Innovative Medicines—Price controls.”
Our Anti-Infectives franchise supplies active phar-maceutical ingredients and intermediates – mainly anti-biotics – for internal use by Retail Generics and for sale to the pharmaceutical industry worldwide.
Our Biopharmaceuticals franchise operates in an emerging business environment, particularly in the US. Regulatory pathways for approving biosimilar products are either relatively new or still in development, and pol-icies have not yet been fully defined or implemented regarding the automatic substitution and reimbursement of biosimilars in many markets, including the US. As a result, in many of these markets, our biosimilar products are marketed as branded competitors to the originator products.

Item 4. Information on the Company
46
Competition
The market for generic products is characterized by increasing demand for high-quality pharmaceuticals that can be marketed at lower costs due to comparatively minimal initial research and development investments. Increasing pressure on healthcare expenditure and numerous patent and data exclusivity period expirations have encouraged more generic product launches, result-ing in increased competition among the companies sell-ing generic pharmaceutical products, leading to ongoing price pressure. In particular, Sandoz faces increased industrywide pressure on prices for generic products, particularly in the US, driven by factors including cus-tomer consolidation and growing competition from other manufacturers of generic medicines. These factors con-tributed to a decline in US sales that began in 2017 and continued through 2020.
In addition, research-based pharmaceutical compa-nies are participating directly in the generic conversion process by licensing their patented products to generic companies (so-called “authorized generics”). Conse-quently, generic companies that were not otherwise in a position to launch a specific product may participate in the market using the innovator’s product authorization. Authorized generics serve as a business opportunity for Sandoz when the product of a research-based pharma-ceutical company loses patent protection and Sandoz secures a license from the research-based pharmaceu-tical company to launch the authorized generic of that product.
Development and registration
Development of Sandoz Biopharmaceuticals is jointly overseen by Sandoz and by Global Drug Development (GDD) and is mostly executed by GDD. Development and registration activities for Retail Generics products, and certain registration activities for Biopharmaceuticals products, continue to be overseen directly by Sandoz.
Before a generic pharmaceutical may be marketed, intensive technical and clinical development work must be performed to demonstrate, in bioavailability studies, the bioequivalence of the generic product to the refer-ence product. Nevertheless, research and development costs associated with generic pharmaceuticals are much lower than those of the originator pharmaceuticals, as no preclinical studies or clinical trials on dose finding, safety and efficacy must be performed by the generic company. As a result, generic pharmaceutical products can be offered for sale at prices often much lower than those of products protected by patents and data exclu-sivity, which must recoup substantial research and devel-opment costs through higher prices over the life of the product’s patent and data exclusivity period.
While generic pharmaceuticals are follow-on ver-sions of chemically synthesized molecules, biosimilar products contain a version of the active substance of an already approved biological reference medicine. Due to the inherent variability and complexity of biologic prod-ucts, including batch-to-batch differences and variations following manufacturing changes, the development and
the regulatory pathway of biosimilars differ significantly from that of generics.
The development of a biosimilar product is much more technically challenging than the development of a typical generic small-molecule pharmaceutical. While generic pharmaceuticals normally do not require clinical studies in patients, regulators worldwide do require such targeted studies for biosimilar products. Biosimilars are engineered to match the reference medicine in quality, safety and efficacy. This is achieved by systematically defining the target range of the reference medicine and then comparing the biosimilar to the reference medicine at various development stages to confirm biosimilarity and to establish that there are no clinically meaningful differences between the proposed biosimilar and the ref-erence biologic. Because the purpose of a biosimilar clin-ical development program is to confirm biosimilarity and not to establish efficacy and safety de novo, the clinical studies required are less than those required for a ref-erence biologic. Therefore, the cost of development for a biosimilar is usually less than that of a reference bio-logic.
The Development and Registration staff employed by affiliates of the Sandoz Division are based worldwide, including at facilities in Holzkirchen, Germany; Hyder-abad, India; Kundl, Austria; Ljubljana, Slovenia; and Rudolstadt, Germany. In November 2020, Sandoz com-pleted (i) the previously announced closure of the Holz-kirchen, Germany, development and registration site, with the exception of patch development and the proj-ect management group, and; (ii) the closure of the prod-uct development and registration site as well as the main-tenance and development regulatory centers in Unterach, Austria. We are conducting a review of our global devel-opment and regulatory network to consolidate and streamline operations and optimize our network struc-ture to enable Sandoz to compete sustainably in an increasingly challenging generics environment. As part of this review, in the fourth quarter of 2020, Sandoz announced the planned closure of its maintenance reg-ulatory center in Barleben, Germany, which we expect will be completed in the fourth quarter of 2021. Sandoz also announced the planned closure of the Fougera development center located in Melville, New York as well as the product development center in Boucherville, Can-ada, which we expect will be completed in 2021.
Regulation
GenericsThe Hatch-Waxman Act in the US (and similar legislation in the EU and in other countries) eliminated the require-ment that manufacturers of generic pharmaceuticals repeat the extensive clinical trials required for reference products, so long as the generic version could be shown to be therapeutically equivalent to the reference prod-uct.
In the US, the decision on whether a generic phar-maceutical is therapeutically equivalent to the original product is made by the FDA based on an Abbreviated New Drug Application (ANDA) filed by the generic prod-uct’s manufacturer. The process typically takes nearly two years from the filing of the ANDA until FDA approval.

Item 4. Information on the Company
47
However, delays can occur if issues arise, for example, regarding the interpretation of bioequivalence study data, labeling requirements for the generic product, or qualifying the supply of active ingredients. In addition, the Hatch-Waxman Act requires a generic manufacturer to certify in certain situations that the generic product does not infringe on any current applicable patents on the product held by the holder of the marketing authori-zation for the reference product, or to certify that such patents are invalid. This certification often results in a patent infringement lawsuit being brought against the generic company. In the event of such a lawsuit, the Hatch-Waxman Act imposes an automatic 30-month delay in the approval of the ANDA to allow the parties to resolve the intellectual property issues. For generic applicants who are the first to file their ANDA containing a certification claiming non-infringement or patent inva-lidity, the Hatch-Waxman Act generally provides those applicants with 180 days of marketing exclusivity to recoup the expense of challenging the patents on the reference product. However, generic applicants must launch their products within certain timeframes or risk losing the marketing exclusivity that they had gained by being a first-to-file applicant.
In the EU, decisions on the granting of a marketing authorization are made either by the European Commis-sion based on a positive recommendation by the EMA under the centralized procedure, or by a single member state under the national or decentralized procedure. See “—Innovative Medicines—Regulation—European Union.” Companies may submit Abridged Applications for approval of a generic medicinal product based upon its “essential similarity” to a medicinal product authorized and marketed in the EU following the expiration of the product’s data exclusivity period. In such cases, the generic company is able to submit its Abridged Applica-tion based on the data submitted by the innovator com-pany for the reference product, without the need to con-duct extensive Phase III clinical trials of its own. For all products that received a marketing authorization in the EU after late 2005, the Abridged Application can be sub-mitted throughout the EU. However, the data submitted by the innovator company in support of its application for a marketing authorization for the reference product will be protected for 10 years after the first grant of mar-keting authorization in all member states, and can be extended for an additional year if a further innovative indication has been authorized for that product, based on preclinical and clinical trials filed by the innovator company that show a significant clinical benefit in com-parison to the existing therapies.
BiosimilarsThe regulatory pathways for approval of biosimilar medicines are still being developed and established in
many countries of the world. A regulatory framework for the approval of biosimilars has been established in the EU, Japan, Canada and the US, while the World Health Organization (WHO) has issued guidance. Sandoz has successfully registered and launched the first biosimilar (or biosimilar-type) medicine in Europe, the US, Canada, Japan, Taiwan, Australia, and many countries in Latin America and Asia. Sandoz was the first company to secure approval for and launch a biosimilar under the US biosimilar pathway that was established as part of the Biologics Price Competition and Innovation Act (BPCIA).
The approval of biosimilars in Europe follows a pro-cess similar to that followed for small molecules. How-ever, biosimilars usually have to be approved through the centralized procedure because they are manufactured using recombinant DNA technology. As part of the approval process in the EU, biosimilars have to demon-strate comparability to the reference medicine in terms of safety, efficacy and quality through an extensive com-parability exercise, based on strict guidelines set by the authorities. Regulators will only approve a biosimilar based on data that allows the regulators to conclude that there are no clinically meaningful differences between the reference medicine and the biosimilar.
In the US, under the BPCIA, a biosimilar must be highly similar with no clinically meaningful differences compared to the reference medicine. Approval of a bio-similar in the US requires the submission of an ABLA to the FDA, including an assessment of immunogenicity, and pharmacokinetics or pharmacodynamics. The ABLA for a biosimilar can be submitted as soon as four years after the initial approval of the reference biologic, but can only be approved 12 years after the initial approval of the reference biologic.
Intellectual property
We take all reasonable steps to ensure that our products do not infringe valid intellectual property rights held by others. Nevertheless, competing companies commonly assert patent and other intellectual property rights. As a result, we can become involved in significant litigation regarding our products. If we are unsuccessful in defend-ing these suits, we could be subject to injunctions pre-venting us from selling our products and to potentially substantial damages.
Wherever possible, our products are protected by our own patents. Among other things, patents may cover the products themselves, including the product’s formu-lation, or the processes for manufacturing a product. However, there can be no assurance that our intellectual property will protect our products or that we will be able to avoid adverse effects from the loss of intellectual prop-erty protection in the future.

Item 4. Information on the Company
48
4.C Organizational structure
Organizational structure
See “Item 4. Information on the Company—Item 4.A History and development of Novartis” and “Item 4. Information on the Company—Item 4.B Business overview—Overview.”
Significant subsidiaries
See “Item 18. Financial Statements—Note 32. Principal Group subsidiaries and associated companies.”
4.D Property, plants and equipment
Our principal executive offices are located in Basel, Swit-zerland. Our divisions operate through a number of affil-iates that have offices, research and development facil-ities, and production sites throughout the world.
We generally own our facilities or have entered into long-term lease arrangements for them. Some of our principal facilities are subject to mortgages and other security interests granted to secure certain debts.
Novartis Technical Operations (NTO) manages the production, supply chains and quality of our Innovative Medicines and Sandoz Division products through a net-work of 54 manufacturing sites, as well as through exter-nal suppliers, and warehouse and distribution centers. In addition, our Innovative Medicines Division manages
six AAA sites for radioligand therapies production and six sites for Novartis Gene Therapies (formerly AveXis) for research and development, production, warehousing and administrative offices. Endocyte manages two sites for research and its headquarters and administrative offices.
The following table sets forth our major headquar-ters and most significant production, research and devel-opment, and administrative facilities. See also “—Item 4.B Business overview—Innovative Medicines—Produc-tion” and “—Item 4.B Business overview—Sandoz—Pro-duction” for a discussion of our manufacturing pro-cesses.
Major facilities Size of site (in Location square meters) Major activity
Basel, Switzerland – St. Johann 589 000 Global Group headquarters; global Innovative Medicines Division headquarters; Global Sandoz Division headquarters; research and development; production of drug substances and drug intermediates
Kundl and Schaftenau, Austria 480 000 Production of biotechnological products, drug products and finished products, anti-infectives, active drug substances, product development
East Hanover, New Jersey 391 000 Innovative Medicines Division US headquarters, research and development
Barleben, Germany 340 000 Production of broad range of generics finished dosage forms
Cambridge, Massachusetts 201 800 Research and development
Shanghai, China 106 500 Research and development
Stein, Switzerland 64 700 Production of sterile vials, pre-filled syringes and ampoules; inhalation capsules, tablets and transdermals; active pharmaceutical ingredients, and cell and gene therapies
Holzkirchen, Germany 64 200 Global Sandoz Division, production of oral films, transdermal delivery systems, matrix patches, product development
Huningue, France 35 000 Production of drug substances for clinical and commercial supply
Princeton, New Jersey 14 300 Sandoz Division US headquarters
Libertyville, Illinois 9 800 Production, warehouse and administrative offices for the Novartis Gene Therapies unit within the Innovative Medicines Division
As our product portfolio evolves, NTO is adapting our manufacturing capacity and capabilities to meet our changing needs, shifting from high-volume products toward lower-volume, customized and personalized medicines. As of December 31, 2020, we have closed, exited or sold 18 manufacturing sites since 2016 and have announced the closure, exit or sale of seven additional manufacturing sites. We have continued to expand our
capacity in personalized medicines and complex biologic drugs, such as in Stein, Switzerland, as well as investing in new facilities to provide cell and gene therapies, such as in Les Ulis, France. We are leveraging innovation to increase the reliability and productivity of our manufac-turing network, including using data and digital technol-ogies. We continue to seek opportunities to manage our production facilities as efficiently as possible, optimize
Item 4. Information on the Company
49
external spend, and simplify and standardize across our manufacturing network to help us lower costs and help optimize the value of our products. At the same time, we are working to improve our environmental sustainability, for example by reducing energy and water consumption at our sites.
For a description of the impact of environmental mat-ters, see “Item 3. Key Information—Item 3.D Risk fac-tors—Environmental, social and governance—Unsuc-
cessful management of environmental, social and governance matters,” “Item 3. Key Information—Item 3.D Risk factors—Environmental matters—Impact of environ-mental liabilities,” and “Item 3. Key Information—Item 3.D Risk factors—Climate change—Climate change and associated increased risk of major natural disasters.” See also “Item 18. Financial Statements—Note 20. Pro-visions and other non-current liabilities.”

Item 4A. Unresolved Staff Comments
50
Item 4A. Unresolved Staff CommentsNot applicable.

Item 5. Operating and Financial Review and Prospects
51
Item 5. Operating and Financial Review and Prospects5.A Operating results
This operating and financial review should be read with the Group’s consolidated financial statements in this Annual Report, which have been prepared in accordance with International Financial Reporting Standards (IFRS) as published by the International Accounting Standards Board (see “Item 18. Financial Statements”). “Item 5. Operating and Financial Review and Prospects” with the sections on compounds in development and selected development projects of our divisions (see “Item 4. Infor-mation on the Company—Item 4.B Business overview”) constitute the Operating and Financial Review (Lage-bericht), as defined by the Swiss Code of Obligations.
The discussion and analysis of the financial condition and results of operations of certain items from fiscal year ended December 31, 2018 and year to year comparison between fiscal year ended December 31, 2019 and December 31, 2018 that are not included in this Form 20-F can be found in “Item 5. Operating and Financial Review and Prospects” of our Form 20-F for the fiscal year ended December 31, 2019, which is incorporated by reference herein.
OverviewOur purpose is to reimagine medicine to improve and extend people’s lives. We use innovative science and tech-nology to address some of society’s most challenging healthcare issues. We discover and develop breakthrough treatments and find new ways to deliver them to as many people as possible. We also aim to reward those who invest their money, time and ideas in our Company. Our vision is to become the most valued and trusted medicines com-pany in the world.
The businesses of Novartis are divided operationally on a worldwide basis into two identified reporting seg-ments:• Innovative Medicines: innovative patent-protected pre-
scription medicines• Sandoz: generic pharmaceuticals and biosimilars
In addition, we separately report the results of Corpo-rate activities. The financial results of our Corporate activities include the costs of the Group headquarters and those of corporate coordination functions in major countries. Corporate also includes other items of income and expense that are not attributable to specific seg-ments, such as certain revenues from intellectual prop-erty rights and certain expenses related to post-employ-ment benefits, environmental remediation liabilities, charitable activities, donations and sponsorships.
Our divisions are supported by the following organi-zational units: the Novartis Institutes for BioMedical Research, Global Drug Development, Novartis Technical Operations and Novartis Business Services. The financial
results of these organizational units are included in the results of the divisions for which their work is performed.
Significant transactions are discussed in “Item 18. Financial Statements—Note 2. Significant transactions”, “Item 18. Financial Statements—Note 3. Segmentation of key figures 2020, 2019 and 2018,” and “Item 18. Finan-cial Statements—Note 30. Discontinued operations.”
Following the February 28, 2019, shareholders’ approval of the spin-off of the Alcon business, the Group reported its consolidated financial statements as “con-tinuing operations” and “discontinued operations” for the current and prior years to comply with IFRS. Continuing operations include the businesses of the Innovative Medicines and Sandoz Divisions, and the continuing Cor-porate activities. Discontinued operations include the Alcon eye care devices business and certain Corporate activities attributable to the Alcon business prior to the spin-off, the gain on distribution of Alcon Inc. to Novartis AG shareholders and certain other expenses related to the spin-off. See “Item 18. Financial Statements—Note 1. Significant Accounting Policies”, “Item 18. Financial State-ments—Note 2. Significant Transactions” and “Item 18. Financial Statements—Note 30. Discontinued opera-tions.”
Our environment
We live in an era of amazing medical innovation, driven by better understanding of the genetic and biological roots of disease, and surging use of data analytics and digital technology in science and healthcare. At the same time, the world’s population continues to grow and peo-ple are living longer, fueling a rise in chronic diseases. Together, these factors are increasing demand for high-quality care worldwide and pressuring healthcare systems to restrain spending growth.
Our strategy
Our strategy is to build a leading, focused medicines company powered by advanced therapy platforms and data science. As we implement our strategy, we have five priorities to shape our future and help us continue to cre-ate value for our company, our shareholders and soci-ety: • Unleash the power of people. We believe that culture is
fundamental to driving our performance and value for stakeholders. We are implementing this priority by building one consistent organizational culture that is inspired, curious and unbossed. Engagement of our associates is now at an all-time high. Externally, more than half of our candidates reference culture as one of the reasons to join Novartis. In the future, we expect to make real-time insights on company culture available

Item 5. Operating and Financial Review and Prospects
52
to our leaders to drive our performance and further foster our culture.
• Deliver transformative innovation. We prioritize first-in-class medicines in our pipeline to address the needs of patients with no or limited treatment options. Our commitment is to go beyond traditional modalities (for example, small molecules and biologics) and invest in advanced therapy platforms (for example, cell therapy, gene therapy, radioligand therapy and RNA-based therapeutics). Novartis has a leading pipeline based on scale, innovation and future value, including 118 assets in Phase I or II, 49 in Phase III or undergoing registra-tion and more than 65 new molecular entities as of December 31, 2020. The pipeline is expected to fuel growth in the mid-to long-term, with around 90% poten-tial first-in-class/first-in-indication medicines and about 80% of targets in areas of high unmet patient need. The company is strengthening its advanced ther-apy platforms along the value chain with 20 advanced platform therapies in clinical development alongside a large number of pre-clinical projects. We are also mak-ing significant progress on the manufacturing and com-mercialization of these advanced therapy platforms.
• Embrace operational excellence. We believe that oper-ational excellence is becoming an increasingly import-ant factor to the success of our business. We are focused on three key areas: (i) Launch excellence and the performance of our growth drivers. We are rein-forcing our approach to product launches to become more consistent across markets. To ensure we deploy our resources effectively, we are investing in earlier pre-launch preparations, including talking with doctors, patients and insurers to better understand their needs. Using data science, we are expanding our ability to test and learn from new commercial models and employ real-time analysis of marketing data in order to target customers with personalized content, orchestrated across multiple marketing channels; (ii) Transformation of NTO to deliver consistent productivity gains together with high levels of quality and service. We are consol-idating our manufacturing footprint to achieve better asset utilization and increased focus on making medicines. At the same time, we are investing in innovative technologies and advanced therapy plat-forms, while supporting launches and growth drivers through dedicated product management teams. NTO is digitizing its key processes and leveraging data to establish next-generation manufacturing capabilities. Our resilient supply network has helped us to respond to the COVID-19 pandemic, supporting an uninter-rupted supply of our medicines; and (iii) NBS continu-ing on its journey to become an industry-leading enter-prise transformation engine. We are strengthening our Global Service Centers, while building strong IT and digital foundations, realizing significant procurement efficiencies, and driving simplification of key enterprise processes.
• Go big on data and digital. We believe that the growth and implementation of digital technologies in our indus-try, including for research and development, produc-tion, marketing and sales, and as a component of our
products is an important trend in our industry. Our dig-ital ambition is to transform how we innovate, how we engage with customers and how we operate. We plan to achieve this by focusing on four areas: (i) Scale our digital foundational programs designed to jumpstart our digital transformation in key areas of our business; (ii) Make Novartis digital by working to build up our tal-ent, infrastructure and ways of working to enable us to work more efficiently with data and to improve the qual-ity of that data; (iii) Become the healthcare partner of choice in the tech ecosystem by transforming how we work with all of our partners – from nimble start-ups and innovative academic institutions to some of the biggest organizations in the industry. We have created the Novartis Biome as a bridge to help our partners become more like an extension of our own teams and to work with us as easily and productively as possible; and (iv) We are preparing for potential future disruptive healthcare scenarios such as AI-based digital disease management.
• Build trust with society. Building trust with society has become an important requirement for companies like Novartis. Stakeholders are increasingly expressing preference for companies with clear ESG plans, and some institutional investors increasingly believe there is a correlation between company valuations and ESG performance. We focus on four strategic pillars defined as material by strategic stakeholders: (i) Ethical stan-dards: In 2020, we focused our activities on operational excellence including the launch of a new Code of Eth-ics and strengthening our third-party risk management framework; (ii) Pricing and Access: We continue to sys-tematically integrate access strategies into the research, development and delivery of our medicines globally, including in low and middle-income countries. In 2020, we issued the first healthcare industry sus-tainability-linked bond which was also the first sustain-ability-linked bond incorporating social targets tied to targets for expanding access to our innovative medicines and addressing key global health chal-lenges, two areas where we believe we can drive the greatest value for society; (iii) Global Health Chal-lenges: We continue to expand our global health pro-grams in malaria, leprosy, Chagas disease, and sick-le-cell-disease, and in 2020 launched our new Sub-Saharan-Africa strategy with our Sub-Saha-ran-Africa unit deploying innovative approaches to increase patient reach across countries regardless of income level; and (iv) Corporate Citizenship: We aim at achieving gender balance in management and fulfill our UN pay equity and transparency pledge by 2023. We also aim to achieve full carbon, plastic and water neu-trality by 2030. Beyond our four strategic pillars, we continue our efforts to strengthen our governance and increase transparency. In 2020, we created an ESG Management Office within Corporate Strategy tasked with improving oversight, and facilitating embedding ESG measures into our business operations. Further, we have created an ESG Index to allow ESG analysts to more easily locate our ESG disclosures across our public disclosures and channels.

Item 5. Operating and Financial Review and Prospects
53
Results of operations
Financial year 2020 compared to 2019
Key figures1
Change in
Change constant
Year ended Year ended in USD currencies
(USD millions unless indicated otherwise) Dec 31, 2020 Dec 31, 2019 % % 2
Net sales to third parties from continuing operations 48 659 47 445 3 3
Sales to discontinued operations 53 nm nm
Net sales from continuing operations 48 659 47 498 2 3
Other revenues 1 239 1 179 5 5
Cost of goods sold – 15 121 – 14 425 – 5 – 3
Gross profit from continuing operations 34 777 34 252 2 3
Selling, general and administration – 14 197 – 14 369 1 1
Research and development – 8 980 – 9 402 4 6
Other income 1 742 2 031 – 14 – 17
Other expense – 3 190 – 3 426 7 9
Operating income from continuing operations 10 152 9 086 12 19
% of net sales to third parties 20.9 19.2
Income from associated companies 673 659 2 2
Interest expense – 869 – 850 – 2 – 4
Other financial income and expense – 78 45 nm nm
Income before taxes from continuing operations 9 878 8 940 10 17
Taxes – 1 807 – 1 793 – 1 – 7
Net income from continuing operations 8 071 7 147 13 20
Net loss from discontinued operations
before gain on distribution of Alcon Inc.
to Novartis AG shareholders – 101 nm nm
Gain on distribution of Alcon Inc.
to Novartis AG shareholders 4 691 nm nm
Net income from discontinued operations 4 590 nm nm
Net income 8 071 11 737 – 31 – 27
Attributable to:
Shareholders of Novartis AG 8 072 11 732 – 31 – 27
Non-controlling interests – 1 5 nm nm
Basic earnings per share from continuing operations (USD) 3.55 3.12 14 21
Basic earnings per share from discontinued operations (USD) 2.00 nm nm
Total basic earnings per share (USD) 3.55 5.12 – 31 – 26
Net cash flows from operating activities from continuing operations 13 650 13 547 1
Free cash flow from continuing operations 2 11 691 12 937 – 10
1 Continuing operations include the businesses of the Innovative Medicines and Sandoz Divisions and the continuing Corporate activities and discontinued operations include the Alcon eye care devices business and certain Corporate activities attributable to the Alcon business prior to the spin-off, the gain on distribution of Alcon Inc. to Novartis AG shareholders in 2019 and certain other expenses related to the distribution. See “Item 18. Financial Statements—Note 1. Significant accounting policies”, “Item 18. Financial Statements—Note 2. Significant transactions—Significant transactions in 2019,” and “Item 18. Financial Statements—Note 30. Discontinued operations.”
2 For an explanation of non-IFRS measures and reconciliation tables, see “Item 5.A Operating results—Non-IFRS measures as defined by Novartis.”nm = not meaningful

Item 5. Operating and Financial Review and Prospects
54
Group overview
The COVID-19 situation continues to evolve and is tak-ing differing courses across the multitude of geographies that Novartis operates in. We continue to take strong actions to help address the pandemic consequences. Our primary concerns remain the health and safety of our associates and patients.
During the year, there have been COVID-19 related lockdowns in several geographies negatively impacting certain therapeutic areas, most notably in: ophthalmol-ogy, dermatology and the Sandoz Retail Generics Busi-ness. However, our operations remain stable and cash collections continue to be according to our normal trade terms, with days sales outstanding at normal levels. Novartis remains well positioned to meet its ongoing financial obligations and has sufficient liquidity to sup-port our normal business activities. At present, drug development operations are continuing with manageable disruptions, with our range of digital technologies allow-ing us to proactively manage our clinical trials portfolio and rapidly mitigate any disruptions (see the section on compounds in development and selected development projects of our divisions within “Item 4. Information on the Company – Item 4.B Business overview”).
Novartis launched a first-of-its-kind not-for-profit portfolio of 15 medicines from the Sandoz Division for symptomatic treatment of COVID-19. The portfolio addresses urgent unmet needs and is sold at no profit to governments in up to 79 eligible low and lower middle income countries. We continue to work closely with third parties to fight the COVID-19 pandemic. Novartis is also undertaking drug discovery efforts to develop the first oral medicines for COVID-19 and other coronaviruses. We are investigating two potential medicines, DFV890 and MAS825, in early stage development focused on the immune response. In October, we announced a collab-oration with Molecular Partners to develop, manufacture and commercialize Molecular Partners’ anti-COVID-19 DARPin® program, potential medicines for the prevention and treatment of COVID-19.
In 2020, Novartis delivered sales growth, margin expansion, and continued to progress its next wave of medicines.
Net sales to third parties for Novartis continuing oper-ations were USD 48.7 billion, up 3% in reported terms and up 3% measured in constant currencies (cc) to remove the impact of exchange rate movements. Sales growth was driven by volume growth of 9 percentage points, mainly driven by Entresto, Zolgensma, Cosentyx, Ilaris and the Xiidra acquisition for the Novartis Pharmaceuticals business unit and Promacta/Revolade, Jakavi, Kisqali, Tafinlar + Mekinist and Piqray for the Novartis Oncology business unit. The strong volume growth was partly offset by the negative impacts of pric-ing (3 percentage points) and generic competition (3 per-centage points).
By division, Innovative Medicines delivered net sales of USD 39.0 billion (+3%, +4% cc). Sandoz net sales were USD 9.6 billion (–1%, 0% cc), impacted by ongoing dis-ruptions to hospitals and HCP practices due to COVID- 19, which limited patient access to treatments for our retail business across regions.
In Emerging Growth Markets, which comprise all mar-kets excluding the US, Canada, Western Europe, Japan, Australia and New Zealand, sales from continuing oper-ations were USD 11.9 billion (+1%, +6% cc) driven by China (USD 2.6 billion) growing 16%, (+16% cc).
Operating income from continuing operations was USD 10.2 billion (+12%, +19% cc), mainly driven by higher sales and productivity including lower spend. Operating income margin from continuing operations was 20.9% of net sales, increasing by 1.7 percentage point (+2.9 per-centage points cc).
Net income from continuing operations was USD 8.1 billion (+13%, +20% cc) mainly driven by higher operat-ing income. Earnings per share from continuing opera-tions were USD 3.55 (+14%, +21% cc), growing faster than net income and benefiting from lower weighted average number of shares outstanding.
Net cash flows from operating activities from con-tinuing operations amounted to USD 13.6 billion, com-pared to USD 13.5 billion in 2019. This increase was mainly driven by higher net income adjusted for non-cash items and other adjustments including divestment gains, partly offset by higher payments out of provisions related to legal matters.
Free cash flow from continuing operations amounted to USD 11.7 billion (–10%) compared to USD 12.9 billion in 2019, as higher operating income adjusted for non-cash items was more than offset by payments related to legal matters and lower divestment proceeds.
We also present our core results1, which exclude the impact of amortization, impairments, disposals, acquisi-tions, restructurings and other significant items, to help investors understand our underlying performance.
Core operating income from continuing operations was USD 15.4 billion (+9%, +13% cc) driven by sales growth, lower spend and productivity. Core operating income margin was 31.7% of net sales, increasing by 2.0 percentage points (+2.8 percentage points cc).
Core net income from continuing operations was USD 13.2 billion (+9%, +12% cc) mainly driven by growth in core operating income. Core earnings per share from continuing operations were USD 5.78 (+9%, +13% cc), growing faster than core net income benefiting from lower weighted average number of shares outstanding.
In 2020, there were no operational activities related to discontinued operations. In 2019, discontinued oper-ations net sales were USD 1.8 billion, operating income amounted to USD 71 million and net income from discon-tinued operations was USD 4.6 billion, including the non-taxable non-cash net gain on distribution of Alcon Inc. to Novartis AG shareholders which amounted to USD 4.7 billion.
For the total Group, net income amounted to USD 8.1 billion compared to USD 11.7 billion in the prior year, including the non-taxable non-cash net gain on distribu-tion of Alcon Inc. which amounted to USD 4.7 billion. Basic earnings per share were USD 3.55 compared to USD 5.12 in prior year. Cash flow from operating activi-ties for the total Group amounted to USD 13.6 billion and free cash flow to USD 11.7 billion.1 For an explanation of non-IFRS measures and reconciliation tables, see “Item 5.A
Operating results—Non-IFRS measures as defined by Novartis.”

Item 5. Operating and Financial Review and Prospects
55
Net sales by segment
The following table provides an overview of net sales to third parties by segment:
Change in
Change constant
Year ended Year ended in USD currencies
(USD millions) Dec 31, 2020 Dec 31, 2019 % %
Innovative Medicines 39 013 37 714 3 4
Sandoz 9 646 9 731 – 1 0
Net sales to third parties from continuing operations 48 659 47 445 3 3
Innovative Medicines
The Innovative Medicines Division delivered net sales of USD 39.0 billion in 2020, up 3% in reported terms and 4% in constant currencies (cc). The Novartis Pharmaceuticals business unit delivered net sales of USD 24.3 billion in 2020, growing 4% (+5% cc), driven by Entresto, Zolgensma, Cosentyx, Ilaris and the Xiidra acquisition. Growth was partly offset by declines in Gilenya, and lower demand for Lucentis due to COVID-19. Other Ophthalmology products were also impacted by both COVID-19 and generic competition. The Novartis Oncology business unit delivered net sales of USD 14.7 billion, growing 2% (+3% cc), driven by Promacta/Revolade, Jakavi, Kisqali, Tafinlar + Mekinist and Piqray, partially offset by generic competition for Afinitor and Exjade. Volume contributed 10 percentage points to
sales growth. Pricing had a negative impact of 3 percent-age points. Generic competition had a negative impact of 3 percentage points.
Regionally, US sales (USD 14.3 billion, +4%) delivered strong performance of Entresto, Zolgensma and Cosentyx. Europe sales (USD 13.5 billion, +5%, +4% cc) grew driven by Entresto, Zolgensma, Jakavi, Kisqali and Kymriah. Japan sales were USD 2.4 billion (0%, –3% cc) as growth was negatively impacted by the Galvus co-pro-motion agreement. Emerging Growth Markets sales grew 3% (+7% cc), led by double-digit growth in China, includ-ing the launches of Cosentyx and Entresto.
The following table provides an overview of net sales to third parties by business franchise in the Innovative Medicines Division:
Change in
Change constant
Year ended Year ended in USD currencies
(USD millions) Dec 31, 2020 Dec 31, 2019 % %
Total Novartis Oncology business unit 14 711 14 370 2 3
Total Novartis Pharmaceuticals business unit 24 302 23 344 4 5
Immunology, Hepatology and Dermatology 4 868 4 222 15 16
Ophthalmology 4 410 4 776 – 8 – 8
Neuroscience 4 323 3 773 15 14
Cardiovascular, Renal and Metabolism 2 498 1 750 43 42
Respiratory 1 900 1 825 4 5
Established Medicines 6 303 6 998 – 10 – 8
Total Innovative Medicines 39 013 37 714 3 4

Item 5. Operating and Financial Review and Prospects
56
The following table provides the top 20 Innovative Medicines Division product net sales in 2020 as well as the change compared to 2019:
US Rest of world Total
% % % % %
change change change change change
Brands Business franchise Indication USD m USD/cc 2 USD m USD cc 2 USD m USD cc 2
Psoriasis, ankylosing
spondylitis, psoriatic
Immunology, arthritis and
Hepatology and non-radiographic axial
Cosentyx Dermatology spondyloarthritis 2 516 13 1 479 11 12 3 995 13 13
Gilenya Neuroscience Relapsing multiple sclerosis 1 562 – 10 1 441 – 3 – 3 3 003 – 7 – 7
Cardiovascular, Renal
Entresto and Metabolism Chronic heart failure 1 277 38 1 220 52 52 2 497 45 44
Tasigna Oncology Chronic myeloid leukemia 859 7 1 099 2 3 1 958 4 5
Age-related
Lucentis Ophthalmology macular degeneration 1 933 – 7 – 8 1 933 – 7 – 8
Immune thrombocytopenia
(ITP), severe aplastic
Promacta/Revolade Oncology anemia (SAA) 833 21 905 25 26 1 738 23 23
BRAF V600+ metastatic
and adjuvant melanoma;
advanced non-small cell
Tafinlar + Mekinist Oncology lung cancer (NSCLC) 569 18 973 14 15 1 542 15 16
Carcinoid tumors
Sandostatin Oncology and acromegaly 837 – 5 602 – 14 – 13 1 439 – 9 – 8
Myelofibrosis (MF),
Jakavi Oncology polycythemia vera (PV) 1 339 20 20 1 339 20 20
Severe zllergic zsthma
(SAA), chronic spontaneous
Xolair 1 Respiratory urticaria (CSU) and nasal polyps 1 251 7 8 1 251 7 8
Galvus Group Established Medicines Type 2 diabetes 1 199 – 8 – 5 1 199 – 8 – 5
Chronic myeloid
Gleevec/Glivec Oncology leukemia and GIST 315 – 6 873 – 6 – 6 1 188 – 6 – 6
Afinitor/Votubia Oncology Breast cancer/TSC 644 – 36 439 – 18 – 17 1 083 – 30 – 29
Diovan Group Established Medicines Hypertension 124 44 879 – 10 – 8 1 003 – 6 – 4
Exforge Group Established Medicines Hypertension 16 23 964 – 5 – 3 980 – 4 – 3
Spinal muscular atrophy
Zolgensma Neuroscience (SMA) 459 50 461 nm nm 920 155 151
Immunology, Auto-inflammatory (CAPS,
Hepatology and TRAPS, HIDS/MKD, FMF, SJIA,
Ilaris Dermatology AOSD and gout) 400 32 473 29 30 873 30 31
HR+/HER2- metastatic
Kisqali Oncology breast cancer 318 27 369 60 65 687 43 45
Exjade/Jadenu Oncology Chronic iron overload 138 – 69 515 – 2 – 2 653 – 33 – 33
Votrient Oncology Renal cell carcinoma 259 – 22 376 – 11 – 10 635 – 16 – 15
Top 20 products total 11 126 3 18 790 6 7 29 916 5 5
Rest of portfolio 3 216 8 5 881 – 5 – 5 9 097 – 1 0
Total division sales 14 342 4 24 671 3 4 39 013 3 4
1 Net sales reflect Xolair sales for all indications.2 Constant currencies (cc) is a non-IFRS measure. For an explanation of non-IFRS measures, see “ —Item 5.A Operating results—Non-IFRS measures as defined by Novartis.”
For the table providing the top 20 Innovative Medicines Division product net sales in 2019, see “Item 18. Financial statements—Note 3. Segmentation of key figures 2020, 2019 and 2018.”
For information about the approved indications for certain products described, see “Item 4. Information on the Company—Item 4.B Business overview—Innovative Medicines— Innovative Medicines Division products.”
Novartis Oncology business unitTasigna (USD 2.0 billion, +4%, +5% cc) sales grew due to a strong performance in key markets including the US and China, partly offset by a decline in Europe.
Promacta/Revolade (USD 1.7 billion, +23%, +23% cc) grew across all regions, driven by increased use in
chronic immune thrombocytopenia (ITP) and as first-line treatment for severe aplastic anemia (SAA) in the US.
Tafinlar + Mekinist (USD 1.5 billion, +15%, +16% cc), the worldwide leader in BRAF/MEK-inhibition, continued to deliver strong growth driven by demand in adjuvant melanoma, as well as advanced NSCLC. Tafinlar +

Item 5. Operating and Financial Review and Prospects
57
Mekinist is the first and only targeted therapy to achieve five-year relapse-free survival (RFS) and overall survival (OS) data in the adjuvant and metastatic melanoma set-tings, respectively.
Sandostatin (USD 1.4 billion, –9%, –8% cc) sales declined due to ongoing competitive pressure in Europe, US and Japan. The brand was also impacted by generic competition in Europe.
Jakavi (USD 1.3 billion, +20%, +20% cc) growth was driven by strong demand in the myelofibrosis and poly-cythemia vera indications. Data readouts from two Phase III studies (REACH2 and REACH3) showed Jakavi sig-nificantly improved outcomes in patients with steroid-re-sistant/dependent graft-versus-host disease (GvHD) compared to best available therapy. Regulatory filings based on the GvHD data are planned for 2021.
Gleevec/Glivec (USD 1.2 billion, –6%, –6% cc) declined due to increased generic competition.
Afinitor/Votubia (USD 1.1 billion, –30%, –29% cc) declined due to generic competition in the US, Europe and Emerging Growth Markets.
Kisqali (USD 687 million, +43%, +45% cc) continued strong growth across all geographies benefiting from the impact of positive overall survival (OS) data from two pivotal Phase III trials (MONALEESA-7 and MONA-LEESA-3). Kisqali stands apart as the only CDK4/6 inhib-itor that significantly improves OS in two large Phase III trials, regardless of metastatic sites, endocrine treat-ment (ET) resistance, ET partner, treatment line or meno-pausal status, while maintaining quality of life.
Exjade/Jadenu (USD 653 million, –33%, –33% cc) declined mainly due to pressure from generic competi-tion in the US and other regions.
Votrient (USD 635 million, –16%, –15% cc) declined due to increased competition in Europe and the US.
Kymriah (USD 474 million, +71%, +68% cc) grew strongly in Europe, US and Japan. Coverage continued to expand, with more than 280 qualified treatment cen-ters and 27 countries having coverage for at least one indication. FDA granted Regenerative Medicine Advanced Therapy designation and orphan drug status for Kymriah in follicular lymphoma. At the interim analy-sis, the Phase II ELARA trial in patients with relapsed or refractory follicular lymphoma met its primary endpoint of complete response rate. Regulatory approvals in Swit-zerland, France and Japan expanded manufacturing capabilities for Kymriah to meet increased demand.
Lutathera (USD 445 million, +1%, +1% cc) sales were broadly in line with prior year, as the COVID-19 pandemic had an impact on the brand. There are 384 total centers now actively treating patients. Sales from all AAA brands (including Lutathera and radiopharmaceutical diagnos-tic products) were USD 681 million.
Piqray (USD 320 million, +176%, +176% cc) grew sig-nificantly in the US as the launch roll out continued. Piqray in combination with fulvestrant received European Com-mission (EC) approval to treat HR+/HER2- advanced breast cancer with a PIK3CA mutation. Piqray is the first and only therapy specifically developed for the approx-imately 40% of HR+/HER2- advanced breast cancer patients who have a PIK3CA mutation, which is associ-ated with poor prognosis. Piqray is now approved in more
than 50 countries, including the US and EU member states. Piqray launched in the US in June 2019.
Adakveo (USD 105 million) US launch continued to progress well, with more than 600 accounts purchasing Adakveo to date. Payer coverage decisions expanded, both in Medicaid and commercial (with 94% coverage among commercial plans to date). Following approval in Europe in Q4, reimbursement discussions with individ-ual countries are underway.
Tabrecta (USD 35 million) US launch progressed well. Ninety leading lung cancer institutions have started patients on treatment. Tabrecta is the first and only ther-apy approved by the US FDA to specifically target met-astatic NSCLC with a mutation that leads to MET exon 14 skipping (METex14), as detected by an FDA-approved test. Tabrecta also secured regulatory approval in Japan.
Novartis Pharmaceuticals business unit
Immunology, Hepatology and DermatologySales in the Immunology, Hepatology and Dermatology franchise reached USD 4.9 billion (+15%, +16% cc), of which Cosentyx delivered USD 4.0 billion.
Cosentyx (USD 4.0 billion, +13%, +13% cc) saw con-tinued growth across indications despite lower new patient starts across the market in dermatology and rheumatology in most geographies due to COVID-19. In the second quarter, Cosentyx received approval and launched in the EU and US for non-radiographic axial spondyloarthritis (nr-axSpA), its fourth major indication, and in August became the first treatment approved in Japan for this indication. In April, Cosentyx also became the first IL17A inhibitor approved in China for the treat-ment of AS. In July, Cosentyx received EU approval as a first-line systemic treatment for pediatric psoriasis. In November, Cosentyx received EC approval for a new 300 mg autoinjector and pre-filled syringe, which enable the 300 mg dose to be administered in a single injection. In China, Cosentyx has been listed in the National Reim-bursement Drug List (NRDL) as the only interleukin inhib-itor with planned execution March 1, 2021
Ilaris (USD 873 million, +30%, +31% cc) sales were driven by strong double-digit volume growth, particularly coming from the US, Europe and Japan. In June, Ilaris was granted a new indication in the US for active Still’s disease including Adult-Onset Still’s Disease (AOSD); this is in addition to its previously-granted indication for systemic juvenile idiopathic arthritis (SJIA). Ilaris is the first FDA-approved treatment for AOSD.
OphthalmologySales in the Ophthalmology franchise were USD 4.4 bil-lion (–8%, –8% cc) and were impacted by the COVID-19 pandemic.
Lucentis (USD 1.9 billion, –7%, –8% cc) sales declined due to the negative impact of the COVID-19 pandemic, which has significantly disrupted ophthalmology prac-tices and limited patient access to treatment of retinal diseases. Sales have been consistently recovering from the COVID-19 impact since May until the end of the third quarter, and showed less impact of the pandemic in the fourth quarter compared to the second quarter.

Item 5. Operating and Financial Review and Prospects
58
Xiidra (USD 376 million, +96%, +95% cc) was impacted by COVID-19 pandemic as ophthalmology visits declined significantly. In the latter part of the second quarter, the US dry eye market began to rebound as eye care prac-tices began opening. Novartis has informed the Euro-pean Medicines Agency of its decision to withdraw the centralized application for Marketing Authorization of Xiidra. Novartis acquired Xiidra from Takeda and began recording sales as of July 1, 2019.
Beovu (USD 190 million) launch roll-out continued, with approval now in 57 countries. Post marketing case reports termed as “retinal vasculitis” and/or “retinal vas-cular occlusion” that may result in severe vision loss, typ-ically associated with intraocular inflammation, and the COVID-19 pandemic had an unfavorable impact on sales. Novartis has a comprehensive plan, in strong collabora-tion with leading external global experts to educate the retina community about the positive benefit / risk profile of Beovu.
Other Ophthalmology products declined due to the negative impact of the COVID-19 pandemic and generic impacts in the US, primarily for Travatan and Ciprodex.
NeuroscienceSales in the Neuroscience franchise were USD 4.3 bil-lion (+15%, +14% cc), mainly driven by the sales growth of Zolgensma, partly offset by sales decline of Gilenya.
Gilenya (USD 3.0 billion, –7%, –7% cc) sales declined due to increased competition and the impact of the COVID-19 pandemic. Gilenya remains the top prescribed high efficacy therapy in 41 countries and the only one approved to treat pediatric RMS.
Zolgensma (USD 920 million, +155%, +151% cc) deliv-ered significant growth despite the negative impact of the COVID-19 pandemic in the US and ex-US, with geo-graphic expansion in Europe and Japan contributing strongly. Reimbursement is now secured in six countries, with access pathways in nine EU countries through our Day One Access initiative representing approximately 25% of the EU population. As anticipated, there was a shift from prevalent patients to incident patients in all markets post launch, with increased newborn screening in the US contributing to growth. Zolgensma recent approvals include Brazil, Israel, Canada and Taiwan. Zolgensma is viewed as an essential one-time treatment and is the only therapy for spinal muscular atrophy (SMA) that addresses the genetic root cause of SMA by replac-ing the function of the missing SMN1 gene. Its clinical profile and one-time dosing are anticipated to remain dif-ferentiators for both physicians and patients when mak-ing a treatment choice. Zolgensma launched in the US in June 2019.
Mayzent (USD 170 million) continued to grow steadily. Growth was driven by fulfilling an important unmet need in patients showing signs of progression despite being on other treatments. Mayzent is the first and only oral DMT studied and proven to delay disease progression in a broad SPMS patient population. In addition to the US and EU, Mayzent is now approved in the UK, Australia, Canada, Japan and Switzerland.
Aimovig (USD 164 million, ex-US, ex-Japan, +59%, +57% cc) is the most prescribed anti-CGRP worldwide, with more than half a million patients prescribed world-wide in the post-trial setting. Aimovig is co-commercial-
ized with Amgen in the US, where Amgen records sales. Novartis has exclusive rights and records sales in all ex-US territories excluding Japan. During the ongoing litigation between the companies the collaboration con-tinues and will remain in force until a final court decision.
Kesimpta (ofatumumab, formerly OMB157) (USD 15 million) was launched in the US following FDA approval in August. To initiate access, we are providing Kesimpta free of charge to US patients who are eligible for reim-bursement until they are covered by their insurance. Kes-impta is a targeted B-cell therapy that can deliver sus-tained high efficacy, with a favorable safety profile and the flexibility of an at home self-administration for a broad population of RMS patients. We have seen a promising start with our flexible hybrid face-to-face / digital launch.
Cardiovascular, Renal and MetabolismSales in the Cardiovascular, Renal and Metabolism fran-chise were USD 2.5 billion (+43%, +42% cc).
Entresto (USD 2.5 billion, +45%, +44% cc) sustained strong growth with increased patient share across mar-kets, driven by demand as the essential first choice ther-apy for HF patients (reduced ejection fraction). Entresto was successfully launched in Japan in August. FDA Car-diovascular and Renal Drugs Advisory Committee voted 12 to 1 to support the use of Entresto in treatment of patients with heart failure with preserved ejection frac-tion (HFpEF). Expected FDA approval has the potential to make Entresto the first therapy indicated for both HFpEF and HFrEF in the US, and a final decision is expected in the first quarter of 2021.
RespiratorySales in the Respiratory franchise were USD 1.9 billion (+4%, +5% cc), of which Xolair delivered USD 1.3 billion.
Xolair (USD 1.3 billion, +7%, +8% cc) continued growth in the severe allergic asthma (SAA) and chronic sponta-neous urticaria (CSU) indications. In the first half 2020, Xolair received approval from the US and the European Commission (EC) for a new indication to treat severe chronic rhinosinusitis with nasal polyps (CRSwNP). Novartis co-promotes Xolair with Genentech in the US and shares a portion of operating income, but we do not record any US sales.
Ultibro Group (USD 623 million, –1%, –1% cc) sales were broadly in line with prior year, as strong Ultibro Bree-zhaler sales were offset by the decline in Seebri Bree-zhaler and Onbrez Breezhaler. Ultibro Group consists of inhaled COPD therapies Ultibro Breezhaler, Seebri Bree-zhaler and Onbrez Breezhaler.
Enerzair Group consists of Enerzair Breezhaler and Atectura Breezhaler. Enerzair Breezhaler (indacaterol / glycopyrronium bromide / mometasone, formerly known as QVM149) is an inhaled LABA/LAMA/ICS combina-tion for patients whose asthma is uncontrolled with LABA/ICS. Atectura Breezhaler (indacaterol / mometa-sone, formerly known as QMF149) is a LABA/ICS fixed-dose combination for patients whose asthma is uncon-trolled with SABA and ICS. Both medicines were approved in the EU, Japan, Canada, Australia, Switzerland and South Korea in 2020, together with the digital compan-ion (sensor and app) for Enerzair Breezhaler in the EU and Switzerland. They have been launched to date in seven markets, including Germany, Japan and the UK.

Item 5. Operating and Financial Review and Prospects
59
Established MedicinesThe Established Medicines franchise had sales of USD 6.3 billion (–10%, –8% cc).
Galvus Group (USD 1.2 billion, –8%, –5% cc) declined primarily due to generic competition in Emerging Growth Markets and pricing impact from our co-promotion agreement in Japan that started in 2019.
Diovan Group (USD 1.0 billion, –6%, –4% cc) declined mainly due to generic competition and the impact of VBP in China.
Exforge Group (USD 980 million, –4%, –3% cc) declined in Europe due to generic competition, partly offset by growth in China.
Zortress/Certican (USD 452 million, –7%, –7% cc) declined mainly due to generic competition in the US.
Neoral/Sandimmun(e) (USD 393 million, –6%, –6% cc) declined mainly due to generic competition and man-datory price reductions.
Voltaren/Cataflam (USD 360 million, –14%, –12% cc) declined mainly due to generic competition and external supply issues following the COVID-19 pandemic.
Sandoz
Net sales were USD 9.6 billion (–1%, 0% cc) with volume growth of 2 percentage points despite the COVID-19 impacts. There was a negative price effect of 2 percent-age points, despite the benefit from off-contract sales and favorable revenue deduction adjustments.
Sales in Europe were USD 5.2 billion (+2%, +2% cc). Sales in the US were USD 2.1 billion (–14%), due to the continued volume decline in oral solids including part-nership terminations. Sales in Asia / Africa / Australasia were USD 1.5 billion (+12%, +11% cc) including the con-tribution from the Aspen Japan acquisition. Sales in Can-ada and Latin America were USD 772 million (–2%, +8% cc).
The following table provides an overview of net sales to third parties by business franchise in the Sandoz Divi-sion:
Change in
Change constant
Year ended Year ended in USD currencies
(USD millions) Dec 31, 2020 Dec 31, 2019 % %
Retail Generics1 7 244 7 590 – 5 – 4
Biopharmaceuticals 1 928 1 607 20 19
Anti-Infectives
(partner label/API) 474 534 – 11 – 12
Total Sandoz 9 646 9 731 – 1 0
1 Of which USD 694 million (2019: USD 784 million) represents anti-infectives sold under the Sandoz name
Retail Generics In Retail Generics, Sandoz develops, manufactures and markets active ingredients and finished dosage forms of small molecule pharmaceuticals to third parties across
a broad range of therapeutic areas, as well as finished dosage form of anti-infectives sold to third parties.
Retail Generics sales were USD 7.2 billion (–5%, –4% cc) impacted by the declines in the US and COVID-19 related impact across regions.
BiopharmaceuticalsIn Biopharmaceuticals, Sandoz develops, manufactures and markets protein- and other biotechnology-based products, including biosimilars, and provides biotechnol-ogy manufacturing services to other companies. The Biopharmaceuticals business also includes Glatopa, a generic version of Copaxone®, which treats relapsing forms of multiple sclerosis and is marketed in the US.
Global sales of Biopharmaceuticals (biosimilars, bio-pharmaceutical contract manufacturing and Glatopa) grew to USD 1.9 billion (+20%, +19% cc), driven by con-tinued double-digit growth in Europe from Hyrimoz (adali-mumab), Erelzi (etanercept) and Zessly (infliximab) and growth from Omnitrope (somatropin) across all regions. Launch roll-outs in other geographies also contributed to growth.
Anti-InfectivesIn Anti-Infectives, Sandoz manufactures and supplies active pharmaceutical ingredients and intermediates, mainly antibiotics, for internal use by Retail Generics and for sale to third-party customers.
Total Anti-Infectives franchise sales were USD 1.2 bil-lion (–11%, –11% cc) including finished dosage forms sold under the Sandoz name (USD 694 million, –11%, –10% cc) and Anti-Infectives sold to third parties for sale under their own name (USD 474 million, –11%, –12% cc), which were impacted by a planned contract discontinuation.
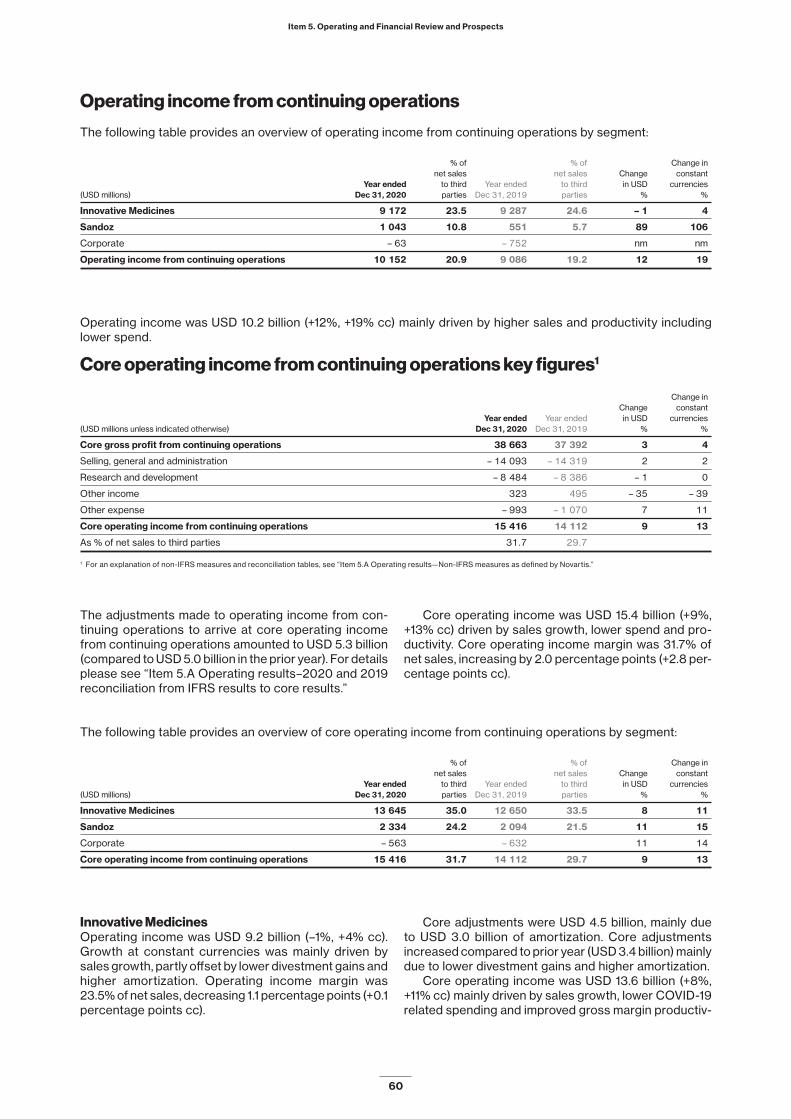
Item 5. Operating and Financial Review and Prospects
60
Operating income from continuing operations
The following table provides an overview of operating income from continuing operations by segment:
% of % of Change in
net sales net sales Change constant
Year ended to third Year ended to third in USD currencies
(USD millions) Dec 31, 2020 parties Dec 31, 2019 parties % %
Innovative Medicines 9 172 23.5 9 287 24.6 – 1 4
Sandoz 1 043 10.8 551 5.7 89 106
Corporate – 63 – 752 nm nm
Operating income from continuing operations 10 152 20.9 9 086 19.2 12 19
Operating income was USD 10.2 billion (+12%, +19% cc) mainly driven by higher sales and productivity including lower spend.
Core operating income from continuing operations key figures1
Change in
Change constant
Year ended Year ended in USD currencies
(USD millions unless indicated otherwise) Dec 31, 2020 Dec 31, 2019 % %
Core gross profit from continuing operations 38 663 37 392 3 4
Selling, general and administration – 14 093 – 14 319 2 2
Research and development – 8 484 – 8 386 – 1 0
Other income 323 495 – 35 – 39
Other expense – 993 – 1 070 7 11
Core operating income from continuing operations 15 416 14 112 9 13
As % of net sales to third parties 31.7 29.7
1 For an explanation of non-IFRS measures and reconciliation tables, see “Item 5.A Operating results—Non-IFRS measures as defined by Novartis.”
The adjustments made to operating income from con-tinuing operations to arrive at core operating income from continuing operations amounted to USD 5.3 billion (compared to USD 5.0 billion in the prior year). For details please see “Item 5.A Operating results–2020 and 2019 reconciliation from IFRS results to core results.”
Core operating income was USD 15.4 billion (+9%, +13% cc) driven by sales growth, lower spend and pro-ductivity. Core operating income margin was 31.7% of net sales, increasing by 2.0 percentage points (+2.8 per-centage points cc).
The following table provides an overview of core operating income from continuing operations by segment:
% of % of Change in
net sales net sales Change constant
Year ended to third Year ended to third in USD currencies
(USD millions) Dec 31, 2020 parties Dec 31, 2019 parties % %
Innovative Medicines 13 645 35.0 12 650 33.5 8 11
Sandoz 2 334 24.2 2 094 21.5 11 15
Corporate – 563 – 632 11 14
Core operating income from continuing operations 15 416 31.7 14 112 29.7 9 13
Innovative MedicinesOperating income was USD 9.2 billion (–1%, +4% cc). Growth at constant currencies was mainly driven by sales growth, partly offset by lower divestment gains and higher amortization. Operating income margin was 23.5% of net sales, decreasing 1.1 percentage points (+0.1 percentage points cc).
Core adjustments were USD 4.5 billion, mainly due to USD 3.0 billion of amortization. Core adjustments increased compared to prior year (USD 3.4 billion) mainly due to lower divestment gains and higher amortization.
Core operating income was USD 13.6 billion (+8%, +11% cc) mainly driven by sales growth, lower COVID-19 related spending and improved gross margin productiv-
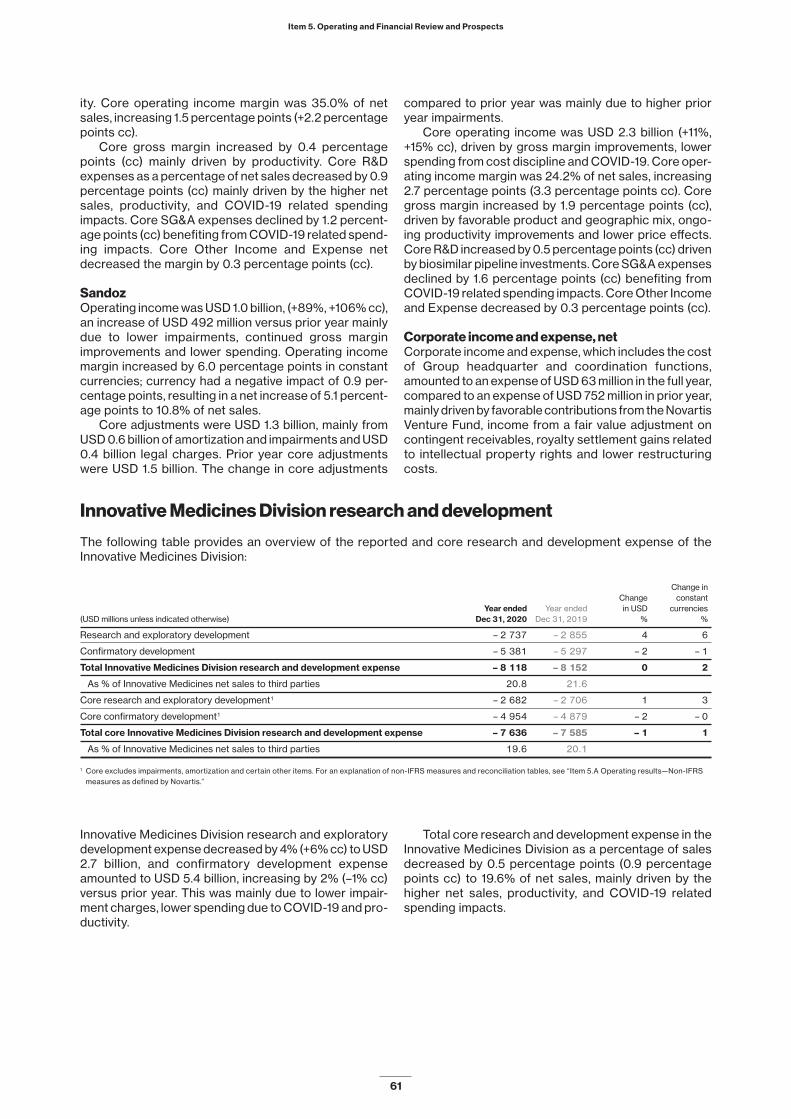
Item 5. Operating and Financial Review and Prospects
61
ity. Core operating income margin was 35.0% of net sales, increasing 1.5 percentage points (+2.2 percentage points cc).
Core gross margin increased by 0.4 percentage points (cc) mainly driven by productivity. Core R&D expenses as a percentage of net sales decreased by 0.9 percentage points (cc) mainly driven by the higher net sales, productivity, and COVID-19 related spending impacts. Core SG&A expenses declined by 1.2 percent-age points (cc) benefiting from COVID-19 related spend-ing impacts. Core Other Income and Expense net decreased the margin by 0.3 percentage points (cc).
SandozOperating income was USD 1.0 billion, (+89%, +106% cc), an increase of USD 492 million versus prior year mainly due to lower impairments, continued gross margin improvements and lower spending. Operating income margin increased by 6.0 percentage points in constant currencies; currency had a negative impact of 0.9 per-centage points, resulting in a net increase of 5.1 percent-age points to 10.8% of net sales.
Core adjustments were USD 1.3 billion, mainly from USD 0.6 billion of amortization and impairments and USD 0.4 billion legal charges. Prior year core adjustments were USD 1.5 billion. The change in core adjustments
compared to prior year was mainly due to higher prior year impairments.
Core operating income was USD 2.3 billion (+11%, +15% cc), driven by gross margin improvements, lower spending from cost discipline and COVID-19. Core oper-ating income margin was 24.2% of net sales, increasing 2.7 percentage points (3.3 percentage points cc). Core gross margin increased by 1.9 percentage points (cc), driven by favorable product and geographic mix, ongo-ing productivity improvements and lower price effects. Core R&D increased by 0.5 percentage points (cc) driven by biosimilar pipeline investments. Core SG&A expenses declined by 1.6 percentage points (cc) benefiting from COVID-19 related spending impacts. Core Other Income and Expense decreased by 0.3 percentage points (cc).
Corporate income and expense, netCorporate income and expense, which includes the cost of Group headquarter and coordination functions, amounted to an expense of USD 63 million in the full year, compared to an expense of USD 752 million in prior year, mainly driven by favorable contributions from the Novartis Venture Fund, income from a fair value adjustment on contingent receivables, royalty settlement gains related to intellectual property rights and lower restructuring costs.
Innovative Medicines Division research and development
The following table provides an overview of the reported and core research and development expense of the Innovative Medicines Division:
Change in
Change constant
Year ended Year ended in USD currencies
(USD millions unless indicated otherwise) Dec 31, 2020 Dec 31, 2019 % %
Research and exploratory development – 2 737 – 2 855 4 6
Confirmatory development – 5 381 – 5 297 – 2 – 1
Total Innovative Medicines Division research and development expense – 8 118 – 8 152 0 2
As % of Innovative Medicines net sales to third parties 20.8 21.6
Core research and exploratory development1 – 2 682 – 2 706 1 3
Core confirmatory development1 – 4 954 – 4 879 – 2 – 0
Total core Innovative Medicines Division research and development expense – 7 636 – 7 585 – 1 1
As % of Innovative Medicines net sales to third parties 19.6 20.1
1 Core excludes impairments, amortization and certain other items. For an explanation of non-IFRS measures and reconciliation tables, see “Item 5.A Operating results—Non-IFRS measures as defined by Novartis.”
Innovative Medicines Division research and exploratory development expense decreased by 4% (+6% cc) to USD 2.7 billion, and confirmatory development expense amounted to USD 5.4 billion, increasing by 2% (–1% cc) versus prior year. This was mainly due to lower impair-ment charges, lower spending due to COVID-19 and pro-ductivity.
Total core research and development expense in the Innovative Medicines Division as a percentage of sales decreased by 0.5 percentage points (0.9 percentage points cc) to 19.6% of net sales, mainly driven by the higher net sales, productivity, and COVID-19 related spending impacts.

Item 5. Operating and Financial Review and Prospects
62
Non-operating income and expense
The term “non-operating income and expense” includes all income and expense items outside operating income. The following table provides an overview of non-operating income and expense from continuing operations:
Change in
Change constant
Year ended Year ended in USD currencies
(USD millions unless indicated otherwise) Dec 31, 2020 Dec 31, 2019 % %
Operating income from continuing operations 10 152 9 086 12 19
Income from associated companies 673 659 2 2
Interest expense – 869 – 850 – 2 – 4
Other financial income and expense – 78 45 nm nm
Income before taxes from continuing operations 9 878 8 940 10 17
Taxes – 1 807 – 1 793 – 1 – 7
Net income from continuing operations 8 071 7 147 13 20
Net loss from discontinued operations
before gain on distribution of Alcon Inc.
to Novartis AG shareholders – 101 nm nm
Gain on distribution of Alcon Inc.
to Novartis AG shareholders 4 691 nm nm
Net income from discontinued operations 4 590 nm nm
Net income 8 071 11 737 – 31 – 27
Attributable to:
Shareholders of Novartis AG 8 072 11 732 – 31 – 27
Non-controlling interests – 1 5 nm nm
Basic earnings per share from continuing operations (USD) 3.55 3.12 14 21
Basic earnings per share from discontinued operations (USD) 2.00 nm nm
Total basic earnings per share (USD) 3.55 5.12 – 31 – 26
nm = not meaningful
Income from associated companiesIncome from associated companies amounted to USD 673 million in 2020 compared to USD 659 million in the prior year. This comprises mainly the share of income from Roche amounting to USD 677 million, which was broadly in line with the prior year amount of USD 662 million.
Interest expense and other financial income and expenseInterest expense increased to USD 869 million from USD 850 million in the prior year, mainly due to an increase in interest expense from discounting long term liabilities.
Other financial income and expense amounted to a loss of USD 78 million compared to an income of USD 45 million in prior year mainly due to lower interest income in 2020.
TaxesThe tax rate for continuing operations was 18.3% com-pared to 20.1% in the prior year. The current year tax rate
was impacted by the effect of non-deductible legal charges and uncertain tax positions. The prior year tax rate was impacted by a one-time, non-cash deferred tax expense resulting from legal entity reorganizations, a prior year item and an increase to an uncertain tax posi-tion, partially offset by the deferred tax credit from Swiss tax reform.
Excluding these impacts, the rate from continuing operations would have been 15.6% compared to 15.4% in the prior year. The increase from prior year was mainly the result of a change in profit mix.
Net income from continuing operationsNet income was USD 8.1 billion (+13%, +20% cc) mainly driven by higher operating income.
Earnings per shareBasic earnings per share from continuing operations were USD 3.55 (+14%, +21% cc), growing faster than net income and benefiting from lower weighted average number of shares outstanding.

Item 5. Operating and Financial Review and Prospects
63
Core non-operating income and expense from continuing operations1
The following table provides an overview of core non-operating income and expense from continuing operations:
Change in
Change constant
Year ended Year ended in USD currencies
(USD millions unless indicated otherwise) Dec 31, 2020 Dec 31, 2019 % %
Core operating income from continuing operations 15 416 14 112 9 13
Core income from associated companies 1 097 1 086 1 1
Core interest expense – 869 – 850 – 2 – 4
Core other financial income and expense – 83 56 nm nm
Core income before taxes from continuing operations 15 561 14 404 8 11
Core taxes – 2 403 – 2 300 – 4 – 8
Core net income from continuing operations 13 158 12 104 9 12
Core basic earnings per share from continuing operations (USD) 5.78 5.28 9 13
1 For an explanation of non-IFRS measures and reconciliation tables, see “Item 5.A Operating results—Non-IFRS measures as defined by Novartis.”
Core income from associated companiesCore income from associated companies was USD 1.1 billion in 2020, in line with the prior year, mainly driven by the core income contribution from Roche.
Core interest expense and other financial income and expenseCore interest expense increased to USD 869 million from USD 850 million in the prior year, mainly due to an increase in interest expense from discounting long term liabilities. Core other financial income and expense amounted to a loss of USD 83 million compared to an income of USD 56 million in prior year mainly due to lower interest income in 2020.
Core taxesThe core tax rate from continuing operations (core taxes as a percentage of core income before tax from continu-ing operations) was 15.4% compared to 16.0% in the prior year mainly as a result of a change in profit mix.
Core net income Core net income was USD 13.2 billion (+9%, +12% cc) mainly driven by growth in core operating income.
Core earnings per shareCore earnings per share were USD 5.78 (+9%, +13% cc), growing faster than core net income and benefiting from lower weighted average number of shares outstanding.
Discontinued operations
Discontinued operations include the business of Alcon and certain corporate costs directly attributable to Alcon up to the spin-off date. As the Alcon spin-off was com-pleted on April 9, 2019, the prior year included three months of operating results of the divested business.
In 2020, there were no operational activities related to discontinued operations. In 2019, discontinued oper-ations net sales were USD 1.8 billion, operating income amounted to USD 71 million and net income from discon-tinued operations was USD 4.6 billion, including the non-taxable non-cash net gain on distribution of Alcon Inc. to Novartis AG shareholders which amounted to USD 4.7 billion.
For further details, see “Item 18. Financial State-ments—Note 1. Significant accounting policies—Distri-bution of Alcon Inc. to Novartis AG shareholders,” “Item 18. Financial Statements—Note 2. Significant transac-tions—Significant transactions in 2019—Completion of the spin-off of the Alcon business through a dividend in kind distribution to Novartis AG shareholders,” and “Item 18. Financial Statements—Note 30. Discontinued oper-ations.”
Total Group
For the total Group, net income amounted to USD 8.1 bil-lion compared to USD 11.7 billion in the prior year, includ-ing the non-taxable non-cash net gain on distribution of Alcon Inc. which amounted to USD 4.7 billion. Basic earn-ings per share were USD 3.55 compared to USD 5.12 in prior year. Cash flow from operating activities for the total Group amounted to USD 13.6 billion and free cash flow to USD 11.7 billion.

Item 5. Operating and Financial Review and Prospects
64
Factors affecting comparability of year-on-year results of operationsSignificant transactions in 2020 and 2019
The comparability of the year-on-year results of our operations for the total Group can be significantly affected by acquisitions and divestments. As part of our
long-term strategy to focus Novartis as a leading medicines company, we announced and/or completed several acquisitions and divestments during 2020 and 2019.
A detailed description of significant transactions in 2020 and 2019, can be found in “Item 18. Financial State-ments—Note 2. Significant transactions.”
Critical accounting policies and estimates
Our significant accounting policies which are prepared in accordance with International Financial Reporting Standards (IFRS) as issued by the International Account-ing Standards Board (IASB) are set out in “Item 18. Finan-cial Statements—Note 1. Significant accounting policies.”
Given the uncertainties inherent in our business activ-ities, we must make certain estimates and assumptions that require difficult, subjective and complex judgments. Because of uncertainties inherent in such judgments, actual outcomes and results may differ from our assump-tions and estimates, which could materially affect the Group’s consolidated financial statements. Application of the following accounting policies requires certain assumptions and estimates that have the potential for the most significant impact on our consolidated financial statements.
Deductions from revenues
As is typical in the pharmaceutical industry, our gross sales are subject to various deductions, which are pri-marily composed of rebates and discounts to retail cus-tomers, government agencies, wholesalers, health insur-ance companies and managed healthcare organizations. These deductions represent estimates of the related obligations, requiring the use of judgment when estimat-ing the effect of these sales deductions on gross sales for a reporting period. These adjustments are deducted from gross sales to arrive at net sales.
The following summarizes the nature of some of these deductions and how the deduction is estimated. After recording these, net sales represent our best esti-mate of the cash that we expect to ultimately collect. The US market has the most complex arrangements related to revenue deductions.
United States-specific healthcare plans and program rebatesThe United States Medicaid Drug Rebate Program is administered by state governments, using state and fed-eral funds to provide assistance to certain vulnerable and needy individuals and families. Calculating the rebates to be paid related to this program involves inter-preting relevant regulations, which are subject to chal-lenge or change in interpretative guidance by govern-ment authorities. Provisions for estimating Medicaid rebates are calculated using a combination of historical
experience, product and population growth, product pricing, and the mix of contracts and specific terms in the individual state agreements.
The United States Federal Medicare Program, which funds healthcare benefits to individuals aged 65 and older, and to people with certain disabilities, provides prescription drug benefits under the Part D section of the program. This benefit is provided and administered through private prescription drug plans. Provisions for estimating Medicare Part D rebates are calculated based on the terms of individual plan agreements, product sales and population growth, product pricing, and the mix of contracts.
We offer rebates to key managed healthcare and pri-vate plans in an effort to ensure patient access to our products and to sustain and increase the market share of our products. These programs provide a rebate after the plans have demonstrated they have met all terms and conditions set forth in their contract with us.
These rebates are estimated based on the terms of individual agreements, historical experience, product pricing and projected product growth rates, and are recorded as a deduction from revenue at the time the related revenues are recorded.
These provisions are adjusted based on established processes and experiences from filing data with individ-ual states and plans. There is often a time lag of several months between recording of the revenue deductions and the final accounting for them.
Non-United States-specific healthcare plans and program rebatesIn certain countries other than the US, we provide rebates to governments and other entities. These rebates are often mandated by laws or government regulations. These rebates are estimated based on government reg-ulations, laws and terms of individual rebate arrange-ments, historical experience and other relevant factors, and are recorded as a deduction from revenue at the time the related revenue is recorded. These estimates are adjusted periodically to reflect actual experience. There is often a time lag of several months between the recording of revenue deductions and the final account-ing for them.
Innovative pay-for-performance arrangementsIn several countries, we enter into innovative pay-for-per-formance arrangements (i.e. outcome based arrange-

Item 5. Operating and Financial Review and Prospects
65
ments) with certain healthcare providers. Under these agreements, we may be required to make refunds to the healthcare providers or to provide additional medicines free of charge if anticipated treatment outcomes do not meet predefined targets. The impact of potential refunds or the delivery of additional medicines at no cost is esti-mated and recorded as a deduction from revenue at the time the related revenues are recorded. Estimates are based on historical experience and clinical data. In cases where historical experience and clinical data are not suf-ficient for a reliable estimation of the outcome, revenue recognition is deferred until such history is available.
There is often a time lag of several months between recording of the revenue deductions and the final accounting for them.
Non-healthcare plans and program rebates, returns and other deductionsWe offer rebates to purchasing organizations and other direct and indirect customers to sustain and increase market share and to ensure patient access to our prod-ucts. Since rebates are contractually agreed upon, the related provisions are estimated based on the terms of the individual agreements, historical experience and pro-jected product sales growth rates.
Chargebacks occur where our subsidiaries have arrangements with indirect customers to sell products at prices that are lower than the price charged to whole-salers. A chargeback represents the difference between the invoice price to the wholesaler and the indirect cus-tomer’s contract price. We account for chargebacks by reducing revenue by the estimate of chargebacks attrib-utable to a sales transaction. Provisions for estimated chargebacks are calculated using a combination of fac-tors, such as historical experience, product growth rates, product pricing, level of inventory in the distribution chan-nel, and the terms of individual agreements.
When we sell a product providing a customer the right to return it, we record a provision for estimated sales returns based on our sales return policy and historical return rates. Other factors considered include actual product recalls, expected marketplace changes, the remaining shelf life of the product, and the expected entry of generic products. In 2020, sales returns amounted to approximately 1% of gross product sales. If sufficient experience is not available, sales are only
recorded based on evidence of product consumption or when the right of return has expired.
We enter into distribution service agreements with major wholesalers, which provide a financial disincentive for the wholesalers to purchase product quantities in excess of current customer demand. Where possible, we adjust shipping patterns for our products to maintain wholesalers’ inventory levels consistent with underlying patient demand.
We offer cash discounts to customers to encourage prompt payment. Cash discounts are estimated and accrued at the time of invoicing and are deducted from revenue.
Following a decrease in the price of a product, we generally grant customers a “shelf stock adjustment” for their existing inventory for the relevant product. Provi-sions for shelf stock adjustments, which are primarily relevant within the Sandoz Division, are determined at the time of the price decline or at the point of sale, if the impact of a price decline on the products sold can be reasonably estimated based on the customer’s inventory levels of the relevant product.
Other sales discounts, such as consumer coupons and copay discount cards, are offered in some markets. The estimated amounts of these discounts are recorded at the time of sale or when the coupons are issued, and are estimated utilizing historical experience and the spe-cific terms for each program. If a discount for a proba-ble future transaction is offered as part of a sales trans-action, then an appropriate portion of revenue is deferred to cover this estimated obligation.
In addition, we offer global patient assistance pro-grams.
We adjust provisions for revenue deductions period-ically to reflect actual experience. To evaluate the ade-quacy of provision balances, we use internal and exter-nal estimates of the inventory in transit, the level of inventory in the distribution and retail channels, actual claims data received, and the time lag for processing rebate claims. External data sources include reports from wholesalers and third-party market data purchased by Novartis.
For the table showing the worldwide extent of our revenue deductions provisions and related payment experiences for the Group see “Item 18. Financial State-ments—Note 22. Provisions and other current liabilities.”
Gross-to-net sales reconciliationThe table below shows the gross-to-net sales reconciliation for our Innovative Medicines Division:
In % of In % of
gross sales gross sales
to third to third
(USD millions) 2020 parties 2019 parties
Innovative Medicines gross sales subject to deductions 56 067 100.0 52 956 100.0
US-specific healthcare plans and program rebates – 5 412 – 9.7 – 4 824 – 9.1
Non-US-specific healthcare plans and program rebates – 3 746 – 6.7 – 3 438 – 6.5
Non-healthcare plans and program-related rebates,
returns and other deductions – 7 896 – 14.0 – 6 980 – 13.2
Total Innovative Medicines gross-to-net sales adjustments – 17 054 – 30.4 – 15 242 – 28.8
Innovative Medicines net sales 39 013 69.6 37 714 71.2

Item 5. Operating and Financial Review and Prospects
66
Impairment of goodwill, intangible assets and property, plant and equipmentWe review long-lived intangible assets and property, plant and equipment for impairment whenever events or changes in circumstance indicate that the asset’s bal-ance sheet carrying amount may not be recoverable. Goodwill and other currently not amortized intangible assets are reviewed for impairment at least annually.
An asset is considered impaired when its balance sheet carrying amount exceeds its estimated recover-able amount, which is defined as the higher of its fair value less costs of disposal and its value in use. Usually, Novartis applies the fair value less costs of disposal method for its impairment assessment. In most cases, no directly observable market inputs are available to measure the fair value less costs of disposal. Therefore, an estimate is derived indirectly and is based on net present value techniques utilizing post-tax cash flows and discount rates. In the limited cases where the value in use method would be applied, net present value techniques would be applied using pre-tax cash flows and discount rates.
Fair value less costs of disposal reflects estimates of assumptions that market participants would be expected to use when pricing the asset or cash generating units (CGUs), and for this purpose, management considers the range of economic conditions that are expected to exist over the remaining useful life of the asset.
The estimates used in calculating the net present val-ues are highly sensitive and depend on assumptions spe-cific to the nature of the Group’s activities as indicated in “Item 18. Financial Statements—Note 1. Significant accounting policies.” Due to these factors, actual cash flows and values could vary significantly from forecasted future cash flows and related values derived using dis-counting techniques.
The recoverable amount of the grouping of cash-gen-erating units to which goodwill is allocated is based on fair value less costs of disposal. The valuations are derived from applying discounted future cash flows based on key assumptions, including the terminal growth rate and discount rate. For additional information on impairment charges recognized and reversed by divi-sions, see “Item 18. Financial Statements—Note 1. Sig-nificant accounting policies—Impairment of goodwill and intangible assets” and “Item 18. Financial Statements—Note 11. Goodwill and intangible assets.”
Goodwill and other intangible assets represent a sig-nificant part of our consolidated balance sheet, primar-ily due to acquisitions. Although no significant additional impairments are currently anticipated, impairment eval-uation could lead to material impairment charges in the future. For more information, see “Item 18. Financial Statements—Note 11. Goodwill and intangible assets.”
For net impairment charges for property, plant and equipment from continuing operations see “Item 18. Finan-cial Statements—Note 9. Property, plant and equipment.”
Contingent consideration
In an acquisition or divestment of a business, it is neces-sary to recognize contingent future amounts due to pre-
vious owners representing contractually defined potential amounts as a liability or asset. Usually for Novartis, these are linked to milestone or royalty payments related to cer-tain assets and are recognized as a financial liability or financial asset at their fair value, which is then remeasured at each subsequent reporting date. These estimations typically depend on factors such as technical milestones or market performance, and are adjusted for the proba-bility of their likelihood of payment and, if material, are appropriately discounted to reflect the impact of time.
Changes in the fair value of contingent consideration liabilities in subsequent periods are recognized in the consolidated income statement in “Cost of goods sold” for currently marketed products and in “Research and development” for in-process research and development (IPR&D). Changes in contingent consideration assets are recognized in “Other income” or “Other expense,” depending on their nature.
The effect of unwinding the discount over time is rec-ognized for contingent liabilities in “Interest expense” and for contingent assets as interest income recognized in the consolidated income statement within “Other financial income and expense.”
Retirement and other post-employment benefit plansWe sponsor pension and other post-employment bene-fit plans in various forms that cover a significant portion of our current and former associates. For post-employ-ment plans with defined benefit obligations, we are required to make significant assumptions and estimates about future events in calculating the expense and the present value of the liability related to these plans. These include assumptions about the interest rates we apply to estimate future defined benefit obligations and net periodic pension expense, as well as rates of future pen-sion increases. In addition, our actuarial consultants pro-vide our management with historical statistical informa-tion, such as withdrawal and mortality rates in connection with these estimates.
Assumptions and estimates used by the Group may differ materially from the actual results we experience due to changing market and economic conditions, higher or lower withdrawal rates, and longer or shorter life spans of participants, among other factors.
Depending on events, such differences could have a material effect on our total equity. For more information on obligations under retirement and other post-employ-ment benefit plans and underlying actuarial assumptions, see “Item 18. Financial Statements—Note 25. Post-em-ployment benefits for associates.”
Provisions and contingencies
A number of Group companies are involved in various gov-ernment investigations and legal proceedings (intellectual property, sales and marketing practices, product liability, commercial, employment and wrongful discharge, envi-ronmental claims, etc.) arising out of the normal conduct of their businesses. For more information, see “Item 18. Financial Statements—Note 20. Provisions and other
Item 5. Operating and Financial Review and Prospects
67
non-current liabilities” and “Item 18. Financial State-ments—Note 28. Commitments and contingencies.”
We record provisions for legal proceedings when it is probable that a liability has been incurred and the amount can be reliably estimated. These provisions are adjusted periodically as assessments change or addi-tional information becomes available. For significant product liability cases, the provision is actuarially deter-mined based on factors such as past experience, amount and number of claims reported, and estimates of claims incurred but not yet reported.
Provisions are recorded for environmental remedia-tion costs when expenditure on remedial work is proba-ble and the cost can be reliably estimated. Remediation costs are provided for under “Non-current liabilities” in the Group’s consolidated balance sheet.
Provisions relating to estimated future expenditure for liabilities do not usually reflect any insurance or other claims or recoveries, since these are only recognized as assets when the amount is reasonably estimable and collection is virtually certain.
Research and development
Internal research and development (R&D) costs are fully charged to the consolidated income statement in the period in which they are incurred. We consider that reg-ulatory and other uncertainties inherent in the develop-ment of new products preclude the capitalization of inter-nal development expenses as an intangible asset usually until marketing approval from the regulatory authority is obtained in a relevant major market, such as for the United States, the European Union or Switzerland.
Costs for post-approval studies performed to sup-port the continued registration of a marketed product are recognized as marketing expenses. Costs for activ-ities that are required by regulatory authorities as a con-dition for obtaining marketing approval are capitalized and recognized as currently marketed products.
Healthcare contributions
In some countries, our subsidiaries are required to make contributions to the country’s healthcare costs as part
of programs other than the ones mentioned above under deductions from revenues. The amounts to be paid depend on various criteria such as the subsidiary’s mar-ket share or sales volume compared to certain targets. Considerable judgment is required in estimating these contributions, as not all data is available when the esti-mates need to be made.
The largest of these healthcare contributions relates to the US healthcare reform fee, which was introduced in 2011. This fee is an annual levy paid by US pharmaceutical companies, including various Novartis subsidiaries. The calculation of the annual expense for this levy requires use of management judgement and estimates. This is required as the US healthcare reform fee owed is based on the Group’s percentage share of the total industry qualifying sales subject to the healthcare reform fee, which requires estimation as the total industry qualifying sales subject to the healthcare reform fee is not publicly available until the following year when the fee is due for payment. This phar-maceutical fee levy is recognized in “Other expense.”
Taxes
We prepare and file our tax returns based on an inter-pretation of tax laws and regulations, and we record esti-mates based on these judgments and interpretations. Our tax returns are subject to examination by the com-petent taxing authorities, which may result in an assess-ment being made, requiring payments of additional tax, interest or penalties. Since Novartis uses its intellectual property globally to deliver goods and services, the transfer prices within the Group as well as arrangements between subsidiaries to finance research and develop-ment and other activities may be challenged by the national tax authorities in any of the jurisdictions in which Novartis operates. Therefore, inherent uncertainties exist in our estimates of our tax positions, but we believe that our estimated amounts for current and deferred tax assets or liabilities, including any amounts related to any uncertain tax positions, are appropriate based on cur-rently known facts and circumstances.
Internal control over financial reporting
The Group’s management has assessed the effective-ness of internal control over financial reporting. The Group’s independent statutory auditor also issued an opinion on the effectiveness of internal control over financial reporting. Both the Group’s management and
its external auditors concluded that the Group main-tained, in all material respects, effective internal control over financial reporting as of December 31, 2020. For more details, see “Item 15. Controls and Procedures.”
Approach to risk management
See “Item 6. Directors, Senior Management and Employ-ees—Item 6.C Board practices—Corporate gover-nance—Information and control systems—Risk manage-
ment” and “Item 18. Financial Statements—Note 29. Financial instruments – additional disclosures.”

Item 5. Operating and Financial Review and Prospects
68
Non-IFRS measures as defined by Novartis
Novartis uses certain non-IFRS metrics when measur-ing performance, especially when measuring cur-rent-year results against prior periods, including core results, constant currencies, free cash flow and net debt.
Despite the use of these measures by management in setting goals and measuring the Group’s performance, these are non-IFRS measures that have no standardized meaning prescribed by IFRS. As a result, such measures have limits in their usefulness to investors.
Because of their non-standardized definitions, the non-IFRS measures (unlike IFRS measures) may not be comparable to the calculation of similar measures of other companies. These non-IFRS measures are pre-sented solely to permit investors to more fully understand how the Group’s management assesses underlying per-formance. These non-IFRS measures are not, and should not be viewed as, a substitute for IFRS measures, and should be viewed in conjunction with IFRS financials.
As an internal measure of Group performance, these non-IFRS measures have limitations, and the Group’s performance management process is not solely restricted to these metrics.
Core results
The Group’s core results – including core operating income, core net income and core earnings per share – exclude fully the amortization and impairment charges of intangible assets, excluding software, net gains and losses on fund investments and equity securities valued at fair value through profit and loss, and certain acquisi-tion- and divestment-related items. The following items that exceed a threshold of USD 25 million are also excluded: integration- and divestment-related income and expenses; divestment gains and losses; restructur-ing charges/releases and related items; legal-related items; impairments of property, plant and equipment, and financial assets, and income and expense items that management deems exceptional and that are or are expected to accumulate within the year to be over a USD 25 million threshold.
Novartis believes that investor understanding of the Group’s performance is enhanced by disclosing core measures of performance since, core measures exclude items that can vary significantly from year to year, they enable better comparison of business performance across years. For this same reason, Novartis uses these core measures in addition to IFRS and other measures as important factors in assessing the Group’s perfor-mance.
The following are examples of how these core measures are utilized:• In addition to monthly reports containing financial infor-
mation prepared under International Financial Report-
ing Standards (IFRS), senior management receives a monthly analysis incorporating these core measures.
• Annual budgets are prepared for both IFRS and core measures.
As an internal measure of Group performance, the core results measures have limitations, and the Group’s performance management process is not solely restricted to these metrics. A limitation of the core results measures is that they provide a view of the Group’s oper-ations without including all events during a period, such as the effects of an acquisition, divestment, or amortiza-tion/impairments of purchased intangible assets and restructurings.
Constant currencies
Changes in the relative values of non-US currencies to the US dollar can affect the Group’s financial results and financial position. To provide additional information that may be useful to investors, including changes in sales volume, we present information about our net sales and various values relating to operating and net income that are adjusted for such foreign currency effects.
Constant currency calculations have the goal of elim-inating two exchange rate effects so that an estimate can be made of underlying changes in the consolidated income statement excluding the impact of fluctuations in exchanges rates:• The impact of translating the income statements of con-
solidated entities from their non-USD functional cur-rencies to USD
• The impact of exchange rate movements on the major transactions of consolidated entities performed in cur-rencies other than their functional currency
We calculate constant currency measures by translating the current year’s foreign currency values for sales and other income statement items into USD, using the aver-age exchange rates from the prior year and comparing them to the prior-year values in USD.
We use these constant currency measures in evalu-ating the Group’s performance, since they may assist us in evaluating our ongoing performance from year to year. However, in performing our evaluation, we also consider equivalent measures of performance that are not affected by changes in the relative value of currencies.
Growth rate calculation
For ease of understanding, Novartis uses a sign conven-tion for its growth rates such that a reduction in operat-ing expenses or losses compared to the prior year is shown as a positive growth.

Item 5. Operating and Financial Review and Prospects
69
Free cash flow
Novartis defines free cash flow as net cash flows from operating activities and cash flows from investing activ-ities associated with purchases and sales of property, plant and equipment, of intangible assets, of financial assets and of other non-current assets. Excluded from free cash flow are cash flows from investing activities associated with acquisitions and divestments of busi-nesses and of interests in associated companies, pur-chases and sales of marketable securities and commod-ities and net cash flows from financing activities.
Free cash flow is a non-IFRS measure and is not intended to be a substitute measure for net cash flows from operating activities as determined under IFRS. Free cash flow is presented as additional information because management believes it is a useful supplemental indica-tor of the Group’s ability to operate without reliance on additional borrowing or use of existing cash. Free cash flow is a measure of the net cash generated that is avail-able for investment in strategic opportunities, returning to shareholders and for debt repayment. Free cash flow is a non-IFRS measure, which means it should not be interpreted as a measure determined under IFRS.
Net debt
Novartis calculates net debt as current financial debts and derivative financial instruments plus non-current financial debt less cash and cash equivalents and mar-ketable securities, commodities, time deposits and deriv-ative financial instruments.
Net debt is a non-IFRS measure, which means it should not be interpreted as a measure determined under IFRS. Net debt is presented as additional informa-tion because management believes it is a useful supple-mental indicator of the Group’s ability to pay dividends, to meet financial commitments, and to invest in new stra-tegic opportunities, including strengthening its balance sheet.
Novartis Cash Value Added
Novartis Cash Value Added (NCVA) is a metric that is based on what the Company assesses to be its cash flow return less a capital charge on gross operating assets. NCVA is used as the primary internal financial measure for determining payouts under the old Long-Term Performance Plan (LTPP) introduced in 2014. The LTPP performance measures were changed effective January 1, 2019, and from the 2019 cycle onward no lon-ger include NCVA as a performance measure. More infor-mation on NCVA is presented as part of the Compensa-tion Report; see “Item 6. Directors, Senior Management and Employees—Item 6.B Compensation.”
Additional information
EBITDANovartis defines earnings before interest, tax, depreci-ation and amortization (EBITDA) as operating income, excluding depreciation of property, plant and equipment, depreciation of right-of-use assets, amortization of intan-gible assets, and impairments of plant and equipment, right-of-use assets and of intangible assets.
(USD millions) 2020 2019
Operating income from
continuing operations 10 152 9 086
Depreciation of property,
plant and equipment 1 318 1 345
Depreciation of the
right-of-use-assets 330 305
Amortization of intangible
assets 3 462 2 836
Impairments of property,
plant and equipment, and
intangible assets 1 1 354 1 340
EBITDA from continuing
operations 16 616 14 912
Operating income from
discontinued operations 71
Depreciation of property,
plant and equipment 42
Depreciation of the
right-of-use-assets 9
Amortization of intangible
assets 174
EBITDA from discontinued
operations 296
EBITDA Total Group 16 616 15 208
1 There were no impairments of right-of-use assets in 2020 and 2019.
Enterprise valueEnterprise value represents the total amount that share-holders and debt holders have invested in Novartis, less the Group’s liquidity.
(USD millions) Dec 31, 2020 Dec 31, 2019
Market capitalization 214 269 214 815
Non-controlling interests 68 77
Non-current financial debts 26 259 20 353
Current financial debts and
derivatives financial instruments 9 785 7 031
Marketable securities,
commodities, time deposits
and derivative financial
instruments – 1 905 – 334
Cash and cash equivalents – 9 658 – 11 112
Enterprise value 238 818 230 830
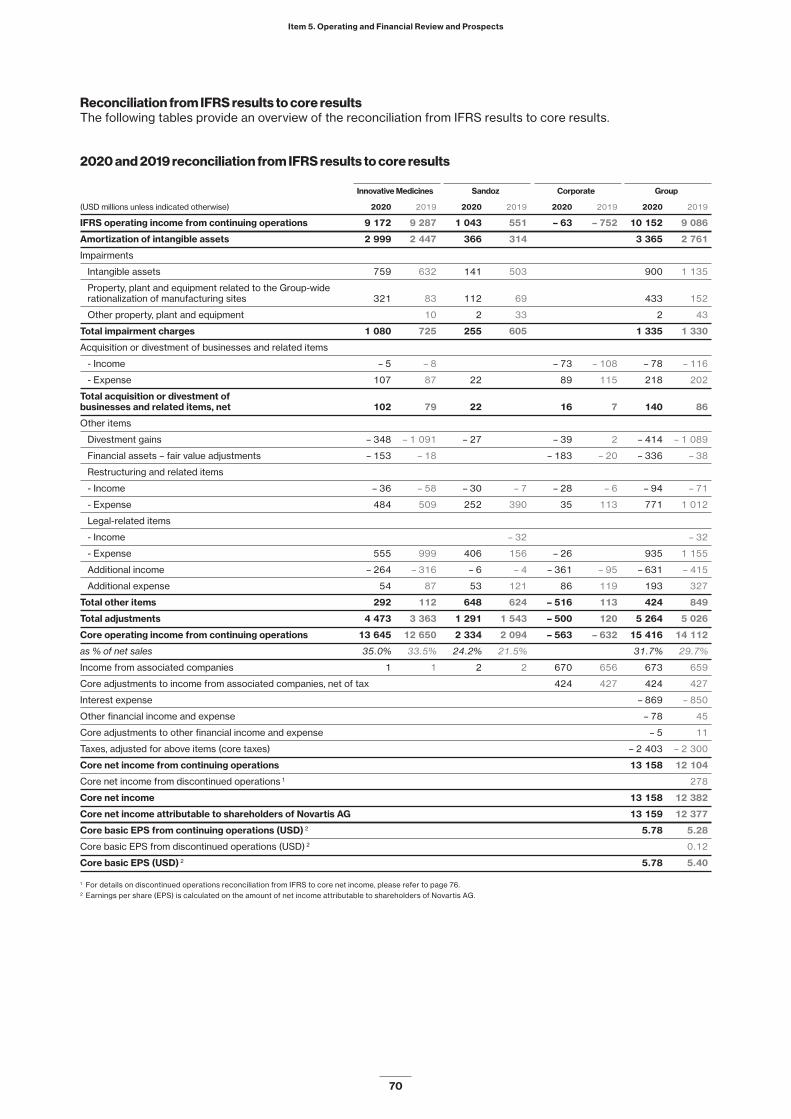
Item 5. Operating and Financial Review and Prospects
70
Reconciliation from IFRS results to core resultsThe following tables provide an overview of the reconciliation from IFRS results to core results.
2020 and 2019 reconciliation from IFRS results to core results
Innovative Medicines Sandoz Corporate Group
(USD millions unless indicated otherwise) 2020 2019 2020 2019 2020 2019 2020 2019
IFRS operating income from continuing operations 9 172 9 287 1 043 551 – 63 – 752 10 152 9 086
Amortization of intangible assets 2 999 2 447 366 314 3 365 2 761
Impairments
Intangible assets 759 632 141 503 900 1 135
Property, plant and equipment related to the Group-wide
rationalization of manufacturing sites 321 83 112 69 433 152
Other property, plant and equipment 10 2 33 2 43
Total impairment charges 1 080 725 255 605 1 335 1 330
Acquisition or divestment of businesses and related items
- Income – 5 – 8 – 73 – 108 – 78 – 116
- Expense 107 87 22 89 115 218 202
Total acquisition or divestment of
businesses and related items, net 102 79 22 16 7 140 86
Other items
Divestment gains – 348 – 1 091 – 27 – 39 2 – 414 – 1 089
Financial assets – fair value adjustments – 153 – 18 – 183 – 20 – 336 – 38
Restructuring and related items
- Income – 36 – 58 – 30 – 7 – 28 – 6 – 94 – 71
- Expense 484 509 252 390 35 113 771 1 012
Legal-related items
- Income – 32 – 32
- Expense 555 999 406 156 – 26 935 1 155
Additional income – 264 – 316 – 6 – 4 – 361 – 95 – 631 – 415
Additional expense 54 87 53 121 86 119 193 327
Total other items 292 112 648 624 – 516 113 424 849
Total adjustments 4 473 3 363 1 291 1 543 – 500 120 5 264 5 026
Core operating income from continuing operations 13 645 12 650 2 334 2 094 – 563 – 632 15 416 14 112
as % of net sales 35.0% 33.5% 24.2% 21.5% 31.7% 29.7%
Income from associated companies 1 1 2 2 670 656 673 659
Core adjustments to income from associated companies, net of tax 424 427 424 427
Interest expense – 869 – 850
Other financial income and expense – 78 45
Core adjustments to other financial income and expense – 5 11
Taxes, adjusted for above items (core taxes) – 2 403 – 2 300
Core net income from continuing operations 13 158 12 104
Core net income from discontinued operations 1 278
Core net income 13 158 12 382
Core net income attributable to shareholders of Novartis AG 13 159 12 377
Core basic EPS from continuing operations (USD) 2 5.78 5.28
Core basic EPS from discontinued operations (USD) 2 0.12
Core basic EPS (USD) 2 5.78 5.40
1 For details on discontinued operations reconciliation from IFRS to core net income, please refer to page 76.2 Earnings per share (EPS) is calculated on the amount of net income attributable to shareholders of Novartis AG.

Item 5. Operating and Financial Review and Prospects
71
2020 and 2019 reconciliation from IFRS results to core results – Group
Acquisition or
Amortization divestment of
of intangible businesses and Other
2020 (USD millions unless indicated otherwise) IFRS results assets 1 Impairments 2 related items 3 items 4 Core results
Gross profit from continuing operations 34 777 3 301 377 70 138 38 663
Operating income from continuing operations 10 152 3 365 1 335 140 424 15 416
Income before taxes from continuing operations 9 878 3 789 1 335 140 419 15 561
Taxes from continuing operations 5 – 1 807 – 2 403
Net income from continuing operations 8 071 13 158
Net income 8 071 13 158
Basic EPS from continuing operations (USD) 6 3.55 5.78
Basic EPS (USD) 6 3.55 5.78
The following are adjustments to arrive at core gross profit
Other revenues 1 239 – 136 1 103
Cost of goods sold – 15 121 3 301 377 70 274 – 11 099
The following are adjustments to arrive at core operating income
Selling, general and administration – 14 197 16 88 – 14 093
Research and development – 8 980 64 523 3 – 94 – 8 484
Other income 1 742 – 6 – 78 – 1 335 323
Other expense – 3 190 441 129 1 627 – 993
The following are adjustments to arrive at core income before taxes
Income from associated companies 673 424 1 097
Other financial income and expense – 78 – 5 – 83
1 Amortization of intangible assets: cost of goods sold includes the amortization of acquired rights to currently marketed products and other production-related intangible assets; research and development includes the amortization of acquired rights for technologies; income from associated companies includes USD 424 million for the Novartis share of the estimated Roche core items
2 Impairments: cost of goods sold and research and development include impairment charges related to intangible assets; other income includes an impairment reversal related to property, plant and equipment; other expense includes impairment charges related to property, plant and equipment
3 Acquisition or divestment of businesses and related items, including restructuring and integration charges: cost of goods sold, selling, general and administration, research and development and other expense include net charges related to acquisitions; other income and other expense include transitional service-fee income and expenses related to the Alcon distribution
4 Other items: other revenues includes a settlement of royalties; cost of goods sold includes the cumulative amount of the depreciation up to December 31, 2019, recognized with the reclassification of property, plant and equipment out of assets of disposal group held for sale (see Item 18. Financial Statements–Note 2. Significant transactions–Significant transactions in 2020); cost of goods sold, other income and other expense include net restructuring and other charges related to the Group-wide rationalization of manufacturing sites; cost of goods sold, selling, general and administration, research and development, other income and other expense include other restructuring income and charges and related items; cost of goods sold and research and development also include adjustments to contingent considerations; selling, general and administration and other expense include expenses related to COVID-19 donations; selling, general and administration also includes adjustments to provisions; other income and other expense include fair value adjustments and divestment gains and losses on financial assets, and adjustments to environmental provisions; other income also includes net gains from the divestment of products, a fair value adjustment on a contingent receivable and adjustments to provisions; other expense includes adjustments to legal provisions, legal-related items and a termination fee; other financial income and expense includes a revaluation impact of a financial liability incurred through the Alcon distribution
5 Taxes on the adjustments between IFRS and core results take into account, for each individual item included in the adjustment, the tax rate that will finally be applicable to the item based on the jurisdiction where the adjustment will finally have a tax impact. Generally, this results in amortization and impairment of intangible assets and acquisition-related restructuring and integration items having a full tax impact. There is usually a tax impact on other items, although this is not always the case for items arising from legal settlements in certain jurisdictions. Adjustments related to income from associated companies are recorded net of any related tax effect. Due to these factors and the differing effective tax rates in the various jurisdictions, the tax on the total adjustments for continuing operations of USD 5.7 billion to arrive at the core results before tax amounts to USD 596 million. The average tax rate on the adjustments is 10.5%.
6 Earnings per share (EPS) is calculated on the amount of net income attributable to shareholders of Novartis AG.

Item 5. Operating and Financial Review and Prospects
72
Acquisition or
Amortization divestment of
of intangible businesses and Other
2019 (USD millions unless indicated otherwise) IFRS results assets 1 Impairments 2 related items 3 items 4 Core results
Gross profit from continuing operations 34 252 2 711 85 48 296 37 392
Operating income from continuing operations 9 086 2 761 1 330 86 849 14 112
Income before taxes from continuing operations 8 940 3 188 1 330 86 860 14 404
Taxes from continuing operations 5 – 1 793 – 2 300
Net income from continuing operations 7 147 12 104
Net income from discontinued operations 6 4 590 278
Net income 11 737 12 382
Basic EPS from continuing operations (USD) 7 3.12 5.28
Basic EPS from discontinued operations (USD) 7 2.00 0.12
Basic EPS (USD) 7 5.12 5.40
The following are adjustments to arrive at core gross profit
Other revenues 1 179 – 66 1 113
Cost of goods sold – 14 425 2 711 85 48 362 – 11 219
The following are adjustments to arrive at core operating income
Selling, general and administration – 14 369 10 40 – 14 319
Research and development – 9 402 50 1 078 10 – 122 – 8 386
Other income 2 031 – 2 – 116 – 1 418 495
Other expense – 3 426 169 134 2 053 – 1 070
The following are adjustments to arrive at core income before taxes
Income from associated companies 659 427 1 086
Other financial income and expense 45 11 56
1 Amortization of intangible assets: cost of goods sold includes the amortization of acquired rights to currently marketed products and other production-related intangible assets; research and development includes the amortization of acquired rights for technologies; income from associated companies includes USD 427 million for the Novartis share of the estimated Roche core items
2 Impairments: cost of goods sold, and research and development include impairment charges related to intangible assets; research and development also includes the reversal of an impairment charge; cost of goods sold, other income and other expense include net impairment charges related to property, plant and equipment
3 Acquisition or divestment of businesses and related items, including restructuring and integration charges: cost of goods sold, selling, general and administration, research and development, other income and other expense include net charges related to acquisitions; other income and other expense also include transitional service fee income and expenses related to the portfolio transformation and the Alcon distribution
4 Other items: other revenues includes income from an outlicensing agreement, and income related to an amendment of a collaboration agreement; cost of goods sold, other income and other expense include net restructuring and other charges related to the Group-wide rationalization of manufacturing sites; cost of goods sold, research and development, selling, general and administration, other income and other expense include other restructuring income and charges and related items; cost of goods sold, and research and development also include fair value adjustments of contingent consideration liabilities; cost of goods sold also includes inventory write-offs and other provisions; selling, general and administration includes receivable expected credit loss provisions and other provisions; other income and other expense include fair value adjustments and divestment gains and losses on financial assets and legal-related items as well as environmental provisions; other income also includes net gains from the divestment of products and property, plant and equipment, and provision releases; other expense includes a provision for onerous contracts and other provisions; other financial income and expense includes a revaluation impact of a financial liability incurred through the Alcon distribution
5 Taxes on the adjustments between IFRS and core results take into account, for each individual item included in the adjustment, the tax rate that will finally be applicable to the item based on the jurisdiction where the adjustment will finally have a tax impact. Generally, this results in amortization and impairment of intangible assets and acquisition-related restructuring and integration items having a full tax impact. There is usually a tax impact on other items, although this is not always the case for items arising from legal settlements in certain jurisdictions. Adjustments related to income from associated companies are recorded net of any related tax effect. Due to these factors and the differing effective tax rates in the various jurisdictions, the tax on the total adjustments for continuing operations of USD 5.5 billion to arrive at the core results before tax amounts to USD 507 million. The average tax rate on the adjustments is 9.3%.
6 For details on discontinued operations reconciliation from IFRS to core net income please refer to page 76.7 Earnings per share (EPS) is calculated on the amount of net income, attributable to shareholders of Novartis AG.

Item 5. Operating and Financial Review and Prospects
73
2020 and 2019 reconciliation from IFRS results to core results – Innovative Medicines
Acquisition or
Amortization divestment of
2020 of intangible businesses and Other
(USD millions) IFRS results assets 1 Impairments 2 related items 3 items 4 Core results
Gross profit 29 896 2 935 250 48 146 33 275
Operating income 9 172 2 999 1 080 102 292 13 645
The following are adjustments to arrive at core gross profit
Cost of goods sold – 10 927 2 935 250 48 146 – 7 548
The following are adjustments to arrive at core operating income
Selling, general and administration – 11 657 16 58 – 11 583
Research and development – 8 118 64 509 3 – 94 – 7 636
Other income 922 – 1 – 5 – 687 229
Other expense – 1 871 322 40 869 – 640
1 Amortization of intangible assets: cost of goods sold includes the amortization of acquired rights to currently marketed products and other production-related intangible assets; research and development includes the amortization of acquired rights for technologies
2 Impairments: cost of goods sold and research and development include impairment charges related to intangible assets; other income and other expense include net impairment charges related to property, plant and equipment
3 Acquisition or divestment of businesses and related items, including restructuring and integration charges: cost of goods sold, selling, general and administration, research and development and other expense include net charges related to acquisitions; other income and other expense include transitional service-fee income and expenses related to the Alcon distribution
4 Other items: cost of goods sold, other income and other expense include net restructuring and other charges related to the Group-wide rationalization of manufacturing sites; cost of goods sold, selling, general and administration, research and development, other income and other expense include other restructuring income and charges and related items; cost of goods sold and research and development also include adjustments to contingent considerations; selling, general and administration includes expenses related to COVID-19 donations and adjustments to provisions; other income and other expense include fair value adjustments on financial assets; other income also includes net gains from the divestment of products and financial assets and adjustments to provisions; other expense includes legal-related items and a termination fee
Acquisition or
Amortization divestment of
2019 of intangible businesses and Other
(USD millions) IFRS results assets 1 Impairments 2 related items 3 items 4 Core results
Gross profit 29 539 2 397 48 116 32 100
Operating income 9 287 2 447 725 79 112 12 650
The following are adjustments to arrive at core gross profit
Other revenues 1 092 – 66 1 026
Cost of goods sold – 10 050 2 397 48 182 – 7 423
The following are adjustments to arrive at core operating income
Selling, general and administration – 11 617 10 25 – 11 582
Research and development – 8 152 50 632 10 – 125 – 7 585
Other income 1 586 – 1 – 8 – 1 230 347
Other expense – 2 069 94 19 1 326 – 630
1 Amortization of intangible assets: cost of goods sold includes the amortization of acquired rights to currently marketed products and other production-related intangible assets; research and development includes the amortization of acquired rights for technologies
2 Impairments: research and development includes impairment charges and a reversal of impairment charges related to intangible assets; other income and other expense include net impairment charges related to property, plant and equipment
3 Acquisition or divestment of businesses and related items, including restructuring and integration charges: cost of goods sold, selling, general and administration, research and development, other income and other expense include net charges related to acquisitions; other income and other expense also include transitional service-fee income and expenses related to the portfolio transformation and the Alcon distribution
4 Other items: other revenues includes a net income from an outlicensing agreement and an income related to an amendment of a collaboration agreement; cost of goods sold, other income and other expense include restructuring and other charges related to the Group-wide rationalization of manufacturing sites; cost of goods sold, research and development, other income and other expense include other restructuring income and charges and related items; cost of goods sold, and research and development also include fair value adjustments of contingent consideration liabilities; selling, general and administration includes other provisions; other income and other expense include fair value adjustments and divestment gains and losses on financial assets; other income also includes net gains from the divestment of products and property, plant and equipment, and provision releases; other expense includes legal-related items

Item 5. Operating and Financial Review and Prospects
74
2020 and 2019 reconciliation from IFRS to core results – Sandoz
Acquisition or
Amortization divestment of
2020 of intangible businesses and Other
(USD millions) IFRS results assets 1 Impairments 2 related items 3 items 4 Core results
Gross profit 4 636 366 127 22 128 5 279
Operating income 1 043 366 255 22 648 2 334
The following are adjustments to arrive at core gross profit
Cost of goods sold – 5 252 366 127 22 128 – 4 609
The following are adjustments to arrive at core operating income
Selling, general and administration – 2 076 30 – 2 046
Research and development – 862 14 – 848
Other income 176 – 5 – 62 109
Other expense – 831 119 552 – 160
1 Amortization of intangible assets: cost of goods sold includes the amortization of acquired rights to currently marketed products and other production-related intangible assets2 Impairments: cost of goods sold and research and development include impairment charges related to intangible assets; other income includes an impairment reversal related to
property, plant and equipment; other expense includes impairment charges related to property, plant and equipment3 Acquisition or divestment of businesses and related items, including restructuring and integration charges: cost of goods sold includes net charges related to an acquisition4 Other items: cost of goods sold includes the cumulative amount of the depreciation up to December 31, 2019, recognized with the reclassification of property, plant and equipment
out of assets of disposal group held for sale (see Item 18. Financial Statements–Note 2. Significant transactions–Significant transactions in 2020); cost of goods sold and other expense include restructuring and other charges related to the Group-wide rationalization of manufacturing sites; cost of goods sold, selling, general and administration, other income and other expense include other restructuring income and charges and related items; selling, general and administration also includes expenses related to COVID-19 donations and adjustments to provisions; other income includes net gains from the divestment of a product and adjustments to provisions; other expense includes a legal provision and legal-related items
Acquisition or
Amortization divestment of
2019 of intangible businesses and Other
(USD millions) IFRS results assets 1 Impairments 2 related items items 3 Core results
Gross profit 4 601 314 85 180 5 180
Operating income 551 314 605 624 2 094
The following are adjustments to arrive at core gross profit
Cost of goods sold – 5 334 314 85 180 – 4 755
The following are adjustments to arrive at core operating income
Selling, general and administration – 2 218 15 – 2 203
Research and development – 1 250 446 3 – 801
Other income 167 – 1 – 39 127
Other expense – 749 75 465 – 209
1 Amortization of intangible assets: cost of goods sold includes the amortization of acquired rights to currently marketed products and other production-related intangible assets2 Impairments: cost of goods sold, and research and development include impairment charges related to intangible assets; cost of goods sold, other income and other expense
include net impairment charges related to property, plant and equipment3 Other items: cost of goods sold and other expense include net restructuring and other charges related to the Group-wide rationalization of manufacturing sites; cost of goods sold,
selling, general and administration, other income and other expense include restructuring income and charges and related items; cost of goods sold also includes inventory write-offs and other provisions; selling, general and administration includes receivable expected credit loss provisions and other provisions; other income and other expense also include legal-related items; other expense also includes an environmental provision, a provision for onerous contracts and other provisions
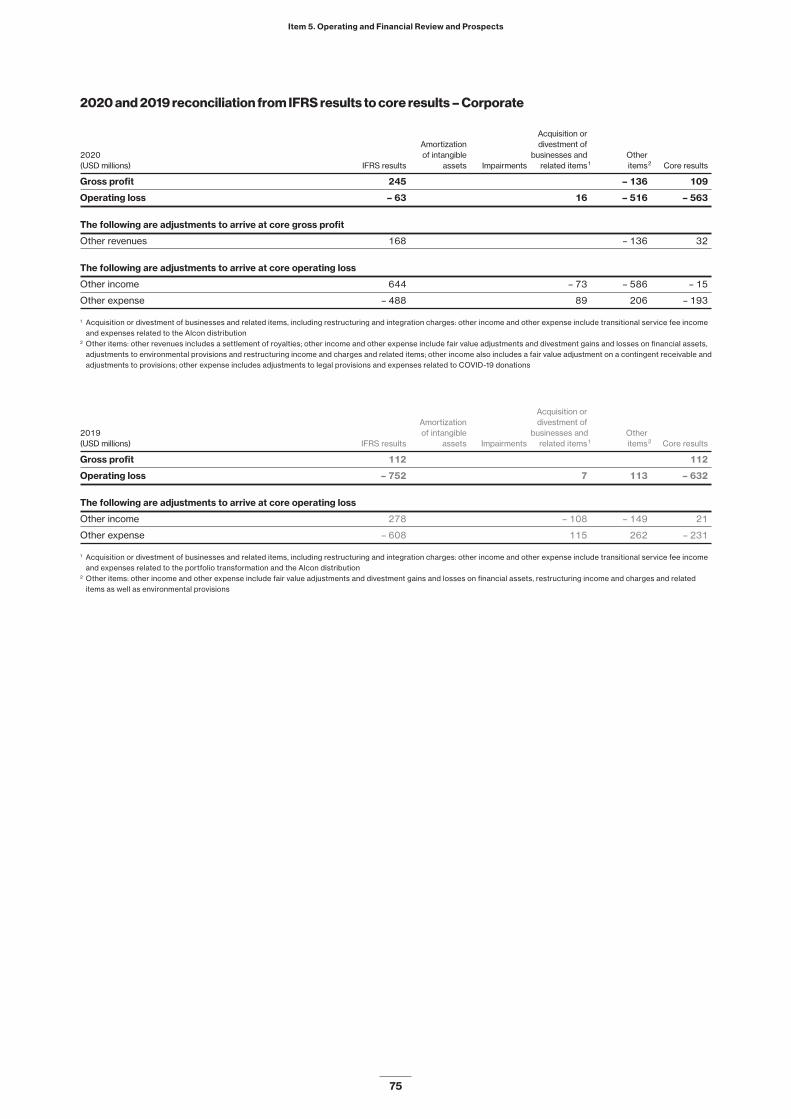
Item 5. Operating and Financial Review and Prospects
75
2020 and 2019 reconciliation from IFRS results to core results – Corporate
Acquisition or
Amortization divestment of
2020 of intangible businesses and Other
(USD millions) IFRS results assets Impairments related items 1 items 2 Core results
Gross profit 245 – 136 109
Operating loss – 63 16 – 516 – 563
The following are adjustments to arrive at core gross profit
Other revenues 168 – 136 32
The following are adjustments to arrive at core operating loss
Other income 644 – 73 – 586 – 15
Other expense – 488 89 206 – 193
1 Acquisition or divestment of businesses and related items, including restructuring and integration charges: other income and other expense include transitional service fee income and expenses related to the Alcon distribution
2 Other items: other revenues includes a settlement of royalties; other income and other expense include fair value adjustments and divestment gains and losses on financial assets, adjustments to environmental provisions and restructuring income and charges and related items; other income also includes a fair value adjustment on a contingent receivable and adjustments to provisions; other expense includes adjustments to legal provisions and expenses related to COVID-19 donations
Acquisition or
Amortization divestment of
2019 of intangible businesses and Other
(USD millions) IFRS results assets Impairments related items 1 items 2 Core results
Gross profit 112 112
Operating loss – 752 7 113 – 632
The following are adjustments to arrive at core operating loss
Other income 278 – 108 – 149 21
Other expense – 608 115 262 – 231
1 Acquisition or divestment of businesses and related items, including restructuring and integration charges: other income and other expense include transitional service fee income and expenses related to the portfolio transformation and the Alcon distribution
2 Other items: other income and other expense include fair value adjustments and divestment gains and losses on financial assets, restructuring income and charges and related items as well as environmental provisions
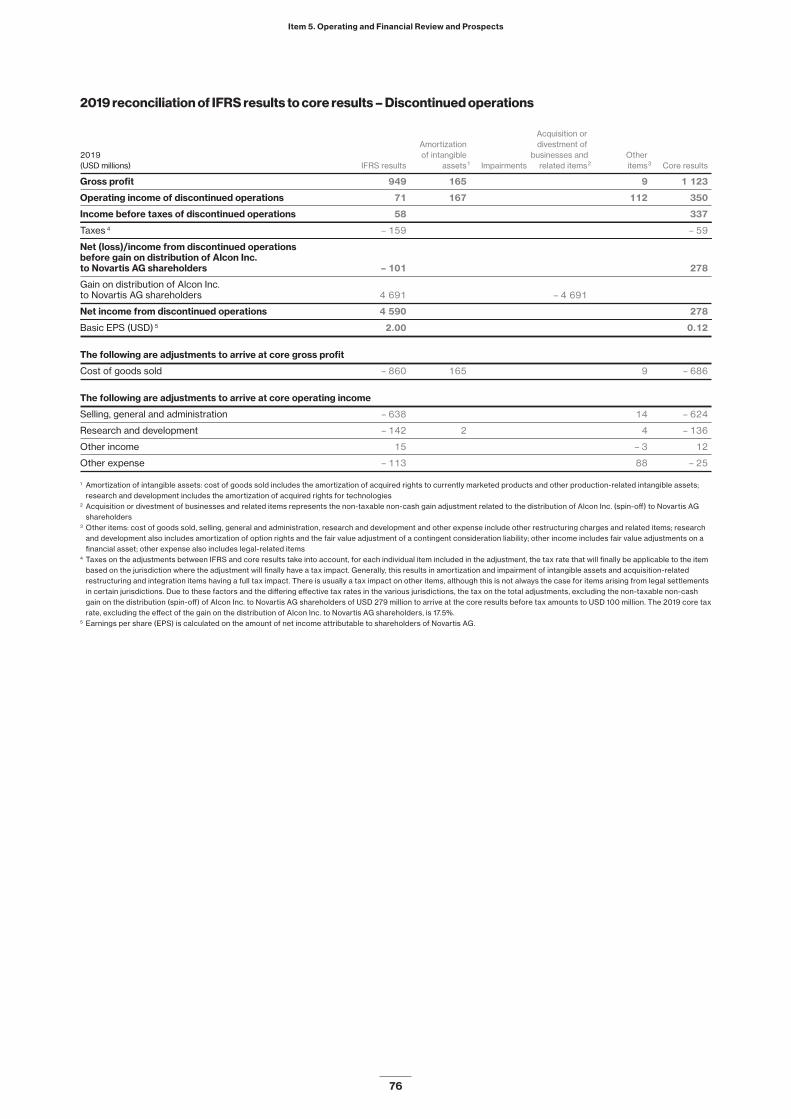
Item 5. Operating and Financial Review and Prospects
76
2019 reconciliation of IFRS results to core results – Discontinued operations
Acquisition or
Amortization divestment of
2019 of intangible businesses and Other
(USD millions) IFRS results assets 1 Impairments related items 2 items 3 Core results
Gross profit 949 165 9 1 123
Operating income of discontinued operations 71 167 112 350
Income before taxes of discontinued operations 58 337
Taxes 4 – 159 – 59
Net (loss)/income from discontinued operations
before gain on distribution of Alcon Inc.
to Novartis AG shareholders – 101 278
Gain on distribution of Alcon Inc.
to Novartis AG shareholders 4 691 – 4 691
Net income from discontinued operations 4 590 278
Basic EPS (USD) 5 2.00 0.12
The following are adjustments to arrive at core gross profit
Cost of goods sold – 860 165 9 – 686
The following are adjustments to arrive at core operating income
Selling, general and administration – 638 14 – 624
Research and development – 142 2 4 – 136
Other income 15 – 3 12
Other expense – 113 88 – 25
1 Amortization of intangible assets: cost of goods sold includes the amortization of acquired rights to currently marketed products and other production-related intangible assets; research and development includes the amortization of acquired rights for technologies
2 Acquisition or divestment of businesses and related items represents the non-taxable non-cash gain adjustment related to the distribution of Alcon Inc. (spin-off) to Novartis AG shareholders
3 Other items: cost of goods sold, selling, general and administration, research and development and other expense include other restructuring charges and related items; research and development also includes amortization of option rights and the fair value adjustment of a contingent consideration liability; other income includes fair value adjustments on a financial asset; other expense also includes legal-related items
4 Taxes on the adjustments between IFRS and core results take into account, for each individual item included in the adjustment, the tax rate that will finally be applicable to the item based on the jurisdiction where the adjustment will finally have a tax impact. Generally, this results in amortization and impairment of intangible assets and acquisition-related restructuring and integration items having a full tax impact. There is usually a tax impact on other items, although this is not always the case for items arising from legal settlements in certain jurisdictions. Due to these factors and the differing effective tax rates in the various jurisdictions, the tax on the total adjustments, excluding the non-taxable non-cash gain on the distribution (spin-off) of Alcon Inc. to Novartis AG shareholders of USD 279 million to arrive at the core results before tax amounts to USD 100 million. The 2019 core tax rate, excluding the effect of the gain on the distribution of Alcon Inc. to Novartis AG shareholders, is 17.5%.
5 Earnings per share (EPS) is calculated on the amount of net income attributable to shareholders of Novartis AG.

Item 5. Operating and Financial Review and Prospects
77
5.B Liquidity and capital resources
The following tables summarize the Group’s cash flows and net debt.
(USD millions) 2020 2019
Net cash flows from operating activities from continuing operations 13 650 13 547
Net cash flows from operating activities from discontinued operations 78
Net cash flows used in investing activities from continuing operations – 13 055 – 1 067
Net cash flows used in investing activities from discontinued operations – 127 – 1 159
Net cash flows used in financing activities from continuing operations – 2 158 – 16 884
Net cash flows used in/from financing activities from discontinued operations – 50 3 257
Effect of exchange rate changes on cash and cash equivalents 286 69
Net change in cash and cash equivalents – 1 454 – 2 159
Change in marketable securities, commodities, time deposits and derivative financial instruments 1 571 – 2 359
Change in current and non-current financial debts and derivative financial instruments – 8 660 4 764
Change in net debt – 8 543 246
Net debt at January 1 – 15 938 – 16 184
Net debt at December 31 – 24 481 – 15 938
Cash flow
Financial year 2020 compared to 2019Net cash flows from operating activities from continuing operations amounted to USD 13.6 billion, compared to USD 13.5 billion in 2019. This increase was mainly driven by higher net income adjusted for non-cash items and other adjustments, including divestment gains, partly off-set by higher payments out of provisions related to legal matters.
Net cash outflows used in investing activities from continuing operations amounted to USD 13.1 billion, com-pared to USD 1.1 billion in 2019.
The current year cash outflows were mainly driven by USD 10.0 billion for acquisitions and divestments of businesses, net (including the acquisition of The Medicines Company for USD 9.5 billion, net of cash acquired USD 0.1 billion, and the acquisition of the Jap-anese business of Aspen Global Incorporated for USD 0.3 billion); USD 1.4 billion for net purchases of market-able securities and commodities; USD 1.3 billion for pur-chases of property, plant and equipment; and USD 1.3 billion for purchases of intangible assets. These cash outflows were partly offset by cash inflows of USD 0.7 billion from the sale of financial assets (including USD 0.3 billion proceeds from the sale of Alcon Inc. shares) and USD 0.4 billion from the sale of intangible assets.
In 2019, net cash flows used in investing activities from continuing operations were driven by USD 3.8 bil-lion for acquisitions and divestments of businesses, net (including the acquisition of Xiidra from Takeda Pharma-ceutical Company Limited for USD 3.5 billion and the acquisition of IFM Tre, Inc. for USD 0.3 billion); USD 1.4 billion for purchases of property, plant and equipment; USD 0.9 billion for purchases of intangible assets; and USD 0.4 billion for purchases of financial assets and other non-current assets. These cash outflows were partly offset by cash inflows of USD 2.3 billion from the net proceeds from the sale of marketable securities and
commodities; USD 0.9 billion from the sale of property, plant and equipment (including the proceeds from the sale and leaseback of real estate); USD 1.2 billion from the sale of financial assets (including USD 1.0 billion pro-ceeds from the sale of Alcon Inc. shares); and USD 1.0 billion from the sale of intangible assets.
Net cash flows used in investing activities from dis-continued operations amounted to USD 0.1 billion com-pared to USD 1.2 billion in 2019. The current year includes payments for transaction related expenditures. In 2019, the net outflows were mainly driven by USD 0.3 billion for the acquisition of PowerVision, Inc.; USD 0.6 billion due to derecognized cash and cash equivalents follow-ing the completion of the Alcon spin-off, on April 9, 2019; and transaction related expenditures.
Net cash flows used in financing activities from con-tinuing operations amounted to USD 2.2 billion, com-pared to USD 16.9 billion in 2019.
The current year cash outflows were driven by USD 7.0 billion for the dividend payment; USD 2.1 billion for net treasury share transactions; USD 2.0 billion for the repayment of two US dollar bonds at maturity; USD 0.3 billion net payments for lease liabilities; and USD 0.2 bil-lion for other financing cash outflows, net. These cash outflows were partly offset by cash inflows of USD 7.1 billion from the increase in non-current financial debts, mainly consisting of USD 4.9 billion from the issuance of bonds denominated in US dollars (notional amount of USD 5.0 billion) and USD 2.1 billion from the issuance of a sustainability-linked bond denominated in euro (notional amount of EUR 1.85 billion); and USD 2.3 billion from the net increase in current financial debts.
In 2019, net cash flows used in financing activities from continuing operations were driven by USD 6.6 bil-lion for the dividend payment; USD 5.3 billion for the net treasury share transactions (mainly related to the up-to USD 5 billion share buyback); USD 3.1 billion for net

Item 5. Operating and Financial Review and Prospects
78
non-current financial debts (mainly driven by the repay-ment at maturity of a US dollar bond of USD 3.0 billion); USD 1.6 billion for net repayments of current financial debts; and USD 0.3 billion for payments of lease liabili-ties, net.
Net cash flows used in financing activities from dis-continued operations amounted to USD 50 million, com-
pared to a cash inflow of USD 3.3 billion in 2019. The current year cash outflows are for transaction costs. In 2019, cash inflows included mainly proceeds from the USD 3.5 billion Alcon borrowings, partly offset by USD 0.2 billion payments for transaction costs.
Free cash flow
Free cash flow is a non-IFRS measure, see “Item 5.A Operating results—Non-IFRS measures as defined by Novartis—Free cash flow” above for further information.
The following table is a summary of the free cash flow:
(USD millions) 2020 2019
Operating income from continuing operations 10 152 9 086
Adjustments for non-cash items
Depreciation, amortization and impairments 6 129 5 788
Change in provisions and other non-current liabilities 1 411 1 871
Other 260 – 476
Operating income adjusted for non-cash items 17 952 16 269
Dividends received from associated companies and others 490 463
Interest and other financial receipts 511 242
Interest and other financial payments – 742 – 826
Taxes paid – 1 833 – 1 876
Payments out of provisions and other net cash movements in non-current liabilities – 2 437 – 924
Change in inventory and trade receivables less trade payables – 730 – 809
Change in other net current assets and other operating cash flow items 439 1 008
Net cash flows from operating activities from continuing operations 13 650 13 547
Purchases of property, plant and equipment – 1 275 – 1 379
Proceeds from sale of property, plant and equipment 88 857
Purchases of intangible assets – 1 310 – 878
Proceeds from sale of intangible assets 380 973
Purchases of financial assets – 230 – 302
Proceeds from sale of financial assets 1 447 176
Purchases of other non-current assets – 61 – 60
Proceeds from sale of other non-current assets 2 3
Free cash flow from continuing operations 11 691 12 937
Free cash flow from discontinued operations 2 – 62
Total free cash flow 11 691 12 875
1 For the free cash flow, proceeds from the sale of financial assets excludes the cash inflows from the sale of a portion of the Alcon Inc. shares received by certain consolidated foundations through the Alcon spin-off, which amounted to USD 276 million (2019: USD 976 million). See “Item 18. Financial Statements–Note 2. Significant transactions–Significant transactions in 2019.”
2 In 2019, the free cash flow from discontinued operations was a cash outflow of USD 62 million consisting of USD 78 million net cash inflows from operating activities from discontinued operations, USD 1.2 billion net cash flows used in investing activities from discontinued operations adjusted by USD 362 million of net cash outflows for acquisition and divestments of businesses and by USD 657 million for cash outflows attributable to the spin-off of the Alcon business.
Financial year 2020 compared to 2019Free cash flow from continuing operations amounted to USD 11.7 billion (–10%) compared to USD 12.9 billion in 2019, as higher operating income adjusted for non-cash items was more than offset by payments related to legal mat-ters and lower divestment proceeds.

Item 5. Operating and Financial Review and Prospects
79
Condensed consolidated balance sheets
(USD millions) Dec 31, 2020 Dec 31, 2019
Assets
Property, plant and equipment 12 263 12 069
Right-of-use assets 1 676 1 677
Goodwill 29 999 26 524
Intangible assets other than goodwill 36 809 28 787
Investments in associated companies 9 632 8 644
Deferred tax assets 8 214 7 909
Financial assets and other non-current assets 3 793 3 256
Total non-current assets 102 386 88 866
Inventories 7 131 5 982
Trade receivables 8 217 8 301
Other current assets and income tax receivable 2 762 2 934
Marketable securities, commodities, time deposits and derivative financial instruments 1 905 334
Cash and cash equivalents 9 658 11 112
Assets of disposal group held for sale 841
Total current assets 29 673 29 504
Total assets 132 059 118 370
Equity and liabilities
Total equity 56 666 55 551
Liabilities
Financial debts 26 259 20 353
Lease liabilities 1 719 1 703
Deferred tax liabilities 7 422 5 867
Provisions and other non-current liabilities 6 934 6 632
Total non-current liabilities 42 334 34 555
Trade payables 5 403 5 424
Financial debts and derivative financial instruments 9 785 7 031
Lease liabilities 286 246
Provisions and other current liabilities and
current income tax liabilities 17 585 15 532
Liabilities of disposal group held for sale 31
Total current liabilities 33 059 28 264
Total liabilities 75 393 62 819
Total equity and liabilities 132 059 118 370
As of December 31, 2019, the assets and liabilities of the Sandoz US generic oral solids and dermatology busi-nesses were reported as current assets and liabilities held for sale in the consolidated balance sheet. In March 2020, Novartis decided to retain the Sandoz US generic oral solids and dermatology businesses and, on April 2, 2020, announced the mutual agreement with Aurobindo to terminate the sale agreement. As such, these assets and liabilities are reclassified to their respective consol-idated balance sheet lines as from March 31, 2020; the prior year consolidated balance sheet is not restated. For further details see “Item 18. Financial Statements—Note 2. Significant transactions—Significant transac-tions in 2020—Sandoz – retention of US dermatology business and generic US oral solids portfolio, previously planned to be divested.”
AssetsTotal non-current assets of USD 102.4 billion at Decem-ber 31, 2020, increased by USD 13.5 billion compared to December 31, 2019.
Intangible assets other than goodwill increased by USD 8.0 billion mainly due to the acquisitions of The Medicines Company and of the Japanese business of Aspen Global Incorporated, net additions, favorable cur-rency translation adjustments and the reclassification of the intangible assets of the disposal group held for sale of USD 0.3 billion, partially offset by amortization and impairments.
Goodwill increased by USD 3.5 billion, and deferred tax assets by USD 0.3 billion, mainly due to the acquisi-tion of The Medicines Company and favorable currency translation adjustments.
Investments in associated companies increased by USD 1.0 billion primarily due to favorable currency trans-

Item 5. Operating and Financial Review and Prospects
80
lation adjustments, as income from associated compa-nies was largely offset by dividends received.
Financial and other non-current assets increased by USD 0.5 billion, mainly due to fair value adjustments on financial assets.
Property, plant and equipment increased by USD 0.2 billion, mainly due to net additions and the reclassifica-tion of property, plant and equipment of the disposal group held for sale of USD 0.1 billion and favorable cur-rency translation adjustments, partly offset by depreci-ation and impairments. Right-of-use assets were broadly in line with December 31, 2019.
Total current assets of USD 29.7 billion at December 31, 2020, increased by USD 0.2 billion compared to December 31, 2019.
Marketable securities, commodities, time deposits, and derivative financial instruments increased by USD 1.6 billion, mainly due to the investment of a portion of the September 16, 2020 issuance of the euro denomi-nated sustainability-linked bond.
Inventories increased by USD 1.1 billion, which includes USD 0.2 billion from the reclassification of the inventory of the disposal group held for sale.
These increases were partly offset by a decrease in cash and cash equivalents by USD 1.5 billion, and in other current assets by USD 0.2 billion.
Trade receivables and income tax receivables were broadly in line with December 31, 2019.
We consider our provisions for doubtful trade receiv-ables to be adequate. We continue to monitor the level of trade receivables, particularly in Argentina, Brazil, Greece, Italy, Portugal, Russia, Saudi Arabia, Spain and Turkey. Should there be a substantial deterioration in our economic exposure with respect to those countries, we may change the terms of trade on which we operate. The gross trade receivables from these countries at Decem-ber 31, 2020, amounted to USD 1.5 billion (2019: USD 1.6 billion), of which USD 55 million is past due for more than one year (2019: USD 61 million), and for which provisions of USD 27 million have been recorded (2019: USD 24 mil-lion). At December 31, 2020, amounts past due for more than one year were not significant in any of these coun-tries on a standalone basis. The majority of the outstand-ing trade receivables from Portugal, Saudi Arabia, Spain and Greece are due directly from local governments or government-funded entities.
The following table provides an overview of the aging analysis of total trade receivables and the total amount of the provision for doubtful trade receivables as of December 31, 2020 and 2019:
(USD millions) 2020 2019
Not overdue 7 714 7 763
Past due for not more than one month 150 161
Past due for more than one month
but less than three months 118 123
Past due for more than three months
but less than six months 102 103
Past due for more than six months
but less than one year 77 96
Past due for more than one year 149 150
Provisions for doubtful trade receivables – 93 – 95
Total trade receivables, net 8 217 8 301
There is also a risk that certain countries could devalue their currency. Currency exposures are described in more detail in “—Effects of currency fluctuations.”
LiabilitiesTotal non-current liabilities of USD 42.3 billion increased by USD 7.8 billion compared to December 31, 2019.
Non-current financial debts increased by USD 5.9 billion, mainly driven by the issuance of a euro denomi-nated sustainability-linked bond for a notional amount of EUR 1.85 billion (USD 2.2 billion), and the issuance of US dollar denominated bonds for a total notional amount of USD 5.0 billion.
This increase was partly offset by the reclassification from non-current to current financial debt for a total of USD 2.3 billion consisting of a EUR 1.25 billion (USD 1.5 billion) bond and a EUR 0.6 billion (USD 0.7 billion) bond due in March 2021 and November 2021, respectively.
Deferred tax liabilities increased by USD 1.6 billion mainly due to the acquisition of The Medicines Company.
Provisions and other non-current liabilities increased by USD 0.3 billion, and lease liabilities were broadly in line compared to December 31, 2019.
Total current liabilities of USD 33.1 billion increased by USD 4.8 billion compared to December 31, 2019.
Current financial debts and derivative financial instru-ments increased by USD 2.8 billion, due to the reclassi-fication from non-current to current financial debt of USD 2.3 billion and higher short-term borrowings, partly off-set by the repayment at maturity of two US dollar bonds totaling USD 2.0 billion.
Provisions and other current liabilities increased by USD 1.8 billion mainly due to a USD 1.8 billion treasury share repurchase obligation under a share buyback trad-ing plan and current income tax liabilities increased by USD 0.3 billion.
Trade payables and lease liabilities were broadly in line compared to December 31, 2019.
In our key countries, Switzerland and the United States, assessments have been agreed by the tax author-ities up to 2015 in Switzerland and 2014 in the United States, respectively, with the exception of one open United States position related to the 2007 tax filing. In addition, a subsidiary in France, acquired with the AAA acquisition, has an open position related to the tax years 2014 and 2015. Uncertainties also exist on the applica-tion of a German non-resident tax regulation for license or capital gains income derived from German registered intellectual property rights.
Novartis believes that its total provisions are ade-quate based upon currently available information. How-ever, given the inherent difficulties in estimating liabilities in this area, Novartis may incur additional costs beyond the amounts provided. Management believes that such additional amounts, if any, would not be material to the Group’s financial condition but could be material to the results of operations or cash flows in a given period.
EquityThe Group’s equity increased by USD 1.1 billion to USD 56.7 billion at December 31, 2020 compared to Decem-ber 31, 2019.
This increase was mainly due to the net income of USD 8.1 billion, the net effect of the exercise of options

Item 5. Operating and Financial Review and Prospects
81
and employee transactions of USD 0.8 billion, equi-ty-based compensation of USD 0.7 billion, favorable cur-rency translation differences of USD 3.2 billion and the net favorable fair value adjustments on financial instru-ments of USD 0.3 billion.
This was partly offset by the cash-dividend payment of USD 7.0 billion, purchase of treasury shares of USD 3.1 billion and the increase of the treasury share repur-chase obligation of USD 1.8 billion.
Summary of equity movements attributable to Novartis AG shareholders
Number of outstanding shares Equity attributable to (in millions) Novartis AG shareholders
2020 2019
2020 2019 USD millions USD millions
Balance at beginning of year 2 265.0 2 311.2 55 474 78 614
Impact of change in accounting policy 1 3
Restated equity at January 1 55 474 78 617
Shares acquired to be canceled – 32.6 – 60.3 – 2 897 – 5 351
Other share purchases – 1.7 – 1.7 – 159 – 160
Exercise of options and employee transactions 14.7 5.5 806 210
Repurchase of options – 89
Equity-based compensation 11.0 9.4 730 833
Shares delivered to Alcon employees as a result of the Alcon spin-off 0.4 0.9 30 18
Taxes on treasury share transactions 2 32 – 189
(Increase)/decrease of treasury share repurchase
obligation under a share buyback trading plan – 1 769 284
Transaction costs, net of taxes 3 – 253
Dividends – 6 987 – 6 645
Dividend in kind to effect the spin-off of Alcon Inc. 4 – 23 434
Net income of the year attributable to shareholders of Novartis AG 8 072 11 732
Other comprehensive income attributable to shareholders of Novartis AG 3 331 – 207
Impact of change in ownership of consolidated entities 6 – 3
Other movements 5 18 22
Balance at end of year 2 256.8 2 265.0 56 598 55 474
1 In 2019, the impact of change in accounting policy includes USD 3 million related to the implementation of IFRS 16 Leases (see “Item 18. Financial Statements—Note 1. Significant accounting policies”).
2 Included in 2019 is a USD 69 million impact related to the revaluation of deferred tax liability on treasury shares. This revaluation resulted from the Swiss federal tax reform enacted in May 2019 (see “Item 18. Financial Statements—Note 12. Deferred tax assets and liabilities”).
3 In 2019 transaction costs, net of tax of USD 36 million, directly attributable to the distribution (spin-off) of Alcon to Novartis shareholders (see “Item 18. Financial Statements—Note 1. Significant accounting policies”).
4 Included in 2019 is the fair value of the dividend in kind of Alcon Inc. shares to Novartis AG shareholders and ADR (American Depositary Receipt) holders approved at the 2019 Annual General Meeting held on February 28, 2019. Distribution was effected on April 8, 2019, whereby each Novartis AG shareholder and ADR holder received one Alcon Inc. share for every five Novartis AG shares/ADRs they held on April 8, 2019, close of business (see “Item 18. Financial Statements—Note 1. Significant accounting policies”).
5 Impact of hyperinflationary economies (see “Item 18. Financial Statements—Note 1. Significant accounting policies”).
In 2020, Novartis repurchased a total of 32.6 million shares for USD 2.9 billion on the SIX Swiss Exchange second trading line, including 8.0 million shares (USD 0.7 billion) bought back under the up-to USD 2.5 billion share buyback announced in November 2020, and 24.6 million shares (USD 2.2 billion) to mitigate dilution related to par-ticipation plans of associates. In addition, 1.7 million shares (USD 0.2 billion) were repurchased from associ-ates. In the same period, 26.1 million shares (for an equity value of USD 1.5 billion) were delivered as a result of options exercised and share deliveries related to partic-ipation plans of associates. Consequently, the total num-ber of shares outstanding decreased by 8.2 million ver-sus December 31, 2019. These treasury share transactions resulted in a decrease in equity of USD 1.6 billion and a net cash outflow of USD 2.1 billion including the benefit from net option proceeds.
In 2019, Novartis repurchased a total of 60.3 million shares for USD 5.4 billion on the SIX Swiss Exchange
second trading line, including 46.5 million shares (USD 4.2 billion) bought back under the up-to USD 5 bil-lion share buyback announced in June 2018, and 13.8 million shares (USD 1.1 billion) to mitigate dilution related to participation plans of associates. In addition, 1.7 mil-lion shares (USD 0.2 billion) were repurchased from associates. In the same period, 15.8 million shares (for an equity value of USD 1.1 billion) were delivered as a result of options exercised and share deliveries related to participation plans of associates. Consequently, the total number of shares outstanding decreased by 46.2 million versus December 31, 2018. These treasury share transactions resulted in a decrease in equity of USD 4.5 billion and a net cash outflow of USD 5.3 billion.
Treasury sharesAt December 31, 2020, our holding of treasury shares amounted to 210.2 million shares, or approximately 9% of the total number of issued shares. Approximately 103

Item 5. Operating and Financial Review and Prospects
82
million treasury shares were held in entities that restrict their availability for use.
At December 31, 2019, our holding of treasury shares amounted to 262.3 million shares, or approximately 10%
of the total number of issued shares. Approximately 118 million treasury shares were held in entities that restrict their availability for use.
Effects of currency fluctuations
We transact our business in many currencies other than the US dollar, our reporting currency.
The following table provides an overview of net sales and operating expenses for our continuing operations based on IFRS values for 2020 and 2019, for currencies most important to the Group:
2020 2019
Operating Operating
Net sales expenses Net sales expenses
Currency % % 1 % % 1
US dollar (USD) 36 34 37 36
Euro (EUR) 29 27 28 26
Swiss franc (CHF) 2 18 2 16
Japanese yen (JPY) 6 3 6 3
Chinese yuan (CNY) 5 3 5 4
Canadian dollar (CAD) 3 1 3 2
British pound (GBP) 2 3 2 2
Brazilian real (BRL) 2 1 2 1
Russian ruble (RUB) 2 1 2 1
Australian dollar (AUD) 1 1 1 1
Other currencies 12 8 12 8
1 Operating expenses include cost of goods sold; selling, general and administration; research and development; other income and other expense.
We prepare our consolidated financial statements in US dollars. As a result, fluctuations in the exchange rates between the US dollar and other currencies can have a significant effect on both the Group’s results of operations as well as the reported value of our assets, liabilities and cash flows. This in turn may significantly affect reported earnings (both positively and negatively) and the compa-rability of period-to-period results of operations.
For purposes of our consolidated balance sheets, we translate assets and liabilities denominated in other cur-rencies into US dollars at the prevailing market exchange rates as of the relevant balance sheet date. For purposes of the Group’s consolidated income and cash flow state-ments, revenue, expense and cash flow items in local cur-rencies are translated into US dollars at average exchange rates prevailing during the relevant period. As a result, even if the amounts or values of these items remain unchanged in the respective local currency, changes in exchange rates have an impact on the amounts or values of these items in our consolidated financial statements.
Because our expenditure in Swiss francs is signifi-cantly higher than our revenue in Swiss francs, volatility in the value of the Swiss franc can have a significant impact on the reported value of our earnings, assets and liabilities, and the timing and extent of such volatility can be difficult to predict.
There is also a risk that certain countries could devalue their currency. If this occurs, it could impact the effective prices we would be able to charge for our prod-ucts and also have an adverse impact on both our con-solidated income statement and balance sheet.
Subsidiaries whose functional currencies have expe-rienced a cumulative inflation rate of more than 100% over the past three years apply the rules of IAS 29 “Finan-cial Reporting in Hyperinflationary Economies.” Gains and losses incurred upon adjusting the carrying amounts of non-monetary assets and liabilities for inflation are recognized in the income statement. The hyperinflation-ary economies in which Novartis operates are Argentina and Venezuela. Venezuela was hyperinflationary for all years presented, and Argentina became hyperinflation-ary effective July 1, 2018, requiring retroactive implemen-tation of hyperinflation accounting as of January 1, 2018. The impacts from applying IAS 29 were not significant.
The Group manages its global currency exposure by engaging in hedging transactions where management deems appropriate, after taking into account the natural hedging afforded by our global business activity. For 2020, we entered into various contracts that change in value with movements in foreign exchange rates, to preserve the value of assets, commitments and expected transactions. We use forward contracts and foreign currency options to hedge. For more information on how these transactions affect our consolidated financial statements and on how foreign exchange rate exposure is managed, see “Item 18. Financial Statements—Note 1. Significant accounting pol-icies,” “Item 18. Financial Statements—Note 5. Interest expense and other financial income and expense,” “Item 18. Financial Statements—Note 15. Trade receivables,” “Item 18. Financial Statements—Note 28. Commitments and contingencies” and “Item 18. Financial Statements—Note 29. Financial instruments – additional disclosures.”

Item 5. Operating and Financial Review and Prospects
83
The following table sets forth the foreign exchange rates of the US dollar against key currencies used for foreign currency translation when preparing the Group’s consolidated financial statements:
Average for year Year-end
USD per unit 2020 2019 Change in % 2020 2019 Change in %
Australian dollar (AUD) 0.690 0.695 – 1 0.771 0.701 10
Brazilian real (BRL) 0.196 0.254 – 23 0.193 0.249 – 22
Canadian dollar (CAD) 0.746 0.754 – 1 0.784 0.767 2
Swiss franc (CHF) 1.066 1.006 6 1.135 1.032 10
Chinese yuan (CNY) 0.145 0.145 0 0.153 0.144 6
Euro (EUR) 1.141 1.120 2 1.229 1.121 10
British pound (GBP) 1.283 1.277 0 1.365 1.313 4
Japanese yen (JPY (100)) 0.937 0.918 2 0.970 0.920 5
Russian ruble (RUB (100)) 1.389 1.546 – 10 1.337 1.613 – 17
The following table provides a summary of the currency impact on key Group figures due to their conversion into US dollars, the Group’s reporting currency, of the financial data from entities reporting in non-US dollars. Constant currency (cc) calculations apply the exchange rates of the prior year to the current-year financial data for entities reporting in non-US dollars.
Currency impact on key figures
Change in Percentage Change in Percentage
Change in constant point currency Change in constant point currency
USD % currencies % impact USD % currencies % impact
2020 2020 2020 2019 2019 2019
Total Group – Continuing operations
Net sales to third parties 3 3 0 6 9 – 3
Operating income 12 19 – 7 8 14 – 6
Net income 13 20 – 7 – 44 – 41 – 3
Basic earnings per share (USD) 14 21 – 7 – 43 – 40 – 3
Core operating income 9 13 – 4 12 17 – 5
Core net income 9 12 – 3 11 15 – 4
Core basic earnings per share (USD) 9 13 – 4 12 17 – 5
Innovative Medicines
Net sales to third parties 3 4 – 1 8 11 – 3
Operating income – 1 4 – 5 18 24 – 6
Core operating income 8 11 – 3 13 18 – 5
Sandoz
Net sales to third parties – 1 0 – 1 – 1 2 – 3
Operating income 89 106 – 17 – 59 – 53 – 6
Core operating income 11 15 – 4 5 10 – 5
Corporate
Operating loss nm nm nm 6 4 2
Core operating loss 11 14 – 3 – 6 – 9 3
nm = not meaningful
For additional information on the effects of currency fluctuations, see “Item 18. Financial Statements—Note 29. Financial instruments – additional disclosures.”

Item 5. Operating and Financial Review and Prospects
84
Group liquidity, financial debts and net debtThe following table shows Group liquidity, financial debts and net debt:
(USD millions) 2020 2019
Non-current financial debts – 26 259 – 20 353
Current financial debts
and derivative financial
instruments – 9 785 – 7 031
Total financial debts – 36 044 – 27 384
Less liquidity
Cash and cash equivalents 9 658 11 112
Marketable securities,
commodities, time deposits
and derivative financial
instruments 1 905 334
Total liquidity 11 563 11 446
Net debt at December 31 1 – 24 481 – 15 938
1 For further information about the net debt measure, which is a non-IFRS measure, see “Item 5.A Operating results—Non-IFRS measures as defined by Novartis—Net debt”.
Financial year 2020Group net debt at December 31, 2020, increased to USD 24.5 billion, compared to USD 15.9 billion at Decem-ber 31, 2019.
Total financial debts increased by USD 8.7 billion to USD 36.0 billion at December 31, 2020. Non-current financial debts increased by USD 5.9 billion, mainly driven by the issuance of a euro denominated sustainabili-ty-linked bond for a notional amount of EUR 1.85 billion (USD 2.2 billion), and the issuance of US dollar denomi-nated bonds for a total notional amount of USD 5.0 bil-lion. This increase was partly offset by the reclassifica-tion from non-current to current financial debt for a total of USD 2.3 billion consisting of a EUR 1.25 billion (USD 1.5 billion) bond and a EUR 0.6 billion (USD 0.7 billion) bond due in March 2021 and November 2021, respec-tively.
Current financial debts and derivative financial instru-ments increased by USD 2.8 billion, due to the reclassi-fication from non-current to current financial debt of USD 2.3 billion and higher short-term borrowings, partly off-set by the repayment at maturity of two US dollar bonds totaling USD 2.0 billion.
Novartis has two US commercial paper programs under which it can issue up to USD 9.0 billion in the aggregate of unsecured commercial paper notes. Novartis also has a Japanese commercial paper program under which it can issue up to JPY 150 billion (approxi-mately USD 1.5 billion) of unsecured commercial paper notes. Commercial paper notes totaling USD 4.3 billion under these three programs were outstanding as per December 31, 2020 (2019: USD 2.3 billion).
Novartis also has a committed credit facility of USD 6.0 billion, which was renewed in 2019. This credit facility is provided by a syndicate of banks and is intended to be used as a backstop for the US commercial paper programs. The renewed facility matures in September 2024 and was undrawn as per December 31, 2020, and December 31, 2019.
As of year-end 2020, Moody’s Investors Service rated the Company A1 for long-term maturities and P-1 for short-term maturities and S&P Global Ratings rated the company AA- for long-term maturities and A-1+ for short-term maturities.
For the tables showing the maturity schedule of our current financial assets, current and non-current finan-cial debts and net debt at December 31, 2020 and December 31, 2019 see “Item 18. Financial Statements–Note 29. Financial instruments – Additional disclosures—Nature and extent of risks arising from financial instru-ments—Liquidity risk.”
For a description of risks and restrictions on the abil-ity of subsidiaries to transfer funds to the Company via cash dividends, loan or advances please see “Item 5.B Liquidity and capital resources—Group liquidity, finan-cial debts and net debt–Liquidity/short-term funding” and “Item 18. Financial Statements—Note 29. Financial instruments – Additional disclosures—Nature and extent of risks arising from financial instruments.”
Information regarding the Company’s material com-mitments for capital expenditures as of the end of 2020 and 2019 and an indication of the general purpose of such commitments and the anticipated sources of funds needed to fulfill such commitments are provided in “Item 5.F Tabular disclosure of contractual obligations.”

Item 5. Operating and Financial Review and Prospects
85
Liquidity and financial debt by currency
The following table provides a breakdown of liquidity and financial debt by currency as of December 31:
Financial Financial
Liquidity Liquidity debt in % debt in %
in % 2020 1 in % 2019 1 2020 2 2019 2
USD 57 72 55 53
CHF 11 14 10 12
EUR 23 7 30 29
JPY 1 2 3
Other 9 6 3 3
100 100 100 100
1 Liquidity includes cash and cash equivalents, marketable securities, commodities and time deposits.2 Financial debt includes non-current and current financial debt.
Bonds
In February 2020, a 3-year USD bond of USD 1.0 billion with a coupon of 1.80% was repaid at maturity.
In February 2020, four US dollar bonds totaling USD 5.0 billion were issued: a 5-year bond of USD 1.0 billion with a coupon of 1.75%, a 7-year bond of USD 1.25 billion with a coupon of 2.00%, a 10-year bond of USD 1.5 bil-lion with a coupon of 2.20%, and a 30-year bond of USD 1.25 billion with a coupon of 2.75%.
In April 2020, a 10-year USD bond of USD 1.0 billion with a coupon of 4.40% was repaid at maturity.
In September 2020, an 8-year euro sustainabili-ty-linked bond of EUR 1.85 billion with a coupon of 0.00% was issued.
In February 2019, a 10-year USD bond of USD 3.0 bil-lion with a coupon of 5.125% was repaid at maturity.
Liquidity/short-term funding
The Group’s liquidity amounted to USD 11.6 billion at December 31, 2020, compared to USD 11.4 billion at December 31, 2019. Total non-current and current finan-cial debts, including derivatives, amounted to USD 36.0 billion at December 31, 2020, compared to USD 27.4 bil-lion at December 31, 2019.
The debt/equity ratio increased to 0.64:1 at Decem-ber 31, 2020, compared to 0.49:1 at December 31, 2019.
The net debt increased to USD 24.5 billion at December 31, 2020, compared to USD 15.9 billion at December 31, 2019.
We continuously track our liquidity position and asset/liability profile. This involves modeling cash flow maturity profiles based on both historical experiences and contractual expectations to project our liquidity requirements. We seek to preserve prudent liquidity and funding capabilities. We are confident that we have suf-ficient liquidity to support our normal business activities for the foreseeable future.
Certain countries have legal or economic restrictions on the ability of subsidiaries to transfer funds to the Group in the form of cash dividends, loans or advances, but these restrictions do not have an impact on the abil-ity of the Group to meet its cash obligations.
We are not aware of any significant demands to change the level of liquidity needed to support our nor-mal business activities. We make use of various borrow-ing facilities provided by several financial institutions. We also successfully issued various bonds in previous years (including 2018), and raised funds through our commer-cial paper programs.
The maturity schedule of our net debt can be found in “Item 18. Financial Statements–Note 29. Financial instruments –Additional disclosures—Nature and extent of risks arising from financial instruments—Liquidity risk.”

Item 5. Operating and Financial Review and Prospects
86
5.C Research and development, patents and licenses
Our research and development spending from continu-ing operations totaled USD 9.0 billion and USD 9.4 bil-lion (Core research and development USD 8.5 billion and USD 8.4 billion) for the years 2020 and 2019, respec-tively.
Each of our divisions has its own research and devel-opment and patent policies. Our divisions have numer-ous products in various stages of development. For fur-ther information on these policies and these products in development, see “Item 4. Information on the Company—Item 4.B Business overview.”
As described in the risk factors section and else-where in this Annual Report, our drug development efforts are subject to the risks and uncertainties inher-
ent in any new drug development program. Due to the risks and uncertainties involved in progressing through preclinical development and clinical trials, and the time and cost involved in obtaining regulatory approvals, among other factors, we cannot reasonably estimate the timing, completion dates and costs, or range of costs, of our drug development programs, or of the development of any particular development compound (see “Item 3. Key Information—Item 3.D Risk factors”). In addition, for a description of the research and development process for the development of new drugs and our other prod-ucts, and the regulatory process for their approval, see “Item 4. Information on the Company—Item 4.B Business overview.”
5.D Trend information
Please see “—Item 5.A Operating results”, “—Item 5.B Liquidity and capital resources” and “Item 4. Information
on the Company—Item 4.B Business overview” for trend information.
5.E Off-balance sheet arrangements
We have no unconsolidated special purpose financing or partnership entities or other off-balance sheet arrangements that have or are reasonably likely to have a current or future effect on our financial condition, changes in financial condition, revenues or expenses,
results of operations, liquidity, capital expenditures or capital resources, that is material to investors. See also “Item 18. Financial Statements—Note 28. Commitments and contingencies,” and matters described in “— Item 5.F Tabular disclosure of contractual obligations.”

Item 5. Operating and Financial Review and Prospects
87
5.F Tabular disclosure of contractual obligations
The following table summarizes the Group’s contractual obligations and other commercial commitments, as well as the effect these obligations and commitments are expected to have on the Group’s liquidity and cash flow in future periods:
Payments due by period
Less than After
(USD millions) Total 1 year 2–3 years 4–5 years 5 years
Non-current financial debt, including current portion 28 531 2 272 5 177 5 444 15 638
Interest on non-current financial debt, including current portion 6 647 550 1 014 832 4 251
Lease liabilities, non-current and current portion 2 005 286 415 277 1 027
Interest on lease liabilities, non-current and current portion 1 502 52 85 66 1 299
Unfunded pensions and other post-employment benefit plans 1 760 93 190 191 1 286
Research and development potential milestone commitments 5 232 449 1 016 764 3 003
Contingent consideration liabilities 1 046 62 327 312 345
Property, plant and equipment purchase commitments 256 223 29 4
Acquisition of business commitments 235 210 7 18
Research and development commitments on transactions
entered into but not closed in 2020 1 3 296 549 408 930 1 409
Total contractual cash obligations 50 510 4 746 8 668 8 816 28 280
1 For research and development commitments on transactions entered into but not closed in 2020, please refer to “Item 18. Financial Statements – Note 28 Commitments and contingencies – research and development commitments”.
The Group intends to fund the research and develop-ment; property, plant and equipment; intangible asset purchase commitments with internally generated resources, and the acquisition of business commitment through available cash and short- and long-term borrow-ings.
For other contingencies, see “Item 8. Financial Infor-mation—Item 8.A Consolidated statements and other financial information,” “Item 18. Financial Statements — Note 10. Right-of-use assets and lease liabilities,” “Item 18. Financial Statements—Note 20. Provisions and other non-current liabilities,” and “Item 18. Financial State-ments—Note 28. Commitments and contingencies.”

Item 6. Directors, Senior Management and Employees
88
Item 6. Directors, Senior Management and Employees6.A Directors and senior management
The information set forth under “Item 6. Directors, Senior Management and Employees—Item 6.C Board prac-tices—Corporate governance—Board of Directors” and
“Item 6. Directors, Senior Management and Employees—Item 6.C Board practices—Corporate governance—Executive Committee” is incorporated by reference.

Item 6. Directors, Senior Management and Employees
89
6.B Compensation
Dear shareholder, I am pleased to share with you the 2020 Compensation Report of Novartis AG. It follows a similar structure to the previous year’s report, which was supported by over 92% of shareholders.
From the 2020 Annual General Meeting (AGM), we welcomed new member Bridgette Heller and permanent guest Simon Moroney to the Compensation Committee. I have been grateful for their contributions during the year. In addition, I would like to express my sincere grat-itude to Srikant Datar, who will step down from the Com-pensation Committee at the 2021 AGM, for his valuable engagement throughout his tenure with the Committee.
Feedback from shareholders prior to our last AGM and, more recently, toward the end of 2020 suggested that shareholders were in agreement that our current compensation system is aligned with the Company’s purpose, strategy and culture. No changes are therefore proposed for 2021.
COVID-19 pandemicDuring 2020, Novartis navigated the pandemic well. We increased our focus on associates’ health and well-be-ing by implementing a number of support programs, including additional paid leave, childcare assistance during school closures, a one-time payment for home office setup, a new flexible working scheme within the country of employment, and a one-time payment to asso-ciates and external contractors required to work on site (i.e., in our laboratories or our manufacturing units). No government assistance (e.g., subsidies, furloughs) was sought by the Company, and no COVID-19-related asso-ciate redundancies were made. Through these actions, we were able to minimize the disruption to our business operations and consequently were in a position to com-mit to making no changes to our dividend policy for 2021.
To help tackle the issues caused by the pandemic directly, Novartis made a number of commitments, col-laborating with healthcare peers and other organizations on anti-COVID-19 programs, including the rollout of treat-ments to the developing world. More information on Novartis response efforts can be found in our Novartis in Society ESG Report 2020.
2020 Company performanceFinancial performance in 2020 was solid despite the impact of the global pandemic. Net sales to third parties for Novartis continuing operations grew 3% in reported terms and 3% measured in constant currencies (cc), which removes the impact of exchange rate movements. Growth was mainly driven by Cosentyx (USD 4.0 billion in sales), Entresto (USD 2.5 billion), Promacta/Revolade (USD 1.7 billion), and Zolgensma (USD 0.9 billion). Other recently launched products, including Kisqali, Piqray and Kymriah, also contributed. However, this was below our ambitious net sales plan, as COVID-19 weighed on cer-tain therapeutic areas, most notably dermatology and
ophthalmology, and the Sandoz Retail Generics business. The safety updates on Beovu also impacted the business.
Operating income grew 19% versus the prior year (cc), and net income grew 20% versus the prior year (cc). Core operating income grew 13% versus the prior year (cc), exceeding the target, driven by improved produc-tivity in marketing and sales as well as research and development, and Novartis Technical Operations (NTO) network transformation initiatives. Core operating income margin increased to 31.7% (+2.8 percentage points cc versus the prior year, and +1.5 percentage points cc versus target), with Innovative Medicines core margin reaching 35%.
Free cash flow amounted to USD 11.7 billion. The tar-get, as a percentage of sales, was slightly overachieved due to continued strong cash collection despite higher legal fee payouts.
Financial performance determines 60% of the CEO’s Annual Incentive balanced scorecard. Targets for the financial measures were set at the start of the year, and the Compensation Committee determined that it would not adjust or apply upwards discretion to reflect the neg-ative impact of the pandemic or settlements of legacy legal cases. Overall, our aforementioned performance resulted in achievement meeting target for this element of the Annual Incentive.
Strategic objectives determine the remaining 40% of the CEO’s Annual Incentive balanced scorecard. Prog-ress against these objectives resulted in achievement meeting target for this element of the CEO’s Annual Incentive. More details on our strategic objectives as well as our financial performance can be found in “—2020 CEO balanced scorecard.”
Two of the five strategic objectives in the CEO’s Annual Incentive balanced scorecard relate to environ-mental, social and governance (ESG) matters: “people and culture” and “building trust with society.” We con-tinue to integrate ESG, a priority for the Novartis Board of Directors and the Executive Committee, across our operations. Novartis focuses on four strategic ESG pil-lars: ethical standards, pricing and access, global health challenges and corporate citizenship. In addition to the COVID-19-related efforts previously mentioned, partic-ular achievements in 2020 included:• Setting ambitious long-term environmental targets for
our entire supply chain • Increasing our patient reach in low- and middle-income
countries with emerging market brands and flagship programs (i.e., Chagas disease, leprosy, malaria and sickle cell disease)
• Continuing to make great progress on our diversity and inclusion strategy related to gender balance, LGBTI equity, disability equity, and race and ethnicity
• Issuing a sustainability-linked bond, the first of its kind in the healthcare industry
• Launching our new Code of Ethics

Item 6. Directors, Senior Management and Employees
90
Significant upgrades from ESG rating agencies such as MSCI and Sustainalytics in the latest reporting season were based on closing compliance-related allegations; strong governance, including extensive ethics policies; leading programs to expand access to healthcare for low-income populations; and a comprehensive employee engagement strategy relative to peers.
2020 realized compensationBased on the overall balanced scorecard assessment meeting target, the Board of Directors decided on an Annual Incentive resulting in a payout for the CEO amounting to CHF 2 636 550, which is 100% of target, within the range of 0–200%.
The 2018-2020 Long-Term Incentive (LTI) plans com-prise the Long-Term Performance Plan (LTPP) and the Long-Term Relative Performance Plan (LTRPP). The 2018-2020 LTPP delivered strong results. The Cash Value Added target – which has continued to increase for the last three cycles – was exceeded, and innovation was above target. For the 2018-2020 LTRPP, Novartis was above median, ranking 7 out of a total of 15 global healthcare peers (including Novartis) on three-year relative total shareholder return (TSR). Overall, when considering both plans, the Board of Directors awarded the CEO a total LTI payout of CHF 8 054 923, corre-sponding to a 126% payout against a maximum of 200%.
No Annual Incentive or LTI targets were adjusted as a result of the pandemic.
The Board determined that no adjustments were required to the incentive payouts, notwithstanding the Company’s supportive treatment of associates and ability to adapt to new ways of working throughout the pandemic, without government assistance or making any COVID-19-related redundancies. In addition, Novartis is committing to a 2021 dividend to shareholders, in line with its policy.
These incentive performance outcomes, combined with base salary and other benefits, pension, Alcon Keep Whole awards and dividend equivalents, resulted in 2020 total realized compensation for the CEO of CHF 12 724 166.
The higher total realized compensation for the CEO compared to 2019 can be attributed to the vesting of his first LTI granted after his promotion to CEO in 2018.
The 2020 total realized compensation for the Exec-utive Committee members (comprising the CEO and the other 12 active Executive Committee members) was CHF 58 819 813. This is lower than the prior year due to the reduction in members reported (two members stepped down and were replaced in 2019, whereas no members stepped down in 2020). For more detail on the 2020 realized pay for the CEO and ECN members, please see “—2020 realized compensation for the CEO and other Executive Committee members.”
Board compensation In 2020, the Compensation Committee reviewed, with its independent advisor, the Board of Directors’ compen-sation system against the Swiss Market Index. Additional information on our Board benchmarking practices is provided in “—2020 Board compensation.”
They found that the Chairman and retainer fees of the other Board members are well positioned and com-petitive among the benchmarked companies in relation to the Company’s size, operational complexity and corporate headquarters location. The Compensation Committee therefore proposed no changes to the Board of Directors’ fees for the 2021-2022 AGM.
2021 AGMIn line with our Articles of Incorporation, at the 2021 AGM, shareholders will be asked to approve, in a binding vote, the maximum aggregate amount of compensation for the Board of Directors from the 2021 AGM to the 2022 AGM, and the maximum aggregate amount of compen-sation for the Executive Committee for the financial year 2022. Shareholders will also be asked to endorse this Compensation Report in an advisory vote.
This will be my last year as Chairman of the Compen-sation Committee of the Board of Directors, and I would like to thank you all for your support throughout my nine-year tenure. I will stand for election as a member of our Compensation Committee at the 2021 AGM to ensure a smooth transition to my successor. We will also ask shareholders to elect Simon Moroney to the Compen-sation Committee and, if support is received, the Board of Directors will then appoint him as the new Chairman of the Compensation Committee.
On behalf of Novartis and the Compensation Committee, I would like to thank you for your continued engagement and feedback, which we consider extremely valuable in driving improvements in our compensation systems and practices.
Respectfully,
Enrico Vanni, Ph.D.Chairman of the Compensation Committee

Annual base salary Pension and other benefits
2020 Annual Incentive Long-Term Incentive awards cycle 2018-2020
2020 fixed pay and benefits
Reflects responsibil-ities, experience and skill sets
Cash
–
Provides retirement and risk insurances (tailored to local market practices/regulations)
Country/individual- specific and aligned with other employees
–
Rewards for perfor-mance against short-term financial and stra-tegic objectives, and Values and Behaviors
50% cash 50% equity3 deferred for three years
Balanced scorecard comprising:• Financial measures
(60%)• Strategic objectives4
(40%)
Rewards long-term shareholder value creation and innovation in line with our strategy
Equity, vesting following a three-year performance period
• Novartis Cash Value Added (75%)
• Innovation mile-stones (25%)
• Relative TSR versus global sector peers (100%)5
LTPP1 LTRPP2
Performance-related variable pay
Purpose
Form of payment
Performance measures
1 LTPP = Long-Term Performance Plan 2 LTRPP = Long-Term Relative Performance Plan3 Executive Committee members may elect to receive more of their Annual Incentive in equity instead of cash.4 Strategic objectives are aligned with the five strategic pillars: innovation, operational excellence, data and digital, people and culture, and building trust with society.5 For the 2018-2020 performance cycle, the peer group comprises 15 global healthcare companies, including Novartis, as listed in “—Approach to market benchmarking.”
Item 6. Directors, Senior Management and Employees
91
Compensation at a glanceExecutive Committee compensation system
Target incentive opportunity levels for the CEO are 150% and 325% of base salary for the Annual Incentive and LTI, respectively. Based on Novartis compensation guidelines, the other members of the Executive Committee have Annual Incentive and LTI target opportunity levels that range from 80% to 120%, and 160% to 270% of base sal-ary, respectively. The payout range remains at 0% to 200% of target opportunity based on achievement against performance. The 2018-2020 cycle will be the last vesting of the LTRPP plan, which was discontinued as of grants made in 2019. The LTPP metrics were subsequently transformed into four equally weighted measures: net sales compound annual growth rate, core operating income compound annual growth rate, innovation and relative TSR.
Compensation governance at a glance
A summary of the compensation decision authorization levels within the parameters set by the AGM is shown below, along with an overview of the risk management principles.
DECISION ON DECISION-MAKING AUTHORITY
Compensation of Chairman and other Board members Board of Directors
Compensation of CEO Board of Directors
Compensation of other Executive Committee members Compensation Committee
EXECUTIVE COMMITTEE COMPENSATION RISK MANAGEMENT PRINCIPLES
• Rigorous performance management process
• Balanced mix of short-term and long-term variable compensation elements
• Performance evaluation under the Annual Incentive includes an individual balanced scorecard
• Performance-based LTI, with three-year cycles
• All variable compensation is capped at 200% of target
• Contractual notice period of 12 months• Post-contractual non-compete period
limited to a maximum of 12 months from the end of employment. Resulting compensation is limited to the annual base salary plus the prior-year Annual Incentive as per contract, if applicable
• Good and bad leaver provisions apply to the variable compensation of leavers
• No severance payments or change-of-control clauses
• Clawback and malus principles apply to all elements of variable compensation
• Share ownership requirements; no hedging or pledging of Novartis share ownership position
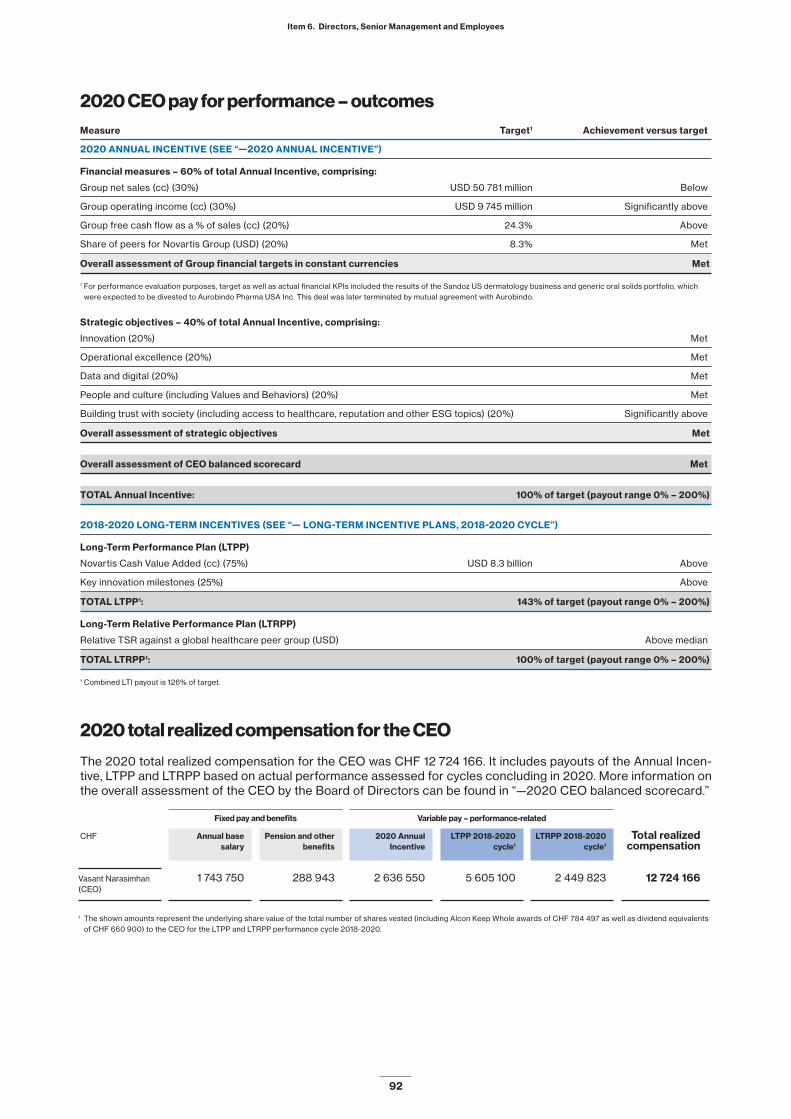
Measure Target1 Achievement versus target
2020 ANNUAL INCENTIVE (SEE “—2020 ANNUAL INCENTIVE”)
Financial measures – 60% of total Annual Incentive, comprising:
Group net sales (cc) (30%) USD 50 781 million Below
Group operating income (cc) (30%) USD 9 745 million Significantly above
Group free cash flow as a % of sales (cc) (20%) 24.3% Above
Share of peers for Novartis Group (USD) (20%) 8.3% Met
Overall assessment of Group financial targets in constant currencies Met
1 For performance evaluation purposes, target as well as actual financial KPIs included the results of the Sandoz US dermatology business and generic oral solids portfolio, which were expected to be divested to Aurobindo Pharma USA Inc. This deal was later terminated by mutual agreement with Aurobindo.
Strategic objectives – 40% of total Annual Incentive, comprising:
Innovation (20%) Met
Operational excellence (20%) Met
Data and digital (20%) Met
People and culture (including Values and Behaviors) (20%) Met
Building trust with society (including access to healthcare, reputation and other ESG topics) (20%) Significantly above
Overall assessment of strategic objectives Met
Overall assessment of CEO balanced scorecard Met
TOTAL Annual Incentive: 100% of target (payout range 0% – 200%)
2018-2020 LONG-TERM INCENTIVES (SEE “— LONG-TERM INCENTIVE PLANS, 2018-2020 CYCLE”)
Long-Term Performance Plan (LTPP)
Novartis Cash Value Added (cc) (75%) USD 8.3 billion Above
Key innovation milestones (25%) Above
TOTAL LTPP1: 143% of target (payout range 0% – 200%)
Long-Term Relative Performance Plan (LTRPP)
Relative TSR against a global healthcare peer group (USD) Above median
TOTAL LTRPP1: 100% of target (payout range 0% – 200%)
1 Combined LTI payout is 126% of target.
Item 6. Directors, Senior Management and Employees
92
2020 CEO pay for performance – outcomes
2020 total realized compensation for the CEO
The 2020 total realized compensation for the CEO was CHF 12 724 166. It includes payouts of the Annual Incen-tive, LTPP and LTRPP based on actual performance assessed for cycles concluding in 2020. More information on the overall assessment of the CEO by the Board of Directors can be found in “—2020 CEO balanced scorecard.”
Fixed pay and benefits Variable pay – performance-related
CHF Annual base Pension and other 2020 Annual LTPP 2018-2020 LTRPP 2018-2020 Total realized salary benefits Incentive cycle1 cycle1 compensation
Vasant Narasimhan 1 743 750 288 943 2 636 550 5 605 100 2 449 823 12 724 166(CEO)
1 The shown amounts represent the underlying share value of the total number of shares vested (including Alcon Keep Whole awards of CHF 784 497 as well as dividend equivalents of CHF 660 900) to the CEO for the LTPP and LTRPP performance cycle 2018-2020.

Item 6. Directors, Senior Management and Employees
93
2020 Board compensation system
The compensation system applicable to the Board of Directors is shown below and remains unchanged since the prior year. All fees to the Board members are delivered at least 50% in shares and the remainder in cash. AGM 2020-2021
CHF 000s annual fee
Chairman of the Board 3 800
Board membership 280
Vice Chairman 50
Chair of the Audit and Compliance Committee 130
Chair of the Compensation Committee 90
Chair of the following committees:
• Governance, Nomination and Corporate Responsibilities Committee
• Science & Technology Committee
• Risk Committee 70
Membership of the Audit and Compliance Committee 70
Membership of the following committees:
• Compensation Committee
• Governance, Nomination and Corporate Responsibilities Committee
• Science & Technology Committee
• Risk Committee 40
2020 Board compensation
Total actual compensation earned by Board members in the 2020 financial year is shown in the table below. 2020
CHF 000s total compensation 1
Chairman of the Board 3 805
Other 13 members of the Board 4 925
Total 8 729
1 Includes an amount of CHF 26 118 for mandatory employer contributions for all Board members paid by Novartis to governmental social security systems. This amount is out of total employer contributions of CHF 430 023 , and provides a right to the maximum future insured government pension benefit for the Board member.

Pay for performance
• Variable compensation is tied directly to the achievement of strategic Company targets
Shareholder alignment
• Our incentives are significantly weighted toward long-term equity-based plans
• Measures under the Long-Term Incentive plans are calibrated to promote the creation of shareholder value
• Executive Committee members are expected to build and maintain substantial shareholdings
Balanced rewards
• Balanced set of measures to create sustainable value
• Mix of targets based on financial metrics, strategic objectives, and performance versus our competitors
Business ethics
• The Novartis Values and Behaviors are an integral part of our compensation system
• They underpin the assessment of overall performance for the Annual Incentive
Competitive compensation
• Total compensation must be sufficient to attract and retain key global talent
• Overarching emphasis on pay for performance
GLOBAL HEALTHCARE PEER GROUP
AbbVie
Biogen
GlaxoSmithKline
Novo Nordisk
Roche
Amgen
Bristol-Myers Squibb
Gilead Sciences
Merck & Co.
Sanofi
AstraZeneca
Eli Lilly & Co.
Johnson & Johnson
Pfizer
Item 6. Directors, Senior Management and Employees
94
Executive Committee compensation philosophy and principlesNovartis compensation philosophy
Our compensation philosophy aims to ensure that we attract and retain outstanding Executive Committee members and that they are rewarded according to their success in implementing the Company strategy, and their contribution to Company performance and long-term value creation.
Alignment with Company strategy
Our strategy is to build a leading, focused medicines com-pany powered by advanced therapy platforms and data science. We foster a company culture that is inspired, curi-ous and unbossed. We believe these elements drive con-tinued innovation and will support the creation of value over the long term for our Company, society and shareholders.
To align the compensation system with this strategy and to ensure that Novartis is a high-performing organiza-tion, the Company operates both a short-term Annual Incentive and an LTI plan with a balanced set of measures and targets. The Board of Directors determines specific, measurable and time-bound performance measures for the Annual Incentive and LTI plan. The Compensation Com-mittee has reviewed the existing compensation system and determined that it continues to support our strategy.
Approach to market benchmarking
There remains significant competition for top executive talent with deep expertise, competencies and proven per-formance within the pharmaceutical and biotechnology
industries. As such, external peer compensation data is one of a number of key reference points considered by the Board of Directors and the Compensation Committee when making decisions on executive pay, helping to ensure that the compensation system and compensation levels at Novartis remain competitive. Novartis makes the commitment to shareholders to confirm benchmarking practices, including the peer group, each year.
The Compensation Committee believes in a rigorous approach to peer group construction and maintenance. The Compensation Committee also believes that using a consistent set of peers that is similar in size and scope enables shareholders to evaluate the compensation year on year and make pay-for-performance comparisons. As such, following a review of the benchmarking peer group, the Compensation Committee decided to maintain the same primary peer group of 14 global healthcare com-panies until the end of 2020 (with the exception of Cel-gene, which was acquired by Bristol-Myers Squibb), as presented below.
The companies in this peer group reflect our industry and are similar to Novartis in terms of both size and scope of operations. Novartis target compensation is generally positioned around the market median benchmark for com-parable roles within this group.
Although Novartis is headquartered in Switzerland, more than a third of its sales come from the US market, and the US remains a significant talent pool for the recruitment of executives by the Company. It is therefore critical that Novartis is able to attract and retain key tal-ent globally, especially from the US.
For consideration of European and local practices, the Compensation Committee also references a cross-in-dustry peer group of Europe-headquartered multina-tional companies, selected on the basis of comparability in size, scale, global scope of operations, and economic influence to Novartis.
Six of these companies focus mainly on healthcare: AstraZeneca, GlaxoSmithKline, Merck KgaA, Novo Nor-disk, Roche and Sanofi. Nine companies are selected from the STOXX® All Europe 100 Index representing mul-tiple sectors: Anheuser-Busch InBev, Bayer, BMW, Daim-ler, Danone, Heineken, L’Oréal, Nestlé and Unilever.
Due to the varying impact of the global pandemic on different companies, we believe that this year has demon-strated the importance of using a more homogeneous industry peer group, where possible.

ELEMENT OF COMPENSATION POLICY
Level The overall package should be market-competitive to enable the recruitment of global executive talent with deep expertise and competencies.
Annual base salary The Compensation Committee may appoint individuals who are new to a role on an annual base salary that is below the market level, with a view to increase this toward a market level over a period of three to four years as an individual develops in the role.
This prudent approach ensures pay levels are merit-based, with increases dependent on strong performance and proven ability in the role over a sustained period.
Incentives The ongoing compensation package will normally include the key compensation elements and incentive opportunities in line with those offered to current Executive Committee members.
In exceptional circumstances, higher Long-Term Incentive opportunities than those offered to current Executive Committee members may be provided at the Compensation Committee’s discretion.
Performance measures may include business-specific measures tailored to the specific role.
Pension and other benefits Newly appointed Executive Committee members are eligible for a local market pension and other benefits in line with the wider employee group.
Buyouts The Compensation Committee seeks to balance the need to offer competitive compensation opportunities to acquire the talent required by the business with the principle of maintaining a strong focus on pay for performance.
As such, when an individual forfeits variable compensation as a result of an appointment at Novartis, the Compensation Committee may offer replacement awards in such form as the Compensation Committee considers appropriate, taking into account relevant factors.
Relevant factors include the replacement vehicle (i.e., cash, restricted share units, restricted shares or performance share units), whether the award is contingent on meeting performance conditions or not, the expected value of the forfeited award, the timing of forfeiture (i.e., Novartis mirrors the blocking or vesting period of the forfeited award) and the leaver conditions, in case the recruited individual leaves Novartis prior to the end of the blocking or vesting period.
The Compensation Committee will seek to pay no more than is required to match the commercial value or fair value of payments and awards forfeited by the individual.
International mobility If individuals are required to relocate or be assigned away from their home location to take up their position, relocation support may be provided in line with our global mobility policies (i.e., relocation support, tax equalization).
Item 6. Directors, Senior Management and Employees
95
Executive Committee appointments compensation policy

ELEMENT OF COMPENSATION POLICY
Annual Incentive – cash element
Retirement, termination by the Company (for reasons other than performance or conduct), change of control, disability, death i.e. “good leavers”Pro-rata Annual Incentive is paid to reflect the portion of the year the individual was employed.
Any other reasonNo Annual Incentive.
Annual Incentive – mandatory deferral into restricted shares/
RSUs
If a participant leaves employment due to voluntary resignation or misconduct, unvested restricted shares and restricted share units (RSUs) are forfeited.
If a participant leaves involuntarily, restricted shares and RSUs are released on the original blocking end date.
All awards are subject to non-compete terms until the end of the three-year blocking date, starting from the date of grant.
Annual Incentive – voluntary restricted shares/RSUs/ADRs
(US associates only)
Awards are not subject to forfeiture during the deferral period.
Long-Term Incentives (LTPP/LTRPP)
Voluntary resignation or termination by the Company for misconductAll of the award will be forfeited.
Termination by the Company for reasons other than performance or conduct, and change in control due to divestment (including retirement)Awards vest on the regular vesting date, subject to performance, on a pro-rata basis for time spent with the Company during the performance cycle. There is no accelerated vesting.
Death or long-term disability Accelerated vesting at target will be applied.
Non-compete agreementAll awards are subject to non-compete terms against the healthcare peer group until the vesting date.
Item 6. Directors, Senior Management and Employees
96
Treatment of variable compensation for Executive Committee leavers
Malus and clawback
Any incentive compensation paid to Executive Commit-tee members is subject to malus and clawback rules. This means that the Board of Directors for the CEO, and the Compensation Committee for the other Executive Committee members, may decide – subject to applica-ble law – to retain any unpaid or unvested incentive com-pensation (malus), or to recover incentive compensation
that has been paid or has vested in the past (clawback). This applies in cases where the payout has resulted from a violation of laws or conflicts with internal management standards, including Company and accounting policies.
This principle applies to both the short-term Annual Incentive and LTI plans.

Objective setting
• The CEO proposes his targets to the Chairman of the Board; they are then reviewed and approved by the Board of Directors, based on input from the Compensation Committee.
• For other Executive Committee members, targets for their division or unit are initially discussed with the CEO and subsequently approved by the Board of Directors and Compensation Committee.
Performance evaluation
• The CEO’s performance against the individual balanced scorecard is assessed by the Board of Directors.
• For Executive Committee members, the CEO discusses with the Chairman each member’s performance (assessed against his or her individual balanced scorecard) before making recommendations to the Board of Directors.
• Periodic assessments, including at the mid-year stage, ensure progress is suitably tracked.
Compensation determination
• A recommendation for the CEO’s variable pay is made by the Compensation Committee to the Board of Directors for final determination.
• For the Long-Term Incentive financial measures payout schedules, a formulaic approach applies and the Compensation Committee can also exercise judgment to ensure there is appropriate alignment between payout levels and overall performance achieved. The same principle of discretion applies to the relative TSR and innovation performance measures.
• The CEO’s recommendations for other Executive Committee members are considered and approved by the Compensation Committee, after which the Board of Directors is notified of the outcomes.
Item 6. Directors, Senior Management and Employees
97
Executive Committee performance management process
To foster a high-performance culture, the Company applies a uniform performance management process worldwide, based on quantitative and qualitative criteria, including our Values and Behaviors. All Novartis associ-ates, including the CEO and other Executive Committee members, are subject to a formal three-step process: objective setting, performance evaluation and compen-sation determination. This process is explained below.
Performance targets are generally set before the start of the relevant performance cycle. There is a rigor-ous framework in place for establishing targets to ensure they are suitably robust and challenging, and align with the strategic priorities of the Group. The key factors taken into account when setting targets include:• Novartis strategic priorities• Internal and external market expectations• Regulatory factors (e.g., new launches, patent expiries)• Investment in capital expenditure• Values and Behaviors
The targets are challenged at multiple stages before they are ultimately approved by the Board of Directors. In line with good governance practices, the Compensation Committee works to set targets that are ambitious and challenging but do not encourage undue risk-taking.
Following the end of the performance cycle, the Board of Directors and the Compensation Committee consider performance against the targets originally set. The CEO and Executive Committee members are not present while the Board of Directors and the Compensation Commit-tee discuss their individual performance evaluations. Prior to determining the final outcome, related factors such as performance relative to peers, wider market con-ditions, general industry trends and good practice are used to inform the overall performance assessment.

Annual base salary
Overview • The annual base salary is reviewed each year, taking into account the individual’s role, performance and experience, business performance and the external environment, increases across the Group and market movements.
2020 annual base salaries The 2020 annual base salaries were as follows:• CEO (effective March 1, 2020): CHF 1 757 700 • OTHER EXECUTIVE COMMITTEE MEMBERS (effective March 1, 2020): All other members of the
Executive Committee were awarded increases in line with the average of all Novartis employees, with the exception of four individuals as disclosed in Item 6.B of the 2019 Annual Report. These members were appointed to their roles with base salaries below external market median level and have demonstrated excellent performance during their tenure.
Pension and other benefits
Overview • Pension and other benefits do not constitute a significant proportion of total compensation and are provided to the Executive Committee on the same terms as all other associates based on local country practices and regulations.
• The CEO and all other Swiss-based members of the Executive Committee are members of the Novartis Swiss pension funds, which provide Company contributions on the base salary and Annual Incentive up to the legal cap on the insured salary of CHF 853 200. No supplementary pension plans or savings plans are provided. The CEO’s employer pension contributions represent 10.04% of his base salary.
• Globally the Company operates both defined benefit and defined contribution pension plans (see also Note 25 to the Group’s consolidated financial statements).
• Novartis may provide other benefits according to local market practice. These include Company car provision, tax and financial planning, and insurance benefits.
• Executive Committee members who are required to relocate internationally may also receive additional benefits (including tax equalization), in line with the Company’s global mobility policies.
Item 6. Directors, Senior Management and Employees
98
2020 Executive Committee compensation Performance outcomes

PLAN OVERVIEW
Target Annual Incentive
On-target opportunities • CEO: 150% of annual base salary• Other Executive Committee members: 80% to 120% of annual base salary
Performance measures • An Annual Incentive balanced scorecard containing:• Financial performance measures related to Group, division or business unit, where relevant (60% weighting)• Five key strategic objectives in the areas of innovation, operational excellence, data and digital, people
and culture, and building trust with society (40% weighting)• The 2020 balanced scorecard targets and achievements of the CEO are detailed on the next page.• The 2020 balanced scorecards for other Executive Committee members include Group financial targets as
well as financial or other quantitative targets that relate to their division or business unit, if applicable.• Values and Behaviors are a key component of the Annual Incentive and are embedded in our culture. As
such, members of the Executive Committee are expected to demonstrate these to the highest standards.
Target setting • Financial targets are set at the beginning of each financial year and align with the strategic plan proposed by management to the Board of Directors for approval.
• The strategic objectives are aligned with the most important priorities in any performance year.
Payout ranges • The payout schedule for the Annual Incentive incorporates performance against financial and strategic objectives. The payout range is 0% to 200% of on-target opportunity based on performance, as shown below:
PERFORMANCE PAYOUT (% of on-target)
Outstanding 170% – 200%
Exceeds expectations 130% – 160%
Meets expectations 80% – 120%
Partially meets expectations 40% – 70%
Below expectations 0%
Payout formula
Payout vehicle • At the end of the performance period, 50% is paid in cash, and the remaining 50% is delivered in Novartis restricted shares or RSUs, deferred for three years (see “—Treatment of variable compensation for Executive Committee leavers”).
• Executives may choose to receive all or part of the cash portion of their Annual Incentive in Novartis shares or American Depositary Receipts (ADRs; US only) that will not be subject to forfeiture conditions. In the US, awards may also be delivered in cash under the US-deferred compensation plan.
• Clawback and malus provisions apply to all Annual Incentive awards.
Dividend rights, voting rights and settlement
• Novartis restricted shares carry voting rights and dividends during the vesting period. RSUs are of equivalent value but do not carry voting rights and dividends during the vesting period.
• Following the vesting period, settlement of RSUs is made in unrestricted Novartis shares or ADRs.
Annual base salary
Target incentive (% of base salary)
Target Annual Incentive
x =
Annual base salary
Target incentive (% of base salary)
Payout factor (% of target: 0%–200%)
Realized Annual Incentive
x x =
Item 6. Directors, Senior Management and Employees
99
2020 Annual Incentive

2020 CEO BALANCED SCORECARD
This section presents the balanced scorecard for the CEO. Balanced scorecard performance is measured in constant curren-cies to reflect operational performance that can be influenced. The Board of Directors uses a stringent process to set ambi-tious financial targets to incentivize superior performance. No adjustments were made to the targets as a result of the COVID-19 pandemic. In addition to the financial targets, the CEO also has ambitious strategic objectives across five key pillars, two of which are related to ESG matters.
During the year, the Compensation Committee took the opportunity to benchmark its approach to incentive target setting. The committee asked its independent advisor to survey several organizations, representing global multinationals from various indus-tries, to gain insight into their variable incentive target-setting processes. Through this review, it was concluded that Novartis practices are in line with the surveyed companies, and no changes to the target-setting process were made.
Achievement versusCEO achievements – 2020 Target1 target
Financial measures – 60% of total Annual Incentive, comprising:
Group net sales (cc) (30%) 50 781 million Below
Group operating income (cc) (30%) | 9 745 million | Significantly above
Group free cash flow as a % of sales (cc) (20%) | 24.3% | Above
Share of peers for Novartis Group (USD) (20%) 8.3% Met
Overall assessment of Group financial targets in constant currencies Met
1 For performance evaluation purposes, target as well as actual financial KPIs included the results of the Sandoz US dermatology business and generic oral solids portfolio, which were expected to be divested to Aurobindo Pharma USA Inc. This deal was later terminated by mutual agreement with Aurobindo.
Strategic objectives – 40% of total Annual Incentive, comprising:
Innovation (20%) | MetNovartis continued to strengthen its product portfolio with 26 major approvals and 13 major submissions. Thir-ty-one new targets or technologies were discovered; 35 projects achieved first patient, first visit; and 13 positive proofs of concept/proofs of mechanism were achieved. However, due to pandemic and data-related delays, miles-tones for Lu-PSMA-617 and Entresto (for heart failure with preserved ejection fraction) were missed.
Despite the pandemic, launches of Kesimpta, Cosentyx (for non-radiographic axial spondyloarthritis), Enerzair and Tabrecta showed strong early performance, with Tabrecta being the first-ever fully virtual launch. The launch of AVXS-101 intrathecal was delayed due to a partial hold on clinical trials based on findings in a small preclinical animal study.
We continued to strengthen our advanced therapy platforms across the value chain, moving forward a breadth of clinical and preclinical programs, expanding our manufacturing capacity, and making our marketed therapies like Zolgensma, Kymriah and Lutathera widely available around the world.
Operational excellence (20%) | MetSolid sales growth (3% increase compared to 2019), transformation of our NTO network, and improved produc-tivity in marketing and sales as well as research and development drove double-digit cc growth in core operating income to USD 15.4 billion. Compared to the prior year, core operating income margin increased by 2.8 percentage points (cc) to 31.7%.
Net income from continuing operations grew 13% (20% cc), mainly driven by higher operating income. Full-year free cash flow was USD 11.7 billion, as higher operating income was more than offset by increased legal payments and lower divestments.
Data and digital (20%) | MetWe continued to advance and accelerate our digital lighthouse platforms in areas of biggest impact. The data42 analytics platform is now scaled. We have more than 5 000 users on our Nerve Live platform to manage clinical trials in real time. Through our remote clinical trial program, we ran over 35 000 remote monitoring interventions to mitigate the impact of the pandemic.
In the commercial and medical space, we transitioned all sales representatives globally to a harmonized customer relationship management tool. We also continued to significantly invest in next-generation marketing and sales, with 1 400 marketers trained. SpotOn, our control center for manufacturing and supply chain flow, is now live at five sites with three technology platforms, and is supporting our NTO organization to connect and contextualize data to predict and simulate scenarios.
Item 6. Directors, Senior Management and Employees
100

2020 CEO BALANCED SCORECARD − CONTINUED
People and culture (20%) | MetWe continued to build a culture that is inspired, curious and unbossed. The score for engagement in our quarterly employee survey reached an all-time high of 80 (out of 100) in the fourth quarter of 2020, compared to 74 a year earlier, bringing us further above the pharmaceutical industry benchmark of 73 and the global benchmark of 74.
We made good progress toward our associate learning initiatives in 2020, with 45.7 learning hours per associate on average. Additionally, the Unbossed Leadership Experience leadership program reached over 5 000 leaders.
We continued to make steady progress toward our Equal Pay International Coalition (EPIC) pledge to achieve gender balance in management by 2023. The percentage of women in management overall rose to 45% in 2020 (from 44% a year earlier) and to 33% for Novartis Top Leaders (up 2%, slightly below the 2020 aspiration). Novartis has a global median pay gap of -3.1% and a global mean pay gap of +3.6% (available data at the time of disclosure). While we acknowledge this percentage is influenced by worldwide workforce demographics, this is significantly ahead of the Bloomberg benchmarks of +19% median and +23% mean. We introduced an inclusion index and achieved a 74 score versus a global benchmark of 71 and a pharmaceutical industry benchmark of 70.
Building trust with society (including access to healthcare, reputation and other ESG topics) (20%) | Significantly aboveThe Company’s ESG strategy comprises four key pillars. Some particular highlights for 2020 include the settling of historic litigations matters, issuing a sustainability-linked bond, committing to achieve full carbon neutrality by 2030, and integrating ESG across all functions. These efforts contributed to improvements in our scores on a number of ESG indices from external agencies. Namely, we were sector leaders for Sustainalytics and FTSE-4Good, and received an “A” rating from MSCI in the most recent reporting cycle. Additional information on these achievements is provided below and in the Novartis in Society ESG Report 2020.
ETHICAL STANDARDS
In June 2020, Novartis reached settlements for the investigations into historical conduct by the Company and its subsidiaries dating back to 2012. With these agreements, all legacy compliance-related allegations against Novartis are closed. Our new Code of Ethics was rolled out in September, providing our associates with a robust framework for decision-making to help navigate situations that are complex or unclear. Third-party risk assess-ments were conducted for 100% of new eligible suppliers and distributors.
PRICING AND ACCESS
Compared to 2019, we increased our reach with strategic innovative therapies to patients in low- and middle-in-come countries (LMICs) by 27%, a significant step toward reaching our 2025 goal (200% increase in patient reach). In 2020, we launched 22 emerging market brands, and 100% of new launches have an access strategy in place. Piqray in India, for instance, was one month ahead of the first European country launch thanks to early planning and more formalized processes. In response to the COVID-19 pandemic, Novartis partnered with the Africa Medical Supplies Platform (AMSP) to facilitate the supply of 15 Sandoz medicines to 55 African and 15 CARICOM-eligible countries. In 2020, Novartis issued a sustainability bond linked to our access targets for strategic innovative the-rapies and our flagship programs, becoming the first healthcare company to issue a corporate bond of this kind.
GLOBAL HEALTH
The four Novartis global health flagship programs in leprosy, malaria, Chagas disease and sickle cell disease focus on diseases where there is a market failure and where we have the ability to innovate. Progress in this area was delayed, as the pandemic limited accessibility to clinics. However, we were able to treat approximately 5 000 pati-ents with sickle cell disease in sub-Saharan Africa and expand the rollout of the Africa sickle cell disease program to Kenya, Tanzania and Uganda.
RESPONSIBLE CITIZENSHIP
Novartis advanced its ambition to reduce its environmental impact, aiming to achieve full carbon, plastic and water neutrality by 2030. In 2020, we reduced our carbon emissions, waste disposal and water consumption compared to 2019 by an estimated 16%, 21% and 25%, respectively – well ahead of our 8% target in each of the three areas. We made measurable progress toward our public equity pledges, preparing to go live with pay transparency in 10 new countries from February 2021, and eliminating the use of historical salary data in 75% of cases when making internal and external hiring decisions. To address racial inequalities, our Novartis US Foundation has shifted focus and is dedicated to tackling this issue.
Overall assessment of strategic objectives Met
Overall assessment of CEO balanced scorecard Met
ANNUAL INCENTIVE PAYOUT
Payout Based on the overall assessment, the Board of Directors decided on an Annual Incentive resulting in a payout for the CEO amounting to CHF 2 636 550, which is 100% of target, within the range of 0–200%.
Item 6. Directors, Senior Management and Employees
101

OVERVIEW OF LONG-TERM INCENTIVE PLANS
Grant formula At the start of the performance cycle, performance share units (PSUs) are granted under each of the Long-Term Incentive plans, as follows:
On-target opportunity LTPP:• CEO: 200% of annual base salary• Other Executive Committee members: between 130% and 190% of annual base salary
LTRPP:• CEO: 125% of annual base salary• Other Executive Committee members: between 30% and 80% of annual base salary
Payout range • From 0% to 200% of the on-target amount based on performance
Award vehicle PSUs granted at the beginning of the cycle vest at the end of the three-year performance cycle and are converted into Novartis shares.PSUs carry dividend equivalents that are paid in shares at the end of the cycle to the extent that performance conditions have been met.
Payout formula:
Policy information in “—Treatment of variable compensation for Executive Committee leavers” provides details on the treatment of Long-Term Incentive awards for leavers.
Annual base salary
Grant value
Target incentive %
Share price
Grant value
Target number of PSUs
x
/
Step 1
Step 2
=
=
Target number of PSUs
Performance factorDividend
equivalentsRealized PSUsx + =
Item 6. Directors, Senior Management and Employees
102
Long-Term Incentive plans, 2018-2020 cycle• The Long-Term Performance Plan (LTPP) is the first of two LTI plans operated over the 2018-2020 cycle and
rewards creation of long-term value and innovation.• The Long-Term Relative Performance Plan (LTRPP) is the second of two LTI plans operated over the 2018-2020
cycle and rewards competitive shareholder return relative to the global healthcare peer group.
The structure of the two plans is summarized below.

NOVARTIS CASH VALUE ADDED (NCVA) (75% OF LTPP)
Description NCVA incentivizes sales growth and margin improvement as well as asset efficiency. It is calculated as follows:
1 WACC = weighted average cost of capital2 NCVA = (cash flow return on investment % – WACC) x gross operational assets in constant currencies
The NCVA performance factor is based on a 1:3 payout curve, whereby a 1% deviation in realization versus target leads to a 3% change in payout (for example, a realization of 105% leads to a payout factor of 115%).
Accordingly, if performance over the three-year vesting period falls below 67% of target, no payout is made for this portion of the LTPP. Conversely, if performance over the three-year vesting period is above 133% of target, payout for this portion of the LTPP is capped at 200% of target.
Group performance outcome for the 2018-2020 cycle
For the last three cycles, the Board of Directors has set increasingly ambitious NCVA targets to promote improvements to operational efficiencies. During the 2018-2020 cycle, Novartis delivered an NCVA of USD 9.6 billion, 16% ahead of a target of USD 8.3 billion in constant currencies.When setting the target for the 2018-2020 cycle, which increased by USD 2.2 billion (i.e., 37% versus the 2017-2019 cycle), the Compensation Committee took into account the following: • An expected increase in operational performance• Key business transformation investments and restructuring costs, particularly in the manufacturing and
business services organizationsThe 2018-2020 NCVA performance was mainly driven by the following:• Out-performance of sales targets over the three-year cycle (predominantly in 2019) by Innovative Medicines (+USD
1.3 billion, mainly driven by Entresto, Promacta/Revolade, and Tafinlar + Mekinist)• Significant increase in productivity, mainly in manufacturing (with core production cost of goods sold as a
percentage of sales improving by 2% points in constant currencies), marketing and sales, and research and development. This allowed for targeted launch investments and increased core operating income margin in constant currencies
No adjustments were made to the target to reflect the impact of the COVID-19 pandemic.Following the application of the agreed payout curve, the 116% achievement versus target generates a performance factor of 147% of target for this part of the LTPP.This will be the last year NCVA is considered in our LTI plans. For LTPP cycles starting from 2019, NCVA has been replaced with a combination of a three-year net sales compound annual growth rate (CAGR) and core operating income CAGR.
INNOVATION (25% OF LTPP)
Description Innovation is a key value driver for shareholders and is critical to our future. At the beginning of the cycle, the Science & Technology Committee (formerly the Research & Development Committee) determines the most important target milestones, considering the following:• The expected future potential revenue• The potential qualitative impact of research and development on science and medicine• The potential impact of research and development on the treatment or care of patients
For the cycle 2018-2020, innovation performance is based on group-wide innovation using a combination of Novartis Institutes for BioMedical Research (NIBR) and Global Drug Development (GDD) targets.
At the end of the cycle, the Compensation Committee determines the payout factor based on the performance assessment made by the Science & Technology Committee. In the healthcare industry, achievement of 60% to 80% of pipeline targets set at the beginning of a three-year cycle is considered good performance. The payout range 0% to 150% of target is based on the achievement of the target milestones, and payout above 150% of target is only delivered for truly exceptional performance.
Group performance outcome for the 2018-2020 cycle
In the 2018-2020 period, Novartis exceeded its innovation performance targets. We achieved a number of readouts and submissions in the Innovative Medicines Division, including approvals for Mayzent in the US and the EU to treat multiple sclerosis (MS); Kesimpta in the US to treat MS; Beovu in the US and the EU to treat neovascular (wet) age-related macular degeneration; Piqray in the US and the EU to treat HR+/HER2- advanced breast cancer with a PIK3CA mutation; Atectura and Enerzair in the EU to treat asthma; and Adakveo in the US and the EU to treat sickle cell disease. Entresto for heart failure with preserved ejection fraction (US) and Cosentyx for non-radiographic axial spondyloarthritis (US and EU) were also approved. Although the readout for QAW039 (fevipiprant) in asthma was attained, the program failed to meet its goals in Phase III clinical trials and was therefore terminated. Overall, Novartis achieved nine approvals for new molecular entities over the cycle.
Sandoz achieved US approval for long-acting oncology supportive care biosimilar Ziextenzo (pegfilgrastim-bmez), becoming the first and only company to offer US patients long- and short-acting filgrastim biosimilar treatment options. NIBR achieved its targets, discovering eight new first-in-class potential targets for liver diseases and initiating first-in-human studies of a CD19-targeted CAR-T therapy with an advanced manufacturing process.
Following input from the Science & Technology Committee, the Board of Directors approved an innovation performance factor for the CEO and Executive Committee members of 131% of target.
LTPP PAYOUT
Payout Overall, the Board of Directors approved an LTPP payout for the CEO amounting to CHF 5 605 100, which is 143% of target, within the range of 0–200%. This includes dividend equivalents of CHF 459 895.
Operating income +
Amortization, impairments, and adjusting for gains/losses from non-operating assets
– Taxes
Capital charge (based on WACC1) on gross operational assets NCVA2– =
Item 6. Directors, Senior Management and Employees
103
LTPP performance outcomes

RELATIVE TOTAL SHAREHOLDER RETURN (TSR) (100% OF LTRPP)
Description Performance is based on our TSR relative to a global healthcare peer group. Outperformance of this peer group is a key indicator that Novartis is delivering long-term value to its shareholders.
The peer group and payout matrix for the 2018-2020 performance cycle are as follows:
The payout matrix includes a significant reduction (including scope to reduce to nil) when Novartis does not outperform the majority of the companies in the group. At the end of the performance cycle, all companies are ranked in order of highest to lowest TSR in USD. As communicated in the 2019 Annual Report, for the 2018-2020 cycle, a one-day pricing approach was taken to determine the share value at the start of the performance cycle, and a three-month averaging method was then used at the end of the cycle.
The Compensation Committee uses its discretion to determine the payout factor within the ranges shown above, and takes into consideration factors such as absolute TSR, overall economic conditions, currency fluctuations and other unforeseeable economic situations.
Group performance outcome for the 2018-2020 cycle
Novartis TSR over the three-year period (2018-2020) was 29.4% using the methodology described above. When compared to the global healthcare peer group, Novartis TSR ranked No. 7 out of 15 companies.
LTRPP PAYOUT FOR THE 2018-2020 CYCLE
Payout Based on the ranking, the Board of Directors approved an LTRPP payout of 100% of target for the CEO, resulting in CHF 2 449 823, which includes dividend equivalents of CHF 201 005.
Combined LTI (LTPP and LTRPP) outcomes for the 2018-2020 cycle
Payout When considering both the LTPP and LTRPP, the total combined LTI payout was 126% of target for the CEO, resulting in CHF 8 054 923, compared to 157% last year. This amount includes CHF 660 900 of dividend equivalents accrued over the three-year cycle and CHF 784 497 in Alcon Keep Whole awards. Further detail can be found in the tables “2018-2020 LTPP performance cycle” and “2018-2020 LTRPP performance cycle.”
2018-2020 peer group (14 companies, excluding Novartis)
AbbVie
Biogen
GlaxoSmithKline
Novo Nordisk
Roche
Amgen
Bristol-Myers Squibb
Gilead Sciences
Merck & Co.
Sanofi
AstraZeneca
Eli Lilly & Co.
Johnson & Johnson
Pfizer
Novartis position Payout range in the peer group (% of target)
Position 1 – 2
Position 3 – 5
Position 6 – 8
Position 9 – 15
170% – 200%
130% – 160%
80% – 120%
0%
Item 6. Directors, Senior Management and Employees
104
LTRPP performance outcomes

Item 6. Directors, Senior Management and Employees
105
Realized compensation
To aid shareholders’ understanding of the link between pay and performance, the Compensation Committee dis-closes the realized compensation for the CEO individually, and for the other members of the Executive Committee on an aggregated basis. Disclosing realized compensation means that the Annual Incentive and the LTI are dis-closed at the end of their respective performance cycles, reflecting actual payouts based on performance.
The total actual payout may vary year on year depending on multiple factors, including the composition of the Executive Committee and the tenure of its members (as new members may not have a vested LTI), compensation increases, payout of variable compensation based on actual performance, share price fluctuations of the LTI, and dividend equivalents.
As communicated in the 2018 and 2019 Annual Reports, all Novartis shareholders received a dividend in kind in Alcon shares at the spin-off date, which created immediate and significant value to shareholders. However, unvested performance share units (PSUs), such as the LTPP and LTRPP, were not entitled to such dividend in kind. To ensure equal treatment relative to shareholders, PSU holders were instead awarded Alcon Keep Whole awards of similar value to the dividend in kind. These are only realized at the same time as the underlying PSUs, and are subject to the same performance conditions. The vesting of these Alcon Keep Whole awards will be considered in the realized compensation of the CEO and ECN members.
2020 realized compensation for the CEO and other Executive Committee membersThe Board reconsidered the executive incentive targets set prior to the pandemic and concluded that no changes should be made.
To determine the appropriateness of the 2020 CEO and executive compensation payouts under the Annual Incentive and LTI plans, the Board of Directors and the Compensation Committee reviewed management’s perfor-mance and contribution, taking the following into consideration:• No COVID-19-related government support or employee redundancies • Supportive treatment of associates and responsible societal approach adopted throughout the pandemic• Resilient operational and financial performance against targets• Strong progress toward strengthening our global product portfolio• Accomplishments across all strategic pillars, with careful attention to ESG targets• 29.4% shareholder return over cycle 2018-2020, when considering a three-month price averaging at the end of
the cycle (40.4% when considering the spot rate on December 31, 2020)
On this basis, the Board of Directors determined that no discretionary judgments were required to the resulting payouts. More detail on the performance of the CEO can be found in “—2020 CEO balanced scorecard.”
The Board of Directors awarded the CEO a 2020 Annual Incentive of CHF 2 636 550, which is 100% of target, within the payout range of 0% to 200%.
The 2018-2020 LTI plans comprise the LTPP and the LTRPP. The 2018-2020 LTPP delivered strong results, with Cash Value Added and innovation above target (see “—LTPP performance outcomes”). For the 2018-2020 LTRPP, Novartis ranked above median at position 7 out of a total of 15 global healthcare peers (including Novartis), on three-year relative TSR. Overall, when considering both plans, the Board of Directors awarded the CEO a total LTI payout of CHF 8 054 923, corresponding to a 126% payout against a maximum of 200%.
These incentive performance outcomes, combined with base salary and other benefits, pension, Alcon Keep Whole awards and dividend equivalents, resulted in 2020 total realized compensation for the CEO of CHF 12 724 166.
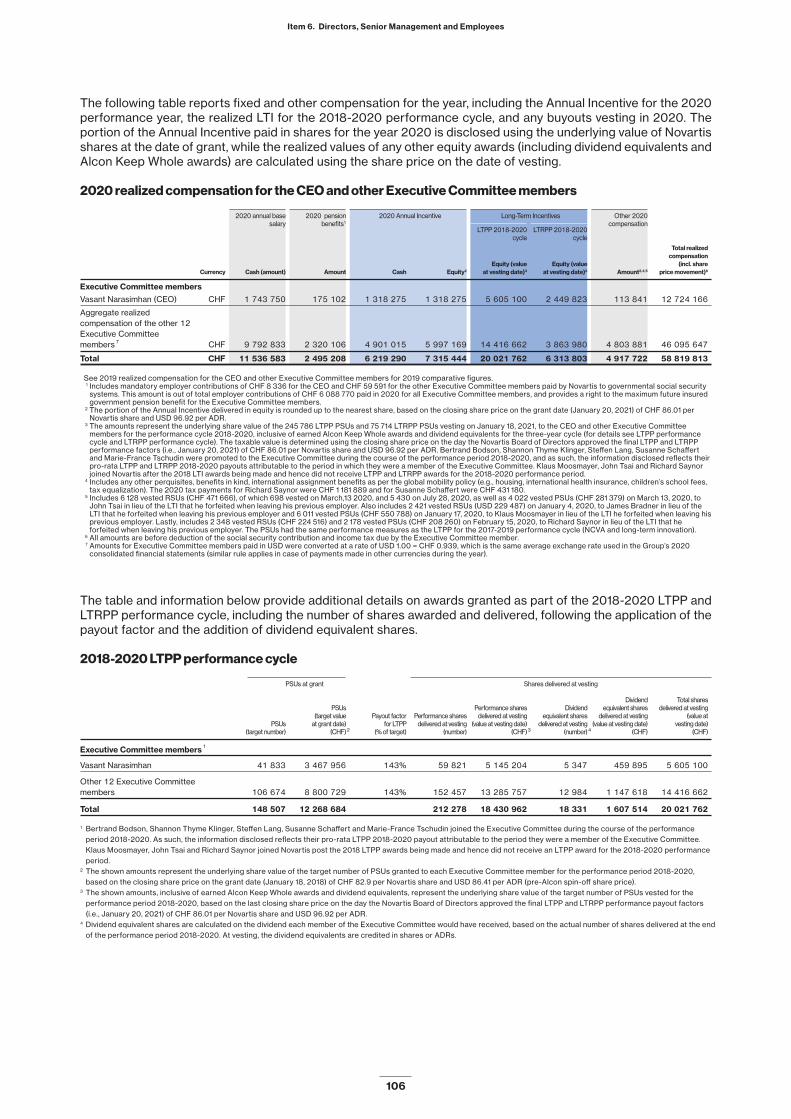
Item 6. Directors, Senior Management and Employees
106
The following table reports fixed and other compensation for the year, including the Annual Incentive for the 2020 performance year, the realized LTI for the 2018-2020 performance cycle, and any buyouts vesting in 2020. The portion of the Annual Incentive paid in shares for the year 2020 is disclosed using the underlying value of Novartis shares at the date of grant, while the realized values of any other equity awards (including dividend equivalents and Alcon Keep Whole awards) are calculated using the share price on the date of vesting.
2020 realized compensation for the CEO and other Executive Committee members
2020 annual base
2020 pension
2020 Annual Incentive Long-Term Incentives Other 2020
salary
benefits1
compensation
LTPP 2018-2020
LTRPP 2018-2020
cycle
cycle Total realized
compensation
Equity (value Equity (value (incl. share
Currency Cash (amount) Amount Cash Equity2 at vesting date)3 at vesting date)3 Amount2,4,5 price movement)6
Executive Committee members
Vasant Narasimhan (CEO) CHF 1 743 750 175 102 1 318 275 1 318 275 5 605 100 2 449 823 113 841 12 724 166
Aggregate realized
compensation of the other 12
Executive Committee
members 7 CHF 9 792 833 2 320 106 4 901 015 5 997 169 14 416 662 3 863 980 4 803 881 46 095 647
Total CHF 11 536 583 2 495 208 6 219 290 7 315 444 20 021 762 6 313 803 4 917 722 58 819 813
See 2019 realized compensation for the CEO and other Executive Committee members for 2019 comparative figures. 1 Includes mandatory employer contributions of CHF 8 336 for the CEO and CHF 59 591 for the other Executive Committee members paid by Novartis to governmental social security
systems. This amount is out of total employer contributions of CHF 6 088 770 paid in 2020 for all Executive Committee members, and provides a right to the maximum future insured government pension benefit for the Executive Committee members.
2 The portion of the Annual Incentive delivered in equity is rounded up to the nearest share, based on the closing share price on the grant date (January 20, 2021) of CHF 86.01 per Novartis share and USD 96.92 per ADR.
3 The amounts represent the underlying share value of the 245 786 LTPP PSUs and 75 714 LTRPP PSUs vesting on January 18, 2021, to the CEO and other Executive Committee members for the performance cycle 2018-2020, inclusive of earned Alcon Keep Whole awards and dividend equivalents for the three-year cycle (for details see LTPP performance cycle and LTRPP performance cycle). The taxable value is determined using the closing share price on the day the Novartis Board of Directors approved the final LTPP and LTRPP performance factors (i.e., January 20, 2021) of CHF 86.01 per Novartis share and USD 96.92 per ADR. Bertrand Bodson, Shannon Thyme Klinger, Steffen Lang, Susanne Schaffert and Marie-France Tschudin were promoted to the Executive Committee during the course of the performance period 2018-2020, and as such, the information disclosed reflects their pro-rata LTPP and LTRPP 2018-2020 payouts attributable to the period in which they were a member of the Executive Committee. Klaus Moosmayer, John Tsai and Richard Saynor joined Novartis after the 2018 LTI awards being made and hence did not receive LTPP and LTRPP awards for the 2018-2020 performance period.
4 Includes any other perquisites, benefits in kind, international assignment benefits as per the global mobility policy (e.g., housing, international health insurance, children’s school fees, tax equalization). The 2020 tax payments for Richard Saynor were CHF 1 181 889 and for Susanne Schaffert were CHF 431 180.
5 Includes 6 128 vested RSUs (CHF 471 666), of which 698 vested on March,13 2020, and 5 430 on July 28, 2020, as well as 4 022 vested PSUs (CHF 281 379) on March 13, 2020, to John Tsai in lieu of the LTI that he forfeited when leaving his previous employer. Also includes 2 421 vested RSUs (USD 229 487) on January 4, 2020, to James Bradner in lieu of the LTI that he forfeited when leaving his previous employer and 6 011 vested PSUs (CHF 550 788) on January 17, 2020, to Klaus Moosmayer in lieu of the LTI he forfeited when leaving his previous employer. Lastly, includes 2 348 vested RSUs (CHF 224 516) and 2 178 vested PSUs (CHF 208 260) on February 15, 2020, to Richard Saynor in lieu of the LTI that he forfeited when leaving his previous employer. The PSUs had the same performance measures as the LTPP for the 2017-2019 performance cycle (NCVA and long-term innovation).
6 All amounts are before deduction of the social security contribution and income tax due by the Executive Committee member. 7 Amounts for Executive Committee members paid in USD were converted at a rate of USD 1.00 = CHF 0.939, which is the same average exchange rate used in the Group’s 2020
consolidated financial statements (similar rule applies in case of payments made in other currencies during the year).
The table and information below provide additional details on awards granted as part of the 2018-2020 LTPP and LTRPP performance cycle, including the number of shares awarded and delivered, following the application of the payout factor and the addition of dividend equivalent shares.
2018-2020 LTPP performance cycle
PSUs at grant
Shares delivered at vesting
Dividend Total shares
PSUs Performance shares Dividend equivalent shares delivered at vesting
(target value Payout factor Performance shares delivered at vesting equivalent shares delivered at vesting (value at
PSUs at grant date) for LTPP delivered at vesting (value at vesting date) delivered at vesting (value at vesting date) vesting date)
(target number) (CHF) 2 (% of target) (number) (CHF) 3 (number) 4 (CHF) (CHF)
Executive Committee members 1
Vasant Narasimhan 41 833 3 467 956 143% 59 821 5 145 204 5 347 459 895 5 605 100
Other 12 Executive Committee
members 106 674 8 800 729 143% 152 457 13 285 757 12 984 1 147 618 14 416 662
Total 148 507 12 268 684 212 278 18 430 962 18 331 1 607 514 20 021 762
1 Bertrand Bodson, Shannon Thyme Klinger, Steffen Lang, Susanne Schaffert and Marie-France Tschudin joined the Executive Committee during the course of the performance period 2018-2020. As such, the information disclosed reflects their pro-rata LTPP 2018-2020 payout attributable to the period they were a member of the Executive Committee. Klaus Moosmayer, John Tsai and Richard Saynor joined Novartis post the 2018 LTPP awards being made and hence did not receive an LTPP award for the 2018-2020 performance period.
2 The shown amounts represent the underlying share value of the target number of PSUs granted to each Executive Committee member for the performance period 2018-2020, based on the closing share price on the grant date (January 18, 2018) of CHF 82.9 per Novartis share and USD 86.41 per ADR (pre-Alcon spin-off share price).
3 The shown amounts, inclusive of earned Alcon Keep Whole awards and dividend equivalents, represent the underlying share value of the target number of PSUs vested for the performance period 2018-2020, based on the last closing share price on the day the Novartis Board of Directors approved the final LTPP and LTRPP performance payout factors (i.e., January 20, 2021) of CHF 86.01 per Novartis share and USD 96.92 per ADR.
4 Dividend equivalent shares are calculated on the dividend each member of the Executive Committee would have received, based on the actual number of shares delivered at the end of the performance period 2018-2020. At vesting, the dividend equivalents are credited in shares or ADRs.

Item 6. Directors, Senior Management and Employees
107
2018-2020 LTRPP performance cycle
PSUs at grant
Shares delivered at vesting
Dividend Total shares
PSUs Performance shares Dividend equivalent shares delivered at vesting
(target value Payout factor Performance shares delivered at vesting equivalent shares delivered at vesting (value at
PSUs at grant date) for LTRPP delivered at vesting (value at vesting date) delivered at vesting (value at vesting date) vesting date)
(target number) (CHF) 2 (% of target) (number) (CHF) 3 (number) 4 (CHF) (CHF)
Executive Committee members 1
Vasant Narasimhan 26 146 2 167 503 100% 26 146 2 248 817 2 337 201 005 2 449 823
Other 12 Executive Committee
members 40 722 3 355 831 100% 40 722 3 559 493 3 486 309 988 3 863 980
Total 66 868 5 523 335 66 868 5 808 310 5 823 510 993 6 313 803
1 Shannon Thyme Klinger, Steffen Lang, Susanne Schaffert and Marie-France Tschudin joined the Executive Committee during the course of the performance period 2018-2020. As such, the information disclosed reflects their pro-rata LTRPP 2018-2020 payout attributable to the period they were a member of the Executive Committee. Klaus Moosmayer, John Tsai and Richard Saynor joined Novartis post the 2018 LTRPP awards being made and hence did not receive an LTRPP award for the 2018-2020 performance period.
2 The shown amounts represent the underlying share value of the target number of PSUs granted to each Executive Committee member for the performance period 2018-2020, based on the closing share price on the grant date (January 18, 2018) of CHF 82.9 per Novartis share and USD 86.41 per ADR (pre-Alcon spin-off share price).
3 The shown amounts, inclusive of earned Alcon Keep Whole awards and dividend equivalents, represent the underlying share value of the target number of PSUs vested for the performance period 2018-2020, based on the last closing share price on the day the Novartis Board of Directors approved the final LTPP and LTRPP performance payout factors (i.e., January 20, 2021) of CHF 86.01 per Novartis share and USD 96.92 per ADR.
4 Dividend equivalent shares are calculated on the dividend each member of the Executive Committee would have received, based on the actual number of shares delivered at the end of the performance period 2018-2020. At vesting, the dividend equivalents are credited in shares or ADRs.

Item 6. Directors, Senior Management and Employees
108
The table and information below provide details on the 2019 realized compensation for the CEO and other Exec-utive Committee members, for comparative purposes.
2019 realized compensation for the CEO and other Executive Committee members
2019 annual base
2019 pension
2019 Annual Incentive Long-Term Incentives Other 2019
salary
benefits1
compensation
LTPP
LTRPP
2017-2019 cycle
2017-2019 cycle Total realized
compensation
Equity (value Equity (value (incl. share
Currency Cash (amount) Amount Cash Equity2 at vesting date)3 at vesting date)3 Amount2,4,5 price movement)6
Executive Committee members
Vasant Narasimhan (CEO) CHF 1 653 333 165 547 2 008 800 2 008 839 3 510 963 1 107 806 160 452 10 615 740
Aggregate realized
compensation of the other 14
Executive Committee
members, including the two members
who stepped down
during financial year 2019 7, 8 CHF 9 370 547 2 131 905 5 809 455 7 013 842 17 932 704 6 383 700 7 233 594 55 875 748
Total CHF 11 023 880 2 297 452 7 818 255 9 022 682 21 443 667 7 491 506 7 394 046 66 491 488
1 Includes mandatory employer contributions of CHF 4 373 for the CEO and CHF 63 461 for the other Executive Committee members paid by Novartis to governmental social security systems. This amount is out of total employer contributions of CHF 3 923 070 paid in 2019 for all Executive Committee members, and provides a right to the maximum future insured government pension benefit for the Executive Committee members.
2 The portion of the Annual Incentive delivered in equity is rounded up to the nearest share, based on the closing share price on the grant date (January 21, 2020) of CHF 92.89 per Novartis share and USD 95.19 per ADR.
3 The amounts represent the underlying share value of the 232 425 LTPP PSUs and 77 904 LTRPP PSUs vesting on January 17, 2020, to the CEO and other Executive Committee members for the performance cycle 2017-2019, inclusive of earned dividend equivalents for the three-year cycle (details in ‘’LTPP performance cycle and LTRPP performance cycle”).The taxable value is determined using the closing share price on the day the Novartis Board of Directors approved the final LTPP and LTRPP performance factors (i.e., January 21, 2020) of CHF 92.89 per Novartis share and USD 95.19 per ADR. Shannon Thyme Klinger, Steffen Lang, Susanne Schaffert and Marie-France Tschudin were promoted to the Executive Committee during the course of the performance period 2017-2019, and as such, the information disclosed reflects their pro-rata LTPP and LTRPP 2017-2019 payouts attributable to the period they were a member of the Executive Committee. Bertrand Bodson, Klaus Moosmayer, John Tsai, Robert Weltevreden and Richard Saynor joined Novartis post the 2017 LTI awards were made and hence did not receive LTPP and LTRPP awards for the 2017-2019 performance period.
4 Includes any other perquisites, benefits in kind, international assignment benefits as per the global mobility policy (e.g., housing, international health insurance, children’s school fees, tax equalization) as well as vested shares under LTPP and LTRPP after the ‘’step down’’ date.
5 Includes 5 430 vested RSUs (CHF 502 003) on July 28, 2019, to John Tsai, in lieu of the LTI that he forfeited when leaving his previous employer and 1 323 vested RSUs (CHF 123 092) and 14 470 vested PSUs (CHF 1 346 289) on March 24, 2019, to Paul Hudson in lieu of the LTI that he forfeited when leaving his previous employer. The PSUs had the same performance measures as the LTPP for the 2016-2018 performance cycle (NCVA and long-term innovation).
6 All amounts are before deduction of the social security contribution and income tax due by the Executive Committee member. 7 Comprises the compensation of Richard Francis, the former CEO of Sandoz including the vesting of his Long-Term Incentives for performance cycle 2017-2019, as per the plan rules.
Unvested shares for Paul Hudson were forfeited upon his departure from the Company. 8 Amounts for Executive Committee members paid in USD were converted at a rate of USD 1.00 = CHF 0.9938, which is the same average exchange rate used in the Group’s 2019
consolidated financial statements.
Realized compensation for the CEO and other Executive Committee members for 2020 compared to 2019When comparing the 2020 CEO realized pay to 2019, there is an overall increase of 19.9%. The change is driven by a significant increase in realized LTI due to the following:• The vesting of the CEO’s first LTI granted following his appointment to CEO. For the 2018-2020 cycle, Vasant
Narasimhan received an increase in target LTI to reflect his promotion from Global Head of Drug Development to CEO.
• The vesting of the CEO’s Alcon Keep Whole awards. The total vesting value of these Alcon Keep Whole awards was CHF 784 497, which is included in the corresponding LTPP and LTRPP values in the prior tables.
The increase was partly offset by the lower variable incentive performance payout for the 2020 Annual Incentive (100% versus 160% in 2019) and the LTI cycle 2018-2020 (126% for the LTPP and LTRPP combined versus 157% for cycle 2017-2019).
The 2020 total realized compensation for the Executive Committee members (comprising the CEO and the other 12 active Executive Committee members) was CHF 58 819 813. This is a decrease compared to the prior year and can be attributed to (i) lower Annual Incentive payouts on average and lower 2018-2020 LTI payouts as well as (ii) a reduction in members reported (two members stepped down and were replaced in 2019, whereas no members stepped down in 2020).
Forecasts for 2021 realized compensation for the other Executive Committee membersA number of current members joined the Executive Committee, both from internal and external positions, during 2018. The LTPP 2019-2021 will therefore be their first annual LTI to be realized/fully reported since their appoint-ment. It may therefore be reasonable to expect an increase in realized compensation for these members next year, depending on the performance of the plan against target and the evolution of the share price.

Item 6. Directors, Senior Management and Employees
109
Compensation at grant value
In accordance with the Swiss Ordinance against Excessive Compensation in Listed Companies, Novartis continues to disclose total compensation at grant value for the CEO and other Executive Committee members. The following tables disclose for the CEO and other Executive Committee members:• Fixed 2020 compensation (base salary and benefits)• The actual cash portion and the deferred portion granted in equity of the 2020 Annual Incentive• 2020-2022 LTPP performance cycle awards, which are reported at target value at grant date under the assump-
tion that the awards will vest at 100% achievement, excluding any share price movement and dividend equivalents that may be accrued over the performance cycle. The future payout will be determined only after the performance cycle concludes in three years (i.e., the end of 2022), with a payout range of 0% to 200% of the target value.
• Other compensation for 2020, which includes other benefits, either paid in cash or granted in equity in the year
To assess CEO actual pay for performance in 2020, including the Annual Incentive payout for the 2020 performance year and the LTI payouts for the 2018-2020 performance cycle, shareholders should refer to the 2020 realized compensation table in “—2020 realized compensation for the CEO and other Executive Commit-tee members.”
2020 compensation at grant value for the CEO and other Executive Committee members
Fixed compensation and Variable compensation
pension benefits
Actual compensation paid or granted for 2020 Long-Term Incentive
2020-2022 cycle
grants at target
2020 annual base 2020 pension 2020 Annual Incentive LTPP 2020-2022 cycle Other 2020 Total
salary benefits (performance achieved) compensation compensation
paid, promised
or granted 2020
Equity PSUs
Cash Cash (value at (target value
Currency (amount) Amount 1 (amount) grant date) 2 at grant date) 3 Amount 4 Amount 5
Executive Committee members active on December 31, 2020
Vasant Narasimhan CHF 1 743 750 175 102 1 318 275 1 318 275 5 712 549 113 841 10 381 793
Steven Baert CHF 798 617 167 294 480 000 480 022 1 679 265 85 587 3 690 785
Bertrand Bodson CHF 634 834 177 088 256 000 256 052 1 152 115 131 745 2 607 834
James Bradner 6 USD 1 203 654 373 063 768 900 768 963 2 911 862 88 472 6 114 914
Harry Kirsch CHF 1 063 433 171 930 585 750 585 814 2 769 330 50 294 5 226 551
Shannon Thyme Klinger CHF 862 500 182 852 525 000 525 005 1 925 517 32 773 4 053 647
Steffen Lang CHF 758 333 171 130 228 000 684 038 1 367 619 12 918 3 222 037
Klaus Moosmayer CHF 520 833 184 884 241 500 241 516 840 004 29 496 2 058 233
Richard Saynor CHF 778 333 190 372 390 000 390 055 1 482 060 1 737 100 4 967 920
Susanne Schaffert CHF 871 250 173 111 341 445 796 797 2 013 669 581 188 4 777 460
John Tsai CHF 868 333 182 517 478 500 478 560 2 175 855 104 669 4 288 434
Marie-France Tschudin CHF 871 250 182 216 437 750 437 791 2 013 669 – 3 942 677
Robert Weltevreden CHF 634 834 186 392 215 040 399 430 1 152 115 2 925 2 590 735
Total 11 536 583 2 495 208 6 219 290 7 315 444 27 018 132 2 965 615 57 550 273
Based on assumption of 100% payout at target. Actual payout (0–200% of target) will be known at the end of the three-year
cycle in January 2023
See next page for 2019 comparative figures. 1 Includes mandatory employer contributions of CHF 8 336 for the CEO and CHF 59 591 for the other Executive Committee members paid by Novartis to governmental social security systems. This amount is out
of total employer contributions of CHF 6 088 770 paid in 2020 for all Executive Committee members, and provides a right to the maximum future insured government pension benefit for the Executive Committee members.
2 The portion of the Annual Incentive delivered in equity is rounded up to the nearest share, based on the closing share price on the grant date (January 20, 2021) of CHF 86.01 per Novartis share and USD 96.92 per ADR.
3 The amounts represent the underlying share value of the target number of PSUs granted to Executive Committee members for the performance cycle 2020-2022, based on the closing share price on the grant date (January 21, 2020) of CHF 92.89 per Novartis share and USD 95.19 per ADR for all members.
4 Includes any other perquisites, benefits in kind, and international assignment benefits as per the global mobility policy (e.g., housing, international health insurance, children’s school fees, tax equalization) 5 All amounts are before deduction of the social security contribution and income tax due by the Executive Committee member. 6 Amounts in USD for James Bradner were converted at a rate of CHF 1.00 = USD 1.0649, which is the average rate used in the Group’s 2020 consolidated financial statements.

Item 6. Directors, Senior Management and Employees
110
2019 compensation at grant value for the CEO and other Executive Committee membersFor comparative purposes, the table below provides the compensation at grant value for 2019.
Executive Committee member compensation at grant for financial year 2019
Fixed compensation and Variable compensation
pension benefits
Actual compensation paid or granted for 2019 Long-Term Incentive
2019-2021 cycle
grants at target
2019 annual base 2019 pension 2019 Annual Incentive LTPP Other 2019 Total
salary benefits (performance achieved) 2019-2021 cycle compensation compensation
paid, promised
or granted 2019
Equity PSUs
Cash Cash (value at (target value
Currency (amount) Amount 1 (amount) grant date) 2 at grant date) 3 Amount 4 Amount 5
Executive Committee members active on December 31, 2019
Vasant Narasimhan CHF 1 653 333 165 547 2 008 800 2 008 839 5 440 530 160 452 11 437 501
Steven Baert CHF 789 750 161 454 633 360 633 417 1 662 585 124 979 4 005 545
Bertrand Bodson CHF 607 500 170 178 341 040 341 092 974 476 137 826 2 572 111
James Bradner 6 USD 1 126 781 359 961 951 720 951 805 2 832 511 85 498 6 308 275
Harry Kirsch CHF 1 053 000 164 467 1 045 044 1 045 105 2 744 591 27 658 6 079 865
Shannon Thyme Klinger CHF 783 333 188 990 468 000 468 073 1 600 005 111 375 3 619 776
Steffen Lang CHF 745 000 167 815 408 000 612 145 1 200 026 9 810 3 142 796
Klaus Moosmayer CHF 500 000 125 483 260 000 260 092 800 047 171 749 2 117 371
Richard Saynor (from July 15, 2019) 7 CHF 356 021 87 118 179 315 179 371 – 1 950 908 2 752 732
Susanne Schaffert 7 CHF 850 000 167 096 459 000 1 071 115 1 870 066 160 252 4 577 528
John Tsai CHF 858 333 181 048 602 000 602 020 2 064 063 377 544 4 685 007
Marie-France Tschudin (from June 7, 2019) 7 CHF 481 667 92 090 290 630 290 653 968 249 – 2 123 289
Robert Weltevreden CHF 607 500 157 423 158 340 475 132 974 476 4 860 2 377 731
Subtotal 10 405 223 2 186 434 7 799 341 8 932 950 23 114 040 3 322 378 55 760 366
Executive Committee members who stepped down during 2019
Richard Francis (until March 19, 2019) 8, 9 CHF 179 315 36 025 18 914 37 435 720 460 3 808 445 4 800 594
Paul Hudson (until June 7, 2019) 9, 10 CHF 439 342 74 994 – – 270 451 2 885 164 3 669 950
Subtotal 618 657 111 018 18 914 37 435 990 910 6 693 609 8 470 543
Total 11 023 880 2 297 452 7 818 255 8 970 384 24 104 951 10 015 988 64 230 910
Based on assumption of 100% payout at target. Actual payout (0–200% of target) will be known at the end of the three-year
cycle in January 2022.
1 Includes mandatory employer contributions of CHF 4 373 for the CEO and CHF 63 461 for the other Executive Committee members paid by Novartis to governmental social security systems. This amount is out of total employer contributions of CHF 3 923 070 paid in 2019 for all Executive Committee members, and provides a right to the maximum future insured government pension benefit for the Executive Committee member.
2 The portion of the Annual Incentive delivered in equity is rounded up to the nearest share, based on the closing share price on the grant date (January 21, 2020) of CHF 92.89 per Novartis share and USD 95.19 per ADR.
3 The amounts represent the underlying share value of the target number of PSUs granted to Executive Committee members for the performance cycle 2019-2021, based on the closing share price on the grant date (January 22, 2019) of CHF 88.14 per Novartis share and USD 88.32 per ADR for all members except for Richard Saynor, who was not part of the Company at the annual grant date and hence did not receive an LTPP award.
4 Includes any other perquisites, benefits in kind, and international assignment benefits as per the global mobility policy (e.g., housing, international health insurance, children’s school fees, tax equalization). 5 All amounts are before deduction of the social security contribution and income tax due by the Executive Committee member. 6 Amounts in USD for James Bradner were converted at a rate of CHF 1.00 = USD 1.006, which is the average rate used in the Group’s 2019 consolidated financial statements. 7 For those members who joined the Executive Committee in 2019, the information under the columns “Actual compensation paid or granted for 2019” and “Long-Term Incentive 2019-2021 cycle grants at target”
includes their pro-rata compensation from the date they joined the Executive Committee to December 31, 2019, or to the end of the performance cycle in the case of the “Long-Term Incentive 2019-2021 cycle grants at target.”
8 Richard Francis stepped down as CEO, Sandoz on March 19, 2019, and left the Company on March 31, 2020, in line with his contractual notice period. Until the end of the notice period, he received further contractual compensation that includes the base salary, Annual Incentive and pension benefits. In accordance with the plan rules, the LTPP 2019-2021 cycle grant (21 217 PSUs), included in full in the above table, will vest on the normal vesting date pro-rata based on the number of months of Novartis employment during the performance cycle. The vesting of this grant is subject to performance conditions assessed at the end of the period.
9 For those members leaving the Executive Committee in 2019, the columns under “Actual compensation paid or granted for 2019” and “Long-Term Incentive 2019-2021 cycle grants at target” reflect the pro-rata compensation for their period as Executive Committee member. The column “Other 2019 compensation” includes inter alia their pro-rata compensation from the date they left the Executive Committee to December 31, 2019, or to the end of the performance cycle in the case of the “Long-Term Incentive 2019-2021 cycle grants at target”. See “—2019 Executive Committee member departures” for details.
10 Paul Hudson stepped down as CEO, Novartis Pharmaceuticals on June 7, 2019, and left the Company on August 31, 2019, in line with his reduced contractual notice period (for more details “—2019 Executive Committee member departures.”) The Annual Incentive and LTPP 2019-2021 cycle grant (31 553 PSUs), included in the table above, were forfeited in full upon his departure.

Item 6. Directors, Senior Management and Employees
111
Compensation at grant value for the CEO and other Executive Committee for 2020 compared to 2019Grant compensation delivered to the CEO decreased slightly by CHF 1.1 million from 2019 to 2020, largely due to the lower Annual Incentive payout, which was partly offset by a 5% increase in annual base salary from March 31, 2020, as reported in Item 6.B of the 2019 Annual Report. There was no change to his target Annual Incentive or his target Long-Term Incentive, as a percentage of annual base salary, in 2020.
Similarly, there is an overall decrease when comparing the 2020 Executive Committee total compensation at grant value of CHF 57. 6 million to the 2019 grant value of CHF 64.2 million. This reduction can be largely explained by the fact that two members stepped down in 2019, whereas no members stepped down in 2020.

Item 6. Directors, Senior Management and Employees
112
Additional disclosures for the CEO and other Executive Committee members
This section provides additional disclosures, including information about the shareholdings of the CEO and the other Executive Committee members.
Malus and clawbackPer our “—Executive Committee compensation philosophy and principles,” in 2020, there was no legal or factual basis on which to exercise malus or clawback for current or former Executive Committee members.
Number of equity instruments granted to the CEO and other Executive Committee members for financial year 2020
Variable compensation1
2020 Annual Incentive
LTPP
Other
(performance achieved)
2020-2022 cycle
Equity PSUs Equity/PSUs
(number) 2 (target number) 3 (number)
Executive Committee members active on December 31, 2020
Vasant Narasimhan 15 327 61 498 0
Steven Baert 5 581 18 078 0
Bertrand Bodson 2 977 12 403 0
James Bradner 7 934 30 590 0
Harry Kirsch 6 811 29 813 0
Shannon Thyme Klinger 6 104 20 729 0
Steffen Lang 7 953 14 723 0
Klaus Moosmayer 2 808 9 043 0
Richard Saynor 4 535 15 955 0
Susanne Schaffert 9 264 21 678 0
John Tsai 5 564 23 424 0
Marie-France Tschudin 5 090 21 678 0
Robert Weltevreden 4 644 12 403 0
Total 84 592 292 015 0
See next page for 2019 comparative figures.1 The values of the awards are reported in the table “2020 compensation at grant value for the CEO and other Executive Committee members.”2 Vested shares, restricted shares and/or RSUs granted under the Annual Incentive for performance period 2020.3 Target number of PSUs granted under the LTPP as applicable for the performance cycle 2020-2022.

Item 6. Directors, Senior Management and Employees
113
Number of equity instruments granted to the CEO and other Executive Committee members for financial year 2019 (comparative information)
Variable compensation1
2019 Annual Incentive
LTPP
Other
(performance achieved)
2019-2021 cycle
Equity PSUs Equity/PSUs
(number) 2 (target number) 3 (number)
Executive Committee members active on December 31, 2019
Vasant Narasimhan 21 626 61 726 0
Steven Baert 6 819 18 863 0
Bertrand Bodson 3 672 11 056 0
James Bradner 9 999 32 071 0
Harry Kirsch 11 251 31 139 0
Shannon Thyme Klinger 5 039 18 153 0
Steffen Lang 6 590 13 615 0
Klaus Moosmayer 2 800 9 077 0
Richard Saynor (from July 15, 2019) 4 1 931 0 11 452
Susanne Schaffert 11 531 21 217 0
John Tsai 6 481 23 418 0
Marie-France Tschudin (from June 7, 2019) 4 3 129 11 085 0
Robert Weltevreden 5 115 11 056 0
Subtotal 95 983 262 476 11 452
Executive Committee members who stepped down during 2019
Richard Francis (until March 19, 2019) 5, 6 403 8 841 0
Paul Hudson (until June 7, 2019) 5, 7 0 4 525 0
Subtotal 403 13 366 0
Total 96 386 275 842 11 452
1 The values of the awards are reported in the table “2019 compensation at grant value for the CEO and other Executive Committee members.”2 Vested shares, restricted shares and/or RSUs granted under the Annual Incentive for performance period 2019.3 Target number of PSUs granted under the LTPP as applicable for the performance cycle 2019-2021.4 For those members who joined the Executive Committee in 2019, the information under the column “Variable compensation” includes their pro-rata number of equity instruments
from the date they joined the Executive Committee to December 31, 2019, or to the end of the performance cycle in the case of the “LTPP 2019-2021 cycle.”5 For those members leaving the Executive Committee in 2019, the column under “Variable compensation” reflects the pro-rata number of equity instruments for their period as
Executive Committee member. The column “Other” includes their pro-rata compensation from the date they left the Executive Committee to December 31, 2019, or to the end of the performance cycle in the case of the “LTPP 2019-2021 cycle.” See “2019 Executive Committee member departures” for details.
6 Richard Francis stepped down as CEO, Sandoz on March 19, 2019, and left the Company on March 31, 2020, in line with his contractual notice period. In accordance with the plan rules, the LTPP 2019-2021 cycle grant (21 217 PSUs), included in full in the above table, will vest on the normal vesting date pro-rata based on the number of months of Novartis employment during the performance cycle. The vesting of this grant is subject to performance conditions assessed at the end of the period.
7 Paul Hudson stepped down as CEO, Novartis Pharmaceuticals on June 7, 2019, and left the Company on August 31, 2019, in line with his reduced contractual notice period (for more details “—2019 Executive Committee member departures”). The 2019 Annual Incentive and LTPP 2019-2021 cycle grant (31 553 PSUs), included in the table above, were forfeited in full upon his departure.
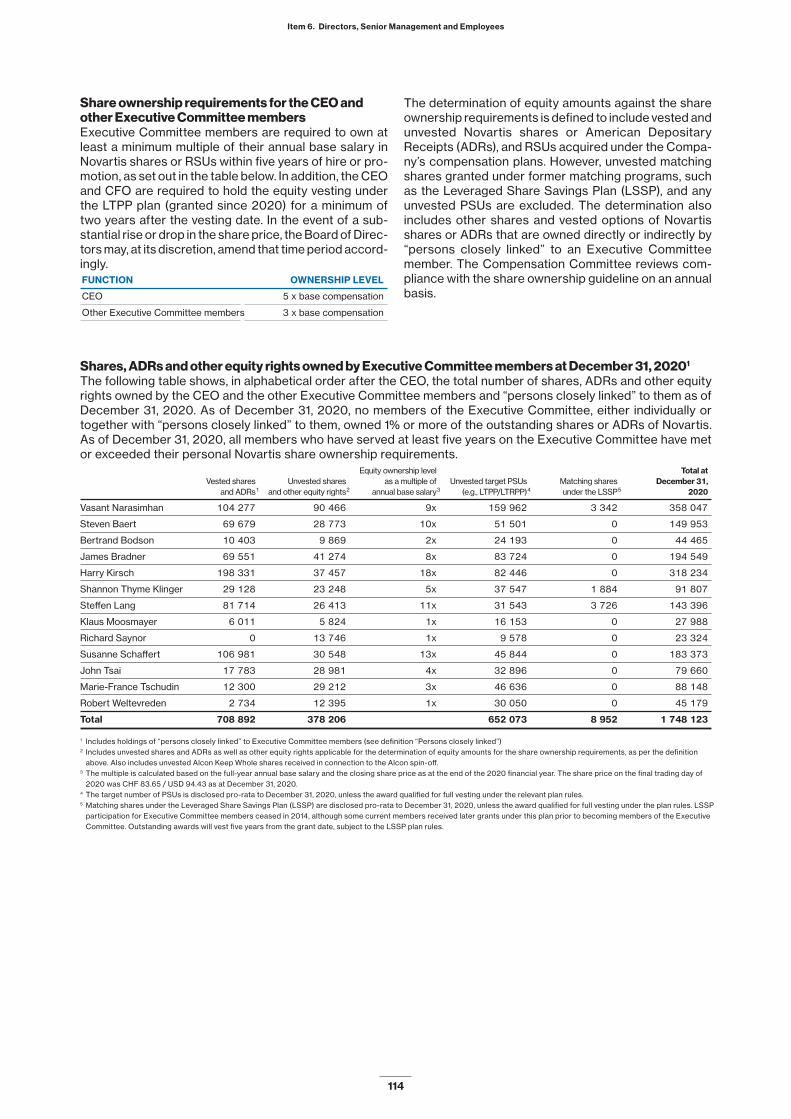
Item 6. Directors, Senior Management and Employees
114
Share ownership requirements for the CEO and other Executive Committee membersExecutive Committee members are required to own at least a minimum multiple of their annual base salary in Novartis shares or RSUs within five years of hire or pro-motion, as set out in the table below. In addition, the CEO and CFO are required to hold the equity vesting under the LTPP plan (granted since 2020) for a minimum of two years after the vesting date. In the event of a sub-stantial rise or drop in the share price, the Board of Direc-tors may, at its discretion, amend that time period accord-ingly.FUNCTION OWNERSHIP LEVEL
CEO 5 x base compensation
Other Executive Committee members 3 x base compensation
The determination of equity amounts against the share ownership requirements is defined to include vested and unvested Novartis shares or American Depositary Receipts (ADRs), and RSUs acquired under the Compa-ny’s compensation plans. However, unvested matching shares granted under former matching programs, such as the Leveraged Share Savings Plan (LSSP), and any unvested PSUs are excluded. The determination also includes other shares and vested options of Novartis shares or ADRs that are owned directly or indirectly by “persons closely linked” to an Executive Committee member. The Compensation Committee reviews com-pliance with the share ownership guideline on an annual basis.
Shares, ADRs and other equity rights owned by Executive Committee members at December 31, 20201
The following table shows, in alphabetical order after the CEO, the total number of shares, ADRs and other equity rights owned by the CEO and the other Executive Committee members and “persons closely linked” to them as of December 31, 2020. As of December 31, 2020, no members of the Executive Committee, either individually or together with “persons closely linked” to them, owned 1% or more of the outstanding shares or ADRs of Novartis. As of December 31, 2020, all members who have served at least five years on the Executive Committee have met or exceeded their personal Novartis share ownership requirements. Equity ownership level Total at
Vested shares Unvested shares as a multiple of Unvested target PSUs Matching shares December 31,
and ADRs 1 and other equity rights 2 annual base salary 3 (e.g., LTPP/LTRPP) 4 under the LSSP 5 2020
Vasant Narasimhan 104 277 90 466 9x 159 962 3 342 358 047
Steven Baert 69 679 28 773 10x 51 501 0 149 953
Bertrand Bodson 10 403 9 869 2x 24 193 0 44 465
James Bradner 69 551 41 274 8x 83 724 0 194 549
Harry Kirsch 198 331 37 457 18x 82 446 0 318 234
Shannon Thyme Klinger 29 128 23 248 5x 37 547 1 884 91 807
Steffen Lang 81 714 26 413 11x 31 543 3 726 143 396
Klaus Moosmayer 6 011 5 824 1x 16 153 0 27 988
Richard Saynor 0 13 746 1x 9 578 0 23 324
Susanne Schaffert 106 981 30 548 13x 45 844 0 183 373
John Tsai 17 783 28 981 4x 32 896 0 79 660
Marie-France Tschudin 12 300 29 212 3x 46 636 0 88 148
Robert Weltevreden 2 734 12 395 1x 30 050 0 45 179
Total 708 892 378 206 652 073 8 952 1 748 123
1 Includes holdings of “persons closely linked” to Executive Committee members (see definition “Persons closely linked”)2 Includes unvested shares and ADRs as well as other equity rights applicable for the determination of equity amounts for the share ownership requirements, as per the definition
above. Also includes unvested Alcon Keep Whole shares received in connection to the Alcon spin-off.3 The multiple is calculated based on the full-year annual base salary and the closing share price as at the end of the 2020 financial year. The share price on the final trading day of
2020 was CHF 83.65 / USD 94.43 as at December 31, 2020.4 The target number of PSUs is disclosed pro-rata to December 31, 2020, unless the award qualified for full vesting under the relevant plan rules.5 Matching shares under the Leveraged Share Savings Plan (LSSP) are disclosed pro-rata to December 31, 2020, unless the award qualified for full vesting under the plan rules. LSSP
participation for Executive Committee members ceased in 2014, although some current members received later grants under this plan prior to becoming members of the Executive Committee. Outstanding awards will vest five years from the grant date, subject to the LSSP plan rules.

Item 6. Directors, Senior Management and Employees
115
Fixed and variable compensationThe CEO and other Executive Committee members’ annual base salary and variable compensation mix at grant value for financial year 2020:
Annual Variable
base salary 1 compensation 2
Vasant Narasimhan 17.1% 82.9%
Steven Baert 22.7% 77.3%
Bertrand Bodson 26.1% 73.9%
James Bradner 21.0% 79.0%
Harry Kirsch 21.0% 79.0%
Shannon Thyme Klinger 22.3% 77.7%
Steffen Lang 24.9% 75.1%
Klaus Moosmayer 27.8% 72.2%
Richard Saynor 16.3% 83.7%
Susanne Schaffert 18.9% 81.1%
John Tsai 21.1% 78.9%
Marie-France Tschudin 23.2% 76.8%
Robert Weltevreden 26.4% 73.6%
Total 21.0% 79.0%
1 Excludes pension and other benefits.2 See the table ‘’2020 compensation at grant value for the CEO and other Executive Committee members’’ with regard to the disclosure principles of variable compensation.
Other payments to Executive Committee members During 2020, no other payments or waivers of claims other than those set out in the tables (including their foot-notes) contained in this Compensation Report were made to Executive Committee members or to “persons closely linked” to them.
Payments to former Executive Committee membersUnder the former Executive Committee members’ con-tracts and in line with the Company’s LTI plan rules, pay-ments were made to 8 former members. Of this, CHF 11 559 192 relates to the vesting of the LTPP and LTRPP for the 2018-2020 performance cycle and the vesting of
buyout awards. In addition, contractual amounts totaling 643 065 were made (comprising base salary, the Annual Incentive and other benefits), and 3 individuals received CHF 3 147 567 in tax equalization on incentive compen-sation granted during an international assignment.
No other payments (or waivers of claims) were made to former Executive Committee members or to “persons closely linked” to them during 2020.
Loans to Executive Committee membersOur policy does not allow loans to be granted to current or former members of the Executive Committee or to “persons closely linked” to them. Therefore, no loans were granted in 2020, and none were outstanding as of December 31, 2020.
Persons closely linked“Persons closely linked” are (i) their spouse, (ii) their chil-dren below age 18, (iii) any legal entities that they own or otherwise control, and (iv) any legal or natural person who is acting as their fiduciary.
Note 27 to the Group’s audited consolidated financial statementsThe total expense for the year for compensation awarded to Executive Committee and Board members, using International Financial Reporting Standards (IFRS) mea-surement rules, is presented in Note 27 to the Group’s audited consolidated financial statements.
Award and delivery of equity to Novartis associates During 2020, 14.7 million unvested restricted shares (or ADRs), RSUs and target PSUs were granted, and 13.8 million Novartis vested shares (or ADRs) were delivered to Novartis associates under various equity-based par-ticipation plans. Current unvested equity instruments (restricted shares, RSUs and target PSUs) and outstand-ing equity options held by associates represent 1.38% of issued shares. Novartis delivers treasury shares to associates to fulfill these obligations, and aims to offset the dilutive impact from its equity-based participation plans.

Item 6. Directors, Senior Management and Employees
116
Interim update regarding ongoing LTI performance cycles Below we report how performance is tracking against target for our ongoing LTI performance cycles.
2019-2021 LTPP This will be the first cycle vesting under the new system of four equally weighted measures: net sales CAGR, core operating income CAGR, innovation and relative TSR. After the first two years of the three-year LTI perfor-mance cycle, net sales CAGR is tracking above target despite a slowdown in sales in 2020, due to a significant over-delivery in 2019. Core operating income is exceed-ing expectations and is currently above target. Innovation for the cycle is currently tracking at target, with a num-ber of target filings already achieved. Forecasts at the end of December place the Novartis relative TSR at median among our global healthcare peer group.
PERFORMANCE MEASURES TRACKING
Net sales growth CAGR (25%) Above target
Core operating income CAGR (25%) Above target
Innovation (25%) At target
Relative TSR (25%) At median
CAGR = compound annual growth rate
2020-2022 LTPP After the first year of the three-year performance cycle, net sales CAGR is tracking below target. This is largely due to the impact of the pandemic on our sales execu-tion. Core operating income CAGR is tracking above tar-get, mainly driven by gross margin improvements and lower-than-planned function costs. Innovation is track-ing at target, against the selected development projects in Innovative Medicines published in Item 4.B of this report. Relative TSR is currently positioned 11 out of a peer group of 15 (including Novartis).
PERFORMANCE MEASURES TRACKING
Net sales growth CAGR (25%) Below target
Core operating income CAGR (25%) Above target
Innovation (25%) At target
Relative TSR (25%) Below median
CAGR = compound annual growth rate

Item 6. Directors, Senior Management and Employees
117
2021 Executive Committee compensationExecutive Committee member appointments and departures
Appointment of Head of Customer & Technology Solutions – Robert WeltevredenRobert Weltevreden joined the Executive Committee on June 1, 2018 as Head of Novartis Business Services (NBS). Effective February 1, 2021, the Digital function will be merged with NBS to form a new Customer and Technology Solutions unit, which Mr. Weltevreden has been appointed to lead. Effective March 1, 2021, Mr. Weltevreden will receive an annual base salary of CHF 680 000, a target Annual Incentive of 80%, and a target Long-Term Incen-tive of 190%. This represents an increase in annual base salary of 6.3% and a 10% increase in target LTI, as a per-centage of his annual base salary. There is no change to his target Annual Incentive.
Departure of Chief Digital Officer – Bertrand BodsonMr. Bodson will step down from the Executive Committee on February 1, 2021. Mr. Bodson will be treated as a good leaver for compensation purposes in line with the policy outlined in the “—Treatment of variable compensation for Executive Committee leavers”. During his contractual notice period, which ends on January 31, 2022, he will receive his annual base salary, benefits and Annual Incentive at target level in accordance with the Annual Incentive plan rules. He did not receive a Long-Term Performance Plan grant in January 2021 for the 2021-2023 performance cycle.
Mr. Bodson’s unvested Long-Term Incentives for outstanding performance cycles will be pro-rated for time employed during the three-year performance periods. In line with the plan rules, there will be no accelerated vest-ing, as awards will remain subject to performance over the full cycle. Clawback and malus, and non-compete restric-tions as defined by the plan rules will apply. No severance or non-compete payments will be made.
2021 Executive Committee member compensation increases
As outlined in “—Executive Committee appointments compensation policy,” some members were appointed with total target compensation below external market median level. Each year, we collaborate with our advisors to bench-mark the compensation levels of the members of the Executive Committee. Taking the current climate of the pan-demic into consideration, while bearing in mind the need to ensure our competitiveness in a global competitive tal-ent market, the following members will receive an increase in total target compensation for 2021, in line with their demonstrated performance and ability in their respective roles.
Steffen Lang, Head of Novartis Technical OperationsSteffen Lang led the manufacturing and supply chain function to a very strong financial and operational perfor-mance in 2020. Highlights included the uninterrupted supply during the pandemic, the further improvement of our manufacturing network utilization and footprint, the upscaling of data and digital technologies in NTO and an out-standing improvement in our environmental impact. Effective March 1, 2021, Mr. Lang will receive an annual base salary increase of 3.3% and an increase in target Annual Incentive of 10%, as a percentage of annual base salary. He will also receive a target Long-Term Incentive (LTI) increase of 20%, as a percentage of annual base salary.
Klaus Moosmayer, Chief Ethics, Risk and Compliance OfficerHaving joined Novartis in December 2018, Mr. Moosmayer is a globally recognized leader in compliance and risk management. He plays a key role in Novartis trust with society priority. Mr. Moosmayer is leading the roll-out of the Code of Ethics and advancing our Third Party Risk Management practice as well as coordinating our COVID-19 risk management, enabling the organization to function seamlessly. Effective March 1, 2021, Mr. Moosmayer will receive an annual base salary increase of 9.5% and a 20% increase in target LTI, as a percentage of annual base salary.
Another two ECN members will receive a 10% increase for their LTI target 2021-2023 (in addition to an annual base salary increase in line with local market increases), leading to an overall increase in target compensation not exceed-ing 3%. The LTI is subject to three-year performance conditions and provides for an overall payout between 0% and 200%.
All other Executive Committee members, including the CEO, were awarded annual base salary increases in line with the annual compensation review applicable to all associates in Switzerland and, where applicable, the US.

Item 6. Directors, Senior Management and Employees
118
Implementation of a Global Employee Share PlanIn 2020, the Board of Directors approved the implemen-tation of a global Employee Share Purchase Plan (ESPP). Novartis aims to launch in country waves over the next five years, which will provide associates, including Exec-utive Committee members, the option to invest up to 15%
of their base salary (capped at USD 25 000) to purchase Novartis shares at a 15% discount. The shares purchased under this plan will be subjected to a minimum manda-tory two-year holding period.

Item 6. Directors, Senior Management and Employees
119
2020 Board compensationPhilosophy and benchmarking
Aligned with market practice in Switzerland, the Board of Directors sets compensation for its members at a level that allows for the attraction of high-caliber individuals, including both Swiss and international members, who have global experience.
Board members do not receive variable compensa-tion, in line with their focus on corporate strategy, super-vision and governance. Each year at the AGM, share-holders are requested to approve, in a binding vote, the total compensation of the Board of Directors until the following AGM.
The Board of Directors sets the level of compensa-tion for its Chairman and the other members to be in line with relevant benchmark companies, which include other large Switzerland-based multinational companies: ABB, Credit Suisse, Lafarge Holcim, Nestlé, Roche and UBS. This peer group was chosen for Board compensation due to the comparability of Swiss legal requirements, including broad personal and individual liabilities under Swiss law (and new criminal liability under Swiss rules regarding board and executive committee compensa-tion related to the Ordinance against Excessive Com-pensation in Listed Companies), and under US law (due to the Company’s secondary listing on the New York Stock Exchange). The Board of Directors reviews the compensation of its members, including the Chairman, each year based on a proposal by the Compensation Committee and on advice from its independent advisor, including relevant benchmarking information. The peer group used for the Board of Directors is different than that used for the Executive Committee to ensure inde-pendence of decision-making.
The Chairman’s contract and the Board of Directors compensation policy do not provide for any termina-tion-related payments.
Chairman of the Board
As Chairman, Joerg Reinhardt receives total annual com-pensation valued at CHF 3.8 million. The total compen-sation is comprised equally of cash and shares, as fol-lows:• Cash compensation: CHF 1.9 million per year• Share compensation: annual value equal to CHF 1.9
million of unrestricted Novartis shares
For 2020, the Chairman voluntarily waived the increase in compensation to which he is contractually entitled, which is an amount not lower than the average annual compensation increase awarded to associates based in Switzerland (0.8% for 2020).
Other Board members
The annual fee rates for Board membership and addi-tional functions are included in the table below. These were approved by the Board of Directors with effect from the 2020 AGM. Aggregate Board compensation is aligned with other large Swiss companies. 2020-2021 AGM
CHF 000s annual fee
Chairman of the Board 3 800
Board membership 280
Vice Chairman 50
Chair of the Audit and Compliance Committee 130
Chair of the Compensation Committee 90
Chair of the following committees:
• Governance, Nomination and
Corporate Responsibilities Committee
• Science & Technology Committee
• Risk Committee 70
Membership of the Audit
and Compliance Committee 70
Membership of the following committees:
• Compensation Committee
• Governance, Nomination and
Corporate Responsibilities Committee
• Science & Technology Committee
• Risk Committee 40
In addition, the following policies apply regarding Board compensation:• 50% of compensation is delivered in cash, paid on a
quarterly basis in arrears. Board members may choose to receive more of their compensation in shares instead of cash.
• At least 50% of compensation is delivered in shares in two installments: one six months after the AGM, and one 12 months after the AGM.
Board members bear the full cost of their employee social security contributions, if any, and do not receive share options or pension benefits.
2021 Board compensation
In 2020, the Compensation Committee reviewed, with its independent advisor, the Board of Directors’ compen-sation system against the Swiss Market Index.
They found that the Chairman and retainer fees of the other Board members are well positioned and com-petitive among the benchmarked companies in relation to the Company’s size, operational complexity and cor-porate headquarters location. The Board of Directors compensation system and fee levels will therefore remain unchanged in 2021.
The Lead Independent Director Role is currently combined with the Vice Chair role, and no additional compensation will be paid. It is expected that the Lead Independent Director role will evolve going forward and compensation for this role will be kept under review.

Item 6. Directors, Senior Management and Employees
120
Board member total compensation earned for the financial year 2020 Governance,
Nomination
Audit and and Corporate Science & Cash Shares Other Total
Board Compliance Compensation Responsibilities Technology Risk Shares (CHF) (CHF) (CHF) (CHF)
membership Committee Committee Committee Committee Committee (number) 1 (A) (B) (C) 2 (A)+(B)+(C) 3
Board members active on December 31, 2020
Joerg Reinhardt 4 Chair Chair 22 629 1 900 000 1 900 000 4 501 3 804 501
Enrico Vanni Vice Chair • Chair • 3 156 265 000 265 000 3 614 533 614
Nancy C. Andrews • • • 2 143 180 000 180 000 – 360 000
Ton Buechner • • • 3 508 29 167 354 167 4 501 387 835
Patrice Bula • • 2 750 133 333 186 666 4 501 324 500
Srikant Datar • • • Chair 3 348 153 333 306 666 – 459 999
Elizabeth Doherty • Chair • 3 424 131 250 318 750 – 450 000
Ann Fudge • • • 2 249 183 333 183 333 – 366 666
Bridgette Heller 5 • • 1 059 133 333 133 333 – 266 666
Frans van Houten • • 3 810 – 320 000 – 320 000
Simon Moroney 5 • • 1 059 133 333 133 333 4 501 271 167
Andreas von Planta • • Chair • 2 739 230 000 230 000 4 501 464 501
Charles L. Sawyers • • • 2 143 180 000 180 000 – 360 000
William T. Winters • • • 5 4 287 – 360 000 – 360 000
Subtotal 58 304 3 652 082 5 051 248 26 118 8 729 448
See next page for 2019 comparative figures. 1 The shown amounts represent the gross number of shares delivered to each Board member in 2020 for the respective Board member’s service period. The number of shares
reported in this column represent: (i) the second and final equity installment delivered in February 2020 for the services from the 2019 AGM to the 2020 AGM, and (ii) the first of two equity installments delivered in August 2020 for the services from the 2020 AGM to the 2021 AGM. The second and final equity installment for the services from the 2020 AGM to the 2021 AGM will take place in February 2021.
2 Includes an amount of CHF 26 118 for mandatory employer contributions for all Board members paid by Novartis to governmental social security systems. This amount is out of total employer contributions of CHF 430 023 , and provides a right to the maximum future insured government pension benefit for the Board member.
3 All amounts are before deduction of the social security contribution and income tax due by the Board member. 4 No additional committee fees for chairing the Science & Technology Committee were delivered to Joerg Reinhardt. 5 From February 28, 2020.
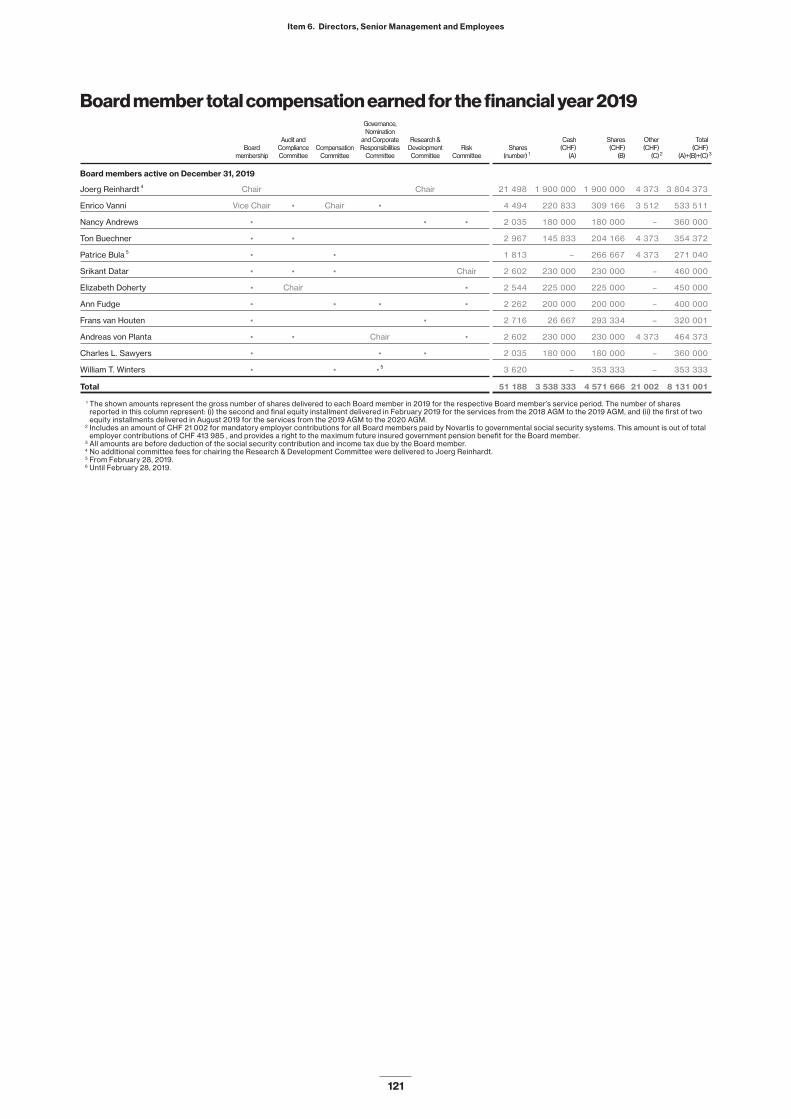
Item 6. Directors, Senior Management and Employees
121
Board member total compensation earned for the financial year 2019 Governance,
Nomination
Audit and and Corporate Research & Cash Shares Other Total
Board Compliance Compensation Responsibilities Development Risk Shares (CHF) (CHF) (CHF) (CHF)
membership Committee Committee Committee Committee Committee (number) 1 (A) (B) (C) 2 (A)+(B)+(C) 3
Board members active on December 31, 2019
Joerg Reinhardt 4 Chair Chair 21 498 1 900 000 1 900 000 4 373 3 804 373
Enrico Vanni Vice Chair • Chair • 4 494 220 833 309 166 3 512 533 511
Nancy Andrews • • • 2 035 180 000 180 000 – 360 000
Ton Buechner • • 2 967 145 833 204 166 4 373 354 372
Patrice Bula 5 • • 1 813 – 266 667 4 373 271 040
Srikant Datar • • • Chair 2 602 230 000 230 000 – 460 000
Elizabeth Doherty • Chair • 2 544 225 000 225 000 – 450 000
Ann Fudge • • • • 2 262 200 000 200 000 – 400 000
Frans van Houten • • 2 716 26 667 293 334 – 320 001
Andreas von Planta • • Chair • 2 602 230 000 230 000 4 373 464 373
Charles L. Sawyers • • • 2 035 180 000 180 000 – 360 000
William T. Winters • • • 5 3 620 – 353 333 – 353 333
Total 51 188 3 538 333 4 571 666 21 002 8 131 001
1 The shown amounts represent the gross number of shares delivered to each Board member in 2019 for the respective Board member’s service period. The number of shares reported in this column represent: (i) the second and final equity installment delivered in February 2019 for the services from the 2018 AGM to the 2019 AGM, and (ii) the first of two equity installments delivered in August 2019 for the services from the 2019 AGM to the 2020 AGM.
2 Includes an amount of CHF 21 002 for mandatory employer contributions for all Board members paid by Novartis to governmental social security systems. This amount is out of total employer contributions of CHF 413 985 , and provides a right to the maximum future insured government pension benefit for the Board member.
3 All amounts are before deduction of the social security contribution and income tax due by the Board member. 4 No additional committee fees for chairing the Research & Development Committee were delivered to Joerg Reinhardt. 5 From February 28, 2019. 6 Until February 28, 2019.

Item 6. Directors, Senior Management and Employees
122
Additional disclosures
Share ownership requirements for Board members The Chairman is required to own a minimum of 30 000 Novartis shares, and other members of the Board of Directors are required to own at least 5 000 Novartis shares within five years after joining the Board of Direc-tors, to ensure their interests are aligned with those of shareholders.
Board members are prohibited from hedging or pledging their ownership positions in Novartis shares that are part of their guideline share ownership require-ment, and are required to hold these shares for 12 months after retiring from the Board of Directors. As of Decem-ber 31, 2020, all current and former members of the Board of Directors who were required to meet the mini-mum share ownership requirements did so.
Shares, ADRs and share options owned by Board membersThe total number of vested Novartis shares and ADRs owned by members of the Board of Directors and “per-sons closely linked” to them as of December 31, 2020, is shown in the table below. As of December 31, 2020, no members of the Board, either individually or together with “persons closely linked” to them, owned 1% or more of the outstanding shares (or ADRs) of Novartis. As of the same date, no members of the Board of Directors held any share options to purchase Novartis shares. Number of shares
at December 31, 2020 1,2
Joerg Reinhardt 586 326
Enrico Vanni 28 847
Nancy C. Andrews 8 872
Ton Buechner 14 338
Patrice Bula 4 621
Srikant Datar 43 845
Elizabeth Doherty 8 744
Ann Fudge 15 201
Bridgette Heller 794
Frans van Houten 7 621
Simon Moroney 731
Andreas von Planta 163 834
Charles L. Sawyers 12 593
William T. Winters 21 289
Total 917 656
1 Includes holdings of “persons closely linked” to Board members (see definition “Persons closely linked”).
2 Each share provides entitlement to one vote.
Loans to Board membersOur policy does not allow loans to be granted to current or former members of the Board of Directors or to “per-sons closely linked” to them. Therefore, no loans were granted in 2020, and none were outstanding as of December 31, 2020.
Other payments to Board membersDuring 2020, no payments (or waivers of claims) other than those set out in the Board member compensation table titled “Board member total compensation earned for the financial year 2020” (including its footnotes) were made to current members of the Board or to “persons closely linked” to them.
Payments to former Board membersDuring 2020, no payments (or waivers of claims) were made to former Board members or to “persons closely linked” to them, except for the payments reported in Note 27 to the Group’s audited consolidated financial state-ments.

RISK MANAGEMENT PRINCIPLES
• Rigorous performance management process, with approval of targets and evaluation of performance for the CEO by the Board of Directors
• Balanced mix of short-term and long-term variable com-pensation elements
• Values and Behaviors are a key component of the Annual Incentive and are embedded in our culture
• Clawback and malus principles apply to all elements of the variable compensation
• Performance-vesting Long-Term Incentives only, with three-year cycles
• All variable compensation is capped at 200% of target
• Contractual notice period of 12 months
• Post-contractual non-compete period limited to a maximum of 12 months from the end of employment. Resulting compensation is limited to the annual base salary plus the prior-year Annual Incentive as per contract, if applicable
• Good and bad leaver provisions apply to variable compensation of leavers
• No severance payments or change-of-control clauses
• Share ownership requirements; no hedging or pledging of Novartis share ownership
Item 6. Directors, Senior Management and Employees
123
Compensation governance Legal frameworkThe Swiss Code of Obligations and the Corporate Gover-nance Guidelines of the SIX Swiss Exchange require listed companies to disclose certain information about the com-pensation of Board of Directors and Executive Committee members, their equity participation in the Group, and loans made to them. This Annual Report fulfills that requirement. In addition, the Annual Report is in line with the principles of the Swiss Code of Best Practice for Corporate Gover-nance of the Swiss Business Federation (economiesuisse).
Risk management principlesThe Compensation Committee, with support from its independent advisor, reviews market trends in compen-sation, and changes in corporate governance rules and best practices. Together with the Risk Committee, it also reviews the Novartis compensation systems to ensure that they do not encourage inappropriate or excessive risk-taking, and instead encourage behaviors that sup-port sustainable value creation. A summary of the risk management principles is outlined below.
Executive Committee employment contracts provide for a notice period of up to 12 months and contain no change-of-control clauses or severance provisions (for example, agreements concerning special notice periods, lon-ger-term contracts, “golden parachutes,” waiver of lockup periods for equities and bonds, shorter vesting periods, and additional contributions to occupational pension schemes). For share ownership requirements, please refer to “—Share ownership requirements for the CEO and other Executive Committee members.”
Compensation decision-making authoritiesAuthority for decisions related to compensation is gov-erned by the Articles of Incorporation, Board Regulations and the Compensation Committee Charter, which are all published on the Company website: www.novartis.com/investors/company-overview/corporate-governance. The Compensation Committee serves as the supervisory and
governing body for compensation policies and plans within Novartis, and has overall responsibility for determining, reviewing and proposing compensation policies and plans for approval by the Board of Directors in line with the Com-pensation Committee Charter. A summary of discussions and conclusions of each committee meeting is delivered to the full Board of Directors. A summary of the compen-sation decision-making authorities is set out below.
Compensation authorization levels within the parameters set by the shareholders’ meeting
DECISION ON DECISION-MAKING AUTHORITY
Compensation of Chairman and Board of Directorsother Board members
Compensation of CEO Board of Directors
Compensation of other Executive Compensation CommitteeCommittee members
Committee member independenceThe Compensation Committee is composed exclusively of members of the Board of Directors who meet the inde-pendence criteria set forth in the Board Regulations. From the 2020 AGM, the Compensation Committee had the fol-lowing five members: Patrice Bula, Bridgette Heller (from the 2020 AGM), Srikant Datar, Enrico Vanni and William Winters. Simon Moroney also attended each Compen-sation Committee meeting after the 2020 AGM as a per-manent guest. Mr. Vanni has served as a member since 2011 and as Chair since 2012.
Role of the Compensation Committee’s independent advisorThe Compensation Committee retained Mercer Limited during the financial year 2020 as its independent external compensation advisor to support the committee in determin-ing the design and implementation of compensation and ben-efits. The advisor was hired directly by the Compensation Committee in 2017, and the Compensation Committee has been fully satisfied with the performance and independence of the advisor since its engagement. In determining whether to renew the engagement with the advisor, the Compensa-tion Committee evaluates, at least annually, the quality of the consulting service, the independence of the advisor, and the benefits of rotating advisors. Mercer Limited also provides services related to management development at the mid- and frontline leader level and in respect of corporate pensions. The individual Mercer Limited consultants who advise and support the committee are not responsible or rewarded for work beyond support to the Compensation Committee and the People & Organization function on senior compensation.
Meetings held in 2020 and self-evaluationIn 2020, the Compensation Committee held six formal meetings. In line with prior years, it collaborated with the Science & Technology Committee to review and endorse for approval by the Board of Directors the innovation tar-gets and achievements of the Annual Incentive and LTPP. The assessment of the Compensation Committee was included in the Board’s overall 2020 self-evaluation.

Item 6. Directors, Senior Management and Employees
124
Report of the statutory auditor on the Compensation Report of Novartis AG
To the General Meeting of Novartis AG, Basel
We have audited the 2020 realized compensation for the CEO and other Executive Committee members on pages 105-108, the 2020 compensation at grant value for the CEO and other Executive Committee members on pages 109-111, and additional disclosures for the CEO and other Executive Committee members on pages 112-115, as well as the 2020 Board Compensation on pages 119-121 and the additional disclosures on page 122; of the accompa-nying Compensation Report of Novartis AG for the year ended December 31, 2020; hereinafter referred to as “disclosures made on the pages defined as subject to audit”.
Board of Directors’ responsibilityThe Board of Directors is responsible for the prepara-tion and overall fair presentation of the Compensation Report in accordance with Swiss law and the Ordinance against Excessive Compensation in Stock Exchange Listed Companies (Ordinance). The Board of Directors is also responsible for designing the remuneration sys-tem and defining individual remuneration packages.
Auditor’s responsibilityOur responsibility is to express an opinion on the accom-panying disclosures made on the pages defined as sub-ject to audit. We conducted our audit in accordance with Swiss Auditing Standards. Those standards require that we comply with ethical requirements and plan and per-form the audit to obtain reasonable assurance about whether the disclosures made on the pages defined as subject to audit comply with Swiss law and articles 14–16 of the Ordinance.
An audit involves performing procedures to obtain audit evidence on the disclosures made on the pages defined as subject to audit with regard to compensation, loans and credits in accordance with articles 14–16 of the Ordi-nance. The procedures selected depend on the auditor’s
judgment, including the assessment of the risks of mate-rial misstatements in the disclosures made on the pages defined as subject to audit, whether due to fraud or error. This audit also includes evaluating the reasonableness of the methods applied to value components of remu-neration, as well as assessing the overall presentation of the disclosures made on the pages defined as subject to audit.
We believe that the audit evidence we have obtained is sufficient and appropriate to provide a basis for our opin-ion.
OpinionIn our opinion, the disclosures made on the pages defined as subject to audit of the accompanying Compensation Report of Novartis AG for the year ended December 31, 2020 comply with Swiss law and articles 14–16 of the Ordinance.
PricewaterhouseCoopers AG
Luc Schulthess Kris MullerAudit expert Global relationship Auditor in charge partner
Basel, January 25, 2021

Governance bodies
GENERAL MEETING OF SHAREHOLDERS
Approves operating and financial review, Novartis Group consolidated financial statements, and financial statements of Novartis AG; decides appropriation of available earnings and dividend; approves compensation of Board and Executive Committee; elects Board members, Chairman, Compensation Committee members, Independent Proxy and external auditor; adopts and modifies Articles of Incorporation
EXTERNAL AUDITORBOARD OF DIRECTORS
AUDIT AND COMPLIANCE COMMITTEE
COMPENSATION COMMITTEE
RISK COMMITTEE
SCIENCE & TECHNOLOGY COMMITTEE
GOVERNANCE, NOMI NATION AND CORPORATE RESPONSIBILITIES COMMITTEE
EXECUTIVE COMMITTEE
Responsible for operational management of Novartis
Sets strategic direction of Novartis, appoints and oversees key executives, approves major transactions and investments
Provides opinion on compliance of Novartis Group consolidated financial statements and the financial statements of Novartis AG with applicable standards and Swiss law, on compliance of the Compensation Report with applicable law, on effectiveness of internal controls over financial reporting, and on the corporate responsibility reporting of Novartis
Item 6. Directors, Senior Management and Employees
125
6.C Board practices
Corporate governance Framework Novartis is committed to effective corporate governance, and our corporate governance framework is intended to support sustainable financial performance and long-term value creation for our shareholders, patients, employees and other stakeholders based on our Values and Behaviors.
The Novartis corporate governance principles are further described in key governance documents, in particular in our Articles of Incorporation and the Regulations of the Board, the Board Committees and the Executive Committee (Board Regulations) (www.novartis.com/investors/company-overview/corporate-governance). The Governance, Nomination and Corporate Responsi-bilities Committee (GNCRC) regularly reviews both the corporate governance principles and the key governance documents against evolving best practice standards and new developments in line with our commitment to main-taining the highest standards.
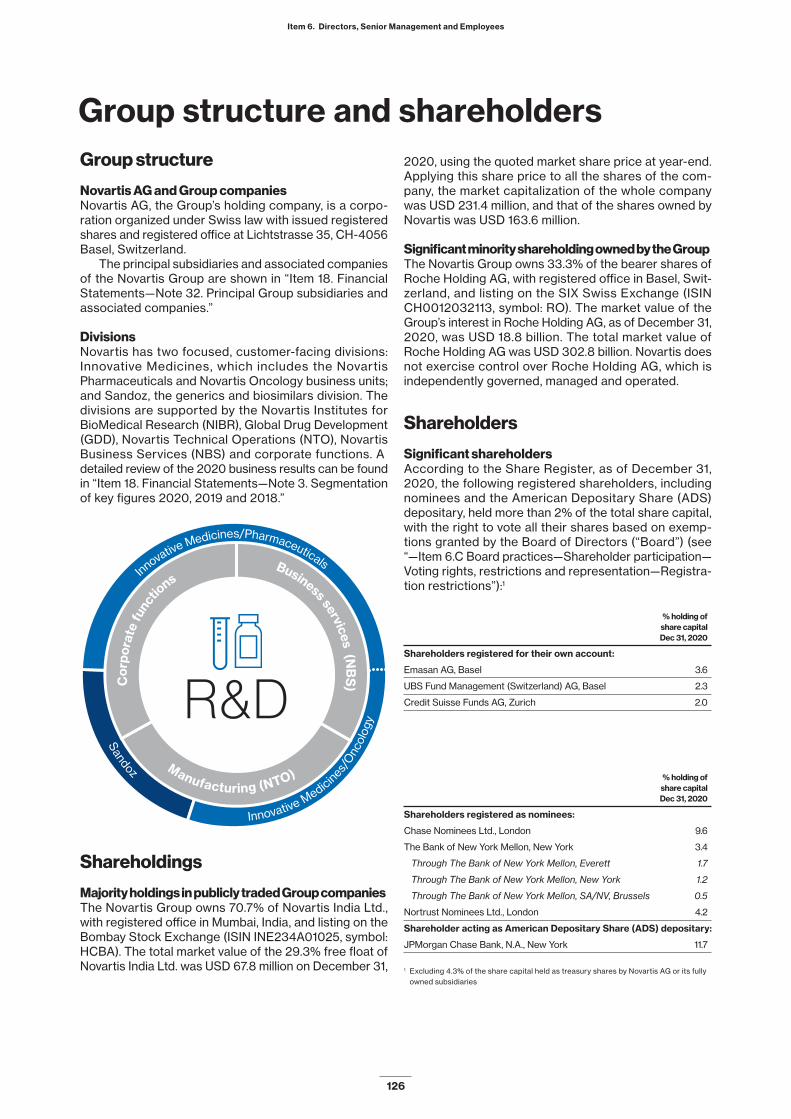
Innovative Medicines/O
ncol
ogy
Sandoz
Cor
pora
te fu
nctio
nsBusiness services (N
BS
)
Manufacturing (NTO)
Innovative Medicines/Pharmaceuticals
Innovative Medicines/O
ncol
ogy
Item 6. Directors, Senior Management and Employees
126
Group structure and shareholdersGroup structure
Novartis AG and Group companiesNovartis AG, the Group’s holding company, is a corpo-ration organized under Swiss law with issued registered shares and registered office at Lichtstrasse 35, CH-4056 Basel, Switzerland.
The principal subsidiaries and associated companies of the Novartis Group are shown in “Item 18. Financial Statements—Note 32. Principal Group subsidiaries and associated companies.”
DivisionsNovartis has two focused, customer-facing divisions: Innovative Medicines, which includes the Novartis Pharmaceuticals and Novartis Oncology business units; and Sandoz, the generics and biosimilars division. The divisions are supported by the Novartis Institutes for BioMedical Research (NIBR), Global Drug Development (GDD), Novartis Technical Operations (NTO), Novartis Business Services (NBS) and corporate functions. A detailed review of the 2020 business results can be found in “Item 18. Financial Statements—Note 3. Segmentation of key figures 2020, 2019 and 2018.”
Shareholdings
Majority holdings in publicly traded Group companiesThe Novartis Group owns 70.7% of Novartis India Ltd., with registered office in Mumbai, India, and listing on the Bombay Stock Exchange (ISIN INE234A01025, symbol: HCBA). The total market value of the 29.3% free float of Novartis India Ltd. was USD 67.8 million on December 31,
2020, using the quoted market share price at year-end. Applying this share price to all the shares of the com-pany, the market capitalization of the whole company was USD 231.4 million, and that of the shares owned by Novartis was USD 163.6 million.
Significant minority shareholding owned by the GroupThe Novartis Group owns 33.3% of the bearer shares of Roche Holding AG, with registered office in Basel, Swit-zerland, and listing on the SIX Swiss Exchange (ISIN CH0012032113, symbol: RO). The market value of the Group’s interest in Roche Holding AG, as of December 31, 2020, was USD 18.8 billion. The total market value of Roche Holding AG was USD 302.8 billion. Novartis does not exercise control over Roche Holding AG, which is independently governed, managed and operated.
Shareholders
Significant shareholdersAccording to the Share Register, as of December 31, 2020, the following registered shareholders, including nominees and the American Depositary Share (ADS) depositary, held more than 2% of the total share capital, with the right to vote all their shares based on exemp-tions granted by the Board of Directors (“Board”) (see “—Item 6.C Board practices—Shareholder participation—Voting rights, restrictions and representation—Registra-tion restrictions”):1
% holding of
share capital
Dec 31, 2020
Shareholders registered for their own account:
Emasan AG, Basel 3.6
UBS Fund Management (Switzerland) AG, Basel 2.3
Credit Suisse Funds AG, Zurich 2.0
% holding of
share capital
Dec 31, 2020
Shareholders registered as nominees:
Chase Nominees Ltd., London 9.6
The Bank of New York Mellon, New York 3.4
Through The Bank of New York Mellon, Everett 1.7
Through The Bank of New York Mellon, New York 1.2
Through The Bank of New York Mellon, SA/NV, Brussels 0.5
Nortrust Nominees Ltd., London 4.2
Shareholder acting as American Depositary Share (ADS) depositary:
JPMorgan Chase Bank, N.A., New York 11.7
1 Excluding 4.3% of the share capital held as treasury shares by Novartis AG or its fully owned subsidiaries

Item 6. Directors, Senior Management and Employees
127
According to a disclosure notification filed with Novartis AG, Norges Bank (Central Bank of Norway), Oslo, held 2.3% of the share capital but was not regis-tered in the Share Register as of December 31, 2020.
According to a disclosure notification filed with Novartis AG and the SIX Swiss Exchange, BlackRock, Inc., New York, held between 3% and 5%, but was registered with less than 2% of the share capital as of December 31, 2020.
Disclosure notifications pertaining to shareholdings filed with Novartis AG and the SIX Swiss Exchange are published on the latter’s electronic publication platform: www.six-exchange-regulation.com/en/home/publications/significant-shareholders.html.
Duty to make an offerAccording to the Swiss Federal Act on Financial Infra-structures, anyone who – directly, indirectly or acting in concert with third parties – acquires equity securities exceeding 33 1/3% of the voting rights of a company (whether or not such rights are exercisable) is required to make an offer to acquire all listed equity securities of that company. A company may raise this threshold up to 49% of the voting rights (“opting up”) or may, under cer-tain circumstances, waive the threshold (“opting out”). Novartis AG has not adopted any such measures.
Cross shareholdingsNovartis AG has no cross shareholdings in excess of 5% of capital, or voting rights with any other company.
Overview on shareholder structureThe following tables relate only to registered share-holders and cannot be assumed to represent the entire investor base because nominees and JPMorgan Chase Bank, N.A., as ADS depositary, are registered as share-holders for a large number of beneficial owners.
As of December 31, 2020, Novartis AG had approxi-mately 176 000 registered shareholders.
Number of registered shareholders/shares
Number of
registered % of
As of December 31, 2020 1 shareholders share capital
1–100 31 457 0.07
101–1 000 104 629 1.73
1 001–10 000 36 429 4.10
10 001–100 000 3 230 3.39
100 001–1 000 000 478 5.81
1 000 001–5 000 000 64 4.72
5 000 001 or more 2 32 48.13
Total registered shareholders/shares 176 319 67.95
Unregistered shares 32.05
Total 100.00
1 At the record date of the 2020 Annual General Meeting of Shareholders (AGM), unregistered shares amounted to 15%.
2 Including significant registered shareholders as listed above
Registered shareholders by type
As of December 31, 2020 Shareholders in % Shares in %
Individual shareholders 96.61 14.00
Legal entities 1 3.34 34.51
Nominees, fiduciaries
and ADS depositary 0.05 51.49
Total 100.00 100.00
1 Excluding 4.3% of the share capital held as treasury shares by Novartis AG or its fully owned subsidiaries
Registered shareholders by country1
As of December 31, 2020 Shareholders in % Shares in %
Belgium 0.12 1.03
France 2.01 0.31
Germany 5.68 1.80
Japan 0.20 0.59
Luxembourg 0.06 0.69
Switzerland 2 87.45 44.08
United Kingdom 0.59 25.09
United States 0.28 24.36
Other countries 3.61 2.05
Total 100.00 100.00
1 Registered shares held by nominees are shown in the country where the company/affiliate entered in the Share Register as shareholder has its registered seat.
2 Excluding 4.3% of the share capital held as treasury shares by Novartis AG or its fully owned subsidiaries

Item 6. Directors, Senior Management and Employees
128
Capital structureShare capital
As of December 31, 2020, the share capital amounted to CHF 1 233 530 460 fully paid-in and divided into 2 467 060 920 registered shares with a nominal value of CHF 0.50 each.
Shares are listed on the SIX Swiss Exchange (ISIN CH0012005267, symbol: NOVN) and on the New York Stock Exchange (NYSE) in the form of American Depos-itary Receipts (ADRs) representing American Deposi-tary Shares (ADSs) (ISIN US66987V1098, symbol: NVS).
No authorized and conditional capital exists as of December 31, 2020.
Shares, participation certificates, non-voting equity securities, profit-sharing certificatesShares are issued as uncertificated securities (in the sense of the Swiss Code of Obligations) and as book entry securities (in terms of the Swiss Act on Intermedi-ated Securities). All shares have equal voting rights and carry equal entitlements to dividends. No participation certificates, non-voting equity securities (Genuss scheine) or profit-sharing certificates have been issued.
Convertible securities and options
Novartis AG has not issued convertible or exchange-able bonds, warrants, options or other securities grant-ing rights to shares, other than options (or similar instru-ments such as stock appreciation rights) granted under or in connection with equity-based participation plans of associates. Novartis AG does not grant any new stock options under these plans.
Limitation on transferability
No transferability restrictions are imposed on shares (for registration restrictions, see “—Item 6.C Board practices—Shareholder participation—Voting rights, restrictions and representation—Registration restrictions”). The registra-tion of shareholders in the Share Register or in the ADR register kept by JPMorgan Chase Bank, N.A., does not affect the tradability of shares or ADRs.
Changes to share capital
Average repurchase
AGM Shareholder decision Shares canceled share price (CHF) 1
2018 • Capital reduction by CHF 33.11 million (from CHF 1 308 422 410 to CHF 1 275 312 410) 66 220 000 78.34
2019 • Capital reduction by CHF 11.63 million (from CHF 1 275 312 410 to CHF 1 263 687 410) 23 250 000 79.08
• Authorization of the Board to repurchase shares up to a maximum of CHF 10 billion
until the 2022 AGM under an eighth share repurchase program
2020 • Capital reduction by CHF 30.16 million (from CHF 1 263 687 410 to CHF 1 233 530 460) 60 313 900 88.18
Average repurchase
AGM Proposal to the shareholders Shares to be canceled share price (CHF) 1
2021 • Capital reduction by CHF 16.3 million (from CHF 1 233 530 460 to CHF 1 217 210 460) 32 640 000 80.57
• Authorization of the Board to repurchase shares as deemed appropriate from time to time
up to a maximum of CHF 10 billion between the 2021 AGM and the 2024 AGM
1 All shares were repurchased on the SIX Swiss Exchange second trading line.
Key Novartis share data
2020 2019 2018
Issued shares 2 467 060 920 2 527 374 820 2 550 624 820
Treasury shares 1 210 238 872 262 366 332 239 453 391
Outstanding shares at December 31 2 256 822 048 2 265 008 488 2 311 171 429
Weighted average number of shares outstanding 2 277 041 940 2 290 792 782 2 319 322 369
1 Approximately 103 million treasury shares (2019: 118 million; 2018: 122 million) are held in Novartis entities that restrict their availability for use.

Item 6. Directors, Senior Management and Employees
129
Per-share information1
2020 2019 2018
Basic earnings per share from continuing operations (USD) 3.55 3.12 5.52
Basic earnings per share from discontinued operations (USD) 2.00 – 0.08
Total basic earnings per share (USD) 3.55 5.12 5.44
Diluted earnings per share from continuing operations (USD) 3.52 3.08 5.46
Diluted earnings per share from discontinued operations (USD) 1.98 – 0.08
Total diluted earnings per share (USD) 3.52 5.06 5.38
Net cash flow from operating activities of continuing operations (USD) 5.99 5.91 5.63
Year-end equity for Novartis AG shareholders (USD) 25.07 24.49 34.01
Dividend (CHF) 2 3.00 2.95 2.85
1 Calculated on the weighted average number of shares outstanding, except year-end equity2 2020: proposal to shareholders for approval at the AGM on March 2, 2021
Key ratios – December 31
2020 2019 2018
Price/earnings ratio 1 26.7 18.5 15.7
Price/earnings ratio from
continuing operations 1 26.7 30.4 15.4
Dividend yield (%) 1 3.6 3.2 3.4
1 Based on the Novartis share price at December 31 of each year
Key data on ADRs issued in the US
2020 1 2019 1 2018
Year-end ADR price (USD) 94.43 94.69 85.81
High 2 99.01 96.14 93.91
Low 2 70.67 75.40 72.44
Number of
ADRs outstanding 3 288 755 853 315 073 094 338 641 387
1 2020 and 2019 exclude the business of Alcon, which was spun off in April 2019 into a separately traded standalone company.
2 Based on the daily closing prices
3 The depositary, JPMorgan Chase Bank, N.A., holds one Novartis AG share for every ADR issued.
Share price (CHF)
2020 1 2019 1 2018
Year-end share price 83.65 91.90 84.04
High 2 95.82 96.04 91.84
Low 2 69.96 77.03 72.42
Year-end market capitalization
(USD billions) 3 214.3 214.8 197.0
Year-end market capitalization
(CHF billions) 3 188.8 208.2 194.2
1 2020 and 2019 exclude the business of Alcon, which was spun off in April 2019 into a separately traded standalone company.
2 Based on the daily closing prices3 Market capitalization is calculated based on the number of shares outstanding
(excluding treasury shares). Market capitalization in USD is based on the market capitalization in CHF converted at the year-end CHF/USD exchange rate.

Item 6. Directors, Senior Management and Employees
130
Shareholder participation Shareholder engagement
Shareholder engagement is fundamental to our commit-ment to governance and transparency, and the feedback we receive during these engagements helps us create long-term and sustainable value.
We concentrate our outreach efforts on our largest 100 shareholders – portfolio managers; buy-side profes-sionals; stewardship teams; and environmental, social and governance (ESG) analysts – who represent 60% of our ownership. While the Chairman, CEO and CFO together with Investor Relations are accountable for ensuring effective shareholder engagement, other senior managers from within and outside the Executive Com-mittee also participate in the meetings. We conduct reg-ular outreach to investors throughout the year.
TYPES OF ENGAGEMENTS (SELECT EXAMPLES):
• AGM and quarterly results teleconferences (TCs)• Bank conferences and management roadshows• “Meet Novartis Management” capital markets event • Oncology pipeline update• Governance and compensation roadshow, and governance TCs• Chairman’s lunch in Zurich, and TCs for US and UK investors• ESG Investor Day and roadshows, including sustainability-linked
bond roadshow
TOPICS DISCUSSED WITH SHAREHOLDERS DURING 2020:
INNOVATION:• Progress and milestones• Data of pipeline projects (e.g., 177Lu-PSMA-617, ABL001, ACZ885,
LNP023)• Launches (e.g., Kesimpta, Tabrecta)
OPERATIONAL EXECUTION:• Financial prudence and supply chain resilience during COVID-19• Progress on financial, strategic and operational performance• Long-term sustainability of financial performance• Capital allocation strategy• Policy and pricing environment• Lifecycle management
DATA AND DIGITAL:• New initiatives and progress
BUILDING TRUST WITH SOCIETY AND CULTURE (ESG):• COVID-19 response to address all stakeholder needs• Board accountability on ESG, and integration of ESG and
compensation• Strong governance, enhanced process and focus on material ESG
factors, leading to improved rating agency scores • New ESG targets: full carbon neutrality, patient access targets for
strategic innovative therapies, and global health flagship programs• New ESG index to improve primary ESG data• Sustainability-linked bond demonstrating ESG innovation• Key resolutions (settlements with US DOJ and SEC resolving all
Foreign Corrupt Practices Act investigations including Greece, resolution with DOJ Antitrust Division concerning US generics industry investigation, settlement concerning speaker program litigation with Southern District of New York)
• Progress on culture and metrics
COMPENSATION AND GOVERNANCE: • Diversity of the Board, the Executive Committee and the Company• Board refreshment, succession planning and evaluation• Link of compensation system to key strategic priorities• Risk oversight• Independence of some Board members and the external auditor• Overboarding
We appreciate the value that shareholders attach to ESG matters. We will continue to integrate ESG into our strategy and to promote transparency through our comprehensive ESG engagement program. We have more than doubled the number of investor engagements on ESG matters in recent years, and in 2020, our CEO led our ESG Inves-tor Day for the second time (marking our seventh dedi-cated ESG event for investors since 2014). We also held our second ESG roadshow in the Netherlands, and our first ESG roadshows in France, the US and Switzerland. We are the first company in the healthcare industry to issue an innovative sustainability-linked bond, and the first company to issue such a bond based on social targets.
Voting rights, restrictions and representationREGISTRATIONShareholders have the right to vote and to execute all other rights as granted under Swiss law and the Arti-cles of Incorporation (see, in particular, articles 17 and 18 of the Articles of Incorporation: www.novartis.com/investors/company-overview/corporate-governance).
Each share registered with the right to vote by the third business day before the General Meeting entitles the holder to one vote at General Meetings. To be regis-tered with voting rights, a shareholder must declare that he or she acquired the shares in his or her own name and for his or her own account. According to article 5, paragraph 3 of the Articles of Incorporation (www.novartis.com/investors/company-overview/corporate-gover-nance), the Board may register nominees with the right to vote. The Share Register is an internal, non-public reg-ister subject to statutory confidentiality and data privacy.
REGISTRATION RESTRICTIONSArticle 5, paragraph 2 of the Articles of Incorporation (www.novartis.com/investors/company-overview/corporate-gov-ernance) provides that no shareholder shall be registered with the right to vote for more than 2% of the share capital. Given that shareholder representation at General Meetings traditionally has been rather low in Switzerland, Novartis AG considers registration restrictions ne cessary to prevent a minority shareholder from dominating a General Meeting. The Board may, upon request, grant an exemption. Con-siderations include whether the shareholder supports our goal of creating sustainable value and has a long-term investment horizon. Exemptions are in force for the regis-tered shareholders listed in “—Item 6.C Board practices—Group structure and shareholders—Shareholders—Signifi-cant shareholders.” These include Credit Suisse Funds AG, Zurich, which received an exemption in 2020 based on the fulfillment of the requirements. Exemptions also apply to the Novartis Foundation for Employee Participation, Basel, which as of December 31, 2020, was registered in the Share Reg-ister with less than 2% of the share capital, and to Norges Bank (Central Bank of Norway), Oslo, which as of Decem-ber 31, 2020, was not registered but held 2.3% according to a disclosure notification filed with Novartis AG. The same restrictions indirectly apply to ADR holders.

Item 6. Directors, Senior Management and Employees
131
Article 5, paragraph 3 of the Articles of Incorporation provides that no nominee shall be registered with the right to vote for more than 0.5% of the registered share capital. The Board may, upon request, grant an exemption from this restriction if the nominee discloses the names, addresses and number of shares of the persons for whose account it holds 0.5% or more of the registered share cap-ital. Exemptions are in force for the nominees listed in “—Item 6.C Board practices—Group structure and sharehold-ers—Shareholders—Significant shareholders,” and for the nominee Citibank, London, which in 2015 requested an exemption, but as of December 31, 2020, was not regis-tered in the Share Register. The same restrictions indirectly apply to ADR holders.
Shareholders, ADR holders, or nominees who are linked to each other or who act in concert to circumvent registration restrictions are treated as one person or nom-inee for the purposes of the restrictions on registration.
The registration restrictions may be changed by res-olution of the General Meeting, with approval of at least two-thirds of the votes represented at the meeting.
REPRESENTATION AND SHERPANY PLATFORMNormally, shareholders can vote their shares by them-selves or appoint another shareholder or the Indepen-dent Proxy to vote on their behalf. However, in accor-dance with Swiss legislation passed in response to the COVID-19 pandemic, the Board has decided that voting rights at our 2021 AGM can only be exercised through the Independent Proxy. It will not be possible to phys-ically attend our 2021 AGM. All shareholders (who are not yet registered on the online platform) will receive an invitation with a form to appoint the Independent Proxy. On this form, shareholders can also instruct the Indepen-dent Proxy to vote on alternative or additional motions related to the agenda items either (i) following the rec-ommendations of the Board for such alternative or addi-tional motions, or (ii) against such alternative or additional motions. They can also abstain from voting.
Shareholders can use the online Sherpany platform to receive invitations to General Meetings exclusively by email and to exercise their voting rights. Not-yet-registered share-holders can sign up with the account opening document that will be sent to them with the invitation to the 2021 AGM or by ordering the document from the Share Registry. Share-holders can deactivate their online account at any time and again receive invitations in paper form.
ADR HOLDERSADR holders have the rights enumerated in the deposit agreement (such as the right to give voting instruc-tions and to receive dividends). The ADS depositary of Novartis AG – JPMorgan Chase Bank, N.A., New York – holds the shares underlying the ADRs and is registered as a shareholder in the Share Register. An ADR is not a share, and an ADR holder is not a Novartis AG shareholder. Each ADR represents one share. ADR holders exercise their voting rights by instructing the depositary to exer-cise their voting rights. The ADS depositary exercises the voting rights for registered shares underlying ADRs for which no voting instructions have been given by pro-viding a discretionary proxy to an uninstructed indepen-dent designee. Such designee has to be a shareholder.
General Meeting
CONVENING The AGM must be held within six months after the end of our financial year (December 31), and normally takes place in late February/early March. Extraordinary General Meet-ings may be requested by the Board, the external auditor, or shareholders representing at least 10% of the share capital.
AGENDAShareholders representing shares with an aggregate nominal value of at least CHF 1 million may request that an item be included in a General Meeting agenda. Such requests must be made in writing at least 45 days before the meeting, specifying the requested item and proposal.
POWERSThe following powers are vested exclusively in the General Meeting:• Adoption and amendment of the Articles of Incorporation• Election and removal of the Chairman, the Board and
Compensation Committee members, the Independent Proxy and the external auditor
• Approval of the management report and of the consol-idated financial statements
• Approval of the financial statements of Novartis AG, and decision on the appropriation of available earn-ings shown on the balance sheet, including dividends
• Approval of the maximum aggregate compensation of the Board (from an AGM until the next AGM) and of the Executive Committee (for the financial year following the AGM). If the maximum aggregate amount of com-pensation already approved by the AGM is not sufficient to cover the compensation of newly appointed or pro-moted Executive Committee members, Novartis may use up to 40% of the amount last approved for the newly appointed or promoted Executive Committee members.
• Discharge of Board and Executive Committee members• Decision on other matters that are reserved by law or
by the Articles of Incorporation (e.g., advisory vote on the Compensation Report) to the General Meeting
STATUTORY QUORUMSThe General Meeting passes resolutions and elections with the absolute majority of the votes represented at the meet-ing. However, under article 18 of the Articles of Incorporation (www.novartis.com/investors/company -overview/corporate -governance), the approval of two-thirds of the votes represented at the meeting is required for: • Alteration of the purpose of Novartis AG• Creation of shares with increased voting powers• Implementation of restrictions on the transfer of registe red
shares, and the removal of such restrictions• Authorized or conditional increase of the share capital• Increase of the share capital out of equity, by contribution
in kind, for the purpose of an acquisition of property or the grant of special rights
• Restriction or cancellation of subscription rights• Change of the registered office of Novartis AG• Dissolution of Novartis AG
In addition, the law provides for a qualified majority for other resolutions, such as a merger or demerger.

Composition (as per December 31, 2020)
CHAIRMAN: J. Reinhardt VICE CHAIRMAN: E. Vanni1
N. Andrews T. Buechner P. Bula S. Datar
E. Doherty A. Fudge B. Heller F. van Houten
S. Moroney A. von Planta C. Sawyers W. Winters
AUDIT AND COMPLIANCE COMMITTEE
COMPENSATION COMMITTEE
E. Doherty (Chair) T. Buechner S. Datar A. von Planta E. Vanni
E. Vanni (Chair) P. Bula S. Datar B. Heller W. Winters
A. von Planta (Chair) A. Fudge C. Sawyers E. Vanni W. Winters
S. Datar (Chair) N. Andrews T. Buechner E. Doherty A. von Planta
J. Reinhardt (Chair) N. Andrews A. Fudge F. van Houten S. Moroney C. Sawyers
GOVERNANCE, NOMINATION AND CORPORATE RESPON- SIBILITIES COMMITTEE
RISK COMMITTEE SCIENCE & TECHNOLOGY COMMITTEE
1 In addition to his role as Vice Chairman, Enrico Vanni was appointed Lead Independent Director as of January 1, 2021.
Item 6. Directors, Senior Management and Employees
132
Board of Directors
Election and term of office
Board members (including the Chairman) and Com-pensation Committee members are elected individually by shareholders at the General Meeting for a one-year term of office. The term of office expires at the end of the next AGM.
There is currently no mandatory term limit for Board members. However, Board members who are 70 years old as of the General Meeting are no longer eligible for re-election to the Board (see article 20, paragraph 3 of the Articles of Incorporation: www.novartis.com/inves-tors/company-overview/corporate-governance). The General Meeting may, under special circumstances, grant exceptions to this rule.
At the 2021 AGM, the Board will propose to share-holders an amendment to the Articles of Incorporation that for future re-elections would replace the current age limit with a term limit. The proposal foresees that a mem-ber shall not serve on the Board for more than 12 years. The Board may recommend to shareholders exceptions under certain circumstances and if deemed to be in the best interests of the Company.
The proposed term limit supports our commitment to renew the Board on an ongoing basis. It also follows international best practice, which increasingly asks for an overall tenure of no more than 12 years. We believe age is still a relevant factor in Board composition, and the GNCRC will consider this and other factors – includ-ing gender and ethnicity – when evaluating candidates and exploring ways to improve Board diversity.
Succession planning
The Chairman, supported by the GNCRC, ensures effective succession plans for the Board, the CEO and the Execu-tive Committee. These plans are discussed by the Board in private meetings without management. A search for a new Board member is launched – normally with the sup-port of a professional executive search company – with individual selection criteria defined based on the evolv-ing needs of the Company and a continuing focus on diversity. The set of competencies (further explained in “—Item 6.C Board practices—Board of Directors—Board skills”) is also an important criterion for the GNCRC when evaluating new candidates. Candidates are interviewed by the Chairman, members of the GNCRC, other Board members, and members of the Executive Committee. The GNCRC then makes a recommendation to the full Board, and the Board ultimately decides who should be proposed for election at the upcoming AGM.
Independence
All Board members – including the Chairman – are non-ex-ecutive and independent, pursuant to applicable corpo-rate governance rules and Novartis independence criteria, which are outlined in Appendix II to the Board Regula-tions (www.novartis.com/investors/company-overview/corporate-governance). In particular, no Board member is or was a member of the management of Novartis AG or of any other Novartis Group company in the last three financial years up to December 31, 2020, or has a signif-icant business relationship with Novartis AG or with any other Novartis Group company. We assess independence annually. Because all Board members are independent, no separate meetings of independent Board members were held in 2020.

Diversity profile
p American 36%p Swiss 28%p British 11%p Dutch 11%p German 11%p New Zealander 3%
Gender TENURE
EXECUTIVE/NON-EXECUTIVE INDEPENDENCEGENDER
AGEBACKGROUND/EXPERIENCE
NATIONALITY
p Male 71%p Female 29%
p 55–60 29%p 61–65 50%p >65 21%
Tenure
p <3 y 21%p 3–6 y 29%p 7–9 y 29%p >9 y 21%
Age TENURE
EXECUTIVE/NON-EXECUTIVE INDEPENDENCEGENDER
AGEBACKGROUND/EXPERIENCE
NATIONALITY
Nationality1
TENURE
EXECUTIVE/NON-EXECUTIVE INDEPENDENCEGENDER
AGEBACKGROUND/EXPERIENCE
NATIONALITY
TENURE
EXECUTIVE/NON-EXECUTIVE INDEPENDENCEGENDER
AGEBACKGROUND/EXPERIENCE
NATIONALITY
1 Please note that four Board members have two nationalities. Each of these nationalities is counted as a half in the above chart.
Board skill distribution
Medicine/healthcare/R&D 50% 7/14
Leadership/management 86% 12/14
Finance/accounting 50% 7/14
Law/regulatory/risk management 50% 7/14
Data/digital 21% 3/14
Environmental, social 43% 6/14 and governance (ESG)
Item 6. Directors, Senior Management and Employees
133
Diversity
Diversity is a key factor to success and Board effective-ness. A diverse Board ensures that the appropriate bal-ance of skills, expertise and experience is represented to discharge responsibilities to shareholders, and helps create long-term value. We are continuously looking for opportunities to improve our Board diversity, including gender and ethnic diversity. Last year, we disclosed our
aspiration to find female candidates for two of the next three nominations. At the 2020 AGM, our Board welcomed its fourth female member, Bridgette Heller. Compared to last year, the female representation on our Board rose to 29% from 25%. The GNCRC is focused on achieving even greater diversity when identifying new Board mem-ber candidates and aims to further increase the number of women on the Board.
Board skills
Upon proposal by the GNCRC, the Board has determined a diverse set of competencies for its members that align with our status as a listed company as well as our busi-ness portfolio, geographic reach and culture. Based on this set of competencies, our Board members were asked to identify their most relevant skills highlighted by their educational background, professional experience and personal achievements.
The GNCRC assesses the set of competencies as well as the individual skills annually to ensure that an appropriate balance of skills, expertise, experience and diversity is represented on the Board.
To learn more about our Board members’ biographies and their individual skills, see “—Item 6.C Board practices—Board of Directors—Members of the Board of Directors.”
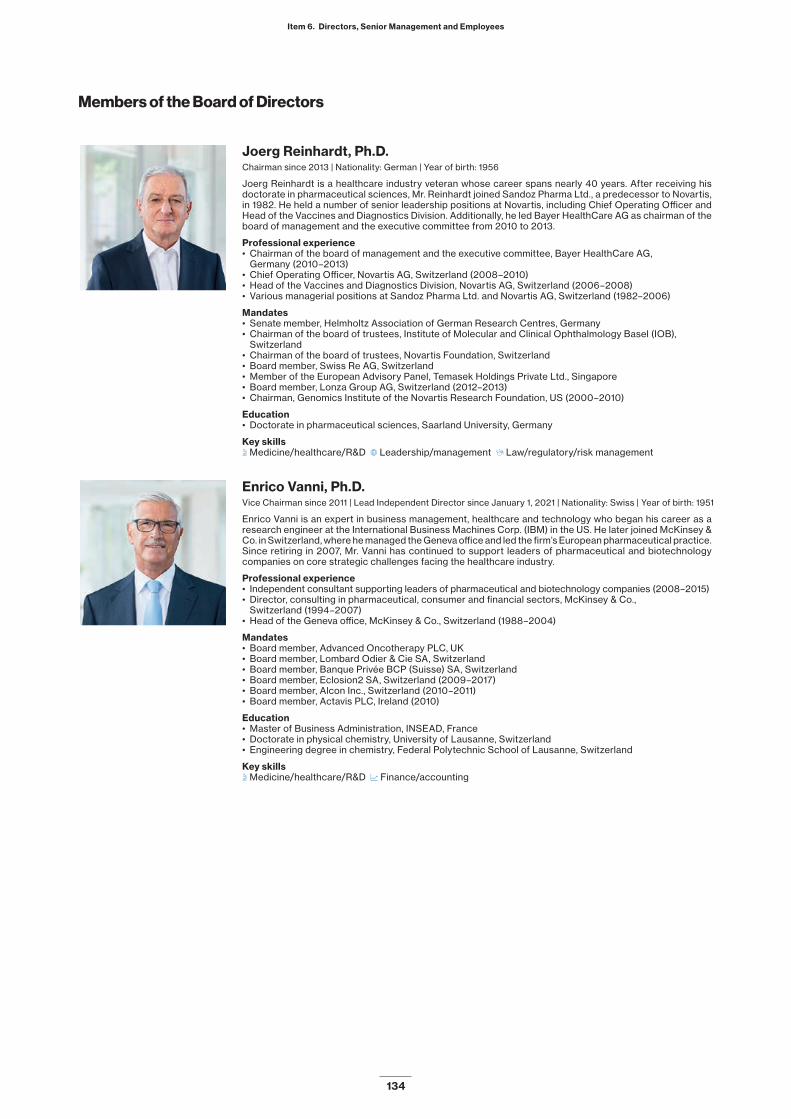
Item 6. Directors, Senior Management and Employees
134
Members of the Board of Directors
Joerg Reinhardt, Ph.D.Chairman since 2013 | Nationality: German | Year of birth: 1956
Joerg Reinhardt is a healthcare industry veteran whose career spans nearly 40 years. After receiving his doctorate in pharmaceutical sciences, Mr. Reinhardt joined Sandoz Pharma Ltd., a predecessor to Novartis, in 1982. He held a number of senior leadership positions at Novartis, including Chief Operating Officer and Head of the Vaccines and Diagnostics Division. Additionally, he led Bayer HealthCare AG as chairman of the board of management and the executive committee from 2010 to 2013.
Professional experience • Chairman of the board of management and the executive committee, Bayer HealthCare AG,
Germany (2010–2013)• Chief Operating Officer, Novartis AG, Switzerland (2008–2010)• Head of the Vaccines and Diagnostics Division, Novartis AG, Switzerland (2006–2008)• Various managerial positions at Sandoz Pharma Ltd. and Novartis AG, Switzerland (1982–2006)
Mandates • Senate member, Helmholtz Association of German Research Centres, Germany • Chairman of the board of trustees, Institute of Molecular and Clinical Ophthalmology Basel (IOB),
Switzerland• Chairman of the board of trustees, Novartis Foundation, Switzerland• Board member, Swiss Re AG, Switzerland• Member of the European Advisory Panel, Temasek Holdings Private Ltd., Singapore• Board member, Lonza Group AG, Switzerland (2012–2013)• Chairman, Genomics Institute of the Novartis Research Foundation, US (2000–2010)
Education• Doctorate in pharmaceutical sciences, Saarland University, Germany
Key skillsx Medicine/healthcare/R&D g Leadership/management l Law/regulatory/risk management
Enrico Vanni, Ph.D.Vice Chairman since 2011 | Lead Independent Director since January 1, 2021 | Nationality: Swiss | Year of birth: 1951
Enrico Vanni is an expert in business management, healthcare and technology who began his career as a research engineer at the International Business Machines Corp. (IBM) in the US. He later joined McKinsey & Co. in Switzerland, where he managed the Geneva office and led the firm’s European pharmaceutical practice. Since retiring in 2007, Mr. Vanni has continued to support leaders of pharmaceutical and biotechnology companies on core strategic challenges facing the healthcare industry.
Professional experience • Independent consultant supporting leaders of pharmaceutical and biotechnology companies (2008–2015)• Director, consulting in pharmaceutical, consumer and financial sectors, McKinsey & Co.,
Switzerland (1994–2007)• Head of the Geneva office, McKinsey & Co., Switzerland (1988–2004)
Mandates • Board member, Advanced Oncotherapy PLC, UK• Board member, Lombard Odier & Cie SA, Switzerland• Board member, Banque Privée BCP (Suisse) SA, Switzerland• Board member, Eclosion2 SA, Switzerland (2009–2017)• Board member, Alcon Inc., Switzerland (2010–2011)• Board member, Actavis PLC, Ireland (2010)
Education• Master of Business Administration, INSEAD, France• Doctorate in physical chemistry, University of Lausanne, Switzerland• Engineering degree in chemistry, Federal Polytechnic School of Lausanne, Switzerland
Key skillsx Medicine/healthcare/R&D m Finance/accounting

Item 6. Directors, Senior Management and Employees
135
Nancy C. Andrews, M.D., Ph.D.Board member since 2015 | Nationality: American/Swiss | Year of birth: 1958
Nancy C. Andrews has extensive experience as a physician, scientist, professor and senior administrator at leading academic institutions and hospitals. Her distinguished career spans more than 30 years, with leadership roles at both Harvard Medical School and the Duke University School of Medicine. Dr. Andrews currently chairs the board of the American Academy of Arts and Sciences, and is credited with conducting research that led to advances in understanding iron biology and iron diseases.
Professional experience • Dean emerita, Duke University School of Medicine, and vice chancellor emerita for academic affairs,
Duke University, US (2017–present)• Dean, Duke University School of Medicine, and vice chancellor for academic affairs,
Duke University, US (2007–2017)• Professor of pediatrics, pharmacology and cancer biology, Duke University, US (2007–present)• Dean for basic sciences and graduate studies, Harvard Medical School, US (2003–2007)• Director, Harvard/MIT M.D.-Ph.D. Program, US (1999–2003)• Biomedical research investigator, Howard Hughes Medical Institute, US (1993–2006)
Mandates • Board member, Charles River Laboratories Inc., US• Member of the executive committee of the Corporation, Massachusetts Institute of Technology, US• Council member, National Academy of Sciences, US• Former council member (2013–2019) and member, National Academy of Medicine, US• Chair of the board, American Academy of Arts and Sciences, US • Member of the Scientific Advisory Board, Dyne Therapeutics Inc., US• Board member and former chair, Burroughs Wellcome Fund, US (2011–2019)• Member of the Scientific Management Review Board, National Institutes of Health, US (2014–2019)
Education• Doctor of medicine, Harvard Medical School, US• Doctorate in biology, Massachusetts Institute of Technology, US• Master of Science and Bachelor of Science in molecular biophysics and biochemistry, Yale University, US
Key skillsx Medicine/healthcare/R&D g Leadership/management
Ton BuechnerBoard member since 2016 | Nationality: Dutch/Swiss | Year of birth: 1965
Ton Buechner is an engineer by training who started his career in the oil and gas construction industry. He spent almost two decades at Sulzer AG, and held leadership roles including CEO and divisional president. Mr. Buechner most recently served as chairman and CEO of the executive board of AkzoNobel NV, a company widely recognized as a leader in sustainability, where he implemented significant ESG policies.
Professional experience • CEO and chairman of the executive board, AkzoNobel NV, Netherlands (2012–2017)• CEO, Sulzer AG, Switzerland (2007–2011)• President, Sulzer Pumps, Switzerland (2003–2006)• President, Sulzer Turbomachinery Services, Switzerland (2000–2002)• Various managerial positions at Sulzer AG, China and Switzerland (1994–2000)
Mandates• Chairman of the board of directors, Burckhardt Compression AG, Switzerland• Chairman of the board of directors, Swiss Prime Site AG, Switzerland• Advisor, Ammega, Switzerland • Member of the presidential and shareholder committees, Voith GmbH & Co. KGaA, Germany (2014–2020)• Member of the supervisory board, Voith GmbH & Co. KGaA, Germany (2014–2018)
Education• Master of Business Administration, IMD business school, Switzerland• Master of Science in civil engineering, Delft University of Technology, Netherlands
Key skillsg Leadership/management m Finance/accounting l Law/regulatory/risk management z Environmental, social and governance (ESG)
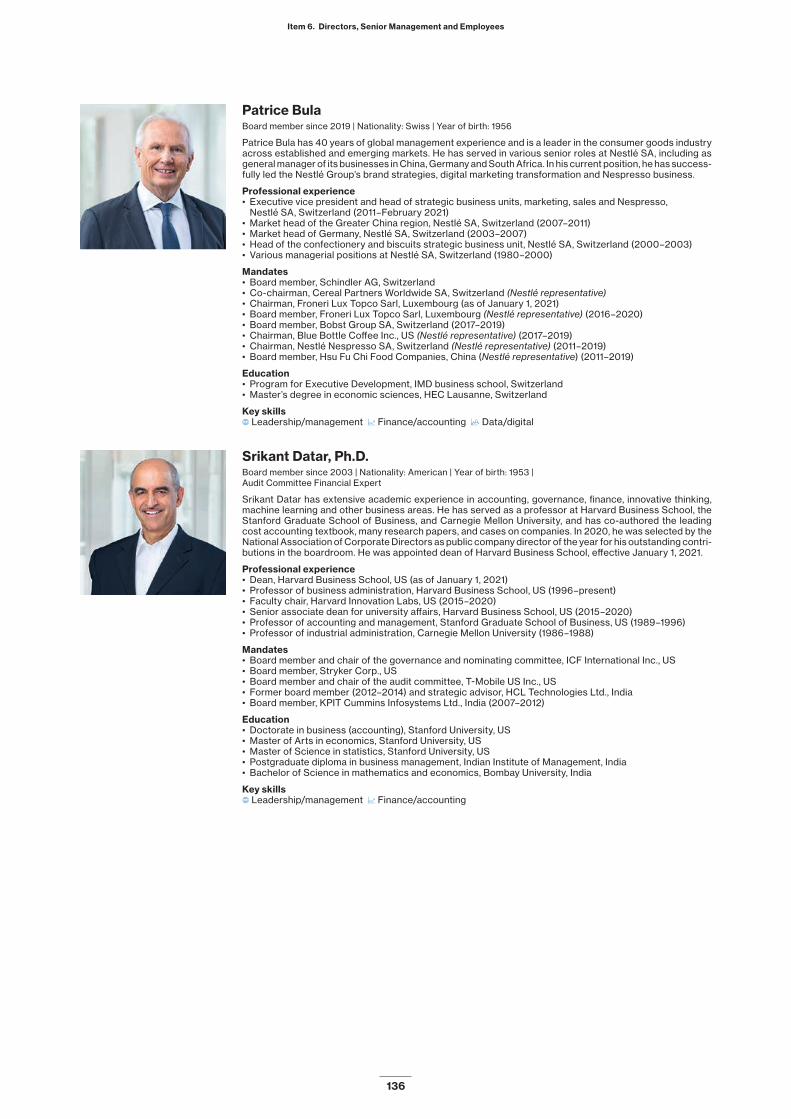
Item 6. Directors, Senior Management and Employees
136
Patrice BulaBoard member since 2019 | Nationality: Swiss | Year of birth: 1956
Patrice Bula has 40 years of global management experience and is a leader in the consumer goods industry across established and emerging markets. He has served in various senior roles at Nestlé SA, including as general manager of its businesses in China, Germany and South Africa. In his current position, he has success-fully led the Nestlé Group’s brand strategies, digital marketing transformation and Nespresso business.
Professional experience • Executive vice president and head of strategic business units, marketing, sales and Nespresso,
Nestlé SA, Switzerland (2011–February 2021)• Market head of the Greater China region, Nestlé SA, Switzerland (2007–2011)• Market head of Germany, Nestlé SA, Switzerland (2003–2007)• Head of the confectionery and biscuits strategic business unit, Nestlé SA, Switzerland (2000–2003)• Various managerial positions at Nestlé SA, Switzerland (1980–2000)
Mandates• Board member, Schindler AG, Switzerland• Co-chairman, Cereal Partners Worldwide SA, Switzerland (Nestlé representative)• Chairman, Froneri Lux Topco Sarl, Luxembourg (as of January 1, 2021)• Board member, Froneri Lux Topco Sarl, Luxembourg (Nestlé representative) (2016–2020)• Board member, Bobst Group SA, Switzerland (2017–2019)• Chairman, Blue Bottle Coffee Inc., US (Nestlé representative) (2017–2019)• Chairman, Nestlé Nespresso SA, Switzerland (Nestlé representative) (2011–2019)• Board member, Hsu Fu Chi Food Companies, China (Nestlé representative) (2011–2019)
Education• Program for Executive Development, IMD business school, Switzerland• Master’s degree in economic sciences, HEC Lausanne, Switzerland
Key skillsg Leadership/management m Finance/accounting y Data/digital
Srikant Datar, Ph.D.Board member since 2003 | Nationality: American | Year of birth: 1953 | Audit Committee Financial Expert
Srikant Datar has extensive academic experience in accounting, governance, finance, innovative thinking, machine learning and other business areas. He has served as a professor at Harvard Business School, the Stanford Graduate School of Business, and Carnegie Mellon University, and has co-authored the leading cost accounting textbook, many research papers, and cases on companies. In 2020, he was selected by the National Association of Corporate Directors as public company director of the year for his outstanding contri-butions in the boardroom. He was appointed dean of Harvard Business School, effective January 1, 2021.
Professional experience• Dean, Harvard Business School, US (as of January 1, 2021)• Professor of business administration, Harvard Business School, US (1996–present)• Faculty chair, Harvard Innovation Labs, US (2015–2020)• Senior associate dean for university affairs, Harvard Business School, US (2015–2020)• Professor of accounting and management, Stanford Graduate School of Business, US (1989–1996)• Professor of industrial administration, Carnegie Mellon University (1986–1988)
Mandates• Board member and chair of the governance and nominating committee, ICF International Inc., US• Board member, Stryker Corp., US• Board member and chair of the audit committee, T-Mobile US Inc., US• Former board member (2012–2014) and strategic advisor, HCL Technologies Ltd., India • Board member, KPIT Cummins Infosystems Ltd., India (2007–2012)
Education• Doctorate in business (accounting), Stanford University, US• Master of Arts in economics, Stanford University, US• Master of Science in statistics, Stanford University, US• Postgraduate diploma in business management, Indian Institute of Management, India• Bachelor of Science in mathematics and economics, Bombay University, India
Key skillsg Leadership/management m Finance/accounting

Item 6. Directors, Senior Management and Employees
137
Elizabeth (Liz) DohertyBoard member since 2016 | Nationality: British | Year of birth: 1957 | Audit Committee Financial Expert
Elizabeth (Liz) Doherty is an expert in finance and accounting who has broad operational experience in inter-national consumer and retail businesses. She began her career in internal audit at Unilever PLC and has held senior finance and accounting roles there and at other companies including Tesco PLC and Reckitt Benckiser Group PLC.
Professional experience • CFO (interim), Cognita Schools Ltd., UK (2014–2015) • CFO and board member, Reckitt Benckiser Group PLC, UK (2011–2013)• CFO (interim), City Inn, UK (2010)• CFO, Brambles Ltd., Australia (2007–2009)• Group international finance director, Tesco PLC, UK (2001–2007)• Various managerial positions at Unilever PLC, UK (1981–2001)
Mandates • Board member, Corbion NV, Netherlands• Member of the supervisory board and chair of the audit committee, Royal Philips NV, Netherlands• Advisor, Affinity Petcare SA and GB Foods SA, Spain• Board member, Dunelm Group PLC, UK (2013–2019)• Board member, HM Courts & Tribunals Service, UK (2015–2019)• Board member, Ministry of Justice, UK (2015–2019)• Board member, Delhaize Group, Belgium (2013–2016)• Board member, Nokia Corp., Finland (2013–2016)• Board member, Brambles Ltd., Australia (2007–2009)• Board member, SABMiller PLC, UK (2004–2010)
Education• Fellow, Chartered Institute of Management Accountants, UK• Bachelor’s degree in liberal studies in science (physics), University of Manchester, UK
Key skillsg Leadership/management m Finance/accounting l Law/regulatory/risk management
Ann FudgeBoard member since 2008 | Nationality: American | Year of birth: 1951
Ann Fudge has a track record of success across global technology and consumer goods companies, and is widely considered one of the most influential women in American business. Before serving as chairman and CEO of Young & Rubicam Brands, Ms. Fudge spent 15 years in leadership roles at Kraft Foods Inc. She is deeply committed to social initiatives, including the Executive Leadership Council, a nonprofit focused on helping African American leaders positively impact business and communities. With WGBH Public Media, she has brought greater focus to more diverse media programming and broadening the reach of communi-ty-based initiatives. More recently, she has consulted with companies and educational institutions as they develop social justice initiatives.
Professional experience • Chairman and CEO, Young & Rubicam Brands, US (2003–2007)• President of the Beverages, Desserts and Post Division brands, Kraft Foods Inc., US (2000–2001)• Various managerial positions at Kraft Foods Inc., US (1986–2000)
Mandates• Senior trustee, the Brookings Institution, US• Member, American Academy of Arts and Sciences, US• Board member, Northrop Grumman Corp., US• Chair of the board of trustees, WGBH Public Media, US• Chair of the United States Program Advisory Panel, Bill & Melinda Gates Foundation, US (2007–2019)• Member of the visiting committee, Harvard Business School, US (2014–2019)• Board member and former vice chair, Unilever PLC and NV, UK and Netherlands (2009–2018)• Board member, General Electric Co., US (1999–2015)
Education• Master of Business Administration, Harvard Business School, US • Bachelor’s degree in management, Simmons College, US
Key skillsg Leadership/management z Environmental, social and governance (ESG)

Item 6. Directors, Senior Management and Employees
138
Bridgette HellerBoard member since February 28, 2020 | Nationality: American | Year of birth: 1961
Bridgette Heller has proven experience in the standalone divisions of companies such as Johnson & Johnson, Merck & Co. Inc. and Danone SA, and has served on the audit committees of ADT Corp. and Tech Data Corp. During her career, she has overseen the performance of CFOs and made decisions on strategic R&D prior-ities. Ms. Heller is an advocate for diversity, equity and inclusion, and traveled globally to reinforce Danone’s commitment to infant and maternal health, inclusive diversity, an equitable workforce for women, and sustainable communities. She is co-founder and CEO of the Shirley Proctor Puller Foundation, an education and youth empowerment nonprofit, and devotes much of her time to strengthening education and sustain-ability in an underserved community in the US.
Professional experience • Co-founder and CEO, Shirley Proctor Puller Foundation, US (2019–present)• EVP and president of specialized nutrition, Danone SA, Netherlands (2017–2019)• EVP of early life nutrition, Danone SA, Netherlands (2016–2019)• EVP and president of consumer care, Merck & Co. Inc., US (2010–2015)• Global president of the baby global business unit, Johnson & Johnson, US (2007–2009)• President of the US baby, kids and wound care business and of global innovation development, Johnson
& Johnson, US (2005–2007)• Managing partner, Heller Associates: Ideas for Growth Inc., US (2004–2005)• CEO, Chung’s Gourmet Foods, US (2003–2004)• Various managerial positions at Kraft Foods Inc., US (1985–2003)
Mandates• Board member, Dexcom Inc., US• Board member, Newman’s Own Inc., US• Member of the board of trustees, Northwestern University, US• Member of the advisory board, Kellogg School of Management at Northwestern University, US• Board member, Shirley Proctor Puller Foundation, US• Board member, Tech Data Corp., US (2016–2020)• Board member, ADT Corp., US (2012–2016)• Board member, Girls Inc., US (2002–2014)
Education• Master’s degree in marketing and management policy, Kellogg School of Management at Northwestern
University, US• Bachelor’s degree in economics and computer studies, Northwestern University, US
Key skillsx Medicine/healthcare/R&D g Leadership/management m Finance/accounting z Environmental, social and governance (ESG)
Frans van HoutenBoard member since 2017 | Nationality: Dutch | Year of birth: 1960
Frans van Houten is passionate about purpose-driven innovation, entrepreneurship and business transfor-mation to drive competitiveness and customer value. Under his leadership as CEO, Royal Philips NV has transformed into a focused health technology leader through targeted divestments, acquisitions and organic business development. Royal Philips NV has also adopted a comprehensive set of commitments across all the ESG dimensions, and is today carbon neutral in its operations and recycles 90% of its operational waste. Mr. van Houten was an initiator of The Compact for Responsive and Responsible Leadership, which aims to create a corporate governance framework with a focus on the long-term sustainability of corporations and the long-term goals of society.
Professional experience • CEO and chairman of the executive committee and the board of management, Royal Philips NV,
Netherlands (2011–present)• Interim management, ING Group NV, Netherlands (2009–2010)• CEO and chairman of the management board, NXP Semiconductors NV (formerly Philips
Semiconductors NV), Netherlands (2004–2009)• Various managerial positions at Royal Philips Electronics NV, Netherlands (1986–2004)
Mandates • Member of the steering committee, European Round Table for Industry (ERT), Belgium• Vice chairman and member of the supervisory board, Philips Lighting, Netherlands (2016–2017)
Education• Master of Science in economics and business management, Erasmus University Rotterdam, Netherlands• Bachelor of Science in economics, Erasmus University Rotterdam, Netherlands
Key skillsx Medicine/healthcare/R&D g Leadership/management l Law/regulatory/risk management y Data/digital z Environmental, social and governance (ESG)
Item 6. Directors, Senior Management and Employees
139
Simon Moroney, D.Phil.Board member since February 28, 2020 | Nationality: German/New Zealander | Year of birth: 1959
As co-founder and CEO of MorphoSys AG, Simon Moroney played a central role in establishing the company as a force in the field of therapeutic antibodies, with one of the broadest pipelines of drug candidates in the industry. Mr. Moroney holds both a doctorate and a Master of Science in chemistry.
Professional experience • Co-founder and CEO, MorphoSys AG, Germany (1992–2019)• Research associate, Department of Pharmacology, University of Cambridge, UK (1991–1992)• Assistant professor, Department of Chemistry, University of British Columbia, Canada (1989–1990)
Education• Doctorate in chemistry, University of Oxford, UK• Master of Science in chemistry, University of Waikato, New Zealand
Key skillsx Medicine/healthcare/R&D g Leadership/management l Law/regulatory/risk management
Andreas von Planta, Ph.D.Board member since 2006 | Nationality: Swiss | Year of birth: 1955
Andreas von Planta is a leading expert in corporate governance, corporate law and stock exchange regulation. He advises boards of public companies on corporate governance matters and is a sought-after speaker and writer on these topics. He has co-authored the Switzerland chapter of the International Comparative Legal Guide to Corporate Governance for many years.
Professional experience• Senior counsel, Lenz & Staehelin, Switzerland (2017–present)• Partner, Lenz & Staehelin, Switzerland (1988–2017)
Mandates • Board member, Helvetia Holding AG, Switzerland• Board member, A.P. Moller Finance SA, Switzerland• Board member, Helvetia Schweizerische Lebensversicherungsgesellschaft AG, Switzerland• Board member, Helvetia Schweizerische Versicherungsgesellschaft AG, Switzerland• Chairman, HSBC Private Bank (Suisse) SA, Switzerland• Chairman, HSBC Private Banking Holdings (Suisse) SA, Switzerland• Board member, Socotab Frana SA, Switzerland • Chairman of the regulatory board, SIX Swiss Exchange AG, Switzerland• Board member, Burberry (Suisse) SA, Switzerland• Chairman of the audit committee, International Road Transport Union, Switzerland• Board member, Raymond Weil SA, Switzerland (2007–2018)• Board member and former chairman, Clinique Générale-Beaulieu SA, Switzerland (2008–2016)• Board member and former chairman, Schweizerische National Versicherungs AG, Switzerland (1997–2015)• Board member, Holcim AG, Switzerland (2003–2014)
Education• Master of Laws, Columbia Law School, US• Bar examination, Switzerland• Doctorate in law, University of Basel, Switzerland• Licentiatus iuris, University of Basel, Switzerland
Key skillsl Law/regulatory/risk management z Environmental, social and governance (ESG)

Item 6. Directors, Senior Management and Employees
140
Charles L. Sawyers, M.D.Board member since 2013 | Nationality: American | Year of birth: 1959
Charles L. Sawyers is a highly accomplished expert and leader in cancer research. As a physician and prominent scientist, he has a deep understanding of the benefits of drugs for patients and society at large, and the importance of access to medicines. Dr. Sawyers co-developed the Novartis cancer drug Gleevec/Glivec and has received numerous honors and awards, including the Lasker-DeBakey Clinical Medical Research Award.
Professional experience• Chair of the Human Oncology and Pathogenesis Program, Memorial Sloan Kettering Cancer Center, US
(2006–present)• Professor of medicine (2008–present), and professor of cell and developmental biology (2011–present),
Weill Cornell Graduate School of Medical Sciences, US• Investigator, Howard Hughes Medical Institute, US (2002–2006 and 2008–present)• Associate chief, Division of Hematology-Oncology, University of California, Los Angeles, US (1996–2006)
Mandates• Member, National Academy of Medicine, US• Member, National Academy of Sciences, US • Investigator, Howard Hughes Medical Institute, US• Science advisor for the following US companies: Agios Pharmaceuticals Inc.; Arsenal Capital Partners;
BeiGene Ltd.; Blueprint Medicines Corp.; Foghorn Therapeutics Inc.; Housey Pharmaceutical Research Laboratories; KSQ Therapeutics Inc.; Nextech Invest Ltd.; ORIC Pharmaceuticals Inc.; PMV Pharmaceuticals Inc.; The Column Group
• Member, National Cancer Advisory Board, US (2012–2020)• President, American Association for Cancer Research, US (2013–2014)
Education• Doctor of medicine, Johns Hopkins University School of Medicine, US• Bachelor of Arts, Princeton University, US
Key skillsx Medicine/healthcare/R&D g Leadership/management z Environmental, social and governance (ESG)
William T. WintersBoard member since 2013 | Nationality: British/American | Year of birth: 1961
William T. Winters has extensive leadership experience in the financial sector. He began his career at JPMorgan Chase & Co. in 1983 and has held management roles across several market areas and in corporate finance. Mr. Winters founded Renshaw Bay LLP, an alternative asset management firm, and now serves as CEO of Standard Chartered PLC, where he is leading a digital transformation of the global bank.
Professional experience• CEO, Standard Chartered PLC, UK (2015–present)• Chairman and CEO, Renshaw Bay LLP, UK (2011–2015)• Co-CEO of the Investment Bank, JPMorgan Chase & Co., UK (2004–2010)• Various managerial positions at JPMorgan Chase & Co., UK and US (1983–2004)
Mandates • Board member, Standard Chartered Bank PLC, UK• Board member, International Rescue Committee, UK• Chair of the board of trustees, The Coronet Theatre, UK• Commissioner, Independent Commission on Banking, UK (2010–2011)
Education• Master of Business Administration, Wharton School of the University of Pennsylvania, US• Bachelor’s degree in international relations, Colgate University, US
Key skillsg Leadership/management m Finance/accounting l Law/regulatory/risk management y Data/digital
Corporate Secretary
Charlotte Pamer-Wieser, Ph.D.

Item 6. Directors, Senior Management and Employees
141
Self-assessment
The Board and its committees conduct a self-assess-ment once a year, covering topics including Board com-position, purpose, scope and responsibilities; Board pro-cesses and governance; Board meetings and pre-reading material; team effectiveness; and Chairman and peer evaluation. Every third year, this process is conducted by an independent external consultant. This last happened in 2017 and was repeated in 2020 with the consulting firm Egon Zehnder.
As part of the 2020 self-assessment, each Board member filled out a questionnaire prepared by Egon Zehnder, and then participated in an interview to share his or her perspectives on current strengths and poten-tial areas for development, best practices exhibited by other boards, the contributions of each Board member, and the interaction between the Board and the Execu-tive Committee. Additionally, representatives from Egon Zehnder met with each Executive Committee member to capture his or her perspectives on how the Board functions as a whole and interacts with the Executive Committee, and to solicit ideas on how the Board can be even more effective. Egon Zehnder representatives also observed parts of a Board meeting.
In a meeting with the Chairman, Egon Zehnder first shared the preliminary results of the in-depth assess-ment. Thereafter, Egon Zehnder led a qualitative review with the Board, sharing its key observations and recom-mendations, and held individual feedback sessions with each Board member.
The results of the 2020 in-depth assessment by Egon Zehnder determined that the Board and its committees are perceived as functioning well, and that the Board is evolving positively, both in how it operates and in its com-position. Board meetings are considered to have a high level of transparency, and provide clarity around deci-sions. The feedback from management on the Board’s evaluation showed that the Executive Committee wel-comes the longer-term perspective of the Board and the level of strategic discussion, as well as the interactions with individual Board members.
The report did make a number of recommendations for the Board’s consideration, including succession plan-ning (the right degree of continuity, diversity, and breadth of skills), and where the Board should focus its attention, factoring in the current challenges posed by the pandemic.
Trainings
Our Board receives regular briefings and trainings on ethics, risks and compliance, and other relevant topics. In 2020, each Board member completed the following e-learning courses: • Data Privacy• Novartis Code of Ethics• Fit to Commit, focusing on our ethical commitments
around anti-bribery, antitrust and fair competition, insider trading and third-party risk management
Our Chief Legal Officer also provides regular updates to our Board members on developments related to insider trad-ing laws and regulations. In addition, the Company offers to its Board members a broad set of external trainings.
Role of the Board and its committees
The Board is responsible for the overall direction and oversight of management, and holds the ultimate decision-making authority, with the exception of deci-sions reserved for shareholders.
The Board has delegated certain of its duties and responsibilities to its five committees led by a Board-elected committee chair, as set out in the Board Regulations (www.novartis.com/investors/company-overview/corporate-gov-ernance). In some cases, these responsibilities are of an advisory or preparatory nature (A/P). In other cases, the committee has decision-making power that is subject to final Board approval (FBA), or the responsibilities have been fully delegated to the committee (FD). All commit-tees have the authority to retain external consultants.
Any Board member may request a Board or committee meeting and the inclusion of an agenda item. Before meetings, Board members receive materials to help them prepare the discussions and decision-making.

Item 6. Directors, Senior Management and Employees
142
Board of Directors
Primary responsibilities• Strategy: decides on the ultimate direction of the Group’s business (including portfolio, markets, acquisitions and divestments) • Structure and organization: determines major changes in the Group’s structure and organization • Culture: oversees the strategy and implementation of the corporate culture • Ethics and compliance: oversees the Group’s ethics and compliance framework, including the approval of fundamental
corporate policies such as the Novartis Code of Ethics• Risk management: oversees the Group’s risk management system, the most significant risks and how these risks are managed• Finance: determines the Group’s accounting system, financial controls and financial planning;
reviews and approves the Annual Report (including the Compensation Report)• People and organization: nominates or appoints, removes, and determines responsibilities of key executives,
and succession planning
Key activities in 2020 Strategic priorities5
• Oversaw the overall Company strategy focused on the five strategic pillars p i e d s• Oversaw the COVID-19 response plan at Novartis and closely monitored, together with
the Executive Committee, the implementation of innovative solutions (e.g., the Choice with Responsibility working model) p e
• Reviewed the Company’s ESG strategy and efforts, also as reflected in external ESG rankings s• Reviewed and discussed the culture transformation and efforts to strengthen Novartis
leadership, focusing on sustainability and talent management with “big bet” solutions (e.g., unbossed leadership experience) p s
• Followed up on the NTO and NBS transformation programs powered by data, digital and technology i e d
• Discussed longer-term Board succession planning and required profiles, and approved the creation of a Lead Independent Director role1 p
• Agreed to propose a term limit for Board members at the 2021 AGM2 p• Focused on accelerating our drive to scale up data and digital through innovation,
engagement and operation, and on ensuring high-quality data and clear data governance i e d• Discussed and reviewed the annual Board self-evaluation conducted by an external consultant p
Meetings
Number of meetings held 10Number of members 14Approximate average duration (hours) 4:46Meeting attendance 99%
The Board met 10 times in 2020. This includes regular meet-ings in January, April, June, August, October and December, and additional special meetings to deal with ad hoc matters. Board committees typically meet the day before the meetings of the full Board. In response to the COVID-19 pandemic, the Board seamlessly moved to virtual meetings as of April 2020.
J. Reinhardt (Chair) 10E. Vanni (Vice Chairman, Lead Independent Director3) 10N. Andrews 10T. Buechner 10P. Bula 10S. Datar 10E. Doherty 10A. Fudge 10B. Heller4 8F. van Houten 9S. Moroney4 8A. von Planta 10C. Sawyers 10W. Winters 9
Documents• Articles of Incorporation of Novartis AG • Board Regulations
www.novartis.com/investors/company-overview/corporate-governance
1 See “—Item 6.C Board practices—Board of Directors—Vice Chairman and Lead Independent Director”2 See “—Item 6.C Board practices—Board of Directors—Election and term of office”3 As of January 1, 20214 Ms. Heller and Mr. Moroney were elected at the 2020 AGM and have attended all Board meetings since their election.5 Strategic priorities:
p Unleash the power of our people i Deliver transformative
innovation e Embrace operational excellence d Go big on data and
digital s Build trust with society

Item 6. Directors, Senior Management and Employees
143
Audit and Compliance Committee
Primary responsibilities• Supervises the external auditor, and selects and nominates the external auditor for election by the shareholders (FD)**• Oversees Internal Audit (FD)**• Oversees accounting policies, financial controls, and compliance with accounting and internal control standards (FD)**• Approves financial statements for the first three quarters of each calendar year and the corresponding financial results
releases (FD)**, and reviews the annual financial statements and the corresponding financial results releases (FBA)***• Oversees internal control and compliance processes and procedures (FD)**• Oversees compliance with laws, regulations and internal policies falling into its subject matter expertise (FD)**
Key activities in 2020 Strategic priorities2
• Tendered the external audit mandate for the selection of an audit firm to be proposed to shareholders for election at the 2022 AGM1 e
• Evaluated the performance and nomination of the external auditor Pricewaterhouse Coopers AG (PwC) for re-election at the 2021 AGM e
• Reviewed the accounting and financial reporting, focusing in particular on those areas involving significant risk or judgment e
• Reviewed progress on the transformation of Group Financial Reporting & Accounting (FRA), and assessed its operational stability e
• Received the risk assessment of high-risk countries and associated plans to mitigate the risks e s• Received reports and updates from Internal Audit; Quality; Ethics, Risk & Compliance (ERC);
the SpeakUp Office; Health, Safety and Environment (HSE); Tax; and Legal, and discussed progress on identifying and remedying the root causes of issues p s
Meetings
Number of meetings held 8Number of members 5Approximate average duration (hours) 2:43Meeting attendance 100%
E. Doherty (Chair, Audit Committee Financial Expert) 8T. Buechner 8S. Datar (Audit Committee Financial Expert) 8A. von Planta 8E. Vanni 8
Documents• Board Committees Charter, Appendix I to the Board Regulations
www.novartis.com/investors/company-overview/corporate-governance
* A/P = advisory or preparatory task** FD = fully delegated task*** FBA = task subject to final Board approval1 See “—Item 6.C Board practices—Auditors—Auditor tender process”2 Strategic priorities:
p Unleash the power of our people i Deliver transformative
innovation e Embrace operational excellence d Go big on data and
digital s Build trust with society

Item 6. Directors, Senior Management and Employees
144
Compensation Committee
Primary responsibilities• Designs, reviews and recommends to the Board the compensation policies and programs (FBA)***• Advises the Board on the compensation of Board members and of the CEO (A/P)*• Decides on the compensation of Executive Committee members (FD)**• Prepares the Compensation Report and the Say-on-Pay brochure, and submits them to the Board for approval (FBA)***
Key activities in 2020 Strategic priorities3
• Made decisions relating to Executive Committee compensation during the year p• Determined the critical performance measures (including financial, strategic, operational,
innovation and ESG) to be considered in the 2020 incentive plan targets p i e s• Reviewed the achievement of incentive plan targets for the Executive Committee members p s• Reviewed shareholder and proxy advisor feedback related to Novartis compensation
practices and disclosures p s• Considered additional disclosures in the 2020 Compensation Report s• Proposed appropriate peer companies for comparisons of board and executive committee
compensation, and assessed the Company’s level of compensation against the peer group s
Meetings
Number of meetings held 6Number of members 5Approximate average duration (hours) 2:11Meeting attendance 100%
E. Vanni (Chair)1 6P. Bula 6S. Datar 6B. Heller2 5W. Winters 6
Documents• Board Committees Charter, Appendix I to the Board Regulations
www.novartis.com/investors/company-overview/corporate-governance
* A/P = advisory or preparatory task** FD = fully delegated task*** FBA = task subject to final Board approval1 At the 2021 AGM, Mr. Vanni will stand for re-election as member of the Compensation Committee, but will step down as committee chair. The Board proposes to shareholders the
election of Mr. Moroney as new member of the Compensation Committee. Subject to his election, the Board intends to designate Mr. Moroney as successor of Mr. Vanni in the role of the chair. Mr. Moroney attended each Compensation Committee meeting after the 2020 AGM as a permanent guest.
2 Ms. Heller was elected at the 2020 AGM and has attended all Compensation Committee meetings since her election.3 Strategic priorities:
p Unleash the power of our people i Deliver transformative
innovation e Embrace operational excellence d Go big on data and
digital s Build trust with society

Item 6. Directors, Senior Management and Employees
145
Governance, Nomination and Corporate Responsibilities Committee
Primary responsibilities• Oversees the Company’s strategy, governance and progress on ESG, global health and corporate responsibility (FBA)***• Recommends to the Board corporate governance best practices (FBA)***• Reviews periodically the Articles of Incorporation and Board Regulations, with a view to fostering shareholder rights (FD)**• Reviews regularly the composition and size of the Board and its committees (FBA)***• Identifies new Board member candidates and recommends to the Board whether existing Board members
should stand for re-election (FBA)***• Prepares and reviews succession plans for the Chairman, the Vice Chairman, the Lead Independent Director,
Board members, committee members and chairs, and the CEO (FBA)***• Reviews annually the independence of each Board member (FBA)***• Reviews directorships and agreements of Board members for conflicts of interest, and deals with conflicts of interest (FBA)***
Key activities in 2020 Strategic priorities3
• Evaluated sustainability at Novartis, focusing on material ESG factors, strategy and corresponding short- and mid-term ESG targets, and ways to leverage Novartis ESG efforts s
• Assessed ESG rating agency scores and identified potential gaps s• Reviewed access-to-medicine and global health targets announced in September, as well as
the issuance of an innovative sustainability-linked bond s• Discussed the progress of the Global Health & Corporate Responsibility function,
including the COVID-19 response such as the creation of donation funds worth up to USD 40 million to support communities impacted by the pandemic s
• Received an update on the patient advocacy key achievements in 2020 and discussed the priorities for 2021 s
• Discussed the succession of Board and committee members (including committee chairs), taking into account upcoming retirements and the desire to increase diversity p
• Discussed and recommended to the Board the creation of a Lead Independent Director role1 and the introduction of a term limit for Board members2 p
• Reviewed the skill matrix and independence of the Board p• Discussed the format of the 2021 AGM s
Meetings
Number of meetings held 4Number of members 5Approximate average duration (hours) 1:53Meeting attendance 100%
A. von Planta (Chair) 4A. Fudge 4C. Sawyers 4E. Vanni 4W. Winters 4
Documents• Board Committees Charter, Appendix I to the Board Regulations
www.novartis.com/investors/company-overview/corporate-governance
* A/P = advisory or preparatory task** FD = fully delegated task*** FBA = task subject to final Board approval1 See “—Item 6.C Board practices—Board of Directors—Vice Chairman and Lead Independent Director”2 See “—Item 6.C Board practices—Board of Directors—Election and term of office”3 Strategic priorities:
p Unleash the power of our people i Deliver transformative
innovation e Embrace operational excellence d Go big on data and
digital s Build trust with society

Item 6. Directors, Senior Management and Employees
146
Risk Committee
Primary responsibilities• Oversees the risk management system and processes (FBA)***• Reviews, together with management, the prioritization and handling of risks, the risk portfolio,
and actions implemented by management (FBA)***• Performs deep dives into key risk areas and fosters a culture of smart risk-taking (FBA)***
Key activities in 2020 Strategic priorities1
• Reviewed and discussed the Company’s Third-Party Risk Management program e s• Analyzed the Company’s launch excellence, including risks and challenges i e• Discussed the culture transformation and how to engage Novartis leaders in the process p s• Received two updates on cybersecurity from the Chief Information Security Officer d• Evaluated various risks and their coverage (e.g., developments in EU data privacy) e• Analyzed pricing developments e• Reviewed the NTO transformation and the risk management framework i e• Reviewed the Enterprise Risk Management (ERM) results e
Meetings
Number of meetings held 4Number of members 5Approximate average duration (hours) 2:10Meeting attendance 100%
S. Datar (Chair) 4N. Andrews 4T. Buechner 4E. Doherty 4A. von Planta 4
Documents• Board Committees Charter, Appendix I to the Board Regulations
www.novartis.com/investors/company-overview/corporate-governance
* A/P = advisory or preparatory task** FD = fully delegated task*** FBA = task subject to final Board approval1 Strategic priorities:
p Unleash the power of our people i Deliver transformative
innovation e Embrace operational excellence d Go big on data and
digital s Build trust with society

Item 6. Directors, Senior Management and Employees
147
Science & Technology Committee
Primary responsibilities• Monitors emerging scientific, data-related, technological and research trends and issues,
and brings recommendations to the Board (FBA)***• Periodically informs the Board about critical developments for the success of the portfolio and for scientific,
technological and research activities as well as benchmarking (A/P)*• Assists the Board with setting the Company’s strategy for science, data, technology and research (A/P)*• Assists the Board with oversight and evaluation of the performance of the Company’s scientific, technological,
and research and development activities (FBA)***• Reviews performance and proposed targets in the area of science, technology and research (FD)**• Reviews such other matters in relation to science, data, technology and research as the committee may,
in its own discretion, deem desirable in connection with its responsibilities (A/P)*
Key activities in 2020 Strategic priorities2
• Expanded its scope to digital technology and implemented name change from Research & Development Committee to Science & Technology Committee d
• Reviewed the Company’s digitization process and discussed the further development of the digital investment i d
• Reviewed an external assessment of the portfolio and productivity of Novartis research and development i e
• Discussed the cardiovascular, renal and metabolism; ophthalmology; and hematology portfolios i
Meetings
Number of meetings held 3Number of members 6Approximate average duration (hours) 7:10Meeting attendance 100%
J. Reinhardt (Chair) 3N. Andrews 3A. Fudge 3F. van Houten 3S. Moroney1 3C. Sawyers 3
Documents• Board Committees Charter, Appendix I to the Board Regulations
www.novartis.com/investors/company-overview/corporate-governance
* A/P = advisory or preparatory task** FD = fully delegated task*** FBA = task subject to final Board approval1 Mr. Moroney was elected at the 2020 AGM and has attended all Science & Technology Committee meetings since his election.2 Strategic priorities:
p Unleash the power of our people i Deliver transformative
innovation e Embrace operational excellence d Go big on data and
digital s Build trust with society

Item 6. Directors, Senior Management and Employees
148
Chairman
The Chairman leads the Board to represent the interests of all stake holders, and ensures an appropriate balance of power between the Board and the Executive Commit-tee. In this role, he:• Provides leadership to the Board• Supports and mentors the CEO• Ensures that the Board and its committees work
effectively• Sets the agenda, style and tone of Board discus-
sions, promoting constructive dialogue and effective decision-making
• Ensures onboarding programs for new Board members, and continuing education and specialization for all Board members
• Ensures the Board’s annual performance evaluation• Promotes effective relationships and communication
between Board and Executive Committee members• Ensures effective communication with the Company’s
shareholders, other stakeholders and the public
Vice Chairman and Lead Independent DirectorUntil December 31, 2020, the Vice Chairman had the fol-lowing responsibilities:• Leads the Board in case and as long as the Chairman
is incapacitated• Chairs the sessions of the independent Board mem-
bers, and leads the independent Board members if and as long as the Chairman is not independent
• Leads the yearly session of the Board members to evaluate the performance of the Chairman, during which the Chairman is not present
To support adequate control mechanisms, the Board amended, with effect as of January 1, 2021, the Board Regulations (www.novartis.com/investors/company-over-view/corporate-governance) to introduce the additional role of the Lead Independent Director with the follow-ing duties: • Chairs the sessions of the independent Board members• Leads the independent Board members in case of a
crisis or matter requiring their separate consideration or decision
The Vice Chairman will continue to lead the Board in case and as long as the Chairman is incapacitated. In addition, the Vice Chairman leads the Board’s annual assessment of the Chairman.
The roles of the Vice Chairman and the Lead Inde-pendent Director can be held by two Board members or by one Board member (combined role).
The Board appointed Enrico Vanni as Vice Chairman and Lead Independent Director (combined role) effec-tive as of January 1, 2021. With his long-standing expe-rience, Mr. Vanni will help shape the role of the Lead Inde-pendent Director during his remaining time on the Board.
Honorary Chairmen
Alex Krauer and Daniel Vasella have been appointed Hon-orary Chairmen in recognition of their significant achieve-ments on behalf of Novartis. They are not provided with Board documents and do not attend Board meetings.
Mandates outside the Novartis Group
According to article 34, paragraph 1 of the Articles of Incorporation (www.novartis.com/investors/company- overview/corporate-governance), the following limitations on mandates apply:
Maximum number
of mandates
Mandates 10
Other listed companies 1 4
1 Chairmanship of the board of directors in other listed companies counts as two mandates.
According to article 34, paragraph 3 of the Articles of Incorporation (www.novartis.com/investors/company- overview/corporate-governance), the following man-dates are not subject to the above-mentioned limitations:
Maximum number
of mandates
Mandates in companies that are controlled by Novartis AG No limit
Mandates held at the request of Novartis AG
or companies controlled by it 5
Mandates in associations, charitable organizations,
foundations, trusts and employee welfare foundations 10
“Mandates” means those in the supreme governing body of a legal entity that is required to be registered in the commercial register or a comparable foreign register. Mandates in different legal entities that are under joint control are deemed one mandate.

Composition (as per December 31, 2020)
Steven BaertChief People & Organization Officer
Vasant (Vas) NarasimhanChief Executive Officer
Shannon Thyme KlingerChief Legal Officer
Steffen LangGlobal Head of NovartisTechnical Operations (NTO)
Bertrand Bodson1
Chief Digital Officer
Susanne SchaffertPresident of Novartis Oncology
John TsaiHead of Global Drug Developmentand Chief Medical Officer
Klaus MoosmayerChief Ethics, Risk & Compliance Officer
James (Jay) BradnerPresident of the Novartis Institutesfor BioMedical Research (NIBR)
Marie-France TschudinPresident of Novartis Pharmaceuticals
Richard SaynorChief Executive Officer of Sandoz
Harry KirschChief Financial Officer
Robert Weltevreden1
Head of Novartis Business Services (NBS)
1 Effective February 1, 2021, the Digital function will be merged with NBS to form a new Customer & Technology Solutions (CTS) unit, which Mr. Weltevreden has been appointed to lead. Mr. Bodson will step down from the Executive Committee on February 1, 2021.
Item 6. Directors, Senior Management and Employees
149
Executive Committee
Role of the Executive Committee
The Board has appointed the Executive Committee members and delegated to them the overall responsi-bility for and oversight of the operational management of Novartis, including:• Recruiting, appointing and promoting senior management• Ensuring the efficient operation of the Group and the
achievement of optimal results• Promoting an active internal and external communi cations
policy • Developing policies and strategic plans for Board
approval, and implementing those approved• Submitting the following to the Board for approval:
investments, divestments, transactions, contracts and litigations with a value exceeding USD 500 million, cap-ital market and other important financing transactions, as well as all other matters of fundamental significance to the Novartis Group
• Preparing and submitting quarterly and annual reports to the Board and its committees
• Informing the Board of all matters of fundamental sig-nificance to the businesses
• Dealing with any other matters delegated by the Board
There are no contracts between Novartis and third par-ties whereby Novartis would delegate any business man-agement tasks to such third parties.
CEO
With the support of the Executive Committee, the CEO is responsible for the operational management of Novartis. This includes effectively implementing the Company strat-egy, delivering financial results, and shaping a corporate culture of empowerment and responsibility to help drive innovation, performance and reputation.
In addition to other Board-assigned duties, the CEO leads the Executive Committee, building and maintaining an effective executive team. With the support of the Executive Committee, the CEO is responsible for:• Ensuring Novartis has the capabilities to achieve its
long-term strategic objectives• Developing robust management succession and devel-
opment plans for presentation to the Board• Promoting effective communication with shareholders
and other stakeholders• Ensuring Novartis conducts its business in a legal and
ethical manner• Developing an effective risk control framework for all
business activities • Ensuring the flow of information to the Board is accurate,
timely and clear

Diversity profile
p American 31%p German 23%p Swiss 15%p Belgian 15%p Dutch 8%p British 8%
Gender TENURE
EXECUTIVE/NON-EXECUTIVE INDEPENDENCEGENDER
AGEBACKGROUND/EXPERIENCE
NATIONALITY
p Male 77%p Female 23%
p <45 8%p 45–50 38%p >50 54%
Tenure
p <2 y 23%p 2–4 y 62%p >4 y 15%
Age TENURE
EXECUTIVE/NON-EXECUTIVE INDEPENDENCEGENDER
AGEBACKGROUND/EXPERIENCE
NATIONALITY
Nationality1
TENURE
EXECUTIVE/NON-EXECUTIVE INDEPENDENCEGENDER
AGEBACKGROUND/EXPERIENCE
NATIONALITY
TENURE
EXECUTIVE/NON-EXECUTIVE INDEPENDENCEGENDER
AGEBACKGROUND/EXPERIENCE
NATIONALITY
1 Please note that two Executive Committee members have two nationalities. Each of these nationalities is counted as a half in the above chart.
Item 6. Directors, Senior Management and Employees
150
Diversity
The composition as of December 31, 2020, in terms of nationality, gender, age and length of tenure, is shown in the following charts:
Mandates outside the Novartis Group
According to article 34, paragraph 2 of the Articles of Incorporation (www.novartis.com/investors/company- overview/corporate-governance), the following limitations on mandates apply:
Maximum number
of mandates
Mandates 6
Other listed companies 1 2
1 Chairmanship of the board of directors in other listed companies is not allowed.
According to article 34, paragraph 3 of the Articles of Incorporation (www.novartis.com/investors/company- overview/corporate-governance), the following mandates are not subject to above-mentioned limitations:
Maximum number
of mandates
Mandates in companies that are controlled by Novartis AG No limit
Mandates held at the request of Novartis AG
or companies controlled by it 5
Mandates in associations, charitable organizations,
foundations, trusts and employee welfare foundations 10
“Mandates” means those in the supreme governing body of a legal entity that is required to be registered in the commercial register or a comparable foreign register. Mandates in different legal entities that are under joint control are deemed one mandate.

Item 6. Directors, Senior Management and Employees
151
Members of the Executive Committee
Vasant (Vas) Narasimhan, M.D.Chief Executive Officer of Novartis since 2018 | Nationality: American | Year of birth: 1976
Professional experience• Global Head of Drug Development and Chief Medical Officer, Novartis AG, Switzerland (2016–2018)• Global Head of Development, Novartis Pharmaceuticals, Switzerland (2014–2016)• Global Head of Biopharmaceuticals and Oncology Injectables, Sandoz International, Germany (2014)• Global Head of Development, Novartis Vaccines, US (2012–2014)• North America Region Head, Novartis Vaccines, and US Country President, Novartis Vaccines and
Diagnostics, US (2008–2012)• Joined Novartis in 2005
Mandates• Member, National Academy of Medicine, US • Board member, African Parks Network, South Africa• Committee member, Biopharmaceutical CEOs Roundtable (BCR), International Federation of
Pharmaceutical Manufacturers & Associations (IFPMA), Switzerland• Member of the board of fellows, Harvard Medical School, US• Board member, Pharmaceutical Research and Manufacturers of America (PhRMA), US
Education• Doctor of medicine, Harvard Medical School, US• Master’s degree in public policy, John F. Kennedy School of Government, Harvard University, US• Bachelor’s degree in biological sciences, University of Chicago, US
Steven BaertChief People & Organization Officer of Novartis since 2014 | Nationality: Belgian | Year of birth: 1974
Professional experience• Global Head of Human Resources, Novartis Oncology, Switzerland (2012–2014)• Head of Human Resources for the US and Canada, Novartis Pharmaceuticals, US (2009–2012)• Head of Human Resources for Emerging Growth Markets, Novartis Pharmaceuticals,
Switzerland (2008–2009)• Head of Human Resources Global Functions, Novartis Pharmaceuticals, Switzerland (2006–2008)
Mandates • Board member, WeSeeHope charity, US• Represented Novartis on the board of GlaxoSmithKline Consumer Healthcare Holdings Ltd. (2015–2018)
Education• Master of Business Administration, Vlerick Business School, Belgium• Master of Laws, Katholieke Universiteit Leuven, Belgium• Bachelor of Laws, Katholieke Universiteit Brussels, Belgium
Bertrand BodsonChief Digital Officer of Novartis from 2018 through January 31, 2021 | Mr. Bodson will step down from the Executive Committee on February 1, 2021 | Nationality: Belgian | Year of birth: 1975
Professional experience • Chief digital and marketing officer, Sainsbury’s Argos, UK (2013–2017)• Executive vice president of the global digital business, EMI Music, UK (2010–2013)• Co-founder and CEO, Bragster.com, UK (2006–2010)• Senior group product manager, Amazon Inc., US and UK (2003–2006)
Mandates • Member of the supervisory board, Wolters Kluwer NV, Netherlands • Board member, Electrocomponents PLC, UK (2015–2021)
Education• Master of Business Administration, Harvard Business School, US• Master’s degree in commercial engineering, Solvay Business School, Belgium/McGill University, Canada

Item 6. Directors, Senior Management and Employees
152
James (Jay) Bradner, M.D.President of the Novartis Institutes for BioMedical Research (NIBR) since 2016 | Nationality: American | Year of birth: 1972
Professional experience• Associate professor, Department of Medicine, Harvard Medical School, US (2014–2016)• Assistant professor, Department of Medicine, Harvard Medical School, US (2010–2014)• Attending physician, Department of Medical Oncology, Dana-Farber Cancer Institute, US (2005–2015)• Co-founder of five biotechnology companies• Co-author of more than 250 scientific publications and 50 US patent applications
Mandates • Science advisor for the Abdul Latif Jameel Clinic for Machine Learning in Health, Massachusetts
Institute of Technology, US, and for Brigham and Women’s Hospital, US• Chairman, Genomics Institute of the Novartis Research Foundation, US
Education• Doctor of medicine, University of Chicago Pritzker School of Medicine, US• Bachelor’s degree in biochemistry, Harvard University, US• Postdoctoral training in chemistry and chemical biology, Harvard University, US• Fellowship in medical oncology and hematology, Dana-Farber Cancer Institute, US• Residency in medicine, Brigham and Women’s Hospital, US
Harry KirschChief Financial Officer of Novartis since 2013 | Nationality: German/Swiss | Year of birth: 1965
Professional experience • Chief Financial Officer of the Pharmaceuticals Division (now known as the Innovative Medicines Division),
Novartis Pharmaceuticals, Switzerland (2010-2013)• Chief Financial Officer of Pharma Europe, Novartis Pharmaceuticals, Switzerland (2008–2010)• Head of Business Planning & Analysis for the Pharmaceuticals Division, Novartis Pharmaceuticals,
Switzerland (2005–2008) • Joined Novartis in 2003 as Head Finance Global Primary Care, and over the years held positions of
increasing responsibility within Finance
Mandates • Represented Novartis on the board of GlaxoSmithKline Consumer Healthcare Holdings Ltd. (2015–2018)
Education• Diploma degree in industrial engineering and economics, University of Karlsruhe, Germany
Shannon Thyme KlingerChief Legal Officer of Novartis since 2018 | Nationality: American | Year of birth: 1971
Professional experience• Chief Ethics, Risk & Compliance Officer, Novartis AG, Switzerland (April–May 2018)• Chief Ethics and Compliance Officer and Global Head of Litigation, Novartis AG, Switzerland (2016–2018)• General Counsel and Global Head of Legal, Sandoz International, Germany (2012–2016)• General Counsel for North America, Sandoz Inc., US (2011–2012)• Partner, Mayer Brown LLP, US (2010–2011)• General counsel and senior vice president, Solvay Pharmaceuticals Inc., US (2008–2010)
Mandates • Board member, SwissHoldings, the Swiss federation of industrial and service groups, Switzerland• Board member, SIX Group, Switzerland (2016–2020)
Education• Bar memberships: State of Georgia, District of Columbia, US• Juris doctor with honors, University of North Carolina at Chapel Hill, US• Bachelor’s degree in psychology, University of Notre Dame, US
Steffen Lang, Ph.D.Global Head of Novartis Technical Operations (NTO) since 2017 | Nationality: German/Swiss | Year of birth: 1967
Professional experience• Global Head of Biologics Technical Development and Manufacturing, Novartis Technical Operations,
Switzerland (2015–2017)• Global Head of Technical Research and Development, Novartis Pharmaceuticals, Switzerland (2009–2015)• Joined Novartis in 1994 as Head of Laboratory in Research, and over the years held positions of
increasing responsibility within Pharmaceuticals Development
Mandates • Board member, Bachem Holding AG, Switzerland
Education• Doctorate in pharmaceutical technology, Swiss Federal Institute of Technology, Switzerland • Master’s degree in pharmaceutical sciences, University of Heidelberg, Germany

Item 6. Directors, Senior Management and Employees
153
Klaus Moosmayer, Ph.D.Chief Ethics, Risk & Compliance Officer of Novartis since 2018 | Nationality: German | Year of birth: 1968
Professional experience• Chief compliance officer, Siemens AG, Germany (2014–2018)• Chief counsel compliance, Siemens AG, Germany (2009–2013)• Compliance operating officer, Siemens AG, Germany (2007–2009)
Mandates• Vice chair, Business at OECD (BIAC) executive board, Paris • Member of the advisory panel, Pharmaceutical Supply Chain Initiative, US• Co-founder and board member, European Chief Compliance and Integrity Officers’ Forum• Chair of the Anti-Corruption Committee of the Business and Industry Advisory Committee (BIAC),
Organization for Economic Co-operation and Development (OECD), Paris (2013–2020)• Co-chair, B20 Integrity & Compliance Task Force under the G20 presidency of Saudi Arabia (2020)• Co-chair, B20 Integrity & Compliance Task Force under the G20 presidency of Argentina (2018)• Chair, B20 Integrity & Compliance Task Force under the G20 presidency of Germany (2017)
Education• First and second state examination in law, Germany• Doctor of jurisprudence, University of Freiburg, Germany
Richard SaynorChief Executive Officer of Sandoz since 2019 | Nationality: British | Year of birth: 1967
Professional experience • Senior vice president of classic and established products, and commercial and digital platforms,
GlaxoSmithKline (GSK) Pte. Ltd., UK (March–June 2019) • Senior vice president and global head of classic and established products, GSK, UK (2014–2019)• Senior vice president and global head of established products, GSK, UK (2013–2014)• Senior vice president of classic brands and generics for Europe, Japan, and the emerging markets and
Asia-Pacific (EMAP) region, GSK, Singapore (2010–2013)• Region Head of Asian Markets, Sandoz International, Singapore (2008–2010)• Region Head of Asia-Pacific, Latin America, Canada and Turkey, Sandoz International, Germany (2005–2008)
Mandates • Member, Royal Pharmaceutical Society, UK • Board member, GSK India, India (2018–2019)
Education• Bachelor of Pharmacy, University of Bradford, UK
Susanne Schaffert, Ph.D.President of Novartis Oncology since 2019 | Nationality: German | Year of birth: 1967
Professional experience • Chairperson and President, Advanced Accelerator Applications, Switzerland (2018–2019)• General Manager of Europe, Novartis Oncology, Italy (2012–2018)• Global Head of Investor Relations, Novartis AG, Switzerland (2010–2012)• Global Franchise Head for Immunology and Infectious Diseases, Novartis AG, Switzerland (2009–2010)• General Manager of Northern and Central Europe, Novartis Oncology, Italy (2007–2009)• General Manager of Germany, Novartis Oncology, Germany (2004–2007)
Mandates • Board member, Novartis AG, Germany• Board and executive committee member, European Federation of Pharmaceutical Industries and
Associations (EFPIA), Belgium• Represented Novartis on the board of GlaxoSmithKline Consumer Healthcare Holdings Ltd. (2015–2018)
Education• Doctorate in organic chemistry, University of Erlangen, Germany
John Tsai, M.D.Head of Global Drug Development and Chief Medical Officer for Novartis since 2018 | Nationality: American | Year of birth: 1967
Professional experience• Chief medical officer and senior vice president of Global Medical, Amgen Inc., US (2017–2018)• Global head of clinical development for marketed products, Bristol-Meyers Squibb Co. (BMS), US (2016–2017)• Full development team leader in oncology, BMS, US (2015–2016) • Head of Worldwide Medical, BMS, US (2014–2015)• Chief medical officer for Europe, BMS, France (2012–2014)• Vice president of US Medical, BMS, US (2010–2012) • Vice president of Cardiovascular Medical, BMS, US (2006–2010)
Education• Doctor of medicine, University of Louisville School of Medicine, US• Bachelor of Science in electrical engineering, Washington University in St. Louis, US
Item 6. Directors, Senior Management and Employees
154
Marie-France TschudinPresident of Novartis Pharmaceuticals since 2019 | Nationality: Swiss | Year of birth: 1971
Professional experience • President, Advanced Accelerator Applications, France (March–June 2019)• Europe Region Head, Novartis Pharmaceuticals, Switzerland (2017–2019)• Corporate vice president of hematology and oncology for Europe, the Middle East and Africa, Celgene
International, Switzerland (2014–2016)• Regional vice president of northern Europe, Celgene International, Switzerland (2012–2014)• General manager of Austria, Switzerland, the Czech Republic, Poland, Slovenia and Slovakia, Celgene
International, Switzerland (2009–2011)• Country manager of Switzerland, Celgene International, Switzerland (2008–2009)
Mandates • Board member, AXA, France
Education• Master of Business Administration, IMD business school, Switzerland• Bachelor of Science, Georgetown University, US
Robert WeltevredenHead of Novartis Business Services (NBS) from 2018 through January 31, 2021 | Head of Customer & Technology Solutions (CTS) as of February 1, 2021 | Nationality: Dutch | Year of birth: 1969
Professional experience • Head of business services, Syngenta AG, Switzerland (2015–2017)• Head of business process management, Syngenta AG, Switzerland (2014)• Head of finance services, Syngenta AG, Switzerland, (2009–2014)• Chief financial officer of the Asia-Pacific region, Syngenta Crop Protection AG, Singapore (2007–2009)
Education• Master’s degree in international finance, economics and business administration, Erasmus University
Rotterdam, Netherlands• Master of Business Administration in financial management, Vlerick Business School, Belgium

Item 6. Directors, Senior Management and Employees
155
Information and control systems The Board’s information and control systems vis-à-vis man-agement include a steady flow of information from senior management; monthly financial reports; a comprehensive and integrated risk management framework; an integrated assurance framework; and the independent evaluation of our risk management and internal control framework by Novartis Business Assurance & Advisory (NBAA).
Information from senior management
The Board ensures that it receives sufficient information from the Executive Committee through:• Monthly CEO reporting (including detailed written
updates from each division and business unit head), frequent communications from the CEO on current developments, and a yearly presentation
• Executive Committee meeting minutes• Regular meetings/teleconferences by the Board and/
or Board committees with the CEO and/or other mem-bers of the Executive Committee (e.g., the CFO, the Chief Legal Officer, the Chief Ethics, Risk & Compli-ance Officer), and occasional meetings/teleconfer-ences with senior management (e.g., the Global Head of NBAA and Head of Internal Audit)
• Information from Executive Committee members or other Novartis associates, and visits to Novartis sites
To get an outside view, the Board and/or Board com-mittees occasionally invite external advisors (e.g., the independent advisor of the Compensation Committee, the external auditor) to attend a meeting and/or repre-sent a specific topic.
Monthly financial reports
Novartis produces comprehensive, consolidated (unau-dited) financial statements on a monthly basis for the Group and its operating divisions. These are typically available within 10 days after the end of the month, and include the following:• Consolidated income statement of the month and year to
date, in accordance with International Financial Report-ing Standards (IFRS), as well as adjustments to arrive at core results, as defined by Novartis (see “Item 5. Operating and Financial Review and Prospects—Item 5.A Operating results—Non-IFRS measures as defined by Novartis”). The IFRS and core figures are compared to the prior-year period and targets in both USD and on a constant currency basis.
• Supplementary data on a monthly and year-to-date basis, such as free cash flow and earnings per share on a USD basis
Management information related to the consolidated income statements and free cash flow is made available to Board members through the monthly CEO Report, including an analysis of key deviations from the prior year or target.
Prior to the release of each quarter’s results, the Board receives the actual consolidated financial statement infor-mation and an outlook of the full-year results in accor-dance with IFRS and core results (as defined by Novartis), together with related commentary.
Annually, in the middle of the year, the Board approves the Company’s strategic plan for the next three years. In the fourth quarter of the year, the Board approves the operating targets for the following year as well as the financial targets for the following three-year period, including a projected consolidated income statement in USD prepared in accordance with IFRS and non-IFRS measures as defined by Novartis (core results).
The Board does not have direct access to the Novartis financial and management reporting systems but can, at any time, request more detailed information.

Item 6. Directors, Senior Management and Employees
156
Risk management
OverviewAt Novartis, our continued success depends on our ability to manage risk. Our Board has ultimate oversight of the Enterprise Risk Management (ERM) system and regularly reviews the most significant risks and how these risks are managed. As further explained below, the Board is sup-ported by its committees. Furthermore, our NBAA function provides an independent evaluation of risk management (see “—Item 6.C Board practices—Information and con-trol systems—Novartis Business Assurance & Advisory”).
BOARD COMMITTEES
RISK COMMITTEE• Oversees the risk management system and processes• Reviews, together with management, the prioritization and handling
of risks, the risk portfolio, and actions implemented by management• Performs deep dives into key risk areas and fosters a culture of
smart risk-taking• Receives updates at its four annual meetings from designated risk
owners as well as the Chief Ethics, Risk & Compliance Officer and/or the Head of Risk & Resilience
AUDIT AND COMPLIANCE COMMITTEE• Ensures that Internal Audit plans are aligned with key risks and that
the function provides independent assurance and insights around these risks
• Works closely with the Risk Committee to minimize gaps in risk coverage
• Reviews the integrated assurance report with the Chief Ethics, Risk & Compliance Officer and the Global Head of NBAA and Head of Internal Audit
• Receives biannually a presentation from the Chief Ethics, Risk & Compliance Officer
• Pays particular attention to financial risk• Has closed sessions individually with the Chief Ethics,
Risk & Compliance Officer and the Global Head of NBAA and Head of Internal Audit
COMPENSATION COMMITTEE• Works closely with the Risk Committee to ensure that the
compensation system does not lead to excessive risk-taking (see “—Item 6.B Compensation—Compensation governance—Risk management principles”)
EXECUTIVE COMMITTEE OF NOVARTIS
• Regularly assesses risks and fosters a culture of risk awareness, in line with the Novartis Values and Behaviors and the Novartis Code of Ethics
ETHICS, RISK & COMPLIANCE
• Governs the Novartis Code of Ethics• Provides an integrated ERM framework (further described in the
following section)• Governs the global compliance program within Novartis
SENIOR LEADERS OF DIVISIONS, ORGANIZATIONAL UNITS AND GROUP FUNCTIONS, AT ALL LEVELS
• Provide appropriate risk management within their area of responsibility
• Establish adequate risk prevention and mitigation strategies when risk exposure is identified, including tracking progress and providing resources for possible actions
• Assess emerging risks, trends and overall exposure as part of the ERM process
Enterprise Risk Management frameworkThe Ethics, Risk & Compliance (ERC) function provides an integrated ERM framework to obtain a holistic view of Company risks and drive a culture of smart risk-taking. Under the leadership of the Chief Ethics, Risk & Compli-ance Officer, the Risk & Resilience team is responsible for the overall ERM process. This process covers, but is not limited to covering, risks associated with: • The research, development, manufacturing, marketing
and sales of products• Finance; taxes; intellectual property; compliance with law
and regulations; security; product safety; human resources; and health, safety and environmental protection
• Business objectives and strategies, including mergers and acquisitions
• External factors such as the social, political and eco-nomic environment
The ERM process continued to evolve in 2020 based on the Company’s changing needs. The Risk & Resilience team conducted risk workshops and collaborated with all risk assurance functions to identify key risks across the Company. Each Novartis unit organized a focused risk workshop at the leadership team level. In parallel, risk workshops were held in the top 11 countries (by rev-enue) and in certain focus markets. Once key risks were identified, mitigation action plans were created to effec-tively address them. The findings from these workshops were consolidated into the Novartis Risk Compass, which enables senior management, the Executive Committee and the Board to focus discussions on key risks and more closely align our corporate strategy with our risk expo-sure and ways of working.
In 2020, we strengthened our ERM framework within the Novartis Risk & Resilience organization by further developing certain components. In addition to the ERM, Business Continuity Management (BCM) and Novartis Emergency Management (NEM) functions, we now have a Risk & Internal Control department to provide a holis-tic control framework, and a team to support Enterprise Policy Management (EPM).

Recurring observations relate to:
3 Governance of data, data management, and oversight of digital initiatives
3 IT security
3 Third-party management
3 Design of commercial processes, and applications of systems and policies
3 Patient support programs and managed access programs
AUDITS
39
ADVISORIES
17
INTERNAL REVIEWS
6
2020 INTERNAL AUDIT ACTIVITIES AND OBSERVATIONS
Item 6. Directors, Senior Management and Employees
157
Novartis Business Assurance & Advisory NBAA brings together the SpeakUp Office, Internal Audit and Global Security. NBAA supports Novartis in achiev-ing its objectives and culture transformation; identifying and managing major risks; and complying with policies, laws and regulations. NBAA conducts fair, timely and thorough investigations, and proactively shares insights, best practices, ongoing findings and root causes with the business to foster continuous learning.
SpeakUp OfficeOur SpeakUp Office provides a safe place for associates to report potential misconduct. They have the option to do so anonymously.
Internal AuditOur Internal Audit function executes the risk-based annual audit plan approved by the ACC at the Group and entity levels, and reports the results to the audited units, the Executive Committee and the ACC (in the form of formal quarterly presentations and audit report executive sum-maries). Potential material irregularities are escalated to the ACC and to the SpeakUp Office for triage and possi-ble investigation, and action plans are developed together with the audited units. Internal Audit conducts desktop follow-up for high-risk findings prior to the due date for remediation actions. If the audit opinion is “needs major improvement,” a follow-up audit takes place the next year. Audit findings and action plans are stored and monitored in a single application to enable efficient follow-up.
In 2020, a larger portion of the audit plan was dedi-cated to advisories, enabling more proactive risk man-agement and forward-looking collaboration with the busi-ness. Additionally, Internal Audit developed a new approach called “internal reviews” to cover smaller markets, units that have not been audited for more than five years, and follow-up visits on “needs improvement” audits. The fol-lowing outlines the number of audits, internal reviews and advisories performed in 2020, and key topics that we repeatedly observed in our work.
We performed 81% of planned activities (equating to 62 engagements) in 2020, most conducted remotely, despite the obstacles created by COVID-19. These engage-ments comprised 39 audits, 17 advisories and six internal reviews covering the entire value chain of Novartis and key risks. Internal Audit continues to invest in and refine its remote audit methodology.
NBAA and ERC continue to work toward integrated assurance by improving collaboration with other Novartis risk and assurance providers. This includes the coordi-nation of internal plans, alignment on messaging and reporting, and increased communication around poten-tial issues and risks.
NBAA leadershipOur Global Head of NBAA and Head of Internal Audit reports administratively to the CEO, and functionally to the Chair of the ACC, and meets with the latter and the Chairman of the Board at least quarterly. She has full access to the ACC and the Chairman of the Board, and confirms the organizational independence of the Inter-nal Audit function annually to the ACC.
Item 6. Directors, Senior Management and Employees
158
AuditorsDuration of the mandate and terms of officeOn behalf of the Board, the ACC selects and nominates an independent auditor for election at the AGM. PwC assumed its existing auditing mandate for Novartis in 1996. Luc Schulthess, auditor in charge, began serving in his role in 2018, and Kris Muller, global relationship part-ner, began serving in her role in 2019. The ACC together with PwC ensure that these partners are rotated at least every five years.
Auditing fees and additional fees
The ACC monitors and preapproves the fees paid to the external auditor for all audit and non-audit services. It has developed and approved a policy with clear guidelines on the engagement of the independent auditor firm. This pol-icy is designed to help ensure that the independence of the external auditor is maintained. It limits the scope of ser-vices that the external auditor may provide to the Group, stipulating certain permissible types of audit-related and non-audit services, including tax services and other ser-vices that have been preapproved by the ACC. The ACC preapproves all other services on a case-by-case basis.
The external auditor is required to report periodically to the ACC about the scope of the services it has pro-vided to the Group and the fees for the services it has performed to date. PwC fees for professional services related to the 12-month periods ended December 31, 2020, and December 31, 2019, are as follows:
2020 2019
USD million USD million
Audit services 20.5 21.2
Audit-related services 1.4 1.0
Tax services 0.4 0.7
Other services 1.2 1.4
Total 23.5 24.3
Audit services include work performed to issue opinions on consolidated financial statements and parent com-pany financial statements of Novartis AG, to issue opin-ions related to the effectiveness of the Group’s internal control over financial reporting, and to issue reports on local statutory financial statements. Also included are audit services that generally can only be provided by the statutory auditor, such as the audit of the Compensation Report, audits of the adoption of new accounting policies, audits of information systems and the related control envi-ronment, as well as reviews of quarterly financial results.
Audit-related services include other assurance ser-vices provided by the independent auditor but not restricted to those that can only be provided by the stat-utory auditor. They include services such as audits of pension and other employee benefit plans; audits in con-nection with non-recurring transactions; contract audits of third-party arrangements; corporate responsibility assurance; and other audit-related services.
Tax services represent tax compliance, assistance with historical tax matters, and other tax-related services.
Other services include procedures related to corpo-rate integrity agreements, benchmarking studies, and license fees for use of accounting and other reporting guidance databases.
Information to the Board and the ACC
The ACC, acting on behalf of the Board, is responsible for overseeing the activities of PwC. In 2020, this commit-tee held eight meetings. PwC was invited to six of these meetings to attend the discussions on auditing matters and any other matters relevant to its audit.
The ACC recommended to the Board to approve the audited consolidated financial statements and the sep-arate parent company financial statements of Novartis AG for the year ended December 31, 2020. The Board pro-posed the acceptance of these financial statements for approval by the shareholders at the next AGM.
The ACC regularly evaluates the performance of PwC and, based on this, once a year determines whether PwC should be proposed to the shareholders for re-election. To assess the performance of PwC, the ACC holds pri-vate meetings with the CFO and the Global Head of NBAA and Head of Internal Audit and, if necessary, obtains an independent external assessment. Criteria applied for the performance assessment of PwC include an evalu-ation of its technical and operational competence; its independence and objectivity; the sufficiency of the resources it has employed; its focus on areas of signifi-cant risk to Novartis; its willingness to probe and chal-lenge; its ability to provide effective, practical recommen-dations; and the openness and effectiveness of its communications and coordination with the ACC, the Internal Audit function and management.
Once a year, the auditor in charge and the global relationship partner report to the Board on PwC’s activ-ities during the current year and on the audit plan for the coming year.
On an annual basis, PwC provides the ACC with writ-ten disclosures required by the US Public Company Accounting Oversight Board, and the committee and PwC discuss PwC’s independence from Novartis.
Item 6. Directors, Senior Management and Employees
159
Auditor tender process
In April 2020, the ACC decided to invite several audit firms, including PwC, to participate in a tender process that would lead to the selection of an external audit firm to be proposed for election at the 2022 AGM.
Key criteria in identifying potential participant firms included their expertise, experience and footprint to audit a company with our global scale and complexity of oper-ations. The ACC determined that PwC, KPMG, Deloitte, and Ernst & Young met these criteria and invited them to participate in the tender process. The audit tender was conducted through a fair, transparent and balanced pro-cess according to defined selection criteria under a strong governance structure, ensuring that all audit firms had equal access to management and information.
In the first phase of the tender process, the firms had an introductory meeting with the CFO and the Head of Group FRA, were granted access to a data room con-
taining both financial and organizational information, and met with select members of Group management. In the second phase, the firms submitted written proposals and made presentations to select members of Group man-agement, including the CEO, the CFO and the Chief Legal Officer, and met with the Chair of the ACC. In the third phase, the entire ACC evaluated management’s assess-ment of the four firms against the selection criteria and shortlisted two firms to present to the entire ACC, the Chairman, the CEO, the CFO, the Chief Legal Officer and the Head of Group FRA.
Based on the assessment of the two shortlisted firms against the selection criteria, the ACC plans to propose to the shareholders at the 2022 AGM the election of KPMG AG as the external auditor commencing for the 2022 financial year.
For the 2021 financial year, the ACC will propose to the shareholders at the 2021 AGM the re-election of PwC.

Item 6. Directors, Senior Management and Employees
160
Information policyNovartis is committed to open and transparent commu-nication with shareholders, investors, financial analysts, customers, suppliers and other stakeholders. Novartis disseminates information about material developments in its businesses in a broad and timely manner that complies with the rules of the SIX Swiss Exchange and the NYSE.
Communications
Novartis publishes this Annual Report to provide infor-mation on the Group’s results and operations. Novartis discloses financial results in accordance with IFRS on a quarterly basis, and issues press releases from time to time regarding business developments.
Novartis publishes press releases related to financial results and material events to the US Securities and Exchange Commission (SEC) via Form 6-K. An archive containing annual reports, US SEC Form 20-F, quarterly results releases, and all related materials – including pre-sentations and conference call webcasts – is available at www.novartis.com/investors.
Novartis also publishes a Novartis in Society ESG Report, available at www.novartis.com/nisreport2020, which details progress on ESG topics and demonstrates the company’s commitment in global health and corpo-rate responsibility. The Novartis in Society ESG Report has been prepared in accordance with the Global Report-ing Initiative (GRI) Standards: Core option, and fulfills the Company’s reporting requirement as a signatory of the United Nations Global Compact.
The information on Board and Executive Committee compensation is outlined in the Compensation Report (see “—Item 6.B Compensation” in general, and for cer-
tain compensation information with respect to our Board that is responsive to Item 6.C.2 of Form 20-F, see “—Item 6.B Compensation—2020 Board compensation—Philos-ophy and benchmarking”). Please also refer to articles 29-35 of the Articles of Incorporation (www.novartis.com/investors/company- overview/corporate-governance). There are no change-of-control and “golden parachute” clauses benefiting Board members, Executive Commit-tee members, or other members of senior management. Employment contracts with Executive Committee mem-bers are either for a fixed term not exceeding one year or for an indefinite period with a notice period not exceed-ing 12 months, and do not contain commissions for the acquisition or transfer of enterprises or severance pay-ments. No loans or credits are granted to Board and Exec-utive Committee members.
Information contained in reports and releases issued by Novartis is only correct and accurate at the time of release. Novartis does not update past releases to reflect subsequent events, and advises against relying on them for current information.
Investor Relations
Investor Relations manages the Group’s interactions with the international financial community. Several events are held each year to provide institutional investors and analysts with various opportunities to learn more about Novartis.
Investor Relations is based at the Group’s head quarters in Basel. Part of the team is located in the US to coor-dinate interaction with US investors. More information is available at www.novartis.com/investors.
Website information
Topic Information
Share capital Articles of Incorporation of Novartis AG www.novartis.com/investors/company-overview/corporate-governance Novartis key share data www.novartis.com/key-share-data
Shareholder rights Articles of Incorporation of Novartis AG www.novartis.com/investors/company-overview/corporate-governance
Annual General Meeting of Shareholders Annual General Meeting of Shareholders www.novartis.com/investors/shareholder-information/annual-general-meeting
Board Regulations Board Regulations www.novartis.com/investors/company-overview/corporate-governance
Novartis code for senior financial officers Novartis Code of Ethical Conduct for CEO and Senior Financial Officers www.novartis.com/investors/company-overview/corporate-governance
Novartis in Society ESG Report Novartis in Society ESG Report www.novartis.com/nisreport2020
Novartis financial data Novartis financial data www.novartis.com/investors/financial-data
Press releases Press releases www.novartis.com/news/news-archive?type=press_release Free email service www.novartis.com/news/stay-up-to-date
Additional information Novartis Investor Relations (including Novartis investors event calendar, registered office, www.novartis.com/investorscontact and email addresses, phone numbers, etc.)
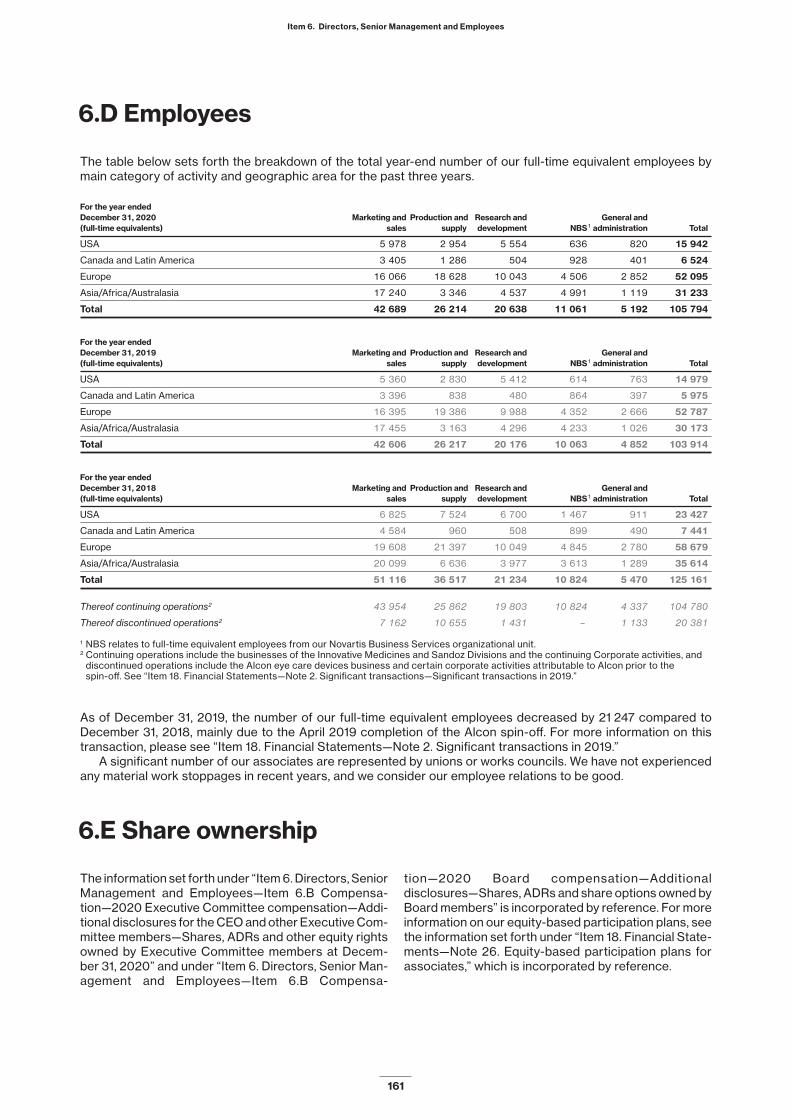
Item 6. Directors, Senior Management and Employees
161
6.D Employees
The table below sets forth the breakdown of the total year-end number of our full-time equivalent employees by main category of activity and geographic area for the past three years.
For the year ended
December 31, 2020 Marketing and Production and Research and General and
(full-time equivalents) sales supply development NBS 1 administration Total
USA 5 978 2 954 5 554 636 820 15 942
Canada and Latin America 3 405 1 286 504 928 401 6 524
Europe 16 066 18 628 10 043 4 506 2 852 52 095
Asia/Africa/Australasia 17 240 3 346 4 537 4 991 1 119 31 233
Total 42 689 26 214 20 638 11 061 5 192 105 794
For the year ended
December 31, 2019 Marketing and Production and Research and General and
(full-time equivalents) sales supply development NBS 1 administration Total
USA 5 360 2 830 5 412 614 763 14 979
Canada and Latin America 3 396 838 480 864 397 5 975
Europe 16 395 19 386 9 988 4 352 2 666 52 787
Asia/Africa/Australasia 17 455 3 163 4 296 4 233 1 026 30 173
Total 42 606 26 217 20 176 10 063 4 852 103 914
For the year ended
December 31, 2018 Marketing and Production and Research and General and
(full-time equivalents) sales supply development NBS 1 administration Total
USA 6 825 7 524 6 700 1 467 911 23 427
Canada and Latin America 4 584 960 508 899 490 7 441
Europe 19 608 21 397 10 049 4 845 2 780 58 679
Asia/Africa/Australasia 20 099 6 636 3 977 3 613 1 289 35 614
Total 51 116 36 517 21 234 10 824 5 470 125 161
Thereof continuing operations2 43 954 25 862 19 803 10 824 4 337 104 780
Thereof discontinued operations2 7 162 10 655 1 431 – 1 133 20 381
1 NBS relates to full-time equivalent employees from our Novartis Business Services organizational unit.2 Continuing operations include the businesses of the Innovative Medicines and Sandoz Divisions and the continuing Corporate activities, and
discontinued operations include the Alcon eye care devices business and certain corporate activities attributable to Alcon prior to the spin-off. See “Item 18. Financial Statements—Note 2. Significant transactions—Significant transactions in 2019.”
As of December 31, 2019, the number of our full-time equivalent employees decreased by 21 247 compared to December 31, 2018, mainly due to the April 2019 completion of the Alcon spin-off. For more information on this transaction, please see “Item 18. Financial Statements—Note 2. Significant transactions in 2019.”
A significant number of our associates are represented by unions or works councils. We have not experienced any material work stoppages in recent years, and we consider our employee relations to be good.
6.E Share ownership
The information set forth under “Item 6. Directors, Senior Management and Employees—Item 6.B Compensa-tion—2020 Executive Committee compensation—Addi-tional disclosures for the CEO and other Executive Com-mittee members—Shares, ADRs and other equity rights owned by Executive Committee members at Decem-ber 31, 2020” and under “Item 6. Directors, Senior Man-agement and Employees—Item 6.B Compensa-
tion—2020 Board compensation—Additional disclosures—Shares, ADRs and share options owned by Board members” is incorporated by reference. For more information on our equity-based participation plans, see the information set forth under “Item 18. Financial State-ments—Note 26. Equity-based participation plans for associates,” which is incorporated by reference.

Item 7. Major Shareholders and Related Party Transactions
162
Item 7. Major Shareholders and Related Party Transactions7.A Major shareholders
Novartis shares are widely held. As of December 31, 2020, Novartis had approximately 176 000 sharehold-ers listed in the Novartis Share Register, representing approximately 67.9% of issued shares. Based on the Novartis Share Register and excluding treasury shares, approximately 44.1% of the shares registered by name were held in Switzerland, and approximately 24.4% were held in the US. Approximately 14% of the shares regis-tered in our share register were held by individual inves-tors, while approximately 34.5% were held by legal enti-ties (excluding 4.3% of our share capital held as treasury shares by Novartis AG or its fully owned subsidiaries), and 51.5% by nominees, fiduciaries and the ADS depos-itary.
Based on our share register, we believe that we are not directly or indirectly owned or controlled by another corporation or government, or by any other natural or legal persons. There are no arrangements that may result in a change of control.
The tables below set forth information with respect to our major shareholders according to our share regis-ter as of December 31, 2020, excluding 4.3% of our share capital held as treasury shares by Novartis AG or its fully owned subsidiaries. The following registered sharehold-ers (including nominees and the ADS depositary) held more than 2% of the total share capital of Novartis with the right to vote all their Novartis shares based on an exemption granted by the Board of Directors:
% of respective share capital beneficially owned
as of:
Ordinary shares
beneficially owned as of
Dec 31, 2020 Dec 31, 2020 Dec 31, 2019 Dec 31, 2018
Shareholders registered for their own account:
Emasan AG, Basel, Switzerland 89 135 960 3.6 3.5 3.5
Novartis Foundation for Employee Participation, Basel, Switzerland 1 - <2.0 2.1 2.3
UBS Fund Management (Switzerland) AG, Basel, Switzerland 56 764 402 2.3 2.1 2.2
Credit Suisse Funds AG, Zurich, Switzerland 50 187 090 2.0 <2.0 <2.0
1 The Novartis Foundation for Employee Participation (the “Employee Foundation”) is a special purpose entity that was founded by, but is independent from, Novartis.
% of respective share capital held as of:
Ordinary shares
held as of
Dec 31, 2020 Dec 31, 2020 Dec 31, 2019 Dec 31, 2018
Shareholders registered as nominees:
Chase Nominees Ltd., London, England 237 417 808 9.6 10.4 9.8
The Bank of New York Mellon, New York, NY 83 805 997 3.4 3.8 4.1
Through The Bank of New York Mellon, Everett, MA 41 574 113 1.7 2.0 2.1
Through The Bank of New York Mellon, New York, NY 28 683 674 1.2 1.2 1.3
Through The Bank of New York Mellon, SA/NV, Brussels, Belgium 13 548 210 0.5 0.6 0.7
Nortrust Nominees Ltd., London, England 104 327 562 4.2 3.9 3.6
Shareholder acting as American Depositary Share (ADS) depositary:
JPMorgan Chase Bank, N.A., New York, NY 288 785 853 11.7 12.5 13.3
According to a disclosure notification filed with Novartis AG, Norges Bank (Central Bank of Norway), Oslo, Nor-way, held 2.3% of the share capital of Novartis AG, or 56 513 527 shares, as of December 31, 2020, but was not registered in our share register as of December 31, 2020. Provided that these shares are registered in the share register on the record date of the Annual General Meeting, Norges Bank will have full voting rights for all of these shares.
According to a disclosure notification filed with Novartis AG and the SIX Swiss Exchange, Black-Rock, Inc., New York, NY, held between 3% and 5%, but was registered with less than 2% of the share capital of Novartis AG in our share register as of December 31, 2020.
According to disclosure notifications filed with Novartis AG and the SIX Swiss Exchange, The Capital Group Companies, Inc., Los Angeles, California, held

Item 7. Major Shareholders and Related Party Transactions
163
between 3% and 5%, but was not registered in our share register as of December 31, 2019, and December 31, 2018.
As of December 31, 2020, no other shareholder was registered as owner of more than 2% of the registered share capital.
The Articles of Incorporation provide that no share-holder shall be registered with the right to vote shares comprising more than 2% of the registered share capi-tal. The Board of Directors may, upon request, grant an
exemption from this restriction. Considerations include whether the shareholder supports the Novartis goal of creating sustainable value and has a long-term invest-ment horizon. In 2020, the Board approved an exemp-tion requested by Credit Suisse Funds AG, Zurich, based on the fulfilment of the requirements described above. Exemptions are in force for the registered major share-holders as described above. Novartis has not entered into any agreement with any shareholder regarding the voting or holding of Novartis shares.
7.B Related party transactions
The information set forth under “Item 18. Financial Statements—Note 27. Transactions with related parties” is incor-porated by reference.
7.C Interests of experts and counsel
Not applicable.

Item 8. Financial Information
164
Item 8. Financial Information8.A Consolidated statements and other financial information
See “Item 18. Financial Statements.”
Dividend policy
Subject to the dividend policy described below, our Board of Directors expects to recommend the payment of a dividend in respect of each financial year. If approved by our shareholders at the relevant annual shareholders’ meeting, the dividends will be payable shortly following such approval. Any shareholder who purchases our shares before the ex-dividend date and holds the shares until that date shall be deemed to be entitled to receive the dividends approved at that meeting. Dividends are reflected in our financial statements in the year in which they are approved by our shareholders.
Our dividend policy is to pay a growing annual divi-dend in Swiss francs. This policy is subject to our finan-cial conditions and outlook at the time, the results of our operations, and other factors.
The Board will propose a dividend of CHF 3.00 per share to the shareholders for approval at the Annual General Meeting to be held on March 2, 2021. Because we pay dividends in Swiss francs, exchange rate fluctu-ations will affect the US dollar amounts received by hold-ers of ADRs. For a summary of dividends we paid in the past five years, see “Item 3. Key Information—Item 3.A Selected financial data—Cash dividends per share.”
Disclosure pursuant to Section 219 of the Iran Threat Reduction & Syria Human Rights Act (ITRA)
At Novartis, our purpose is to reimagine medicine to improve and extend people’s lives, regardless of where they live. This includes the compliant sale of medicines and other healthcare products worldwide. To help us ful-fill this mission, we have for many years maintained two representative offices located in Iran.
As of October 18, 2010, a non-US affiliate within our Innovative Medicines Division entered into a non-bind-ing Memorandum of Understanding (MoU) with the Min-istry of Health and Medical Education of the Islamic Republic of Iran. Pursuant to the MoU, the Iranian Minis-try of Health acknowledges certain benefits that may apply to sales of certain Innovative Medicines Division medicines by third-party distributors in Iran. These include fast-track registration, market exclusivity, end-user subsidies, and exemptions from customs tar-iffs. Novartis receives no payments from the Iranian Min-istry of Health under the MoU, and the MoU creates no
obligations on the part of either Novartis or the Iranian Ministry of Health.
From time to time, including in 2020, non-US affiliates in our Innovative Medicines and Sandoz Divisions made payments to government entities in Iran related to pat-ents, trademarks, exit fees and other transactions ordi-narily incident to travel by doctors and other medical pro-fessionals resident in Iran to attend conferences or other events outside Iran.
From time to time, including in 2020, non-US affiliates in our Innovative Medicines and Sandoz Divisions enter into agreements with hospitals, research institutes, med-ical associations and universities in Iran to provide grants and sponsor congresses, seminars and symposia, and with doctors and other healthcare professionals for con-sulting services, including participation in advisory boards and investigator services for observational (non-interventional) studies. Some hospitals and research institutes are owned or controlled by the gov-ernment of Iran, and some doctors and healthcare pro-fessionals are employed by hospitals that may be public or government-owned.
Because our Innovative Medicines and Sandoz Divi-sions have operations in Iran, including employees, they obtain services and have other dealings incidental to their activities in that country, including paying taxes and salaries either directly or indirectly through a service pro-vider, and obtaining office rentals, insurance, electricity, water and telecommunications services, office and sim-ilar supplies, and customs-related services from Iranian companies that may be owned or controlled by the gov-ernment of Iran. In addition, from time to time, represen-tatives of our non-US affiliates participate in meetings with Iranian officials to discuss issues relevant to our business and the pharmaceutical industry.
Non-US affiliates in our Innovative Medicines and Sandoz Divisions maintain local accounts at banks that are, as of November 5, 2018, on the Specially Designated Nationals and Blocked Persons List (SDN List). These non-US affiliates make local transactions for employee payroll and local vendor payment purposes. These trans-actions are conducted for the purpose of facilitating the provision of medicine to Iran, in line with the humanitar-ian exceptions contained in Section 11 of Executive Order 13902 and other applicable sanctions by legal authori-ties. No transactions are made with an Iranian financial institution designated on the SDN List in connection with Iran’s support for international terrorism or proliferation of weapons of mass destruction.

Item 8. Financial Information
165
8.B Significant changes
None.

Item 9. The Offer and Listing
166
Item 9. The Offer and Listing9.A Offer and listing details
Our shares are listed in Switzerland on the SIX Swiss Exchange (SIX).
ADSs, each representing one share, have been avail-able in the US through an ADR program since Decem-ber 1996. This program was established pursuant to a deposit agreement that we entered into with JPMorgan Chase Bank, N.A., as depositary (“Deposit Agreement”).
Our ADRs have been listed on the NYSE since May 2000 and are traded under the symbol NVS.
The depositary has informed us that as of Janu-ary 20, 2021, there were 289 million ADRs outstanding, each representing one Novartis share (approximately 12% of total Novartis shares issued). On January 20, 2021, the closing price per share on the SIX was CHF 86.01 and USD 96.92 per ADR on the NYSE.
9.B Plan of distribution
Not applicable.
9.C Markets
See “—Item 9.A Offer and listing details.”
9.D Selling shareholders
Not applicable.
9.E Dilution
Not applicable.
9.F Expenses of the issue
Not applicable.
Item 10. Additional Information
167
Item 10. Additional Information10.A Share capital
Not applicable.
10.B Memorandum and articles of association
The following is a non-exhaustive summary of certain provisions of our Articles of Incorporation (“Articles”), our Regulations of the Board, the Board Committees and the Executive Committee (“Board Regulations”) and of Swiss law, particularly the Swiss Code of Obligations (“Swiss CO”), and is qualified in its entirety by reference to the Articles and the Board Regulations, which are an exhibit to this Form 20-F, and to Swiss law.
10.B.1 Company purpose
Novartis AG is registered in the commercial register of the canton of Basel-Stadt, Switzerland, under number CHE-103.867.266. Our business purpose, as stated in Article 2 of the Articles, is to hold interests in enterprises in the area of healthcare or nutrition. We may also hold interests in enterprises in the areas of biology, chemis-try, physics, information technology or related areas. We may acquire, mortgage, liquidate or sell real estate and intellectual property rights in Switzerland or abroad. In pursuing our business purpose, we strive to create sus-tainable value.
10.B.2 Directors
According to our Articles, the Board of Directors (“Board”) consists of a minimum of eight and a maximum of 16 members. The members of the Board (including the Chairman) are elected individually by the General Meet-ing of Shareholders (“General Meeting”) for a one year term of office lasting until completion of the next Annual General Meeting of Shareholders (“AGM”).(a) A board resolution requires the affirmative majority of
the votes cast. According to our Board Regulations, a member of our Board (“Director”) may not partici-pate in decisions and resolutions on matters that affect, or reasonably might affect, the Director’s inter-ests or the interests of a person close to the Direc-tor.
(b) Compensation of the Directors is subject to the approval of the aggregate amounts of such compen-sation by a shareholders’ resolution under the Ordi-nance against Excessive Compensation in Public Companies of the Swiss Federal Council.
(c) The Articles prohibit the granting of loans or credits to Directors.
(d) Directors who have turned 70 years of age at the date of the General Meeting may no longer be elected as members of the Board. The General Meeting may, under special circumstances, grant exceptions to this rule.
(e) Our Directors are not required to be shareholders at the time of the election by the General Meeting. How-ever, according to our share ownership guidelines, the Chairman is required to own a minimum of 30 000 Novartis AG shares, and other Directors are required to own at least 5 000 Novartis AG shares within five years after joining the Board, to ensure their interests are aligned with those of our shareholders.
10.B.3 Shareholder rights
Because Novartis AG has only one class of registered shares, the following information applies to all sharehold-ers.(a) Under the Swiss CO, we may only pay dividends out
of balance sheet profits or out of distributable reserves. In any event, under the Swiss CO, while the Board may propose that a dividend be paid, we may only pay dividends upon shareholders’ approval at a General Meeting. Furthermore, the Swiss CO requires us to accrue general legal reserves under certain cir-cumstances so long as these reserves amount to less than 20% of our registered share capital, and Swiss law and the Articles permit us to accrue additional reserves beyond the statutory reserves. Our auditors must confirm that the dividend proposal of our Board conforms with the Swiss CO and the Articles. Our Board expects to recommend the payment of a divi-dend in respect of each financial year. See “Item 3. Key Information—Item 3.A. Selected financial data—Cash dividends per share” and “Item 8. Financial Informa-tion—Item 8.A. Consolidated statements and other financial information—Dividend policy.”
Dividends are usually due and payable shortly after the shareholders have passed a resolution approving the payment. Dividends that have not been claimed within five years after the due date revert to us and are allocated to our general reserves. For information about deduction of the withholding tax or other duties from dividend payments, see “—Item 10.E Taxation.”
(b) Each share is entitled to one vote at a General Meet-ing. Voting rights may only be exercised for shares registered with the right to vote on the record date

Item 10. Additional Information
168
for the applicable General Meeting. In order to do so, the shareholder must file a share registration form with us, setting forth the shareholder’s name, address and citizenship (or, in the case of a legal entity, its reg-istered office). If the shareholder has not timely reg-istered its shares, then the shareholder may not vote at, or participate in, a General Meeting.
To vote its shares, the shareholder must also explicitly declare that it has acquired the shares in its own name and for its own account. If the shareholder refuses to make such a declaration, the shares may not be voted unless the Board recognizes such share-holder as a nominee.
The Articles provide that no shareholder shall be registered with the right to vote shares comprising more than 2% of the registered share capital. The Board may, upon request, grant an exemption from this restriction. Considerations include whether the shareholder supports our goal of creating sustainable value and has a long-term investment horizon. Fur-thermore, the Articles provide that no nominee shall be registered with the right to vote shares compris-ing more than 0.5% of the registered share capital. The Board may, upon request, grant an exemption from this restriction if the nominee discloses the names, addresses and number of shares of the per-sons for whose account it holds 0.5% or more of the registered share capital. The same restrictions indi-rectly apply to ADR holders. We have in the past granted exemptions from the 2% rule for sharehold-ers and the 0.5% rule for nominees.
For purposes of the 2% rule for shareholders and the 0.5% rule for nominees, groups of companies and groups of shareholders acting in concert are consid-ered to be one shareholder. These rules also apply to shares acquired or subscribed by the exercise of sub-scription, option or conversion rights.
After hearing the registered shareholder or nom-inee, the Board may cancel, with retroactive effect as of the date of registration, the registration of the shareholders if the registration was effected based on false information.
Registration restrictions in the Articles may only be removed upon a resolution carrying a two-thirds majority of the votes represented at a General Meet-ing.
Except as noted below, shareholders’ resolutions require the approval of an absolute majority of the votes present at a General Meeting. As a result, abstentions have the effect of votes against such res-olutions. Some examples of shareholders’ resolutions requiring a vote by such “absolute majority of the votes” are: • Adoption and amendment of the Articles
• Election and removal of the Chairman, the Board and Compensation Committee members, the Inde-pendent Proxy and the external auditor
• Approval of the management report and of the con-solidated financial statements
• Approval of the financial statements of Novartis AG, and decision on the appropriation of available earn-ings shown on the balance sheet, including divi-dends, if any
• Approval of the maximum aggregate compensation of the Board (from an AGM until the next AGM) and of the Executive Committee (for the financial year following the AGM)
• Discharge of Board and Executive Committee members from liability for matters disclosed to the General Meeting
• Decision on other matters that are reserved by law or by the Articles (e.g., advisory vote on the Com-pensation Report) to the General Meeting
According to the Articles and Swiss law, the fol-lowing matters require the approval of a “superma-jority” of at least two-thirds of the votes present at a General Meeting: • Alteration of the purpose of Novartis AG
• Creation of shares with increased voting powers
• Implementation of restrictions on the transfer of registe red shares, and the removal of such restric-tions
• Authorized or conditional increase of the share cap-ital
• Increase of the share capital out of equity, by con-tribution in kind, for the purpose of an acquisition of property or the grant of special rights
• Restriction or cancellation of subscription rights
• Change of the registered office of Novartis AG
• Dissolution of Novartis AG
In addition, the law provides for a qualified major-ity for other resolutions, such as a merger or demerger.
Our shareholders are required to annually elect all Directors (including the Chairman), the Compen-sation Committee members, the external auditor and the Independent Proxy. The Articles do not provide for cumulative voting of shares.
At a General Meeting, shareholders can be repre-sented by a proxy, which must either be the sharehold-er’s legal representative, another shareholder with the right to vote, or the Independent Proxy. Votes are taken either by a show of hands or by electronic voting, unless the General Meeting resolves to have a ballot or where a ballot is ordered by the chair of the meeting. How-ever, in accordance with Swiss legislation passed in response to the COVID-19 pandemic, the Board has decided that voting rights at our 2021 AGM can only be exercised through the Independent Proxy. It will not be possible to physically attend our 2021 AGM.

Item 10. Additional Information
169
ADSs, each representing one Novartis AG share and evidenced by ADRs, are issued by our depositary JPMorgan Chase Bank, N.A., New York, and not by us. The ADR is vested with rights defined and enu-merated in the Deposit Agreement (such as the rights to vote, to receive a dividend and to receive a share of Novartis AG in exchange for a certain number of ADRs). The enumeration of rights, including any lim-itations on those rights in the Deposit Agreement, is final. There are no other rights given to the ADR hold-ers. Only the ADS depositary, holding our shares underlying the ADRs, is registered as shareholder in our share register. An ADR is not a Novartis AG share and an ADR holder is not a Novartis AG shareholder.
The Deposit Agreement between our depositary, the ADR holder and us has granted certain indirect rights to vote to the ADR holders. ADR holders may not attend a General Meeting in person. ADR holders exercise their voting rights by instructing JPMorgan Chase Bank, N.A., our depositary, to exercise the vot-ing rights attached to the registered shares underly-ing the ADRs. Each ADR represents one Novartis AG share. JPMorgan Chase Bank, N.A., exercises the vot-ing rights for registered shares underlying ADRs for which no voting instructions have been given by pro-viding a discretionary proxy to an uninstructed inde-pendent designee. Such designee has to be a share-holder of Novartis AG. The same voting restrictions apply to ADR holders as to those holding Novartis AG shares (i.e., the right to vote up to 2% of the Novartis AG registered share capital – unless otherwise granted an exemption by the Board – and the disclo-sure requirement for nominees).
(c) Shareholders have the right to allocate the profit shown on our balance sheet and to distribute divi-dends by vote taken at the General Meeting, subject to the legal requirements described in “Item 10.B.3(a) Shareholder rights.”
(d) Under the Swiss CO, any surplus arising out of a liq-uidation of Novartis AG (i.e., after the settlement of all claims of all creditors) would be distributed to the shareholders in proportion to the paid-in nominal value of their shares.
(e) The Swiss CO limits a corporation’s ability to hold or repurchase its own shares. We and our subsidiaries may only repurchase shares if we have sufficient freely disposable equity in the amount of the pur-chase price of the acquired shares. The aggregate nominal value of all Novartis AG shares held by us and our subsidiaries may not exceed 10% of our regis-tered share capital. However, it is accepted that a Swiss corporation may repurchase its own shares beyond the statutory limit of 10% if the repurchased shares are clearly earmarked for cancellation. In addi-tion, we are required to recognize a negative position, or if our subsidiaries acquire our shares, to create a special reserve on our balance sheet in the amount of the purchase price of the acquired shares. Repur-chased shares held by us or our subsidiaries do not carry any rights to vote at a General Meeting, but are entitled to the economic benefits generally con-nected with the shares. The definition of subsidiaries, and therefore, treasury shares, for purposes of the above described reserves requirement and voting
restrictions differs from the definition of subsidiaries for purposes of consolidation in our consolidated financial statements. The definition in the consoli-dated financial statements requires consolidation for financial reporting purposes of special purpose enti-ties in instances where we have the power to govern the financial and operating policies of the entity so as to obtain benefits from its activities. Therefore, our consolidated financial statements include special purpose entities, mainly foundations, which do not qualify as subsidiaries subject to the reserve require-ments and voting restrictions of the Swiss CO because we do not hold a majority participation in these spe-cial purpose entities. Accordingly, no reserve require-ments apply to shares held by such special purpose entities, and such entities are not restricted from inde-pendently voting their shares.
Under the Swiss CO, we may not cancel treasury shares without the approval of a capital reduction by our shareholders.
(f) Not applicable.(g) Since all of our issued and outstanding shares have
been fully paid in, our shareholders are not obliged to make further contributions with respect to their shares.
(h) See “—Item 10.B.3(b) Shareholder rights” and “—Item 10.B.7 Change in control.”
10.B.4 Changes to shareholder rights
Under the Swiss CO, we may not issue new shares with-out the prior approval of a capital increase by our share-holders. If a capital increase is approved, then our share-holders would generally have certain pre-emptive rights to obtain newly issued shares in an amount proportional to the nominal value of the shares they already hold. These pre-emptive rights could be excluded in certain limited circumstances with the approval of a resolution adopted at a General Meeting by a supermajority of two-thirds of the votes. In addition, we may not create shares with increased voting powers or place restrictions on the transfer of registered shares without the approval of a resolution adopted at a General Meeting by a super-majority of votes. In addition, see “—Item 10.B.3(b) Share-holder rights” with regard to the Board’s ability to cancel the registration of shares under limited circumstances.
10.B.5 Shareholder meetings
Under the Swiss CO and the Articles, we must hold an AGM within six months after the end of our financial year. A General Meeting may be convened by the Board or, if necessary, by the external auditor. The Board is further required to convene an extraordinary General Meeting if so resolved by a General Meeting, or if so requested by shareholders representing at least 10% of the share capital, specifying the items for the agenda and their proposals. Shareholders representing shares with an aggregate nominal value of at least CHF 1 000 000 may request that an item be included in a General Meeting agenda. A General Meeting is convened by publishing a notice in the Swiss Official Gazette of Commerce

Item 10. Additional Information
170
(Schweizerisches Handelsamtsblatt) at least 20 days prior to such meeting. Shareholders may also be informed by mail. Neither the Swiss CO nor the Articles require a quorum for a General Meeting. In addition, see “—Item 10.B.3(b) Shareholder rights” regarding conditions for exercising a shareholder’s right to vote at a General Meeting.
10.B.6 Limitations
There are no limitations under the Swiss CO or our Arti-cles on the right of non-Swiss residents or nationals to own or vote shares other than the restrictions applica-ble to all shareholders. But see “—Item 10.B.3(b) Share-holder rights” regarding conditions for exercising an ADR holder’s right to vote at a shareholder meeting.
10.B.7 Change in control
The Articles and the Board Regulations contain no pro-vision that would have an effect of delaying, deferring or preventing a change in control of Novartis AG and that would operate only with respect to a merger, acquisition or corporate restructuring involving us or any of our sub-sidiaries.
According to the Swiss Merger Act, shareholders may pass a resolution to merge with another corpora-tion at any time. Such a resolution would require the con-sent of at least two-thirds of all votes present at the nec-essary General Meeting.
Under the Swiss Financial Market Infrastructure Act, shareholders and groups of shareholders acting in con-cert who acquire more than 33 1/3% of our shares would be under an obligation to make an offer to acquire all remaining Novartis AG shares. Novartis AG has neither opted out from the mandatory takeover offer obligation nor opted to increase the threshold for mandatory take-over offers in its Articles.
10.B.8 Disclosure of shareholdings
Under the Swiss Financial Market Infrastructure Act, per-sons who directly, indirectly or in concert with other par-ties acquire or dispose of our shares or purchase or sale rights relating to our shares are required to notify us and the SIX of the level of their holdings whenever such hold-ings reach, exceed or fall below certain thresholds – 3%, 5%, 10%, 15%, 20%, 25%, 33 1/3%, 50% and 66 2/3% – of the voting rights represented by our share capital (whether exercisable or not). This also applies to anyone who has discretionary power to exercise voting rights associated with our shares. Following receipt of such notification, we are required to inform the public by pub-lishing the information via the electronic publication plat-form operated by the SIX.
An additional disclosure obligation exists under the Swiss CO that requires us to disclose, once a year in the notes to the financial statements published in our Annual Report, the identity of all of our shareholders (or related groups of shareholders) who have been granted exemp-tion entitling them to vote more than 2% of our registered share capital, as described in “—Item 10.B.3(b) Share-holder rights.”
10.B.9 Differences in the law
See the references to Swiss law throughout this “—Item 10.B Memorandum and articles of association.”
10.B.10 Changes in capital
The requirements of the Articles regarding changes in capital are not more stringent than the requirements of Swiss law.
10.C Material contracts
Alcon spin-off
In connection with the spin-off of our Alcon business, we entered into a Separation and Distribution Agreement, a Tax Matters Agreement and several other agreements with Alcon to effect the separation of the Alcon business and provide a framework for our relationship with Alcon after the spin-off.
The Separation and Distribution Agreement sets forth the parties’ agreements regarding the principal actions to be taken in connection with the separation of the Alcon business and the spin-off, including the con-ditions of the spin-off and the rights and obligations of the parties with respect to the distribution. The Separa-tion and Distribution Agreement identifies the assets to be transferred, liabilities to be assumed and contracts to be assigned to each of Novartis and Alcon as part of the internal transactions effected prior to the distribu-
tion, and provides for when and how such transfers, assumptions and assignments should occur.
The Tax Matters Agreement imposes certain restric-tions and indemnity obligations on Alcon designed to preserve the tax-neutral nature of the spin-off for Swiss tax and US federal income tax purposes. The Tax Mat-ters Agreement also provides that Alcon will generally indemnify Novartis for any taxes of Novartis and its sub-sidiaries to the extent such taxes are attributable to the Alcon business, and Novartis will generally indemnify Alcon for any of Alcon’s or its subsidiaries’ taxes to the extent such taxes are attributable to the Novartis retained businesses.
In connection with the spin-off, we also entered into an employee matters agreement, a transition services agreement, forward and reverse manufacturing supply agreements, and certain intellectual property agree-ments, each of which is not material to Novartis.

Item 10. Additional Information
171
Acquisition of The Medicines CompanyOn November 23, 2019, we entered into an Agreement and Plan of Merger (the “Merger Agreement”) with US-based pharmaceutical company The Medicines Company. Pursuant to the Merger Agreement, on Decem-ber 5, 2019, Novartis, through a subsidiary, commenced a tender offer to acquire all outstanding shares of The
Medicines Company for USD 85 per share, or a total con-sideration of approximately USD 9.6 billion in cash on a fully diluted basis. The tender offer expired on January 3, 2020, and on January 6, 2020, the acquiring subsid-iary merged with and into The Medicines Company, resulting in The Medicines Company becoming an indi-rect wholly owned subsidiary of Novartis. This merger broadens our cardiovascular portfolio by adding incli-siran, an investigational cholesterol-lowering therapy.
10.D Exchange controls
There are no Swiss governmental laws, decrees or reg-ulations that affect – in a manner material to Novartis AG – the export or import of capital, including the availabil-ity of cash and cash equivalents for use by Novartis or
any foreign exchange controls that affect the remittance of dividends, interest or other payments to non-residents or non-citizens of Switzerland who hold Novartis AG securities.
10.E Taxation
The taxation discussion set forth below is intended only as a descriptive summary and does not purport to be a complete analysis or listing of all potential tax effects rel-evant to the ownership or disposition of our shares or ADRs. The statements of US and Swiss tax laws set forth below are based on the laws and regulations in force as of the date of this 20-F – including the current Conven-tion Between the US and the Swiss Confederation for the Avoidance of Double Taxation with Respect to Taxes on Income, entered into force on December 19, 1997 (“the Treaty”); the US Internal Revenue Code of 1986, as amended (“the Code”); Treasury regulations; rulings; judi-cial decisions; and administrative pronouncements – and may be subject to any changes in US and Swiss law, and in any double taxation convention or treaty between the US and Switzerland occurring after that date, which changes may have retroactive effect.
Swiss taxation
Swiss residentsWithholding Tax on dividends and distributions. Divi-dends that we pay and similar cash or in-kind distribu-tions that we may make to a holder of shares or ADRs (including distributions of liquidation proceeds in excess of the nominal value, stock dividends and, under certain circumstances, proceeds from repurchases of shares by us in excess of the nominal value) are generally sub-ject to a Swiss federal withholding tax (“the Withholding Tax”) at a current rate of 35%. Under certain circum-stances, distributions out of capital contribution reserves made by shareholders after December 31, 1996, are exempt from the Withholding Tax. We are required to withhold Withholding Tax due from the gross distribution and to pay the Withholding Tax to the Swiss Federal Tax Administration. The Withholding Tax is refundable in full to Swiss tax residents who are the beneficial owners of the taxable distribution at the time it is resolved and duly
report the gross distribution received on their personal tax return or in their financial statements for tax pur-poses, as the case may be.
Income tax on dividends. A Swiss tax resident who receives dividends and similar distributions (including stock dividends and liquidation surplus) on shares or ADRs is required to include such amounts in the share-holder’s personal income tax return. However, distribu-tions out of qualified capital contribution reserves are not subject to income tax. A corporate shareholder may claim substantial relief from taxation of dividends and similar distributions received if the shares held represent a fair market value of at least CHF 1 million.
Capital gains tax upon disposal of shares. Under current Swiss tax law, the gain realized on shares held by a Swiss resident who holds shares or ADRs as part of his private property is generally not subject to any federal, cantonal or municipal income taxation on gains realized on the sale or other disposal of shares or ADRs. However, gains realized upon a repurchase of shares by us may be char-acterized as taxable dividend income if certain condi-tions are met. Book gains realized on shares or ADRs held by a Swiss corporate entity or by a Swiss resident individual as part of the shareholder’s business property are, in general, included in the taxable income of such person. However, the Federal Law on the Direct Federal Tax of December 14, 1990, and several cantonal laws on direct cantonal taxes provide for exceptions for Swiss corporate entities holding more than 10% of our voting stock for more than one year.
Residents of other countriesRecipients of dividends and similar distributions on our shares who are neither residents of Switzerland for tax purposes nor holding shares as part of a business con-ducted through a permanent establishment situated in Switzerland (“Non-Resident Holders”) are not subject to

Item 10. Additional Information
172
Swiss income taxes in respect of such distributions. Moreover, gains realized by such recipients upon the dis-posal of shares are not subject to Swiss income taxes.
Non-Resident Holders of shares are, however, sub-ject to the Withholding Tax on dividends and similar dis-tributions mentioned above and, under certain circum-stances, to the Stamp Duty described below. Such Non-Resident Holders may be entitled to a partial refund of the Withholding Tax if the country in which they reside
has entered into a bilateral treaty for the avoidance of double taxation with Switzerland. Non-Resident Holders should be aware that the procedures for claiming treaty refunds (and the time frame required for obtaining a refund) may differ from country to country. Non-Resident Holders should consult their own tax advisors regarding receipt, ownership, purchase, sale or other dispositions of shares or ADRs, and the procedures for claiming a refund of the Withholding Tax.
As of January 1, 2021, Switzerland has entered into bilateral treaties for the avoidance of double taxation with respect to income taxes with the following countries, whereby a part of the above-mentioned Withholding Tax may be refunded (subject to the limitations set forth in such treaties):
AlbaniaAlgeriaArgentinaArmeniaAustraliaAustriaAzerbaijanBahrainBangladeshBelarusBelgiumBulgariaCanadaChileChinaColombiaCroatiaCyprusCzech RepublicDenmarkEcuadorEgyptEstoniaFinland
FranceGeorgiaGermanyGhanaGreeceHong KongHungaryIcelandIndiaIndonesiaIranRepublic of IrelandIsraelItalyIvory CoastJamaicaJapanKazakhstanRepublic of Korea(South Korea)KosovoKuwaitKyrgyzstanLatvia
LiechtensteinLithuaniaLuxembourgMacedoniaMalaysiaMaltaMexicoMoldovaMongoliaMontenegroMoroccoNetherlandsNew ZealandNorwayOmanPakistanPeruPhilippinesPolandPortugalQatarRomaniaRussiaSerbia
SingaporeSlovak RepublicSloveniaSouth AfricaSpainSri LankaSwedenTaiwanTajikistanThailandTrinidad and TobagoTunisiaTurkeyTurkmenistanUkraineUnited Arab EmiratesUnited KingdomUnited States of AmericaUruguayUzbekistanVenezuelaVietnam Zambia
The tax treaty with Bahrain is not applicable to the healthcare industry. Tax treaty negotiations are underway, or have been conducted, with Bahrain, Bosnia and Herzegovina, Brazil, Costa Rica, Ethiopia, Libya, North Korea, Saudi Arabia, Senegal, Syria and Zimbabwe. Tax treaty negotiations between Switzerland and some of the countries listed in the immediately preceding sentence have been ongoing for an extended period of time, and we are not certain when or if such negotiations will be completed, and when or if the corresponding treaties will come into effect.
A Non-Resident Holder of shares or ADRs will not be lia-ble for any Swiss taxes other than the Withholding Tax described above and, if the transfer occurs through or with a Swiss bank or other Swiss securities dealer, the Stamp Duty described below. If, however, the shares or ADRs of Non-Resident Holders can be attributed to a permanent establishment or a fixed place of business maintained by such person within Switzerland during the relevant tax year, the shares or ADRs may be subject to Swiss income taxes in respect of income and gains real-ized on the shares or ADRs, and such person may qual-ify for a full refund of the Withholding Tax based on Swiss tax law.
Residents of the US. A Non-Resident Holder who is a resident of the US for purposes of the Treaty is eligible for a reduced rate of tax on dividends equal to 15% of
the dividend, provided that such holder (i) qualifies for benefits under the Treaty, (ii) is not a company (or, if it is a company, such company directly holds less than 10% of our voting stock), and (iii) does not conduct business through a permanent establishment or fixed base in Swit-zerland to which the shares or ADRs are attributable. Such an eligible holder must apply for a refund of the amount of the Withholding Tax in excess of the 15% Treaty rate. A Non-Resident Holder who is a resident of the US for purposes of the Treaty is eligible for a reduced rate of tax on dividends equal to 5% of the dividend, pro-vided that such holder (i) is a company, (ii) qualifies for benefits under the Treaty, (iii) holds directly at least 10% of our voting stock, and (iv) does not conduct business through a permanent establishment or fixed place of business in Switzerland to which the shares or ADRs are attributable. Such an eligible holder must apply for a

Item 10. Additional Information
173
refund of the amount of the Withholding Tax in excess of the 5% Treaty rate. Claims for refunds must be filed on Swiss Tax Form 82 (82C for corporations; 82I for indi-viduals; 82E for other entities), which may be obtained from any Swiss Consulate General in the US or from the Federal Tax Administration of Switzerland at the address below, together with an instruction form. Four copies of the form must be duly completed, signed before a notary public of the US, and sent to the Federal Tax Adminis-tration of Switzerland, Eigerstrasse 65, CH-3003 Bern, Switzerland. The form must be accompanied by suitable evidence of deduction of Swiss tax withheld at source, such as certificates of deduction, signed bank vouchers or credit slips. The form may be filed on or after July 1 or January 1 following the date the dividend was payable, but no later than December 31 of the third year following the calendar year in which the dividend became payable. For US resident holders of ADRs, JPMorgan Chase Bank, N.A., as depositary, will comply with these Swiss proce-dures on behalf of the holders, and will remit the net amount to the holders.
Stamp Duty upon transfer of securities. The sale of shares, whether by Swiss residents or Non-Resident Holders, may be subject to federal securities transfer Stamp Duty of 0.15%, calculated on the sale proceeds, if the sale occurs through or with a Swiss bank or other Swiss securities dealer, as defined in the Swiss Federal Stamp Duty Act. The Stamp Duty has to be paid by the securities dealer and may be charged to the parties in a taxable transaction who are not securities dealers. Stamp Duty may also be due if a sale of shares occurs with or through a non-Swiss bank or securities dealer, provided (i) such bank or dealer is a member of the SIX, and (ii) the sale takes place on the SIX. In addition to this Stamp Duty, the sale of shares by or through a member of the SIX may be subject to a minor stock exchange levy.
US federal income taxation
The following is a general discussion of the material US federal income tax consequences of the ownership and disposition of our shares or ADRs that may be relevant to you if you are a US Holder (as defined below). Because this discussion does not consider any specific circum-stances of any particular holder of our shares or ADRs, persons who are subject to US taxation are strongly urged to consult their own tax advisors as to the overall US federal, state and local tax consequences, as well as to the overall Swiss and other foreign tax consequences, of the ownership and disposition of our shares or ADRs. In particular, additional or different rules may apply to US expatriates; banks and other financial institutions; regu-lated investment companies; traders in securities who elect to apply a mark-to-market method of accounting; dealers in securities or currencies; tax-exempt entities; insurance companies; broker-dealers; investors liable for alternative minimum tax; investors that hold shares or ADRs as part of a straddle, hedging or conversion trans-action; holders whose functional currency is not the US dollar; partnerships or other pass-through entities; per-sons who acquired our shares pursuant to the exercise
of employee stock options or otherwise as compensa-tion; and persons who hold, directly, indirectly or by attri-bution, 10% or more of our outstanding shares. This dis-cussion generally applies only to US Holders who hold the shares or ADRs as a capital asset (generally, for investment purposes), and whose functional currency is the US dollar. Investors are urged to consult their own tax advisors concerning whether they are eligible for benefits under the Treaty.
For purposes of this discussion, a US Holder is a ben-eficial owner of our shares or ADRs who is (i) an individ-ual who is a citizen or resident of the US for US federal income tax purposes; (ii) a corporation (or other entity taxable as a corporation for US federal income tax pur-poses) created or organized in or under the laws of the US or a state thereof or the District of Columbia; (iii) an estate the income of which is subject to US federal income taxation regardless of its source; or (iv) a trust (i) subject to the primary supervision of a US court and the control of one or more US persons, or (ii) that has a valid election in place to be treated as a US person. If a partnership (or other entity treated as a partnership for US federal income tax purposes) holds shares or ADRs, the tax treatment of a partner generally will depend upon the status of the partner and the activities of the part-nership. Partners in a partnership that holds shares or ADRs are urged to consult their own tax advisor regard-ing the specific tax consequences of the owning and disposing of such shares or ADRs by the partnership.
For US federal income tax purposes, a US Holder of ADRs generally will be treated as the beneficial owner of our shares represented by the ADRs. However, see the discussion below under “—Dividends” regarding cer-tain statements made by the US Treasury concerning depositary arrangements.
This discussion assumes that each obligation in the Deposit Agreement and any related agreement will be performed in accordance with its terms.
Dividends. US Holders will be required to include in gross income, as an item of ordinary income, the full amount (without reduction for any Withholding Tax) of the divi-dend paid with respect to our shares or ADRs at the time that such dividend is received by the US Holder, in the case of shares, or by the depositary, in the case of ADRs. For this purpose, a “dividend” will include any distribu-tion paid by us with respect to our shares or ADRs (other than certain pro rata distributions of our capital stock) paid out of our current or accumulated earnings and prof-its, as determined under US federal income tax princi-ples. To the extent the amount of a distribution by us exceeds our current and accumulated earnings and prof-its, such excess will first be treated as a tax-free return of capital to the extent of a US Holder’s tax basis in the shares or ADRs (with a corresponding reduction in such tax basis), and thereafter will be treated as capital gain, which will be long-term capital gain if the US Holder held our shares or ADRs for more than one year. Under the Code, dividend payments by us on the shares or ADRs are not eligible for the dividends received deduction gen-erally allowed to corporate shareholders.
Dividend income in respect of our shares or ADRs will constitute income from sources outside the US for US foreign tax credit purposes. Subject to the limitations

Item 10. Additional Information
174
and conditions provided in the Code, US Holders gener-ally may claim as a credit against their US federal income tax liability, any Withholding Tax withheld from a dividend. The rules governing the foreign tax credit are complex. Each US Holder is urged to consult its own tax advisor concerning whether, and to what extent, a foreign tax credit will be available with respect to dividends received from us. Alternatively, a US Holder may claim the With-holding Tax as a deduction for the taxable year within which the Withholding Tax is paid or accrued, provided a deduction is claimed for all of the foreign income taxes the US Holder pays or accrues in the particular year. A deduction does not reduce US tax on a dollar-for-dollar basis like a tax credit. The deduction, however, is not subject to the limitations applicable to foreign tax cred-its, but may be subject to other limitations, and each US Holder is urged to consult its own tax advisor.
The US Treasury has expressed concern that parties to whom ADRs are released may be taking actions incon-sistent with the claiming of foreign tax credits for US Holders of ADRs. Accordingly, the summary above of the creditability of the Withholding Tax could be affected by future actions that may be taken by the US Treasury.
In general, a US Holder will be required to determine the amount of any dividend paid in Swiss francs, includ-ing the amount of any Withholding Tax imposed thereon, by translating the Swiss francs into US dollars at the spot rate on the date the dividend is actually or constructively received by a US Holder, in the case of shares, or by the depositary, in the case of ADRs, regardless of whether the Swiss francs are in fact converted into US dollars. If a US Holder converts the Swiss francs so received into US dollars on the date of receipt, the US Holder gener-ally should not recognize foreign currency gain or loss on such conversion. If a US Holder does not convert the Swiss francs so received into US dollars on the date of receipt, the US Holder will have a tax basis in the Swiss francs equal to the US dollar value on such date. Any for-eign currency gain or loss that a US Holder recognizes on a subsequent conversion or other disposition of the Swiss francs generally will be treated as US source ordi-nary income or loss.
For a non-corporate US Holder, the US dollar amount of any dividends paid that constitute qualified dividend income generally will be taxable at a maximum rate of 15% (or 20% in the case of taxpayers with annual income that exceeds certain thresholds), provided that the US Holder meets certain holding period and other require-ments. In addition, the dividends could be subject to a 3.8% net investment income tax. This tax is applied against the lesser of the US Holder’s net investment income or the amount by which modified adjusted gross income exceeds a statutory threshold amount based on filing status. We currently believe that dividends paid with respect to our shares and ADRs will constitute qualified dividend income for US federal income tax purposes,
provided that the US Holder meets certain holding period and other requirements. US Holders of shares or ADRs are urged to consult their own tax advisors regarding the availability to them of the reduced dividend rate in light of their own particular situation and the computations of their foreign tax credit limitation with respect to any qual-ified dividends paid to them, as applicable.
Sale or other taxable disposition. Upon a sale or other taxable disposition of shares or ADRs, US Holders gen-erally will recognize capital gain or loss in an amount equal to the difference between the US dollar value of the amount realized on the disposition and the US Hold-er’s tax basis (determined in US dollars) in the shares or ADRs. This capital gain or loss generally will be US source gain or loss and will be treated as long-term cap-ital gain or loss if the holding period in the shares or ADRs exceeds one year. In the case of a non-corporate US Holder, any long-term capital gain generally will be sub-ject to US federal income tax at preferential rates, with a maximum rate of 15% (or 20% in the case of taxpayers with annual income that exceeds certain thresholds). In addition, the gains could be subject to a 3.8% investment income tax. This tax is applied against the lesser of the US Holder’s net investment income or the amount by which modified adjusted gross income exceeds a stat-utory threshold amount based on filing status. The deductibility of capital losses is subject to significant lim-itations under the Code. Deposits or withdrawals of our shares by US Holders in exchanges for ADRs will not result in the realization of gain or loss for US federal income tax purposes.
US information reporting and backup withholding. Divi-dend payments with respect to shares or ADRs and pro-ceeds from the sale, exchange or other disposition of shares or ADRs received in the United States or through US-related financial intermediaries may be subject to information reporting to the US Internal Revenue Service (IRS) and possible US backup withholding. Certain exempt recipients (such as corporations) are not subject to these information reporting and backup withholding requirements. Backup withholding will not apply to a US Holder who furnishes a correct taxpayer identification number and makes any other required certification or who is otherwise exempt from backup withholding. Any US Holders required to establish their exempt status generally must provide a properly executed IRS Form W-9 (Request for Taxpayer Identification Number and Certi-fication). Backup withholding is not an additional tax. Amounts withheld as backup withholding may be cred-ited against a US Holder’s US federal income tax liabil-ity, and a US Holder may obtain a refund of any excess amounts withheld under the backup withholding rules by timely filing the appropriate claim for refund with the IRS and furnishing any required information.
10.F Dividends and paying agents
Not applicable.

Item 10. Additional Information
175
10.G Statement by experts
Not applicable.
10.H Documents on display
Any statement in this Form 20-F about any of our con-tracts or other documents is not necessarily complete. If the contract or document is filed as an exhibit to the Form 20-F, the contract or document is deemed to mod-ify the description contained in this Form 20-F. You must review the exhibits themselves for a complete descrip-tion of the contract or document.
The SEC maintains an internet site at http://www.sec.gov that contains reports and other information regard-ing issuers that file electronically with the SEC. These
SEC filings are also available to the public from commer-cial document retrieval services.
We are required to file or furnish reports and other information with the SEC under the Exchange Act and regulations under that act. As a foreign private issuer, we are exempt from the rules under the Exchange Act pre-scribing the form and content of proxy statements, and our officers, directors and principal shareholders are exempt from the reporting and short swing profit recov-ery provisions contained in Section 16 of the Exchange Act.
10.I Subsidiary information
Not applicable.

Item 11. Quantitative and Qualitative Disclosures About Market Risk
176
Item 11. Quantitative and Qualitative Disclosures About Market RiskThe major financial risks facing the Group are managed centrally by Group Treasury. We have a written Treasury Directive and have implemented a strict segregation of front-office and back-office controls. The Group does regular reconciliations of its positions with its counter-parties. In addition, the Treasury function is included in management’s internal control assessment.
For information about the effects of currency fluctu-ations and how we manage currency risk, see “Item 5. Operating and Financial Review and Prospects—Item 5.B Liquidity and capital resources.”
The information set forth under “Item 18. Financial Statements—Note 29. Financial instruments—additional disclosures” is incorporated by reference.

Item 12. Description of Securities Other Than Equity Securities
177
Item 12. Description of Securities Other Than Equity Securities12.A Debt securities
Not applicable.
12.B Warrants and rights
Not applicable.
12.C Other securities
Not applicable.
12.D American Depositary Shares
Fees payable by ADR holders
According to our Deposit Agreement with the ADS depositary, JPMorgan Chase Bank, N.A. (JPMorgan), holders of our ADRs may have to pay to JPMorgan, either directly or indirectly, fees or charges up to the amounts set forth below:
Category Depositary actions Associated fee
Depositing or substituting Acceptance of shares surrendered, and issuance of ADRs in exchange, USD 5.00 for each 100 ADSs underlying shares including surrenders and issuances in respect of: (or portion thereof) — Share distributions evidenced by the new — Stock split ADRs delivered — Rights — Merger — Exchange of shares or any other transaction or event or other distribution affecting the ADSs or the deposited shares
Withdrawing Acceptance of ADRs surrendered for withdrawal of deposited shares USD 5.00 for each 100 ADSs underlying shares (or portion thereof) evidenced by the ADRs surrendered
Selling or Distribution or sale of shares, the fee being in an amount equal to the fee USD 5.00 for each 100 ADSs exercising rights for the execution and delivery of ADRs that would have been charged (or portion thereof) as a result of the deposit of such shares
Transferring, Transfers, combining or grouping of depositary receipts USD 1.50 per ADRsplitting or grouping receipts
Expenses of the Expenses incurred on behalf of holders in connection with: Expenses payable at the sole depositary — Compliance with foreign exchange control regulations or any law or discretion of the depositary regulation relating to foreign investment by billing holders or by — The depositary’s or its custodian’s compliance with applicable law, deducting charges from one rule or regulation or more cash dividends or — Stock transfer or other taxes and other governmental charges other cash distributions — Cable, telex and facsimile transmission and delivery — Expenses of the depositary in connection with the conversion of foreign currency into US dollars (which are paid out of such foreign currency) — Any other charge payable by any of the depositary or its agents
Advance tax relief Tax relief/reclamation process for qualified holders A depositary service charge of USD 0.008 per ADS

Item 12. Description of Securities Other Than Equity Securities
178
Fees payable by the depositary to the issuerPursuant to an agreement effective as of May 11, 2017 (“the Agreement”), JPMorgan, as our ADS depositary, has agreed to make an annual contribution payment to Novartis at the end of each 12-month period beginning on the effective date of the Agreement and on each sub-sequent anniversary of the effective date of the Agree-ment (each such 12-month period is a “Contract Year”). This annual contribution payment will equal: (a)(1) USD 1.7 million less (a)(2) the custody costs, fees and expenses (including, without limitation, any central securities depository fees, charges and expenses) incurred during the applicable Contract Year (the items in (a)(2) collec-tively are the “Custody Costs”) plus (b) 70% of the gross
issuance and cancellation fees collected by JPMorgan under the Deposit Agreement during such Contract Year minus (c) that portion (if any) of JPMorgan’s legal fees, charges and out-of-pocket expenses in excess of USD 50 000 for such Contract Year. To the extent that the Custody Costs for a Contract Year exceed USD 1.7 mil-lion, these costs would be capped at USD 1.7 million.
JPMorgan has further agreed to waive the USD 0.05 per ADS issuance fees that would normally be owed by Novartis in connection with our deposits of shares as part of our employee stock ownership and employee par-ticipation plans. Novartis is responsible for reimbursing JPMorgan for all taxes and governmental charges required to have been withheld and/or paid, and not so withheld and/or paid, arising from such waived fees.

Item 13. Defaults, Dividend Arrearages and Delinquencies
179
PART II
Item 13. Defaults, Dividend Arrearages and DelinquenciesNone.

Item 14. Material Modifications to the Rights of Security Holders and Use of Proceeds
180
Item 14. Material Modifications to the Rights of Security Holders and Use of ProceedsNone.
Item 15. Controls and Procedures
181
Item 15. Controls and ProceduresReport of Novartis Management on Internal Control Over Financial Reporting
Novartis AG’s Chief Executive Officer and Chief Finan‑cial Officer, after evaluating the effectiveness of our dis‑closure controls and procedures (as defined in Exchange Act Rule 13a‑15(e)) as of the end of the period covered by this Annual Report, have concluded that, as of such date, our disclosure controls and procedures were effec‑tive.
The Board of Directors and management of the Group are responsible for establishing and maintaining adequate internal control over financial reporting. The Group’s internal control system was designed to provide reasonable assurance to the Group’s management and Board of Directors regarding the reliability of financial reporting and the preparation and fair presentation of its published consolidated financial statements.
All internal control systems, no matter how well designed, have inherent limitations. Therefore, even those systems determined to be effective may not pre‑vent or detect misstatements and can provide only rea‑sonable assurance with respect to financial statement preparation and presentation. Also, projections of any evaluation of effectiveness to future periods are subject to the risk that controls may become inadequate because of changes in conditions, or that the degree of compli‑ance with the policies or procedures may deteriorate.
Group management assessed the effectiveness of the Group’s internal control over financial reporting as of December 31, 2020. In making this assessment, it used the criteria established in Internal Control—Integrated Framework (2013) issued by the Committee of Sponsor‑ing Organizations of the Treadway Commission (COSO). Based on our assessment, management concluded that, as of December 31, 2020, the Group’s internal control over financial reporting is effective based on those cri‑teria.
PricewaterhouseCoopers AG, Switzerland, an inde‑pendent registered public accounting firm, has issued an unqualified opinion on the effectiveness of the Group’s internal control over financial reporting, which is included in this Annual Report under “Item 18. Financial State‑ments—Report of independent registered public accounting firm.”
See the report of PwC, an independent registered public accounting firm, included under “Item 18. Finan‑cial Statements—Report of independent registered pub‑lic accounting firm.”
There were no changes to our internal control over financial reporting that occurred during the period cov‑ered by this Annual Report that have materially affected, or are reasonably likely to materially affect, our internal control over financial reporting.
Vas Narasimhan Harry KirschChief Executive Officer Chief Financial Officer
Basel, January 25, 2021

Item 16A. Audit Committee Financial Expert
182
Item 16A. Audit Committee Financial Expert
Our Audit and Compliance Committee has determined that Srikant Datar and Elizabeth Doherty each possess specific accounting and financial management expertise and that each is an Audit Committee Financial Expert as defined by the SEC. The Board of Directors has also determined that Srikant Datar and Elizabeth Doherty are
each “independent” in accordance with the applicable requirements of Rule 10A‑3 of the Exchange Act, and that other members of the Audit and Compliance Com‑mittee have sufficient experience and ability in finance and compliance matters to enable them to adequately discharge their responsibilities.

Item 16B. Code of Ethics
183
Item 16B. Code of EthicsIn addition to our Code of Ethics and Professional Prac‑tices Policy, which are applicable to all of our associates, we have adopted Ethical Conduct Requirements that impose additional obligations on our principal executive officer, principal financial officer, principal accounting
officer, and persons performing similar functions. This document is accessible on our internet website at:https://www.novartis.com/investors/company‑over‑view/corporate‑governance

Item 16C. Principal Accountant Fees and Services
184
Item 16C. Principal Accountant Fees and ServicesThe information set forth under “Item 6. Directors, Senior Management and Employees—Item 6.C Board practices—Corporate governance—Auditors” is incorporated by reference.

Item 16D. Exemptions from the Listing Standards for Audit Committees
185
Item 16D. Exemptions from the Listing Standards for Audit CommitteesNot applicable.

Item 16E. Purchases of Equity Securities by the Issuer and Affiliated Purchasers
186
Item 16E. Purchases of Equity Securities by the Issuer and Affiliated Purchasers Maximum Maximum
approximate approximate
Total number value of value of
of shares shares that shares that
purchased may yet be may yet be
as part of purchased purchased
publicly under the under the
Average price announced plans or plans or
Total number of paid per share plans or programs programs
shares purchased in USD programs (CHF millions) (USD millions)
2020 (a) 1 (b) (c) 2 (d) (e) 3
Jan. 1‑31 1 127 034 95.09 0 4 752 4 897
Feb. 1‑28 315 761 95.18 0 4 752 4 913
Mar. 1‑31 28 093 89.61 0 4 752 4 937
Apr. 1‑30 67 831 83.63 0 4 752 4 881
May 1‑31 7 990 85.29 0 4 752 4 932
Jun. 1‑30 22 601 86.85 0 4 752 4 989
Jul. 1‑31 13 275 87.91 0 4 752 5 245
Aug. 1‑31 1 806 646 87.15 1 800 000 4 610 5 102
Sep. 1‑30 12 951 800 88.85 12 917 162 3 559 3 862
Oct. 1‑31 9 896 929 87.06 9 882 838 2 774 3 032
Nov. 1‑30 1 350 036 89.71 1 340 000 2 665 2 953
Dec. 1‑31 6 715 051 91.22 6 700 000 2 122 2 409
Total 34 303 047 88.99 32 640 000
1 Column (a) shows shares repurchased on the SIX Swiss Exchange second trading line plus shares we purchased from employees who had obtained the shares through a Novartis Employee Ownership Plan. See “Item 18. Financial Statements – Note 26 Equity‑based participation plans for associates.”
2 Column (c) shows shares repurchased on the SIX Swiss Exchange second trading line under the eighth CHF 10 billion share buyback authority approved at the 2019 AGM. See “Item 6. Directors, Senior Management and Employees – Item 6C. Board Practices – Our capital structure – Changes in capital.”
3 Column (e) shows the Swiss franc amount from column (d) converted into US dollars as of the month‑end, using the Swiss franc/US dollar exchange rate at the applicable month‑end

Item 16F. Change in Registrant’s Certifying Accountant
187
Item 16F. Change in Registrant’s Certifying AccountantNot applicable.
Item 16G. Corporate Governance
188
Item 16G. Corporate Governance
Novartis AG is subject to and compliant with the laws and regulations of Switzerland (in particular, Swiss com‑pany and securities laws, SIX Swiss Exchange rules and the Swiss Code of Best Practice for Corporate Gover‑nance) and the securities laws of the United States, including New York Stock Exchange (NYSE) rules, as applicable to foreign private issuers of securities. The following summarizes some significant ways in which our corporate governance practices differ from those fol‑lowed by domestic listed US companies under the list‑ing standards of the NYSE:• Novartis AG shareholders do not receive written
reports directly from Board committees.
• External auditors are appointed by shareholders at the Annual General Meeting of Shareholders (AGM), as opposed to being appointed by the Audit and Compli‑ance Committee.
• While shareholders cannot vote on all equity compen‑sation plans, they are entitled to hold separate, yearly binding votes on Board and Executive Committee com‑pensation.
• The Board has set up a separate Risk Committee that oversees the risk management system and processes, as opposed to delegating this responsibility to the Audit and Compliance Committee.
• The full Board is responsible for overseeing the performance evaluation of the Board and Executive Committee.
• The full Board is responsible for setting objectives rel‑evant to the CEO’s compensation and for evaluating his performance.

Item 16H. Mine Safety Disclosure
189
Item 16H. Mine Safety DisclosureNot applicable.

Item 17. Financial Statements
190
PART III
Item 17. Financial StatementsSee response to “Item 18. Financial Statements.”

Item 18. Financial Statements
191
Item 18. Financial StatementsThe following financial statements are filed as part of this Annual Report. PageConsolidated income statements F‑1Consolidated statements of comprehensive income F‑2Consolidated balance sheets F‑3Consolidated statements of changes in equity F‑4Consolidated statements of cash flows F‑5Notes to the Novartis Group consolidated financial statements F‑6 1. Significant accounting policies F‑6 2. Significant transactions F‑15 3. Segmentation of key figures 2020, 2019 and 2018 F‑19 4. Associated companies F‑29 5. Interest expense and other financial income and expense F‑30 6. Taxes F‑31 7. Earnings per share F‑32 8. Changes in consolidated statements of comprehensive income F‑33 9. Property, plant and equipment F‑34 10. Right‑of‑use assets and lease liabilities F‑36 11. Goodwill and intangible assets F‑37 12. Deferred tax assets and liabilities F‑40 13. Financial and other non‑current assets F‑42 14. Inventories F‑42 15. Trade receivables F‑42 16. Marketable securities, commodities, time deposits, derivative financial instruments,
and cash and cash equivalents F‑44 17. Other current assets F‑44 18. Equity F‑44 19. Non‑current financial debt F‑47 20. Provisions and other non‑current liabilities F‑48 21. Current financial debt and derivative financial instruments F‑52 22. Provisions and other current liabilities F‑53 23. Details to the consolidated statements of cash flows F‑55 24. Acquisitions of businesses F‑58 25. Post‑employment benefits for associates F‑59 26. Equity‑based participation plans for associates F‑63 27. Transactions with related parties F‑66 28. Commitments and contingencies F‑67 29. Financial instruments – additional disclosures F‑69 30. Discontinued operations F‑78 31. Events subsequent to the December 31, 2020, consolidated balance sheet date F‑82 32. Principal Group subsidiaries and associated companies F‑83Report of the statutory auditor on the consolidated financial statements of Novartis AG F‑85
Financial statements of Novartis AG A‑1Notes to the financial statements of Novartis AG A‑3Appropriation of available earnings and reserves of Novartis AG A‑11Report of the statutory auditor on the financial statements of Novartis AG A‑12

Item 19. Exhibits
192
Item 19. Exhibits
The SEC maintains an internet site at http://www.sec.gov that contains reports and other information regarding issuers that file electronically with the SEC. These SEC filings are also available to the public from commercial doc‑ument retrieval services.
1.1 Articles of Incorporation of Novartis AG, as amended February 28, 2020 (English translation) (incorpo‑rated by reference to Exhibit 4.1 to Novartis AG’s registration statement on Form S‑8 (File No. 333‑250207) as filed with the SEC on November 19, 2020).
1.2 Regulations of the Board of Directors, the Board Committees and the Executive Committee of Novartis AG, effective January 1, 2021.
2.1 Amended and Restated Deposit Agreement, dated as of May 11, 2000, among Novartis AG, JPMorgan Chase Bank (fka Morgan Guaranty Trust Company of New York), as depositary, and all holders from time to time of ADRs issued thereunder (incorporated by reference to Exhibit (a)(1) to Post‑Effective Amend‑ment No. 1 to Novartis AG’s registration statement on Form F‑6 (File No. 333‑11758) as filed with the SEC on September 8, 2000).
2.2 Amendment No. 1 to the Amended and Restated Deposit Agreement (incorporated by reference to Exhibit (a)(2) to Post‑Effective Amendment No. 1 to Novartis AG’s registration statement on Form F‑6 (File No. 333‑11758) as filed with the SEC on September 8, 2000).
2.3 Amendment No. 2 to the Amended and Restated Deposit Agreement (incorporated by reference to Exhibit (a)(3) to Novartis AG’s registration statement on Form F‑6 (File No. 333‑13446) as filed with the SEC on May 3, 2001).
2.4 Restricted Issuance Agreement, dated as of January 11, 2002, among Novartis AG, JPMorgan Chase Bank, as depositary, and all holders from time to time of ADRs representing ADSs issued thereunder (incorporated by reference to Exhibit 4 to the Registration Statement on Form F‑3 (File No. 333‑81862) as filed with the SEC on January 31, 2002).
2.5 Letter Agreement, dated December 14, 2007, between Novartis AG and JPMorgan Chase Bank, as depos‑itary (incorporated by reference to Exhibit 2.4 to the Form 20‑F for the year ended December 31, 2007, as filed with the SEC on January 28, 2008).
2.6 Form of American Depositary Receipt (incorporated by reference to Exhibit (a)(7) to the Registration Statement on Form F‑6 (File No. 333‑198623) as filed with the SEC on September 8, 2014).
2.7 The total amount of long‑term debt securities authorized under any instrument does not exceed 10% of the total assets of the Company and its subsidiaries on a consolidated basis. We hereby agree to furnish to the SEC, upon its request, a copy of any instrument defining the rights of holders of long‑term debt of the Company or of its subsidiaries for which consolidated or unconsolidated financial statements are required to be filed.
2.8 Description of Securities registered under Section 12 of the Exchange Act.
8.1 For a list of all of our principal Group subsidiaries and associated companies, see “Item 18. Financial Statements—Note 32. Principal Group subsidiaries and associated companies.”
12.1 Certification of Vasant Narasimhan, Chief Executive Officer of Novartis AG, pursuant to Section 302 of the Sarbanes‑Oxley Act of 2002.
12.2 Certification of Harry Kirsch, Chief Financial Officer of Novartis AG, pursuant to Section 302 of the Sar‑banes‑Oxley Act of 2002.
13.1 Certification of Vasant Narasimhan, Chief Executive Officer of Novartis AG, pursuant to Section 18 U.S.C. Section 1350, as adopted pursuant to Section 906 of the Sarbanes‑Oxley Act of 2002.

Item 19. Exhibits
193
13.2 Certification of Harry Kirsch, Chief Financial Officer of Novartis AG, pursuant to Section 18 U.S.C. Sec‑tion 1350, as adopted pursuant to Section 906 of the Sarbanes‑Oxley Act of 2002.
15.1 Consent of PricewaterhouseCoopers AG.
101.INS XBRL Instance Document
101.SCH XBRL Taxonomy Extension Schema Document
101.CAL XBRL Taxonomy Extension Calculation Linkbase Document
101.DEF XBRL Taxonomy Extension Definition Linkbase Document
101.LAB XBRL Taxonomy Extension Label Linkbase Document
101.PRE XBRL Taxonomy Extension Presentation Linkbase Document

194
(This page has been left blank intentionally.)

Novartis Group consolidated financial statements
F-1
Novartis Group consolidated financial statementsConsolidated income statements(For the years ended December 31, 2020, 2019 and 2018)
(USD millions unless indicated otherwise) Note 2020 2019 2018
Net sales to third parties from continuing operations 3 48 659 47 445 44 751
Sales to discontinued segment 53 82
Net sales from continuing operations 48 659 47 498 44 833
Other revenues 3 1 239 1 179 1 266
Cost of goods sold – 15 121 – 14 425 – 14 510
Gross profit from continuing operations 34 777 34 252 31 589
Selling, general and administration – 14 197 – 14 369 – 13 717
Research and development – 8 980 – 9 402 – 8 489
Other income 1 742 2 031 1 629
Other expense – 3 190 – 3 426 – 2 609
Operating income from continuing operations 10 152 9 086 8 403
Income from associated companies 4 673 659 6 438
Interest expense 5 – 869 – 850 – 932
Other financial income and expense 5 – 78 45 186
Income before taxes from continuing operations 9 878 8 940 14 095
Taxes 6 – 1 807 – 1 793 – 1 295
Net income from continuing operations 8 071 7 147 12 800
Net loss from discontinued operations before gain on
distribution of Alcon Inc. to Novartis AG shareholders 30 – 101 – 186
Gain on distribution of Alcon Inc. to Novartis AG shareholders 2 4 691
Net income/(loss) from discontinued operations 30 4 590 – 186
Net income 8 071 11 737 12 614
Attributable to:
Shareholders of Novartis AG 8 072 11 732 12 611
Non-controlling interests – 1 5 3
Basic earnings per share (USD) from continuing operations 3.55 3.12 5.52
Basic earnings per share (USD) from discontinued operations 2.00 – 0.08
Total basic earnings per share (USD) 7 3.55 5.12 5.44
Diluted earnings per share (USD) from continuing operations 3.52 3.08 5.46
Diluted earnings per share (USD) from discontinued operations 1.98 – 0.08
Total diluted earnings per share (USD) 7 3.52 5.06 5.38
The accompanying Notes form an integral part of the consolidated financial statements.

Novartis Group consolidated financial statements
F-2
Consolidated statements of comprehensive income(For the years ended December 31, 2020, 2019 and 2018)
(USD millions) Note 2020 2019 2018
Net income 8 071 11 737 12 614
Other comprehensive income to be eventually recycled into the consolidated income statement:
Fair value adjustments on debt securities, net of taxes 8 1
Fair value adjustments on deferred cash flow hedges, net of taxes 8 1 12
Total fair value adjustments on financial instruments, net of taxes 2 12
Novartis share of other comprehensive income
recognized by associated companies, net of taxes 4 – 56 – 94 – 482
Net investment hedge 8 – 201 44 95
Currency translation effects 8 3 194 352 315
Total of items to eventually recycle 2 937 304 – 60
Other comprehensive income never to be recycled into the consolidated income statement:
Actuarial gains/(losses) from defined benefit plans, net of taxes 8 143 – 467 – 359
Fair value adjustments on equity securities, net of taxes 8 250 – 47 13
Total of items never to be recycled 393 – 514 – 346
Total comprehensive income 11 401 11 527 12 208
Attributable to:
Shareholders of Novartis AG 11 403 11 525 12 210
Continuing operations 11 403 6 948 12 417
Discontinued operations 4 577 – 207
Non-controlling interests – 2 2 – 2
The accompanying Notes form an integral part of the consolidated financial statements.

Novartis Group consolidated financial statements
F-3
Consolidated balance sheets(At December 31, 2020 and 2019)
(USD millions) Note 2020 2019
Assets
Non-current assets
Property, plant and equipment 9 12 263 12 069
Right-of-use assets 10 1 676 1 677
Goodwill 11 29 999 26 524
Intangible assets other than goodwill 11 36 809 28 787
Investments in associated companies 4 9 632 8 644
Deferred tax assets 12 8 214 7 909
Financial assets 13 2 901 2 518
Other non-current assets 13 892 738
Total non-current assets 102 386 88 866
Current assets
Inventories 14 7 131 5 982
Trade receivables 15 8 217 8 301
Income tax receivables 239 254
Marketable securities, commodities, time deposits and derivative financial instruments 16 1 905 334
Cash and cash equivalents 16 9 658 11 112
Other current assets 17 2 523 2 680
Total current assets without disposal group 29 673 28 663
Assets of disposal group held for sale 2 841
Total current assets 29 673 29 504
Total assets 132 059 118 370
Equity and liabilities
Equity
Share capital 18 913 936
Treasury shares 18 – 53 – 80
Reserves 55 738 54 618
Equity attributable to Novartis AG shareholders 56 598 55 474
Non-controlling interests 68 77
Total equity 56 666 55 551
Liabilities
Non-current liabilities
Financial debts 19 26 259 20 353
Lease liabilities 10 1 719 1 703
Deferred tax liabilities 12 7 422 5 867
Provisions and other non-current liabilities 20 6 934 6 632
Total non-current liabilities 42 334 34 555
Current liabilities
Trade payables 5 403 5 424
Financial debts and derivative financial instruments 21 9 785 7 031
Lease liabilities 10 286 246
Current income tax liabilities 2 458 2 194
Provisions and other current liabilities 22 15 127 13 338
Total current liabilities without disposal group 33 059 28 233
Liabilities of disposal group held for sale 2 31
Total current liabilities 33 059 28 264
Total liabilities 75 393 62 819
Total equity and liabilities 132 059 118 370
The accompanying Notes form an integral part of the consolidated financial statements.

Novartis Group consolidated financial statements
F-4
Consolidated statements of changes in equity(For the years ended December 31, 2020, 2019 and 2018)
Reserves Equity
attributable Non-
Share Treasury Retained Total value to Novartis controlling Total
(USD millions) Note capital shares earnings adjustments shareholders interests equity
Total equity at December 31, 2017, as
previously reported 969 – 100 77 639 – 4 340 74 168 59 74 227
Impact of change in accounting policies 237 – 177 60 60
Restated equity at January 1, 2018 969 – 100 77 876 – 4 517 74 228 59 74 287
Net income 12 611 12 611 3 12 614
Other comprehensive income 8 – 482 81 – 401 – 5 – 406
Total comprehensive income 12 129 81 12 210 – 2 12 208
Dividends 18.1 – 6 966 – 6 966 – 6 966
Purchase of treasury shares 18.2 – 13 – 1 960 – 1 973 – 1 973
Reduction of share capital 18 – 25 34 – 9
Exercise of options and employee transactions 18.2 4 430 434 434
Other share sales 18.2 2 261 263 263
Equity-based compensation 18.2 4 752 756 756
Increase of treasury share repurchase
obligation under a share buyback trading plan 18.3 – 284 – 284 – 284
Transaction costs, net of taxes 18.8 – 79 – 79 – 79
Fair value adjustments on financial assets sold 8 16 – 16
Impact of change in ownership of consolidated entities 18.5 – 13 – 13 22 9
Changes in non-controlling interests 18.6 – 1 – 1
Other movements 18.7 38 38 38
Total of other equity movements – 25 31 – 7 814 – 16 – 7 824 21 – 7 803
Total equity at December 31, 2018, as
previously reported 944 – 69 82 191 – 4 452 78 614 78 78 692
Impact of change in accounting policies 3 3 3
Restated equity at January 1, 2019 944 – 69 82 194 – 4 452 78 617 78 78 695
Net income 11 732 11 732 5 11 737
Other comprehensive income 8 – 94 – 113 – 207 – 3 – 210
Total comprehensive income 11 638 – 113 11 525 2 11 527
Dividends 18.1 – 6 645 – 6 645 – 6 645
Dividend in kind to effect the
spin-off of Alcon Inc. 2 – 23 434 – 23 434 – 23 434
Purchase of treasury shares 18.2 – 31 – 5 480 – 5 511 – 5 511
Reduction of share capital 18 – 8 12 – 4
Exercise of options and employee transactions 18.2 3 207 210 210
Equity-based compensation 18.2 5 828 833 833
Shares delivered to Alcon employees
as a result of the Alcon spin-off 18.2 18 18 18
Taxes on treasury share transactions – 189 – 189 – 189
Decrease of treasury share repurchase
obligation under a share buyback trading plan 18.3 284 284 284
Transaction costs, net of taxes 18.8 – 253 – 253 – 253
Fair value adjustments on financial assets sold 8 95 – 95
Impact of change in ownership of consolidated entities 18.5 – 3 – 3 – 2 – 5
Changes in non-controlling interests 18.6 – 1 – 1
Fair value adjustments related to divestments 8 – 3 3
Other movements 18.7 22 22 22
Total of other equity movements – 8 – 11 – 34 557 – 92 – 34 668 – 3 – 34 671
Total equity at December 31, 2019 936 – 80 59 275 – 4 657 55 474 77 55 551
Net income 8 072 8 072 – 1 8 071
Other comprehensive income 8 – 56 3 387 3 331 – 1 3 330
Total comprehensive income 8 016 3 387 11 403 – 2 11 401
Dividends 18.1 – 6 987 – 6 987 – 6 987
Purchase of treasury shares 18.2 – 18 – 3 038 – 3 056 – 3 056
Reduction of share capital 18 – 23 31 – 8
Exercise of options and employee transactions 18.2 8 798 806 806
Repurchase of options 18.4 – 89 – 89 – 89
Equity-based compensation 18.2 6 724 730 730
Shares delivered to Alcon employees
as a result of the Alcon spin-off 18.2 0 30 30 30
Taxes on treasury share transactions 32 32 32
Increase of treasury share repurchase
obligation under a share buyback trading plan 18.3 – 1 769 – 1 769 – 1 769
Fair value adjustments on financial assets sold 8 150 – 150
Fair value adjustments related to divestments 8 – 2 2
Impact of change in ownership of consolidated entities 18.5 7 – 1 6 – 7 – 1
Other movements 18.7 18 18 18
Total of other equity movements – 23 27 – 10 134 – 149 – 10 279 – 7 – 10 286
Total equity at December 31, 2020 913 – 53 57 157 – 1 419 56 598 68 56 666
The accompanying Notes form an integral part of the consolidated financial statements.

Novartis Group consolidated financial statements
F-5
Consolidated statements of cash flows(For the years ended December 31, 2020, 2019 and 2018)
(USD millions) Note 2020 2019 2018
Net income from continuing operations 8 071 7 147 12 800
Adjustments to reconcile net income from continuing operations to
net cash flows from operating activities from continuing operations
Reversal of non-cash items and other adjustments 23.1 9 881 9 122 1 486
Dividends received from associated companies and others 490 463 719
Interest received 47 214 241
Interest paid – 703 – 793 – 816
Other financial receipts 464 28 218
Other financial payments – 39 – 33 – 31
Taxes paid 23.2 – 1 833 – 1 876 – 1 506
Net cash flows from operating activities from continuing operations before
working capital and provision changes 16 378 14 272 13 111
Payments out of provisions and other net cash movements in non-current liabilities – 2 437 – 924 – 638
Change in net current assets and other operating cash flow items 23.3 – 291 199 576
Net cash flows from operating activities from continuing operations 13 650 13 547 13 049
Net cash flows from operating activities from discontinued operations 78 1 223
Total net cash flows from operating activities 13 650 13 625 14 272
Purchases of property, plant and equipment – 1 275 – 1 379 – 1 254
Proceeds from sale of property, plant and equipment 88 857 102
Purchases of intangible assets – 1 310 – 878 – 1 394
Proceeds from sale of intangible assets 380 973 823
Purchases of financial assets – 230 – 302 – 205
Proceeds from sale of financial assets 723 1 152 165
Purchases of other non-current assets – 61 – 60 – 39
Proceeds from sale of other non-current assets 2 3 9
Acquisitions and divestments of interests in associated companies, net 23.4 – 7 – 6 12 854
Acquisitions and divestments of businesses, net 23.5 – 9 957 – 3 760 – 13 683
Purchases of marketable securities and commodities – 1 900 – 228 – 2 440
Proceeds from sale of marketable securities and commodities 492 2 561 472
Net cash flows used in investing activities from continuing operations – 13 055 – 1 067 – 4 590
Net cash flows used in investing activities from discontinued operations 30 – 127 – 1 159 – 1 001
Total net cash flows used in investing activities – 13 182 – 2 226 – 5 591
Dividends paid to shareholders of Novartis AG – 6 987 – 6 645 – 6 966
Acquisitions of treasury shares – 2 842 – 5 533 – 2 036
Proceeds from exercised options and other treasury share transactions, net 748 201 700
Increase in non-current financial debts 23.6 7 126 93 2 856
Repayments of non-current financial debts 23.6 – 2 003 – 3 195 – 366
Change in current financial debts 23.6 2 261 – 1 582 1 687
Payments of lease liabilities, net 23.6 – 312 – 273
Impact of change in ownership of consolidated entities – 2 – 6 – 19
Other financing cash flows, net – 147 56 67
Net cash flows used in financing activities from continuing operations – 2 158 – 16 884 – 4 077
Net cash flows used in/from financing activities from discontinued operations 30 – 50 3 257 – 167
Total net cash flows used in financing activities – 2 208 – 13 627 – 4 244
Net change in cash and cash equivalents before effect of exchange
rate changes – 1 740 – 2 228 4 437
Effect of exchange rate changes on cash and cash equivalents 286 69 – 26
Total net change in cash and cash equivalents – 1 454 – 2 159 4 411
Cash and cash equivalents at January 1 11 112 13 271 8 860
Cash and cash equivalents at December 31 9 658 11 112 13 271
The accompanying Notes form an integral part of the consolidated financial statements.

Notes to the Novartis Group consolidated financial statements
F-6
Notes to the Novartis Group consolidated financial statements1. Significant accounting policiesThe Novartis Group (Novartis or Group) is a multinational group of companies specializing in the research, devel-opment, manufacturing and marketing of a broad range of innovative pharmaceuticals and cost-saving generic medicines. The Group is headquartered in Basel, Swit-zerland.
The consolidated financial statements of the Group are prepared in accordance with International Financial Reporting Standards (IFRS) as issued by the Interna-tional Accounting Standards Board (IASB). They are pre-pared in accordance with the historical cost convention, except for items that are required to be accounted for at fair value.
The Group’s financial year-end is December 31, which is also the annual closing date of the individual entities’ financial statements incorporated into the Group’s con-solidated financial statements.
The preparation of financial statements requires management to make certain estimates and assump-tions, either at the balance sheet date or during the year, which affect the reported amounts of revenues, expenses, assets, liabilities and contingent amounts.
Estimates are based on historical experience and other assumptions that are considered reasonable under the given circumstances and are regularly monitored. Actual outcomes and results could differ from those esti-mates and assumptions. Revisions to estimates are rec-ognized in the period in which the estimate is revised.
Listed below are accounting policies of significance to Novartis or, in cases where IFRS provides alternatives, the option adopted by Novartis.
Scope of consolidation
The consolidated financial statements include all enti-ties, including structured entities, over which Novartis AG, Basel, Switzerland, directly or indirectly has control (generally as a result of owning more than 50% of the entity’s voting interest). Consolidated entities are also referred to as “subsidiaries.”
In cases where Novartis does not fully own a subsid-iary, it has elected to value any remaining outstanding non-controlling interest at the time of acquiring control of the subsidiary at its proportionate share of the fair value of the net identified assets.
The contribution of a business to an associate or joint venture is accounted for by applying the option under IFRS that permits the accounting for the retained inter-est of the business contributed at its net book value at the time of the contribution.
Investments in associated companies (generally defined as investments in entities in which Novartis holds between 20% and 50% of voting shares or over which it otherwise has significant influence) and joint ventures
are accounted for using the equity method, except for selected venture fund investments for which the Group has elected to apply the method of fair value through the consolidated income statement.
Foreign currencies
The consolidated financial statements of Novartis are presented in US dollars (USD). The functional currency of subsidiaries is generally the local currency of the respective entity. The functional currency used for the reporting of certain Swiss and foreign finance entities is USD instead of their respective local currencies. This reflects the fact that the cash flows and transactions of these entities are primarily denominated in these curren-cies.
For subsidiaries not operating in hyperinflationary economies, the subsidiary’s results, financial position and cash flows that do not have USD as their functional currency are translated into USD using the following exchange rates:• Income, expense and cash flows using for each month
the average exchange rate, with the US dollar values for each month being aggregated during the year
• Balance sheets using year-end exchange rates• Resulting exchange rate differences are recognized in
other comprehensive income
For subsidiaries operating in hyperinflationary econo-mies, the impact of the restatement of the non-monetary assets and liabilities with the general price index at the beginning of the period is recorded in retained earnings in equity. The subsequent gains or losses resulting from the restatement of non-monetary assets are recorded in “Other financial income and expense” in the consoli-dated income statement.
Non-current assets held for sale or held for distribution to ownersNon-current assets are accounted for as assets held for sale or related to discontinued operations when their carrying amount is to be recovered principally through a sale transaction or distribution to owners and a sale or distribution to owners is considered highly probable. They are stated at the lower of carrying amount and fair value less costs to sell with any resulting impairment rec-ognized. Assets related to discontinued operations and assets of disposal group held for sale are not depreci-ated or amortized. The prior year consolidated balance sheet is not restated.
If in a subsequent period, the criteria for classifica-tion as held for sale are no longer met, the recoverable amount of assets and liabilities are reclassified out of

Notes to the Novartis Group consolidated financial statements
F-7
assets held for sale into the respective balance sheet lines, prior year consolidated balance sheet is not restated. The cumulative amount of depreciation and amortization not recorded since the date of their classi-fication to assets held for sale, and any required adjust-ments to the recoverable amounts of assets are recog-nized in the consolidated income statement.
Distribution of Alcon Inc. to Novartis AG shareholders During the first quarter of 2019, at the Annual General Meeting (AGM) of Novartis AG shareholders, held on February 28, 2019, the Novartis AG shareholders approved a special distribution by way of a dividend in kind to effect the spin-off of Alcon Inc.
The February 28, 2019, shareholder approval for the spin-off required the Alcon Division and selected por-tions of corporate activities attributable to Alcon’s busi-ness (the “Alcon business”) to be reported as discontin-ued operations.
The shareholder approval to spin off the Alcon busi-ness also required the recognition of a distribution liabil-ity at the fair value of the Alcon business. The Group elected to measure the distribution liability at the fair value of the Alcon business net assets taken as a whole. The distribution liability was recognized through a reduc-tion in retained earnings. It was required to be adjusted at each balance sheet date for changes in its estimated fair value, up to the date of the distribution to sharehold-ers through retained earnings. Any resulting impairment of the business assets to be distributed would have been recognized in the consolidated income statements in “Other expense” of discontinued operations, at the date of initial recognition of the distribution liability or at sub-sequent dates resulting from changes of the distribution liability valuation. At the April 8, 2019 distribution settle-ment date, the resulting gain, which was measured as the excess amount of the distribution liability over the then-carrying value of the net assets of the business dis-tributed, was recognized on the line “Gain on distribution of Alcon Inc. to Novartis AG shareholders” in the income statement of discontinued operations.
The recognition of the distribution liability required the use of valuation techniques for purposes of impair-ment testing of the Alcon business’ assets to be distrib-uted and for the measurement of the fair value of the dis-tribution liability. These valuations required the use of management assumptions and estimates related to the Alcon business’ future cash flows, market multiples to estimate day one market value, and control premiums to apply in estimating the Alcon business fair value. These fair value measurements were classified as “Level 3” in the fair value hierarchy. The section “—Impairment of goodwill and intangible assets” in this Note 1 provides additional information on key assumptions that are highly sensitive in the estimation of fair values using valuation techniques.
Transaction costs that were directly attributable to the distribution (spin-off) of Alcon to the Novartis share-holders, and that would otherwise have been avoided, were recorded as a deduction from equity.
For additional disclosures, refer to “Note 2. Signifi-cant transactions—Significant transactions in 2019—Completion of the spin-off of the Alcon business through a dividend in kind distribution to Novartis AG sharehold-ers,” and “Note 30. Discontinued operations.”
Acquisition of assets and businesses
Assets separately acquired are recorded at cost, which includes the purchase price and any directly attributable costs for bringing the asset into the condition to operate as intended. Expected costs for obligations to disman-tle and remove property, plant and equipment when they are no longer used are included in their cost.
Acquired businesses are accounted for using the acquisition method, unless the optional concentration test is applied. The optional concentration test allows for the election on a transaction-by-transaction basis to account for the acquired business as an asset separately acquired when substantially all of the fair value of the gross assets acquired is concentrated in a single iden-tifiable asset or group of similar identifiable assets.
The acquisition method requires that the assets acquired and liabilities assumed be recorded at their respective fair values on the date the Group obtains con-trol. The excess of the fair value of the total purchase consideration transferred and the fair value of the acquired assets and assumed liabilities is recognized as goodwill. The related valuations are based on informa-tion available at the acquisition date. Acquisition related costs are expensed as incurred.
The application of the acquisition method requires certain estimates and assumptions to be made, espe-cially concerning the fair values of the acquired intangi-ble assets, inventories, property, plant and equipment and the liabilities assumed at the acquisition date, and the useful lives of the intangible assets and property, plant and equipment. Estimates of fair value require the use of valuation techniques. These valuations require the use of management assumptions and estimates, includ-ing value of comparable assets in the market, amount and timing of future cash flows, outcomes and costs of research and development activities, probability of obtaining regulatory approval, long-term sales forecasts, actions of competitors, discount rates and terminal growth rates. The section “—Impairment of goodwill and intangible assets” in this Note 1 provides additional infor-mation on key assumptions that are highly sensitive in the estimation of fair values using valuation techniques.
Property, plant and equipment
Property, plant and equipment are depreciated on a straight-line basis in the consolidated income statement over their estimated useful lives. Freehold land is not depreciated. The related depreciation expense is included in the costs of the functions using the asset.
Property, plant and equipment are assessed for impairment whenever there is an indication that the balance sheet carrying amount may not be recoverable using cash flow projections for the useful life.

Notes to the Novartis Group consolidated financial statements
F-8
The following table shows the respective useful lives for property, plant and equipment:
Useful life
Buildings 20 to 40 years
Machinery and other equipment
Machinery and equipment 7 to 20 years
Furniture and vehicles 5 to 10 years
Computer hardware 3 to 7 years
Government grants obtained for construction activities, including any related equipment, are deducted from the gross acquisition cost to arrive at the balance sheet car-rying value of the related assets.
Leases and right-of-use assets
From January 1, 2019, with the adoption of IFRS 16 Leases, the Group adopted the following accounting pol-icies for leases and right-of-use assets:
As lessee, the Group assesses whether a contract contains a lease at inception of a contract and upon the modification of a contract. The Group elected to allocate the consideration in the contract to the lease and non-lease components on the basis of the relative standalone price.
The Group recognizes a right-of-use asset and a cor-responding lease liability for all arrangements in which it is a lessee, except for leases with a term of 12 months or less (short-term leases) and low-value leases. For these short-term and low-value leases, the Group rec-ognizes the lease payments as an operating expense on a straight-line basis over the term of the lease.
The lease liability is initially measured at the present value of the future lease payments as from the com-mencement date of the lease to the end of the lease term. The lease term includes the period of any lease exten-sion that in management’s assessment is highly proba-ble to be exercised by the Group. The lease payments are discounted using the interest rate implicit in the lease or, if not readily determinable, the Novartis incremental borrowing rate for the asset subject to the lease in the respective markets.
The Group remeasures the lease liability (and makes a corresponding adjustment to the related right-of-use asset) whenever there is a change to the lease terms or expected payments under the lease, or a modification that is not accounted for as a separate lease.
The portion of the lease payments attributable to the repayment of lease liabilities is recognized in cash flows used in financing activities, and the portion attributable to the payment of interest is included in cash flows from operating activities.
Right-of-use assets are initially recognized on the bal-ance sheet at cost, which comprises the amount of the initial measurement of the corresponding lease liability, adjusted for any lease payments made at or prior to the commencement date of the lease, any lease incentive received and any initial direct costs incurred by Novartis, and expected costs for obligations to dismantle and remove right-of-use assets when they are no longer used.
Right-of-use assets are depreciated on a straight-line basis from the commencement date of the lease over the shorter of the useful life of the right-of-use asset or the end of the lease term.
Right-of-use assets are assessed for impairment whenever there is an indication that the balance sheet carrying amount may not be recoverable using cash flow projections for the useful life.
In arrangements where the Group is the lessor, it determines at lease inception whether the lease is a finance lease or an operating lease. Leases that trans-fer substantially all of the risk and rewards incidental to ownership of the underlying asset to the counterparty (the lessee) are accounted for as finance leases. Leases that do not transfer substantially all of the risks and rewards of ownership are accounted for as operating leases. Lease payments received under operating leases are recognized on a straight-line basis over the lease term in the consolidated income statement in either “net sales” or “other income,” depending on the nature of and underlying asset to the lease arrangement.
Prior to January 1, 2019, the Group applied the following accounting policies for leases:
Leases that transferred substantially all of the risks and rewards of ownership were recognized as finance leases, with the leased asset measured initially at an amount equal to the lower of their fair value and the pres-ent value of the minimum lease payments. Minimum lease payments were the payments over the lease term that the Group, as leasee, was required to make, excluding contingent rent. The underlying asset was accounted for in accordance with the accounting policy applicable to that asset.
Leases that did not transfer substantially all of the risks and rewards of ownership were accounted for as operating leases and were not recognized in the consol-idated balance sheet. Payments made under operating leases were recognized in the consolidated income statement on a straight-line basis over the term of the lease. Lease incentives received were deferred and rec-ognized as a component of lease expense over the term of the lease. The future undiscounted lease payments under operating leases were disclosed as commitments in the notes to the consolidated financial statements.
Lessor accounting policies were not substantially dif-ferent from those applied upon the adoption of IFRS 16 Leases, as described above.
The section “—Impact of adopting significant new IFRS standards in 2019” in this Note 1 provides additional dis-closures on the impact of adoption of IFRS 16 Leases.
Goodwill and intangible assets
GoodwillGoodwill arises in the acquisition of a business when applying the acquisition method and is the excess of the fair value of the consideration transferred to acquire a business over the underlying fair value of the net identi-fied assets acquired. It is allocated to groups of cash-gen-erating units (CGUs), which are usually represented by the reported segments. Goodwill is tested for impairment

Notes to the Novartis Group consolidated financial statements
F-9
annually at the level of these groups of CGUs, and any impairment charges are recorded under “Other expense” in the consolidated income statement.
Intangible assets available for useNovartis has the following classes of available for use intangible assets: currently marketed products; technol-ogies; other intangible assets (including computer soft-ware).
Currently marketed products represent the compos-ite value of acquired intellectual property (IP), patents, distribution rights and product trade names.
Technologies represent identified and separable acquired know-how used in the research, development and production processes.
Significant investments in internally developed and acquired computer software are capitalized and included in the “Other” category, and amortized once available for use.
Intangible assets available for use with a definite use-ful life are amortized over their estimated useful lives on a straight-line basis and are evaluated for potential impairment whenever facts and circumstances indicate that their carrying value may not be recoverable.
The following table shows the respective useful lives for intangible assets available for use and the location in the consolidated income statement in which the respec-tive amortization and any potential impairment charge is recognized:
Income statement location
for amortization and
Useful life impairment charges
Currently marketed products 5 to 20 years “Cost of goods sold”
Technologies 10 to 20 years “Cost of goods sold”
or “Research
and development”
Other (including 3 to 7 years In the respective
computer software) functional expense
Intangible assets not yet available for useAcquired research and development intangible assets that are still under development and have accordingly not yet obtained marketing approval are recognized as in-process research and development (IPR&D).
IPR&D is not amortized, but is evaluated for potential impairment on an annual basis or when facts and circum-stances warrant. Any impairment charge is recorded in the consolidated income statement under “Research and development.” Once a project included in IPR&D has been successfully developed, it is transferred to the “Currently marketed products” category.
Impairment of goodwill and intangible assetsAn asset is considered impaired when its balance sheet carrying amount exceeds its estimated recoverable amount, which is defined as the higher of its fair value less costs of disposal and its value in use. Usually, Novartis applies the fair value less costs of disposal method for its impairment assessment. In most cases,
no directly observable market inputs are available to measure the fair value less costs of disposal. Therefore, an estimate is derived indirectly and is based on net pres-ent value techniques utilizing post-tax cash flows and discount rates. In the limited cases where the value-in-use method would be applied, net present value tech-niques would be applied using pre-tax cash flows and discount rates.
Fair value less costs of disposal reflects estimates of assumptions that market participants would be expected to use when pricing the asset or CGUs, and for this pur-pose, management considers the range of economic conditions that are expected to exist over the remaining useful life of the asset.
The estimates used in calculating the net present val-ues are highly sensitive and depend on assumptions spe-cific to the nature of the Group’s activities with regard to:• Amount and timing of projected future cash flows• Long-term sales forecasts • Actions of competitors (launch of competing products,
marketing initiatives, etc.)• Sales erosion rates after the end of patent or other
intellectual property rights protection, and timing of the entry of generic competition
• Outcome of research and development activities (com-pound efficacy, results of clinical trials, etc.)
• Amount and timing of projected costs to develop IPR&D into commercially viable products
• Profit margins• Probability of obtaining regulatory approval• Future tax rate• Appropriate terminal growth rate• Appropriate discount rate
Generally, for intangible assets with a definite useful life, Novartis uses cash flow projections for the whole useful life of these assets. For goodwill, Novartis generally uti-lizes cash flow projections for a five-year period based on management forecasts, with a terminal value based on cash flow projections usually in line with inflation rates for later periods. Probability-weighted scenarios are typically used.
Discount rates used consider the Group’s estimated weighted average cost of capital, adjusted for specific asset, country and currency risks associated with cash flow projections, to approximate the discount rate that market participants would use to value the asset.
Due to the above factors, actual cash flows and val-ues could vary significantly from forecasted future cash flows and related values derived using discounting tech-niques.
Impairment of associated companies accounted for at equityNovartis considers investments in associated compa-nies for impairment evaluation whenever objective evi-dence indicates the net investment may be impaired, including when a quoted share price indicates a fair value less than the per-share balance sheet carrying value for the investment.

Notes to the Novartis Group consolidated financial statements
F-10
If the recoverable amount of the investment is esti-mated to be lower than the balance sheet carrying amount, an impairment charge is recognized for the dif-ference in the consolidated income statement under “Income from associated companies.”
Cash and cash equivalents
Cash and cash equivalents include highly liquid invest-ments with original maturities of three months or less, which are readily convertible to known amounts of cash. Bank overdrafts are usually presented within current financial debts on the consolidated balance sheet, except in cases where a right of offset has been agreed with a bank, which then allows for presentation on a net basis.
Marketable securities, commodities and non-current financial assets Commodities, which include gold bullion or coins, are valued at the lower of cost or fair value using current market prices. The changes in fair value below cost are immediately recorded in “Other financial income and expense.”
Marketable securities are financial assets held for short-term purposes which are principally traded in liq-uid markets and are classified within current assets on the consolidated balance sheet. The financial impacts related to these financial assets are recorded in “Other financial income and expense” in the consolidated income statement. Non-current financial assets held for long-term strategic purposes are classified within non-current assets on the consolidated balance sheet. The financial impacts related to these financial assets are recorded in “Other income” and “Other expense” in the consolidated income statement.
Marketable securities and non-current financial assets are initially recorded at fair value on their trade date, which is different from the settlement date when the transaction is ultimately effected. Quoted securities are remeasured at each reporting date to fair value based on current market prices. If the market for a financial asset is not active or no market is available, fair values are established using valuation techniques. The major-ity of non-quoted investments are valued initially at fair value through the established purchase price between a willing buyer and seller. Non-quoted investments are subsequently adjusted based on values derived from dis-counted cash flow analysis or other pricing models. These investment values are classified as “Level 3” in the fair value hierarchy.
The Group classifies and accounts for its marketable securities and non-current financial assets in the follow-ing categories:• Debt securities are valued at fair value through other
comprehensive income with subsequent recycling into the consolidated income statement, as they meet both the “solely payment of principal and interest” and the business model criteria. Unrealized gains and losses, except exchange gains and losses, are recorded as a fair value adjustment in the consolidated statement of
comprehensive income. They are recognized in the consolidated income statement when the debt instru-ment is sold, at which time the gain is transferred to “Other financial income and expense.” Exchange gains and losses related to debt instruments are immediately recognized in the consolidated income statement to “Other financial income and expense.”
• Fund investments and equity securities of the Novartis venture fund are valued at fair value through profit and loss (FVPL). Unrealized gains and losses, including exchange gains and losses, are recognized in the con-solidated income statement to “Other income” for gains and “Other expense” for losses.
• Equity securities held as strategic investments, typi-cally held outside of the Novartis venture fund, are gen-erally designated at the date of acquisition as financial assets valued at fair value through other comprehen-sive income with no subsequent recycling through profit and loss. Unrealized gains and losses, including exchange gains and losses, are recorded as a fair value adjustment in the consolidated statement of compre-hensive income. They are reclassified to retained earn-ings when the equity security is sold. If these equity securities are not designated at the date of acquisition as financial assets valued at fair value through other comprehensive income, they are valued at FVPL, as described above.
• Other non-current financial assets, such as loans and long-term receivables from customers, advances and other deposits, are valued at amortized cost, which reflects the time value of money less any allowances for expected credit losses.
The Group assesses on a forward-looking basis the expected credit losses associated with its debt securi-ties valued at fair value through other comprehensive income. Impairments on debt securities are recorded in “Other financial income and expense.”
For other financial assets valued at amortized cost, impairments, which are based on their expected credit losses, and exchange rate losses are included in “Other expense” in the consolidated income statement. Exchange rate gains and interest income, using the effec-tive interest rate method, are included in “Other income” or “Other financial income” in the consolidated income statement, depending on the nature of the item.
Derivative financial instruments
Derivative financial instruments are initially recognized in the balance sheet at fair value and are remeasured to their current fair value at the end of each subsequent reporting period. The valuation of a forward exchange rate contract is based on the discounted cash flow model, using interest curves and spot rates at the report-ing date as observable inputs.
Options are valued based on a modified Black-Scholes model using volatility and exercise prices as major observable inputs.
The Group utilizes derivative financial instruments for the purpose of hedging to reduce the volatility in the Group’s performance due to the exposure to various business related risks. To mitigate these risks, the Group

Notes to the Novartis Group consolidated financial statements
F-11
enters into certain derivative financial instruments. The risk reduction is obtained because the derivative’s value or cash flows are expected, wholly or partly, to offset changes in the value or cash flows of the recognized assets or liabilities. The overall strategy is aiming to mit-igate the currency and interest rate risk of positions that are contractually agreed, and to partially mitigate the exposure risk of selected anticipated transactions.
Certain derivative financial instruments meet the criteria for hedge accounting treatment. A prerequisite for obtaining this accounting-hedge relationship is exten-sive documentation on inception and proving on a regu-lar basis that the economic hedge is effective for account-ing purposes. Other derivative financial instruments do not meet the criteria to qualify for hedge accounting. Changes in the fair value of these derivative instruments are recognized immediately in “Other financial income and expense” in the consolidated income statement.
In addition, the Group has designated certain long-term debt components as hedges of the translation risk arising on certain net investments in foreign operations. On consolidation, foreign currency differences arising on long-term debt designated as net investment hedges of a foreign operation are recognized in other compre-hensive income and accumulated in currency translation effects, to the extent that the hedge is effective. The for-eign currency differences arising from hedge ineffective-ness are recognized in the income statement in “Other financial income and expense.”
When a hedged net investment is disposed of, the proportionate portion of the cumulative amount recog-nized in equity in relation to the hedged net investment is transferred to the consolidated income statement as an adjustment to the gain or loss on disposal.
Inventories
Inventory is valued at the lower of acquisition or produc-tion cost determined on a first-in, first-out basis and net realizable value. This value is used for the “Cost of goods sold” in the consolidated income statement. Unsaleable inventory is fully written off in the consolidated income statement under “Cost of goods sold.”
Trade receivables
Trade receivables are initially recognized at their invoiced amounts, including any related sales taxes less adjust-ments for estimated revenue deductions such as rebates, chargebacks and cash discounts.
The provisions for doubtful trade receivables are established using an expected credit loss model (ECL). The provisions are based on a forward-looking ECL, which includes possible default events on the trade receivables over the entire holding period of the trade receivable. These provisions represent the difference between the trade receivable’s carrying amount in the consolidated balance sheet and the estimated collect-ible amount. Charges for doubtful trade receivables are recorded as marketing and selling costs recognized in the consolidated income statement within “Selling, gen-eral and administration” expenses.
Legal and environmental liabilities
Novartis and its subsidiaries are subject to contingen-cies arising in the ordinary course of business, such as patent litigation, environmental remediation liabilities and other product-related litigation, commercial litigation, and governmental investigations and proceedings. Provisions are recorded where a reliable estimate can be made of the probable outcome of legal or other dis-putes against the subsidiary.
Contingent consideration
In an acquisition or a divestment of a business, it is nec-essary to recognize contingent future amounts due to previous owners, representing contractually defined potential amounts as a liability or an asset. Usually for Novartis, these are linked to milestone or royalty pay-ments related to certain assets and are recognized as a financial liability or financial asset at fair value, which is then remeasured at each subsequent reporting date. These estimations typically depend on factors such as technical milestones or market performance, and are adjusted for the probability of their likelihood of payment, and are appropriately discounted to reflect the impact of time.
Changes in the fair value of contingent consideration liabilities in subsequent periods are recognized in the consolidated income statement in “Cost of goods sold” for currently marketed products and in “Research and development” for IPR&D. Changes in contingent consid-eration assets are recognized in “Other income” or “Other expense,” depending on their nature.
The effect of unwinding the discount over time is rec-ognized for contingent liabilities in “Interest expense” and for contingent assets as interest income recognized in the consolidated income statement within “Other financial income and expense.”
Defined benefit pension plans and other post-employment benefitsThe liability in respect of defined benefit pension plans and other post-employment benefits is the defined ben-efit obligation calculated annually by independent actu-aries using the projected unit credit method. The current service cost for such post- employment benefit plans is included in the personnel expenses of the various func-tions in which associates are employed, while the net interest on the net defined benefit liability or asset is recognized as “Other expense” or “Other income.”
Treasury shares
Treasury shares are initially recorded at fair value on their trade date, which is different from the settlement date, when the transaction is ultimately effected. Treasury shares are deducted from consolidated equity at their nominal value of CHF 0.50 per share. Differences between the nominal amount and the transaction price on purchases or sales of treasury shares with third par-

Notes to the Novartis Group consolidated financial statements
F-12
ties, or the value of services received for the shares allo-cated to associates as part of share-based compensa-tion arrangements, are recorded in “Retained earnings” in the consolidated statement of changes in equity.
Revenue recognition
Revenue on the sale of Novartis Group products and ser-vices, which is recorded as “Net sales” in the consoli-dated income statement, is recognized when a contrac-tual promise to a customer (performance obligation) has been fulfilled by transferring control over the promised goods and services to the customer, substantially all of which is at the point in time of shipment to or receipt of the products by the customer or when the services are performed. If contracts contain customer acceptance provisions, revenue is recognized upon the satisfaction of the acceptance criteria. If products are stockpiled at the request of the customer, revenue is only recognized once the products have been inspected and accepted by the customer, and there is no right of return or replen-ishment on product expiry. The amount of revenue rec-ognized is based on the consideration Novartis expects to receive in exchange for its goods and services, when it is highly probable that a significant reversal will not occur. If a contract contains more than one performance obligation, the consideration is allocated based on the standalone selling price of each performance obligation.
The consideration Novartis receives in exchange for its goods or services may be fixed or variable. Variable consideration is only recognized when it is highly prob-able that a significant reversal will not occur. The most common elements of variable consideration are listed below.• Rebates and discounts granted to government agen-
cies, wholesalers, retail pharmacies, managed health-care organizations and other customers, as well as chargebacks are provisioned and recorded as a reve-nue deduction at the time the related revenues are recorded or when the incentives are offered. They are calculated on the basis of historical experience, regu-lations, the specific terms in the individual agreements, product pricing and the mix of products, contracts, channels and payors.
• Refunds granted to healthcare providers under innovative pay-for-performance agreements (i.e., out-come based arrangements) are provisioned and recorded as a revenue deduction at the time the related sales are recorded. They are calculated on the basis of historical experience and clinical data available for the product, as well as the specific terms in the indi-vidual agreements. In cases where historical experi-ence and clinical data are not sufficient for a reliable estimation of the outcome, revenue recognition is deferred until the uncertainty is resolved or until such history is available.
• Cash discounts are offered to customers to encourage prompt payment and are provisioned and recorded as revenue deductions at the time the related sales are recorded.
• Shelf stock adjustments are generally granted to cus-tomers, primarily of the Sandoz Division, to cover the inventory held by them at the time a price decline
becomes effective. Revenue deduction provisions for shelf stock adjustments are recorded when the price decline is anticipated, based on the impact of the price decline on the customer’s estimated inventory levels.
• Sales returns provisions are recognized and recorded as revenue deductions when there is historical expe-rience of Novartis agreeing to customer returns and Novartis can reasonably estimate expected future returns. In doing so, the estimated rate of return is applied, determined on the basis of historical experi-ence of customer returns and considering any other relevant factors. This is applied to the amounts invoiced, also considering the amount of returned products to be destroyed versus products that can be placed back in inventory for resale. Where shipments are made on a resale or return basis, without sufficient historical experience for estimating sales returns, revenue is only recorded when there is evidence of consumption or when the right of return has expired.
Net sales and provisions for revenue deductions are adjusted to actual amounts as rebates, refunds, dis-counts and returns are processed. The provision rep-resents estimates of the related obligations, requiring the use of judgment when estimating the effect of these sales deductions.
“Other revenue” includes income from profit-sharing arrangements with our collaboration partners, and roy-alty and milestone income from the out-licensing of intel-lectual property when Novartis retains an interest in the intellectual property through a license. Royalty income earned through a license is recognized when the under-lying sales have occurred. Milestone income is recog-nized at the point in time when it is highly probable that the relevant milestone event criteria are met, and the risk of reversal of revenue recognition is remote. Other rev-enue also includes revenue from activities such as man-ufacturing or other services rendered, to the extent such revenue is not recorded under net sales, and is recog-nized when control transfers to the third party and our performance obligations are satisfied.
Research and development
Internal research and development (R&D) costs are fully charged to “Research and development” in the consol-idated income statement in the period in which they are incurred. The Group considers that regulatory and other uncertainties inherent in the development of new prod-ucts preclude the capitalization of internal development expenses as an intangible asset until marketing approval from a regulatory authority is obtained in a major market such as the United States, the European Union, Switzer-land or Japan.
Payments made to third parties, such as contract research and development organizations in compensa-tion for subcontracted R&D, that are deemed not to transfer intellectual property to Novartis are expensed as internal R&D expenses in the period in which they are incurred. Such payments are only capitalized if they meet the criteria for recognition of an internally generated intangible asset, usually when marketing approval has

Notes to the Novartis Group consolidated financial statements
F-13
been achieved from a regulatory authority in a major mar-ket.
Payments made to third parties to in-license or acquire intellectual property rights, compounds and products, including initial upfront and subsequent mile-stone payments, are capitalized, as are payments for other assets, such as technologies to be used in R&D activities. If additional payments are made to the origi-nator company to continue to perform R&D activities, an evaluation is made as to the nature of the payments. Such additional payments will be expensed if they are deemed to be compensation for subcontracted R&D services not resulting in an additional transfer of intellectual property rights to Novartis. Such additional payments will be cap-italized if they are deemed to be compensation for the transfer to Novartis of additional intellectual property developed at the risk of the originator company. Subse-quent internal R&D costs in relation to IPR&D and other assets are expensed, since the technical feasibility of the internal R&D activity can only be demonstrated by the receipt of marketing approval for a related product from a regulatory authority in a major market.
Costs for post-approval studies performed to sup-port the continued registration of a marketed product are recognized as marketing expenses. Costs for activ-ities that are required by regulatory authorities as a con-dition for obtaining marketing approval are capitalized and recognized as currently marketed products.
Inventory produced ahead of regulatory approval is fully provisioned, and the charge is included in “Other expense” in the consolidated income statement, as its ultimate use cannot be assured. If this inventory can be subsequently sold, the provision is released to “Other income” in the consolidated income statement, either on approval by the appropriate regulatory authority or, exceptionally in Europe, on recommendation by the Committee for Medicinal Products for Human Use (CHMP), if approval is virtually certain.
Share-based compensation
Vested Novartis shares and American Depositary Receipts (ADRs) that are granted as compensation are valued at their market value on the grant date and are immediately expensed in the consolidated income state-ment.
The fair values of unvested restricted shares (RSs), restricted share units (RSUs) and performance share units (PSUs) in Novartis shares and ADRs granted to associates as compensation are recognized as an expense over the related vesting period. The expense recorded in the consolidated income statement is included in the personnel expenses of the various func-tions in which the associates are employed.
Unvested restricted shares, restricted ADRs and RSUs are only conditional on the provision of services by the plan participant during the vesting period. They are valued at fair value on the grant date. As RSUs do not entitle the holder to dividends, the fair value is based on the Novartis share price at the grant date adjusted for the net present value of the dividends expected to be paid during the holding period. The fair value of these grants, after making adjustments for assumptions related
to forfeiture during the vesting period, is expensed on a straight-line basis over the respective vesting period.
PSUs are subject to the achievement of certain per-formance criteria during the vesting period and require plan participants to provide services during this period. The following paragraphs provide an overview of the accounting policies for the share-based compensation plans that grant PSUs.
For PSUs granted under plans that are subject to per-formance criteria based on Novartis internal perfor-mance metrics and that are conditional on the provision of service by plan participants during the vesting period, the expense is recognized on a straight-line basis over the vesting period, and is determined based on assump-tions concerning the expected performance against the internal performance metrics throughout the vesting period. The assumptions are based on the Group’s tar-gets for those performance metrics, and the expected forfeitures due to plan participants not meeting their ser-vice conditions. The assumptions are periodically adjusted over the vesting period. Any change in esti-mates for past services is recorded immediately as an expense or income in the consolidated income state-ment, and amounts for the remaining vesting period are expensed on a straight-line basis. As a result, at the end of the vesting period, the charge during the entire vest-ing period represents the amount that will finally vest. The number of equity instruments that finally vest is determined at the vesting date.
For PSUs granted under plans that are subject to per-formance criteria based on variables that can be observed in the market, which for Novartis plans is the Novartis total shareholder return (TSR) relative to a spe-cific peer group of companies over the vesting period, and that are conditional on the provision of services by the plan participants during the vesting period, the expense is recognized on a straight-line basis over the vesting period, and is determined based on the total fair value of the grant over the vesting period. IFRS requires that these variables that can be observed in the market are taken into account in determining the fair value of the PSUs at the grant date. Novartis determined the fair value of these PSUs at the date of grant using a Monte Carlo simulation model. Adjustments to the number of equity instruments granted are only made if a plan participant does not fulfill the service conditions.
For PSUs granted under plans that are subject to both performance criteria based on Novartis internal perfor-mance metrics and Novartis TSR relative to a specific peer group of companies over the vesting period and that are conditional on the provision of service by plan participants during the vesting period, the expense is recognized on a straight-line basis over the vesting period, and is determined based on a bifurcation into the components based on the performance criteria related to Novartis internal performance metrics and TSR, as described in the paragraphs above.
Measuring the fair values of PSUs granted that include TSR performance criteria requires use of esti-mates. The Monte Carlo simulation used to determine the fair value of the PSUs TSR performance criteria requires the probability of factors related to uncertain future events; the term of the award; the grant price of underlying shares or ADRs; expected volatilities; the
Notes to the Novartis Group consolidated financial statements
F-14
expected correlation matrix of the underlying equity instruments with those of the peer group of companies; and the risk-free interest rate as input parameters.
If a plan participant leaves Novartis for reasons other than retirement, disability or death, then unvested restricted shares, restricted ADRs, RSUs and PSUs are forfeited, unless determined otherwise by the provision of the plan rules or by the Compensation Committee of the Novartis Board of Directors, for example, in connec-tion with a reorganization or divestment.
Government grants
Grants from governments or similar organizations are recognized at their fair value when there is a reasonable assurance that the grant will be received and the Group will comply with all attached conditions.
Government grants received to compensate for cost are deferred and recognized in the consolidated income statement over the period necessary to match them against the related costs that they are intended to com-pensate.
The accounting policy for property, plant and equip-ment describes the treatment of any related grants.
Restructuring charges
Restructuring provisions are recognized for the direct expenditures arising from the restructuring, where the plans are sufficiently detailed and where appropriate communication to those affected has been made.
Charges to increase restructuring provisions are included in “Other expense” in the consolidated income statements. Corresponding releases are recorded in “Other income” in the consolidated income statement.
Healthcare contributions
Healthcare contribution levies and fees under govern-mental programs that require the Group to contribute to a country’s healthcare costs, other than programs described in Revenue recognition in this Note 1, are rec-ognized in Other expense in the consolidated income statement. Provisions for healthcare contributions are adjusted to the actual amounts levied. The provision rep-resents estimates of the related obligations, requiring the use of judgment when estimating the effect of these healthcare contributions.
Taxes
Taxes on income are provided in the same periods as the revenues and expenses to which they relate and include interest and penalties incurred during the period. Deferred taxes are determined using the comprehensive liability method and are calculated on the temporary dif-ferences that arise between the tax base of an asset or liability and its carrying value in the balance sheet pre-pared for consolidation purposes, except for those tem-porary differences related to investments in subsidiaries
and associated companies, where the timing of their reversal can be controlled and it is probable that the dif-ference will not reverse in the foreseeable future. Since the retained earnings are reinvested, withholding or other taxes on eventual distribution of a subsidiary’s retained earnings are only taken into account when a dividend has been planned.
The estimated amounts for current and deferred tax assets or liabilities, including any amounts related to any uncertain tax positions, are based on currently known facts and circumstances. Tax returns are based on an interpretation of tax laws and regulations, and reflect estimates based on these judgments and interpretations. The tax returns are subject to examination by the com-petent taxing authorities, which may result in an assess-ment being made requiring payments of additional tax, interest or penalties. Inherent uncertainties exist in the estimates of the tax positions.
Impact of adopting significant new IFRS standard in 2020The following new IFRS standard has been adopted by Novartis from January 1, 2020:
IFRS 3 Business Combination amendmentsThe IASB issued amendments to IFRS 3 Business Com-binations that revised the definition of a business, which assist entities with the evaluation of when an asset or group of assets acquired should be considered a busi-ness. This amended standard has been applied to trans-actions entered into on or after January 1, 2020. The amended standard allows an entity to apply an optional concentration test, on a transaction-by-transaction basis, to evaluate whether substantially all of the fair value of the gross assets acquired is concentrated in a single identifiable asset or group of similar identifiable assets. If this optional concentration test is met, the set of activities and assets is determined not to be a busi-ness. The adoption of this amended standard on Janu-ary 1, 2020 did not have a significant impact on our con-solidated financial statements and is not expected to have a significant impact in future periods. However, this will depend on the facts and circumstances of future transactions and if the Group decides to apply the optional concentration test in the assessment of whether an acquired set of activities and assets is or is not a busi-ness.
There are no other IFRS standards or interpretations not yet effective that would be expected to have a material impact on the Group.
Impact of adopting significant new IFRS standard in 2019The following new IFRS standard has been adopted by Novartis from January 1, 2019:
IFRS 16 LeasesIFRS 16 Leases substantially changed the financial state-ments, as the majority of leases for which the Group is

Notes to the Novartis Group consolidated financial statements
F-15
the lessee became on-balance sheet liabilities with cor-responding right-of-use assets also recognized on the balance sheet. The lease liability reflects the net pres-ent value of the remaining lease payments, and the right-of-use asset corresponds to the lease liability, adjusted for payments made before the commencement date, lease incentives and other items related to the lease agreement. The standard replaces IAS 17 Leases and related interpretations.
Upon adoption of the new standard, a portion of the annual operating lease costs, which was previously fully recognized as functional expenses, as a component of operating income, is recorded as interest expense. In addition, the portion of the lease payments that rep-resents the reduction of the lease liability is recognized in the cash flow statement as an outflow from financing activities, which was previously fully recognized as an outflow from operating activities. Given the leases involved, these effects are not significant to the consol-idated income statement and consolidated statement of cash flow.
The Group implemented the new standard on Janu-ary 1, 2019, and applied the modified retrospective method, with right-of-use assets measured at an amount equal to the lease liability, adjusted by the amount of the prepaid or accrued lease payments relating to those leases recognized in the balance sheet immediately before the date of initial application and did not restate prior years.
Results of our impact assessment: The undiscounted operating lease commitments as of December 31, 2018, amounted to USD 3.6 billion. This
includes approximately USD 0.1 billion of leases with a commencement date in 2019, as well as short-term leases and low-value leases that are recognized from January 1, 2019, upon adoption of IFRS 16, on a straight-line basis as expense in profit and loss. This also includes USD 0.2 billion lease commitments related to the Alcon Division, which is attributable to discontinued operation in 2019. For the remaining undiscounted lease commit-ments attributable to continuing operations of USD 3.3 billion, the Group recognized on January 1, 2019, lease liabilities of USD 1.74 billion and right-of-use assets of USD 1.55 billion (after the reclassification of USD 0.1 bil-lion from property, plant and equipment, and net adjust-ments for the USD 0.3 billion recognition of sublease receivables, prepayments, and accrued lease payments recognized as at December 31, 2018). For the lease com-mitments attributable to discontinued operations, the Group recognized on January 1, 2019, lease liabilities and right-of-use assets of USD 0.2 billion. This does not include the discontinued operations right-of-use assets and lease liability on finance lease agreements of USD 75 million and USD 89 million, respectively. There was an insignificant increase to retained earnings upon adop-tion of IFRS 16 of USD 3 million that arose from subleases that were accounted for as operating lease agreements under IAS 17 and are accounted for as finance leases under IFRS 16.
As a lessor, the Group had no significant impact upon adoption.
For additional significant accounting policies applicable to the discontinued operations business see Note 30.
2. Significant transactionsSignificant transactions in 2020
The Group applied the acquisition method of account-ing for businesses acquired, and did not elect to apply the optional concentration test to account for acquired business as an asset separately acquired.
Innovative Medicines – acquisition of The Medicines CompanyOn November 23, 2019, Novartis entered into an agree-ment and plan of merger (the Merger Agreement) with The Medicines Company, a US-based pharmaceutical company headquartered in Parsippany, New Jersey USA. Pursuant to the Merger Agreement, on December 5, 2019, Novartis, through a subsidiary, commenced a ten-der offer to acquire all outstanding shares of The Medicines Company for USD 85 per share, or a total con-sideration of approximately USD 9.6 billion in cash on a fully diluted basis, including the equivalent share value related to The Medicines Company’s convertible notes, in accordance with their terms. The tender offer expired
on January 3, 2020, and on January 6, 2020, the acquir-ing subsidiary merged with and into The Medicines Com-pany, resulting in The Medicines Company becoming an indirect wholly owned subsidiary of Novartis. Novartis financed the transaction through available cash, and short- and long-term borrowings.
The Medicines Company is focused on the develop-ment of inclisiran, a potentially first-in-class, twice yearly therapy that allows administration during patients’ rou-tine visits to their healthcare professionals and will poten-tially contribute to improved patient adherence and sus-tained lower LDL-C levels.
The fair value of the total purchase consideration was USD 9.6 billion. The purchase price allocation resulted in net identifiable assets of approximately USD 7.1 billion, consisting of USD 8.5 billion intangible assets, USD 1.4 billion net deferred tax liabilities and goodwill of approx-imately USD 2.5 billion.
Results of operations since the date of acquisition were not material.
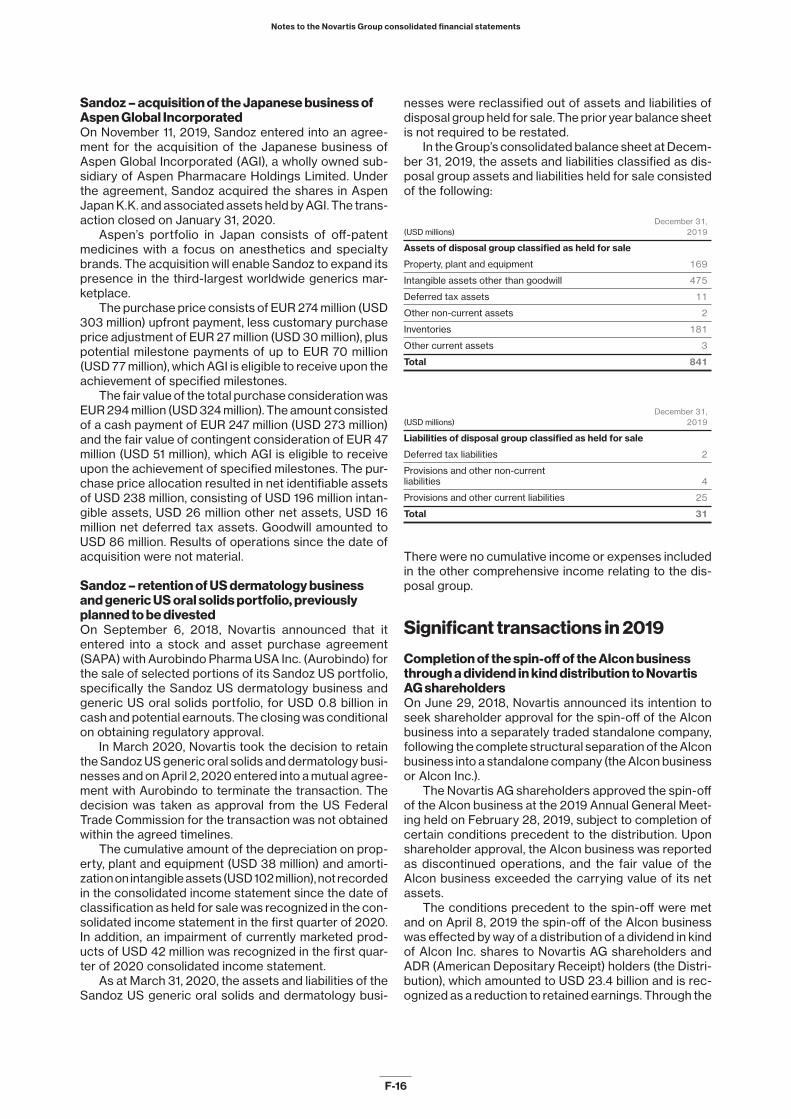
Notes to the Novartis Group consolidated financial statements
F-16
Sandoz – acquisition of the Japanese business of Aspen Global Incorporated On November 11, 2019, Sandoz entered into an agree-ment for the acquisition of the Japanese business of Aspen Global Incorporated (AGI), a wholly owned sub-sidiary of Aspen Pharmacare Holdings Limited. Under the agreement, Sandoz acquired the shares in Aspen Japan K.K. and associated assets held by AGI. The trans-action closed on January 31, 2020.
Aspen’s portfolio in Japan consists of off-patent medicines with a focus on anesthetics and specialty brands. The acquisition will enable Sandoz to expand its presence in the third-largest worldwide generics mar-ketplace.
The purchase price consists of EUR 274 million (USD 303 million) upfront payment, less customary purchase price adjustment of EUR 27 million (USD 30 million), plus potential milestone payments of up to EUR 70 million (USD 77 million), which AGI is eligible to receive upon the achievement of specified milestones.
The fair value of the total purchase consideration was EUR 294 million (USD 324 million). The amount consisted of a cash payment of EUR 247 million (USD 273 million) and the fair value of contingent consideration of EUR 47 million (USD 51 million), which AGI is eligible to receive upon the achievement of specified milestones. The pur-chase price allocation resulted in net identifiable assets of USD 238 million, consisting of USD 196 million intan-gible assets, USD 26 million other net assets, USD 16 million net deferred tax assets. Goodwill amounted to USD 86 million. Results of operations since the date of acquisition were not material.
Sandoz – retention of US dermatology business and generic US oral solids portfolio, previously planned to be divestedOn September 6, 2018, Novartis announced that it entered into a stock and asset purchase agreement (SAPA) with Aurobindo Pharma USA Inc. (Aurobindo) for the sale of selected portions of its Sandoz US portfolio, specifically the Sandoz US dermatology business and generic US oral solids portfolio, for USD 0.8 billion in cash and potential earnouts. The closing was conditional on obtaining regulatory approval.
In March 2020, Novartis took the decision to retain the Sandoz US generic oral solids and dermatology busi-nesses and on April 2, 2020 entered into a mutual agree-ment with Aurobindo to terminate the transaction. The decision was taken as approval from the US Federal Trade Commission for the transaction was not obtained within the agreed timelines.
The cumulative amount of the depreciation on prop-erty, plant and equipment (USD 38 million) and amorti-zation on intangible assets (USD 102 million), not recorded in the consolidated income statement since the date of classification as held for sale was recognized in the con-solidated income statement in the first quarter of 2020. In addition, an impairment of currently marketed prod-ucts of USD 42 million was recognized in the first quar-ter of 2020 consolidated income statement.
As at March 31, 2020, the assets and liabilities of the Sandoz US generic oral solids and dermatology busi-
nesses were reclassified out of assets and liabilities of disposal group held for sale. The prior year balance sheet is not required to be restated.
In the Group’s consolidated balance sheet at Decem-ber 31, 2019, the assets and liabilities classified as dis-posal group assets and liabilities held for sale consisted of the following:
December 31,
(USD millions) 2019
Assets of disposal group classified as held for sale
Property, plant and equipment 169
Intangible assets other than goodwill 475
Deferred tax assets 11
Other non-current assets 2
Inventories 181
Other current assets 3
Total 841
December 31,
(USD millions) 2019
Liabilities of disposal group classified as held for sale
Deferred tax liabilities 2
Provisions and other non-current
liabilities 4
Provisions and other current liabilities 25
Total 31
There were no cumulative income or expenses included in the other comprehensive income relating to the dis-posal group.
Significant transactions in 2019
Completion of the spin-off of the Alcon business through a dividend in kind distribution to Novartis AG shareholders On June 29, 2018, Novartis announced its intention to seek shareholder approval for the spin-off of the Alcon business into a separately traded standalone company, following the complete structural separation of the Alcon business into a standalone company (the Alcon business or Alcon Inc.).
The Novartis AG shareholders approved the spin-off of the Alcon business at the 2019 Annual General Meet-ing held on February 28, 2019, subject to completion of certain conditions precedent to the distribution. Upon shareholder approval, the Alcon business was reported as discontinued operations, and the fair value of the Alcon business exceeded the carrying value of its net assets.
The conditions precedent to the spin-off were met and on April 8, 2019 the spin-off of the Alcon business was effected by way of a distribution of a dividend in kind of Alcon Inc. shares to Novartis AG shareholders and ADR (American Depositary Receipt) holders (the Distri-bution), which amounted to USD 23.4 billion and is rec-ognized as a reduction to retained earnings. Through the
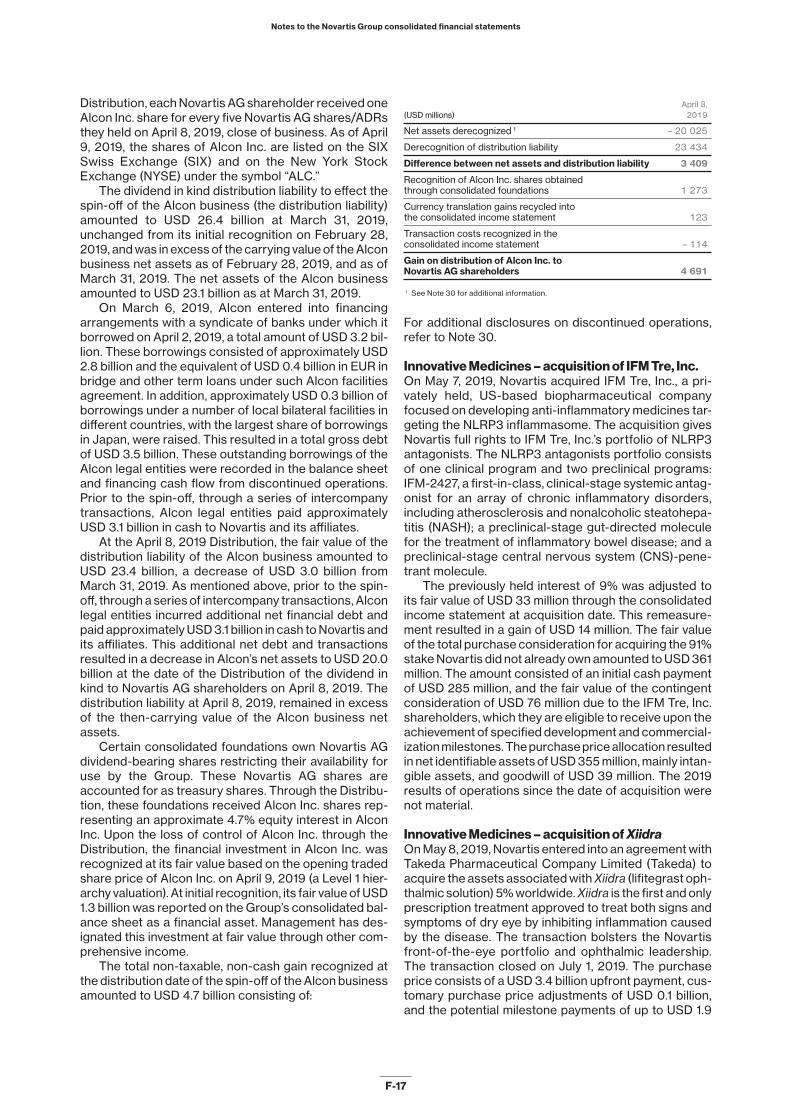
Notes to the Novartis Group consolidated financial statements
F-17
Distribution, each Novartis AG shareholder received one Alcon Inc. share for every five Novartis AG shares/ADRs they held on April 8, 2019, close of business. As of April 9, 2019, the shares of Alcon Inc. are listed on the SIX Swiss Exchange (SIX) and on the New York Stock Exchange (NYSE) under the symbol “ALC.”
The dividend in kind distribution liability to effect the spin-off of the Alcon business (the distribution liability) amounted to USD 26.4 billion at March 31, 2019, unchanged from its initial recognition on February 28, 2019, and was in excess of the carrying value of the Alcon business net assets as of February 28, 2019, and as of March 31, 2019. The net assets of the Alcon business amounted to USD 23.1 billion as at March 31, 2019.
On March 6, 2019, Alcon entered into financing arrangements with a syndicate of banks under which it borrowed on April 2, 2019, a total amount of USD 3.2 bil-lion. These borrowings consisted of approximately USD 2.8 billion and the equivalent of USD 0.4 billion in EUR in bridge and other term loans under such Alcon facilities agreement. In addition, approximately USD 0.3 billion of borrowings under a number of local bilateral facilities in different countries, with the largest share of borrowings in Japan, were raised. This resulted in a total gross debt of USD 3.5 billion. These outstanding borrowings of the Alcon legal entities were recorded in the balance sheet and financing cash flow from discontinued operations. Prior to the spin-off, through a series of intercompany transactions, Alcon legal entities paid approximately USD 3.1 billion in cash to Novartis and its affiliates.
At the April 8, 2019 Distribution, the fair value of the distribution liability of the Alcon business amounted to USD 23.4 billion, a decrease of USD 3.0 billion from March 31, 2019. As mentioned above, prior to the spin-off, through a series of intercompany transactions, Alcon legal entities incurred additional net financial debt and paid approximately USD 3.1 billion in cash to Novartis and its affiliates. This additional net debt and transactions resulted in a decrease in Alcon’s net assets to USD 20.0 billion at the date of the Distribution of the dividend in kind to Novartis AG shareholders on April 8, 2019. The distribution liability at April 8, 2019, remained in excess of the then-carrying value of the Alcon business net assets.
Certain consolidated foundations own Novartis AG dividend-bearing shares restricting their availability for use by the Group. These Novartis AG shares are accounted for as treasury shares. Through the Distribu-tion, these foundations received Alcon Inc. shares rep-resenting an approximate 4.7% equity interest in Alcon Inc. Upon the loss of control of Alcon Inc. through the Distribution, the financial investment in Alcon Inc. was recognized at its fair value based on the opening traded share price of Alcon Inc. on April 9, 2019 (a Level 1 hier-archy valuation). At initial recognition, its fair value of USD 1.3 billion was reported on the Group’s consolidated bal-ance sheet as a financial asset. Management has des-ignated this investment at fair value through other com-prehensive income.
The total non-taxable, non-cash gain recognized at the distribution date of the spin-off of the Alcon business amounted to USD 4.7 billion consisting of:
April 8,
(USD millions) 2019
Net assets derecognized 1 – 20 025
Derecognition of distribution liability 23 434
Difference between net assets and distribution liability 3 409
Recognition of Alcon Inc. shares obtained
through consolidated foundations 1 273
Currency translation gains recycled into
the consolidated income statement 123
Transaction costs recognized in the
consolidated income statement – 114
Gain on distribution of Alcon Inc. to
Novartis AG shareholders 4 691
1 See Note 30 for additional information.
For additional disclosures on discontinued operations, refer to Note 30.
Innovative Medicines – acquisition of IFM Tre, Inc. On May 7, 2019, Novartis acquired IFM Tre, Inc., a pri-vately held, US-based biopharmaceutical company focused on developing anti-inflammatory medicines tar-geting the NLRP3 inflammasome. The acquisition gives Novartis full rights to IFM Tre, Inc.’s portfolio of NLRP3 antagonists. The NLRP3 antagonists portfolio consists of one clinical program and two preclinical programs: IFM-2427, a first-in-class, clinical-stage systemic antag-onist for an array of chronic inflammatory disorders, including atherosclerosis and nonalcoholic steatohepa-titis (NASH); a preclinical-stage gut-directed molecule for the treatment of inflammatory bowel disease; and a preclinical-stage central nervous system (CNS)-pene-trant molecule.
The previously held interest of 9% was adjusted to its fair value of USD 33 million through the consolidated income statement at acquisition date. This remeasure-ment resulted in a gain of USD 14 million. The fair value of the total purchase consideration for acquiring the 91% stake Novartis did not already own amounted to USD 361 million. The amount consisted of an initial cash payment of USD 285 million, and the fair value of the contingent consideration of USD 76 million due to the IFM Tre, Inc. shareholders, which they are eligible to receive upon the achievement of specified development and commercial-ization milestones. The purchase price allocation resulted in net identifiable assets of USD 355 million, mainly intan-gible assets, and goodwill of USD 39 million. The 2019 results of operations since the date of acquisition were not material.
Innovative Medicines – acquisition of XiidraOn May 8, 2019, Novartis entered into an agreement with Takeda Pharmaceutical Company Limited (Takeda) to acquire the assets associated with Xiidra (lifitegrast oph-thalmic solution) 5% worldwide. Xiidra is the first and only prescription treatment approved to treat both signs and symptoms of dry eye by inhibiting inflammation caused by the disease. The transaction bolsters the Novartis front-of-the-eye portfolio and ophthalmic leadership. The transaction closed on July 1, 2019. The purchase price consists of a USD 3.4 billion upfront payment, cus-tomary purchase price adjustments of USD 0.1 billion, and the potential milestone payments of up to USD 1.9

Notes to the Novartis Group consolidated financial statements
F-18
billion, which Takeda is eligible to receive upon the achievement of specified commercialization milestones.
The fair value of the total purchase consideration is USD 3.7 billion. The amount consists of an initial cash payment of USD 3.5 billion, and the fair value of the con-tingent consideration of USD 0.2 billion, which Takeda is eligible to receive upon the achievement of specified commercialization milestones.
The purchase price allocation resulted in net identi-fiable assets of approximately USD 3.6 billion, consist-ing mainly of intangible assets of USD 3.6 billion, and goodwill amounted to approximately USD 0.1 billion. In 2019, from the date of acquisition, the business gener-ated net sales of USD 0.2 billion. Management estimates that net sales for the entire year of 2019 would have amounted to USD 0.3 billion, had the business been acquired at the beginning of the 2019 reporting period. The 2019 results of operations since the date of acqui-sition were not material.
Significant transactions in 2018
Innovative Medicines – acquisition of Advanced Accelerator Applications S.A.On October 30, 2017, Novartis entered into a binding memorandum of understanding with Advanced Acceler-ator Applications S.A. (AAA), a company headquartered in Saint-Genis-Pouilly, France, under which Novartis agreed to commence a tender offer for 100% of the share capital of AAA subject to certain conditions. Novartis commenced the tender offer on December 7, 2017, to purchase all of the outstanding ordinary shares for a price of USD 41 per share and USD 82 per American Depositary Share (ADS), each representing two ordinary shares of AAA, which expired on January 19, 2018. The offer valued AAA’s equity at USD 3.9 billion, on a fully diluted basis.
As of January 19, 2018, the expiration date of the ten-der offer, approximately 97% of the then-outstanding fully diluted ordinary shares, including ordinary shares represented by ADSs (hereinafter collectively referred to as “the outstanding shares”), were validly tendered. On January 22, 2018, Novartis accepted and paid USD 3.9 billion for the outstanding shares tendered in the offer. On January 22, 2018, Novartis commenced a sub-sequent offering period that expired on January 31, 2018. As of the expiration of the subsequent offering period, an additional 1.8% of the outstanding shares were validly tendered. Novartis accepted and paid approximately USD 60 million, resulting in an increase in Novartis own-ership in AAA to 98.7%.
The fair value of the total purchase consideration was USD 3.9 billion. The purchase price allocation resulted in net identifiable assets of approximately USD 1.9 bil-lion, consisting of USD 2.5 billion intangible assets, USD 0.6 billion net deferred tax liabilities, and goodwill of approximately USD 2.0 billion. In 2018, from the date of the acquisition, the business generated net sales of USD 0.4 billion. Management estimated that net sales for the entire year of 2018 would have amounted to USD 0.4 bil-lion had AAA been acquired at the beginning of 2018. The 2018 results from operations since the acquisition were not material.
As of December 31, 2020, Novartis held 99.2% of the then-outstanding fully diluted ordinary shares, including ordinary shares represented by ADSs.
AAA is a radiopharmaceutical company that devel-ops, produces and commercializes molecular nuclear medicines – including Lutathera (USAN: lutetium Lu 177 dotatate/INN: lutetium (177Lu) oxodotreotide), a first-in-class radioligand therapy product for neuroendocrine tumors – and a portfolio of diagnostic products. Radio-pharmaceuticals, such as Lutathera, are unique medici-nal formulations containing radioisotopes, which are used clinically for both diagnosis and therapy.
Innovative Medicines – acquisition of AveXis, Inc.On April 6, 2018, Novartis entered into an agreement and plan of merger with AveXis, Inc., a US-based clinical stage gene therapy company, under which Novartis com-menced on April 17, 2018, a tender offer to purchase all outstanding common stock of AveXis, Inc. for USD 218 per share in cash. On May 15, 2018, Novartis completed the acquisition of the common stock of AveXis, Inc. and paid a total of USD 8.7 billion.
The fair value of the total purchase consideration was USD 8.7 billion. The purchase price allocation resulted in net identifiable assets of approximately USD 7.2 bil-lion, consisting of USD 8.5 billion intangible assets, USD 1.6 billion net deferred tax liabilities and other net assets of USD 0.3 billion, and goodwill of approximately USD 1.5 billion. The 2018 results of operations since the date of acquisition were not material.
AveXis, Inc. is focused on developing and commer-cializing novel treatments for patients suffering from rare and life-threatening neurological genetic diseases. AveXis, Inc.’s initial product candidate, AVXS-101, is a pro-prietary gene therapy currently in development for the treatment of spinal muscular atrophy (SMA) type 1 – the leading genetic cause of infant mortality – and SMA types 2 and 3. In addition, AveXis, Inc. has a pipeline of other novel treatments for rare neurological diseases, including Rett syndrome (RTT) and a genetic form of amyotrophic lateral sclerosis (ALS) caused by mutations in the superoxide dismutase 1 (SOD1) gene.
Innovative Medicines – acquisition of Endocyte, Inc.On October 18, 2018, Novartis entered into an agree-ment and plan of merger with Endocyte, Inc. (Endocyte), a US-based biopharmaceutical company focused on developing targeted therapeutics for cancer treatment. The transaction was completed on December 21, 2018. Under the terms of the agreement, Novartis acquired all outstanding shares of Endocyte common stock for USD 24 per share. The total consideration amounted to USD 2.1 billion.
The fair value of the total purchase consideration was USD 2.1 billion. The purchase price allocation resulted in net identifiable assets of approximately USD 1.5 billion, consisting of USD 1.5 billion intangible assets, USD 0.3 billion net deferred tax liabilities and other net assets of USD 0.3 billion, and goodwill of approximately USD 0.6 billion. The purchase price allocation was preliminary at December 31, 2018, as the transaction closed on Decem-ber 21, 2018, which was close to the Group’s year-end and therefore did not provide sufficient time to complete the valuation of the intangible assets, deferred taxes,

Notes to the Novartis Group consolidated financial statements
F-19
assumed liabilities and goodwill. During 2019, there were no significant revisions to the purchase price allocation.
Endocyte uses drug conjugation technology to develop targeted therapies with companion imaging agents, including 177Lu-PSMA-617, a potential first-in-class investigational radioligand therapy for the treat-ment of metastatic castration-resistant prostate cancer (mCRPC).
Corporate – divestment of 36.5% stake in GlaxoSmithKline Consumer Healthcare Holdings Ltd. On March 27, 2018, Novartis entered into an agreement with GlaxoSmithKline plc (GSK) to divest its 36.5% stake
in GlaxoSmithKline Consumer Healthcare Holdings Ltd. to GSK for USD 13.0 billion in cash. As a result, Novartis discontinued the use of equity method accounting start-ing from April 1, 2018.
On June 1, 2018, the transaction closed and Novartis realized a pre-tax gain of USD 5.8 billion, recorded in income from associated companies.
For significant transactions in 2019 for discontinued operations, see Note 30. There were no significant trans-actions in 2020 for discontinued operations.
3. Segmentation of key figures 2020, 2019 and 2018The businesses of Novartis are divided operationally on a worldwide basis into two identified reporting segments: Innovative Medicines and Sandoz. In addition, we sepa-rately report Corporate activities.
Reporting segments are presented in a manner con-sistent with the internal reporting to the chief operating decision-maker, which is the Executive Committee of Novartis. The reporting segments are managed sepa-rately because they each research, develop, manufac-ture, distribute and sell distinct products that require dif-fering marketing strategies.
The Executive Committee of Novartis is responsible for allocating resources and assessing the performance of the reporting segments.
The reporting segments are as follows:Innovative Medicines researches, develops, manu-
factures, distributes and sells patented prescription medicines. The Innovative Medicines Division is orga-nized into two global business units: Novartis Oncology and Novartis Pharmaceuticals. Novartis Oncology con-sists of the global business franchise Oncology, and Novartis Pharmaceuticals consists of the global business franchises Immunology, Hepatology and Dermatology; Ophthalmology; Neuroscience; Cardiovascular, Renal and Metabolism; Respiratory; and Established Medicines.
Sandoz develops, manufactures and markets finished dosage form medicines as well as intermediary products including active pharmaceutical ingredients. Sandoz is organized globally into three franchises: Retail Generics, Anti-Infectives and Biopharmaceuticals. In Retail Gener-ics, Sandoz develops, manufactures and markets active ingredients and finished dosage forms of small molecule pharmaceuticals to third parties across a broad range of therapeutic areas, as well as finished dosage form of anti-infectives sold to third parties. In Anti-Infectives, Sandoz manufactures and supplies active pharmaceuti-cal ingredients and intermediates, mainly antibiotics, for internal use by Retail Generics and for sale to third-party customers. In Biopharmaceuticals, Sandoz develops, manufactures and markets protein- or other biotechnol-ogy-based products, including biosimilars, and provides
biotechnology manufacturing services to other compa-nies.
Income and expenses relating to Corporate include the costs of the Group headquarters and those of cor-porate coordination functions in major countries. In addi-tion, Corporate includes other items of income and expense that are not attributable to specific segments, such as certain revenues from intellectual property rights, certain expenses related to post-employment benefits, environmental remediation liabilities, charitable activities, donations and sponsorships. Usually, no allo-cation of Corporate items is made to the segments. As a result, Corporate assets and liabilities principally con-sist of net liquidity (cash and cash equivalents, market-able securities less financial debts), investments in asso-ciated companies, and current and deferred taxes and non-segment-specific environmental remediation and post-employment benefit liabilities.
Our divisions are supported by the Novartis Institutes for BioMedical Research, Global Drug Development, Novartis Technical Operations and Novartis Business Services organizations.• The Novartis Institutes for BioMedical Research (NIBR)
conducts research activities for the Innovative Medicines Division and also collaborates with Sandoz.
• The Global Drug Development organization oversees all drug development activities for our Innovative Medicines Division and collaborates with our Sandoz Division on the development of its biosimilars portfo-lio.
• The Novartis Technical Operations organization man-ages our manufacturing operations across our Innovative Medicines and Sandoz Divisions.
• Novartis Business Services (NBS) is our shared ser-vices organization that delivers business support ser-vices across the Group, such as information technol-ogy, real estate and facility services, procurement, product lifecycle services, human resources, and finan-cial reporting and accounting operations.

Notes to the Novartis Group consolidated financial statements
F-20
Following the February 28, 2019, shareholders’ approval of the spin-off of the Alcon business (refer to Notes 1, 2 and 30 for further details), the Group reported its con-solidated financial statements as “continuing operations” and “discontinued operations.”
Continuing operations comprise the activities of the Innovative Medicines and Sandoz Divisions, and the con-tinuing Corporate activities.
Discontinued operations include the operational results from the Alcon eye care devices business and certain corporate activities attributable to the Alcon busi-ness prior to the spin-off, the gain on distribution of Alcon Inc. to Novartis AG shareholders, and certain other
expenses related to the Distribution (refer to Notes 1, 2 and 30 for further details).
The accounting policies mentioned in Note 1 are used in the reporting of segment results. Inter-segmental sales are made at amounts that are considered to approximate arm’s length transactions. The Executive Committee of Novartis evaluates segmental performance and allo-cates resources among the segments based on a num-ber of measures, including net sales, operating income and net operating assets. Segment net operating assets consist primarily of property, plant and equipment; right-of-use assets; intangible assets; goodwill; inventories; and trade and other operating receivables less operat-ing liabilities.
Segmentation – consolidated income statements
Innovative Medicines Sandoz Corporate Group (including eliminations)
(USD millions) 2020 2019 2020 2019 2020 2019 2020 2019
Net sales to third parties from continuing operations 39 013 37 714 9 646 9 731 48 659 47 445
Sales to continuing and discontinued segments 792 783 189 141 – 981 – 871 53
Net sales from continuing operations 39 805 38 497 9 835 9 872 – 981 – 871 48 659 47 498
Other revenues 1 018 1 092 53 63 168 24 1 239 1 179
Cost of goods sold – 10 927 – 10 050 – 5 252 – 5 334 1 058 959 – 15 121 – 14 425
Gross profit from continuing operations 29 896 29 539 4 636 4 601 245 112 34 777 34 252
Selling, general and administration – 11 657 – 11 617 – 2 076 – 2 218 – 464 – 534 – 14 197 – 14 369
Research and development – 8 118 – 8 152 – 862 – 1 250 – 8 980 – 9 402
Other income 922 1 586 176 167 644 278 1 742 2 031
Other expense – 1 871 – 2 069 – 831 – 749 – 488 – 608 – 3 190 – 3 426
Operating income from continuing operations 9 172 9 287 1 043 551 – 63 – 752 10 152 9 086
Income from associated companies 1 1 2 2 670 656 673 659
Interest expense – 869 – 850
Other financial income and expense – 78 45
Income before taxes from continuing operations 9 878 8 940
Taxes – 1 807 – 1 793
Net income from continuing operations 8 071 7 147
Net loss from discontinued operations before gain on
distribution of Alcon Inc. to Novartis AG shareholders – 101
Gain on distribution of Alcon Inc. to Novartis AG shareholders 4 691
Net income from discontinued operations 4 590
Net income 8 071 11 737
Attributable to:
Shareholders of Novartis AG 8 072 11 732
Non-controlling interests – 1 5
Included in net income from continuing operations are:
Interest income 91 245
Depreciation of property, plant and equipment – 912 – 952 – 282 – 283 – 124 – 110 – 1 318 – 1 345
Depreciation of right-of-use assets – 273 – 247 – 41 – 41 – 16 – 17 – 330 – 305
Amortization of intangible assets – 3 080 – 2 509 – 370 – 315 – 12 – 12 – 3 462 – 2 836
Impairment charges on property, plant and equipment, net – 324 – 100 – 116 – 101 – 1 – 440 – 202
Impairment charges on intangible assets, net – 768 – 632 – 141 – 506 – 5 – 914 – 1 138
Impairment charges and fair value
changes on financial assets, net 153 18 182 20 335 38
Additions to restructuring provisions – 217 – 229 – 98 – 165 – 39 – 98 – 354 – 492
Equity-based compensation of Novartis equity plans – 714 – 761 – 64 – 67 – 180 – 239 – 958 – 1 067

Notes to the Novartis Group consolidated financial statements
F-21
Innovative Medicines Sandoz Corporate Group (including eliminations)
(USD millions) 2019 2018 2019 2018 2019 2018 2019 2018
Net sales to third parties from continuing operations 37 714 34 892 9 731 9 859 47 445 44 751
Sales to continuing and discontinued segments 783 741 141 177 – 871 – 836 53 82
Net sales from continuing operations 38 497 35 633 9 872 10 036 – 871 – 836 47 498 44 833
Other revenues 1 092 1 188 63 62 24 16 1 179 1 266
Cost of goods sold – 10 050 – 9 870 – 5 334 – 5 530 959 890 – 14 425 – 14 510
Gross profit from continuing operations 29 539 26 951 4 601 4 568 112 70 34 252 31 589
Selling, general and administration – 11 617 – 10 907 – 2 218 – 2 305 – 534 – 505 – 14 369 – 13 717
Research and development – 8 152 – 7 675 – 1 250 – 814 – 9 402 – 8 489
Other income 1 586 977 167 505 278 147 2 031 1 629
Other expense – 2 069 – 1 475 – 749 – 622 – 608 – 512 – 3 426 – 2 609
Operating income from continuing operations 9 287 7 871 551 1 332 – 752 – 800 9 086 8 403
Income from associated companies 1 1 2 5 656 6 432 659 6 438
Interest expense – 850 – 932
Other financial income and expense 45 186
Income before taxes from continuing operations 8 940 14 095
Taxes – 1 793 – 1 295
Net income from continuing operations 7 147 12 800
Net loss from discontinued operations before gain on
distribution of Alcon Inc. to Novartis AG shareholders – 101 – 186
Gain on distribution of Alcon Inc. to Novartis AG shareholders 4 691
Net income/(loss) from discontinued operations 4 590 – 186
Net income 11 737 12 614
Attributable to:
Shareholders of Novartis AG 11 732 12 611
Non-controlling interests 5 3
Included in net income from continuing operations are:
Interest income 245 292
Depreciation of property, plant and equipment – 952 – 1 075 – 283 – 285 – 110 – 122 – 1 345 – 1 482
Depreciation of right-of-use assets 1 – 247 – 41 – 17 – 305
Amortization of intangible assets – 2 509 – 2 214 – 315 – 366 – 12 – 7 – 2 836 – 2 587
Impairment charges on property, plant and equipment, net – 100 – 239 – 101 – 60 – 1 – 2 – 202 – 301
Impairment charges on intangible assets, net – 632 – 592 – 506 – 249 – 1 138 – 841
Impairment charges and fair value
changes on financial assets, net 18 107 20 – 113 38 – 6
Additions to restructuring provisions – 229 – 395 – 165 – 32 – 98 – 94 – 492 – 521
Equity-based compensation of Novartis equity plans – 761 – 645 – 67 – 53 – 239 – 220 – 1 067 – 918
1 Depreciation of right-of-use assets recognized from January 1, 2019, the date of implementation of IFRS 16 Leases. Note 1 provides additional disclosures.

Notes to the Novartis Group consolidated financial statements
F-22
Segmentation – consolidated balance sheets
Innovative Medicines Sandoz Corporate Group (including eliminations)
(USD millions) 2020 2019 2020 2019 2020 2019 2020 2019
Total assets 83 112 71 225 16 825 16 468 32 122 30 677 132 059 118 370
Total liabilities – 15 472 – 15 332 – 3 786 – 3 804 – 56 135 – 43 683 – 75 393 – 62 819
Total equity 56 666 55 551
Net debt 1 24 481 15 938 24 481 15 938
Net operating assets 67 640 55 893 13 039 12 664 468 2 932 81 147 71 489
Included in assets and liabilities are:
Total property, plant and equipment 9 863 9 632 1 849 1 888 551 549 12 263 12 069
Additions to property, plant
and equipment 2 926 1 114 229 217 110 143 1 265 1 474
Total right-of-use assets 1 489 1 487 133 136 54 54 1 676 1 677
Additions to right-of-use assets 2 264 454 67 49 15 34 346 537
Total goodwill and intangible assets 56 839 46 336 9 817 8 892 152 83 66 808 55 311
Additions to goodwill and
intangible assets 2 1 235 647 105 68 85 52 1 425 767
Total investment in associated
companies 194 128 8 7 9 430 8 509 9 632 8 644
Additions to investment in associated
companies 24 44 7 11 31 55
Cash and cash equivalents, marketable securities,
commodities, time deposits and derivative
financial instruments 11 563 11 446 11 563 11 446
Financial debts and derivative
financial instruments 36 044 27 384 36 044 27 384
Current income tax and deferred tax liabilities 9 880 8 061 9 880 8 061
1 Note 29 provides additional disclosures related to net debt2 Excluding the impact of business acquisitions
The following table shows countries that accounted for more than 5% of at least one of the respective Group totals, as well as regional information for net sales to third parties for the years ended December 31, 2020, 2019 and 2018, and for selected non-current assets for the years ended December 31, 2020 and 2019:
Net sales1 Total of selected non-current assets2
(USD millions) 2020 % 2019 % 2018 % 2020 % 2019 %
Country
Switzerland 800 2 848 2 795 2 34 904 39 33 032 43
United States 16 484 34 16 280 34 14 618 33 39 889 44 28 893 37
France 2 442 5 2 442 5 2 505 6 4 115 5 3 933 5
Germany 4 518 9 4 120 9 3 972 9 2 607 3 2 554 3
Japan 2 804 6 2 656 6 2 575 6 313 309
China 2 573 5 2 214 5 1 953 4 714 1 684 1
Other 19 038 39 18 885 39 18 333 40 7 837 8 8 296 11
Group 48 659 100 47 445 100 44 751 100 90 379 100 77 701 100
Region
Europe 18 715 38 17 933 38 17 259 39 47 798 53 46 103 59
Americas 19 725 41 19 713 41 18 032 39 40 391 45 29 389 38
Asia/Africa/Australasia 10 219 21 9 799 21 9 460 22 2 190 2 2 209 3
Group 48 659 100 47 445 100 44 751 100 90 379 100 77 701 100
1 Net sales to third party from continuing operations by location of customer2 Total of property, plant and equipment; right-of-use assets; goodwill; intangible assets and investment in associated companies

Notes to the Novartis Group consolidated financial statements
F-23
The Group’s largest, second-largest and third-largest cus-tomers account for approximately 17%, 11% and 6% of net sales, respectively (2019: 18%, 13% and 8%, respectively; 2018: 18%, 14% and 8%, respectively). All segments had sales to these customers in 2020, 2019 and 2018.
The highest amounts of trade receivables outstanding were for these same three customers and amounted to approximately 14%, 12% and 6%, respectively, of the trade receivables at December 31, 2020 (2019: 14%, 12% and 7%, respectively).
Segmentation – Net sales by region1
Change Change
(2019 (2018
2020 2019 to 2020) 2018 to 2019)
USD m USD m USD % USD m USD %
Innovative Medicines
Europe 13 484 12 818 5 12 296 4
US 14 342 13 789 4 11 864 16
Asia/Africa/Australasia 8 718 8 458 3 8 097 4
Canada and Latin America 2 469 2 649 – 7 2 635 1
Total 39 013 37 714 3 34 892 8
Of which in Established Markets 29 643 28 573 4 26 258 9
Of which in Emerging Growth Markets 9 370 9 141 3 8 634 6
Sandoz
Europe 5 231 5 115 2 4 963 3
US 2 142 2 491 – 14 2 754 – 10
Asia/Africa/Australasia 1 501 1 341 12 1 363 – 2
Canada and Latin America 772 784 – 2 779 1
Total 9 646 9 731 – 1 9 859 – 1
Of which in Established Markets 7 089 7 111 0 7 233 – 2
Of which in Emerging Growth Markets 2 557 2 620 – 2 2 626 0
Group
Europe 18 715 17 933 4 17 259 4
US 16 484 16 280 1 14 618 11
Asia/Africa/Australasia 10 219 9 799 4 9 460 4
Canada and Latin America 3 241 3 433 – 6 3 414 1
Total 48 659 47 445 3 44 751 6
Of which in Established Markets 36 732 35 684 3 33 491 7
Of which in Emerging Growth Markets 11 927 11 761 1 11 260 4
1 Net sales to third parties from continuing operations by location of customer. Emerging Growth Markets comprise all markets other than the Established Markets of the US, Canada, Western Europe, Japan, Australia and New Zealand.
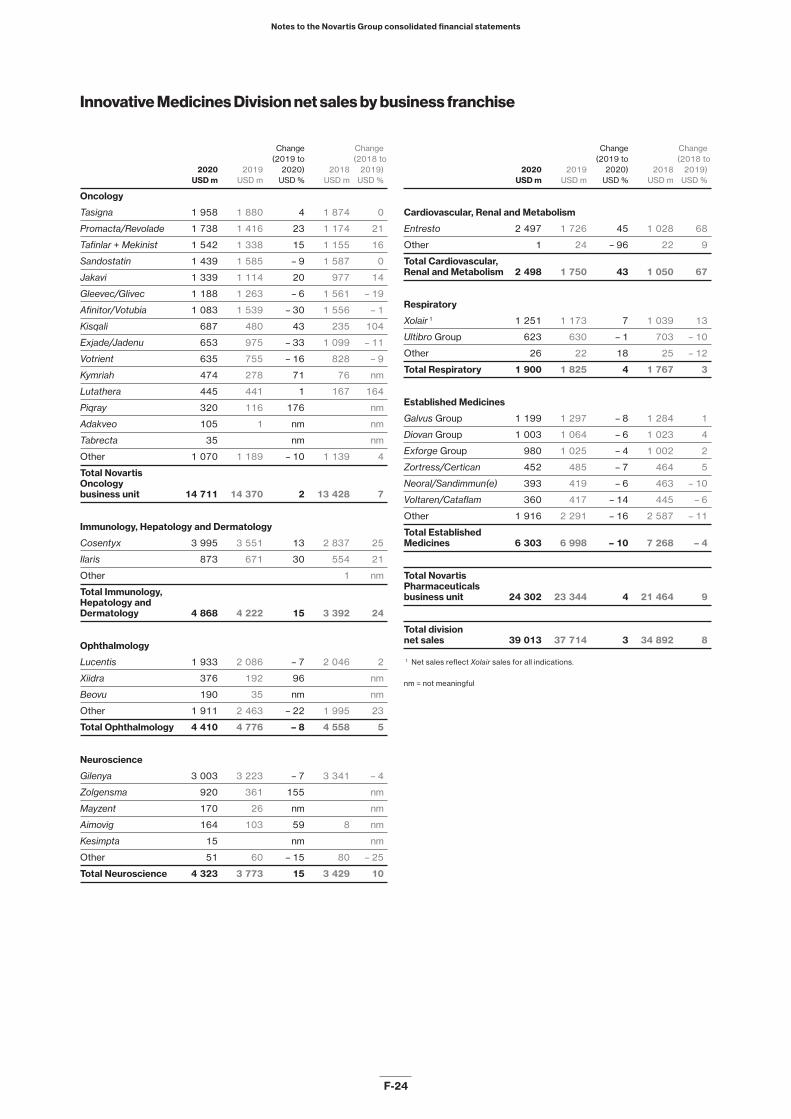
Notes to the Novartis Group consolidated financial statements
F-24
Innovative Medicines Division net sales by business franchise
Change Change
(2019 to (2018 to
2020 2019 2020) 2018 2019)
USD m USD m USD % USD m USD %
Oncology
Tasigna 1 958 1 880 4 1 874 0
Promacta/Revolade 1 738 1 416 23 1 174 21
Tafinlar + Mekinist 1 542 1 338 15 1 155 16
Sandostatin 1 439 1 585 – 9 1 587 0
Jakavi 1 339 1 114 20 977 14
Gleevec/Glivec 1 188 1 263 – 6 1 561 – 19
Afinitor/Votubia 1 083 1 539 – 30 1 556 – 1
Kisqali 687 480 43 235 104
Exjade/Jadenu 653 975 – 33 1 099 – 11
Votrient 635 755 – 16 828 – 9
Kymriah 474 278 71 76 nm
Lutathera 445 441 1 167 164
Piqray 320 116 176 nm
Adakveo 105 1 nm nm
Tabrecta 35 nm nm
Other 1 070 1 189 – 10 1 139 4
Total Novartis
Oncology
business unit 14 711 14 370 2 13 428 7
Immunology, Hepatology and Dermatology
Cosentyx 3 995 3 551 13 2 837 25
Ilaris 873 671 30 554 21
Other 1 nm
Total Immunology,
Hepatology and
Dermatology 4 868 4 222 15 3 392 24
Ophthalmology
Lucentis 1 933 2 086 – 7 2 046 2
Xiidra 376 192 96 nm
Beovu 190 35 nm nm
Other 1 911 2 463 – 22 1 995 23
Total Ophthalmology 4 410 4 776 – 8 4 558 5
Neuroscience
Gilenya 3 003 3 223 – 7 3 341 – 4
Zolgensma 920 361 155 nm
Mayzent 170 26 nm nm
Aimovig 164 103 59 8 nm
Kesimpta 15 nm nm
Other 51 60 – 15 80 – 25
Total Neuroscience 4 323 3 773 15 3 429 10
Change Change
(2019 to (2018 to
2020 2019 2020) 2018 2019)
USD m USD m USD % USD m USD %
Cardiovascular, Renal and Metabolism
Entresto 2 497 1 726 45 1 028 68
Other 1 24 – 96 22 9
Total Cardiovascular,
Renal and Metabolism 2 498 1 750 43 1 050 67
Respiratory
Xolair 1 1 251 1 173 7 1 039 13
Ultibro Group 623 630 – 1 703 – 10
Other 26 22 18 25 – 12
Total Respiratory 1 900 1 825 4 1 767 3
Established Medicines
Galvus Group 1 199 1 297 – 8 1 284 1
Diovan Group 1 003 1 064 – 6 1 023 4
Exforge Group 980 1 025 – 4 1 002 2
Zortress/Certican 452 485 – 7 464 5
Neoral/Sandimmun(e) 393 419 – 6 463 – 10
Voltaren/Cataflam 360 417 – 14 445 – 6
Other 1 916 2 291 – 16 2 587 – 11
Total Established
Medicines 6 303 6 998 – 10 7 268 – 4
Total Novartis
Pharmaceuticals
business unit 24 302 23 344 4 21 464 9
Total division
net sales 39 013 37 714 3 34 892 8
1 Net sales reflect Xolair sales for all indications.
nm = not meaningful
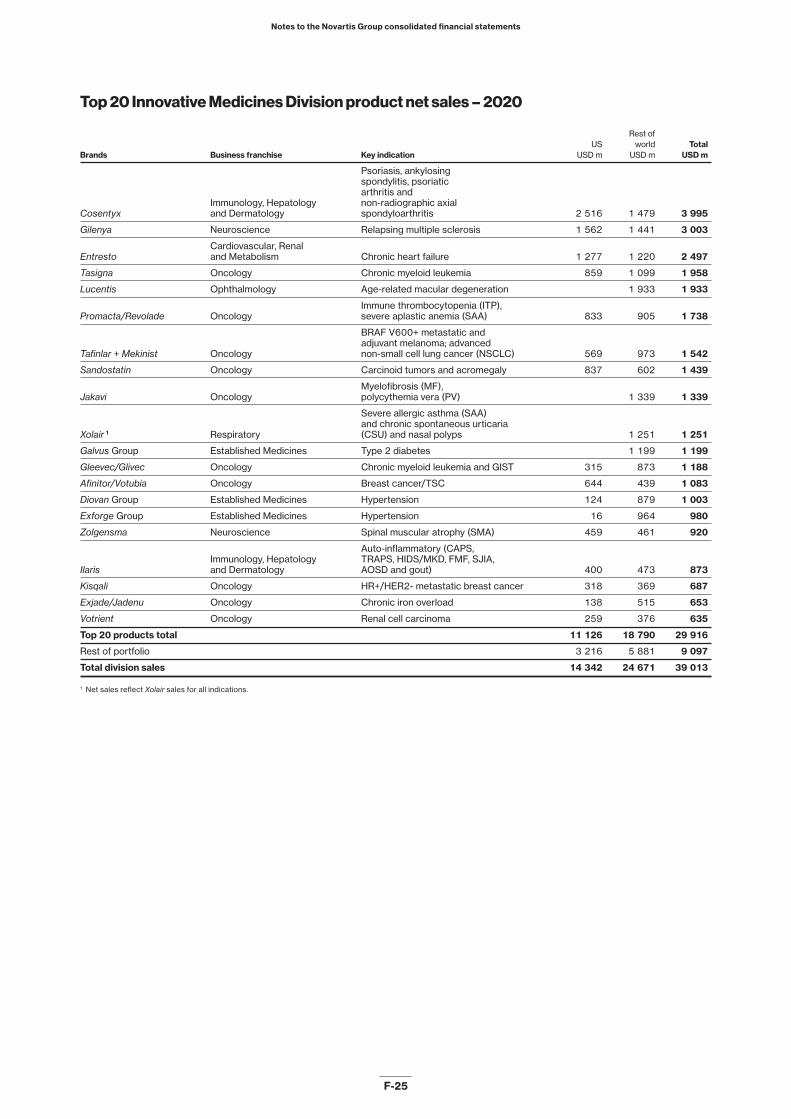
Notes to the Novartis Group consolidated financial statements
F-25
Top 20 Innovative Medicines Division product net sales – 2020
Rest of
US world Total
Brands Business franchise Key indication USD m USD m USD m
Psoriasis, ankylosing
spondylitis, psoriatic
arthritis and
Immunology, Hepatology non-radiographic axial
Cosentyx and Dermatology spondyloarthritis 2 516 1 479 3 995
Gilenya Neuroscience Relapsing multiple sclerosis 1 562 1 441 3 003
Cardiovascular, Renal
Entresto and Metabolism Chronic heart failure 1 277 1 220 2 497
Tasigna Oncology Chronic myeloid leukemia 859 1 099 1 958
Lucentis Ophthalmology Age-related macular degeneration 1 933 1 933
Immune thrombocytopenia (ITP),
Promacta/Revolade Oncology severe aplastic anemia (SAA) 833 905 1 738
BRAF V600+ metastatic and
adjuvant melanoma; advanced
Tafinlar + Mekinist Oncology non-small cell lung cancer (NSCLC) 569 973 1 542
Sandostatin Oncology Carcinoid tumors and acromegaly 837 602 1 439
Myelofibrosis (MF),
Jakavi Oncology polycythemia vera (PV) 1 339 1 339
Severe allergic asthma (SAA)
and chronic spontaneous urticaria
Xolair 1 Respiratory (CSU) and nasal polyps 1 251 1 251
Galvus Group Established Medicines Type 2 diabetes 1 199 1 199
Gleevec/Glivec Oncology Chronic myeloid leukemia and GIST 315 873 1 188
Afinitor/Votubia Oncology Breast cancer/TSC 644 439 1 083
Diovan Group Established Medicines Hypertension 124 879 1 003
Exforge Group Established Medicines Hypertension 16 964 980
Zolgensma Neuroscience Spinal muscular atrophy (SMA) 459 461 920
Auto-inflammatory (CAPS,
Immunology, Hepatology TRAPS, HIDS/MKD, FMF, SJIA,
Ilaris and Dermatology AOSD and gout) 400 473 873
Kisqali Oncology HR+/HER2- metastatic breast cancer 318 369 687
Exjade/Jadenu Oncology Chronic iron overload 138 515 653
Votrient Oncology Renal cell carcinoma 259 376 635
Top 20 products total 11 126 18 790 29 916
Rest of portfolio 3 216 5 881 9 097
Total division sales 14 342 24 671 39 013
1 Net sales reflect Xolair sales for all indications.

Notes to the Novartis Group consolidated financial statements
F-26
Top 20 Innovative Medicines Division product net sales – 2019
Rest of
US world Total
Brands Business franchise Key indication USD m USD m USD m
Immunology, Hepatology Psoriasis, ankylosing
Cosentyx and Dermatology spondylitis and psoriatic arthritis 2 220 1 331 3 551
Gilenya Neuroscience Relapsing multiple sclerosis 1 736 1 487 3 223
Lucentis Ophthalmology Age-related macular degeneration 2 086 2 086
Tasigna Oncology Chronic myeloid leukemia 804 1 076 1 880
Cardiovascular, Renal
Entresto and Metabolism Chronic heart failure 925 801 1 726
Sandostatin Oncology Carcinoid tumors and acromegaly 881 704 1 585
Afinitor/Votubia Oncology Breast cancer/TSC 1 003 536 1 539
Immune thrombocytopenia (ITP),
Promacta/Revolade Oncology severe aplastic anemia (SAA) 691 725 1 416
BRAF V600+ metastatic and
adjuvant melanoma; advanced
Tafinlar + Mekinist Oncology non-small cell lung cancer (NSCLC) 481 857 1 338
Galvus Group Established Medicines Type 2 diabetes 1 297 1 297
Gleevec/Glivec Oncology Chronic myeloid leukemia and GIST 334 929 1 263
Severe allergic asthma (SAA)
and chronic spontaneous urticaria
Xolair 1 Respiratory (CSU) 1 173 1 173
Myelofibrosis (MF),
Jakavi Oncology polycythemia vera (PV) 1 114 1 114
Diovan Group Established Medicines Hypertension 86 978 1 064
Exforge Group Established Medicines Hypertension 13 1 012 1 025
Exjade/Jadenu Oncology Chronic iron overload 450 525 975
Votrient Oncology Renal cell carcinoma 332 423 755
Auto-inflammatory (CAPS,
Immunology, Hepatology TRAPS, HIDS/MKD, FMF, SJIA,
Ilaris and Dermatology AOSD and gout) 304 367 671
Zortress/Certican Established Medicines Transplantation 169 316 485
Kisqali Oncology HR+/HER2- metastatic breast cancer 250 230 480
Top 20 products total 10 679 17 967 28 646
Rest of portfolio 3 110 5 958 9 068
Total division sales 13 789 23 925 37 714
1 Net sales reflect Xolair sales for all indications.

Notes to the Novartis Group consolidated financial statements
F-27
Top 20 Innovative Medicines Division product net sales – 2018
Rest of
US world Total
Brands Business franchise Key indication USD m USD m USD m
Gilenya Neuroscience Relapsing multiple sclerosis 1 765 1 576 3 341
Immunology, Hepatology Psoriasis, ankylosing
Cosentyx and Dermatology spondylitis and psoriatic arthritis 1 674 1 163 2 837
Lucentis Ophthalmology Age-related macular degeneration 2 046 2 046
Tasigna Oncology Chronic myeloid leukemia 806 1 068 1 874
Sandostatin Oncology Carcinoid tumors and acromegaly 817 770 1 587
Gleevec/Glivec Oncology Chronic myeloid leukemia and GIST 440 1 121 1 561
Afinitor/Votubia Oncology Breast cancer/TSC 929 627 1 556
Galvus Group Established Medicines Type 2 diabetes 1 284 1 284
Immune thrombocytopenia (ITP),
Promacta/Revolade Oncology severe aplastic anemia (SAA) 581 593 1 174
BRAF V600+ metastatic and
adjuvant melanoma; advanced
Tafinlar + Mekinist Oncology non-small cell lung cancer (NSCLC) 457 698 1 155
Exjade/Jadenu Oncology Chronic iron overload 521 578 1 099
Severe allergic asthma (SAA)
and chronic spontaneous urticaria
Xolair 1 Respiratory (CSU) 1 039 1 039
Cardiovascular, Renal
Entresto and Metabolism Chronic heart failure 556 472 1 028
Diovan Group Established Medicines Hypertension 84 939 1 023
Exforge Group Established Medicines Hypertension 19 983 1 002
Myelofibrosis (MF),
Jakavi Oncology polycythemia vera (PV) 977 977
Votrient Oncology Renal cell carcinoma 404 424 828
Auto-inflammatory (CAPS,
Immunology, Hepatology TRAPS, HIDS/MKD, FMF, SJIA,
Ilaris and Dermatology AOSD and gout) 262 292 554
Reduction of elevated intraocular
Travoprost Group Ophthalmology pressure 194 323 517
Zortress/Certican Established Medicines Transplantation 145 319 464
Top 20 products total 9 654 17 292 26 946
Rest of portfolio 2 210 5 736 7 946
Total division sales 11 864 23 028 34 892
1 Net sales reflect Xolair sales for all indications.

Notes to the Novartis Group consolidated financial statements
F-28
Sandoz Division net sales by business franchise
Change Change
(2019 to (2018 to
2020 2019 2020) 2018 2019)
USD m USD m USD % USD m USD %
Retail Generics 1 7 244 7 590 – 5 7 880 – 4
Biopharmaceuticals 1 928 1 607 20 1 436 12
Anti-Infectives 474 534 – 11 543 – 2
Total division net sales 9 646 9 731 – 1 9 859 – 1
1 Of which USD 694 million (2019: USD 784 million; 2018: USD 826 million) represents anti-infectives sold under the Sandoz name
The product portfolio of Sandoz is widely spread in 2020, 2019 and 2018.
Segmentation – other revenue
Innovative Medicines Sandoz Corporate Group (including eliminations)
(USD millions) 2020 2019 2020 2019 2020 2019 2020 2019
Profit-sharing income 835 732 2 835 734
Royalty income 107 104 25 19 168 24 300 147
Milestone income 39 201 11 30 50 231
Other 1 37 55 17 12 54 67
Total other revenues 1 018 1 092 53 63 168 24 1 239 1 179
1 Other includes revenue from activities such as manufacturing or other services rendered, to the extent such revenue is not recorded under net sales.
Innovative Medicines Sandoz Corporate Group
(including eliminations)
(USD millions) 2019 2018 2019 2018 2019 2018 2019 2018
Profit-sharing income 732 874 2 3 734 877
Royalty income 104 162 19 10 24 16 147 188
Milestone income 201 128 30 45 231 173
Other 1 55 24 12 4 67 28
Total other revenues 1 092 1 188 63 62 24 16 1 179 1 266
1 Other includes revenue from activities such as manufacturing or other services rendered, to the extent such revenue is not recorded under net sales.

Notes to the Novartis Group consolidated financial statements
F-29
4. Associated companies Net income statement effect Other comprehensive income effect Total comprehensive income effect
(USD millions) 2020 2019 2018 2020 2019 2018 1 2020 2019 2018
Roche Holding AG, Switzerland 677 662 526 – 56 – 94 75 621 568 601
GlaxoSmithKline Consumer
Healthcare Holdings Ltd., UK 5 910 – 557 5 353
Others – 4 – 3 2 – 4 – 3 2
Associated companies
related to continuing operations 673 659 6 438 – 56 – 94 – 482 617 565 5 956
1 In 2018, Novartis share of other comprehensive income recognized by associated companies, net of taxes of USD 511 million was recycled into the consolidated income statement as a result of the divestment of the investment in GSK Consumer Healthcare Holdings Ltd. No Novartis share of other comprehensive income recognized by associated companies, net of taxes was recycled into the consolidated income statement in 2020 and 2019.
Novartis has a significant investment in Roche Holding AG, Basel (Roche), as well as certain other smaller invest-ments that are accounted for as associated companies. The investment in GlaxoSmithKline Consumer Health-care Holdings Ltd., Brentford, Middlesex, UK, was divested on June 1, 2018, to GlaxoSmithKline plc, Great Britain.
Balance sheet value
December 31, December 31,
(USD millions) 2020 2019
Roche Holding AG, Switzerland 9 407 8 445
Others 225 199
Total 9 632 8 644
Roche Holding AG
The Group’s holding in Roche voting shares was 33.3% at December 31, 2020, 2019 and 2018. This investment represents approximately 6.2% of Roche’s total out-standing voting and non-voting equity instruments at December 31, 2020, 2019 and 2018.
Since full-year 2020 financial data for Roche is not available when Novartis produces its consolidated finan-cial results, a survey of analyst estimates is used to esti-mate the Group’s share of Roche’s net income. Any dif-ferences between these estimates and actual results will be adjusted in the Group’s 2021 consolidated financial statements when available.
The following tables show summarized financial infor-mation for Roche, including current values of fair value adjustments made at the time of the acquisition of the shares, for the year ended December 31, 2019, and for the six months ended June 30, 2020 (since full-year 2020 data is not yet available):
Non-current Current Non-current
(CHF billions) Current assets assets liabilities liabilities
December 31, 2019 31.3 56.4 24.1 23.1
June 30, 2020 27.7 55.7 22.5 23.1
Other Total
comprehen- comprehen-
(CHF billions) Revenue Net income sive income sive income
December 31, 2019 63.8 12.3 – 0.9 11.4
June 30, 2020 30.4 7.2 – 0.7 6.5
A purchase price allocation was performed on the basis of publicly available information at the time of acquisition of the investment. The December 31, 2020, balance sheet value allocation is as follows:
December 31,
(USD millions) 2020
Novartis share of Roche’s estimated net assets 2 585
Novartis share of reappraised intangible assets 117
Implicit Novartis goodwill 3 233
Current value of share in net identifiable assets
and goodwill 5 935
Accumulated equity accounting
adjustments and translation
effects less dividends received 3 472
Balance sheet value 9 407
The identified intangible assets principally relate to the value of currently marketed products and are amortized on a straight-line basis over their estimated average use-ful life of 20 years.
In 2020, dividends received from Roche in relation to the distribution of its 2019 net income amounted to USD 487 million (2019: USD 460 million in relation to the distribution of its 2018 net income).
The consolidated income statement effects from applying Novartis accounting principles for this invest-ment in 2020, 2019 and 2018 are as follows:
(USD millions) 2020 2019 2018
Novartis share of Roche’s
estimated current-year
consolidated net income 913 910 799
Prior-year adjustment – 64 – 129 – 125
Amortization of fair value
adjustments relating to
intangible assets, net of taxes
of USD 26 million (2019: USD 24
million; 2018: USD 40 million) – 172 – 162 – 148
Partial release of deferred tax
liability recognized 43
Net income effect 677 662 526
The publicly quoted market value of the Novartis inter-est in Roche (SIX symbol: RO) at December 31, 2020, was USD 18.8 billion (2019: USD 16.9 billion).

Notes to the Novartis Group consolidated financial statements
F-30
GlaxoSmithKline Consumer Healthcare Holdings Ltd.On March 27, 2018, Novartis entered into an agreement with GlaxoSmithKline plc, Great Britain (GSK), to divest its 36.5% stake in GSK Consumer Healthcare Holdings Ltd. (GSK Consumer Healthcare) to GSK for USD 13.0 billion in cash. As a result, Novartis discontinued the use of equity method accounting starting from April 1, 2018. The divestment transaction closed on June 1, 2018, and Novartis realized a pre-tax gain of USD 5.8 billion, recorded in income from associated companies. See Note 2.
GSK Consumer Healthcare was formed in March 2015 via contribution of businesses from both Novartis and GSK.
Until June 1, 2018, Novartis had a 36.5% interest in GSK Consumer Healthcare and had four of 11 seats on the GSK Consumer Healthcare board of directors. Fur-
thermore, Novartis had customary minority rights as well as exit rights at a predefined, market-based pricing mechanism.
The consolidated income statement effects from applying Novartis accounting principles for this invest-ment in 2018 are as follows:
(USD millions) 2018
Novartis share of
GSK Consumer Healthcare’s
estimated current-year
consolidated net income 119
Prior-year adjustment 4
Amortization of fair value
adjustments relating to
intangible assets and inventory,
net of taxes of USD 1 million – 3
Pre-tax gain on divestment of
GSK Consumer Healthcare 5 790
Net income effect 5 910
5. Interest expense and other financial income and expense
Interest expense
(USD millions) 2020 2019 2018
Interest expense – 708 – 714 – 877
Interest expense on lease liabilities – 67 – 66
Expense arising from
discounting long-term liabilities
and capitalized borrowing costs – 94 – 70 – 55
Total interest expense
from continuing operations – 869 – 850 – 932
Other financial income and expense
(USD millions) 2020 2019 2018
Interest income 91 245 292
Other financial income 18 12 1
Financial expense – 52 – 52 – 39
Currency result, net – 135 – 160 – 68
Total other financial income
and expense from
continuing operations – 78 45 186

Notes to the Novartis Group consolidated financial statements
F-31
6. Taxes
Income before taxes
(USD millions) 2020 2019 2018
Switzerland 9 786 8 097 11 887
Foreign 92 843 2 208
Income before taxes
from continuing operations 9 878 8 940 14 095
Current and deferred income tax expense
(USD millions) 2020 2019 2018
Switzerland – 932 – 1 186 – 615
Foreign – 1 168 – 961 – 988
Current income tax expense – 2 100 – 2 147 – 1 603
Switzerland – 137 – 93 – 120
Foreign 430 447 428
Deferred tax income 293 354 308
Income tax expense
from continuing operations – 1 807 – 1 793 – 1 295
Analysis of tax rateNovartis has a substantial business presence in many countries and is therefore subject to different income and expense items that are non-taxable (permanent dif-ferences) or are taxed at different rates in those tax juris-dictions. This results in a difference between our appli-cable tax rate and effective tax rate.
The main elements contributing to the difference between the Group’s overall applicable tax rate (which can change each year since it is calculated as the weighted average tax rate based on the pre-tax income of each subsidiary) and the effective tax rate are shown in the following table:
(As a percentage) 2020 2019 2018
Applicable tax rate 13.6 11.7 14.3
Effect of disallowed expenditures 4.6 4.8 1.7
Effect of utilization of tax losses
brought forward from prior periods – 0.3 – 0.1 – 0.1
Effect of income taxed at reduced rates – 0.3 – 0.7 – 0.4
Effect of income not subject to tax 1 – 0.7 0.0 – 3.7
Effect of tax credits and allowances – 2.3 – 2.3 – 2.3
Effect of release of
contingent consideration liability – 0.2 – 0.5 – 0.2
Effect of tax rate change
on current and deferred
tax assets and liabilities 2 0.3 – 1.4 – 0.1
Effect of write-off of deferred tax assets 3 0.2 4.0 0.2
Effect of write-down and reversal of
write-down of investments in subsidiaries – 0.8 – 0.6 0.0
Effect of prior-year items 2.3 2.2 – 0.5
Effect of other items 4 1.9 3.0 0.3
Effective tax rate for continuing operations 18.3 20.1 9.2
1 Included in 2018 is the effect of income not subject to tax (-3.7%) arising from the portion of the non-taxable gain on the divestment of the Group’s investment in GSK Consumer Healthcare Holdings Ltd. attributable to Switzerland.
2 2019 is mainly related to the revaluation of the deferred tax assets and liabilities resulting from the tax reforms enacted in Switzerland in 2019. Refer to Note 12 for additional disclosures.
3 2019 is primarily related to a non-cash, one-time deferred tax expense for the write-off of a deferred tax asset resulting from legal entity reorganizations.
4 In 2020, other items (+1.9%) include changes in uncertain tax positions (+2.0%) and other items (-0.1%). In 2019, other items (+3.0%) include changes in uncertain tax positions (+2.6%) and other items (+0.4%).
The utilization of tax-loss carry-forwards lowered the tax charge by USD 29 million in 2020, by USD 11 million in 2019, and by USD 19 million in 2018.
For the amount of taxes attributable to discontinued operations, see Note 30.

Notes to the Novartis Group consolidated financial statements
F-32
7. Earnings per share
2020 2019 2018
Net income attributable to shareholders of Novartis AG (USD millions)
- Continuing operations 8 072 7 142 12 797
- Discontinued operations 4 590 – 186
Total 8 072 11 732 12 611
Number of shares (in millions)
Weighted average number of shares outstanding used in basic earnings per share 2 277 2 291 2 319
Adjustment for vesting of restricted shares, restricted share units and dilutive shares from options 19 28 25
Weighted average number of shares in diluted earnings per share 2 296 2 319 2 344
Basic earnings per share (USD)
- Continuing operations 3.55 3.12 5.52
- Discontinued operations 2.00 – 0.08
Total 3.55 5.12 5.44
Diluted earnings per share (USD)
- Continuing operations 3.52 3.08 5.46
- Discontinued operations 1.98 – 0.08
Total 3.52 5.06 5.38
Basic earnings per share (EPS) is calculated by dividing net income attributable to shareholders of Novartis AG by the weighted average number of shares outstanding in a reporting period. This calculation excludes the aver-age number of issued shares purchased by the Group and held as treasury shares.
For diluted EPS, the weighted average number of shares outstanding is adjusted to assume the vesting of
all restricted shares, restricted share units, and the conversion of all potentially dilutive shares arising from options on Novartis shares that have been issued.
No options were excluded from the calculation of diluted EPS in 2020, 2019 or 2018, as all options were dilutive in all years.

Notes to the Novartis Group consolidated financial statements
F-33
8. Changes in consolidated statements of comprehensive incomeThe consolidated statements of comprehensive income include the Group’s net income for the year as well as all other valuation adjustments recorded in the Group’s con-solidated balance sheet which under IFRS are not
recorded in the consolidated income statement. These include fair value adjustments to financial instruments, actuarial gains or losses on defined benefit pension plans, and currency translation effects, net of tax.
Total value
Fair value Actuarial Cumulative adjustments
adjustments gains/(losses) currency attributable to Non-
on financial from defined translation Novartis AG controlling Total value
(USD millions) Note instruments benefit plans effects shareholders interest adjustments
Value adjustments at December 31, 2017,
as previously reported 395 – 5 064 329 – 4 340 – 21 – 4 361
Impact of adoption of IFRS 9 on retained
earnings and OCI – 177 – 177 – 177
Restated value adjustments at January 1, 2018 218 – 5 064 329 – 4 517 – 21 – 4 538
Fair value adjustments on deferred cash flow
hedges, net of taxes of USD -1 million 12 12 12
Fair value adjustments on equity securities,
net of taxes of USD -5 million 1 13 13 13
Net investment hedge 95 95 95
Defined benefit plans, net of taxes
of USD 69 million – 359 – 359 – 359
Currency translation effects 8.1 320 320 – 5 315
Total value adjustments in 2018 25 – 359 415 81 – 5 76
Fair value adjustments on equity securities
sold, reclassified to retained earnings – 16 – 16 – 16
Value adjustments at December 31, 2018 227 – 5 423 744 – 4 452 – 26 – 4 478
Fair value adjustments on deferred cash
flow hedges 1 1 1
Fair value adjustments on debt securities 1 1 1
Fair value adjustments on equity securities,
net of taxes of USD 47 million 1 – 47 – 47 – 47
Net investment hedge 44 44 44
Defined benefit plans, net of taxes
of USD -313 million 2 – 466 – 466 – 1 – 467
Currency translation effects 8.1 354 354 – 2 352
Total value adjustments in 2019 – 45 – 466 398 – 113 – 3 – 116
Fair value adjustments on equity securities
sold, reclassified to retained earnings – 95 – 95 – 95
Fair value adjustments related to divestments 33 – 30 3 3
Value adjustments at December 31, 2019 120 – 5 919 1 142 – 4 657 – 29 – 4 686
Fair value adjustments on equity securities,
net of taxes of USD -36 million 1 250 250 250
Net investment hedge – 201 – 201 – 201
Defined benefit plans, net of taxes
of USD -3 million 145 145 – 2 143
Currency translation effects 8.1 3 193 3 193 1 3 194
Total value adjustments in 2020 250 145 2 992 3 387 – 1 3 386
Fair value adjustments on equity securities
sold, reclassified to retained earnings – 150 – 150 – 150
Fair value adjustments related to divestments 2 2 2
Impact of change in ownership of consolidated entities – 1 – 1 1
Value adjustments at December 31, 2020 220 – 5 773 4 134 – 1 419 – 29 – 1 448
1 Includes fair value adjustments on equity securities designated as financial assets valued at fair value through other comprehensive income with no subsequent recycling into the consolidated income statement
2 Included in 2019 is a USD -358 million impact related to the revaluation of deferred tax assets on Swiss post-employment benefits that were previously recognized through other comprehensive income. This revaluation resulted from the Swiss tax reforms enacted by the voters in 2019. Refer to Note 12 for additional disclosures.

Notes to the Novartis Group consolidated financial statements
F-34
8.1) In 2020, no currency translation losses or gains were recycled through the income statement.
In 2019, cumulative currency translation gains of USD 129 million were recycled through the income state-ment mainly as a result of the spin-off of the Alcon busi-ness through a dividend in kind distribution to Novartis AG shareholders. See Notes 2 and 30.
In 2018, cumulative currency translation losses of USD 946 million were recycled through the income state-ment as a result of the divestment of the investment in GSK Consumer Healthcare Holdings Ltd. See Notes 2 and 4.
9. Property, plant and equipmentThe following table summarizes the movements of property, plant and equipment during 2020:
Machinery
Construction and other
(USD millions) Land Buildings in progress equipment Total
Cost
January 1, 2020 512 11 463 1 350 13 674 26 999
Cost of assets reclassified out of assets of
disposal group held for sale 1 11 117 36 168 332
Impact of acquisitions of businesses 2 19 5 26
Reclassifications 10 433 – 1 038 595
Additions 7 115 847 296 1 265
Disposals and derecognitions – 23 – 465 – 57 – 1 656 – 2 201
Currency translation effects 36 695 110 956 1 797
December 31, 2020 555 12 377 1 248 14 038 28 218
Accumulated depreciation
January 1, 2020 – 20 – 5 124 – 60 – 9 726 – 14 930
Accumulated depreciation on assets reclassified out of assets of
disposal group held for sale 1 – 58 – 4 – 101 – 163
Accumulated depreciation on disposals and derecognitions 17 433 11 1 543 2 004
Depreciation charge 2 – 491 – 827 – 1 318
Impairment charge – 15 – 194 – 10 – 228 – 447
Reversal of impairment charge 7 7
Currency translation effects – 1 – 373 – 3 – 731 – 1 108
December 31, 2020 – 19 – 5 807 – 66 – 10 063 – 15 955
Net book value at December 31, 2020 536 6 570 1 182 3 975 12 263
Commitments for purchases of property, plant and equipment 256
Capitalized borrowing costs 2
1 Note 2 provides additional disclosures related to the reclassification out of assets of the disposal group held for sale.2 Depreciation charge includes USD 38 million (USD 20 million for buildings and USD 18 million for machinery and other equipment), representing the cumulative amount of
depreciation charge on the disposal group held for sale for property, plant and equipment from the date of classification to held for sale, September 2018, to March 31, 2020, the date of reclassification out of assets of disposal group held for sale. See Note 2 for further details.

Notes to the Novartis Group consolidated financial statements
F-35
The following table summarizes the movements of property, plant and equipment during 2019:
Machinery
Construction and other
(USD millions) Land Buildings in progress equipment Total
Cost
January 1, 2019 696 14 135 2 042 17 155 34 028
Cost of assets related to discontinued operations 1 – 61 – 1 615 – 655 – 2 678 – 5 009
Reclassification to right-of-use assets 2 – 122 – 3 – 2 – 127
Cost of assets related to disposal group held for sale 3 – 3 – 12 – 8 – 23
Impact of acquisitions of businesses 10 24 1 9 44
Reclassifications 57 332 – 1 019 630
Additions 6 112 1 001 355 1 474
Disposals and derecognitions – 75 – 1 551 – 9 – 1 774 – 3 409
Currency translation effects 1 32 1 – 13 21
December 31, 2019 512 11 463 1 350 13 674 26 999
Accumulated depreciation
January 1, 2019 – 43 – 6 328 – 37 – 11 924 – 18 332
Accumulated depreciation on assets related to discontinued operations 1 8 562 7 1 541 2 118
Reclassification to right-of-use assets 2 26 26
Accumulated depreciation on assets related to disposal group held for sale 3 2 2
Accumulated depreciation on disposals and derecognitions 1 170 2 1 674 2 846
Depreciation charge 4 – 447 – 898 – 1 345
Impairment charge 5 – 10 – 51 – 34 – 110 – 205
Reversal of impairment charge 1 2 3
Currency translation effects – 1 – 33 – 9 – 43
December 31, 2019 – 20 – 5 124 – 60 – 9 726 – 14 930
Net book value at December 31, 2019 492 6 339 1 290 3 948 12 069
Commitments for purchases of property, plant and equipment 220
Capitalized borrowing costs 4
1 Represents the cost of assets and accumulated depreciation at January 1, 2019, related to the Alcon business reported as discontinued operations. Notes 1, 2 and 30 provide information related to discontinued operations.
2 Reclassification to right-of-use assets at January 1, 2019, upon adoption of IFRS 16 Leases. Refer to Note 1 for additional disclosure.3 Note 2 provides additional disclosures related to disposal group held for sale.4 No depreciation charge in the disposal group held for sale for the period from January 1, 2019, to December 31, 2019, was recorded.5 Impairments in the disposal group held for sale for the period from January 1, 2019, to December 31, 2019, were USD 2 million.

Notes to the Novartis Group consolidated financial statements
F-36
10. Right-of-use assets and lease liabilities
The following table summarizes the movements of the right-of-use assets of continuing operations:
(USD millions) 2020 2019
Right-of-use assets at January 1 1 677 1 554
Impact of acquisitions of businesses 32
Additions 346 537
Depreciation charge – 330 – 305
Lease contract terminations 1 – 63 – 98
Impact of divestments – 32 – 17
Currency translation effects 46 6
Total right-of-use assets at December 31 2 1 676 1 677
1 Lease contract terminations also includes modifications to existing leases that result in reductions to the right-of-use assets, and reductions due to sub-leasing.
2 No impairment charge was recorded in 2020 (2019: nil).
The following table shows the right-of-use assets carry-ing value and depreciation charge of continuing opera-tions at December 31, 2020 and 2019, by underlying class of asset:
December 31, Depreciation December 31, Depreciation
2020 charge 2019 charge
(USD millions) carrying value 2020 carrying value 2019
Land 528 11 537 14
Buildings 963 207 990 194
Vehicles 155 100 129 87
Machinery and
equipment, and
other assets 30 12 21 10
Total right-of-use
assets 1 676 330 1 677 305
The following table shows the lease liabilities of continuing operations by maturity at December 31, 2020 and 2019:
Lease liabilities Lease liabilities
Lease liabilities undiscounted Lease liabilities undiscounted
(USD millions) 2020 2020 2019 2019
Less than one year 286 338 246 295
Between one and two years 229 274 202 246
Between two and three years 186 226 163 202
Between three and four years 148 183 138 173
Between four and five years 129 160 119 150
After five years 1 027 2 326 1 081 2 419
Total lease liabilities 2 005 3 507 1 949 3 485
Less current portion of lease liabilities – 286 – 338 – 246 – 295
Non-current portion of lease liabilities 1 719 3 169 1 703 3 190
At December 31, 2020 and December 31, 2019, there were no material future cash outflows, including exten-sion options, excluded from the measurement of lease liabilities. The Group’s most material lease with a lease term extension, representing a lease liability value of USD 0.6 billion (2019: USD 0.6 billion), has a determined lease term end date of 2071 (2019: 2071).
In 2019, the Group completed sale and leaseback transactions for certain property, plant and equipment as part of its plans to consolidate sites. Transactions resulted in net cash inflows of USD 0.7 billion and the recognition of USD 96 million of lease liabilities, and USD 37 million of right-of-use assets. The right-of-use assets value reflects the proportion of the property, plant and equipment retained for a period of one to five years, with two five-year extension periods for certain right-of-use assets. The liabilities reflect the net present value of future lease payments. The net gain on the sale and leaseback transactions amounted to USD 478 million. There were no significant sale and leaseback transac-tions completed in 2020.
The following table provides additional disclosures related to right-of-use assets and lease liabilities of con-tinuing operations for 2020 and 2019:
(USD millions) 2020 2019
Interest expense on lease liabilities 1 67 66
Expense on short-term leases 4 7
Expense on low-value leases 7 8
Total cash outflows for leases 379 339
Thereof:
Cash outflows for short-term leases
and low-value leases 2 11 15
Payments of interest 3 56 51
Payments of lease liabilities 4 312 273
1 The weighted average interest rate is 3.4% (2019: 3.9%).2 Cash flows from short-term and low-value leases are included within total net cash
flows from operating activities. The portfolio of short-term leases to which the Group is committed to at December 31, 2020 and 2019, is similar to the portfolio of short-term leases the Group entered into during 2020 and 2019.
3 Included within total net cash flows from operating activities.4 Reported as cash outflows used in financing activities net of lease incentives received
of USD nil (2019: USD 33 million).
The net investment held and income from subleasing right-of-use assets were not significant for 2020 and 2019. Income from leasing Novartis property, plant and equipment to third parties for both 2020 and 2019 was not significant.
Note 30 provides additional disclosures on discon-tinued operations.

Notes to the Novartis Group consolidated financial statements
F-37
11. Goodwill and intangible assets
The following table summarizes the movements of goodwill and intangible assets in 2020:
Goodwill Intangible assets other than goodwill
In-process Currently Other
research and marketed intangible
(USD millions) Total development Technologies products assets Total
Cost
January 1, 2020 26 825 7 429 884 43 548 1 558 53 419
Cost of assets reclassified out of assets of
disposal group held for sale 1 10 276 1 112 2 1 400
Impact of acquisitions of businesses 2 580 8 600 196 218 9 014
Reclassifications 2 – 9 272 – 2 9 274
Additions 3 339 674 412 1 425
Disposals and derecognitions 4 – 421 – 101 – 39 – 11 – 572
Currency translation effects 916 208 58 2 568 205 3 039
December 31, 2020 30 321 6 893 1 115 57 333 2 384 67 725
Accumulated amortization
January 1, 2020 – 301 – 2 005 – 721 – 20 969 – 937 – 24 632
Accumulated amortization on assets reclassified
out of assets of disposal group held for sale 1 – 2 – 107 – 816 – 925
Amortization charge 5 – 72 – 3 215 – 175 – 3 462
Accumulated amortization on disposals
and derecognitions 4 421 101 39 6 567
Impairment charge 6 – 515 – 40 – 338 – 21 – 914
Currency translation effects – 21 – 92 – 46 – 1 267 – 145 – 1 550
December 31, 2020 – 322 – 2 193 – 885 – 26 566 – 1 272 – 30 916
Net book value at December 31, 2020 29 999 4 700 230 30 767 1 112 36 809
1 Note 2 provides additional disclosures related to the reclassification out of assets of disposal group held for sale as of March 31, 2020.2 Reclassifications between various asset categories as a result of product launches of acquired in-process research and development and completion of software development3 No addition for the disposal group held for sale for the period from January 1, 2020, to March 31, 20204 Derecognition of assets that are no longer being used or developed and are not considered to have a significant disposal value or other alternative use5 Amortization charge includes USD 102 million (USD 73 million for currently marketed products and USD 29 million for technologies), representing the cumulative amount of
amortization charge for the disposal group held for sale for intangible assets from the date of reclassification to held for sale, September 6, 2018, to March 31, 2020, the date of reclassification out of assets of disposal group held for sale. See Note 2 for further details.
6 Impairment charge includes USD 42 million on currently marketed products that were previously classified within assets of disposal group held for sale. See Note 2 for further details.

Notes to the Novartis Group consolidated financial statements
F-38
The following table summarizes the movements of goodwill and intangible assets in 2019:
Goodwill Intangible assets other than goodwill
In-process Currently Other
research and Alcon marketed Marketing intangible
(USD millions) Total development brand name Technologies products know-how assets Total
Cost
January 1, 2019 35 700 16 167 2 980 6 253 35 412 5 960 2 253 69 025
Cost of assets related to
discontinued operations 1 – 9 000 – 249 – 2 980 – 5 369 – 4 440 – 5 960 – 572 – 19 570
Cost of assets related to disposal group
held for sale, net 2 – 1 4 3
Impact of acquisitions of businesses 186 342 3 550 22 3 914
Reclassifications 3 – 9 069 9 069
Additions 4 265 243 259 767
Disposals and derecognitions 5 – 75 – 544 – 436 – 1 055
Currency translation effects – 61 49 254 32 335
December 31, 2019 26 825 7 429 884 43 548 1 558 53 419
Accumulated amortization
January 1, 2019 – 406 – 1 120 – 4 758 – 21 218 – 1 906 – 1 304 – 30 306
Accumulated amortization
on assets related to discontinued operations 1 101 3 4 184 2 592 1 906 128 8 813
Amortization charge 6 – 42 – 2 657 – 137 – 2 836
Accumulated amortization on disposals
and derecognitions 5 70 494 419 983
Impairment charge 6 – 984 – 105 – 54 – 32 – 1 175
Reversal of impairment charge 37 37
Currency translation effects 4 – 11 – 126 – 11 – 148
December 31, 2019 – 301 – 2 005 – 721 – 20 969 – 937 – 24 632
Net book value at December 31, 2019 26 524 5 424 163 22 579 621 28 787
1 Represents the cost of assets and accumulated amortization at January 1, 2019, related to the Alcon business reported as discontinued operations. Notes 1, 2 and 30 provide information related to discontinued operations.
2 Note 2 provides additional disclosures related to assets of disposal group held for sale.3 Reclassifications between various asset categories as a result of product launches of acquired in-process research and development and completion of software development4 No addition in the disposal group held for sale for the period from January 1, 2019, to December 31, 20195 Derecognition of assets that are no longer being used or developed and are not considered to have a significant disposal value or other alternative use6 No amortization or impairment charges related to the disposal group held for sale for the period from January 1, 2019, to December 31, 2019.
The following table summarizes the allocation of the net book values of goodwill and intangible assets by report-ing segment at December 31, 2020:
Goodwill Intangible assets other than goodwill
In-process Currently Other
research and marketed intangible
(USD millions) Total development Technologies products assets Total
Innovative Medicines 21 718 4 548 3 29 645 925 35 121
Sandoz 8 274 152 227 1 122 42 1 543
Corporate 7 145 145
Net book value at December 31, 2020 29 999 4 700 230 30 767 1 112 36 809
The following table summarizes the allocation of the net book values of goodwill and intangible assets by report-ing segment at December 31, 2019:
Goodwill Intangible assets other than goodwill
In-process Currently Other
research and marketed intangible
(USD millions) Total development Technologies products assets Total
Innovative Medicines 18 750 5 339 7 21 720 520 27 586
Sandoz 7 767 85 156 859 25 1 125
Corporate 7 76 76
Net book value at December 31, 2019 26 524 5 424 163 22 579 621 28 787

Notes to the Novartis Group consolidated financial statements
F-39
The Innovative Medicines and Sandoz Divisions’ cash-generating units, to which goodwill is allocated, each comprise a group of smaller cash-generating units. The valuation method of the recoverable amount of the cash-generating units, to which goodwill is allocated, is based on the fair value less costs of disposal.
The following assumptions are used in the calcula-tions:
Innovative
(As a percentage) Medicines Sandoz
Terminal growth rate 1.5 1.5
Discount rate (post-tax) 6.5 6.5
The discount rates for all divisions consider the Group’s weighted average cost of capital, adjusted to approxi-mate the weighted average cost of capital of a compa-rable market participant.
The fair value less costs of disposal, for all cash-gen-erating units containing goodwill, is reviewed for the impact of reasonably possible changes in key assump-tions. In particular, we considered an increase in the dis-count rate, a decrease in the terminal growth rate, and certain negative impacts on the forecasted cash flows. These reasonably possible changes in key assumptions did not indicate an impairment.
“Note 1. Significant accounting policies—Impairment of goodwill and intangible assets” provides additional disclosures on how the Group performs goodwill and intangible asset impairment testing.
The following table shows the intangible asset and goodwill impairment charges for continuing opera-tions for 2020, 2019 and 2018:
(USD millions) 2020 2019 2018
Innovative Medicines 1 – 768 – 669 – 592
Sandoz 2 – 141 – 506 – 249
Corporate – 5
Total – 914 – 1 175 – 841
1 2020 includes an impairment of USD 485 million related to the write-down of IPR&D related to cessation of clinical development program ZPL389 for atopic dermatitis and USD 181 million related to a partial write-down of the Votrient currently marketed product. 2019 includes an impairment of USD 416 million related to the write-down of IPR&D related to cessation of clinical development program EMA401 and a USD 108 million write-down related to the cessation of clinical development program for MOR106 for atopic dermatitis. 2018 includes an impairment of USD 400 million related to a partial write-down of the Votrient currently marketed product.
2 2019 includes an impairment of USD 442 million related to the write-down of IPR&D related to the discontinuation of the generic Advair® development program. 2018 includes impairments of USD 220 million related to the write-down of the allocated goodwill (USD 183 million) and the currently marketed products (USD 37 million) related to the retained Sandoz US dermatology business and generic US oral solids portfolio. See Note 2.
In 2020, there were no reversals of prior-year impairment charges (2019: USD 37 million; 2018: nil).
Note 30 provides additional disclosures on discontinued operations.

Notes to the Novartis Group consolidated financial statements
F-40
12. Deferred tax assets and liabilities
Pensions and
Property, other benefit Tax loss Other assets,
plant and Intangible obligations carry- provisions
(USD millions) equipment assets of associates Inventories forwards and accruals Total
Gross deferred tax assets at January 1, 2020 108 1 469 1 078 2 446 255 2 596 7 952
Gross deferred tax liabilities at January 1, 2020 – 390 – 3 610 – 291 – 287 – 7 – 1 325 – 5 910
Net deferred tax balance at January 1, 2020 – 282 – 2 141 787 2 159 248 1 271 2 042
At January 1, 2020 – 282 – 2 141 787 2 159 248 1 271 2 042
Credited/(charged) to income 89 110 – 25 212 – 164 71 293
Charged to equity 9 9
Charged to other comprehensive income – 3 – 36 – 39
Impact of acquisitions of businesses 5 – 1 945 – 3 408 34 – 1 501
Other movements – 53 58 38 – 25 5 – 35 – 12
Net deferred tax balance at December 31, 2020 – 241 – 3 918 797 2 343 497 1 314 792
Gross deferred tax assets at December 31, 2020 189 1 351 1 137 2 502 507 2 658 8 344
Gross deferred tax liabilities at December 31, 2020 – 430 – 5 269 – 340 – 159 – 10 – 1 344 – 7 552
Net deferred tax balance at December 31, 2020 – 241 – 3 918 797 2 343 497 1 314 792
After offsetting the following amount of deferred tax assets and liabilities within the same tax jurisdiction, the balance amounts to: 130
Deferred tax assets at December 31, 2020 8 214
Deferred tax liabilities at December 31, 2020 – 7 422
Net deferred tax balance at December 31, 2020 792
Gross deferred tax assets at January 1, 2019 191 1 233 1 188 3 722 273 2 175 8 782
Gross deferred tax liabilities at January 1, 2019 – 622 – 5 384 – 273 – 474 – 805 – 7 558
Net deferred tax balance at January 1, 2019 – 431 – 4 151 915 3 248 273 1 370 1 224
At January 1, 2019 – 431 – 4 151 915 3 248 273 1 370 1 224
Net deferred tax balance related to discontinued operations 1 82 1 403 – 123 – 248 – 39 – 217 858
Credited/(charged) to income 74 605 308 – 818 – 113 298 354
Charged to equity 8 75 – 166 – 83
Charged to other comprehensive income – 313 24 – 289
Impact of acquisitions of businesses 3 – 45 21 – 26 – 47
Other movements – 10 39 – 23 31 – 12 25
Net deferred tax balance at December 31, 2019 – 282 – 2 141 787 2 159 248 1 271 2 042
Gross deferred tax assets at December 31, 2019 108 1 469 1 078 2 446 255 2 596 7 952
Gross deferred tax liabilities at December 31, 2019 – 390 – 3 610 – 291 – 287 – 7 – 1 325 – 5 910
Net deferred tax balance at December 31, 2019 – 282 – 2 141 787 2 159 248 1 271 2 042
After offsetting the following amount of deferred tax assets and liabilities within the same tax jurisdiction, the balance amounts to: 43
Deferred tax assets at December 31, 2019 7 909
Deferred tax liabilities at December 31, 2019 – 5 867
Net deferred tax balance at December 31, 2019 2 042
1 Notes 1, 2 and 30 provide information related to discontinued operations.

Notes to the Novartis Group consolidated financial statements
F-41
The following table presents deferred tax assets and deferred tax liabilities, which are expected to have an impact on current taxes payable after more than 12 months:
(USD billions) 2020 2019
Expected to have an impact on current tax
payable after more than 12 months
– Deferred tax assets 4.5 4.3
– Deferred tax liabilities 7.0 5.2
Deferred tax liabilities have not been recognized for the withholding tax and other taxes that would be payable on the remittance of earnings of foreign subsidiaries, as the Group has the ability to control any future reversal and the unremitted earnings are retained in the foreign subsidiaries for reinvestment. The total unremitted earn-ings retained for reinvestment in the Group’s foreign sub-sidiaries that would be subject to withholding tax or other taxes if remitted to the Group are estimated at approxi-mately USD 27 billion in 2020 (2019: USD 26 billion).
Temporary differences on which no deferred tax has been provided as they are permanent in nature related to:
(USD billions) 2020 2019
Investments in subsidiaries 5 3
Goodwill from acquisitions – 27 – 24
The gross value of tax-loss carry-forwards that have or have not been capitalized as deferred tax assets, with their expiry dates, is as follows:
(USD millions) Not capitalized Capitalized 2020 total
One year 20 20
Two years 1 5 6
Three years 2 6 8
Four years 23 23
Five years 11 40 51
More than five years 1 3 400 2 291 5 691
Not subject to expiry 323 683 1 006
Total 3 780 3 025 6 805
1 Not capitalized more than five years includes USD 3.2 billion attributable to US state
tax-loss carry-forwards, of which USD 1.6 billion relates to The Medicines Company, which was acquired in 2020 (see Note 2).
(USD millions) Not capitalized Capitalized 2019 total
One year 14 0 14
Two years 28 0 28
Three years 28 6 34
Four years 16 46 62
Five years 127 37 164
More than five years 125 2 214 2 339
Not subject to expiry 310 35 345
Total 648 2 338 2 986
(USD millions) 2020 2019 2018
Tax losses carried forward
that expired 14 9 8
Deferred tax assets related to taxable losses of relevant Group entities are recognized to the extent it is consid-ered probable that future taxable profits will be available against which such losses can be utilized in the foresee-able future.
The Basel-Stadt cantonal tax reform was approved by voters in February 2019, with parts of the reform retro-actively enacted per January 1, 2019. The newly enacted tax rate resulted in a decrease of the blended cantonal and federal tax rate from 22% to 13%. This change impacted the Group’s Basel-Stadt-domiciled operating subsidiaries.
The Swiss federal tax reform was approved by vot-ers in May 2019. The enactment of the Swiss federal tax reform required the abolishment of the holding company tax regimes as of January 1, 2020. As a result, the hold-ing company tax rate increased from the current 8% to 13%, effective January 1, 2020.
The enactment of these Swiss tax reforms required a revaluation of the deferred tax assets and liabilities to the newly enacted tax rates at the date of enactment.
The following table shows the impact on the revalu-ation of deferred assets and liabilities in 2019, as at the respective dates of the enactment of the Swiss tax reforms:
Income
statement
continuing
(USD millions) operations Equity Total
Deferred tax asset
and liability revaluation
Items previously recognized
in consolidated income statement 234 234
Items previously recognized
in other comprehensive income 1 – 358 – 358
Total revaluation of deferred
tax assets and liabilities 234 – 358 – 124
1 Related to post-employment benefits

Notes to the Novartis Group consolidated financial statements
F-42
13. Financial and other non-current assets
Financial assets
(USD millions) 2020 2019
Equity securities 1 577 1 524
Debt securities 36 33
Fund investments 366 233
Total financial investments 1 979 1 790
Long-term receivables from finance subleases 83 66
Other long-term receivables 125 104
Contingent consideration receivables 1 625 399
Long-term loans, advances and security deposits 89 159
Total financial assets 2 901 2 518
1 Note 29 provides additional disclosures related to contingent considerations.
Other non-current assets
(USD millions) 2020 2019
Deferred compensation plans 471 414
Prepaid post-employment benefit plans 202 148
Other non-current assets 219 176
Total other non-current assets 892 738
14. Inventories(USD millions) 2020 2019
Raw material, consumables 967 751
Work in progress 3 324 3 024
Finished products 2 840 2 207
Total inventories 7 131 5 982
The following table shows the amount of inventory rec-ognized as an expense in “Cost of goods sold” in the consolidated income statements from continuing oper-ations:
(USD billions) 2020 2019 2018
Cost of goods sold – 8.5 – 8.5 – 8.3
The following table shows the recognized amount of inventory provision and reversals of inventory provision recorded in the consolidated income statements from continuing operations:
(USD millions) 2020 2019 2018
Inventory provisions – 702 – 752 – 603
Reversals of inventory provisions 255 218 216
The reversals mainly result from the release of products initially requiring additional quality control inspections and from the reassessment of inventory values manu-factured prior to regulatory approval but for which approval was subsequently received.
15. Trade receivables(USD millions) 2020 2019
Total gross trade receivables 8 310 8 396
Provisions for doubtful trade receivables – 93 – 95
Total trade receivables, net 8 217 8 301

Notes to the Novartis Group consolidated financial statements
F-43
The following table summarizes the movement in the provision for doubtful trade receivables:
(USD millions) 2020 2019 2018
January 1 – 95 – 126 – 190
Provisions related to discontinued operations 1 54
Impact of acquisitions of businesses – 1
Provisions for doubtful trade receivables charged to the consolidated income statement 2 – 59 – 89 – 47
Utilization of provisions for doubtful trade receivables 13 12 39
Reversal of provisions for doubtful trade receivables credited to the consolidated income statement 3 53 53 61
Currency translation effects – 5 1 12
December 31 – 93 – 95 – 126
1 Notes 1, 2 and 30 provide information related to discontinued operations.2 Provisions charged to the consolidated income statement from continuing operations were USD 30 million in 2018.3 Reversal of provisions credited to the consolidated income statement from continuing operations were USD 44 million in 2018.
The following table shows the trade receivables that are not overdue as specified in the payment terms and con-ditions established with Novartis customers, as well as an analysis of overdue amounts and related provisions for doubtful trade receivables:
(USD millions) 2020 2019
Not overdue 7 714 7 763
Past due for not more than one month 150 161
Past due for more than one month
but less than three months 118 123
Past due for more than three months
but less than six months 102 103
Past due for more than six months
but less than one year 77 96
Past due for more than one year 149 150
Provisions for doubtful trade receivables – 93 – 95
Total trade receivables, net 8 217 8 301
Trade receivable balances represent amounts due from our customers, which are mainly drug wholesalers, retail-ers, private health systems, government agencies, man-aged care providers, pharmacy benefit managers and government-supported healthcare systems. Novartis continues to monitor sovereign debt issues and eco-nomic conditions in the countries in which it operates, particularly in Argentina, Brazil, Greece, Italy, Portugal, Russia, Saudi Arabia, Spain and Turkey, and evaluates trade receivables in these countries for potential collec-tion risks. The majority of the outstanding trade receiv-ables from Portugal, Saudi Arabia, Spain and Greece are due directly from local governments or from govern-ment-funded entities. Deteriorating credit and economic conditions as well as other factors in these closely mon-itored countries have resulted in, and may continue to result in, an increase in the average length of time that it
takes to collect these trade receivables, and may require the Group to re-evaluate the expected credit loss amount of these trade receivables in future periods.
The following table shows the gross trade receiv-ables balance from these closely monitored countries at December 31, 2020 and 2019; the amounts that are past due for more than one year; and the related provisions that have been recorded:
(USD millions) 2020 2019
Total balance of gross trade
receivables from closely
monitored countries 1 505 1 588
Past due for more than one year 55 61
Provisions 27 24
At December 31, 2020, amounts past due for more than one year are not significant in any of these countries on a standalone basis.
Total trade receivables include amounts denomi-nated in the following major currencies:
(USD millions) 2020 2019
US dollar (USD) 3 311 3 466
Euro (EUR) 1 668 1 384
Japanese yen (JPY) 437 466
Russian ruble (RUB) 288 341
Chinese yuan (CNY) 208 279
British pound (GBP) 191 202
Australian dollar (AUD) 153 125
Brazilian real (BRL) 148 165
Canadian dollar (CAD) 125 129
Swiss franc (CHF) 124 89
Other currencies 1 564 1 655
Total trade receivables, net 8 217 8 301

Notes to the Novartis Group consolidated financial statements
F-44
16. Marketable securities, commodities, time deposits, derivative financial instruments, and cash and cash equivalentsMarketable securities, commodities, time deposits and derivative financial instruments
(USD millions) 2020 2019
Marketable securities 26 61
Commodities 111 110
Time deposits and short-term investments with original maturity more than 90 days 1 609 61
Derivative financial instruments 159 102
Total marketable securities, commodities, time deposits and derivative financial instruments 1 905 334
Cash and cash equivalents
(USD millions) 2020 2019
Current accounts 3 750 3 247
Time deposits and short-term investments with original maturity less than 90 days 5 908 7 865
Total cash and cash equivalents 9 658 11 112
17. Other current assets(USD millions) 2020 2019
VAT receivable 544 508
Withholding tax recoverable 73 108
Prepaid expenses 943 898
Receivables from associated companies 1
Other receivables and current assets 963 1 165
Total other current assets 2 523 2 680
18. Equity
The following table shows the movement in the share capital:
Movement Movement Movement
(USD millions) Jan 1, 2018 in year Dec 31, 2018 in year Dec 31, 2019 in year Dec 31, 2020
Share capital 969 – 25 944 – 8 936 – 23 913
Treasury shares – 100 31 – 69 – 11 – 80 27 – 53
Outstanding share capital 869 6 875 – 19 856 4 860
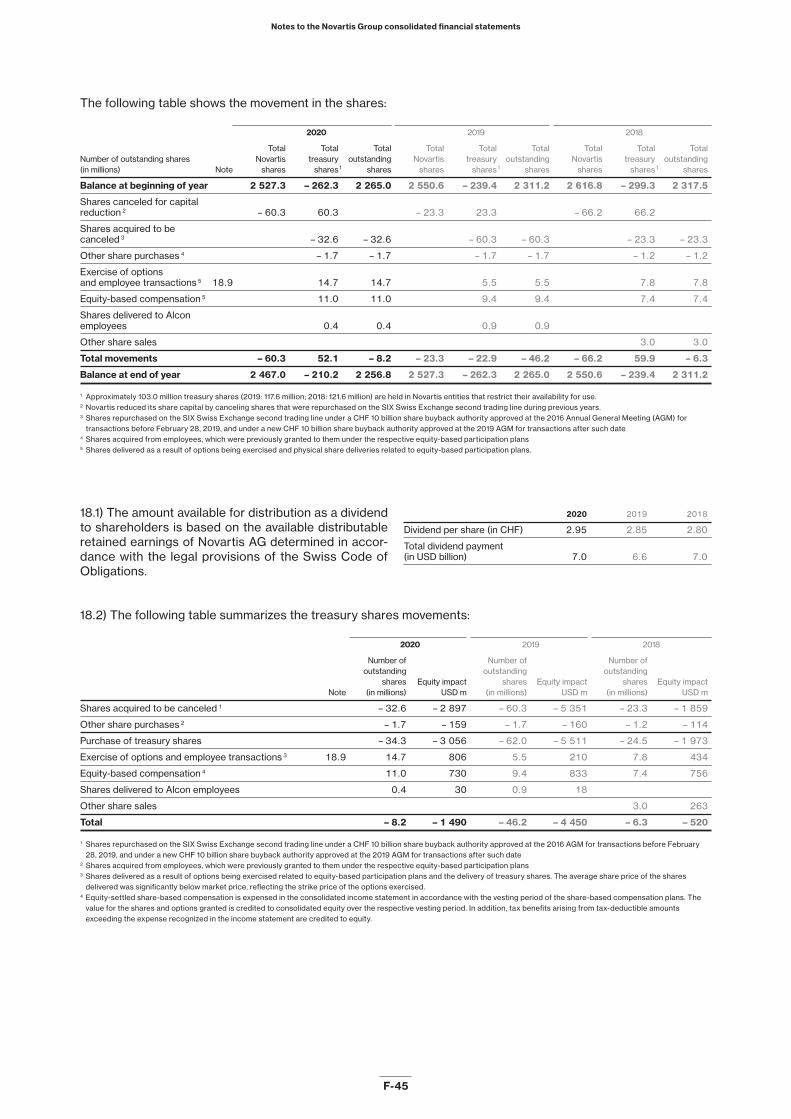
Notes to the Novartis Group consolidated financial statements
F-45
The following table shows the movement in the shares:
2020 2019 2018
Total Total Total Total Total Total Total Total Total
Number of outstanding shares Novartis treasury outstanding Novartis treasury outstanding Novartis treasury outstanding
(in millions) Note shares shares 1 shares shares shares 1 shares shares shares 1 shares
Balance at beginning of year 2 527.3 – 262.3 2 265.0 2 550.6 – 239.4 2 311.2 2 616.8 – 299.3 2 317.5
Shares canceled for capital
reduction 2 – 60.3 60.3 – 23.3 23.3 – 66.2 66.2
Shares acquired to be
canceled 3 – 32.6 – 32.6 – 60.3 – 60.3 – 23.3 – 23.3
Other share purchases 4 – 1.7 – 1.7 – 1.7 – 1.7 – 1.2 – 1.2
Exercise of options
and employee transactions 5 18.9 14.7 14.7 5.5 5.5 7.8 7.8
Equity-based compensation 5 11.0 11.0 9.4 9.4 7.4 7.4
Shares delivered to Alcon
employees 0.4 0.4 0.9 0.9
Other share sales 3.0 3.0
Total movements – 60.3 52.1 – 8.2 – 23.3 – 22.9 – 46.2 – 66.2 59.9 – 6.3
Balance at end of year 2 467.0 – 210.2 2 256.8 2 527.3 – 262.3 2 265.0 2 550.6 – 239.4 2 311.2
1 Approximately 103.0 million treasury shares (2019: 117.6 million; 2018: 121.6 million) are held in Novartis entities that restrict their availability for use.2 Novartis reduced its share capital by canceling shares that were repurchased on the SIX Swiss Exchange second trading line during previous years.3 Shares repurchased on the SIX Swiss Exchange second trading line under a CHF 10 billion share buyback authority approved at the 2016 Annual General Meeting (AGM) for
transactions before February 28, 2019, and under a new CHF 10 billion share buyback authority approved at the 2019 AGM for transactions after such date4 Shares acquired from employees, which were previously granted to them under the respective equity-based participation plans5 Shares delivered as a result of options being exercised and physical share deliveries related to equity-based participation plans.
18.1) The amount available for distribution as a dividend to shareholders is based on the available distributable retained earnings of Novartis AG determined in accor-dance with the legal provisions of the Swiss Code of Obligations.
2020 2019 2018
Dividend per share (in CHF) 2.95 2.85 2.80
Total dividend payment
(in USD billion) 7.0 6.6 7.0
18.2) The following table summarizes the treasury shares movements:
2020 2019 2018
Number of Number of Number of
outstanding outstanding outstanding
shares Equity impact shares Equity impact shares Equity impact
Note (in millions) USD m (in millions) USD m (in millions) USD m
Shares acquired to be canceled 1 – 32.6 – 2 897 – 60.3 – 5 351 – 23.3 – 1 859
Other share purchases 2 – 1.7 – 159 – 1.7 – 160 – 1.2 – 114
Purchase of treasury shares – 34.3 – 3 056 – 62.0 – 5 511 – 24.5 – 1 973
Exercise of options and employee transactions 3 18.9 14.7 806 5.5 210 7.8 434
Equity-based compensation 4 11.0 730 9.4 833 7.4 756
Shares delivered to Alcon employees 0.4 30 0.9 18
Other share sales 3.0 263
Total – 8.2 – 1 490 – 46.2 – 4 450 – 6.3 – 520
1 Shares repurchased on the SIX Swiss Exchange second trading line under a CHF 10 billion share buyback authority approved at the 2016 AGM for transactions before February 28, 2019, and under a new CHF 10 billion share buyback authority approved at the 2019 AGM for transactions after such date
2 Shares acquired from employees, which were previously granted to them under the respective equity-based participation plans3 Shares delivered as a result of options being exercised related to equity-based participation plans and the delivery of treasury shares. The average share price of the shares
delivered was significantly below market price, reflecting the strike price of the options exercised.4 Equity-settled share-based compensation is expensed in the consolidated income statement in accordance with the vesting period of the share-based compensation plans. The
value for the shares and options granted is credited to consolidated equity over the respective vesting period. In addition, tax benefits arising from tax-deductible amounts exceeding the expense recognized in the income statement are credited to equity.

Notes to the Novartis Group consolidated financial statements
F-46
18.3) In November 2020, Novartis entered into an irrevo-cable, non-discretionary arrangement with a bank to repurchase Novartis shares on the second trading line under its up-to USD 2.5 billion share buyback. Novartis is able to cancel this arrangement at any time but could be subject to a 90-day waiting period. The commitment under this arrangement therefore reflects the obligated purchases by the bank under such trading plan over a rolling 90-day period, or if shorter, until the maturity date of such trading plan.
The commitment under this arrangement amounted to USD 1.8 billion as of December 31, 2020.
In August 2020, Novartis entered into an irrevocable, non-discretionary arrangement with a bank to repur-chase Novartis shares to mitigate dilution related to par-ticipation plans of associates. Novartis was able to can-cel this arrangement at any time but would have been subjected to a 90-day waiting period.
This trading plan commitment was fully executed and expired, and as a consequence, there is no contingent liability related to this plan recognized as of December 31, 2020.
In 2019, Novartis entered into a similar irrevocable, non-discretionary arrangement with a bank to repur-chase Novartis shares on the second trading line under its up-to USD 5 billion share buyback and to repurchase Novartis shares to mitigate dilution related to participa-tion plans of associates. The commitment under this arrangement therefore reflects the obligated purchases by the bank under such trading plan over a rolling 90-day period, or if shorter, until the maturity date of such trad-ing plan.
The trading plan commitment was fully executed and expired, and as a consequence, there is no contingent liability related to this plan recognized as of December 31, 2019.
In 2018, Novartis entered into a similar irrevocable, non-discretionary arrangements with a bank to repur-chase Novartis shares. The commitments under this arrangement reflected the expected purchases by the bank under such trading plan over a rolling 90-day period.
The commitment under this arrangement amounted to USD 284 million as of December 31, 2018.
18.4) In October 2020, Novartis entered into an agree-ment with the market maker for its employee options to repurchase a portion of the outstanding written call
options. A total of 3.7 million options were repurchased under this agreement. This agreement was terminated in November 2020.
18.5) The impact of change in ownership of consolidated entities represents the excess of the amount paid to non-controlling interest over their carrying value and equity allocation to non-controlling interest due to change in ownership percentage.
18.6) Changes in non-controlling interests represent the impact on the non-controlling interest of transactions with minority shareholders, such as change in ownership percentage, dividend payments and other equity trans-actions.
18.7) Other movements includes, for subsidiaries in hyperinflationary economies, the impact of the restate-ment of the non-monetary assets and liabilities with the general price index at the beginning of the period as well as the restatement of the equity balances of the current year. In 2020, the amount recorded in equity related to hyperinflation accounting was USD 18 million (2019: USD 22 million; 2018: USD 38 million). See Note 29 for addi-tional disclosures.
18.8) In 2019, transaction costs of USD 253 million (2018: USD 79 million) net of tax of USD 36 million (2018: USD 20 million), that are directly attributable to the distribu-tion (spin-off) of Alcon Inc. to Novartis shareholders and that would otherwise have been avoided, were recorded as a deduction from equity. See Note 1 for further details. No transaction costs were recorded as a deduction from equity in 2020.
18.9) At December 31, 2020, the market maker held 1 mil-lion (2019: 13 million; 2018: 11 million) written call options, originally issued as part of the share-based compensa-tion for associates, that have not yet been exercised. The weighted average exercise price of these options is USD 60.09 (2019: USD 63.90; 2018: USD 62.70), and they have contractual lives of 10 years, with remaining lives up to three years (2019: four years; 2018: five years).
In December 2018, Novartis entered into an agree-ment with the market maker for its employee options to repurchase a portion of the outstanding written call options that are not exercised in exchange for treasury shares. During 2019, this agreement was fully executed.

Notes to the Novartis Group consolidated financial statements
F-47
19. Non-current financial debt
(USD millions) 2020 2019
Straight bonds 28 298 22 167
Liabilities to banks and other financial institutions 1 233 188
Total, including current portion of non-current financial debt 28 531 22 355
Less current portion of non-current financial debt – 2 272 – 2 002
Total non-current financial debt 26 259 20 353
1 Average interest rate 0.3% (2019: 0.2%)
All bonds are initially recorded at the amount of proceeds received, net of transaction costs. They are subsequently carried at amortized cost, with the difference between the proceeds, net of transaction costs, and the amount due on redemption being recognized as a charge to the consolidated income statement over the period of the relevant bond. Financial debts, including current finan-cial debts, contain only general default covenants. The Group is in compliance with these covenants.
The percentage of fixed-rate financial debt to total financial debt was 79% at December 31, 2020, and 82% at December 31, 2019.
The average interest rate on total financial debt in 2020 was 2.0% (2019: 2.4%).
Note 29 contains a maturity table of the Group’s future contractual interest payments commitments.
The following table provides a breakdown of straight bonds:
Nominal 2020 2019
amount Issuance Maturity (USD (USD
Coupon Currency (millions) year year Issuer Issue price millions) millions)
4.400% USD 1 000 2010 2020 Novartis Capital Corporation, New York, United States 99.237% 1 000
2.400% USD 1 500 2012 2022 Novartis Capital Corporation, New York, United States 99.225% 1 497 1 495
3.700% USD 500 2012 2042 Novartis Capital Corporation, New York, United States 98.325% 490 489
3.400% USD 2 150 2014 2024 Novartis Capital Corporation, New York, United States 99.287% 2 142 2 139
4.400% USD 1 850 2014 2044 Novartis Capital Corporation, New York, United States 99.196% 1 826 1 825
0.750% EUR 600 2014 2021 Novartis Finance S.A., Luxembourg, Luxembourg 99.134% 737 670
1.625% EUR 600 2014 2026 Novartis Finance S.A., Luxembourg, Luxembourg 99.697% 735 670
0.250% CHF 500 2015 2025 Novartis AG, Basel, Switzerland 100.640% 568 517
0.625% CHF 550 2015 2029 Novartis AG, Basel, Switzerland 100.502% 625 568
1.050% CHF 325 2015 2035 Novartis AG, Basel, Switzerland 100.479% 369 336
3.000% USD 1 750 2015 2025 Novartis Capital Corporation, New York, United States 99.010% 1 737 1 735
4.000% USD 1 250 2015 2045 Novartis Capital Corporation, New York, United States 98.029% 1 220 1 219
0.125% EUR 1 250 2016 2023 Novartis Finance S.A., Luxembourg, Luxembourg 99.127% 1 530 1 392
0.625% EUR 500 2016 2028 Novartis Finance S.A., Luxembourg, Luxembourg 98.480% 607 553
1.800% USD 1 000 2017 2020 Novartis Capital Corporation, New York, United States 99.609% 1 000
2.400% USD 1 000 2017 2022 Novartis Capital Corporation, New York, United States 99.449% 998 996
3.100% USD 1 000 2017 2027 Novartis Capital Corporation, New York, United States 99.109% 992 990
0.000% EUR 1 250 2017 2021 Novartis Finance S.A., Luxembourg, Luxembourg 99.133% 1 536 1 396
1.125% EUR 600 2017 2027 Novartis Finance S.A., Luxembourg, Luxembourg 99.874% 735 670
0.500% EUR 750 2018 2023 Novartis Finance S.A., Luxembourg, Luxembourg 99.655% 919 837
1.375% EUR 750 2018 2030 Novartis Finance S.A., Luxembourg, Luxembourg 99.957% 920 838
1.700% EUR 750 2018 2038 Novartis Finance S.A., Luxembourg, Luxembourg 99.217% 913 832
1.750% USD 1 000 2020 2025 Novartis Capital Corporation, New York, United States 99.852% 996
2.000% USD 1 250 2020 2027 Novartis Capital Corporation, New York, United States 99.909% 1 245
2.200% USD 1 500 2020 2030 Novartis Capital Corporation, New York, United States 99.869% 1 493
2.750% USD 1 250 2020 2050 Novartis Capital Corporation, New York, United States 97.712% 1 213
0.000% 1 EUR 1 850 2020 2028 Novartis Finance S.A., Luxembourg, Luxembourg 99.354% 2 255
Total straight bonds 28 298 22 167
1 The EUR 1 850 million bond issued in 2020 features a coupon step-up of 0.25% commencing with the first interest payment date after December 31, 2025, if one or both of the 2025 Patient Access Targets are not met. These 2025 Patient Access Targets are the 2025 Flagship Programs Patient Reach Target and the 2025 Strategic Innovative Therapies Patient Reach Target, as defined in the bond prospectus. As of December 31, 2020, there is no indication that these 2025 Patient Access Targets will not be met.

Notes to the Novartis Group consolidated financial statements
F-48
The following tables provide a breakdown of total non-current financial debt, including current portion by maturity and currency:
Breakdown by maturity:
(USD millions) 2020 2019
2020 2 002
2021 2 272 2 067
2022 2 631 2 583
2023 2 546 2 321
2024 2 142 2 139
2025 3 302 2 252
After 2025 15 638 8 991
Total 28 531 22 355
Breakdown by currency:
(USD millions) 2020 2019
US dollar (USD) 15 848 12 889
Euro (EUR) 10 888 7 861
Japanese yen (JPY) 194 184
Swiss franc (CHF) 1 563 1 421
Others 38
Total 28 531 22 355
The following table shows the comparison of balance sheet and fair value of total non-current financial debt, including current portion:
2020 2020 2019 2019
Balance Fair Balance Fair
(USD millions) sheet values sheet values
Straight bonds 28 298 31 359 22 167 23 701
Others 233 233 188 188
Total 28 531 31 592 22 355 23 889
The fair values of straight bonds are determined by quoted market prices. Other financial debts are recorded at notional amounts, which are a reasonable approxima-tion of the fair values.
20. Provisions and other non-current liabilities
(USD millions) 2020 2019
Accrued liability for employee benefits:
Defined benefit pension plans 1 3 538 3 469
Other long-term employee benefits and deferred compensation 637 546
Other post-employment benefits 1 543 612
Environmental remediation provisions 642 592
Provisions for product liabilities, governmental investigations and other legal matters 181 200
Contingent consideration 2 984 958
Other non-current liabilities 409 255
Total provisions and other non-current liabilities 6 934 6 632
1 Note 25 provides additional disclosures related to post-employment benefits.2 Note 29 provides additional disclosures related to contingent consideration.
Novartis believes that its total provisions are adequate based upon currently available information. However, given the inherent difficulties in estimating liabilities in this area, Novartis may incur additional costs beyond the
amounts provided. Management believes that such addi-tional amounts, if any, would not be material to the Group’s financial condition but could be material to the results of operations or cash flows in a given period.
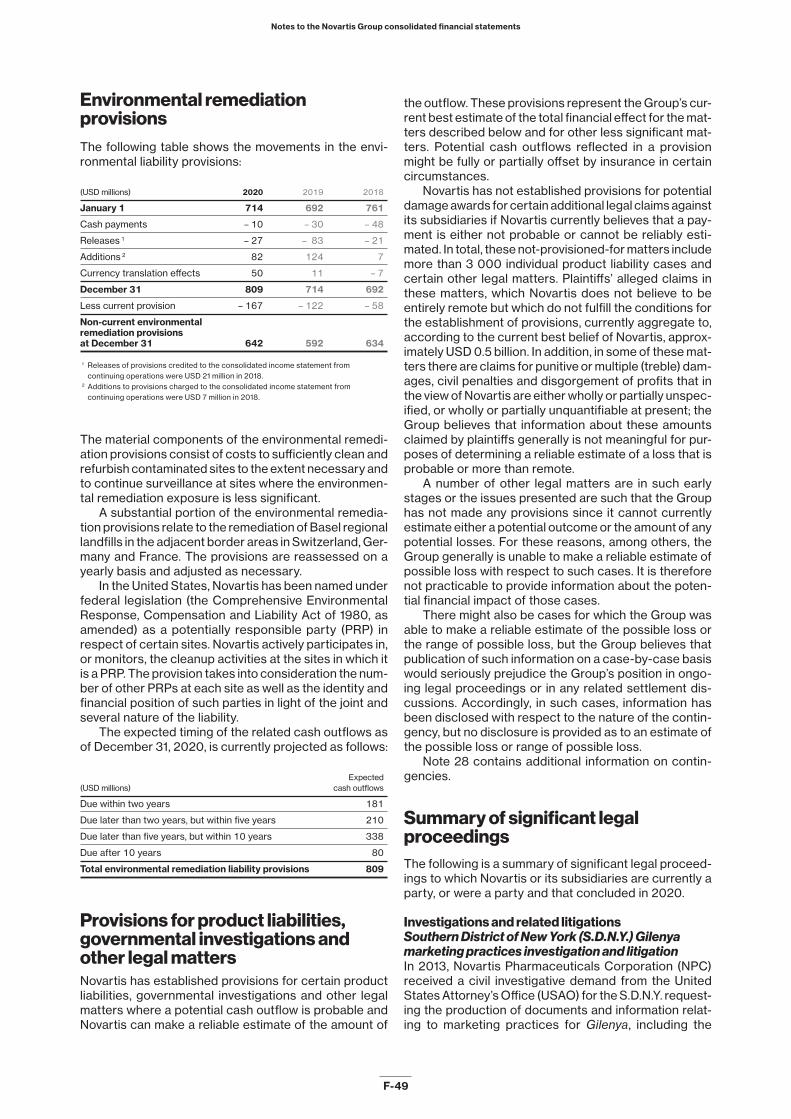
Notes to the Novartis Group consolidated financial statements
F-49
Environmental remediation provisionsThe following table shows the movements in the envi-ronmental liability provisions:
(USD millions) 2020 2019 2018
January 1 714 692 761
Cash payments – 10 – 30 – 48
Releases 1 – 27 – 83 – 21
Additions 2 82 124 7
Currency translation effects 50 11 – 7
December 31 809 714 692
Less current provision – 167 – 122 – 58
Non-current environmental
remediation provisions
at December 31 642 592 634
1 Releases of provisions credited to the consolidated income statement from continuing operations were USD 21 million in 2018.
2 Additions to provisions charged to the consolidated income statement from continuing operations were USD 7 million in 2018.
The material components of the environmental remedi-ation provisions consist of costs to sufficiently clean and refurbish contaminated sites to the extent necessary and to continue surveillance at sites where the environmen-tal remediation exposure is less significant.
A substantial portion of the environmental remedia-tion provisions relate to the remediation of Basel regional landfills in the adjacent border areas in Switzerland, Ger-many and France. The provisions are reassessed on a yearly basis and adjusted as necessary.
In the United States, Novartis has been named under federal legislation (the Comprehensive Environmental Response, Compensation and Liability Act of 1980, as amended) as a potentially responsible party (PRP) in respect of certain sites. Novartis actively participates in, or monitors, the cleanup activities at the sites in which it is a PRP. The provision takes into consideration the num-ber of other PRPs at each site as well as the identity and financial position of such parties in light of the joint and several nature of the liability.
The expected timing of the related cash outflows as of December 31, 2020, is currently projected as follows:
Expected
(USD millions) cash outflows
Due within two years 181
Due later than two years, but within five years 210
Due later than five years, but within 10 years 338
Due after 10 years 80
Total environmental remediation liability provisions 809
Provisions for product liabilities, governmental investigations and other legal matters Novartis has established provisions for certain product liabilities, governmental investigations and other legal matters where a potential cash outflow is probable and Novartis can make a reliable estimate of the amount of
the outflow. These provisions represent the Group’s cur-rent best estimate of the total financial effect for the mat-ters described below and for other less significant mat-ters. Potential cash outflows reflected in a provision might be fully or partially offset by insurance in certain circumstances.
Novartis has not established provisions for potential damage awards for certain additional legal claims against its subsidiaries if Novartis currently believes that a pay-ment is either not probable or cannot be reliably esti-mated. In total, these not-provisioned-for matters include more than 3 000 individual product liability cases and certain other legal matters. Plaintiffs’ alleged claims in these matters, which Novartis does not believe to be entirely remote but which do not fulfill the conditions for the establishment of provisions, currently aggregate to, according to the current best belief of Novartis, approx-imately USD 0.5 billion. In addition, in some of these mat-ters there are claims for punitive or multiple (treble) dam-ages, civil penalties and disgorgement of profits that in the view of Novartis are either wholly or partially unspec-ified, or wholly or partially unquantifiable at present; the Group believes that information about these amounts claimed by plaintiffs generally is not meaningful for pur-poses of determining a reliable estimate of a loss that is probable or more than remote.
A number of other legal matters are in such early stages or the issues presented are such that the Group has not made any provisions since it cannot currently estimate either a potential outcome or the amount of any potential losses. For these reasons, among others, the Group generally is unable to make a reliable estimate of possible loss with respect to such cases. It is therefore not practicable to provide information about the poten-tial financial impact of those cases.
There might also be cases for which the Group was able to make a reliable estimate of the possible loss or the range of possible loss, but the Group believes that publication of such information on a case-by-case basis would seriously prejudice the Group’s position in ongo-ing legal proceedings or in any related settlement dis-cussions. Accordingly, in such cases, information has been disclosed with respect to the nature of the contin-gency, but no disclosure is provided as to an estimate of the possible loss or range of possible loss.
Note 28 contains additional information on contin-gencies.
Summary of significant legal proceedingsThe following is a summary of significant legal proceed-ings to which Novartis or its subsidiaries are currently a party, or were a party and that concluded in 2020.
Investigations and related litigationsSouthern District of New York (S.D.N.Y.) Gilenya marketing practices investigation and litigationIn 2013, Novartis Pharmaceuticals Corporation (NPC) received a civil investigative demand from the United States Attorney’s Office (USAO) for the S.D.N.Y. request-ing the production of documents and information relat-ing to marketing practices for Gilenya, including the
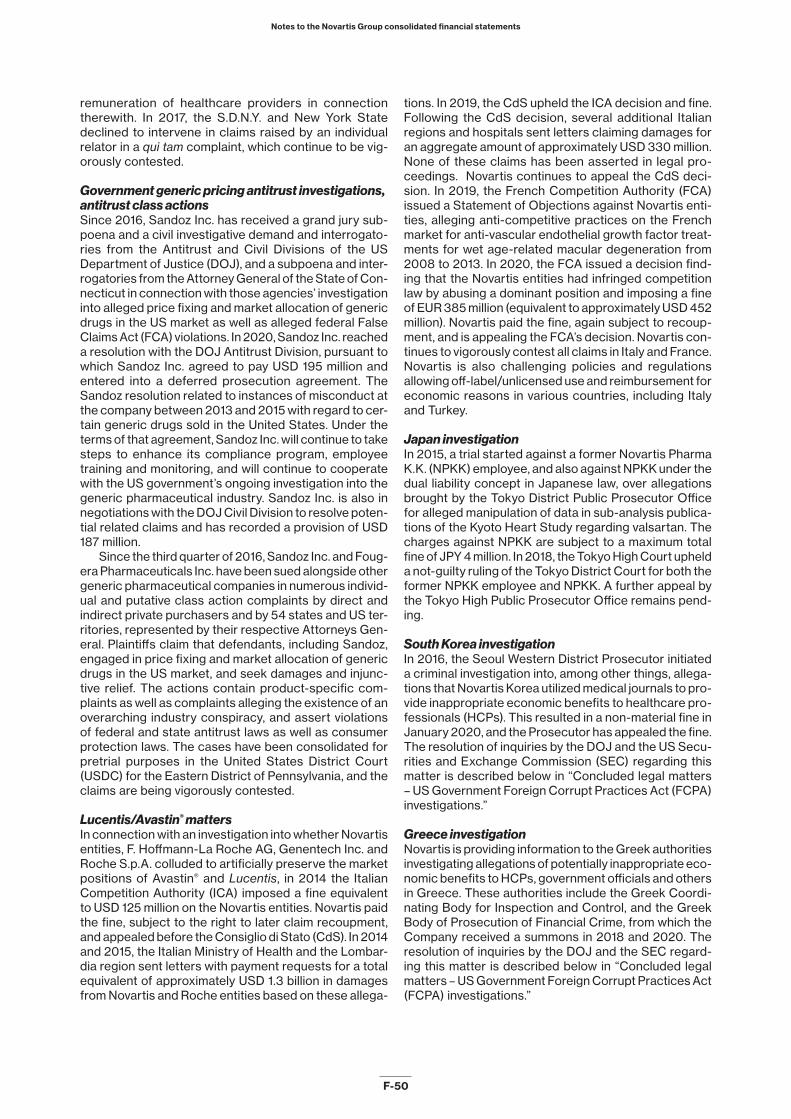
Notes to the Novartis Group consolidated financial statements
F-50
remuneration of healthcare providers in connection therewith. In 2017, the S.D.N.Y. and New York State declined to intervene in claims raised by an individual relator in a qui tam complaint, which continue to be vig-orously contested.
Government generic pricing antitrust investigations, antitrust class actionsSince 2016, Sandoz Inc. has received a grand jury sub-poena and a civil investigative demand and interrogato-ries from the Antitrust and Civil Divisions of the US Department of Justice (DOJ), and a subpoena and inter-rogatories from the Attorney General of the State of Con-necticut in connection with those agencies’ investigation into alleged price fixing and market allocation of generic drugs in the US market as well as alleged federal False Claims Act (FCA) violations. In 2020, Sandoz Inc. reached a resolution with the DOJ Antitrust Division, pursuant to which Sandoz Inc. agreed to pay USD 195 million and entered into a deferred prosecution agreement. The Sandoz resolution related to instances of misconduct at the company between 2013 and 2015 with regard to cer-tain generic drugs sold in the United States. Under the terms of that agreement, Sandoz Inc. will continue to take steps to enhance its compliance program, employee training and monitoring, and will continue to cooperate with the US government’s ongoing investigation into the generic pharmaceutical industry. Sandoz Inc. is also in negotiations with the DOJ Civil Division to resolve poten-tial related claims and has recorded a provision of USD 187 million.
Since the third quarter of 2016, Sandoz Inc. and Foug-era Pharmaceuticals Inc. have been sued alongside other generic pharmaceutical companies in numerous individ-ual and putative class action complaints by direct and indirect private purchasers and by 54 states and US ter-ritories, represented by their respective Attorneys Gen-eral. Plaintiffs claim that defendants, including Sandoz, engaged in price fixing and market allocation of generic drugs in the US market, and seek damages and injunc-tive relief. The actions contain product-specific com-plaints as well as complaints alleging the existence of an overarching industry conspiracy, and assert violations of federal and state antitrust laws as well as consumer protection laws. The cases have been consolidated for pretrial purposes in the United States District Court (USDC) for the Eastern District of Pennsylvania, and the claims are being vigorously contested.
Lucentis/Avastin® mattersIn connection with an investigation into whether Novartis entities, F. Hoffmann-La Roche AG, Genentech Inc. and Roche S.p.A. colluded to artificially preserve the market positions of Avastin® and Lucentis, in 2014 the Italian Competition Authority (ICA) imposed a fine equivalent to USD 125 million on the Novartis entities. Novartis paid the fine, subject to the right to later claim recoupment, and appealed before the Consiglio di Stato (CdS). In 2014 and 2015, the Italian Ministry of Health and the Lombar-dia region sent letters with payment requests for a total equivalent of approximately USD 1.3 billion in damages from Novartis and Roche entities based on these allega-
tions. In 2019, the CdS upheld the ICA decision and fine. Following the CdS decision, several additional Italian regions and hospitals sent letters claiming damages for an aggregate amount of approximately USD 330 million. None of these claims has been asserted in legal pro-ceedings. Novartis continues to appeal the CdS deci-sion. In 2019, the French Competition Authority (FCA) issued a Statement of Objections against Novartis enti-ties, alleging anti-competitive practices on the French market for anti-vascular endothelial growth factor treat-ments for wet age-related macular degeneration from 2008 to 2013. In 2020, the FCA issued a decision find-ing that the Novartis entities had infringed competition law by abusing a dominant position and imposing a fine of EUR 385 million (equivalent to approximately USD 452 million). Novartis paid the fine, again subject to recoup-ment, and is appealing the FCA’s decision. Novartis con-tinues to vigorously contest all claims in Italy and France. Novartis is also challenging policies and regulations allowing off-label/unlicensed use and reimbursement for economic reasons in various countries, including Italy and Turkey.
Japan investigationIn 2015, a trial started against a former Novartis Pharma K.K. (NPKK) employee, and also against NPKK under the dual liability concept in Japanese law, over allegations brought by the Tokyo District Public Prosecutor Office for alleged manipulation of data in sub-analysis publica-tions of the Kyoto Heart Study regarding valsartan. The charges against NPKK are subject to a maximum total fine of JPY 4 million. In 2018, the Tokyo High Court upheld a not-guilty ruling of the Tokyo District Court for both the former NPKK employee and NPKK. A further appeal by the Tokyo High Public Prosecutor Office remains pend-ing.
South Korea investigationIn 2016, the Seoul Western District Prosecutor initiated a criminal investigation into, among other things, allega-tions that Novartis Korea utilized medical journals to pro-vide inappropriate economic benefits to healthcare pro-fessionals (HCPs). This resulted in a non-material fine in January 2020, and the Prosecutor has appealed the fine. The resolution of inquiries by the DOJ and the US Secu-rities and Exchange Commission (SEC) regarding this matter is described below in “Concluded legal matters – US Government Foreign Corrupt Practices Act (FCPA) investigations.”
Greece investigationNovartis is providing information to the Greek authorities investigating allegations of potentially inappropriate eco-nomic benefits to HCPs, government officials and others in Greece. These authorities include the Greek Coordi-nating Body for Inspection and Control, and the Greek Body of Prosecution of Financial Crime, from which the Company received a summons in 2018 and 2020. The resolution of inquiries by the DOJ and the SEC regard-ing this matter is described below in “Concluded legal matters – US Government Foreign Corrupt Practices Act (FCPA) investigations.”

Notes to the Novartis Group consolidated financial statements
F-51
Antitrust class actionsExforgeSince 2018, Novartis Group companies as well as other pharmaceutical companies have been sued by various direct and indirect purchasers of Exforge in multiple US individual and putative class action complaints. They claim that Novartis made a reverse payment in the form of an agreement not to launch an authorized generic, alleging violations of federal antitrust law and state anti-trust, consumer protection and common laws, and seek-ing damages as well as injunctive relief. The cases have been consolidated in the S.D.N.Y. and the claims are being vigorously contested.
Product liability litigationReclast NPC is a defendant in more than 20 US product liability actions involving Reclast and alleging atypical femur fracture injuries, all of which are in New Jersey state or federal court and in California state court, coordinated with claims against other bisphosphonate manufactur-ers. The claims are being vigorously contested.
Taxotere® (docetaxel)Sandoz is a defendant in more than 3 000 US product liability actions involving Taxotere® (docetaxel), an oncology product, many of which have been transferred to a multidistrict litigation in the Eastern District of Lou-isiana. The complaints allege misleading marketing and that Sanofi, as innovator, and several 505(b)(2) NDA hold-ers (including Sandoz) failed to warn of the risk of per-manent alopecia/hair loss. The claims are being vigor-ously contested.
AmiodaroneSandoz entities are named in less than five individual and multi-plaintiff US product liability cases involving amiodarone, a cardiac drug indicated to treat life-threat-ening arrhythmias that have not responded to other treat-ment. The complaints allege failure to warn, off-label pro-motion and failure to include medication guides to pharmacies. The claims are being vigorously contested.
Sartans and ranitidineSince 2018, claims have been brought against Sandoz and other pharmaceutical companies alleging injury from carcinogenic impurities found in valsartan and valsartan/HCT film-coated tablets and/or losartan marketed or manufactured by Sandoz. These claims include several putative class actions in Canada. Claims have also been brought alleging injury from carcinogenic impurities in ranitidine-containing medicines. These claims also include several putative class actions in Canada and a multidistrict litigation in Florida. All of these claims are being vigorously contested.
TasignaNPC is a defendant in more than 80 US product liability actions involving Tasigna, alleging that the product caused various cardiovascular effects and that NPC failed to provide adequate warnings about those alleged side effects. The actions are pending in New Jersey state court and in federal courts in various jurisdictions. The claims are being vigorously contested.
Other mattersAverage Wholesale Price (AWP) litigationLawsuits have been brought, the latest in February 2016, by various US state governmental entities and private parties against various pharmaceutical companies, including NPC, alleging that they fraudulently overstated the AWP that is or has been used by payors, including state Medicaid agencies, to calculate reimbursements to healthcare providers. NPC remains a defendant in a putative class action brought by private payors in New Jersey, and vigorously contests those claims.
Aimovig–Amgen disputeIn 2015 and 2017, Novartis and Amgen entered into agreements regarding the development and commer-cialization of Aimovig, which the companies co-commer-cialize in the US and to which Novartis has exclusive rights in all territories outside the US, excluding Japan. Amgen issued a termination notice in April 2019 based on an alleged material breach of the collaboration agree-ments, and this notice, as well as other ancillary matters, are the subject of legal proceedings between Novartis and Amgen. Novartis disputes Amgen’s allegations vig-orously. In 2020, the court ruled that Amgen did not have grounds to terminate the 2017 agreement and dismissed that portion of their lawsuit. The collaboration continues during the litigation between the companies, and will remain in force until and unless a final court decision ter-minates the agreements.
Shareholder Derivative LawsuitIn 2021, NPC, Sandoz Inc., Novartis Capital Corporation and certain present and former directors and officers of Novartis were named as defendants, and Novartis was named as a nominal defendant, in a purported share-holder derivative lawsuit filed in New York state court. The plaintiff, derivatively as a purported Novartis share-holder on behalf of Novartis, seeks damages and other remedies based on alleged conduct by the corporate and individual defendants. The claims are being vigor-ously contested.
Concluded legal mattersS.D.N.Y. marketing practices investigation and litigationIn 2013, the US government filed a civil complaint in inter-vention to an individual qui tam action against NPC in the USDC for the S.D.N.Y. The complaint, as subsequently amended, asserted federal FCA and common law claims with respect to speaker programs and other promotional activities for certain NPC cardiovascular medications (Lotrel, Starlix and Valturna) allegedly serving as mech-anisms to provide kickbacks to HCPs. Also in 2013, New York State filed a civil complaint in intervention assert-ing similar claims. In 2020, Novartis finalized its settle-ment agreement with the S.D.N.Y, the New York State Attorney General and the individual relator to resolve their claims. As part of this settlement, Novartis agreed to pay USD 0.7 billion, and has agreed to new corporate integrity obligations with the Office of Inspector General of the US Department of Health and Human Services.

Notes to the Novartis Group consolidated financial statements
F-52
U.S. Government Foreign Corrupt Practices Act (FCPA) investigationsIn 2020, Novartis reached settlements with the DOJ and the SEC resolving all FCPA investigations into historical conduct by Novartis and its subsidiaries. These investi-gations were previously disclosed in Note 20 to the Con-solidated Financial Statements in our 2019 Annual Report and 2019 Form 20-F under the headings “Inves-tigations and related litigations – Greece investigation,” “Investigations and related litigations – South Korea investigation” and “Investigations and related litigations – Asia/Russia investigation.” As part of the coordinated resolution of these investigations, Novartis and certain of its current and former subsidiaries agreed to pay USD 0.3 billion. To resolve the DOJ investigation, both Novartis Hellas S.A.C.I. and Alcon Pte Ltd., a former Novartis sub-sidiary, entered into separate deferred prosecution agreements (DPA) with the DOJ. The Novartis Hellas DPA contained no allegations relating to any bribery of Greek politicians, which is consistent with what Novartis found in its own internal investigation. To resolve the SEC investigation, Novartis AG reached an agreement per-taining to internal controls and books and records viola-tions in Greece, Vietnam and South Korea, which also addressed certain internal controls and books and records issues related to Alcon China’s placement of surgical devices. Other developments in Greece and South Korea are described above in “Investigations and related litigations – Greece investigation” and “Investi-gations and related litigations – South Korea investiga-tion,” respectively. The matters disclosed in Note 20 to the Consolidated Financial Statements in our 2019 Annual Report and 2019 Form 20-F under the heading “Investigations and related litigations – Asia/Russia investigation” are now concluded.
EnoxaparinIn 2015, Sandoz and Momenta Pharmaceuticals were sued in a putative antitrust class action in federal court
in Tennessee alleging that Momenta and Sandoz engaged in anticompetitive and unfair business conduct with regard to sales of enoxaparin. In 2019, Sandoz agreed to pay USD 85 million to resolve the class action. The matter is now concluded.
Summary of product liability, governmental investigations and other legal matters provision movements
(USD millions) 2020 2019 2018
January 1 1 369 340 351
Provisions related to
discontinued operations 1 – 42
Impact of acquisitions of businesses 11 10
Cash payments – 1 863 – 116 – 118
Releases of provisions 2 – 31 – 52 – 107
Additions to provisions 3 1 018 1 230 220
Currency translation effects – 17 – 1 – 6
December 31 487 1 369 340
Less current portion – 306 – 1 169 – 126
Non-current product
liabilities, governmental
investigations and other
legal matters provisions
at December 31 181 200 214
1 Notes 1, 2 and 30 provide information related to discontinued operations.2 Releases of provisions credited to the consolidated income statement from
continuing operations were USD 107 million in 2018.3 Additions to provisions charged to the consolidated income statement from
continuing operations were USD 220 million in 2018.
Novartis believes that its total provisions for investiga-tions, product liability, arbitration and other legal matters are adequate based upon currently available information. However, given the inherent difficulties in estimating lia-bilities, there can be no assurance that additional liabil-ities and costs will not be incurred beyond the amounts provided.
21. Current financial debt and derivative financial instruments(USD millions) 2020 2019
Interest-bearing accounts of associates
payable on demand 1 2 085 1 836
Bank and other financial debt 2 976 719
Commercial paper 4 258 2 289
Current portion of non-current financial debt 2 272 2 002
Derivative financial instruments 194 185
Total current financial debt and derivative
financial instruments 9 785 7 031
1 Weighted average interest rate 0.4% (2019: 0.5%)2 Weighted average interest rate 5.0% (2019: 12.9%)
The consolidated balance sheet amounts of current financial debt, other than the current portion of non- current financial debt, approximate the estimated fair value due to the short-term nature of these instruments.
Details on commercial papers and short term bor-rowings are provided under “Liquidity risk” in Note 29.

Notes to the Novartis Group consolidated financial statements
F-53
22. Provisions and other current liabilities
(USD millions) 2020 2019
Taxes other than income taxes 749 471
Restructuring provisions 459 438
Accrued expenses for goods and services received but not invoiced 1 167 1 046
Accruals for royalties 732 653
Accrued interests on financial debt 133 98
Provisions for deductions from revenue 6 256 5 595
Accruals for compensation and benefits, including social security 2 286 2 464
Environmental remediation liabilities 167 122
Deferred income 56 114
Provisions for product liabilities, governmental investigations and other legal matters 1 306 1 169
Accrued share-based payments 269 326
Contingent considerations 2 62 78
Commitment for repurchase of own shares 3 1 769
Other payables 716 764
Total provisions and other current liabilities 15 127 13 338
1 Note 20 provides additional disclosures related to legal provisions.2 Note 29 provides additional disclosures related to contingent considerations.3 Note 18 provides additional disclosures related to commitment for repurchase of own shares.
Provisions are based upon management’s best estimate and adjusted for actual experience. Such adjustments to historic estimates have not been material.

Notes to the Novartis Group consolidated financial statements
F-54
Provisions for deductions from revenue
The following table shows the movement of the provisions for deductions from revenue:
Income statement charge2
Revenue
deductions Effect of Change in
Revenue provisions currency provisions Revenue
deductions related to translation offset against deductions
provisions at discontinued and business Payments/ Adjustments gross trade provisions at
(USD millions) January 1 operations1 combinations utilizations of prior years Current year receivables December 31
2020
US-specific healthcare plans
and program rebates 1 981 – 5 560 – 107 5 739 2 053
Non-US-specific healthcare plans
and program rebates 1 769 167 – 2 597 7 2 940 – 14 2 272
Non-healthcare plans
and program-related rebates,
returns and other deductions 1 845 67 – 11 137 – 51 11 094 113 1 931
Total 2020 5 595 234 – 19 294 – 151 19 773 99 6 256
2019
US-specific healthcare plans
and program rebates 1 883 0 – 5 183 – 193 5 474 1 981
Non-US-specific healthcare plans
and program rebates 1 625 – 28 – 19 – 2 467 – 2 2 659 1 1 769
Non-healthcare plans
and program-related rebates,
returns and other deductions 1 754 – 166 9 – 11 698 – 25 11 868 103 1 845
Total 2019 5 262 – 194 – 10 – 19 348 – 220 20 001 104 5 595
2018
US-specific healthcare plans
and program rebates 1 590 – 4 158 – 90 4 541 1 883
Non-US-specific healthcare plans
and program rebates 1 356 – 78 – 2 182 83 2 555 – 109 1 625
Non-healthcare plans
and program-related rebates,
returns and other deductions 1 726 – 51 – 12 227 – 91 11 956 441 1 754
Total 2018 4 672 – 129 – 18 567 – 98 19 052 332 5 262
1 Notes 1, 2 and 30 provide information related to discontinued operations.2 Charges to the consolidated income statement from continuing operations were USD 18 248 million in 2018.
Restructuring provisions movements
(USD millions) 2020 2019 2018
January 1 438 507 153
Provisions related to
discontinued operations 1 – 8
Additions 2 354 492 534
Cash payments – 268 – 479 – 145
Releases 3 – 87 – 72 – 33
Currency translation effects 22 – 2 – 2
December 31 459 438 507
1 Notes 1, 2 and 30 provide information related to discontinued operations.2 Additions to provisions charged to the consolidated income statement from
continuing operations were USD 521 million in 2018.3 Reversal of provisions credited to the consolidated income statement from continuing
operations were USD 31 million in 2018.
In 2020, additions to provisions of USD 354 million were mainly related to the following reorganizations:
• The Innovative Medicines Division restructured its field force and supporting functions in Region Europe.
• The Sandoz Division initiatives to realign its organiza-tional structures to improve competiveness that com-menced in 2019 continued.
• Group-wide initiatives to streamline Novartis Technical Operations through the setup of operations centers and implementation of new technologies, in the Innovative Medicines Division and the Sandoz Division, continued. In addition, Novartis Business Services con-tinued the phased implementation of the new operat-ing model to change outsourcing structures and tran-sition activities to service centers.
In 2019, additions to provisions of USD 492 million were mainly related to the following reorganizations:• The Innovative Medicines Division restructured its field
force and supporting functions in Latin America, and following the Xiidra acquisition, its Ophthalmology field force in the US.
• The Sandoz Division initiatives to realign its organiza-tional structures to improve competiveness. These ini-

Notes to the Novartis Group consolidated financial statements
F-55
tiatives include reduction in its headquarters, global functions and countries workforce, and the closure of its development center in Holzkirchen, Germany.
• Group-wide initiatives to streamline Novartis Technical Operations and implement new technologies, mainly in the Innovative Medicines Division and in the Sandoz Division, continued. In addition, Novartis Business Ser-vices launched the next phase of the new operating model to change outsourcing structures and transition activities to service centers.
In 2018, additions to provisions of USD 534 million were mainly related to the following reorganizations:
• The Innovative Medicines Division’s Oncology business unit initiative to streamline its organizational structure. The objective was to enhance agility and efficiency, resulting in an acceleration of operational execution. In addition, a program to reorganize the Japanese busi-ness model was launched. Region Europe transformed its approach to market in light of the changing product portfolio. The objective was to speed up patient access.
• Group-wide initiatives to streamline Novartis Technical Operations and implement new technologies, mainly in the Innovative Medicines Division and in the Sandoz Division, continued. In addition, Novartis Business Ser-vices launched an initiative to reorganize its organiza-tional structure to achieve cost efficiencies by shifting activities to global service centers.
23. Details to the consolidated statements of cash flows23.1) Reversal of non-cash items and other adjustments from continuing operations
(USD millions) 2020 2019 2018
Depreciation, amortization and impairments on:
Property, plant and equipment 1 758 1 547 1 783
Right-of-use assets 1 330 305
Intangible assets 4 376 3 974 3 428
Financial assets 2 – 335 – 38 6
Change in provisions and other non-current liabilities 1 411 1 871 895
Gains on disposal and other adjustments on property, plant and equipment; intangible assets;
financial assets; and other non-current assets, net – 478 – 1 234 – 902
Equity-settled compensation expense 738 758 673
Income from associated companies 3 – 673 – 659 – 6 438
Taxes 1 807 1 793 1 295
Net financial expense 947 805 746
Total 9 881 9 122 1 486
1 Depreciation of right-of-use assets recognized from January 1, 2019, the date of implementation of IFRS 16 Leases. See Note 1.2 Includes fair value adjustments3 2018 included a reversal of a pre-tax gain (USD 5.8 billion) recognized from the divestment of the investment in GSK Consumer Healthcare Holdings Ltd. (see Note 2). The net cash
proceed of USD 13.0 billion from the divestment was included in the consolidated statements of cash flows in the line “Acquisitions and divestments of interests in associated companies, net.”
23.2) Total amount of taxes paid
In 2020, the total amount of taxes paid was USD 1.9 billion, of which USD 1.8 billion was included within “Net cash flows from operating activities from continuing operations”, and USD 88 million was included within “Net cash flows used in investing activities from discontinued operations.”
In 2019, the total amount of taxes paid was USD 2.0 billion, of which USD 1.9 billion was included within “Net cash flows from operating activities from continuing operations”, USD 38 million was included within “Net cash flows from operating activities from discontinued operations,” and USD 79 million was included within “Net cash flows used in investing activities from discontinued operations.”
In 2018, the total amount of taxes paid was USD 1.8 billion, of which USD 1.5 billion was included within “Net cash flows from operating activities from continuing operations”, USD 164 million was included within “Net cash flows from operating activities from discontinued operations,” and USD 139 million was included within “Net cash flows used in investing activities from continuing operations.”

Notes to the Novartis Group consolidated financial statements
F-56
23.3) Cash flows from changes in working capital and other operating items included in the net cash flows from operating activities from continuing operations
(USD millions) 2020 2019 2018
(Increase) in inventories – 543 – 382 – 387
Decrease/(increase) in trade receivables 137 – 980 – 544
(Decrease)/increase in trade payables – 324 553 252
Change in other current assets 229 – 160 316
Change in other current liabilities 211 1 167 941
Other adjustments, net – 1 1 – 2
Total – 291 199 576
23.4) Cash flows arising from acquisitions and divestments of interests in associated companies, net
In 2018, acquisitions and divestments of interests in associated companies included USD 12 855 million net of taxes (USD 12 994 million before taxes) from the divestment of the investment in GSK Consumer Healthcare Holdings Ltd. (see Note 2).
23.5) Cash flows arising from acquisitions and divestments of businesses, net
The following table is a summary of the cash flow impact of acquisitions and divestments of businesses. The most significant trans actions are described in Note 2.
(USD millions) Note 2020 2019 2018
Net assets recognized as a result of acquisitions of businesses 24 – 10 173 – 4 124 – 13 660
Fair value of previously held equity interests 7 33
Contingent consideration payables, net 98 242 – 5
Payments, deferred consideration and other adjustments, net 62 – 2 – 36
Cash flows used for acquisitions of businesses – 10 006 – 3 851 – 13 701
Cash flows from divestments of businesses, net 1 49 91 18
Cash flows used for acquisitions and divestments of businesses, net – 9 957 – 3 760 – 13 683
1 In 2020, USD 49 million represented the net cash inflows from divestments in previous years. In 2019, the USD 91 million included USD 4 million of net cash outflows from divestments in previous years, and USD 95 million net cash inflows from business divestments in 2019. The net identifiable assets of the 2019 divested businesses amounted to USD 196 million, comprised of non-current assets of USD 159 million; current assets of USD 96 million, including USD 11 million cash and cash equivalents; non-current liabilities of USD 18 million; and current liabilities of USD 41 million. In 2018, USD 18 million represented the net cash inflows from divestments in previous years.
Notes 2 and 24 provide further information regarding acquisitions and divestments of businesses. All acquisitions were for cash.

Notes to the Novartis Group consolidated financial statements
F-57
23.6) Reconciliation of liabilities arising from financing activities
Current
financial
debts and
Non-current derivative
financial financial Non-current Current lease
(USD millions) debts instruments lease liabilities liabilities
January 1, 2020 20 353 7 031 1 703 246
Increase in non-current financial debts 7 126
Repayments of non-current financial debts – 2 003
Change in current financial debts 2 261
Payments of lease liabilities, net – 312
Interest payments for amounts included in lease liabilities
classified as cash flows from operating activities – 56
New leases 221 73
Impact of acquisitions of businesses 32 36 8
Changes in fair values, and other changes, net – 1 – 30 65
Amortization of bonds discount 16 5
Currency translation effects 832 392 39 12
Reclassification from non-current to current, net – 2 067 2 067 – 250 250
December 31, 2020 26 259 9 785 1 719 286
Current
financial
debts and
Non-current derivative
financial financial Non-current Current lease
(USD millions) debts instruments lease liabilities liabilities
January 1, 2019 22 470 9 678
Impact of adoption of IFRS 16 Leases continuing operations 1 – 2 – 1 1 471 268
Impact of adoption of IFRS 16 Leases discontinued operations 2 – 89 246 40
Financial debts and lease liabilities related to discontinued operations 3 – 47 – 246 – 40
Increase in non-current financial debts 93
Repayments of non-current financial debts – 3 195
Change in current financial debts – 1 582
Payments of lease liabilities, net – 273
Interest payments for amounts included in lease liabilities
classified as cash flows from operating activities – 51
New leases 362 131
Impact of acquisitions and divestments of businesses 2 – 11 – 6
Changes in fair values, and other changes, net 129 33 20
Amortization of bonds discount 25
Currency translation effects – 141 44 4 1
Reclassification from non-current to current, net – 2 003 2 003 – 156 156
December 31, 2019 20 353 7 031 1 703 246
1 Lease liabilities recognized on January 1, 2019, the date of implementation of IFRS 16 Leases. See Note 1.2 In 2018, financial debts included USD 89 million for previously reported finance lease obligations of the Alcon business that were reclassified on January 1, 2019, to lease liabilities,
with the adoption of IFRS 16 Leases. Note 30 provides additional disclosures.3 Represents the financial debts and lease liabilities at January 1, 2019, related to the Alcon business reported as discontinued operations. See Notes 1, 2 and 30.

Notes to the Novartis Group consolidated financial statements
F-58
Current
financial
debts and
Non-current derivative
financial financial
(USD millions) debts instruments
January 1, 2018 23 224 5 308
Increase in non-current financial debts 1 2 856
Repayments of non-current financial debts 2 – 366
Change in current financial debts 3 1 681
Impact of acquisitions of businesses 10 4
Changes in fair values, and other changes 5 – 48
Amortization of bonds discount 27 2
Currency translation effects – 462 – 93
Current portion of non-current financial debt – 3 190 3 190
December 31, 2018 22 470 9 678
1 Increase in non-current financial debts was only recorded in the consolidated statements of cash flows from continuing operations.
2 Repayment of non-current financial debts was only recorded in the consolidated statements of cash flows from continuing operations.
3 Changes in current financial debts included in the consolidated statements of cash flows from continuing operations were USD 1 687 million.
For net cash flows used in investing activities from discontinued operations, see Note 30.
24. Acquisitions of businessesFair value of assets and liabilities arising from acquisitions of businesses
(USD millions) 2020 2019 2018
Property, plant and equipment 26 44 137
Right-of-use assets 32
Currently marketed products 196 3 550 2 531
Acquired research and development 8 600 342 10 224
Other intangible assets 218 22 1
Deferred tax assets 476 60 381
Non-current financial and other assets 49 8 19
Inventories 84 195 20
Trade receivables and financial and other current assets 109 4 90
Cash and cash equivalents 76 1 112
Deferred tax liabilities – 1 977 – 107 – 2 874
Current and non-current financial debts – 32 – 2 – 14
Current and non-current lease liabilities – 44
Trade payables and other liabilities – 144 – 178 – 627
Net identifiable assets acquired 7 669 3 938 11 000
Acquired cash and cash equivalents – 76 – 1 112
Non-controlling interests – 26
Goodwill 2 580 186 4 084
Net assets recognized as a result of acquisitions of businesses 1 10 173 4 124 13 946
1 In 2018, net assets recognized as a result of acquisitions of businesses in the consolidated balance sheet from continuing operations were USD 13 660 million.
Note 2 details significant acquisitions of businesses, spe-cifically, The Medicines Company and the Japanese business of AGI in 2020; Xiidra and IFM Tre, Inc. in 2019; and AAA, AveXis and Endocyte in 2018. The goodwill arising out of these acquisitions is attributable to the
buyer specific synergies, the assembled workforce, and the accounting for deferred tax liabilities on the acquired assets. Goodwill of USD 74 million in 2020 (2019: USD 98 million, 2018: nil) is tax deductible.

Notes to the Novartis Group consolidated financial statements
F-59
25. Post-employment benefits for associates
Defined benefit plans
In addition to the legally required social security schemes, the Group has numerous independent pension and other post-employment benefit plans. In most cases, these plans are externally funded in entities that are legally separate from the Group. For certain Group companies, however, no independent plan assets exist for the pen-sion and other post-employment benefit obligations of associates. In these cases, the related unfunded liability is included in the balance sheet. The defined benefit obli-gations (DBOs) of all major pension and other post-em-ployment benefit plans are reappraised annually by inde-pendent actuaries. Plan assets are recognized at fair value. The major plans are based in Switzerland, the United States, the United Kingdom, Germany and Japan, which represent 95% of the Group’s total DBO for pen-sion plans. Details of the plans in the two most signifi-cant countries, Switzerland and the United States, which represent 81% of the Group’s total DBO for post-employ-ment benefit plans, are provided below.
Swiss-based pension plans represent the most sig-nificant portion of the Group’s total DBO and plan assets. For the active insured members born on or after Janu-ary 1, 1956, or having joined the plans after December 31, 2010, the benefits are partially linked to the contribu-tions paid into the plan. Certain features of Swiss pen-sion plans required by law preclude the plans from being categorized as defined contribution plans. These factors include a minimum interest guarantee on retirement sav-ings accounts, a predetermined factor for converting the accumulated savings account balance into a pension, and embedded death and disability benefits.
All benefits granted under Swiss-based pension plans are vested, and Swiss legislation prescribes that the employer has to contribute a fixed percentage of an
associate’s pay to an external pension fund. Additional employer contributions may be required whenever the plan’s statutory funding ratio falls below a certain level. The associate also contributes to the plan. The pension plans are run by separate legal entities, each governed by a board of trustees that – for the principal plans – con-sists of representatives nominated by Novartis and the active insured associates. The boards of trustees are responsible for the plan design and asset investment strategy.
In December 2020 the Board of Trustees of the Novartis Swiss Pension Fund agreed to adjust the annu-ity conversion rate at retirement with effect from Janu-ary 1, 2022. This amendment does not affect existing pensioners, and its impact on existing plan participants will be mitigated by way of defined compensatory mea-sures. This amendment resulted in a net pre-tax curtail-ment gain of USD 101 million (CHF 90 million).
The United States pension plans represent the sec-ond-largest component of the Group’s total DBO and plan assets. The principal plans (Qualified Plans) are funded, whereas plans providing additional benefits for executives (Restoration Plans) are unfunded. Employer contributions are required for Qualified Plans whenever the statutory funding ratio falls below a certain level.
Furthermore, in certain countries, associates are cov-ered under other post-employment benefit plans and post-retirement medical plans.
In the US, other post-employment benefit plans con-sist primarily of post-employment healthcare benefits, which have been closed to new members since 2015. Part of the costs of these plans is reimbursable under the Medicare Prescription Drug, Improvement, and Mod-ernization Act of 2003. There is no statutory funding requirement for these plans. The Group is funding these plans to the extent that it is tax efficient.
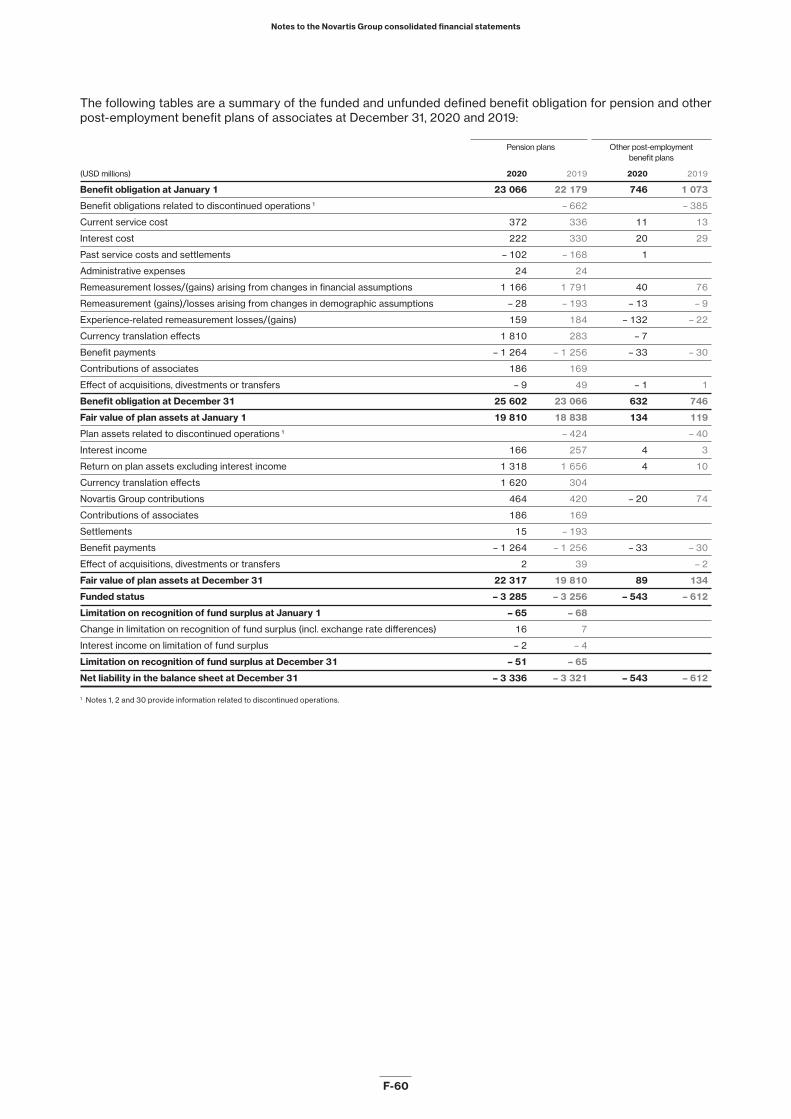
Notes to the Novartis Group consolidated financial statements
F-60
The following tables are a summary of the funded and unfunded defined benefit obligation for pension and other post-employment benefit plans of associates at December 31, 2020 and 2019:
Pension plans Other post-employment benefit plans
(USD millions) 2020 2019 2020 2019
Benefit obligation at January 1 23 066 22 179 746 1 073
Benefit obligations related to discontinued operations 1 – 662 – 385
Current service cost 372 336 11 13
Interest cost 222 330 20 29
Past service costs and settlements – 102 – 168 1
Administrative expenses 24 24
Remeasurement losses/(gains) arising from changes in financial assumptions 1 166 1 791 40 76
Remeasurement (gains)/losses arising from changes in demographic assumptions – 28 – 193 – 13 – 9
Experience-related remeasurement losses/(gains) 159 184 – 132 – 22
Currency translation effects 1 810 283 – 7
Benefit payments – 1 264 – 1 256 – 33 – 30
Contributions of associates 186 169
Effect of acquisitions, divestments or transfers – 9 49 – 1 1
Benefit obligation at December 31 25 602 23 066 632 746
Fair value of plan assets at January 1 19 810 18 838 134 119
Plan assets related to discontinued operations 1 – 424 – 40
Interest income 166 257 4 3
Return on plan assets excluding interest income 1 318 1 656 4 10
Currency translation effects 1 620 304
Novartis Group contributions 464 420 – 20 74
Contributions of associates 186 169
Settlements 15 – 193
Benefit payments – 1 264 – 1 256 – 33 – 30
Effect of acquisitions, divestments or transfers 2 39 – 2
Fair value of plan assets at December 31 22 317 19 810 89 134
Funded status – 3 285 – 3 256 – 543 – 612
Limitation on recognition of fund surplus at January 1 – 65 – 68
Change in limitation on recognition of fund surplus (incl. exchange rate differences) 16 7
Interest income on limitation of fund surplus – 2 – 4
Limitation on recognition of fund surplus at December 31 – 51 – 65
Net liability in the balance sheet at December 31 – 3 336 – 3 321 – 543 – 612
1 Notes 1, 2 and 30 provide information related to discontinued operations.
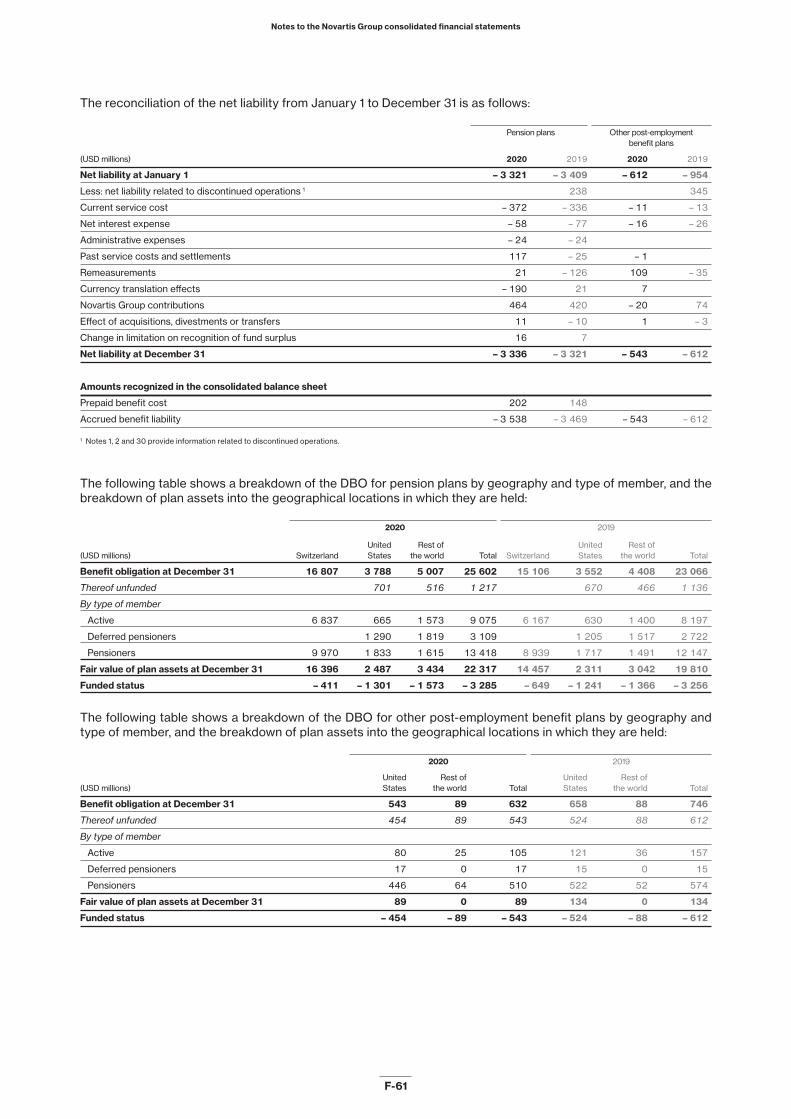
Notes to the Novartis Group consolidated financial statements
F-61
The reconciliation of the net liability from January 1 to December 31 is as follows:
Pension plans Other post-employment benefit plans
(USD millions) 2020 2019 2020 2019
Net liability at January 1 – 3 321 – 3 409 – 612 – 954
Less: net liability related to discontinued operations 1 238 345
Current service cost – 372 – 336 – 11 – 13
Net interest expense – 58 – 77 – 16 – 26
Administrative expenses – 24 – 24
Past service costs and settlements 117 – 25 – 1
Remeasurements 21 – 126 109 – 35
Currency translation effects – 190 21 7
Novartis Group contributions 464 420 – 20 74
Effect of acquisitions, divestments or transfers 11 – 10 1 – 3
Change in limitation on recognition of fund surplus 16 7
Net liability at December 31 – 3 336 – 3 321 – 543 – 612
Amounts recognized in the consolidated balance sheet
Prepaid benefit cost 202 148
Accrued benefit liability – 3 538 – 3 469 – 543 – 612
1 Notes 1, 2 and 30 provide information related to discontinued operations.
The following table shows a breakdown of the DBO for pension plans by geography and type of member, and the breakdown of plan assets into the geographical locations in which they are held:
2020 2019
United Rest of United Rest of
(USD millions) Switzerland States the world Total Switzerland States the world Total
Benefit obligation at December 31 16 807 3 788 5 007 25 602 15 106 3 552 4 408 23 066
Thereof unfunded 701 516 1 217 670 466 1 136
By type of member
Active 6 837 665 1 573 9 075 6 167 630 1 400 8 197
Deferred pensioners 1 290 1 819 3 109 1 205 1 517 2 722
Pensioners 9 970 1 833 1 615 13 418 8 939 1 717 1 491 12 147
Fair value of plan assets at December 31 16 396 2 487 3 434 22 317 14 457 2 311 3 042 19 810
Funded status – 411 – 1 301 – 1 573 – 3 285 – 649 – 1 241 – 1 366 – 3 256
The following table shows a breakdown of the DBO for other post-employment benefit plans by geography and type of member, and the breakdown of plan assets into the geographical locations in which they are held:
2020 2019
United Rest of United Rest of
(USD millions) States the world Total States the world Total
Benefit obligation at December 31 543 89 632 658 88 746
Thereof unfunded 454 89 543 524 88 612
By type of member
Active 80 25 105 121 36 157
Deferred pensioners 17 0 17 15 0 15
Pensioners 446 64 510 522 52 574
Fair value of plan assets at December 31 89 0 89 134 0 134
Funded status – 454 – 89 – 543 – 524 – 88 – 612

Notes to the Novartis Group consolidated financial statements
F-62
The following table shows the principal weighted average actuarial assumptions used for calculating defined ben-efit plans and other post- employment benefits of associates:
Pension plans Other post-employment benefit plans
2020 2019 2018 2020 2019 2018
Weighted average assumptions used to determine
benefit obligations at December 31
Discount rate 0.6% 1.0% 1.6% 2.9% 3.6% 4.4%
Expected rate of pension increase 0.3% 0.3% 0.4%
Expected rate of salary increase 2.7% 2.8% 2.8%
Interest on savings account 0.1% 0.3% 0.8%
Current average life expectancy
for a 65-year-old male in years 22 22 22 21 21 21
Current average life expectancy
for a 65-year-old female in years 24 24 24 23 23 23
Changes in the aforementioned actuarial assumptions can result in significant volatility in the accounting for the Group’s pension plans in the consolidated financial state-ments. This can result in substantial changes in the Group’s other comprehensive income, long-term liabili-ties and prepaid pension assets.
The DBO is significantly impacted by assumptions regarding the rate that is used to discount the actuari-ally determined post-employment benefit liability. This rate is based on yields of high-quality corporate bonds in the country of the plan. Decreasing corporate bond yields decrease the discount rate, so that the DBO increases and the funded status decreases.
In Switzerland, an increase in the DBO due to lower discount rates is slightly offset by lower future benefits expected to be paid on the associate’s savings account where the assumption on interest accrued changes in line with the discount rate.
The impact of decreasing interest rates on a plan’s assets is more difficult to predict. A significant part of the plan assets is invested in bonds. Bond values usually rise when interest rates decrease and may therefore par-tially compensate for the decrease in the funded status. Furthermore, pension assets also include significant holdings of equity instruments. Share prices tend to rise when interest rates decrease and therefore often coun-teract the negative impact of the rising defined benefit obligation on the funded status (although the correlation of interest rates with equities is not as strong as with bonds, especially in the short term).
The expected rate for pension increases significantly affects the DBO of most plans in Switzerland, Germany and the United Kingdom. Such pension increases also decrease the funded status, although there is no strong correlation between the value of the plan assets and pension/inflation increases.
Assumptions regarding life expectancy significantly impact the DBO. An increase in longevity increases the DBO. There is no offsetting impact from the plan assets, as no longevity bonds or swaps are held by the pension funds. Generational mortality tables are used where this data is available.
The following table shows the sensitivity of the defined benefit pension obligation to the principal actu-arial assumptions for the major plans in Switzerland, the
United States, the United Kingdom, Germany and Japan on an aggregated basis:
Change in 2020 year-end
(USD millions) defined benefit pension obligation
25 basis point increase in discount rate – 885
25 basis point decrease in discount rate 942
One-year increase in life expectancy 993
25 basis point increase in rate of pension increase 589
25 basis point decrease in rate of pension increase – 143
25 basis point increase of interest on savings account 62
25 basis point decrease of interest on savings account – 30
25 basis point increase in rate of salary increase 61
25 basis point decrease in rate of salary increase – 61
The healthcare cost trend rate assumptions used for other post- employment benefits are as follows:
2020 2019 2018
Healthcare cost trend rate
assumed for next year 6.3% 6.5% 7.0%
Rate to which the cost trend
rate is assumed to decline 4.5% 4.5% 4.5%
Year that the rate reaches
the ultimate trend rate 2028 2028 2028
The following table shows the weighted average plan asset allocation of funded defined benefit pension plans at December 31, 2020 and 2019:
Pension plans
Long-term Long-term
target target
(as a percentage) minimum maximum 2020 2019
Equity securities 15 40 28 27
Debt securities 20 60 34 36
Real estate 5 20 17 17
Alternative investments 0 20 13 15
Cash and other investments 0 15 8 5
Total 100 100
Cash and most of the equity and debt securities have a quoted market price in an active market. Real estate and

Notes to the Novartis Group consolidated financial statements
F-63
alternative investments, which include hedge fund, pri-vate equity, infrastructure and commodity investments, usually have a quoted market price or a regularly updated net asset value.
The strategic allocation of assets of the different pen-sion plans is determined with the objective of achieving an investment return that, together with the contributions paid by the Group and its associates, is sufficient to main-tain reasonable control over the various funding risks of the plans. Based upon the market and economic envi-ronments, actual asset allocations may temporarily be permitted to deviate from policy targets. The asset allo-cation currently includes investments in shares of Novartis AG as per the below table:
December 31, December 31,
2020 2019
Investment in shares of Novartis AG
Number of shares (in millions) 2.3 2.3
Market value (in USD billions) 0.2 0.2
The weighted average duration of the defined benefit obligation is 15.4 years (2019: 15.2 years).
The Group’s ordinary contribution to the various pen-sion plans is based on the rules of each plan. Additional contributions are made whenever this is required by stat-ute or law (i.e., usually when statutory funding levels fall below predetermined thresholds). The only significant plans that are foreseen to require additional funding are those in the United Kingdom and Germany.
The expected future cash flows in respect of pension and other post-employment benefit plans at December 31, 2020, were as follows:
Other post-
employment
(USD millions) Pension plans benefit plans
Novartis Group contributions
2021 (estimated) 404 40
Expected future benefit payments
2021 1 245 40
2022 1 198 41
2023 1 191 41
2024 1 182 40
2025 1 165 40
2026–2030 5 651 181
Defined contribution plans
In many subsidiaries, associates are covered by defined contribution plans. Contributions charged to the consol-idated income statement for the defined contribution plans were:
(USD millions) 2020 2019 2018
Contributions for defined contribution plans
continuing operations 501 422 443
For defined contribution plans for discontinued opera-tions, see Note 30.
26. Equity-based participation plans for associatesThe expense related to all equity-based participation plans and the liabilities arising from equity-based pay-ment transactions were as follows:
(USD millions) 2020 2019 2018
Expense related to equity-based
participation plans 958 1 067 918
Liabilities arising from equity-based
payment transactions 269 326 273
Equity-based participation plans can be separated into the following plans:
Annual Incentive
The Annual Incentive for the Novartis Group CEO and other Executive Committee members (ECN) is paid 50% in cash and 50% in Novartis restricted shares (RSs) or restricted share units (RSUs). For the Novartis Top Lead-ers (NTLs), the Annual Incentive is paid 70% in cash and 30% in RSs or RSUs. Both the ECN and NTLs can opt to invest up to the maximum cash portion of their Annual
Incentive to receive further RSs or RSUs. Any cash is paid out during February or March in the year following the end of the performance period, and the shares are granted during January in the year following the end of the performance period.
Share savings plans
Associates in certain countries and certain key execu-tives worldwide are encouraged to invest their Annual Incentive in a share savings plan.
Under the share savings plan, participants may elect to receive their relevant compensation fully or partially in Novartis shares in lieu of cash. As a reward for their participation in the share savings plan, at no additional cost to the participant, Novartis matches their invest-ments in shares after a holding period of three or five years.
Novartis operates share savings plans for which associ-ates may only participate in one of the share savings

Notes to the Novartis Group consolidated financial statements
F-64
plans in any given year. The most significant are listed below:• In Switzerland, Employee Share Ownership Plan
(ESOP) participants may choose to receive their Annual Incentive (i) 100% in shares, (ii) 50% in shares and 50% in cash, or (iii) 100% in cash. After expiration of a three-year holding period for Novartis shares invested under the ESOP, participants will receive one matching share for every two invested shares. Associates eligible for the equity plan “Select” are not eligible to receive ESOP matching shares starting with the 2017 performance period.
• The Leveraged Share Savings Plan (LSSP) was avail-able to key executives for performance periods prior to 2016. At the participant’s election, the Annual Incen-tive was awarded partly or entirely in shares. The elected number of shares is subject to a holding period of five years. At the end of the holding period, Novartis will match the invested shares at a ratio of 1-to-1 (i.e., one share awarded for each invested share). In the United States, both the LSSP award and the corre-sponding match are cash settled.
The Novartis Group CEO, the other Executive Commit-tee members from 2014, and the NTLs from 2016 are not eligible to participate in the share savings plans.
Novartis equity plan “Select”
The equity plan “Select” is a global equity incentive plan under which eligible associates may annually be awarded a grant subject to a three-year, and for selected units a four-year, staggered vesting period. No awards are granted for performance ratings below a certain thresh-old. Executive Committee members and NTLs are not eligible to participate in the equity plan “Select”.
The equity plan “Select” currently allows participants in Switzerland to choose the form of their equity com-pensation in RSs or RSUs. In all other jurisdictions, RSs or RSUs are granted unilaterally. Until 2013, participants could also choose to receive part or the entire grant in the form of tradable share options.
Tradable share options expire on their 10th anniver-sary from the grant date. Each tradable share option enti-tles the holder to purchase after vesting (and before the 10th anniversary from the grant date) one Novartis share at a stated exercise price that equals the closing market price of the underlying share at the grant date. As the exercise price does not reflect the decrease in the Novartis share due to the Alcon spin, one-fifth of an Alcon share will also be awarded to the option holder upon exercise.
Options under Novartis equity plan “Select” outside North AmericaThe following table shows the activity associated with the share options during the period. The weighted aver-
age prices in the table below are translated from Swiss francs into USD at historical rates.
2020 2019
Weighted Weighted
average average
exercise exercise
Options price Options price
(millions) (USD) (millions) (USD)
Options outstanding
at January 1 3.4 60.9 5.6 59.9
Sold or exercised – 0.8 57.3 – 2.2 58.4
Outstanding at December 31 2.6 62.0 3.4 60.9
Exercisable at December 31 2.6 62.0 3.4 60.9
All share options were granted at an exercise price that was equal to the closing market price of the Group’s shares at the grant date. The weighted average share price at the dates of sale or exercise was USD 91.7.
The following table summarizes information about share options outstanding at December 31, 2020:
Total/
weighted
Options outstanding average
Number outstanding (millions) 0.4 0.8 1.4 2.6
Remaining contractual life (years) 0.0 1.0 2.0 1.4
Exercise price (USD) 57.0 57.6 66.0 62.0
Options under Novartis equity plan “Select” for North AmericaThe following table shows the activity associated with the ADR options during the period:
2020 2019
Weighted Weighted
average average
ADR exercise ADR exercise
options price options price
(millions) (USD) (millions) (USD)
Options outstanding
at January 1 9.6 61.9 15.2 60.7
Sold or exercised – 2.9 59.6 – 5.6 58.6
Outstanding at December 31 6.7 62.9 9.6 61.9
Exercisable at December 31 6.7 62.9 9.6 61.9
All ADR options were granted at an exercise price that was equal to the closing market price of the ADRs at the grant date. The weighted average ADR price at the dates of sale or exercise was USD 92.2.
The following table summarizes information about ADR options outstanding at December 31, 2020:
Total/
weighted
ADR options outstanding average
Number outstanding (millions) 0.4 2.3 4.0 6.7
Remaining contractual life (years) 0.0 1.0 2.0 1.5
Exercise price (USD) 57.0 58.3 66.1 62.9
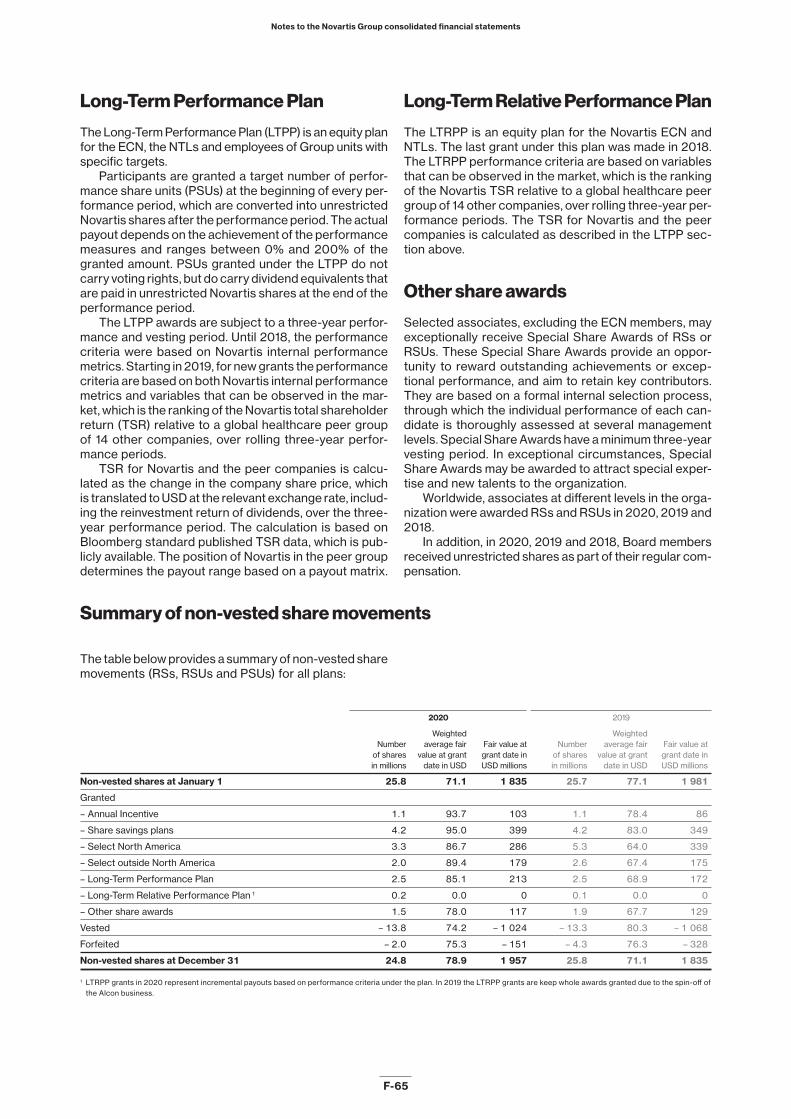
Notes to the Novartis Group consolidated financial statements
F-65
Long-Term Performance Plan
The Long-Term Performance Plan (LTPP) is an equity plan for the ECN, the NTLs and employees of Group units with specific targets.
Participants are granted a target number of perfor-mance share units (PSUs) at the beginning of every per-formance period, which are converted into unrestricted Novartis shares after the performance period. The actual payout depends on the achievement of the performance measures and ranges between 0% and 200% of the granted amount. PSUs granted under the LTPP do not carry voting rights, but do carry dividend equivalents that are paid in unrestricted Novartis shares at the end of the performance period.
The LTPP awards are subject to a three-year perfor-mance and vesting period. Until 2018, the performance criteria were based on Novartis internal performance metrics. Starting in 2019, for new grants the performance criteria are based on both Novartis internal performance metrics and variables that can be observed in the mar-ket, which is the ranking of the Novartis total shareholder return (TSR) relative to a global healthcare peer group of 14 other companies, over rolling three-year perfor-mance periods.
TSR for Novartis and the peer companies is calcu-lated as the change in the company share price, which is translated to USD at the relevant exchange rate, includ-ing the reinvestment return of dividends, over the three-year performance period. The calculation is based on Bloomberg standard published TSR data, which is pub-licly available. The position of Novartis in the peer group determines the payout range based on a payout matrix.
Long-Term Relative Performance Plan
The LTRPP is an equity plan for the Novartis ECN and NTLs. The last grant under this plan was made in 2018. The LTRPP performance criteria are based on variables that can be observed in the market, which is the ranking of the Novartis TSR relative to a global healthcare peer group of 14 other companies, over rolling three-year per-formance periods. The TSR for Novartis and the peer companies is calculated as described in the LTPP sec-tion above.
Other share awards
Selected associates, excluding the ECN members, may exceptionally receive Special Share Awards of RSs or RSUs. These Special Share Awards provide an oppor-tunity to reward outstanding achievements or excep-tional performance, and aim to retain key contributors. They are based on a formal internal selection process, through which the individual performance of each can-didate is thoroughly assessed at several management levels. Special Share Awards have a minimum three-year vesting period. In exceptional circumstances, Special Share Awards may be awarded to attract special exper-tise and new talents to the organization.
Worldwide, associates at different levels in the orga-nization were awarded RSs and RSUs in 2020, 2019 and 2018.
In addition, in 2020, 2019 and 2018, Board members received unrestricted shares as part of their regular com-pensation.
Summary of non-vested share movements
The table below provides a summary of non-vested share movements (RSs, RSUs and PSUs) for all plans:
2020 2019
Weighted Weighted
Number average fair Fair value at Number average fair Fair value at
of shares value at grant grant date in of shares value at grant grant date in
in millions date in USD USD millions in millions date in USD USD millions
Non-vested shares at January 1 25.8 71.1 1 835 25.7 77.1 1 981
Granted
– Annual Incentive 1.1 93.7 103 1.1 78.4 86
– Share savings plans 4.2 95.0 399 4.2 83.0 349
– Select North America 3.3 86.7 286 5.3 64.0 339
– Select outside North America 2.0 89.4 179 2.6 67.4 175
– Long-Term Performance Plan 2.5 85.1 213 2.5 68.9 172
– Long-Term Relative Performance Plan 1 0.2 0.0 0 0.1 0.0 0
– Other share awards 1.5 78.0 117 1.9 67.7 129
Vested – 13.8 74.2 – 1 024 – 13.3 80.3 – 1 068
Forfeited – 2.0 75.3 – 151 – 4.3 76.3 – 328
Non-vested shares at December 31 24.8 78.9 1 957 25.8 71.1 1 835
1 LTRPP grants in 2020 represent incremental payouts based on performance criteria under the plan. In 2019 the LTRPP grants are keep whole awards granted due to the spin-off of the Alcon business.

Notes to the Novartis Group consolidated financial statements
F-66
At April 8, 2019, the Alcon spin-off date, all RSU and PSU holders, who were not entitled to the dividend in kind in the form of Alcon shares received keep whole awards in Novartis shares to compensate for the loss of the Alcon value from their Novartis shares. These keep whole
awards were accounted for as a modification. As they did not increase the value of the original grant, they did not lead to additional expense. In the table above, this is reflected by a zero fair value at grant date amount.
27. Transactions with related partiesRoche Holding AG
Novartis has two agreements with Genentech, Inc., United States (Genentech), and one agreement with Spark Therapeutics, Inc., United States (Spark). Both companies are subsidiaries of Roche Holding AG (Roche), which is indirectly included in the consolidated financial statements using equity accounting since Novartis holds 33.3% of the outstanding voting shares of Roche (see Note 4).
LucentisNovartis has licensed from Genentech/Roche the exclu-sive rights to develop and market Lucentis outside the United States for indications related to diseases of the eye. Novartis pays royalties on the net sales of Lucentis products outside the United States. In 2020, Lucentis sales of USD 1.9 billion (2019: USD 2.1 billion; 2018: USD 2.0 billion) were recognized by Novartis.
XolairNovartis and Genentech/Roche are co-promoting Xolair in the United States, where Genentech/Roche records all sales. Novartis records sales outside the United States.
Novartis markets Xolair and records all sales and related costs outside the United States as well as co-pro-motion costs in the US. Genentech/Roche and Novartis share the resulting profits from sales in the United States, Europe and other countries, according to agreed prof-it-sharing percentages. In 2020, Novartis recognized total sales of Xolair of USD 1.3 billion (2019: USD 1.2 bil-lion; 2018: USD 1.0 billion), including sales to Genentech/Roche for the United States market.
LuxturnaIn 2018, Novartis entered into an exclusive licensing and commercialization agreement and a supply agreement with Spark for Luxturna outside the United States. The agreements include regulatory and sales milestones as well as royalties payable to Spark on ex-US sales. On December 17, 2019, Roche acquired Spark.
The net income for royalties, cost sharing and profit shar-ing arising out of the Lucentis, Xolair and Luxturna agree-ments with Roche totaled USD 217 million in 2020 (net income in 2019: USD 101 million; net expense in 2018: USD 34 million).
Furthermore, Novartis has several patent license, supply and distribution agreements with Roche.
Novartis Pension Fund
In 2018, a Group subsidiary provided an uncommitted overnight credit facility to the Novartis Pension Fund, Switzerland, for up to USD 500 million with interest at
the US Federal Funds Rate. This credit facility was not utilized during the years 2020, 2019 and 2018.
Executive Officers and Non-Executive Directors compensation
During 2020, there were 13 Executive Committee members (“Executive Officers”). There were 15 Exec-
utive Officers in 2019 and 17 Executive Officers in 2018, including those who stepped down.
The total compensation for Executive Committee members and the 14 Non-Executive Directors (13 in 2019 and 2018) using the Group’s accounting policies for equity-based compensation and pension benefits was as follows:
Executive Officers Non-Executive Directors Total
(USD millions) 2020 2019 2018 2020 2019 2018 2020 2019 2018
Cash and other compensation 25.6 20.7 22.5 4.6 4.1 4.0 30.2 24.8 26.5
Post-employment benefits 2.7 2.6 2.5 2.7 2.6 2.5
Equity-based compensation 41.1 40.6 42.5 5.2 4.6 4.8 46.3 45.2 47.3
Total 69.4 63.9 67.5 9.8 8.7 8.8 79.2 72.6 76.3

Notes to the Novartis Group consolidated financial statements
F-67
During 2020, the IFRS compensation expense increased due to higher cash and other compensation. This increase in cash compensation is mainly attributable to ECN members who joined the ECN during 2019, as a result 2019 represented only a portion of their annual compensation. Other compensation increased on account of higher social security payments on vested equity-based compensation.
During 2019, the IFRS compensation expense decreased due to lower cash buyout payments to new executive officers and the forfeiture of equity-based compensation as a result of the resignation of an exec-utive officer. These effects were partially offset by higher equity based compensation of executive officers appointed over the last three years.
The Annual Incentive award, which is fully included in equity- based compensation even when paid out in cash, is granted in January in the year following the reporting period.
The disclosures on Board and executive compensa-tion required by the Swiss Code of Obligations and in
accordance with the Swiss Ordinance against Excessive Compensation in Stock Exchange Listed Companies are shown in the Compensation Report of the Group.
Transactions with former members of the Board of DirectorsDuring 2020, 2019 and 2018, the following payments (or waivers of claims) were made to former Board members or to “persons closely” linked to them:
Currency 2020 2019 2018
Dr. Krauer CHF 60 000 60 000 60 000
Dr. Vasella CHF 18 228
Dr. Alex Krauer, Honorary Chairman, is entitled to an amount of CHF 60 000 for annual periods from one AGM to the next. This amount was fixed in 1998 upon his departure from the Board in 1999, and has not been revised since that date.
28. Commitments and contingenciesResearch and development commitmentsThe Group has entered into long-term research and development agreements with various institutions, which provide for potential milestone payments by Novartis that may be capitalized. As of December 31, 2020, the Group’s commitments to make payments under those agree-ments, and their estimated timing, were as follows:
(USD millions) 2020
2021 449
2022 691
2023 325
2024 483
2025 281
Thereafter 3 003
Total 5 232
In addition in November 2020 and in January 2021, Novartis entered into long-term research and develop-ment agreements, both of which did not close as of Jan-uary 25, 2021. These agreements provide for potential milestones payments by Novartis that may be capital-ized. Based on their estimated timing, the payments for these transactions are expected to amount to USD 549 million in 2021, USD 248 million in 2022, USD 160 million in 2023, USD 415 million in 2024, USD 515 million in 2025, USD 1 409 million later than 2025, for a total of USD 3 296 million.
Commitments for capital calls
The Group holds investments in funds in which it has committed to invest further upon future capital calls. As of December 31, 2020, the total uncalled capital com-mitments for the Group’s investments in funds amounts to USD 87 million. Note 29 contains further information on the Group’s investments in funds.
Other commitments
The Group has entered into various purchase commit-ments for services and materials as well as for equip-ment in the ordinary course of business. These commit-ments are generally entered into at current market prices and reflect normal business operations. For disclosure of property, plant and equipment purchase commit-ments, see Note 9.
Guarantees issued
The Group has issued guarantees to third parties in the ordinary course of business, mostly for tax, customs or other governmental agencies.
In addition, Novartis AG is guarantor of the Group’s issued bonds, credit facilities and commercial paper pro-grams.

Notes to the Novartis Group consolidated financial statements
F-68
Contingencies
Group companies have to observe the laws, government orders and regulations of the country in which they operate.
A number of Novartis companies are, and will likely continue to be, subject to various legal proceedings and investigations that arise from time to time, including pro-ceedings regarding product liability; sales and market-ing practices; commercial disputes; employment and wrongful discharge; and antitrust, securities, health and safety, environmental, tax, international trade, privacy and intellectual property matters. As a result, the Group may become subject to substantial liabilities that may not be covered by insurance and that could affect our business, financial position and reputation. While Novartis does not believe that any of these legal proceedings will have a material adverse effect on its financial position, litigation is inherently unpredictable and large judgments sometimes occur. As a consequence, Novartis may in the future incur judgments or enter into settlements of claims that could have a material adverse effect on its results of operations or cash flow.
Governments and regulatory authorities around the world have been stepping up their compliance and law enforcement activities in recent years in key areas, including marketing practices, pricing, corruption, trade restrictions, embargo legislation, insider trading, anti-trust, cyber security and data privacy. Further, when one government or regulatory authority undertakes an inves-tigation, it is not uncommon for other governments or regulators to undertake investigations regarding the same or similar matters. Responding to such investiga-tions is costly and requires an increasing amount of man-agement’s time and attention. In addition, such investi-gations may affect our reputation, create a risk of potential exclusion from government reimbursement programs in the United States and other countries, and lead to (or arise from) litigation. These factors have con-tributed to decisions by Novartis and other co mpanies in the healthcare industry, when deemed in their interest, to enter into settlement agreements with governmental authorities around the world prior to any formal decision by the authorities or a court. These government settle-
ments have involved and may in the future involve large cash payments, sometimes in the hundreds of millions of dollars or more, including the potential repayment of amounts allegedly obtained improperly and other pen-alties, including treble damages. In addition, settlements of government healthcare fraud cases often require companies to enter into corporate integrity agreements, which are intended to regulate company behavior for a period of years. Our affiliate Novartis Corporation is a party to such an agreement, which will expire in 2025. Also, matters underlying governmental investigations and settlements may be the subject of separate private litigation.
While provisions have been made for probable losses, which management deems to be reasonable or appro-priate, there are uncertainties connected with these estimates.
Note 20 contains additional information on these matters.
A number of Group companies are involved in legal proceedings concerning intellectual property rights. The inherent unpredictability of such proceedings means that there can be no assurances as to their ultimate out-come. A negative result in any such proceeding could potentially adversely affect the ability of certain Novartis companies to sell their products, or require the payment of substantial damages or royalties.
In the opinion of management, however, the outcome of these actions will not materially affect the Group’s financial position but could be material to the results of operations or cash flow in a given period.
The Group’s potential environmental remediation lia-bility is assessed based on a risk assessment and inves-tigation of the various sites identified by the Group as at risk for environmental remediation exposure. The Group’s future remediation expenses are affected by a number of uncertainties. These uncertainties include, but are not limited to, the method and extent of remediation, the per-centage of material attributable to the Group at the reme-diation sites relative to that attributable to other parties, and the financial capabilities of the other potentially responsible parties.
Note 20 contains additional information on environ-mental liabilities.

Notes to the Novartis Group consolidated financial statements
F-69
29. Financial instruments – additional disclosures
The following tables show the carrying values of finan-cial instruments by measurement categories as of December 31, 2020 and 2019. Except for straight bonds
(see Note 19), the carrying values are equal to, or a rea-sonable approximation of, the fair values.
2020
Financial
Financial instruments at
instruments at fair value
Financial fair value through the
instruments at through other consolidated Other
amortized comprehensive income financial
(USD millions) Note costs income statement liabilities
Cash and cash equivalents 16 9 658
Time deposits and short-term investments with original maturity more than 90 days 16 1 609
Trade receivables 15 8 217
Other current assets 17 963
Marketable securities – debt securities 16 26
Long-term financial investments – equity securities 13 1 111 466
Long-term financial investments – debt securities 13 36
Long-term financial investments – fund investments 13 366
Long-term loans, advances, security deposits and other long-term receivables 13 297
Associated companies at fair value through profit and loss 211
Derivative financial instruments 16 159
Contingent consideration receivables 13 625
Total financial assets 20 744 1 173 1 827
Interest-bearing accounts of associates payable on demand 21 2 085
Bank and other short-term financial debt 21 976
Commercial paper 21 4 258
Straight bonds 19 28 298
Long-term liabilities to banks and other financial institutions 19 233
Trade payables 5 403
Commitment for repurchase of own shares 18/22 1 769
Contingent consideration liabilities (see Note 20/22) and other financial liabilities 1 069
Derivative financial instruments 21 194
Lease liabilities 10 2 005
Total financial liabilities 43 022 1 263 2 005

Notes to the Novartis Group consolidated financial statements
F-70
2019
Financial
Financial instruments at
instruments at fair value
Financial fair value through the
instruments at through other consolidated Other
amortized comprehensive income financial
(USD millions) Note costs income statement liabilities
Cash and cash equivalents 16 11 112
Time deposits and short-term investments with original maturity more than 90 days 16 61
Trade receivables 15 8 301
Other current assets 17 2 036
Marketable securities – debt securities 16 24
Marketable securities – fund investments 16 37
Long-term financial investments – equity securities 13 1 158 366
Long-term financial investments – debt securities 13 33
Long-term financial investments – fund investments 13 233
Long-term loans, advances, security deposits and other long-term receivables 13 329
Associated companies at fair value through profit and loss 186
Derivative financial instruments 16 102
Contingent consideration receivables 13 399
Total financial assets 21 839 1 215 1 323
Interest-bearing accounts of associates payable on demand 21 1 836
Bank and other short-term financial debt 21 719
Commercial paper 21 2 289
Straight bonds 19 22 167
Long-term liabilities to banks and other financial institutions 19 188
Trade payables 5 424
Contingent consideration liabilities (see Note 20/22) and other financial liabilities 1 065
Derivative financial instruments 21 185
Lease liabilities 10 1 949
Total financial liabilities 32 623 1 250 1 949
Derivative financial instruments
The following tables show the contract or underlying principal amounts and fair values of derivative financial instruments analyzed by type of contract at Decem-ber 31, 2020 and 2019. Contract or underlying principal
amounts indicate the gross volume of business outstand-ing at the consolidated balance sheet date and do not represent amounts at risk. The fair values are determined by reference to market prices or standard pricing mod-els that use observable market inputs at December 31, 2020 and 2019.
Contract or underlying Positive fair values Negative fair values principal amount
(USD millions) 2020 2019 2020 2019 2020 2019
Forward foreign exchange rate contracts 13 679 10 779 151 96 – 165 – 75
Commodity purchase contract 11 9 8 6
Options on equity securities 70 269 – 29 – 110
Total derivative financial instruments included in
marketable securities and in current financial debts 13 760 11 057 159 102 – 194 – 185
The following table shows by currency contract or underlying principal amount the derivative financial instruments at December 31, 2020 and 2019:
2020
(USD millions) EUR USD Other Total
Forward foreign exchange rate contracts 2 432 6 376 4 871 13 679
Commodity purchase contract 11 11
Options on equity securities 70 70
Total derivative financial instruments 2 432 6 457 4 871 13 760

Notes to the Novartis Group consolidated financial statements
F-71
2019
(USD millions) EUR USD Other Total
Forward foreign exchange rate contracts 1 373 7 760 1 646 10 779
Commodity purchase contract 9 9
Options on equity securities 250 19 269
Total derivative financial instruments 1 373 8 019 1 665 11 057
Derivative financial instruments effective for hedge accounting purposesAt the end of 2020 and 2019, there were no open hedg-ing instruments for anticipated transactions.
Fair value by hierarchy
As required by IFRS, financial assets and liabilities recorded at fair value in the consolidated financial state-ments are categorized based upon the level of judgment associated with the inputs used to measure their fair value. There are three hierarchical levels, based on increasing subjectivity associated with the inputs to derive fair valuation for these assets and liabilities, which are as follows:
The assets carried at Level 1 fair value are equity and debt securities listed in active markets.
The assets generally included in Level 2 fair value hierarchy are foreign exchange and interest rate deriva-tives, and certain debt securities. Foreign exchange and interest rate derivatives are valued using corroborated market data. The liabilities generally included in this fair value hierarchy consist of foreign exchange and interest rate derivatives.
Level 3 inputs are unobservable for the asset or lia-bility. The assets generally included in Level 3 fair value hierarchy are various investments in hedge funds and unquoted equity security investments. Contingent con-sideration carried at fair value is included in this cate-gory.
2020
(USD millions) Level 1 Level 2 Level 3 Total
Financial assets
Debt securities 26 26
Total marketable securities 26 26
Derivative financial instruments 159 159
Total marketable securities and derivative financial instruments 185 185
Debt and equity securities 1 153 460 1 613
Fund investments 366 366
Contingent consideration receivables 625 625
Total long-term financial investments 1 153 1 451 2 604
Associated companies at fair value through profit and loss 211 211
Financial liabilities
Contingent consideration payables – 1 046 – 1 046
Other financial liabilities – 23 – 23
Derivative financial instruments – 194 – 194
Total financial liabilities at fair value – 194 – 1 069 – 1 263

Notes to the Novartis Group consolidated financial statements
F-72
2019
(USD millions) Level 1 Level 2 Level 3 Total
Financial assets
Debt securities 24 24
Fund investments 37 37
Total marketable securities 37 24 61
Derivative financial instruments 102 102
Total marketable securities and derivative financial instruments 37 126 163
Debt and equity securities 976 581 1 557
Fund investments 233 233
Contingent consideration receivables 399 399
Total long-term financial investments 976 1 213 2 189
Associated companies at fair value through profit and loss 186 186
Financial liabilities
Contingent consideration payables – 1 036 – 1 036
Other financial liabilities – 29 – 29
Derivative financial instruments – 185 – 185
Total financial liabilities at fair value – 185 – 1 065 – 1 250
The change in carrying values associated with Level 3 financial instruments, using significant unobservable inputs during the year ended December 31, is set forth below:
2020
Associated
companies at Long-term Contingent Contingent Other
fair value through Fund financial consideration consideration financial
(USD millions) profit and loss investments investments receivables payables liabilities
January 1 186 233 581 399 – 1 036 – 29
Fair value gains and other adjustments,
including from divestments recognized
in the consolidated income statement 57 151 34 173 206
Fair value losses (including impairments and
amortizations) and other adjustments recognized
in the consolidated income statement – 18 – 8 – 39 – 90 – 3
Fair value adjustments recognized in the consolidated statement
of comprehensive income, including currency translation effects 4 3 33 40 – 62 – 2
Purchases 24 17 123 43 – 123
Cash receipts and payments – 30 63 11
Disposals – 23 – 61 – 109
Reclassification – 19 31 – 163 – 4
December 31 211 366 460 625 – 1 046 – 23
Total of fair value gains and losses recognized
in the consolidated income statement for assets
and liabilities held at December 31, 2020 39 143 – 5 173 116 – 3

Notes to the Novartis Group consolidated financial statements
F-73
2019
Associated
companies at Long-term Contingent Contingent Other
fair value through Fund financial consideration consideration financial
(USD millions) profit and loss investments investments receivables payables liabilities
January 1 145 251 488 396 – 907 – 10
Impact from discontinued operations 1 – 28 – 19 163
Fair value gains and other adjustments,
including from divestments recognized
in the consolidated income statement 12 6 35 195 1
Fair value losses (including impairments and
amortizations) and other adjustments recognized
in the consolidated income statement – 15 – 89 – 48
Fair value adjustments recognized in the consolidated statement
of comprehensive income – 6
Purchases 49 28 229 – 401 – 5
Cash receipts and payments – 32 3 33
Disposals – 3 – 30 – 53
Reclassification 10 – 64
December 31 186 233 581 399 – 1 036 – 29
Total of fair value gains and losses recognized
in the consolidated income statement for assets
and liabilities held at December 31, 2019 – 15 12 6 35 106 – 47
1 Notes 1, 2 and 30 provide information related to discontinued operations.
During 2020, there were several individually non-signif-icant transfers of financial investments from Level 3 to Level 1 for USD 166 million (2019: USD 64 million), mainly due to initial public offerings of the invested companies.
Realized gains and losses associated with Level 3 long-term financial investments measured at fair value through the consolidated income statement are recorded in the consolidated income statement under “Other income” or “Other expense,” respectively. Realized gains and losses associated with Level 3 long-term financial investments measured at fair value through other com-prehensive income are not recycled through the consol-idated income statement but are instead reclassified to retained earnings.
During the year, the net loss and net gain recorded on associated companies, fund investments and long-term financial investments at fair value through profit and loss were USD 92 million and USD 427 million, respec-tively.
If the pricing parameters for the Level 3 input were to change for associated companies at fair value through profit and loss, fund investments and long-term financial investments by 10% positively or negatively, this would change the amounts recorded in the 2020 consolidated statement of comprehensive income by USD 104 million.
To determine the fair value of a contingent consideration, various unobservable inputs are used. A change in these inputs might result in a significantly higher or lower fair value measurement. The inputs used are, among others, the probability of success, sales fore-cast and assumptions regarding the discount rate and timing and different scenarios of triggering events. The inputs are interrelated. The significance and usage of these inputs to each contingent consideration may vary due to differences in the timing and triggering events for payments or in the nature of the asset related to the con-tingent consideration.
If the most significant parameters for the Level 3 input were to change by 10% positively or negatively, or where the probability of success (POS) is the most significant input parameter, 10% were added or deducted from the applied probability of success, for contingent consider-ation payables, other financial liabilities and contingent consideration receivables, this would change the amounts recorded in the 2020 consolidated income statement by USD 260 million and USD 324 million, respectively.
Equity securities measured at fair value through other comprehensive incomeEquity securities held as strategic investments, typically held outside the Novartis Venture Fund, are generally designated at date of acquisition as financial assets val-ued at fair value through other comprehensive income with no subsequent recycling through profit and loss. Except for the investment in Alcon Inc. with a fair value of USD 71 million at December 31, 2020 (2019: USD 382 million), these are made up of individually non-significant investments. At December 31, 2020, the Group holds 56 non-listed equity securities (December 31, 2019: 53) and 34 listed equity securities (December 31, 2019: 29) in this category with the following fair values:
(USD millions) 2020 2019
Listed equity securities 862 843
Non-listed equity securities 249 315
Total equity securities 1 111 1 158
There were no dividends recognized during 2020 and 2019 from these equity securities. In 2020, in accor-

Notes to the Novartis Group consolidated financial statements
F-74
dance with the consolidated foundations Alcon Inc. shares divestment plans, Alcon Inc. shares with a fair value of USD 331 million were sold (2019: USD 976 mil-lion), and the USD 13 million gain on disposal (2019: USD 62 million gain) was transferred from other comprehen-sive income to retained earnings during 2020. In addi-tion, in 2020, equity securities that were no longer con-sidered strategic, with a fair value of USD 206 million (2019: USD 33 million), were sold, and the USD 137 mil-lion gain on disposal (2019: USD 33 million gain) was transferred from other comprehensive income to retained earnings (see Note 8).
Nature and extent of risks arising from financial instrumentsMarket riskNovartis is exposed to market risk, primarily related to foreign currency exchange rates, interest rates, and the market value of the investments of liquid funds. The Group actively monitors and seeks to reduce, where it deems it appropriate to do so, fluctuations in these expo-sures. It is the Group’s policy and practice to enter into a variety of derivative financial instruments to manage the volatility of these exposures and to enhance the yield on the investment of liquid funds. It does not enter into any financial transactions containing a risk that cannot be quantified at the time the transaction is concluded. In addition, it does not sell short assets it does not have, or does not know it will have, in the future. The Group only sells existing assets or enters into transactions and future transactions (in the case of anticipatory hedges) that it confidently expects it will have in the future, based on past experience. In the case of liquid funds, the Group writes call options on assets it has, or writes put options on positions it wants to acquire and has the liquidity to acquire. The Group expects that any loss in value for these instruments generally would be offset by increases in the value of the underlying transactions.
Foreign currency exchange rate riskThe Group uses the US dollar as its reporting currency. As a result, the Group is exposed to foreign currency exchange movements, primarily in European, Japanese and emerging market currencies. Fluctuations in the exchange rates between the US dollar and other curren-cies can have a significant effect on both the Group’s results of operations, including reported sales and earn-ings, as well as on the reported value of our assets, lia-bilities and cash flows. This, in turn, may significantly affect the comparability of period-to-period results of operations.
Because our expenditures in Swiss francs are sig-nificantly higher than our revenues in Swiss francs, vol-atility in the value of the Swiss franc can have a signifi-cant impact on the reported value of our earnings, assets and liabilities, and the timing and extent of such volatility can be difficult to predict.
There is also a risk that certain countries could devalue their currency. If this occurs, it could impact the effective prices we would be able to charge for our prod-ucts and also have an adverse impact on both our con-solidated income statement and balance sheet.
Subsidiaries whose functional currencies have expe-rienced a cumulative inflation rate of more than 100% over the past three years apply the rules of IAS 29 “Finan-cial reporting in Hyperinflationary Economies”. The hyperinflationary economies in which Novartis operates are Argentina and Venezuela. Venezuela was hyperinfla-tionary for all years presented, and Argentina became hyperinflationary effective July 1, 2018, requiring retro-active implementation of hyperinflation accounting as of January 1, 2018. The impacts of applying IAS 29 were not significant in all years presented.
The Group manages its global currency exposure by engaging in hedging transactions where management deems appropriate. Novartis may enter into various con-tracts that reflect the changes in the value of foreign cur-rency exchange rates to preserve the value of assets, commitments and anticipated transactions. Novartis also uses forward contracts and foreign currency option con-tracts to hedge.
Net investments in subsidiaries in foreign countries are long-term investments. Their fair value changes through movements of foreign currency exchange rates. The Group has designated a certain portion of its long-term euro-denominated straight bonds as hedges of the translation risk arising on certain of these net invest-ments in foreign operations with euro functional cur-rency. As of December 31, 2020, long-term financial debt with a carrying amount of EUR 1.8 billion (USD 2.3 billion) (December 31, 2019: USD 2.1 billion), has been desig-nated as a hedge instrument. During 2020, USD 201 mil-lion of unrealized loss (unrealized income in 2019: USD 44 million) was recognized in other comprehensive income and accumulated in currency translation effects in relation with this net investment hedge. The hedge remained effective since inception, and no amount was recognized in the consolidated income statement in 2020, 2019 and 2018.
Commodity price riskThe Group has only a very limited exposure to price risk related to anticipated purchases of certain commodities used as raw materials by the Group’s businesses. A change in those prices may alter the gross margin of a specific business, but generally by not more than 10% of the margin and thus below the Group’s risk management tolerance levels. Accordingly, the Group does not enter into significant commodity futures, forward or option contracts to manage fluctuations in prices of anticipated purchases.
Interest rate riskThe Group addresses its net exposure to interest rate risk mainly through the ratio of its fixed-rate financial debt to variable-rate financial debt contained in its total financial debt portfolio. To manage this mix, Novartis may enter into interest rate swap agreements, in which it exchanges periodic payments based on a notional amount and agreed-upon fixed and variable interest rates.
Equity riskThe Group may purchase equities as investments of its liquid funds. As a policy, it limits its holdings in an unre-lated company to less than 5% of its liquid funds. Poten-

Notes to the Novartis Group consolidated financial statements
F-75
tial investments are thoroughly analyzed. Call options are written on equities that the Group owns, and put options are written on equities that the Group wants to buy and for which cash is available.
Credit riskCredit risks arise from the possibility that customers may not be able to settle their obligations as agreed. To man-age this risk, the Group periodically assesses country and customer credit risk, assigns individual credit limits, and takes actions to mitigate credit risk where appropri-ate.
The provisions for expected credit losses for cus-tomers are based on a forward-looking expected credit loss, which includes possible default events on the trade receivables over the entire holding period of the trade receivables.
In measuring the expected credit losses, trade receiv-ables are grouped based on shared credit risk charac-teristics (such as private versus public receivables) and days past due. In determining the expected credit loss rates, the Group considers current and forward-looking macroeconomic factors that may affect the ability of the customers to settle the receivables, and historical loss rates for each category of customers.
The Group’s largest customer accounted for approx-imately 17% of net sales, and the second largest and third largest customers accounted for 11% and 6% of net sales, respectively (2019: 18%, 13% and 8%, respectively; 2018: 18%, 14% and 8%, respectively).
The highest amounts of trade receivables outstand-ing were for these same three customers and amounted to 14%, 12% and 6%, respectively, of the Group’s trade receivables at December 31, 2020 (2019: 14%, 12% and 7%, respectively). There is no other significant concen-tration of customer credit risk.
Counterparty riskCounterparty risk encompasses issuer risk on market-able securities and money market instruments; credit risk on cash, time deposits and derivatives; as well as settle-ment risk for different instruments. Issuer risk is reduced by only buying securities that are at least A- rated. Coun-terparty credit risk and settlement risk are reduced by a policy of entering into transactions with counterparties (banks or financial institutions) that feature a strong credit rating. Exposure to these risks is closely moni-tored and kept within predetermined parameters. The limits are regularly assessed and determined based upon credit analysis, including financial statement and capital adequacy ratio reviews. In addition, reverse repurchas-ing agreements are contracted, and Novartis has entered into credit support agreements with various banks for derivative transactions. To further reduce the settlement risk, the Group has implemented a multi-currency sys-
tem, CLS (Continuous Linked Settlement), providing mul-tilateral netting (payment-versus-payment settlement) of cash flows from foreign exchange transactions.
The Group’s cash and cash equivalents are held with major regulated financial institutions; the three largest ones hold approximately 14.1%, 12.6% and 9.7%, respec-tively (2019: 12.6%, 10.4% and 8.3%, respectively).
The Group does not expect any losses from non-per-formance by these counterparties and does not have any significant grouping of exposures to financial sector or country risk.
Liquidity riskLiquidity risk is defined as the risk that the Group could not be able to settle or meet its obligations associated with financial liabilities that are settled by delivering cash or another financial asset. Group Treasury is responsi-ble for liquidity, funding and settlement management. In addition, liquidity and funding risks, and related pro-cesses and policies, are overseen by management. Novartis manages its liquidity risk on a consolidated basis according to business needs and tax, capital or regulatory considerations, if applicable, through numer-ous sources of financing in order to maintain flexibility.
Certain countries have legal or economic restrictions on the ability of subsidiaries to transfer funds to the Group in the form of cash dividends, loans or advances, but these restrictions do not have an impact on the abil-ity of the Group to meet its cash obligations.
Management monitors the Group’s net debt or liquid-ity position through rolling forecasts on the basis of expected cash flows.
Novartis has two US commercial paper programs under which it can issue up to USD 9.0 billion in the aggregate of unsecured commercial paper notes. Novartis also has a Japanese commercial paper program under which it can issue up to JPY 150 billion (approxi-mately USD 1.5 billion) of unsecured commercial paper notes. Commercial paper notes totaling USD 4.3 billion under these three programs were outstanding as per December 31, 2020 (2019: USD 2.3 billion). Novartis fur-ther has a committed credit facility of USD 6.0 billion, which was renewed in September 2019. This credit facil-ity is provided by a syndicate of banks and is intended to be used as a backstop for the US commercial paper programs. The facility matures in September 2024 and was undrawn as per December 31, 2020, and December 31, 2019.
In December 2019, Novartis entered into a short-term credit facility of USD 7 billion, with a maturity date of June 30, 2020 with a syndicate of banks. On January 7, 2020, Novartis borrowed USD 7 billion under the facility with interest based on the USD LIBOR. On February 14, 2020, Novartis repaid the full USD 7 billion initially borrowed. The facility expired on June 30, 2020.

Notes to the Novartis Group consolidated financial statements
F-76
The following table sets forth how management monitors net debt or liquidity based on details of the remaining contractual maturities of current financial assets and liabilities, excluding trade receivables and payables as well as contingent considerations at December 31, 2020, and December 31, 2019:
2020
Due later than Due later than Due later than
one month three months one year
Due within but less than but less than but less than Due after
(USD millions) one month three months one year five years five years Total
Current assets
Marketable securities, time deposits and short-term
investments with original maturity more than 90 days 13 1 571 25 5 21 1 635
Commodities 111 111
Derivative financial instruments and accrued interest 38 110 4 4 3 159
Cash and cash equivalents 8 558 1 100 9 658
Total current financial assets 8 609 2 781 29 9 135 11 563
Non-current liabilities
Financial debt – 10 621 – 15 638 – 26 259
Financial debt – undiscounted – 10 661 – 15 802 – 26 463
Total non-current financial debt – 10 621 – 15 638 – 26 259
Current liabilities
Financial debt – 4 195 – 2 218 – 3 178 – 9 591
Financial debt – undiscounted – 4 195 – 2 219 – 3 179 – 9 593
Derivative financial instruments – 93 – 84 – 17 – 194
Total current financial debt – 4 288 – 2 302 – 3 195 – 9 785
Net debt 4 321 479 – 3 166 – 10 612 – 15 503 – 24 481
2019
Due later than Due later than Due later than
one month three months one year
Due within but less than but less than but less than Due after
(USD millions) one month three months one year five years five years Total
Current assets
Marketable securities, time deposits and short-term
investments with original maturity more than 90 days 20 26 16 3 57 122
Commodities 110 110
Derivative financial instruments and accrued interest 14 79 3 3 3 102
Cash and cash equivalents 9 712 1 400 11 112
Total current financial assets 9 746 1 505 19 6 170 11 446
Non-current liabilities
Financial debt – 9 110 – 11 243 – 20 353
Financial debt – undiscounted – 9 150 – 11 355 – 20 505
Total non-current financial debt – 9 110 – 11 243 – 20 353
Current liabilities
Financial debt – 4 243 – 1 373 – 1 230 – 6 846
Financial debt – undiscounted – 4 243 – 1 373 – 1 230 – 6 846
Derivative financial instruments – 130 – 29 – 26 – 185
Total current financial debt – 4 373 – 1 402 – 1 256 – 7 031
Net debt 5 373 103 – 1 237 – 9 104 – 11 073 – 15 938
The consolidated balance sheet amounts of financial lia-bilities included in the above analysis are not materially different to the contractual amounts due on maturity. The
positive and negative fair values on derivative financial instruments represent the net contractual amounts to be exchanged at maturity.

Notes to the Novartis Group consolidated financial statements
F-77
The Group’s contractual undiscounted potential cash flows from derivative financial instruments to be settled on a gross basis are as follows:
2020
Due later than Due later than
one month three months
Due within but less than but less than
(USD millions) one month three months one year Total
Derivative financial instruments and accrued interest on derivative
financial instruments
Potential outflows in various currencies – from financial derivative liabilities – 930 – 4 096 – 719 – 5 745
Potential inflows in various currencies – from financial derivative assets 904 4 114 710 5 728
2019
Due later than Due later than
one month three months
Due within but less than but less than
(USD millions) one month three months one year Total
Derivative financial instruments and accrued interest on derivative
financial instruments
Potential outflows in various currencies – from financial derivative liabilities – 814 – 4 624 – 952 – 6 390
Potential inflows in various currencies – from financial derivative assets 807 4 656 922 6 385
Other contractual liabilities that are not part of management’s monitoring of the net debt or liquidity consist of the following items:
2020
Due later than Due later than
three months one year
Due within but less than but less than Due after
(USD millions) three months one year five years five years Total
Contractual interest on non-current liabilities – 82 – 468 – 1 846 – 4 251 – 6 647
Lease liabilities – 77 – 209 – 692 – 1 027 – 2 005
Trade payables – 5 239 – 164 – 5 403
Commitment for repurchase of own shares – 1 769 – 1 769
Contingent consideration liabilities – 24 – 38 – 639 – 345 – 1 046
2019
Due later than Due later than
three months one year
Due within but less than but less than Due after
(USD millions) three months one year five years five years Total
Contractual interest on non-current liabilities – 36 – 428 – 1 531 – 3 439 – 5 434
Lease liabilities – 65 – 181 – 622 – 1 081 – 1 949
Trade payables – 5 222 – 202 – 5 424
Contingent consideration liabilities – 62 – 9 – 582 – 383 – 1 036
Capital risk management
Novartis strives to maintain a strong credit rating. In man-aging its capital, Novartis focuses on maintaining a strong balance sheet. As of December 31, 2020, Moody’s Investor Service rated the Company A1 for long-term maturities and P-1 for short-term maturities and S&P Global Ratings rated the company AA- for long-term maturities and A-1+ for short-term maturities.
Value at risk
The Group uses a value at risk (VAR) computation to esti-mate the potential 10-day loss in the fair value of its finan-cial instruments.
A 10-day period is used because of an assumption that not all positions could be undone in one day given the size of the positions. The VAR computation includes

Notes to the Novartis Group consolidated financial statements
F-78
all financial assets and financial liabilities as set forth in the table on page F-69, except:• Trade receivables• Other current assets• Long-term loans and receivables, advances and secu-
rity deposits• Contingent considerations• Lease liabilities• Commitment for repurchase of own shares• Trade payables
The VAR estimates are made assuming normal market conditions, using a 95% confidence interval. The Group uses a “Delta Normal” model to determine the observed interrelationships between movements in interest rates, stock markets and various currencies. These interrela-tionships are determined by observing interest rate movements, stock market movements and foreign cur-rency rate movements over a 60-day period for the cal-culation of VAR amounts.
The estimated potential 10-day loss in the fair value of the Group’s foreign currency positions (including for-eign exchange translation risk), the estimated potential 10-day loss of its equity holdings, and the estimated potential 10-day loss in fair value of its interest rate-sen-sitive instruments (primarily financial debt and invest-ments of liquid funds under normal market conditions), as calculated in the VAR model, are the following:
(USD millions) 2020 2019
All financial instruments 587 355
Analyzed by components:
Instruments sensitive to foreign
currency exchange rates 199 89
Instruments sensitive to equity
market movements 62 31
Instruments sensitive to interest rates 197 187
The average, high and low VAR amounts are as follows:
2020
(USD millions) Average High Low
All financial instruments 568 659 322
Analyzed by components:
Instruments sensitive to foreign
currency exchange rates 225 515 71
Instruments sensitive to equity
market movements 78 261 21
Instruments sensitive to
interest rates 329 912 173
2019
(USD millions) Average High Low
All financial instruments 348 385 303
Analyzed by components:
Instruments sensitive to foreign
currency exchange rates 143 195 86
Instruments sensitive to equity
market movements 36 81 16
Instruments sensitive to
interest rates 233 303 187
The VAR computation is a risk analysis tool designed to statistically estimate the potential 10-day loss from adverse movements in foreign currency exchange rates, equity prices and interest rates under normal market conditions. The computation does not purport to repre-sent actual losses in fair value on earnings to be incurred by the Group, nor does it consider the effect of favorable changes in market rates. The Group cannot predict actual future movements in such market rates, and it does not claim that these VAR results are indicative of future movements in such market rates or are represen-tative of any actual impact that future changes in market rates may have on the Group’s future results of opera-tions or financial position.
30. Discontinued operationsDiscontinued operations include the operational results from the Alcon eye care devices business and certain Corporate activities attributable to the Alcon business prior to the spin-off, the gain on distribution of Alcon Inc. to Novartis AG shareholders, and certain other expenses related to the Distribution (refer to Notes 1 and 2 for fur-ther details).
The Alcon eye care devices business researched, discovered, developed, manufactured, distributed and sold a broad range of eye care products. Alcon was orga-nized into two global business franchises, Surgical and Vision Care. Alcon also provided services, training, edu-cation and technical support for both the Surgical and Vision Care businesses.

Notes to the Novartis Group consolidated financial statements
F-79
Consolidated income statement
(USD millions) 2019 1 2018
Net sales to third parties from
discontinued operations 1 777 7 149
Sales to continuing segments 32 4
Net sales from discontinued operations 1 809 7 153
Cost of goods sold – 860 – 3 983
Gross profit from discontinued operations 949 3 170
Selling, general and administration – 638 – 2 754
Research and development – 142 – 585
Other income 15 61
Other expense – 113 – 126
Operating income/(loss) from discontinued operations 71 – 234
Interest expense – 10 – 25
Other financial income and expense – 3 – 1
Income/(loss) before taxes from discontinued operations 58 – 260
Taxes – 159 74
Net loss from discontinued operations
before gain on distribution of Alcon Inc.
to Novartis AG shareholders – 101 – 186
Gain on distribution of Alcon Inc.
to Novartis AG shareholders 2 4 691
Net income/(loss) from discontinued operations 4 590 – 186
1 The consolidated income statement amounts are for the period from January 1, 2019, to the completion of the spin-off.2 See Note 2 for further details on the non-taxable, non-cash gain on distribution of Alcon Inc. to Novartis AG shareholders.
Supplemental disclosures related to the Alcon business distributed to Novartis AG shareholders
Additional significant accounting policiesThe accounting policies mentioned in Note 1 were used for the reporting of discontinued operations. The follow-ing additional significant accounting policies were appli-cable to discontinued operations.
Intangible assets available for useIn addition to currently marketed products, technologies and other intangible assets (including computer soft-ware), discontinued operations intangible assets avail-able for use also included marketing know-how and the Alcon brand name.
Marketing know-how represents the value attribut-able to the expertise acquired for marketing and distrib-uting Alcon surgical products.
The Alcon brand name was shown separately, as it was the only Novartis intangible asset that was available for use with an indefinite useful life. Novartis considers that it was appropriate that the Alcon brand name had an indefinite life since Alcon-branded products had a history of strong revenue and cash flow performance, and Novartis had the intent and ability to support the brand with spending to maintain its value for the fore-seeable future. The Alcon brand name was not amor-tized as it had an indefinite useful life, but was evaluated for potential impairment annually.
The following table shows the respective useful lives for available-for-use intangible assets and the location in the consolidated income statement in which the
respective amortization and any potential impairment charge were recognized:
Income statement location
for amortization and
Useful life impairment charges
Marketing know-how 25 years “Cost of goods sold”
Alcon brand name Not amortized, “Other expense”
indefinite useful life
The estimates used in calculating the net present values are highly sensitive and depend on assumptions specific to the nature of the activities and more specifically on appropriate royalty rate for the Alcon brand name.
Revenue recognitionIn the Alcon Division, which is reported as discontinued operations, surgical equipment may have been sold together with other products and services under a sin-gle contract. Revenues were recognized upon satisfac-tion of each of the performance obligations in the con-tract and the consideration was allocated based on the standalone selling price of each performance obligation.
For surgical equipment, in addition to cash and install-ment sales, revenue was recognized under finance and operating lease arrangements. Arrangements in which substantially all the risks and rewards incidental to own-ership transfers to the customer were treated as finance lease arrangements. Revenue from finance lease arrangements was recognized at amounts equal to the fair value of the equipment, which approximated the present value of the minimum lease payments under the arrangements. As interest rates embedded in lease

Notes to the Novartis Group consolidated financial statements
F-80
arrangements were approximately market rates, revenue under finance lease arrangements was comparable to revenue for outright sales. Finance income for arrange-ments longer than 12 months was deferred and subse-quently recognized based on a pattern that approxi-
mated to the use of the effective interest method and was recorded in “Other income.” Operating lease reve-nue for equipment rentals was recognized on a straight-line basis over the lease term.
Net income
Included in net income from discontinued operations are:
(USD millions) 2019 2018
Interest income 2
Depreciation of property, plant and equipment – 42 – 235
Depreciation of right-of-use assets – 9
Amortization of intangible assets – 174 – 1 052
Impairment charges on property, plant and equipment – 3
Impairment charges on intangible assets 1 – 391
Additions to restructuring provisions – 13
Equity-based compensation of Novartis equity plans – 9 – 93
1 2018 includes an impairment of USD 337 million related to the write-down of the CyPass currently marketed product, which was acquired with the Alcon Division 2016 acquisition of Transcend Medical, Inc.
Balance sheet
The following were in the balance sheet from discontinued operations for the period from January 1, 2019, to the date of reclassification:
(USD millions) 2019
Additions to property, plant and equipment 113
Additions to right-of-use assets 3
Additions to goodwill and intangible assets 36
Cash flows used in investing activities from discontinued operationsCash flows used in investing activities from discontinued operations include the investing activities of the Alcon business and cash outflows for transaction-related expenditures attributable to the series of portfolio trans-formation transactions completed in 2015.
(USD millions) 2020 2019 2018
Payments attributable
to the spin-off of the
Alcon business – 39 – 29
Divested cash and cash equivalents – 628
Cash flows attributable to the
spin-off of the Alcon business – 39 – 657
Other cash flows used in
investing activities, net – 88 – 502 – 1 001
Net cash flows used in investing
activities from discontinued
operations – 127 – 1 159 – 1 001
Cash flows from financing activities from discontinued operationsIn 2020, the net cash outflows used in financing activi-ties from discontinued operations of USD 50 million was for transaction cost payments directly attributable to the distribution (spin-off) of the Alcon business to Novartis AG shareholders.
In 2019, the net cash inflows from financing activities from discontinued operations of USD 3.3 billion (2018: USD 167 million net cash outflows) included mainly USD 3.5 billion (2018: nil) cash inflows from Alcon borrowings in connection with the distribution (spin-off) of the Alcon business to Novartis AG shareholders, partly offset by USD 0.2 billion (2018: USD 0.1 billion) transaction cost payments directly attributable to the distribution (spin-off) of the Alcon business to Novartis AG shareholders (see Notes 1 and 2).
Leases
The lease liabilities recorded in discontinued operations on January 1, 2019, the date of implementation of IFRS 16 Leases (see Note 1), were USD 286 million, and the right-of-use assets were USD 276 million, including USD

Notes to the Novartis Group consolidated financial statements
F-81
89 million and USD 75 million, respectively, for the pre-viously reported finance lease obligations. For discon-tinued operations, there were no impairments or signif-
icant contract terminations of right-of-use assets for the period from January 1, 2019, to February 28, 2019, the date of shareholder approval for the Alcon spin-off.
Net assets derecognized
The following table presents the Alcon business net assets at the date of spin-off at April 8, 2019:
(USD millions) 2019
Property, plant and equipment 2 858
Right-of-use assets 269
Goodwill 8 906
Intangible assets other than goodwill 11 121
Deferred tax assets 732
Financial and other non-current assets 526
Inventories 1 469
Trade receivables and other current assets 1 787
Cash and cash equivalents 628
Deferred tax liabilities – 1 713
Current and non-current lease liabilities – 269
Current and non-current financial debts – 3 538
Trade payables, provisions and other liabilities – 2 751
Net assets derecognized 20 025
Defined contribution plans
In many subsidiaries, associates are covered by defined contribution plans. Contributions charged to the consol-idated income statement for the defined contribution plans were:
(USD millions) 2019 2018
Contributions for defined
contribution plans
discontinued operations 33 104
Significant transactions
In March 2019, Alcon acquired PowerVision, Inc. (PowerVision), a privately held, US-based medical device development company focused on developing accom-modative, implantable intraocular lenses. The fair value
of the total purchase consideration was USD 424 million. The amount consisted of an initial cash payment of USD 289 million and the fair value of the contingent consid-eration of USD 135 million, due to PowerVision share-holders, which they are eligible to receive upon the achievement of specified regulatory and commercializa-tion milestones. The purchase price allocation resulted in net identifiable assets of USD 418 million, consisting of intangible assets of USD 505 million, net deferred tax liabilities of USD 93 million, other net assets of USD 6 million, and goodwill of USD 6 million. The 2019 results of operations since the date of the acquisition were not material.
For additional information related to the distribution (spin-off) of the Alcon business to Novartis AG shareholders, effected through a dividend in kind distribution that was completed on April 8, 2019, refer to Note 1 and Note 2.

Notes to the Novartis Group consolidated financial statements
F-82
31. Events subsequent to the December 31, 2020, consolidated balance sheet dateSignificant transactions not closed as of January 25, 2021In November 2020 and in January 2021, Novartis entered into long-term research and development agreements, both of which did not close as of January 25, 2021. For additional information see Note 28.
Significant transaction closed in January 2021In December 2020, Novartis entered into a business acquisition agreement that closed on January 21, 2021, with an estimated fair value purchase price of USD 235 million.
Dividend proposal for 2020 and approval of the Group’s 2020 consolidated financial statements On January 25, 2021, the Novartis AG Board of Direc-tors proposed the acceptance of the 2020 consolidated financial statements of the Novartis Group for approval by the Annual General Meeting on March 2, 2021. Fur-thermore, also on January 25, 2021, the Board proposed a dividend of CHF 3.00 per share to be approved at the Annual General Meeting on March 2, 2021. If approved, total dividend payments would amount to approximately USD 7.7 billion (2019: USD 7.0 billion), using the CHF/USD December 31, 2020, exchange rate.

Notes to the Novartis Group consolidated financial statements
F-83
32. Principal Group subsidiaries and associated companiesThe following table lists the principal subsidiaries controlled by Novartis, associated companies in which Novartis is deemed to have significant influence, and foundations required to be consolidated under IFRS. It includes all sub-sidiaries, associated companies and consolidated foundations with total assets or net sales to third parties in excess of USD 25 million. The equity interest percentage shown in the table also represents the share in voting rights in those entities, except where explicitly noted.
Share Equity
As at December 31, 2020 capital 1 interest
Algeria
Société par actions SANDOZ, Algiers DZD 650.0 m 100%
Argentina
Novartis Argentina S.A., Buenos Aires ARS 906.1 m 100%
Australia
Novartis Australia Pty Ltd, Macquarie Park, NSW AUD 2 100%
Novartis Pharmaceuticals
Australia Pty Ltd, Macquarie Park, NSW AUD 3.8 m 100%
Sandoz Pty Ltd, Macquarie Park, NSW AUD 11.6 m 100%
Austria
Novartis Austria GmbH, Vienna EUR 1.0 m 100%
Novartis Pharma GmbH, Vienna EUR 1.1 m 100%
Sandoz GmbH, Kundl EUR 32.7 m 100%
EBEWE Pharma Ges.m.b.H Nfg. KG, Unterach am Attersee EUR 1.0 m 100%
Bangladesh
Novartis (Bangladesh) Limited, Gazipur BDT 162.5 m 60%
Belgium
Novartis Pharma NV, Vilvoorde EUR 7.1 m 100%
Sandoz NV, Vilvoorde EUR 19.2 m 100%
Alcon – Couvreur NV, Puurs EUR 110.6 m 100%
Bermuda
Novartis Investment Ltd., Hamilton USD 12 000 100%
Novartis Securities Investment Ltd., Hamilton CHF 30 000 100%
Novartis Finance Services Ltd., Hamilton CHF 20 000 100%
Triangle International Reinsurance Limited, Hamilton CHF 1.0 m 100%
Trinity River Insurance Co Ltd., Hamilton USD 370 000 100%
Brazil
Novartis Biociências S.A., São Paulo BRL 265.0 m 100%
Sandoz do Brasil Indústria Farmacêutica Ltda., Cambé, PR BRL 190.0 m 100%
Canada
Novartis Pharmaceuticals Canada Inc., Dorval, Quebec CAD 1.2 m 100%
Sandoz Canada Inc., Boucherville, Quebec CAD 80.8 m 100%
Sandoz Manufacturing Inc., Boucherville, Quebec CAD 100 100%
Chile
Novartis Chile S.A., Santiago de Chile CLP 2.0 bn 100%
China
Beijing Novartis Pharma Co., Ltd., Beijing USD 30.0 m 100%
Novartis Pharmaceuticals (HK) Limited, Hong Kong HKD 200 100%
China Novartis Institutes for
BioMedical Research Co., Ltd., Shanghai USD 320.0 m 100%
Suzhou Novartis Technical
Development Co., Ltd., Changshu USD 12.0 m 100%
Shanghai Novartis Trading Ltd., Shanghai USD 3.2 m 100%
Sandoz (China) Pharmaceutical
Co., Ltd., Zhongshan USD 57.6 m 100%
Colombia
Novartis de Colombia S.A., Santafé de Bogotá COP 7.9 bn 100%
Croatia
Sandoz d.o.o. farmaceutska industrija, Zagreb HRK 25.6 m 100%
Czech Republic
Novartis s.r.o., Prague CZK 51.5 m 100%
Sandoz s.r.o., Prague CZK 44.7 m 100%
Denmark
Novartis Healthcare A/S, Copenhagen DKK 14.0 m 100%
Sandoz A/S, Copenhagen DKK 12.0 m 100%
Ecuador
Novartis Ecuador S.A., Quito USD 4.0 m 100%
Egypt
Novartis Pharma S.A.E., Cairo EGP 193.8 m 99.77%
Sandoz Egypt Pharma S.A.E., New Cairo City EGP 250 000 100%
Finland
Novartis Finland Oy, Espoo EUR 459 000 100%
Share Equity
As at December 31, 2020 capital 1 interest
France
Novartis Groupe France S.A., Rueil-Malmaison EUR 903.0 m 100%
Novartis Pharma S.A.S., Rueil-Malmaison EUR 43.4 m 100%
Advanced Accelerator Applications S.A., Saint-Genis-Pouilly EUR 76 734 99.2%
CELLforCURE, Les Ulis EUR 4.2 m 100%
Sandoz S.A.S., Levallois-Perret EUR 5.4 m 100%
Germany
Novartis Deutschland GmbH, Nuremberg EUR 155.5 m 100%
Novartis Business Services GmbH, Wehr EUR 25 000 100%
Novartis Pharma GmbH, Nuremberg EUR 25.6 m 100%
Novartis Pharma Produktions GmbH, Wehr EUR 2.0 m 100%
Sandoz International GmbH, Holzkirchen EUR 100 000 100%
1 A Pharma GmbH, Oberhaching EUR 26 000 100%
HEXAL AG, Holzkirchen EUR 93.7 m 100%
Salutas Pharma GmbH, Barleben EUR 42.1 m 100%
Aeropharm GmbH, Rudolstadt EUR 26 000 100%
Greece
Novartis (Hellas) S.A.C.I., Metamorphosis / Athens EUR 233.9 m 100%
Hungary
Novartis Hungary Healthcare Limited Liability
Company, Budapest HUF 545.6 m 100%
Sandoz Hungary Limited Liability Company, Budapest HUF 883.0 m 100%
India
Novartis India Limited, Mumbai INR 123.5 m 70.68%
Novartis Healthcare Private Limited, Mumbai INR 60.0 m 100%
Sandoz Private Limited, Mumbai INR 32.0 m 100%
Indonesia
PT. Novartis Indonesia, Jakarta IDR 7.7 bn 100%
Ireland
Novartis Ireland Limited, Dublin EUR 25 000 100%
Novartis Integrated Services Limited, Ringaskiddy, County Cork EUR 100 100%
Novartis Ringaskiddy Limited, Ringaskiddy, County Cork EUR 2.0 m 100%
Novartis Gene Therapies EU Limited, Dublin EUR 100 100%
Israel
Novartis Israel Ltd., Tel Aviv ILS 1 000 100%
Italy
Novartis Farma S.p.A., Origgio EUR 18.2 m 100%
Advanced Accelerator Applications (Italy) S.r.l., Pozzilli EUR 119 000 99.2%
Sandoz S.p.A., Origgio EUR 1.7 m 100%
Japan
Novartis Pharma K.K., Tokyo JPY 6.0 bn 100%
Ciba-Geigy Japan Limited, Tokyo JPY 8.5 bn 100%
Sandoz K.K., Tokyo JPY 100.0 m 100%
Aspen Japan K.K. Tokyo JPY 2.2 bn 100%
Latvia
Novartis Baltics SIA, Riga EUR 3.0 m 100%
Luxembourg
Novartis Investments S.à r.l., Luxembourg City USD 100.0 m 100%
Novartis Finance S.A., Luxembourg City USD 100 000 100%
Malaysia
Novartis Corporation (Malaysia) Sdn. Bhd., Kuala Lumpur MYR 3.3 m 100%
Mexico
Novartis Farmacéutica, S.A. de C.V., Mexico City MXN 205.0 m 100%
Sandoz, S.A. de C.V., Mexico City MXN 468.2 m 100%
Morocco
Novartis Pharma Maroc SA, Casablanca MAD 80.0 m 100%
Netherlands
Novartis Netherlands B.V., Amsterdam EUR 1.4 m 100%
Novartis Pharma B.V., Amsterdam EUR 4.5 m 100%
IDB Holland BV, Baarle-Nassau EUR 18 000 99.2%
Sandoz B.V., Almere EUR 907 560 100%
New Zealand
Novartis New Zealand Ltd, Auckland NZD 820 000 100%

Notes to the Novartis Group consolidated financial statements
F-84
Share Equity
As at December 31, 2020 capital 1 interest
Norway
Novartis Norge AS, Oslo NOK 1.5 m 100%
Pakistan
Novartis Pharma (Pakistan) Limited, Karachi PKR 6.7 bn 99.99%
Panama
Novartis Pharma (Logistics), Inc., Panama City USD 10 000 100%
Peru
Novartis Biosciences Perú S.A., Lima PEN 6.1 m 100%
Philippines
Novartis Healthcare Philippines, Inc., Makati City PHP 298.8 m 100%
Sandoz Philippines Corporation, Makati City PHP 30.0 m 100%
Poland
Novartis Poland Sp. z o.o., Warsaw PLN 44.2 m 100%
Sandoz Polska Sp. z o.o., Warsaw PLN 25.6 m 100%
Lek S.A., Strykow PLN 11.4 m 100%
Portugal
Novartis Portugal, S.G.P.S., Lda., Porto Salvo EUR 500 000 100%
Novartis Farma – Produtos Farmacêuticos, S.A., Porto Salvo EUR 2.4 m 100%
Sandoz Farmacêutica, Lda., Porto Salvo EUR 499 900 100%
Romania
Novartis Pharma Services Romania S.R.L., Bucharest RON 3.0 m 100%
Sandoz S.R.L., Targu-Mures RON 105.2 m 100%
Russian Federation
Novartis Pharma LLC, Moscow RUB 20.0 m 100%
Novartis Neva LLC, St. Petersburg RUB 500.0 m 100%
ZAO Sandoz, Moscow RUB 57.4 m 100%
Saudi Arabia
Novartis Saudi Ltd., Riyadh SAR 30.0 m 100%
Singapore
Novartis (Singapore) Pte Ltd., Singapore SGD 100 000 100%
Novartis Singapore Pharmaceutical
Manufacturing Pte Ltd, Singapore SGD 45.0 m 100%
Novartis Asia Pacific Pharmaceuticals
Pte Ltd, Singapore SGD 39.0 m 100%
Slovakia
Novartis Slovakia s.r.o., Bratislava EUR 2.0 m 100%
Slovenia
Lek Pharmaceuticals d.d., Ljubljana EUR 48.4 m 100%
Sandoz Pharmaceuticals d.d., Ljubljana EUR 1.5 m 100%
South Africa
Novartis South Africa (Pty) Ltd, Midrand ZAR 86.3 m 100%
Sandoz South Africa (Pty) Ltd, Kempton Park ZAR 3.0 m 100%
South Korea
Novartis Korea Ltd., Seoul KRW 24.5 bn 98.55%
Spain
Novartis Farmacéutica, S.A., Barcelona EUR 63.0 m 100%
Advanced Accelerator Applications
Iberica, S.L.U., Barcelona EUR 22.6 m 99.2%
Catalana de Dispensacion sau
(Cadisa), Esplugues de Llobregat EUR 450 750 99.2%
Sandoz Farmacéutica S.A., Madrid EUR 270 450 100%
Sandoz Industrial Products
S.A., Les Franqueses del Vallés / Barcelona EUR 9.3 m 100%
Alcon Cusi, S.A., El Masnou / Barcelona EUR 10.1 m 100%
Abadia Retuerta S.A., Sardón de Duero / Valladolid EUR 6.0 m 100%
Sweden
Novartis Sverige AB, Stockholm SEK 5.0 m 100%
Switzerland
Novartis International AG, Basel CHF 10.0 m 100%
Novartis Holding AG, Basel 3 CHF 100.2 m 100%
Novartis International Pharmaceutical Investment AG, Basel CHF 100 000 100%
Novartis Bioventures AG, Basel CHF 100 000 100%
Novartis Forschungsstiftung, Basel 4 -- -- --
Novartis Stiftung für Kaderausbildung, Basel 4 -- -- --
Novartis Mitarbeiterbeteiligungsstiftung, Basel 4 -- -- --
Novartis Stiftung für Mensch und Umwelt, Basel 4 -- -- --
Stiftung der Novartis AG für Erziehung,
Ausbildung und Bildung, Basel 4 -- -- --
Novartis Overseas Investments AG, Basel CHF 1.0 m 100%
Japat AG, Basel CHF 50 000 100%
Novartis Pharma AG, Basel 3 CHF 350.0 m 100%
Novartis Pharma Services AG, Basel CHF 20.0 m 100%
Novartis Pharma Schweizerhalle AG, Muttenz CHF 18.9 m 100%
Novartis Pharma Stein AG, Stein CHF 251 000 100%
Novartis Pharma Schweiz AG, Risch CHF 5.0 m 100%
Novartis Ophthalmics AG, Fribourg CHF 100 000 100%
Advanced Accelerator Applications International SA, Geneva CHF 9.3 m 99.2%
Sandoz AG, Basel CHF 5.0 m 100%
Sandoz Pharmaceuticals AG, Risch CHF 100 000 100%
Roche Holding AG, Basel CHF 160.0 m 33%/6% 2
Share Equity
As at December 31, 2020 capital 1 interest
Taiwan
Novartis (Taiwan) Co., Ltd., Taipei TWD 170.0 m 100%
Thailand
Novartis (Thailand) Limited, Bangkok THB 302.0 m 100%
Turkey
Novartis Saglik, Gida ve Tarim Ürünleri Sanayi
ve Ticaret A.S., Istanbul TRY 98.0 m 100%
Farmanova Saglik Hizmetleri Ltd. Sti., Istanbul TRY 6.7 m 100%
Sandoz Ilaç Sanayi ve Ticaret A.S., Istanbul TRY 265.0 m 99.99%
Sandoz Grup Saglik Ürünleri
Ilaçlari Sanayi ve Ticaret A.S., Gebze – Kocaeli TRY 50.0 m 100%
Ukraine
Sandoz Ukraine LLC, Kyiv UAH 8.0 m 100%
United Arab Emirates
Novartis Middle East FZE, Dubai AED 7.0 m 100%
United Kingdom
Novartis UK Limited, London GBP 25.5 m 100%
Novartis Pharmaceuticals UK Limited, London GBP 5.4 m 100%
Novartis Grimsby Limited, London GBP 250.0 m 100%
Advanced Accelerator Applications (UK & Ireland), London GBP 100 99.2%
Neutec Pharma Limited, London GBP 7.7 m 100%
Ziarco Group Limited, London GBP 3 904 100%
Sandoz Limited, Frimley / Camberley GBP 2.0 m 100%
Coalesce Product Development Limited, Cambridge, Cambs GBP 6.0 m 40%
United States of America
Novartis Corporation, East Hanover, NJ USD 72.2 m 100%
Novartis Finance Corporation, East Hanover, NJ 3 USD 1 000 100%
Novartis Capital Corporation, East Hanover, NJ USD 1 100%
Novartis Services, Inc., East Hanover, NJ USD 1 100%
Novartis US Foundation, East Hanover, NJ 4 -- -- --
Novartis Pharmaceuticals Corporation, East Hanover, NJ 3 USD 650 100%
Advanced Accelerator Applications USA, Inc., Millburn, NJ USD 1 99.2%
Novartis Gene Therapies, Inc., Bannockburn, IL USD 1 100%
Novartis Technology LLC, East Hanover, NJ -- -- --
Novartis Institutes for BioMedical
Research, Inc., Cambridge, MA USD 1 100%
Novartis Optogenetics Research, Inc., East Hanover, NJ USD 1 100%
CoStim Pharmaceuticals Inc., Cambridge, MA USD 1 100%
Endocyte, Inc., East Hanover, NJ USD 1 100%
Navigate BioPharma Services, Inc., Carlsbad, CA USD 1 100%
The Medicines Company, East Hanover, NJ USD 1 000 100%
Sandoz Inc., Princeton, NJ USD 25 000 100%
Amblyotech Inc., East Hanover, NJ USD 50 100%
Oriel Therapeutics, Inc., Durham, NC USD 50.0 m 100%
Fougera Pharmaceuticals Inc., Melville, NY USD 1 100%
Eon Labs, Inc., Princeton, NJ USD 1 100%
Novartis Vaccines and Diagnostics, Inc., East Hanover, NJ USD 3 100%
Venezuela
Novartis de Venezuela, S.A., Caracas VES 14 100%
Vietnam
Novartis Vietnam Company Limited, Ho Chi Minh City VND 70 bn 100%
In addition, the Group is represented by subsidiaries and associated companies with total assets or net sales to third parties below USD 25 million in the following countries: Bosnia and Herzegovina, Bulgaria, Dominican Republic, Guatemala, Kenya, Kuwait, North Macedonia, Nigeria, Puerto Rico and Uruguay1 Share capital may not reflect the taxable share capital and does not include any
paid-in surplus.2 Approximately 33.3% of voting shares; approximately 6.2% of total net income and
equity attributable to Novartis.3 Significant subsidiary under SEC Regulation S-X Rule 1-02(w)4 Fully consolidated Foundationm = million; bn = billion
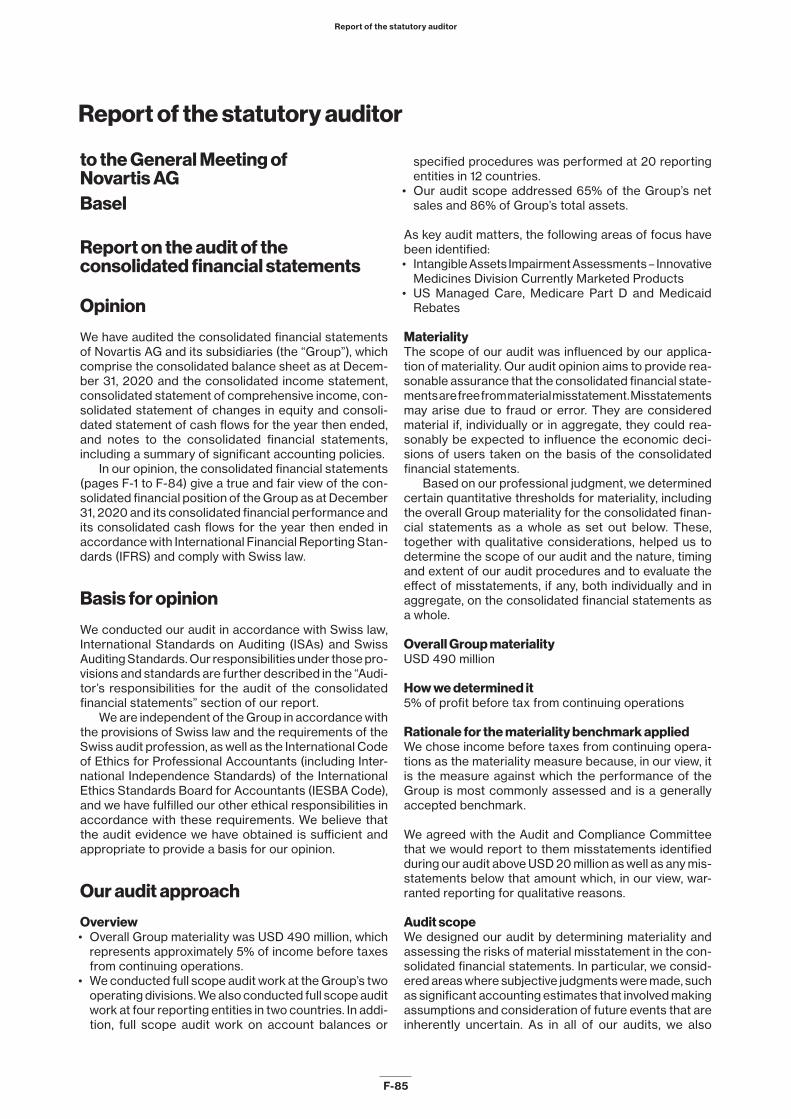
Report of the statutory auditor
F-85
Report of the statutory auditor
to the General Meeting of Novartis AGBasel
Report on the audit of the consolidated financial statements
Opinion
We have audited the consolidated financial statements of Novartis AG and its subsidiaries (the “Group”), which comprise the consolidated balance sheet as at Decem-ber 31, 2020 and the consolidated income statement, consolidated statement of comprehensive income, con-solidated statement of changes in equity and consoli-dated statement of cash flows for the year then ended, and notes to the consolidated financial statements, including a summary of significant accounting policies.
In our opinion, the consolidated financial statements (pages F-1 to F-84) give a true and fair view of the con-solidated financial position of the Group as at December 31, 2020 and its consolidated financial performance and its consolidated cash flows for the year then ended in accordance with International Financial Reporting Stan-dards (IFRS) and comply with Swiss law.
Basis for opinion
We conducted our audit in accordance with Swiss law, International Standards on Auditing (ISAs) and Swiss Auditing Standards. Our responsibilities under those pro-visions and standards are further described in the “Audi-tor’s responsibilities for the audit of the consolidated financial statements” section of our report.
We are independent of the Group in accordance with the provisions of Swiss law and the requirements of the Swiss audit profession, as well as the International Code of Ethics for Professional Accountants (including Inter-national Independence Standards) of the International Ethics Standards Board for Accountants (IESBA Code), and we have fulfilled our other ethical responsibilities in accordance with these requirements. We believe that the audit evidence we have obtained is sufficient and appropriate to provide a basis for our opinion.
Our audit approach
Overview• Overall Group materiality was USD 490 million, which
represents approximately 5% of income before taxes from continuing operations.
• We conducted full scope audit work at the Group’s two operating divisions. We also conducted full scope audit work at four reporting entities in two countries. In addi-tion, full scope audit work on account balances or
specified procedures was performed at 20 reporting entities in 12 countries.
• Our audit scope addressed 65% of the Group’s net sales and 86% of Group’s total assets.
As key audit matters, the following areas of focus have been identified:• Intangible Assets Impairment Assessments – Innovative
Medicines Division Currently Marketed Products• US Managed Care, Medicare Part D and Medicaid
Rebates
MaterialityThe scope of our audit was influenced by our applica-tion of materiality. Our audit opinion aims to provide rea-sonable assurance that the consolidated financial state-ments are free from material misstatement. Misstatements may arise due to fraud or error. They are considered material if, individually or in aggregate, they could rea-sonably be expected to influence the economic deci-sions of users taken on the basis of the consolidated financial statements.
Based on our professional judgment, we determined certain quantitative thresholds for materiality, including the overall Group materiality for the consolidated finan-cial statements as a whole as set out below. These, together with qualitative considerations, helped us to determine the scope of our audit and the nature, timing and extent of our audit procedures and to evaluate the effect of misstatements, if any, both individually and in aggregate, on the consolidated financial statements as a whole.
Overall Group materialityUSD 490 million
How we determined it5% of profit before tax from continuing operations
Rationale for the materiality benchmark appliedWe chose income before taxes from continuing opera-tions as the materiality measure because, in our view, it is the measure against which the performance of the Group is most commonly assessed and is a generally accepted benchmark.
We agreed with the Audit and Compliance Committee that we would report to them misstatements identified during our audit above USD 20 million as well as any mis-statements below that amount which, in our view, war-ranted reporting for qualitative reasons.
Audit scopeWe designed our audit by determining materiality and assessing the risks of material misstatement in the con-solidated financial statements. In particular, we consid-ered areas where subjective judgments were made, such as significant accounting estimates that involved making assumptions and consideration of future events that are inherently uncertain. As in all of our audits, we also

Report of the statutory auditor
F-86
addressed the risk of management override of internal controls, including – among other matters – consider-ation of whether there was evidence of bias that repre-sented a risk of material misstatement due to fraud.
How we tailored the audit scopeWe tailored the scope of our audit in order to perform sufficient work to enable us to provide an opinion on the consolidated financial statements as a whole, taking into account the structure of the Group, the accounting pro-cesses and controls, and the industry in which the Group operates.
The Group financial statements are a consolidation of over 200 reporting entities. We identified four report-ing entities that, in our view, required an audit of their complete financial information due to their size or risk characteristics. We worked very closely with and received full scope reporting from the divisional audit teams for Innovative Medicines and Sandoz, each being a global business. To obtain appropriate coverage of material bal-ances, we also received 19 full scope reports from report-ing entity audit teams for the full scope audit work per-formed on account balances and one specified procedures report. None of the reporting entities excluded from our Group audit scope individually con-tributed more than 5% to net sales or total assets. Audit procedures were also performed by the Group audit team over the Group’s Corporate activities, certain Group functions (including accounting for associated compa-nies, taxation, treasury, certain employee benefits, gov-ernment investigations and litigation) and Group consol-idation.
To exercise the appropriate direction and supervision over the work of the divisional and reporting entity audit teams, the Group audit team reviewed audit working papers, virtually participated in meetings between the divisional and reporting entity audit teams, and virtually attended selected meetings between divisional manage-ment and divisional audit teams.
Key Audit Matters
Key audit matters are those matters that, in our profes-sional judgment, were of most significance in our audit of the consolidated financial statements of the current period. These matters were addressed in the context of our audit of the consolidated financial statements as a whole, and in forming our opinion thereon, and we do not provide a separate opinion on these matters.
Intangible Assets Impairment Assessments – Innovative Medicines Division Currently Marketed ProductsKey audit matterAs described in Notes 1 and 11 to the consolidated finan-cial statements, the Group has intangible assets in its Innovative Medicines Division other than goodwill total-ing USD 35.1 billion at December 31, 2020, including cur-rently marketed products of USD 29.6 billion. The Group recognized impairments of intangible assets in its Innovative Medicines Division other than goodwill of USD
768 million during the year. In most cases, no directly observable market inputs are available to measure the fair value less costs of disposal that is used to determine if the asset is impaired. Therefore, an estimate is derived indirectly and is based on net present value techniques utilizing post-tax cash flows and discount rates. The esti-mates that management used in calculating the net pres-ent values depend on assumptions specific to the nature of the Innovative Medicines Division’s activities with regard to the amount and timing of projected future cash flows; long-term sales forecasts; actions of competitors (launch of competing products, marketing initiatives, etc.); sales erosion rates after the end of patent or other intellectual property rights protection, and timing of the entry of generic competition; outcome of research and development activities (compound efficacy, results of clinical trials, etc.); amount and timing of projected costs to develop IPR&D into commercially viable products; profit margins; probability of obtaining regulatory approval; future tax rate; and discount rate.
The principal considerations for our determination that performing procedures relating to the intangible assets impairment assessments of the Innovative Medicines Division currently marketed products is a key audit matter are the significant judgment by management when developing the net present value of the intangible assets. This in turn led to a high degree of auditor judg-ment, subjectivity, and effort in performing procedures and evaluating management’s significant assumptions related to the amount and timing of projected future cash flows (specifically the long-term sales forecasts and the probability of obtaining regulatory approval) and the dis-count rate. In addition, the audit effort involved the use of professionals with specialized skill and knowledge.
How our audit addressed the key audit matterAddressing the matter involved performing procedures and evaluating audit evidence in connection with form-ing our overall opinion on the consolidated financial statements. These procedures included testing the effectiveness of controls relating to management’s intan-gible assets impairment assessments, including controls over the Innovative Medicines Division currently mar-keted products. These procedures also included, among others, testing management’s process for developing the fair value estimate; evaluating the appropriateness of the net present value techniques; testing the completeness and accuracy of underlying data used in the model; and evaluating the significant assumptions used by manage-ment, including the amount and timing of projected future cash flows and the discount rate. Evaluating manage-ment’s assumptions related to the amount and timing of projected future cash flows and the discount rate involved evaluating whether the assumptions used by manage-ment were reasonable considering the current and past performance of the intangible assets, the consistency with external market and industry data, and whether these assumptions were consistent with evidence obtained in other areas of the audit. Professionals with specialized skill and knowledge were used to assist in the evaluation of the discount rate.

Report of the statutory auditor
F-87
As a result of our procedures, we did not propose any adjustments to the amount of impairment recognized in 2020. For Innovative Medicines Division currently mar-keted products where management determined that no impairment was required, we found that the assessments made by management were based upon reasonable assumptions, consistently applied.
US Managed Care, Medicare Part D and Medicaid RebatesKey audit matterAs described in Note 1 and 22 to the consolidated finan-cial statements, the consideration Novartis receives in exchange for its goods or services may be fixed or vari-able. Variable consideration is only recognized when it is highly probable that a significant reversal will not occur. Rebates and discounts granted to government agencies, wholesalers, retail pharmacies, managed healthcare organizations and other customers, as well as charge-backs are provisioned and recorded as a revenue deduc-tion at the time the related revenues are recorded or when the incentives are offered. They are calculated on the basis of historical experience, regulations, the spe-cific terms in the individual agreements, product pricing and the mix of products, contracts, channels and pay-ors. The provision reported as of December 31, 2020 for revenue deductions amounted to USD 6.3 billion, a sig-nificant portion of which related to US Managed Care, Medicare Part D and Medicaid rebates.
The principal considerations for our determination that performing procedures relating to the US Managed Care, Medicare Part D and Medicaid rebates is a key audit matter are the significant judgment by management due to the significant measurement uncertainty involved in developing these provisions, as the provisions are based on assumptions developed using historical expe-rience, regulations, the specific terms in the individual agreements, product pricing and the mix of products, contracts, channels and payors. This in turn led to a high degree of auditor judgment, subjectivity and effort in applying procedures relating to these assumptions.
How our audit addressed the key audit matterAddressing the matter involved performing procedures and evaluating audit evidence in connection with form-ing our overall opinion on the consolidated financial statements. These procedures included testing the effectiveness of controls relating to provisions for the US Managed Care, Medicare Part D and Medicaid rebate programs, including controls over the assumptions used to estimate these rebates. These procedures also included, among others, developing an independent esti-mate of the rebates by utilizing third-party information on price and market conditions in the US, the terms of the specific rebate programs, and the historical trend of actual rebate claims paid; comparing the independent estimate to management’s estimates; and testing rebate claims processed by the Group, including evaluating those claims for consistency with the contractual and mandated terms of the Group’s rebate arrangements.
We did not identify any material differences between our expectations and the accruals, and we found the judgments made by management to be reasonable.
Other information in the Annual ReportThe Board of Directors is responsible for the other infor-mation in the Annual Report. The other information com-prises all information included in the Annual Report, but does not include the consolidated financial statements, the standalone financial statements and the compensa-tion report of Novartis AG and our auditor’s reports thereon.
Our opinion on the consolidated financial statements does not cover the other information in the Annual Report, and we do not express any form of assurance conclusion thereon.
In connection with our audit of the consolidated finan-cial statements, our responsibility is to read the other information in the Annual Report and, in doing so, con-sider whether the other information is materially incon-sistent with the consolidated financial statements or our knowledge obtained in the audit, or otherwise appears to be materially misstated. If, based on the work we have performed, we conclude that there is a material misstate-ment of this other information, we are required to report that fact. We have nothing to report in this regard.
Responsibilities of the Board of Directors for the consolidated financial statementsThe Board of Directors is responsible for the prepara-tion of the consolidated financial statements that give a true and fair view in accordance with IFRS and the pro-visions of Swiss law, and for such internal control as the Board of Directors determines is necessary to enable the preparation of consolidated financial statements that are free from material misstatement, whether due to fraud or error.
In preparing the consolidated financial statements, the Board of Directors is responsible for assessing the Group’s ability to continue as a going concern, disclos-ing, as applicable, matters related to going concern and using the going concern basis of accounting unless the Board of Directors either intends to liquidate the Group or to cease operations, or has no realistic alternative but to do so.
Auditor’s responsibilities for the audit of the consolidated financial statementsOur objectives are to obtain reasonable assurance about whether the consolidated financial statements as a whole are free from material misstatement, whether due to fraud or error, and to issue an auditor’s report that includes our opinion. Reasonable assurance is a high level of assurance, but is not a guarantee that an audit conducted in accordance with Swiss law, ISAs and Swiss Auditing Standards will always detect a material mis-statement when it exists. Misstatements can arise from fraud or error and are considered material if, individually or in the aggregate, they could reasonably be expected

Report of the statutory auditor
F-88
to influence the economic decisions of users taken on the basis of these consolidated financial statements.
As part of an audit in accordance with Swiss law, ISAs and Swiss Auditing Standards, we exercise professional judgment and maintain professional skepticism through-out the audit. We also:• Identify and assess the risks of material misstatement
of the consolidated financial statements, whether due to fraud or error, design and perform audit procedures responsive to those risks, and obtain audit evidence that is sufficient and appropriate to provide a basis for our opinion. The risk of not detecting a material mis-statement resulting from fraud is higher than for one resulting from error, as fraud may involve collusion, forgery, intentional omissions, misrepresentations, or the override of internal control.
• Obtain an understanding of internal control relevant to the audit in order to design audit procedures that are appropriate in the circumstances.
• Evaluate the appropriateness of accounting policies used and the reasonableness of accounting estimates and related disclosures made.
• Conclude on the appropriateness of the Board of Directors’ use of the going concern basis of account-ing and, based on the audit evidence obtained, whether a material uncertainty exists related to events or con-ditions that may cast significant doubt on the Group’s ability to continue as a going concern. If we conclude that a material uncertainty exists, we are required to draw attention in our auditor’s report to the related dis-closures in the consolidated financial statements or, if such disclosures are inadequate, to modify our opin-ion. Our conclusions are based on the audit evidence obtained up to the date of our auditor’s report. How-ever, future events or conditions may cause the Group to cease to continue as a going concern.
• Evaluate the overall presentation, structure and con-tent of the consolidated financial statements, including the disclosures, and whether the consolidated finan-cial statements represent the underlying transactions and events in a manner that achieves fair presentation.
• Obtain sufficient appropriate audit evidence regarding the financial information of the entities or business activities within the Group to express an opinion on the consolidated financial statements. We are responsible for the direction, supervision and performance of the Group audit. We remain solely responsible for our audit opinion.
We communicate with the Board of Directors, mostly through the Audit and Compliance Committee, regard-ing, among other matters, the planned scope and timing
of the audit and significant audit findings, including any significant deficiencies in internal control that we iden-tify during our audit.
We also provide the Board of Directors with a state-ment that we have complied with relevant ethical require-ments regarding independence, and communicate with them all relationships and other matters that may rea-sonably be thought to bear on our independence, and where applicable, actions taken to eliminate threats or safeguards applied.
From the matters communicated with the Board of Directors, we determine those matters that were of most significance in the audit of the consolidated financial statements of the current period and are therefore the key audit matters. We describe these matters in our audi-tor’s report unless law or regulation precludes public dis-closure about the matter or when, in extremely rare cir-cumstances, we determine that a matter should not be communicated in our report because the adverse con-sequences of doing so would reasonably be expected to outweigh the public interest benefits of such commu-nication.
Report on other legal and regulatory requirementsIn accordance with article 728a paragraph 1 item 3 CO and Swiss Auditing Standard 890, we confirm that an internal control system exists which has been designed for the preparation of consolidated financial statements according to the instructions of the Board of Directors.
We recommend that the consolidated financial state-ments submitted to you be approved.
PricewaterhouseCoopers AG
Luc Schulthess Kris MullerAudit Expert Global relationshipAuditor in charge partner
Basel, January 25, 2021

Financial statements of Novartis AG
A-1
Financial statements of Novartis AGIncome statements (For the years ended December 31, 2020 and 2019)
(CHF millions) Note 2020 2019
Income from investment in Group subsidiaries 8 882 15 318
License income 217 221
Other income 2 2
Total income 9 101 15 541
Amortization of goodwill 3 – 252 – 474
Litigation and settlement costs 4 – 117
General and administrative expenses – 13 – 13
Total expenses – 382 – 487
Operating income 8 719 15 054
Financial income 5 466 512
Financial expenses 5 – 220 – 260
Extraordinary expenses 6 – 11 – 86
Income before taxes 8 954 15 220
Direct taxes – 87 – 40
Net income of the year 8 867 15 180
The accompanying Notes form an integral part of these financial statements.

Financial statements of Novartis AG
A-2
Balance sheets (At December 31, 2020 and 2019)
(CHF millions) Note 2020 2019
Assets
Current assets
Cash and cash equivalents 3 3
Interest-bearing current receivables
Group subsidiaries 5 607 4 078
Other current receivables
Group subsidiaries 62 64
Third parties 1
Total current assets 5 672 4 146
Non-current assets
Financial assets
Group subsidiaries 12 632 14 966
Investments
Group subsidiaries 7 14 252 14 251
Goodwill 3 2 419 2 671
Total non-current assets 29 303 31 888
Total assets 34 975 36 034
Liabilities and equity
Current liabilities
Interest-bearing current liabilities
Group subsidiaries 4 275 4 635
Other current liabilities
Group subsidiaries 36 42
Third parties 193 4
Accrued expenses 53 118
Total current liabilities 4 557 4 799
Non-current liabilities
Interest-bearing non-current liabilities
Bonds 8 1 377 1 377
Non-current provisions 482 482
Total non-current liabilities 1 859 1 859
Total liabilities 6 416 6 658
Equity
Share capital 9 1 234 1 264
Legal capital reserves – capital contribution reserve 10 179 179
General legal reserve 320 320
Legal reserve for treasury shares held by subsidiaries 11 1 389 1 984
Total legal reserves 1 709 2 304
Free reserves 12 2 256 6 949
Retained earnings 16 969 8 844
Net income of the year 8 867 15 180
Retained earnings available for distribution at the end of the year 25 836 24 024
Total unappropriated earnings and free reserves 28 092 30 973
Treasury shares held by Novartis AG 11 – 2 655 – 5 344
Total equity 28 559 29 376
Total liabilities and equity 34 975 36 034
The accompanying Notes form an integral part of these financial statements.

Notes to the financial statements of Novartis AG
A-3
Notes to the financial statements of Novartis AG1. IntroductionThe financial statements of Novartis AG, with its regis-tered office in Basel, comply with the requirements of the Swiss accounting legislation of the Swiss Code of Obligations (SCO).
Novartis AG is presenting consolidated financial statements according to IFRS. Therefore, Novartis AG has applied the exemption included in article 961d, para-graph 1 SCO, and has not prepared additional disclo-sures, a separate cash flow statement and a manage-ment report for SCO purposes.
Significant transactions in 2019
The Novartis AG shareholders approved the spin-off of the Alcon business at the 2019 Annual General Meeting held on February 28, 2019, subject to completion of cer-tain conditions precedent to the distribution.
The conditions precedent to the spin-off were met, and on April 8, 2019, the spin-off of the Alcon business was effected by way of a distribution of a dividend in kind
of Alcon Inc. shares to Novartis AG shareholders and ADR (American Depositary Receipt) holders (“the Dis-tribution”).
Through the Distribution, each Novartis AG share-holder received one Alcon Inc. share for every five Novartis AG shares/ADRs they held on April 8, 2019, close of business. As of April 9, 2019, the shares of Alcon Inc. are listed on the SIX Swiss Exchange (SIX) and on the New York Stock Exchange (NYSE) under the sym-bol “ALC.”
At the date of the distribution, the book value of Alcon Inc. was CHF 17 288 million and consisted of goodwill (CHF 10 081 million), investments in Group subsidiaries (CHF 7 188 million) and cash (CHF 19 million). The Dis-tribution was made at the book value of Alcon Inc. and was recognized as a reduction to free reserves (CHF 17 269 million) and legal capital reserves – capital con-tribution reserves (CHF 19 million).
2. Accounting policiesFinancial income and expenses
Current assets and current liabilities denominated in foreign currencies are converted at year-end exchange rates. Realized exchange gains and losses, and all unreali zed exchange losses arising from these as well as those from business transactions, are recorded net as financial income or financial expenses.
Derivative financial instruments
Derivative financial instruments are used for hedging pur-poses. These instruments are valued at fair value. When different accounting policies apply for the hedged item and the derivative financial instrument, hedge accounting is applied through measuring the hedged item together with the derivative financial instrument.
Financial assets
Financial assets are valued at acquisition cost less adjustments for foreign currency losses and any other impairment of value.
Investments
Investments are initially recognized at cost. Investments in Novartis Group subsidiaries are assessed annually and, in case of an impairment, adjusted to their recover-able amount within their category.
Goodwill
Goodwill is capitalized and amortized over a period of 20 years. Goodwill is reviewed for impairment on a yearly basis. If necessary, an impairment loss is recognized.
Bonds
Bonds are valued at nominal value. Any bond premium is accrued over the duration of the bond so that at maturity, the balance sheet amount will equal the amount that is due to be paid.
Provisions
Provisions are made to cover general business risks of the Group.

Notes to the financial statements of Novartis AG
A-4
3. Goodwill
(CHF millions) 2020 2019
Goodwill
January 1 4 939 22 350
Derecognition as a result of the Alcon Inc. spin-off – 17 411
December 31 4 939 4 939
Accumulated amortization
January 1 – 2 268 – 9 124
Accumulated amortization on assets related to derecognition as a result of the Alcon Inc. spin-off 7 330
Amortization charges – 252 – 474
December 31 – 2 520 – 2 268
Net book value at December 31 2 419 2 671
4. Litigation and settlement costs
In 2020, Novartis resolved some legacy legal matters. Foreign Corrupt Practices Act (FCPA) investigations into Novartis are now closed, as settlements were reached with the US Department of Justice (DOJ) and the US Securities and Exchange Commission (SEC). As part of the settlements, Novartis AG agreed to pay USD 9 mil-lion to the DOJ and USD 113 million to the SEC.
The French Competition Authority (FCA) conducted an investigation into Lucentis against several Novartis subsidiaries. Novartis AG was jointly held liable for a fine of EUR 308 million. As Lucentis is not commercialized by Novartis AG itself, but by Novartis subsidiaries, Novartis AG was fully reimbursed by the operational sub-sidiary.
5. Financial income and expenses 2020 2019
(CHF millions) Income Expenses Income Expenses
Interest 466 – 215 512 – 191
Foreign exchange – 4 – 69
Others – 1
Total 466 – 220 512 – 260
6. Extraordinary expensesIn 2020 and 2019, extraordinary expenses were related to the transaction costs attributable to the spin-off of Alcon Inc.

Notes to the financial statements of Novartis AG
A-5
7. Investments
The principal direct and indirect subsidiaries and other holdings of Novartis AG are shown in Note 32 to the Group’s consolidated financial statements.
In 2019, various participations in Group companies, including Alcon-related participations, were distributed by subsidiaries to Novartis AG, which in turn contributed
them to Alcon Inc. The participation in Alcon Inc. was distributed as a dividend in kind to the Novartis AG share-holders and ADR (American Depositary Receipt) hold-ers on April 8, 2019.
8. BondsStraight bonds
2020 2019
Nominal Issuance Maturity CHF CHF
Coupon Currency amount year year Issuer Issue price millions millions
0.250% CHF 500 2015 2025 Novartis AG, Basel, Switzerland 100.640% 501 501
0.625% CHF 550 2015 2029 Novartis AG, Basel, Switzerland 100.502% 551 551
1.050% CHF 325 2015 2035 Novartis AG, Basel, Switzerland 100.479% 325 325
Total straight bonds 1 377 1 377
Breakdowns by maturity
(CHF millions) 2020 2019
2025 501 501
After 2025 876 876
Total 1 377 1 377
Comparison of balance sheet and fair value
2020 2020 2019 2019
(CHF millions) Balance sheet Fair value Balance sheet Fair value
Straight bonds 1 377 1 470 1 377 1 454
Total 1 377 1 470 1 377 1 454
9. Share capital 2020 2019
Number Share capital Number Share capital
of shares CHF millions of shares CHF millions
January 1 2 527 374 820 1 263.7 2 550 624 820 1 275.3
Number of shares canceled/capital reduced during the period – 60 313 900 – 30.2 – 23 250 000 – 11.6
December 31 2 467 060 920 1 233.5 2 527 374 820 1 263.7
The Novartis AG share capital consists of registered shares with a nominal value of CHF 0.50 each.
The total share capital decreased from CHF 1 263.7 million at December 31, 2019, to CHF 1 233.5 million at December 31, 2020, due to a share capital reduction as

Notes to the financial statements of Novartis AG
A-6
a result of the cancellation of 60.3 million repurchased shares with a nominal value of CHF 30.2 million. The cancellation was approved at the Annual General Meeting on February 28, 2020, and became effective on May 7, 2020. During 2019, the total share capital decreased from CHF 1 275.3 million at December 31, 2018, to CHF 1 263.7 million at December 31, 2019, due to a share
capital reduction as a result of the cancellation of 23.3 million repurchased shares with a nominal value of CHF 11.6 million. The cancellation was approved at the Annual General Meeting on February 28, 2019, and became effective on May 8, 2019.
10. Legal capital reserves – capital contribution reserve
The existing capital contribution reserve of CHF 178 837 279 is intended to be fully used for Novartis AG share buy-back program, which has been approved at the Annual General Meeting on February 28, 2019. That use of the cap-ital contribution reserve is in line with the new provisions on Swiss withholding tax applicable as of January 1, 2020, (article 4a, paragraph 4 VStG).
11. Treasury shares 2020 2019
Legal reserve for Legal reserve for
treasury shares treasury shares
Number held by subsidiaries Number held by subsidiaries
of shares CHF millions of shares CHF millions
Treasury shares held by subsidiaries 1
January 1 33 097 002 1 984 43 229 470 2 596
Number of shares purchased/sold; reserves transferred – 9 771 344 – 595 – 10 132 468 – 612
December 31 23 325 658 1 389 33 097 002 1 984
1 Excluding foundations
2020 2019
Deduction from equity Deduction from equity
for treasury shares for treasury shares
Number held by Novartis AG Number held by Novartis AG
of shares CHF millions of shares CHF millions
Treasury shares held by Novartis AG
January 1 111 621 358 5 344 74 557 458 1 864
Number of shares purchased/canceled; reserves transferred – 27 673 900 – 2 689 37 063 900 3 480
December 31 83 947 458 2 655 111 621 358 5 344
2020 2019
Total Total
Number of treasury shares Number treasury shares
shares CHF millions of shares CHF millions
Total treasury shares 1
January 1 144 718 360 7 328 117 786 928 4 460
Total number of shares purchased/sold or canceled;
reserves transferred – 37 445 244 – 3 284 26 931 432 2 868
December 31 107 273 116 4 044 144 718 360 7 328
1 Excluding foundations

Notes to the financial statements of Novartis AG
A-7
Novartis AG has met the legal requirements for legal reserves under articles 659 et. seq. and 663b.10 SCO for the treasury shares.
Treasury share purchases during 2020 totaled 34.3 million (2019: 62.0 million), with an average purchase price of CHF 81 (2019: CHF 88). No treasury share sales were executed during 2020 (2019: 1.7 million treasury share sales, with an average sale price of CHF 62), and share-based compensation transactions totaled 11.4 mil-lion shares (2019: 10.2 million shares).
The number of treasury shares held by the Company and its subsidiaries meet the definitions and require-ments of article 659b SCO. At December 31, 2020, treasury shares held by Novartis AG and its subsidiaries totaled 107 273 116. As per the dividend payment date, Novartis AG and its subsidiaries are expected to hold 112 226 406 shares. These shares are non- dividend- bearing shares. It should be noted that within the Novartis Group’s IFRS consolidated financial statements, some Novartis entities are included in the consolidation scope. These entities are mainly foundations, which do not qual-ify as subsi diaries in the sense of article 659b SCO.
12. Free reserves(CHF millions) 2020 2019
January 1 6 949 25 433
Special distribution by way of a dividend in kind to effect the spin-off of Alcon Inc. – 17 269
Free reserves after Alcon Inc. spin-off 6 949 8 164
Reduction due to cancellation of treasury shares (CHF 5 318 million / CHF 1 839 million of repurchased shares
less their nominal value of CHF 30 million / CHF 12 million) – 5 288 – 1 827
Transfer from legal reserve for treasury shares 595 612
December 31 2 256 6 949
13. Contingent liabilities(CHF millions) Dec 31, 2020 Dec 31, 2019
Guarantees in favor of subsidiaries to cover capital and interest of bonds, credit facilities and commercial paper
programs – total maximum amount CHF 44 035 million (2019: CHF 41 356 million) 27 482 22 471
Other guarantees in favor of subsidiaries, associated companies and others –
total maximum amount CHF 1 903 million (2019: CHF 1 870 million) 595 495
Total contingent liabilities 28 077 22 966
Novartis AG is part of the Swiss Novartis value-added tax (VAT) group and is therefore jointly liable for existing and future VAT claims from the Swiss Federal Tax Administration.

Notes to the financial statements of Novartis AG
A-8
14. Registration, voting restrictions and major shareholdersThe Company’s Articles of Incorporation state that no person or entity shall be registered with the right to vote for more than 2% of the share capital, as set forth in the commercial register. In particular cases, the Board of Directors may allow exemptions from the limitation for registration in the Novartis Share Register.
According to the Novartis Share Register, sharehold-ers who owned 2% or more of the Company’s capital at December 31, 2020, and were entitled to voting rights on all of their shares, excluding treasury shares held by Novartis AG or its fully owned subsidiaries, were as fol-lows:
% holding of % holding of
share capital share capital
Dec 31, 2020 Dec 31, 2019
Shareholders registered for
their own account:
Emasan AG, Basel 3.6 3.5
UBS Fund Management
(Switzerland) AG, Basel 2.3 2.1
Credit Suisse Funds AG, Zurich 2.0 <2.0
Novartis Foundation for Employee
Participation, Basel <2.0 2.1
Furthermore, there were the following other significant share holders:
% holding of % holding of
share capital share capital
Dec 31, 2020 Dec 31, 2019
Shareholders registered as nominees:
Chase Nominees Ltd., London 9.6 10.4
The Bank of New York Mellon, New York 3.4 3.8
Through The Bank of New York Mellon, Everett 1.7 2.0
Through The Bank of New York Mellon, New York 1.2 1.2
Through The Bank of New York Mellon,
SA/NV, Brussels 0.5 0.6
Nortrust Nominees Ltd., London 4.2 3.9
Shareholder acting as American Depositary Share (ADS) depositary:
JPMorgan Chase Bank, N.A., New York 11.7 12.5
The following shareholder was disclosed through a noti-fication filed with Novartis AG, but was not registered as of December 31, 2020, in the Novartis Share Register:• Norges Bank (Central Bank of Norway), Oslo, which
held 2.3% (2019: 2.1%)
The following shareholder was disclosed through a notification filed with Novartis AG and the SIX Swiss Exchange, but was registered with less than 2% of the share capital as of December 31, 2020, in the Novartis Share Register:• BlackRock, Inc., New York, which held between 3% and
5%

Notes to the financial statements of Novartis AG
A-9
15. Equity instrument disclosures for the Board of Directors and Executive Committee membersShare ownership requirements for Board membersThe Chairman is required to own a minimum of 30 000 Novartis shares, and other members of the Board of Directors are required to own at least 5 000 Novartis shares within five years after joining the Board of Direc-tors, to ensure their interests are aligned with those of shareholders.
Board members are prohibited from hedging or pledging their ownership positions in Novartis shares that are part of their guideline share ownership require-ment, and are required to hold these shares for 12 months after retiring from the Board of Directors. As at Decem-ber 31, 2020, all current and former members of the Board of Directors who were required to meet the mini-mum share ownership requirements did so.
Shares, ADRs and share options owned by Board membersAs at December 31, 2020, no member of the Board of Directors, either individually or together with “persons closely linked”1 to them, owned 1% or more of the out-standing shares (or ADRs) of Novartis. As at the same date, no member of the Board of Directors held any share options to purchase Novartis shares.
The total number of vested Novartis shares and ADRs owned by members of the Board of Directors and “ persons closely linked”1 to them as at December 31, 2020, and as at December 31, 2019, is shown in the table below.
Shares and ADRs owned by Board members1
Number of shares 1,2
At At
December 31, December 31,
2020 2019
Joerg Reinhardt 586 326 563 697
Enrico Vanni 28 847 26 645
Nancy C. Andrews 8 872 7 265
Ton Buechner 14 338 10 950
Patrice Bula 4 621 1 946
Srikant Datar 43 845 41 334
Elizabeth Doherty 8 744 6 765
Ann Fudge 15 201 14 114
Bridgette Heller 794 n.a
Frans van Houten 7 621 4 764
Simon Moroney 731 n.a.
Andreas von Planta 163 834 161 035
Charles L. Sawyers 12 593 10 986
William T. Winters 21 289 18 170
Total 917 656 867 671
na – not applicable1 Includes holdings of “persons closely linked” to Board members (see definition in
“—Persons closely linked”)2 Each share provides entitlement to one vote.
Share ownership requirements for Executive Committee membersExecutive Committee members are required to own at least a minimum multiple of their annual base salary in Novartis shares or RSUs within five years of hire or pro-motion, as set out in the table below. In the event of a substantial rise or drop in the share price, the Board of Directors may, at its discretion, amend that time period accordingly.
Function Ownership level
CEO 5 x base compensation
Other Executive Committee members 3 x base compensation
The determination of equity amounts against the share ownership requirements is defined to include vested and unvested Novartis shares or ADRs, and RSUs acquired under the Company’s compensation plans. However, unvested matching shares granted under former match-ing programs, such as the Leveraged Share Savings Plan (LSSP), and any unvested PSUs are excluded. The deter-mination also includes other shares and vested options of Novartis shares or ADRs that are owned directly or indirectly by “persons closely linked” to an Executive Committee member. The Compensation Committee reviews compliance with the share ownership guideline on an annual basis.
As at December 31, 2020, all members who have served at least five years on the Executive Committee have met or exceeded their personal Novartis share own-ership requirements.
Shares, ADRs, equity rights and share options owned by Executive Committee membersAs at December 31, 2020, no member of the Executive Committee, either individually or together with “persons closely linked”1 to them, owned 1% or more of the out-standing shares (or ADRs) of Novartis. As at the same date, no member of the Executive Committee held any share options to purchase Novartis shares.
The following table shows the total number of shares, ADRs and other equity rights owned by Executive Committee members and “persons closely linked”1 to them as at December 31, 2020, and as at December 31, 2019.
1 “Persons closely linked” are (i) their spouse, (ii) their children below age 18, (iii) any legal entities that they own or otherwise control, and (iv) any legal or natural person who is acting as their fiduciary.

Notes to the financial statements of Novartis AG
A-10
Shares, ADRs and other equity rights owned by Executive Committee members1
Unvested Unvested
Vested shares Total at Vested shares Total at
shares and other December 31, shares and other December 31,
and ADRs equity rights 2 2020 and ADRs equity rights 2 2019
Vasant Narasimhan 104 277 253 770 358 047 59 983 209 934 269 917
Steven Baert 69 679 80 274 149 953 39 785 96 428 136 213
Bertrand Bodson 10 403 34 062 44 465 4 600 26 529 31 129
James Bradner 69 551 124 998 194 549 21 794 150 910 172 704
Harry Kirsch 198 331 119 903 318 234 108 193 143 452 251 645
Shannon Thyme Klinger 29 128 62 679 91 807 12 193 58 633 70 826
Steffen Lang 81 714 61 682 143 396 56 063 51 565 107 628
Klaus Moosmayer 6 011 21 977 27 988 0 15 050 15 050
Susanne Schaffert 106 981 76 392 183 373 43 770 64 082 107 852
Richard Saynor 0 23 324 23 324 0 11 001 11 001
John Tsai 17 783 61 877 79 660 11 859 42 057 53 916
Marie-France Tschudin 12 300 75 848 88 148 5 500 69 793 75 293
Robert Weltevreden 2 734 42 445 45 179 150 19 137 19 287
Total 3 708 892 1 039 231 1 748 123 363 890 958 571 1 322 461
na – not applicable.1 Includes holdings of “persons closely linked” to Executive Committee members (see definition in “—Persons closely linked.”)2 Includes restricted shares, RSUs and target number of PSUs. Matching shares under the ESOP and LSSP, and target number of PSUs are disclosed pro-rata to December 31,
unless the award qualified for full vesting under the relevant plan rules. Awards under all other incentive plans are disclosed in full.3

Appropriation of available earnings and reserves of Novartis AG
A-11
Appropriation of available earnings and reserves of Novartis AG
1. Appropriation of available earnings of Novartis AG as per balance sheet and declaration of dividend
(CHF) 2020 2019
Available unappropriated earnings
Balance brought forward 16 968 847 688 8 844 268 955
Net income of the year 8 867 439 410 15 179 937 729
Total available earnings at the disposal of the Annual General Meeting 25 836 287 098 24 024 206 684
Appropriation proposed by the Board of Directors (cash dividend)
Payment of a gross dividend (before taxes and duties) of CHF 3.00 (2019: CHF 2.95) on 2 354 834 514
(2019: 2 393 660 246) dividend-bearing shares1 with a nominal value of CHF 0.50 each – 7 064 503 542 – 7 061 297 726
Total available earnings after appropriation of cash dividends 18 771 783 556 16 962 908 958
Dividend waived for additional treasury shares held by the Company 5 938 730
Balance to be carried forward after cash dividends 18 771 783 556 16 968 847 688
1 No dividend will be declared on treasury shares held by Novartis AG or its fully owned subsidiaries.
If this proposal is approved, the dividend will be paid as from March 8, 2021. The last trading day with entitlement to receive the dividend is March 3, 2021. As from March 4, 2021, the shares will be traded ex-dividend.
2. Special distribution by way of a dividend in kind to effect the spin-off of Alcon Inc. on April 8, 2019
(CHF) 2019
Available reserves before special distribution
Capital contribution reserves 198 385 279
Free reserves 25 432 646 806
Special distribution by way of a dividend in kind to effect the spin-off of Alcon Inc.
Thereof appropriation from capital contribution reserves – 19 548 000
Thereof appropriation from free reserves – 17 269 355 019
Total distributable reserves after special distribution by way of dividend in kind to effect the spin-off of Alcon Inc.
Capital contribution reserves 178 837 279
Free reserves 8 163 291 787
Novartis shareholders approved the proposed 100% spin-off of Alcon Inc. at the Annual General Meeting on February 28, 2019. The conditions precedent to the spin-off were met, and on April 8, 2019, the spin-off of Alcon Inc. was affected by the way of a distribution of dividend in kind of Alcon Inc. shares to Novartis AG shareholders
and ADR (American Depositary Receipt) holders. Through the distribution, each Novartis AG shareholder received one Alcon Inc. share for every five dividend-bear-ing shares of Novartis AG/ADRs they held on April 8, 2019, close of business.

Report of the statutory auditor
A-12
Report of the statutory auditor
to the General Meeting of Novartis AGBasel
Report on the audit of the financial statements
Opinion
We have audited the financial statements of Novartis AG, which comprise the balance sheet as at December 31, 2020, income statement and notes to the financial state-ments for the year then ended, including a summary of significant accounting policies.
In our opinion, the financial statements (pages A1 to A11) as at December 31, 2020 comply with Swiss law and the company’s articles of incorporation.
Basis for opinion
We conducted our audit in accordance with Swiss law and Swiss Auditing Standards. Our responsibilities under those provisions and standards are further described in the “Auditor’s responsibilities for the audit of the finan-cial statements” section of our report.
We are independent of the entity in accordance with the provisions of Swiss law and the requirements of the Swiss audit profession and we have fulfilled our other ethical responsibilities in accordance with these require-ments. We believe that the audit evidence we have obtained is sufficient and appropriate to provide a basis for our opinion.
Our audit approach
MaterialityThe scope of our audit was influenced by our applica-tion of materiality. Our audit opinion aims to provide rea-sonable assurance that the financial statements are free from material misstatement. Misstatements may arise due to fraud or error. They are considered material if, individually or in aggregate, they could reasonably be expected to influence the economic decisions of users taken on the basis of the financial statements.
Based on our professional judgement, we determined certain quantitative thresholds for materiality, including the overall materiality for the financial statements as a whole as set out in the table below. These, together with qualitative considerations, helped us to determine the scope of our audit and the nature, timing and extent of
our audit procedures and to evaluate the effect of mis-statements, both individually and in aggregate, on the financial statements as a whole.• Overall materiality: CHF 432 million• How we determined it: With reference to our bench-
mark of 5% of income before taxes and for consistency with the Novartis Group consolidated financial state-ments, we determined materiality at CHF 432 million which is 5% of income before taxes.
• Rationale for the materiality benchmark applied: We chose income before taxes as the benchmark because, in our view, it is the benchmark against which the per-formance of the Group is most commonly measured, and it is a generally accepted benchmark.
We agreed with the Audit and Compliance Committee that we would report to them misstatements above CHF 18 million identified during our audit as well as any mis-statements below that amount which, in our view, war-ranted reporting for qualitative reasons.
Audit scopeWe designed our audit by determining materiality and assessing the risks of material misstatement in the finan-cial statements. In particular, we considered where sub-jective judgements were made; for example, in respect of significant accounting estimates that involved making assumptions and considering future events that are inherently uncertain. As in all of our audits, we also addressed the risk of management override of internal controls, including among other matters consideration of whether there was evidence of bias that represented a risk of material misstatement due to fraud.
We tailored the scope of our audit in order to perform sufficient work to enable us to provide an opinion on the financial statements as a whole, taking into account the structure of the entity, the accounting processes and controls, and the industry in which the entity operates.
Report on key audit matters based on the circular 1/2015 of the Federal Audit Oversight Authority We have determined that there are no key audit matters to communicate in our report.
Responsibilities of the Board of Directors for the financial statementsThe Board of Directors is responsible for the prepara-tion of the financial statements in accordance with the provisions of Swiss law and the company’s articles of incorporation, and for such internal control as the Board of Directors determines is necessary to enable the preparation of financial statements that are free from material misstatement, whether due to fraud or error.
Report of the statutory auditor
A-13
In preparing the financial statements, the Board of Direc-tors is responsible for assessing the entity’s ability to continue as a going concern, disclosing, as applicable, matters related to going concern and using the going concern basis of accounting unless the Board of Direc-tors either intends to liquidate the entity or to cease oper-ations, or has no realistic alternative but to do so.
Auditor’s responsibilities for the audit of the financial statementsOur objectives are to obtain reasonable assurance about whether the financial statements as a whole are free from material misstatement, whether due to fraud or error, and to issue an auditor’s report that includes our opinion. Reasonable assurance is a high level of assurance, but is not a guarantee that an audit conducted in accordance with Swiss law and Swiss Auditing Standards will always detect a material misstatement when it exists. Misstate-ments can arise from fraud or error and are considered material if, individually or in the aggregate, they could reasonably be expected to influence the economic deci-sions of users taken on the basis of these financial state-ments.
As part of an audit in accordance with Swiss law and Swiss Auditing Standards, we exercise professional judgment and maintain professional skepticism through-out the audit. We also:• Identify and assess the risks of material misstatement
of the financial statements, whether due to fraud or error, design and perform audit procedures responsive to those risks, and obtain audit evidence that is suffi-cient and appropriate to provide a basis for our opin-ion. The risk of not detecting a material misstatement resulting from fraud is higher than for one resulting from error, as fraud may involve collusion, forgery, intentional omissions, misrepresentations, or the over-ride of internal control.
• Obtain an understanding of internal control relevant to the audit in order to design audit procedures that are appropriate in the circumstances, but not for the pur-pose of expressing an opinion on the effectiveness of the entity’s internal control.
• Evaluate the appropriateness of accounting policies used and the reasonableness of accounting estimates and related disclosures made.
• Conclude on the appropriateness of the Board of Directors’ use of the going concern basis of account-ing and, based on the audit evidence obtained, whether a material uncertainty exists related to events or con-ditions that may cast significant doubt on the entity’s ability to continue as a going concern. If we conclude that a material uncertainty exists, we are required to draw attention in our auditor’s report to the related dis-closures in the financial statements or, if such disclo-sures are inadequate, to modify our opinion. Our con-clusions are based on the audit evidence obtained up to the date of our auditor’s report. However, future events or conditions may cause the entity to cease to continue as a going concern.
We communicate with the Board of Directors, mostly through the Audit and Compliance Committee, regard-ing, among other matters, the planned scope and timing of the audit and significant audit findings, including any significant deficiencies in internal control that we iden-tify during our audit.
We also provide the Board of Directors with a statement that we have complied with relevant ethical requirements regarding independence, and communicate with them all relationships and other matters that may reasonably be thought to bear on our independence, and where applicable, actions taken to eliminate threats or safe-guards applied.
From the matters communicated with the Board of Direc-tors, we determine those matters that were of most sig-nificance in the audit of the financial statements of the current period and are therefore the key audit matters. We describe these matters in our auditor’s report unless law or regulation precludes public disclosure about the matter or when, in extremely rare circumstances, we determine that a matter should not be communicated in our report because the adverse consequences of doing so would reasonably be expected to outweigh the pub-lic interest benefits of such communication.
Report on other legal and regulatory requirementsIn accordance with article 728a paragraph 1 item 3 CO and Swiss Auditing Standard 890, we confirm that an internal control system exists which has been designed for the preparation of financial statements according to the instructions of the Board of Directors.
We further confirm that the proposed appropriation of available earnings complies with Swiss law and the com-pany’s articles of incorporation. We recommend that the financial statements submitted to you be approved.
PricewaterhouseCoopers AG
Luc Schulthess Kris MullerAudit expert Global relationshipAuditor in charge partner
Basel, January 25, 2021