NOV 1 6 1949 U. S. DEPARTMENT OF COMMERCE …
14
REPORT CRPL-4-3 national Bursae of Stewards ISSUED OCTOBER 29,1947 library, & W. Bldg. NOV 1 6 1949 U. S. DEPARTMENT OF COMMERCE NATIONAL BUREAU OF STANDARDS CENTRAL RADIO PROPAGATION LABORATORY WASHINGTON, D. C. SUNSPOTS AND VERY HIGH FREQUENCY RADIO TRANSMISSION BY KENNETH A. NORTON
Transcript of NOV 1 6 1949 U. S. DEPARTMENT OF COMMERCE …

REPORT CRPL-4-3
national Bursae of Stewards
ISSUED OCTOBER 29,1947
library, & W. Bldg.
NOV 1 6 1949 U. S. DEPARTMENT OF COMMERCE
NATIONAL BUREAU OF STANDARDS
CENTRAL RADIO PROPAGATION LABORATORY
WASHINGTON, D. C.
SUNSPOTS AND VERY HIGH FREQUENCY
RADIO TRANSMISSION
BY KENNETH A. NORTON


1
SUNSPOTS AND VERT HIGH FREQUENCY RADIO TRANSMISSION*
At the present time, (1947) the activity of sunspots as measured by the Zurich sunspot numbers!/ is at a higher level than it has ever reached since the discovery of radio during the latter part of the 19th century. In view of our knowledge of the close correlation between the sunspot activity and the characteristics of high-frequency radio transmission via the ionosphere, we may expect very unusual radio propagation conditions generally in the next few months, and, in particular, the ionosphere may be expected to support radio transmission on higher frequencies than ever before.
These spots on the sun are often so large that they can be seen without the aid of telescopes simply by viewing the sun through a smoked glass, or, better yet, by using a pinhole to obtain an image of the sun on a white background. Of course, even better results can be obtained by using a telescope to obtain an image on a white background and even an inexpensive telescope such as is available in many toy shops may be used for this purpose. In this connection it is important tq emphasize that the telescope must not be used to view the sun directly because of probable damage to the eyes of the observer; unless the projection method is used it will be necessary to use a specially designed filter for direct viewing. Fig. 1 contains two photo¬ graphs of the sun made at the Naval Observatory in Washington, D. C. The upper photograph was made on March 6, 1947, and is characterized by several large groups of sunspots; the lower photograph was taken 14 days later on March 20, 1947, and thus approximately represents the side of the sun opposite to that in the upper photograph since the period of rotation of the sun is about 27 days. It will be noted that the visible portion of the sun was much less active on the latter date. The Zurich sunspot number is based upon observations at the Ztirich Observatory in Switzerland and is obtained by the formula S * k(l0g + n) where g denoted the number of groups of spots, n the total number of spots, and k is a constant characteristic of the observer and his telescope. The Zurich daily sunspot numbers for these two days were- reported by the Zurich Observatory to be 198 and 57, respectively, while the average number for the month of March 1947 was 129.8.
The great variability of the sunspot activity from year to year and from cycle to cycle is illustrated in Fig. 2 which shows these secular varia¬ tions. The 49-year running average of the annual sunspot numbers shown on Fig. 2 indicates that there may be an additional cyclical variation of sunspot activity with a period greatly in excess of the well-defined variation ex¬ hibited by the smoothed sunspot numbers and characterized by an average period of about 11 years. Fig. 3 shows the most recent variations in the monthly mean and the smoothed sunspot numbers; the smoothed sunspot numbers are moving averages for 13 successive months and are shown by the solid line. Also shown
2/ W. Brunner, "Tables on Sunspot-Frequency for 1749-1938," Terrestrial Magnetism and Atmospheric Electricity, September 1939, pp. 247-256; these Zurich sunspot numbers are published for later years in subsequent issues of the above journal.
♦This paper is scheduled for publication in the December 1947 issue of QST Magazine; rights for other forms of publication are reserved by that magazine.

- 2 -
on Fig. 3 are several values of the smoothed sunspot number as predicted for the period near the coming maximum of sunspot activity; the McNish and Lincoln^/ predictions were made by the statistical method in current use at the Central Radio Propagation Laboratory of the National Bureau of Standards in connection with the regular forecasts of high-frequency transmission conditions^/; the Waldmeierat/ prediction was made late in 1945, while the Stewart^/ prediction was communicated to the Central Radio Propagation Laboratory in a note dated June 14, 1946. The points indicated by the triangles on Fig. 3 are known as ionospheric sunspot numbers and represent a measure of the sunspot activity obtained from the characteristics of the ionosphere as observed at various ionospheric monitoring stations throughout the world.6/
We turn now to the consideration of the effects of this sunspot activity on high-frequency radio transmission. These effects are very numerous. It has been found that the intensities of radio waves propagated over a particular path via the ionosphere and the intensities of the radio atmospheric noise observed at particular receiving locations vary synchronously with sunspot activity. But the most remarkable and detailed correlations are found between sunspot activity and the maximum radio frequencies (rauf) which may be used for transmission over a particular path. The maximum usable frequencies depend upon the length of the transmission path, being greater for the longer paths up to 4000 kilometers and decreasing somewhat for still longer transmission paths. Fig. 4 shows an example of the close correlation between the sunspot activity and the maximum frequency usable at noon in November for vertical
2/. A. G. McNish and J. V. Lincoln, "Prediction of Annual Sunspot Numbers," Report No. CRFL-1-1, May 15, 1947, published by the Central Radio Propagation Laboratory, National Bureau of Standards, Washington, D. C.
2/ "Basie Radio Propagation Predictions," CRPL series-D, a monthly pub¬ lication giving ionospheric propagation conditions three months in advance as predicted by the Central Radio Propagation Laboratory, National Bureau of Standards; this monthly publication may be obtained by sub¬ scription from the Superintendent of Documents, Government Printing Office, Washington, D. C.
4/ M. Waldmeier, "A Prediction of the Next Maximum of Solar Activity," Terrestrial Magnetism, 51. 270, 1947,
*>/ J. Stewart and F. Eggleston, "The Mathematical Characteristics of Sun¬ spot Variations II," Astrophys. J, ^1, *72, 1940; "A Prediction of the Remaining Course of the Present Sunspot Cycle," JPhys, Rev. 1102, 1939; "The Mathematical Characteristics of Sunspot Variations," Astrophys. J. 88, 385, 1938.
6/ This method is described in detail by M. L. Phillips, "The Ionosphere as a Measure of Solar Activity," Report No, IRPL-R26, prepared in the Interservice Radio Propagation Laboratory, National Bureau of Standards, Washington, D. C.

- 3 -
incidence and for 4000-kilometer transmission paths with their midpoints near Washington, D. C. The maximum usable frequencies at vertical incidence were determined by observing the highest radio frequencies which will return to the earth after reflection at the ionosphere; these determinations were made by transmitting short pulses of energy vertically upwards and observing the reflected pulses on a receiver located at the point of transmission and, in fact, sometimes using the same antenna for reception as for transmission. The maximum usable frequencies for the 4000-kilometer path are values estimated from the vertical-incidence observations and a theory of oblique-incidence propagation which has been found to agree well with experience.
The maximum usable frequencies also depend upon the geographical location, the season and the local hour, being highest near the middle of the day. By studying the vertical-incidence data reported from observing stations all over the world!/ and by making use of relations such as shown on Fig. 4 together with the predictions of future sunspot activity, the Central Radio Propagation Laboratory at the National Bureau of Standards prepares monthly charts for the calculation of the maximum usable frequency on any transmission path and for any time of the day. The charts are pub¬ lished three months in advance of the month for which predictions are made. They are contained in the monthly CRPL publication "Basic Radio Propagation Predictions," obtainable from the Superintendent of Documents, Government Printing Office, Washington, D. C. Fig. 5 is an example of the charts available in this publication and gives the prediction of the maximum usable frequencies for November in the geographical area comprising the W zone which contains most of Canada and the United States and all of South America. These charts give the maximum usable frequency for the latitude and local hour corresponding to the midpoint of the transmission path. Thus, we see that it should be possible to transmit radio waves across the United States on trans¬ mission paths more than 4000 kilometers in length during several hours of the day in November of this year on frequencies as high as 48 Me. This is just a little below the amateur 50-54 Me band but we may nevertheless expect good cross-country transmission on this band for some days in November for the following reason. On Fig. 5 and throughout this report median values for the month are given and values as much as 15$ in excess of these median values may be expected on some days of the month. Furthermore, Fig. 5 is based upon a predicted value of sunspot activity represented by a smoothed Zurich sunspot number of 124. We see by Fig. 3 that the sun may possibly exhibit even higher values of activity than this in November. Thus, it seems quite likely that the amateur 50-Mc band will be quite active for cross-country transmission during the coming winter months.
The maximum usable frequencies discussed in this paper are for regular transmissions via the F2 layer. As is well known, sporadic transmission may also take place via local concentrations of ionization, which occur from time to time in the E region of the ionosphere; these latter transmissions are,
2/ A popular account of this work is given by J. H. Dellinger, "The Ionosphere," The Scientific Monthly, pp. 115-126, August 1947.
4
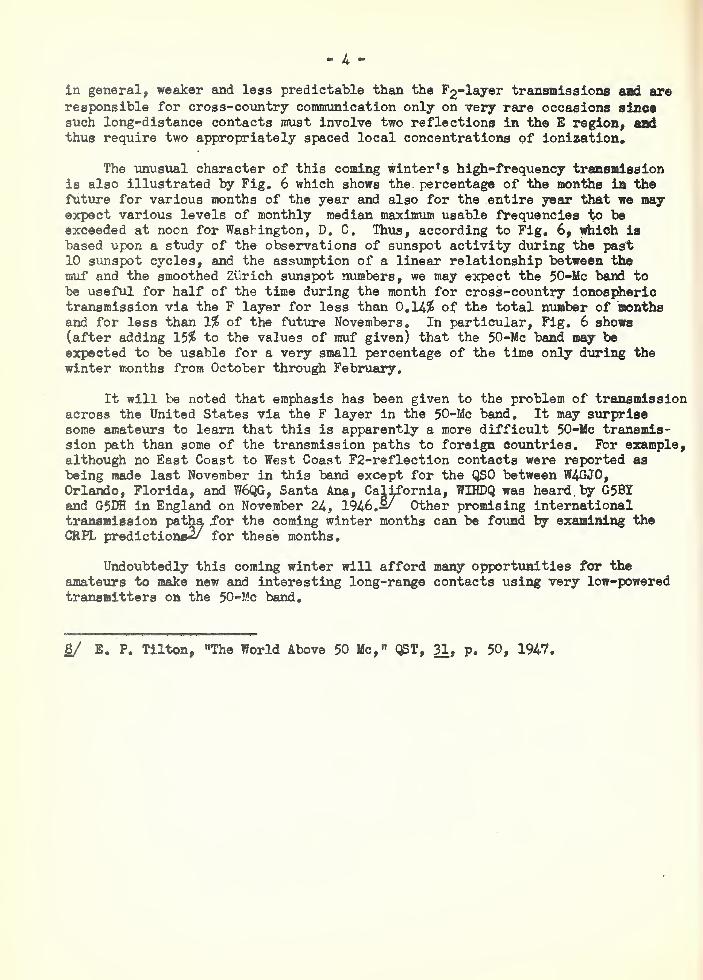
in general, weaker and less predictable than the F2"layer transmissions are responsible for cross-country communication only on very rare occasions since such long-distance contacts must involve two reflections in the E region, and thus require two appropriately spaced local concentrations of ionization.
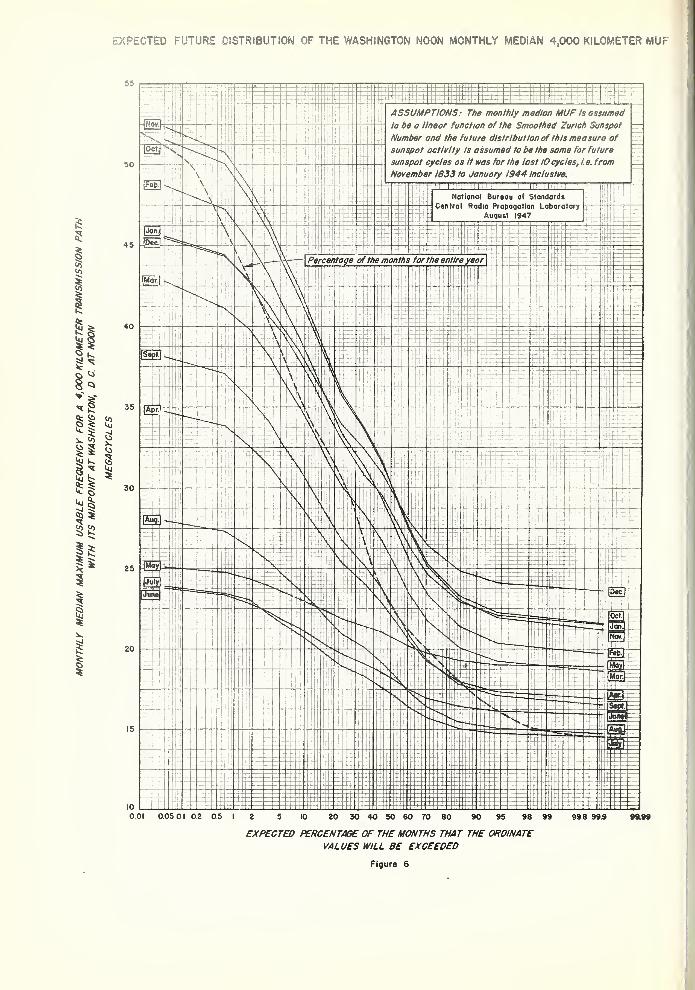
The unusual character of this coming winter*s high-frequency transmission is also illustrated by Fig. 6 which shows the. percentage of the months in the future for various months of the year and also for the entire year that we may expect various levels of monthly median maximum usable frequencies to be exceeded at noon for Washington, D. C. Thus, according to Fig. 6, which is based upon a study of the observations of sunspot activity during the past 10 sunspot cycles, and the assumption of a linear relationship between the muf and the smoothed Zurich sunspot numbers, we may expect the 50-Mc band to be useful for half of the time during the month for cross-country ionospheric transmission via the F layer for less than 0.14$ of the total number of months and for less than 1$ of the future Novembers. In particular, Fig. 6 shows (after adding 15$ to the values of muf given) that the 50-Mc band may be expected to be usable for a very small percentage of the time only during the winter months from October through February.
It will be noted that emphasis has been given to the problem of transmission across the United States via the F layer in the 50-Mc band. It may surprise some amateurs to learn that this is apparently a more difficult 50-Mc transmis¬ sion path than some of the transmission paths to foreign countries. For example, although no East Coast to West Coast F2-reflection contacts were reported as being made last November in this band except for the QSO between W4GJ0, Orlando, Florida, and W6QG, Santa Ana, California, WIHDQ was heard.by G5BI and G5DH in England on November 24, 1946.&/ Other promising international transmission paths, .for the coming winter months can be found by examining the GRPL predictions^/ for these months.
Undoubtedly this coming winter will afford many opportunities for the amateurs to make new and interesting long-range contacts using very low-powered transmitters on the 50-Mc band.
8/ E. P. Tilton, "The World Above 50 Me," QST, 31, p. 50, 1947

photographs of the sun made at the NAVAL OBSERVATORY
WASHINGTON, D. G
MARCH 6, 194?
MARCH 20, 1947
FIGURE i
a f a -a; ■ a.:. ..a,.
iCMHal Rasiio tf||4p#8g tafegfesgr?
i$4T

SE
CU
LA
R
VA
RIA
TIO
NS
EX
HIB
ITE
D
BY
PA
ST
SU
NS
PO
T
CY
CL
ES
5
„ AH0181031 3 0/93HdS0W±V ONV HSI13N0VH 1V/81S39831„ 30 3DSSI 6£6/ 839/S3183S 3HI N! 83NN(189 At A9 0389/19/18 SV
SU3QWDN lOdSNDS 03H100WS HQ/ddZ

230
210
30
«0
RECENT VALUES OF SUNSPOT ACTIVITY WITH PREDICTIONS FOR COMING MONTHS
Notionol Bureau of Stondor rol Radio Propogotion Lot
August 1947
I Smoothed Sunspot Numbers I for comparison with prediction.
o Watdmeier prediction
o Stewart prediction
• Me Nish and Lincoln prediction
x Observed monthly mean Zur ich Sunspot Number
a Ionospheric Sunspot Numbers
Figure 3

CO
RR
EL
AT
ION
OF
TH
E
ME
DIA
N
WA
SH
ING
TO
N
NO
ON
MA
XIM
UM
US
AB
LE
FR
EQ
UE
NC
Y
FO
R
NO
VE
MB
ER
WIT
H
TH
E
SM
OO
TH
ED
SU
NS
PO
T
NU
MB
ER
U39M3AON N! NOON IV3DA! NOION/HSVM NVI03IN A1H1NOH
80
100
120
140
160
180
SM
OO
TH
ED
ZU
RIC
H.
SU
NS
PO
T N
UM
BE
R

f2-layer maximum usable frequency in megacycles Above, VERTICAL INCIDENCE. Below, FOR 4,000 KM. BOTH W ZONE PREDICTIONS FOR NOVEMBER 1947
LOCAL TIME
LOCAL TIME
Figure 5
LA
TIT
UD
E
SO
UT
H
NO
RT
H
LA
TIT
UD
E
MO
NT
HL
Y
ME
DIA
N M
AX
IMU
M
US
AB
LE F
RE
QU
EN
CY F
OR A
4,0
00
KIL
OM
ET
ER T
RA
NS
MIS
SIO
N P
AT
H
WIT
H
ITS
MID
PO
INT
AT W
AS
HIN
GT
ON
, D
C.
AT
NO
ON
ME
GA
CY
CL
ES
EXPECTED FUTURE DISTRIBUTION OF THE WASHINGTON NOON MONTHLY MEDIAN 4,000 KILOMETER MUF
EXPECTED PERCENTAGE OF THE MONTHS THAT THE ORDINATE
VALUES WILL BE EXCEEDED
Figure 6