NOTE: The use of the Outside & Inside: Trends in Internet...
49
PRESENTATION TITLE © 2017 MHI® Copyright claimed for audiovisual works and sound recordings of seminar sessions. All rights reserved. Presented by: Bryan Jensen EVP/Senior Partner Outside & Inside: Trends in Internet Fulfillment Networks and Facilities Your Logo Goes Here!
Transcript of NOTE: The use of the Outside & Inside: Trends in Internet...

PRESENTATION TITLE
© 2017 MHI® Copyright claimed for audiovisual works and sound recordings of seminar sessions. All rights reserved.
NOTE: The use of the
following opening title
slide is MANDATORY in
each PowerPoint
presentation for in-show
continuity and post-show
on-demand web viewing.
Please include seminar
title, sponsor logo and
speaker names/titles. Presented by:
Bryan Jensen
EVP/Senior Partner
Outside & Inside:
Trends in Internet
Fulfillment
Networks and
Facilities
Your Logo Goes
Here!

Topics
• Experience – “Why Listen”
• Some terms and definitions
• Network and facility trends
• Design criteria trends…Big Data
• Processes and equipment trends
• Systems considerations
• How the Networks Outside the 4 Walls affects the
Design inside the 4 Walls

Fulfillment Experience • H&M
• Finish Line
• The Children’s Place
• Sears
• Target
• HSN
• Shopko
• Zale Corp
• Netshops.com
• eFollet
• Walmart
• Golfsmith
• TJX
• Toys “R” Us
• JC Penney
• QVC
• Gap Direct
• Home Depot
• Urban Outfitters
• Rue La La
• L.L. Bean
• David’s Bridal
• Staples
• Office Depot
• Office Max
• Sephora
• Ikea
• West Marine
• Liberty Interactive
• Zulily
• B&N.com
• Budgetext
• Petfooddirect.com
• LTD Commodities
• Nordstrom
• Williams-Sonoma
• S5A.com
• Dell
• Chico’s
• Scholastic Books
• Foot Locker
• Levi Strauss
• PetSmart

Omni-channel: The current trend

Okay so then what’s “multi-channel” There are several basic network types and configurations for servicing direct to consumer
customers. Those that are pertinent to our discussion and are detailed in some of the
slides that follow are:
Combination Center - Stores and on-line customers serviced from same facility
Dedicated Centers – Stores and on-line customers serviced from separate locations
Store Distributed – On-line customers are shipped from stores
Hybrid – Combination of the above strategies based on geography, SKU segment (type or velocity)

Network Types – Location Strategy • Single vs. Multiple locations – Strategy complexion that can apply to any of the
identified network types
Single Location
Combination Center - Stores and on-line customers serviced from same facility
Dedicated Centers – Stores and on-line customers serviced from separate locations
Store Distributed – On-line customers are serviced from stores
Hybrid – Combination of the above strategies based on geography, SKU segment (type or velocity)

Network Types – Location Strategy
• Single vs. Multiple locations – Strategy complexion that can apply to any of the
identified network types
Multiple Locations

Dedicated Center(s)
Store service
Direct to consumer

Multi-channel Center(s)
Store service
Direct to consumer
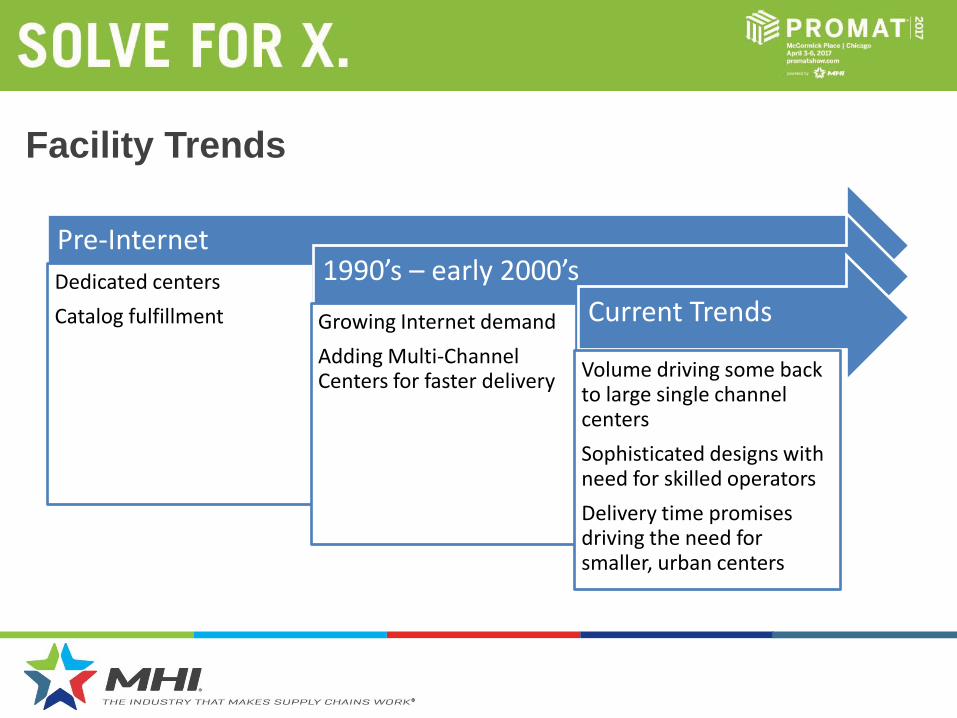
Facility Trends
Pre-Internet
Dedicated centers
Catalog fulfillment
1990’s – early 2000’s
Growing Internet demand
Adding Multi-Channel Centers for faster delivery
Current Trends
Volume driving some back to large single channel centers
Sophisticated designs with need for skilled operators
Delivery time promises driving the need for smaller, urban centers

In what Unit of Measure?
Consumer
Products
• Low SKU count
• Pallet in
• Pallet and case out
Retail
• Higher SKU count
• Pallet and case in
• Case and piece out
Direct to Consumer
• Higher SKU count
• Case and piece in
• Piece out
What are you selling?
Apparel
•Bagged & Labelled
•Sort Friendly
• Imperfect Conveyability
Hard Lines
•Cartons
•Gentler Sorting
•Best Conveyability
Non- Sortables
•Oversized/Asymmetrical
•Too Small
•No AutoID

Using Big Data in the Supply Chain
Finding
• ERP / WMS / WCS
• Backup/Archive Servers
• Websites
• Third party data sources
Mining (Extract)
• Proprietary Tools
• Third party analysts
Analyzing(Translate)
• Proprietary Tools
• Third party analysts
Deciding
• Designing
• Scheduling
• Staffing
• Forecasting
• Sourcing
Continuous Improvement

13
Days
Category Total Avg Min Max Std
OrderNumbers 4,166 21 1 68 9
SKUs 240 72 2 111 21
ShipToIDs 541 17 1 43 6
Lines 32,676 127 2 270 51
Eaches 497,288,475 1,934,975 20,300 4,260,440 721,709
Eq Cases 2,101,175 8,176 73 18,456 3,027
Eq Layers 346,945 1,350 13 3,077 501
Eq Pallets 64,434 251 2 558 91
Loose Eaches - - - - -
Full Cases 20,337 79 - 203 39
Full Layers 26,336 102 - 312 51
Full Pallets 58,838 229 1 514 85
Eaches On Cases 4,804,549 18,695 - 44,029 9,428
Eaches On Layers 43,088,654 167,660 - 518,478 85,456
Eaches On Pallets 449,395,272 1,748,620 9,900 3,895,412 664,445
Eq Cases As Eaches - - - - -
Cases On Layers 164,703 641 - 1,933 324
Cases On Pallets 1,916,135 7,456 30 16,978 2,817
Eq Layers As Eaches - - - - -
Eq Layers As Cases 3,159 12 - 30 6
Layers On Pallets 317,450 1,235 5 2,847 468
Eq Pallets As Eaches - - - - -
Eq Pallets As Cases 622 2 - 6 1
Eq Pallets As Layers 4,974 19 - 57 10
Loose Each Lines - - - - -
Full Case Lines 7,495 29 - 77 14
Full Layer Lines 11,644 45 - 133 23
Full Pallet Lines 19,250 75 1 170 31
Cube (cu ft) 6,103,901 23,751 221 53,381 8,671
Weight (lbs) 44,123,598 171,687 1,697 375,055 63,004
257
0
10,000
20,000
30,000
40,000
50,000
60,000
70,000
4/2
/2012
4/1
6/2
012
4/3
0/2
012
5/1
4/2
012
5/2
8/2
012
6/1
1/2
012
6/2
5/2
012
7/9
/2012
7/2
3/2
012
8/6
/2012
8/2
0/2
012
9/3
/2012
9/1
7/2
012
10/1
/2012
10/1
5/2
012
10/2
9/2
012
11/1
2/2
012
11/2
6/2
012
12/1
0/2
012
12/2
4/2
012
1/7
/2013
1/2
1/2
013
2/4
/2013
2/1
8/2
013
3/4
/2013
3/1
8/2
013
Eq Cases by Week
Day Of Week Sunday Monday Tuesday Wednesday Thursday Friday Saturday TotalDays
Days Analyzed 1 49 49 51 51 50 6 257
Day Of Week Sunday Monday Tuesday Wednesday Thursday Friday Saturday
Min Lines 7.0 3.0 54.0 50.0 31.0 16.0 2.0
Avg Lines 7.0 153.9 134.5 141.3 106.1 117.5 7.3
Stdev Lines 56.0 40.0 39.2 43.1 41.3 7.6
Max Lines 7.0 270.0 240.0 226.0 217.0 244.0 22.0
Line Type Lines % Order Type Orders %
Lines with EAs + Cases + Layers + Pallets 0 0.0% Orders with EAs + Cases + Layers + Pallets 0 0.0%
Lines with EAs + Cases + Layers 0 0.0% Orders with EAs + Cases + Layers 0 0.0%
Lines with EAs + Cases + Pallets 0 0.0% Orders with EAs + Cases + Pallets 0 0.0%
Lines with EAs + Layers + Pallets 0 0.0% Orders with EAs + Layers + Pallets 0 0.0%
Lines with Cases + Layers + Pallets 860 2.6% Orders with Cases + Layers + Pallets 1,777 37.6%
Lines with EAs + Cases 0 0.0% Orders with EAs + Cases 0 0.0%
Lines with EAs + Layers 0 0.0% Orders with EAs + Layers 0 0.0%
Lines with EAs + Pallets 0 0.0% Orders with EAs + Pallets 0 0.0%
Lines with Cases + Layers 2,198 6.7% Orders with Cases + Layers 146 3.1%
Lines with Cases + Pallets 214 0.7% Orders with Cases + Pallets 109 2.3%
Lines with Layers + Pallets 1,712 5.2% Orders with Layers + Pallets 562 11.9%
Lines with EAs Only 0 0.0% Orders with EAs Only 0 0.0%
Lines with Cases Only 4,235 13.0% Orders with Cases Only 676 14.3%
Lines with Layers Only 6,918 21.2% Orders with Layers Only 159 3.4%
Lines with Pallets Only 16,539 50.6% Orders with Pallets Only 1,297 27.4%
Extra Lines 0 0.0% Extra Orders 0 0.0%
Order Analysis

Order Commonality
14
Order Group EachQtySplits LineSplits Orders Order % NumSKUs TotalLines Line % Eaches Each %
[CORE] [100%] [100%] 909 22% 137 1,713 5% 51,668,645 10%
[STFO] [100%] [100%] 313 8% 37 506 2% 37,086,160 7%
[CORE][STFO] [49.3%][50.7%] [72.5%][27.5%] 116 3% 108 797 2% 18,204,384 4%
[CORE][VP] [77.4%][22.6%] [81.5%][18.5%] 87 2% 96 915 3% 13,942,691 3%
[CORE][STFO][VP] [59.5%][20.3%][20.2%] [64%][17.6%][18.4%] 80 2% 100 944 3% 12,868,428 3%
[STFL] [100%] [100%] 80 2% 12 92 0% 5,480,700 1%
[NEWCAKE] [100%] [100%] 75 2% 13 78 0% 234,750 0%
[STFL][STFO] [13%][87%] [29.4%][70.6%] 69 2% 16 385 1% 10,407,330 2%
[CORE][STFL][STFO] [47.6%][8.1%][44.4%] [56.4%][15.1%][28.5%] 63 2% 96 564 2% 10,082,282 2%
[CORE][STFO][STFR] [56.5%][35.6%][7.9%] [66.9%][19.1%][14%] 59 1% 100 598 2% 10,621,962 2%
[STF52R3] [100%] [100%] 55 1% 1 63 0% 426,300 0%
[STFR] [100%] [100%] 51 1% 15 58 0% 584,808 0%
[PL] [100%] [100%] 50 1% 10 55 0% 92,200 0%
[SANDWEDGE] [100%] [100%] 38 1% 3 53 0% 7,048,512 1%
[CORE][STFL][STFO][STFR] [43.9%][7.5%][41.4%][7.3%] [53.7%][10.1%][23.7%][12.5%] 37 1% 87 497 2% 5,498,042 1%
[CORE][STFO][STFR][VP] [49.1%][26.7%][8.3%][15.9%] [57.7%][17.3%][10.3%][14.7%] 36 1% 109 504 2% 6,676,876 1%
[CORE][STFL][STFO][VP] [40.7%][5.6%][40.9%][12.8%] [50.9%][10.1%][24.6%][14.4%] 36 1% 87 464 1% 5,706,450 1%
[FREEDS] [100%] [100%] 34 1% 3 57 0% 6,406,780 1%
[STF202] [100%] [100%] 34 1% 1 34 0% 434,850 0%
[CORE][STFL][STFO][STFR][VP] [47.8%][5.9%][27.1%][5.6%][13.6%] [53.5%][7.9%][16.5%][11.9%][10.2%] 31 1% 110 480 1% 5,221,332 1%
[CARCUP] [100%] [100%] 31 1% 3 31 0% 1,151,328 0%
[CORE][STFR] [75%][25%] [77.5%][22.5%] 29 1% 90 244 1% 5,252,954 1%
[CORE][STFR][VP] [68.5%][13.2%][18.3%] [67.8%][17.5%][14.7%] 29 1% 98 354 1% 6,169,548 1%
[STFL][STFO][STFR] [22.8%][53.2%][24%] [30.1%][47.6%][22.3%] 28 1% 14 166 1% 3,221,230 1%
[VISIBLYFRESH] [100%] [100%] 28 1% 23 53 0% 1,648,650 0%
[CORE][CRYSTALFRESH][VP] [59.8%][19.5%][20.7%] [71.6%][12.1%][16.4%] 28 1% 62 464 1% 4,411,385 1%
For this analysis, the order groups were product families
0%
5%
10%
15%
20%
25%
Order %
Line %
Each %

Growth Considerations
-
5,000
10,000
15,000
20,000
25,000
30,000
year1
year2
year3
year4
year5
year6
year7
year8
year9
orders
lines
units
MATERIAL HANDLING
PROCESSES & EQUIPMENT Match the equipment to the need (but make sure to scrutinize your need)

D2C Order Fulfillment Progression

Are Zone Divert
Pick & Pass
Modules
“so 1990’s”?
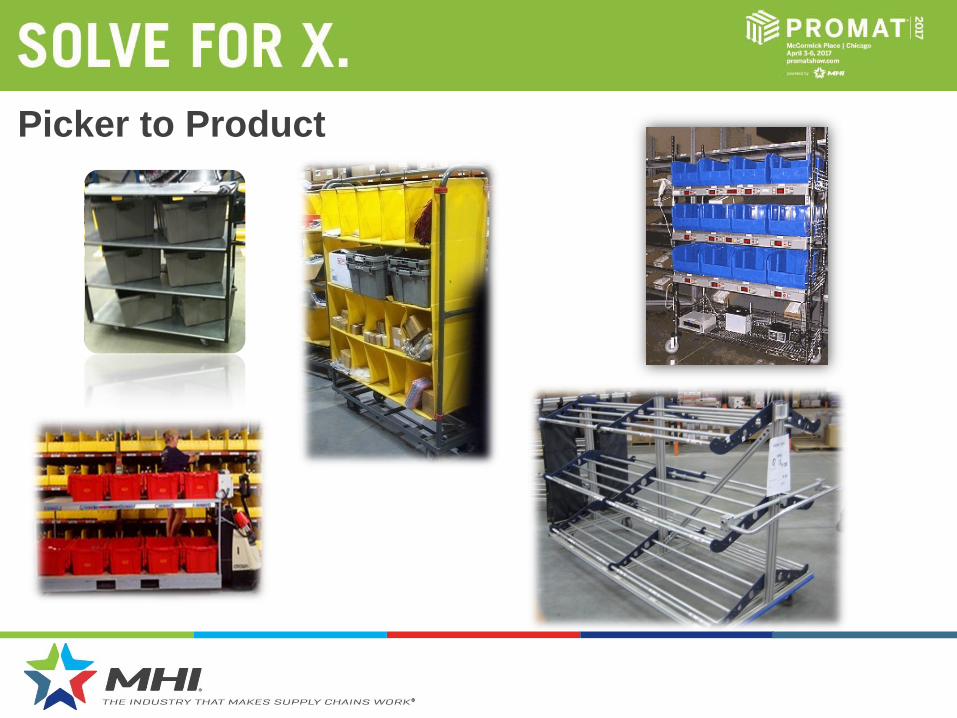
Picker to Product

Product to Picker Mini-load
Carousel
Vertical Lift
Module
Shuttle
System

Unit Sort
Order
Consolidation
Cross
belt
Tilt tray
Bombay

Sort to Order
automated manual
1 sort vs. 2-pass sort
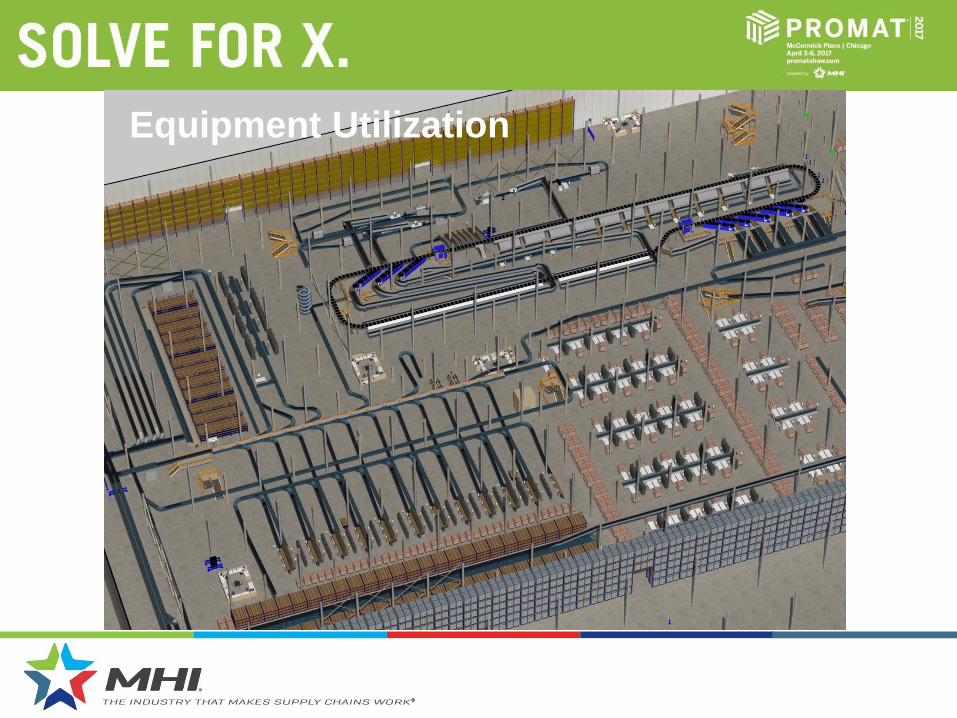
Equipment Utilization


Level of Service (Order Cycle Time) Will Drive Equipment
Utilization/Needs
• 48 hour Level of
Service achieved with
50% reduction in total
facility throughput
capacity
• 72 hour Level of
Service achieved with
60.6% reduction in
facility throughput
capacity
(graph not depicted)

Technology Rises to Meet the E-commerce Fulfillment
Demand (and $tay$ there)
• Investing to accommodate
D2C peaks is significant
• Peak to Average ratios for
a brief period do not
payback investments to
cover those peaks
• The Dilemma – How to maintain service for a significant peak and maintain profitability
• The Answer – Balance (1) CAPEX (2) Throughput Capacity and (3) Labor
Easter Sunday Any Sunday

Technology Rises to Meet the E-commerce Fulfillment
Demand, finds common sense…
• Unit sorter
– One sorter for 10 months
– Active put walls in peak season
• AS/RS
– Cranes based on average single pass/seasonal two part put process
– Use two pass put wall in season
• Manual Solution
– Cart pick to single put wall out of season
– Use two pass put wall in season
• Coupled with additional shifts, the same site can support 4x to 10x peak to average demand, while only driving labor up 2x to 3x

In or Out of Control?
Blurring lines between WMS and WCS
31
Warehouse Management System (WMS)
Warehouse Control System (WCS)
Receiving
Transportation
Order Management
Shipment Management
Inventory Management
Inbound Shipment Documents
Location and Storage Management
Equipment Interfaces
Equipment Communication and Control
Move Management
Cycle Counting
Putaway/Replenishment Task Interleaving

TYPICAL WMS FUNCTIONS

WAREHOUSE CONTROL SYSTEMS
1990’s: PLC’s for material
handling storage &
conveyor equipment
control & diagnostics to
speed item flow from
receipt to order release,
picking & shipment.
Today: PC’s & expanded
functionality including order
analysis, release & status
monitoring, AIDC management
& a host of additional
equipment interfaces coupled
with line & activity balancing .

THE LINES ARE BLURRING

WMS or WCS? • Make sure the layout and processes are fixed first. Don’t overlay
any WMS or WCS on flawed layouts & processes.
• If both make sense for your requirements, develop detailed specifications that define which system controls which functions, data synchronization processes and timing, exception handling – AND, who is accountable for overall system performance.
• Avoid customization – it adds cost, lengthens implementation time & increases risk.
• WMS and WCS have complementary solution sets that need to work together. Instead of looking at this as a battle between WMS & WCS, solutions providers need to look at finding the right balance of both that results in the best answer for the customer’s operational needs.

Significant return levels will demand consideration be given locating
where returns are received back from the customer. Considerations will
differ depending on the number of fulfillment centers and the presence
(or absence) of stores in the company’s supply chain.
• Single Location Fulfillment operation – Return best processed back at
the fulfillment location for return to stock availability
• Multiple Location Fulfillment operation – Decentralized Returns will
decrease return freight if customers are directed to return product to
the center closest to them
• Will the retailer pay return freight or the customer? – Clearly paying return freight will enhance the customers’ experience but will drive
toward a strategy to reduce return freight costs if possible by shipping back to the
closest fulfillment in a multiple fulfillment center environment.
– If the customer pays the freight (and the retailer does not perceive a negative sales
impact by requiring this) then a single returns location may make more sense
• Single returns location maximizes returns processing efficiencies, but
may, if restocked returns are high enough, create an inventory
imbalance issue in multiple fulfillment center networks
Returns Strategy

• The pragmatics of providing shipping material and instructions must be
addressed
– During the on-line return authorization process best in class e-commerce
merchants will provide a shipping label on line to the customer as part of the
return authorization process.
– This can be done for a prepaid label or merely an address label to be applied
to the return package for a return parcel for which the customer is paying.
– The exceptional e-commerce retailer, where possible, provides a return label
with the outbound invoice as part of a multi-part form and can package soft
goods in shipping bags that are reversible or reusable to serve as returns
packaging
• Will the retailer allow on line purchases to be returned to a store (very
‘omni-channel’?
– This enhances the customer experience as the customer has more options
(if this is allowed in addition to shipping it back to an appropriate location)
– The potential downside is selling the product at the store level or dealing with
product that may not be in a salable state at store level.
– Upside is bringing the customer into one the retailers POS locations for
further custom.
Returns Strategy (continued)
Pragmatic Network & Facility Examples

Pragmatic Combination Centers Specialty Retail
• Stores and on-line customers are
serviced from same facilities
• Both store replenishment and e-
com fulfillment require pick and
pack operations
• Bi-weekly transfer shuttles
between DCs to balance
inventory serve as an option to
drive single parcel order
shipments
• A good mix of minimized cycle time to the customer, operating costs advantages and minimal inventory penalty drives this network
• Order volume is low enough, and inventory cube is small enough that the direct to consumer channel does not really demand its own facility
• Like order processing operations (pick and pack for both stores and e-com) allows for processing economies
Store service
Direct to consumer Transfer Shuttle


Pragmatic Dedicated Centers Garment Retail • Stores and on-line customers
serviced from dedicated facilities
for each channel
• Multiple e-com locations serve
customers by geography as
shown on map to the left
(Retailer’s store DCs not shown
illustrative simplicity)
• Service areas for customers can
overlap
Direct to consumer Out of service area direct to consumer
• This network was driven by the size of the D2C and Store DC network demands. Demand was too large for the channels to effectively be in the same building, and D2C demand eventually drove the need for a second fulfillment center
• Inventory location is an issue. A decision making tool addresses the alternatives to supplying the customer when all items are not in stock in the same DC by comparing the options below • Ship two packages
• Ship one package from the suboptimal facility
• Ship the out of stock item from one facility to the other and ship a single order to the customer
• The decision making can be influenced by customer preference (They want one package)


Pragmatic Dedicated Centers Office Supply
• Numerous dedicated direct to
consumer and business to
business centers
• Map is illustrative only, there
are over 30 such centers
• Multiple e-com locations
serve customer by
geography as shown on map
to the left
Direct to consumer
• Speed to the customer is paramount above all other considerations
• Allowing a customer to place their order even one hour later for next day delivery is considered a significant competitive advantage for this specialty direct to consumer retail channel
• While overall volume is significant (over 500,000 orders per day on a light day across the network) no one facility processes more than 5% of the broken pack volume.

Dedicated D2C/B2B
Centers Office
Supply

Pragmatic Store Distributed Specialty Retailer
• This network allows for direct
to consumer customers to be
serviced from stores
• The servicing store is
selected based on inventory
availability and proximity to
the customer
• Service areas overlap
extensively based on where
inventory is available
Store service
Direct to consumer
• Allowing maximum customer access to even the smallest of inventory quantities is the main strategy driver in this case
• There are lower volumes of e-com demand
• Inventory visibility by store is critical and focused on to ensure product is truly available
• Did not increase inventory at the store level (inventory is not stocked at the stores solely for direct to consumer business)
Store Locations

• This network is a hybrid utilizing all
three network types
– One direct to consumer facility
– Multiple DC store replenishment
centers
– Hundred plus stores
• Consumer orders can be shipped
from the D2C
• If not available in the D2C facility and
available at ANY store product is
sourced from the store
• The servicing store selected based
on inventory availability and proximity
to the customer
• Service areas overlap extensively
based on where inventory is available
Store service
Direct to consumer
• Allowing maximum customer access to even the smallest of inventory quantities while ensuring the customer receives the absolute maximum in customer service is the main strategy driver in this case
• This type of network has been combined with free standard shipping on every order to drive maximum customer satisfaction and lowered bar for transit time on standard shipping
Store Locations
Store/e-com DC Hybrid

Recap – The Circle of…
OUTSIDE the Four Walls….
• Logistical Options Driven by the Supply Chain at Hand
Drive INSIDE the Four Walls available options…
• Facility, Equipment, System and Process Options Driven
by the Pragmatics of the location’s Design Criteria
Design Criteria is Driven by
• Suppliers and Customers - AKA the “Supply Chain” at
Hand
…the Supply Chain

Questions?

For More Information:
Speaker email: [email protected]
Website: www.stonge.com
Or visit ProMat Booth S1855