Norwegian Meteorological Institute met.no L. Tarrason, J. E. Jonson, M. Gauss, S. Valiyaveetil, P....
23
Norwegian Meteorological Institute met.no L. Tarrason, J. E. Jonson, M. Gauss , S. Valiyaveetil, P. Wind, I. Isaksen EMEP/MSC-W Evaluation of the Evaluation of the global EMEP model and global EMEP model and comparisons with the comparisons with the OsloCTM2 model OsloCTM2 model ACCENT Workshop, IIASA, Laxenburg, 04-05 December 2007
-
date post
20-Dec-2015 -
Category
Documents
-
view
215 -
download
0
Transcript of Norwegian Meteorological Institute met.no L. Tarrason, J. E. Jonson, M. Gauss, S. Valiyaveetil, P....
Norwegian Meteorological Institute met.no
L. Tarrason, J. E. Jonson, M. Gauss, S. Valiyaveetil, P. Wind, I. Isaksen
EMEP/MSC-W
Evaluation of theEvaluation of theglobal EMEP model andglobal EMEP model andcomparisons with thecomparisons with the
OsloCTM2 model OsloCTM2 model
ACCENT Workshop, IIASA, Laxenburg, 04-05 December 2007
Norwegian Meteorological Institute met.no
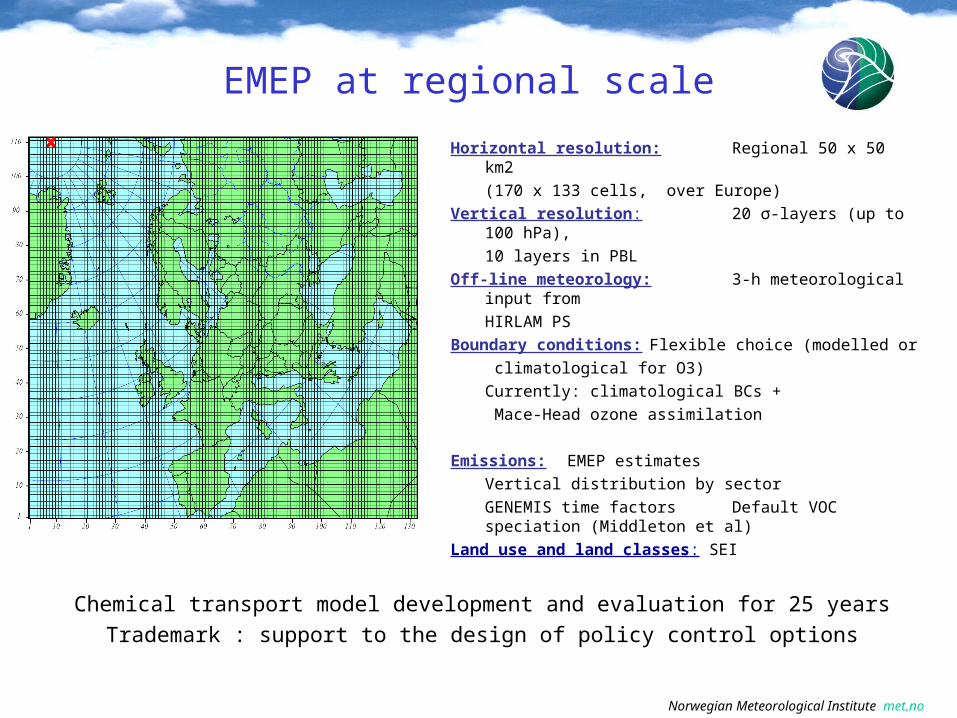
EMEP at regional scale
Horizontal resolution:Regional 50 x 50 km2(170 x 133 cells, over Europe)
Vertical resolution: 20 σ-layers (up to 100 hPa),10 layers in PBL
Off-line meteorology: 3-h meteorological input from
HIRLAM PSBoundary conditions: Flexible choice (modelled or
climatological for O3)Currently: climatological BCs + Mace-Head ozone assimilation
Emissions: EMEP estimates Vertical distribution by sector
GENEMIS time factorsDefault VOC speciation (Middleton et
al)Land use and land classes: SEI
Chemical transport model development and evaluation for 25 yearsTrademark : support to the design of policy control options
Norwegian Meteorological Institute met.no
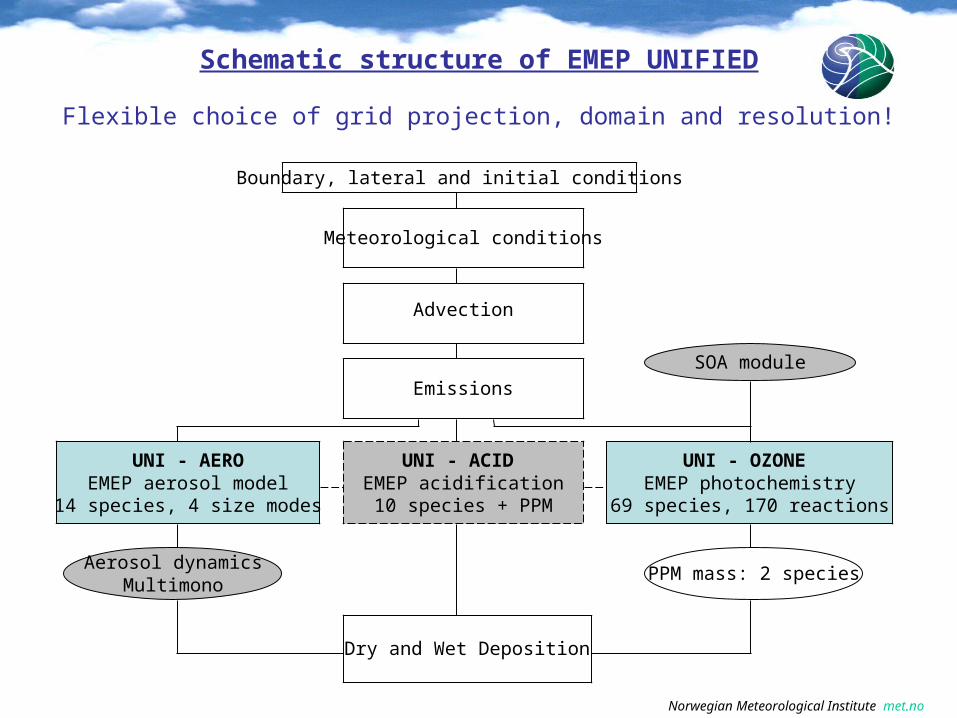
Schematic structure of EMEP UNIFIED
Flexible choice of grid projection, domain and resolution!
Boundary, lateral and initial conditions
Advection
Dry and Wet Deposition
Emissions
UNI - ACID EMEP acidification10 species + PPM
UNI - AEROEMEP aerosol model
14 species, 4 size modes
UNI - OZONE EMEP photochemistry
69 species, 170 reactions
Aerosol dynamicsMultimono
Meteorological conditions
PPM mass: 2 species
SOA module
Norwegian Meteorological Institute met.no
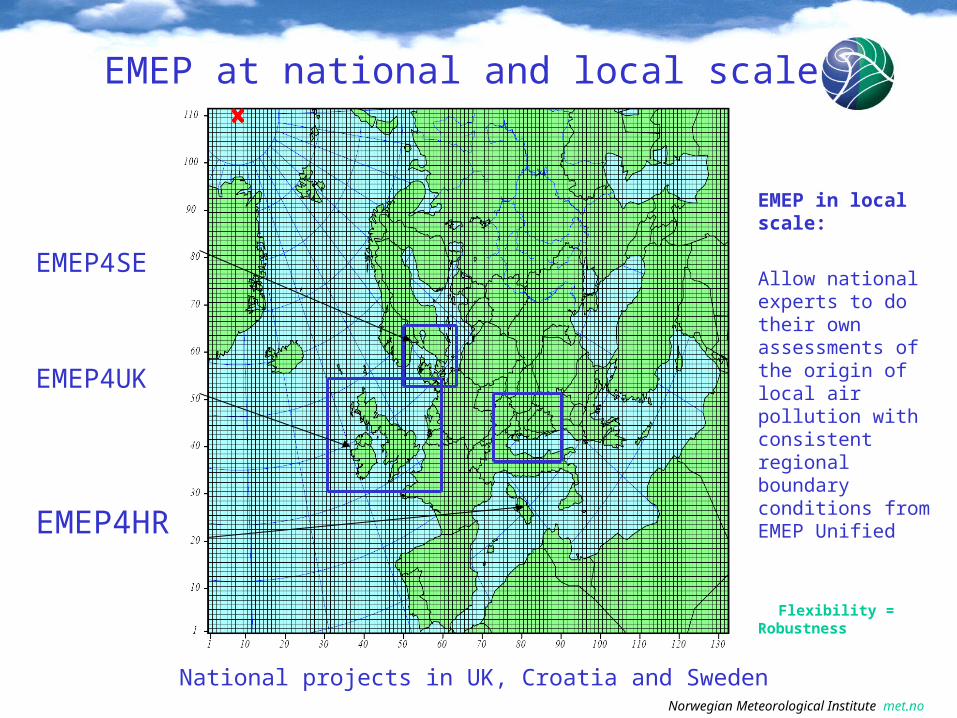
EMEP at national and local scale
EMEP4SE
EMEP4UK
EMEP4HR
National projects in UK, Croatia and Sweden
EMEP in local scale:
Allow national experts to do their own assessments of the origin of local air pollution with consistent regional boundary conditions from EMEP Unified
Flexibility = Robustness
Norwegian Meteorological Institute met.no
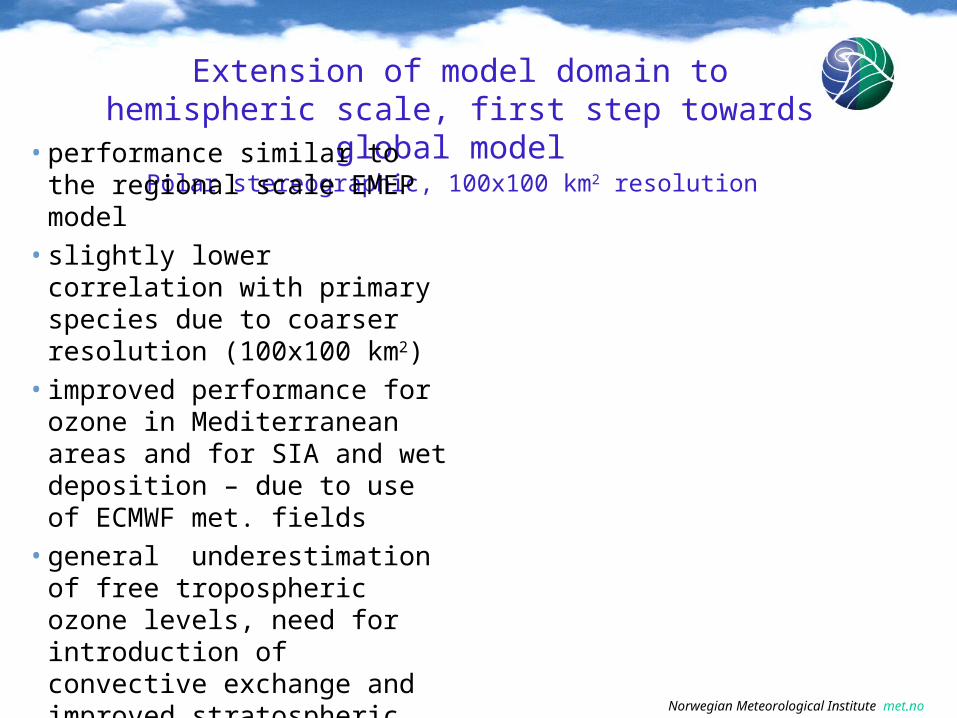
Extension of model domain to hemispheric scale, first step towards global model
Polar stereographic, 100x100 km2 resolution
• performance similar to the regional scale EMEP model
• slightly lower correlation with primary species due to coarser resolution (100x100 km2)
• improved performance for ozone in Mediterranean areas and for SIA and wet deposition – due to use of ECMWF met. fields
• general underestimation of free tropospheric ozone levels, need for introduction of convective exchange and improved stratospheric boundary condition
Norwegian Meteorological Institute met.no
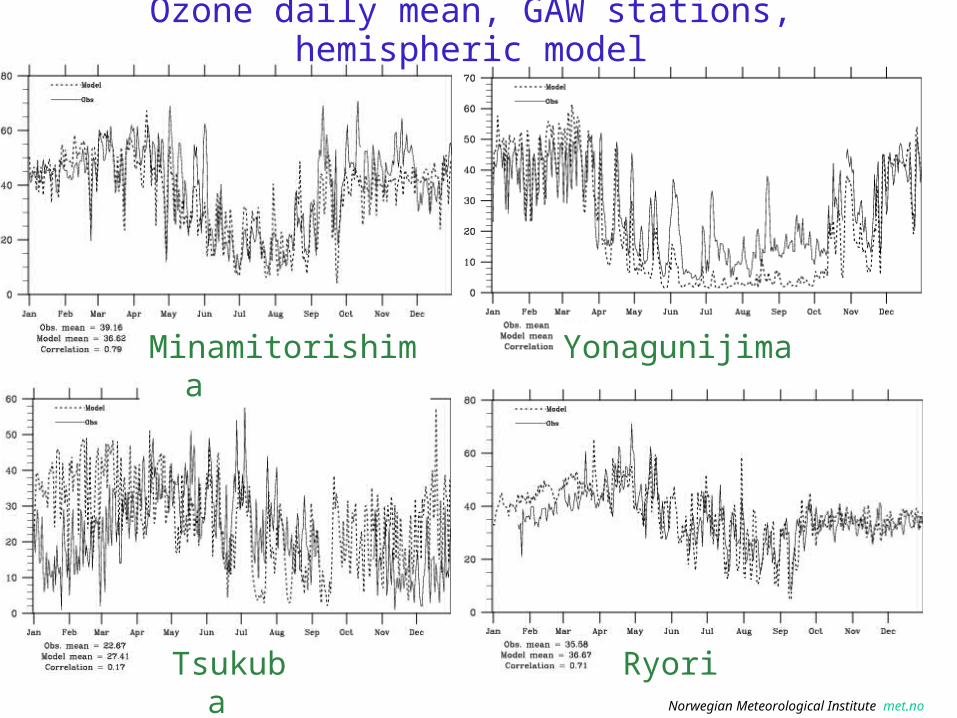
Ozone daily mean, GAW stations, hemispheric model
RyoriTsukuba
Minamitorishima Yonagunijima
Norwegian Meteorological Institute met.no
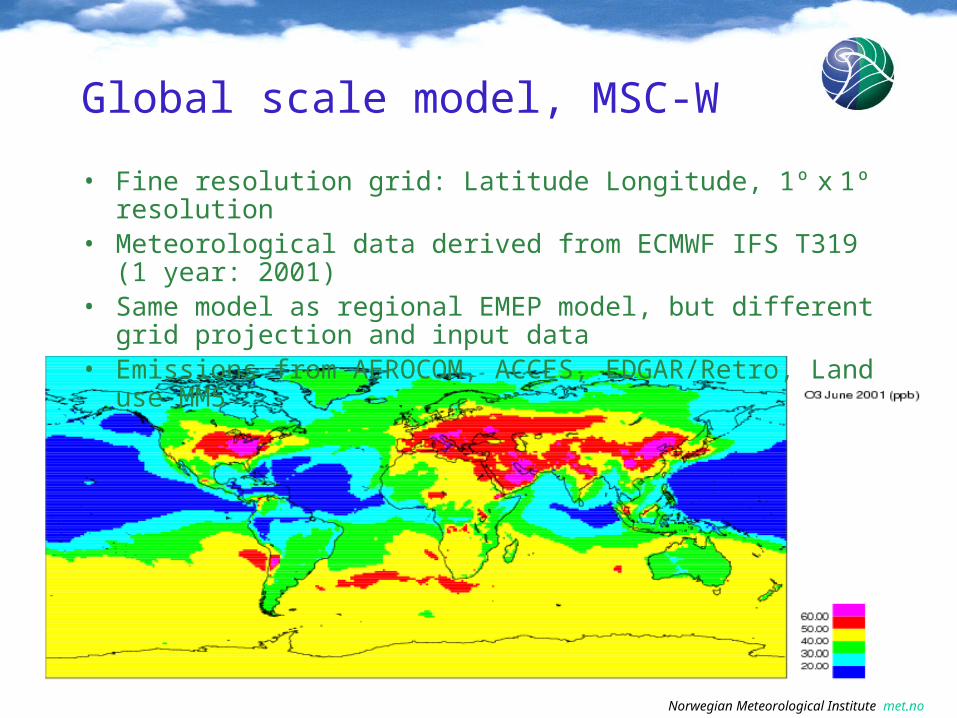
Global scale model, MSC-W
• Fine resolution grid: Latitude Longitude, 1º x 1º resolution• Meteorological data derived from ECMWF IFS T319 (1
year: 2001)• Same model as regional EMEP model, but different grid
projection and input data• Emissions from AEROCOM, ACCES, EDGAR/Retro, Land
use MM5
Norwegian Meteorological Institute met.no
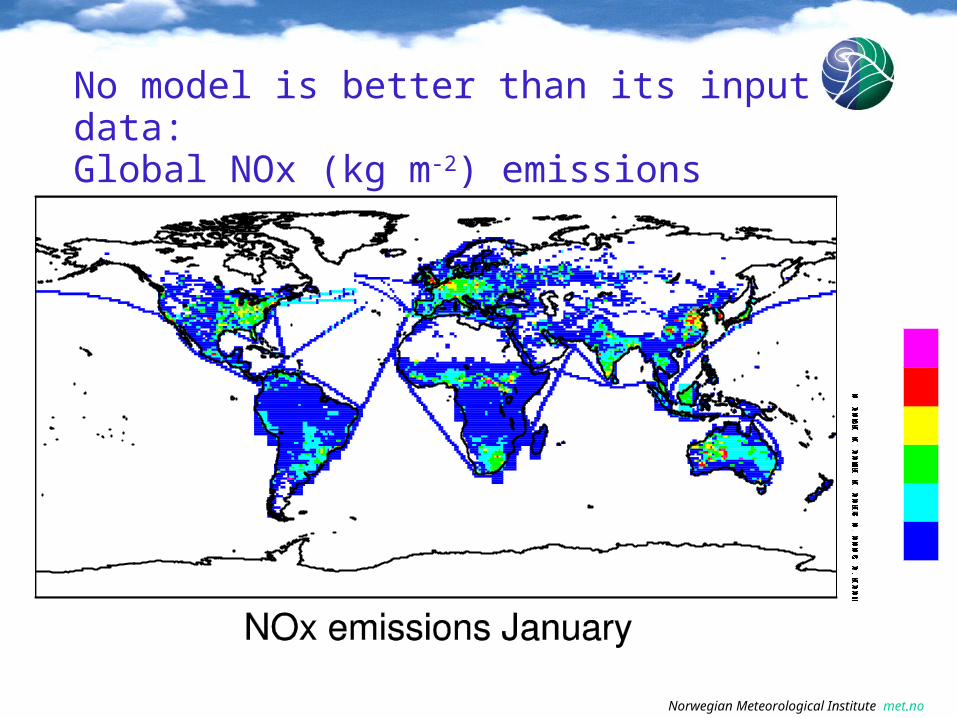
No model is better than its input data: Global NOx (kg m-2) emissions
Norwegian Meteorological Institute met.no
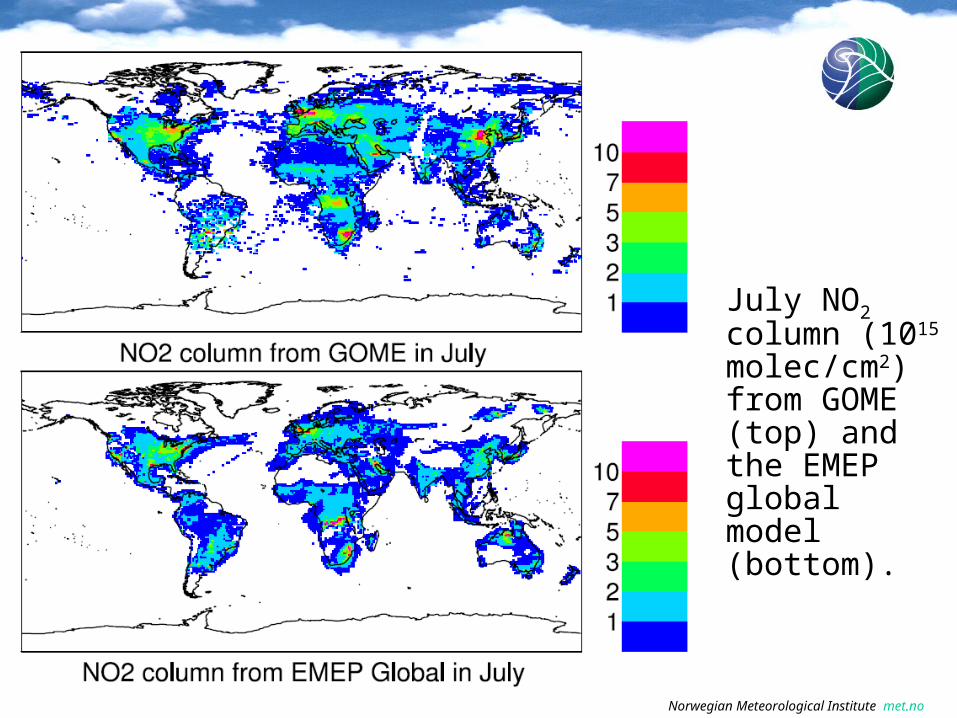
July NO2 column (1015 molec/cm2) from GOME (top) and the EMEP global model (bottom).
Norwegian Meteorological Institute met.no
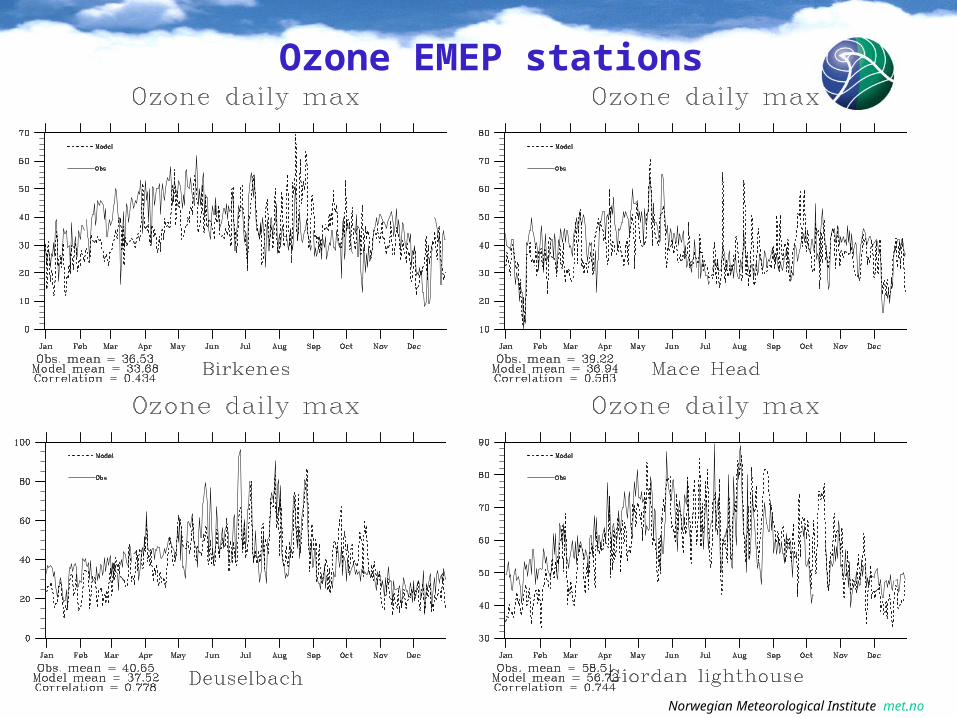
Ozone EMEP stations
Norwegian Meteorological Institute met.no
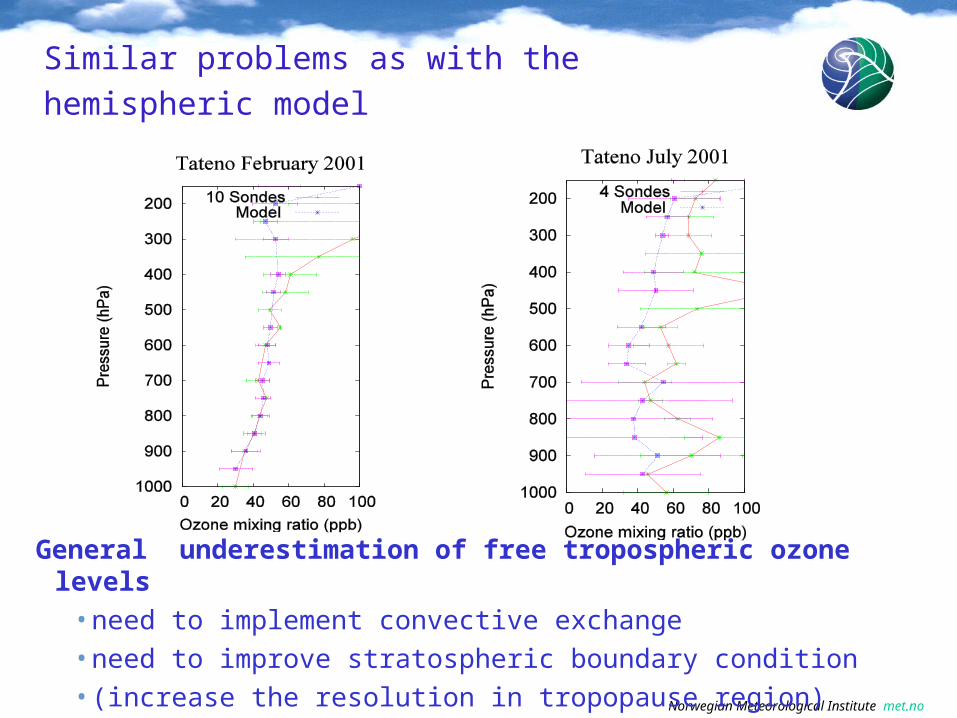
Similar problems as with the hemispheric model
General underestimation of free tropospheric ozone levels
• need to implement convective exchange
• need to improve stratospheric boundary condition
• (increase the resolution in tropopause region)
Norwegian Meteorological Institute met.no
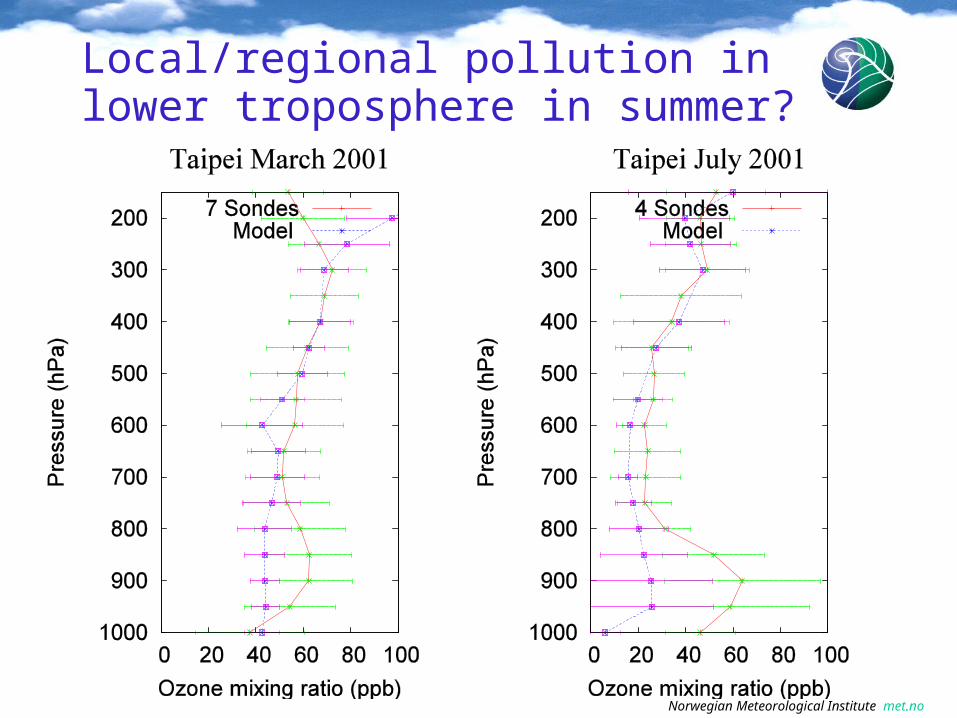
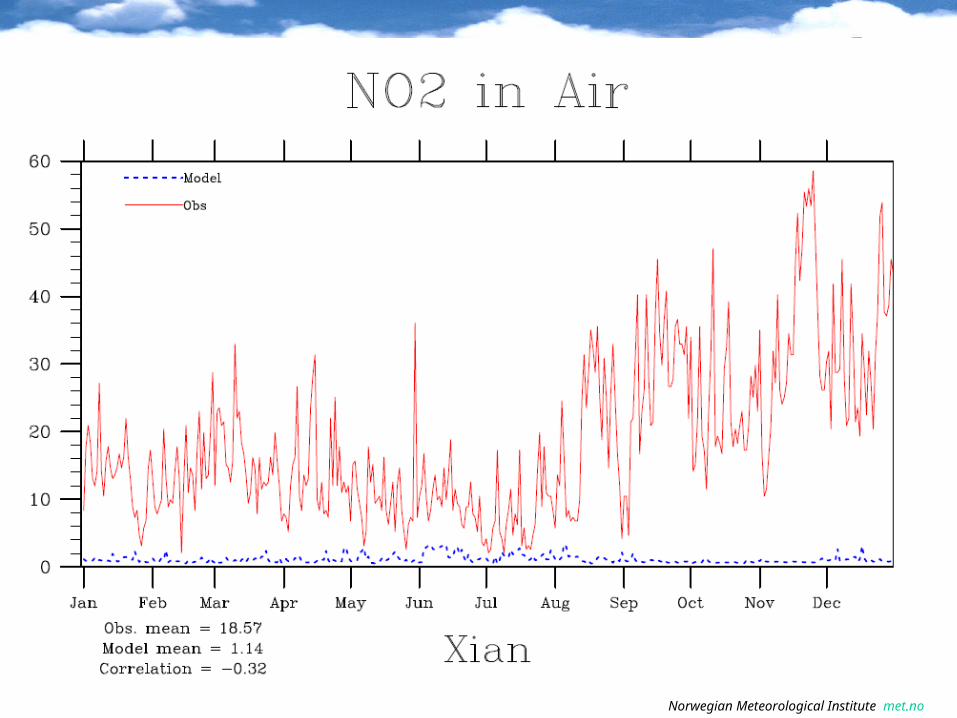
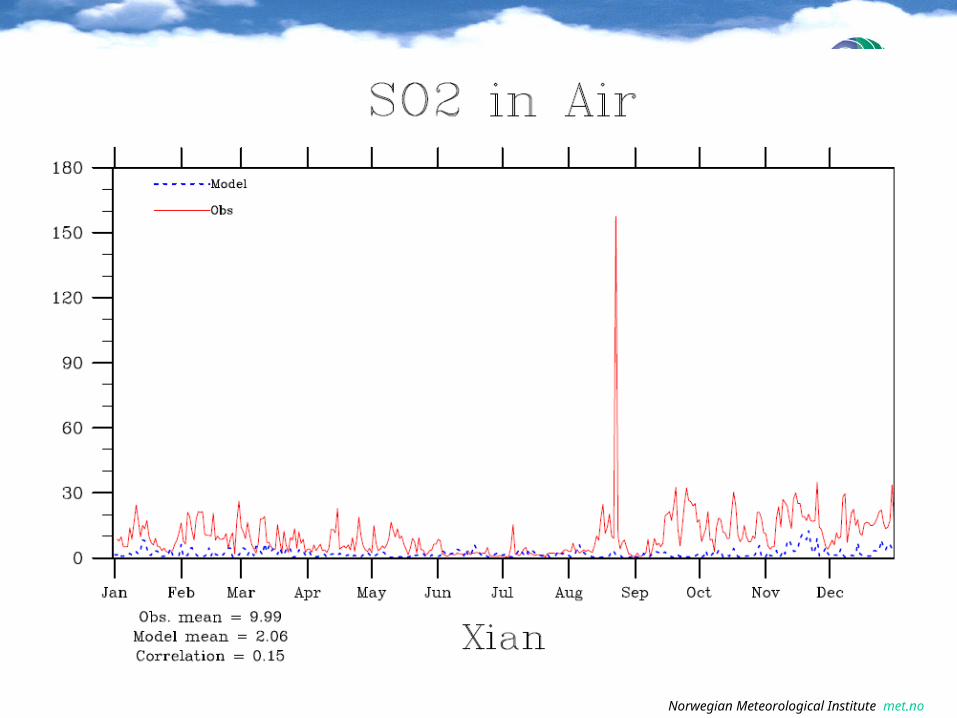
Local/regional pollution in lower troposphere in summer?
Norwegian Meteorological Institute met.no
Norwegian Meteorological Institute met.no
Norwegian Meteorological Institute met.no
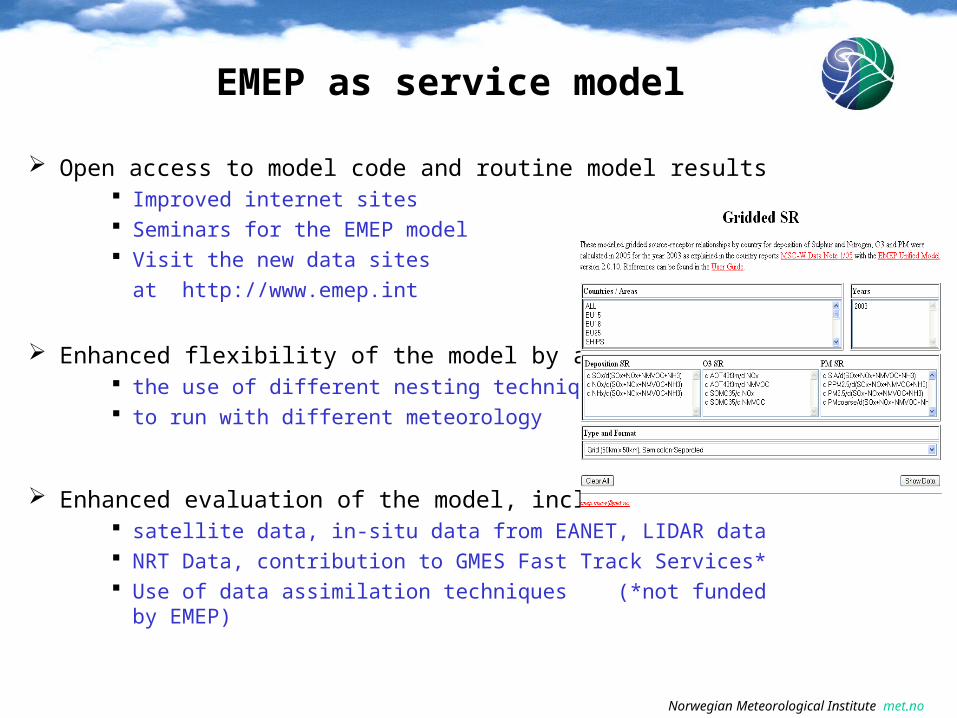
EMEP as service model
Open access to model code and routine model results Improved internet sites Seminars for the EMEP model Visit the new data sites
at http://www.emep.int
Enhanced flexibility of the model by allowing the use of different nesting techniques to run with different meteorology
Enhanced evaluation of the model, including satellite data, in-situ data from EANET, LIDAR data NRT Data, contribution to GMES Fast Track Services* Use of data assimilation techniques (*not funded by EMEP)
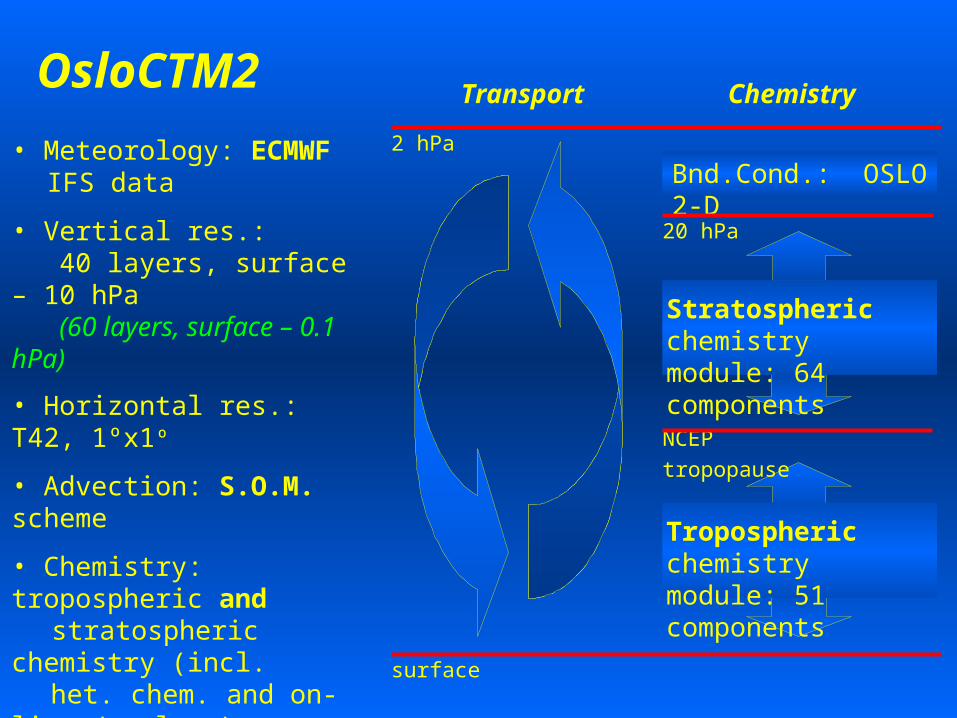
OsloCTM2
• Meteorology: ECMWF IFS data
• Vertical res.: 40 layers, surface – 10 hPa (60 layers, surface – 0.1 hPa)
• Horizontal res.: T42, 1ºx1º
• Advection: S.O.M. scheme
• Chemistry: tropospheric and stratospheric chemistry (incl. het. chem. and on-line J-values)
• Surface emissions: Retro/POET
• BL mixing, convective transp., lightning/aircraft emissions, dry/wet deposition, …
Transport
surface
2 hPa
Bnd.Cond.: OSLO 2-D
NCEP tropopause
20 hPa
Tropospheric chemistry module: 51 components
Stratospheric chemistry module: 64 components
Chemistry
Norwegian Meteorological Institute met.no
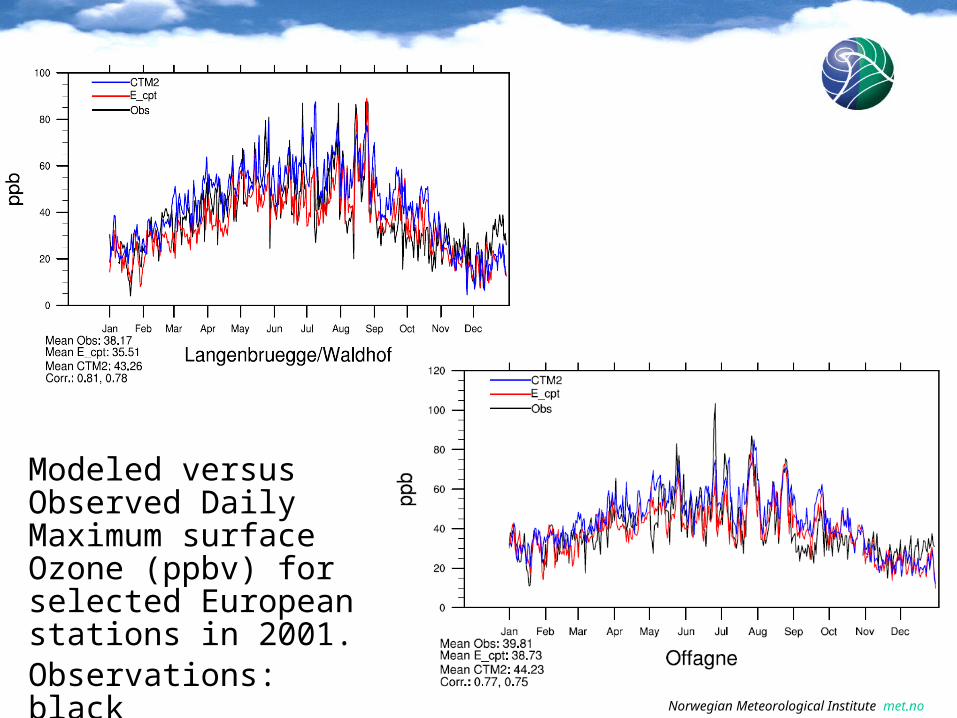
Modeled versus Observed Daily Maximum surface Ozone (ppbv) for selected European stations in 2001.Observations: blackglobal EMEP: redOsloCTM2: blue
Norwegian Meteorological Institute met.no
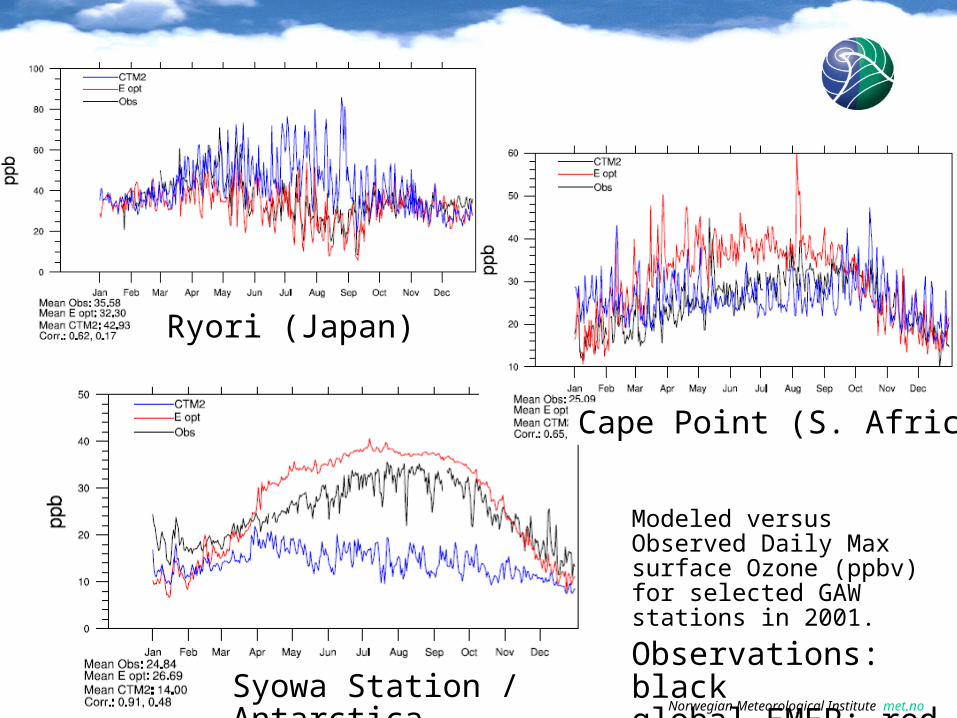
Syowa Station / Antarctica
Ryori (Japan)
Cape Point (S. Africa)
Modeled versus Observed Daily Max surface Ozone (ppbv) for selected GAW stations in 2001.
Observations: blackglobal EMEP: redOsloCTM2: blue
Norwegian Meteorological Institute met.no
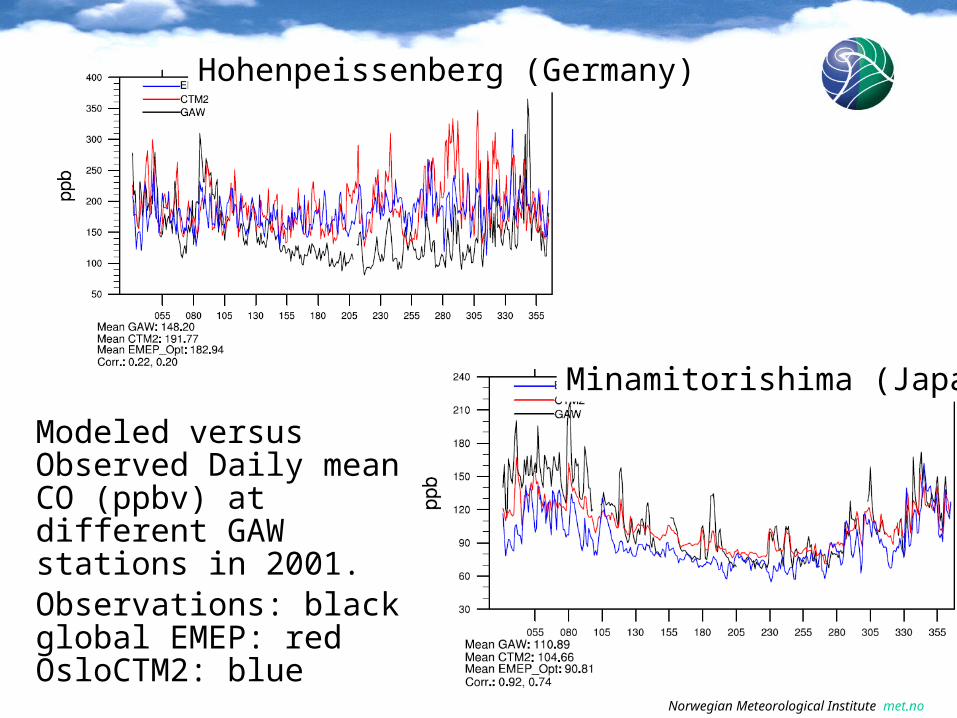
Minamitorishima (Japan)
Modeled versus Observed Daily mean CO (ppbv) at different GAW stations in 2001.Observations: blackglobal EMEP: redOsloCTM2: blue
Hohenpeissenberg (Germany)

Norwegian Meteorological Institute met.no
Annual scatter plots for different sulfur compounds measured at European EMEP stations. Units: μg(S)m−3

Norwegian Meteorological Institute met.no
Annual timeseries of daily SO2 surface mixing ratio (ppbv) over selected European stations.
Norwegian Meteorological Institute met.no
Summary and conclusions (1/2)
• Further evaluation of the performance of the hemispheric and global model is needed
– evaluation of the effect of convection on free tropospheric ozone– need to co-operate with Asian experts on monitoring data,
evaluation with regional Asian network, in particular EANET– explore possibilities of enhanced collaboration with the remote
sensing communities
• There is a strong need to revise and validate emission data and land use information, especially over Asia, in co-operation with international experts (TFHTAP, bilateral links)
• Demonstrate usefulness of EMEP (and OsloCTM2) models as links between emissions and remote sensing.
Norwegian Meteorological Institute met.no
Megacities: The CityZen project (2008-2011)16 partners from Europe, China, Africa (coord. met.no)
Focus on four emission hot spots:
- Eastern Mediterranean- BeNeLux / Ruhr area- Po Valley- Pearl River Delta
• Detect long-term trends from satellite observations and inverse modelling (U Bremen, CNRS). Study impact of megacity emissions on AQ and climate and vice versa. Future scenarios (IIASA).
• EMEP and OsloCTM2 involved together with other models dealing with local, regional and global scales. Scale-bridging.