Northern Corridor Performance Dashboard...
20
Northern Corridor Performance Dashboard Outline July 2016
Transcript of Northern Corridor Performance Dashboard...

Northern Corridor Performance Dashboard Outline
July 2016

Monthly Port Community Charter Report - July 2016 2
TABLE OF CONTENTSTable of Figures........................................................................................................................i
Summary................................................................................................................................iii
1. Introduction................................................................................................................1
2. Maritime Indicators....................................................................................................2
2.1 Ship Turnaround Time..............................................................................................2
2.2 Waiting Before Berth..................................................................................................3
3. Port Indicators.............................................................................................................4
3.1 Cargo Dwell Time at the Port of Mombasa.............................................................4
3.2 One Stop Centre Clearance Time............................................................................5
3.3 Delay after Customs Release......................................................................................6
3.4 Time Taken at the Document Processing Centre (DPC)......................................7
4. Corridor Indicators.....................................................................................................7
4.1 Weighbridge Traffic....................................................................................................7
4.2 Weight Compliance at weighbridge..........................................................................8
4.3 Transit Time in Kenya................................................................................................9
4.4 Container Uptake at Mombasa Port......................................................................10

3 Monthly Port Community Charter Report - July 2016
TABLE OF FIGURES
Figure 1: Ship Turnaround Time (Hrs)......................................................................2
Figure 2: Waiting before Berth.....................................................................................3
Figure 3: Containerised Port Dwell time at Mombasa Port.....................................4
Figure 4: One Stop Centre (hrs)..................................................................................5
Figure 5: Delay after Customs Release........................................................................6
Figure 6: Time Taken at the Document Processing Centre (DPC).........................7
Figure 7: Weighbridge monthly average traffic.........................................................8
Figure 8: Weighbridge Compliance (%).....................................................................9
Figure 9: CFS nomination...........................................................................................10
Figure 10: Container Uptake by CFSs (TEUs)...........................................................11

Monthly Port Community Charter Report - July 2016 4
SUMMARY
The Monthly Mombasa Port Community Charter Report provides an overview of key trends within the port, as well as the Northern Corridor transport system in Kenya. This report summarizes the July 2016 status of 9 key indicators which are tracked by the Northern Corridor performance dashboard as stipulated in the Mombasa Port Community Charter.
The indicators reviewed in this report are categorized into Maritime, Port and Corridor indicators. The performance shows improvements in performance on most of the indicators when compared with the month of June, 2016. The summary performance is as follows:
Table 1: Monthly status summary, July 2016
Category Indicator Unit of measure
Target July Status/Progress
Maritime Indicators
1.Vessel Turnaround Time Hrs 72 70.882. Ship Waiting Time before berth Hrs 24 10.4
Port Indicators
3. Containerised Cargo Dwell time Hrs 72 86.644. One Stop Centre Time Hrs 24 33.45. After Customs Release Hrs 36 41.036. Document Processing Centre Time Hrs 2 2.19
Corridor Indicators
7. Weighbridge Traffic No of trucks weighed
Athi-River: 5,855Mariakani: 2,739
Busia: 4548. Weight compliance at weighbridge % 100 Busia: 78%,
Other weighbridges had over 90% 9. Transit time (Mombasa to Malaba) Hrs 72 118.62 10. Transit time (Mombasa to Busia) Hrs 72 213.17

5 Monthly Port Community Charter Report - July 2016
1. INTRODUCTION
The objective of this report is to analyze monthly performance of the Mombasa Port and the Northern Corridor in relation to the signed Mombasa Port Community Charter. The charter commits both public and private sector to undertake measures that will increase efficiency of the Port and the Northern Corridor. It looks at issues such as time and efficiency of international and national logistics services and physical and procedural impediment to trade and transport facilitation along the Corridor.
The monitoring of the implementation of the Mombasa Port Community Charter is done through the Northern Corridor performance dashboard which can be accessed via www.kandalakaskazi.or.ke or http:/top.ttcanc.org
The Charter provides for 9 key indicators which are tracked by the dashboard. These indicators cover the period from the time the ship enters the port area and leaves, to the time cargo exits the borders either at Malaba or Busia in Kenya.
The Mombasa Port Community Charter envisions various targets to be achieved. Key among them which affect the nine indicators being monitored by the dashboard are:
a) Achieve a dwell time of below 3 days (72 hours) within 120 days after signing the Port Community Charter;
b) Achieve 70% cargo throughput through the Green Channel;
c) An improvement of 900 moves per day in 90 days after the Charter was signed.
The Mombasa Port Community Charter may be accessed via http://ttcanc.org/documents/Port_Comm_Charter_Final.pdf.

Monthly Port Community Charter Report - July 2016 6
2. MARITIME INDICATORS
2.1 SHIP TURNAROUND TIME
The table below gives a summary of the container vessel movements (waiting time before berth and the average monthly turnaround time) at the Port of Mombasa from May to July 2016.
Month Turnaround Time (Hrs.) Waiting Before Berth (Hrs.)Jul-2016 70.88 10.40Jun-2016 75.48 10.94May-2016 75.79 8.30
Target 72.0 24.0
Table 2: Maritime Indicators
Time from ship entry in Port to exit from the Port area is measured from the time the vessel arrives at the fairway buoy to the time it leaves the Port area.
The target for ship turnaround time is 3 days (72 hours) as set out in the Charter for the year 2013. This was to improve to 2 days and further to 1 day within a year. This reduction of days as stipulated in the Charter was to foresee an improved and efficient transport system that would promote trade facilitation within the Northern Corridor region.

7 Monthly Port Community Charter Report - July 2016
Figure 1: Ship Turnaround Time (Hrs)
From the analysis in figure 1, Ship Turnaround Time for the month of July was recorded at 70. 88 hours (a decrease by about four hours from the previous month) exceeding the set target of 72 hours. This performance was a remarkable improvement when compared with 75.48 hrs and 75.79 hours recorded in the months of June and May respectively.
Significant reduction in ship turnaround time is an indicator of improved port performance and efficiency. The data suggests that initiatives spelt out in the Charter aimed at improving turnaround time are bearing fruit. In addition, developed physical infrastructure and capacity building of staff to handle maritime operations will go a long way to facilitate a smooth flow of freight.
Monthly Port Community Charter Report - July 2016 8
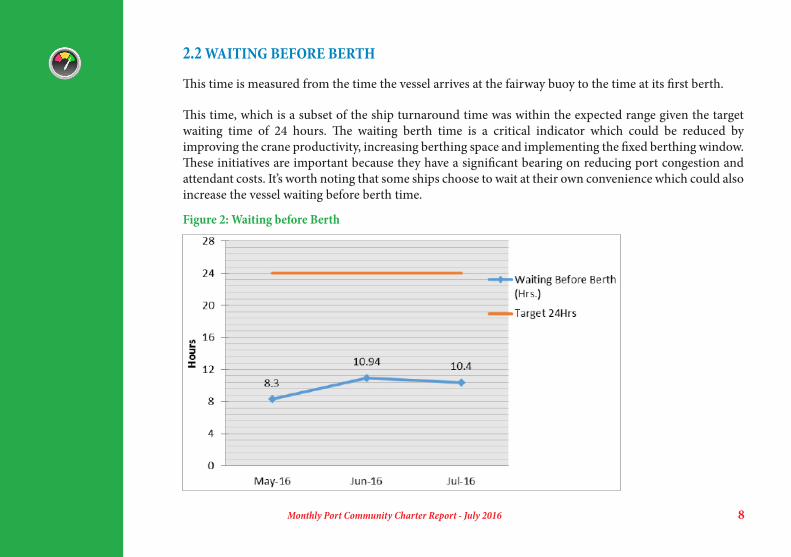
2.2 WAITING BEFORE BERTH
This time is measured from the time the vessel arrives at the fairway buoy to the time at its first berth.
This time, which is a subset of the ship turnaround time was within the expected range given the target waiting time of 24 hours. The waiting berth time is a critical indicator which could be reduced by improving the crane productivity, increasing berthing space and implementing the fixed berthing window. These initiatives are important because they have a significant bearing on reducing port congestion and attendant costs. It’s worth noting that some ships choose to wait at their own convenience which could also increase the vessel waiting before berth time.
Figure 2: Waiting before Berth

9 Monthly Port Community Charter Report - July 2016
The graph in figure 2 shows that the average time taken by containerized vessels from entry to berthing has decreased marginally from 10.94 hrs in June to 10.4hrs in July 2016. It is informative to note that the situation in June and July indicates a significant deterioration of performance when compared with May 2016 which recorded a waiting time of 8.3 hours.
However, for an efficient Port System ideally, waiting time in particular should be as near to zero as possible. Therefore, concerted efforts need to be put in place to address this issue.
3.1 CARGO DWELL TIME AT THE PORT OF MOMBASA
3. PORT INDICATORS
Cargo dwell time refers to the period from the time cargo is offloaded at the Port to the time goods leave the Port after all clearances have been obtained.
Based on data and analysis, port authorities, terminal operators, logistics operators, shippers and all the cargo intervening agencies form an important part in determining cargo dwell time. Congestion, inefficiencies and multiple interventions by various agencies at the Port are the main causes for increase in the Port dwell time.

Monthly Port Community Charter Report - July 2016 10
Figure 3: Containerised Port Dwell time at Mombasa Port
From figure 3, the results show that cargo dwell time has steadily improved from 100.48 hours in May to 86.64 hours in the month of July 2016.
This is approximately 3.6 days which is 14.64 hours shy of the expected 72 hrs (3 days) threshold. Therefore mechanisms for speeding-up clearance of cargo processes should be implemented by all the stakeholders involved to realize the expected results of 3 days. Some of the mechanisms may include; improving Port operations, speeding up clearance of Cargo processes in transferring the containers to CFSs and ensuring there is smooth cargo evacuation.
Containerised Port Dwell Time

11 Monthly Port Community Charter Report - July 2016
Figure4: Port One Stop Centre (hrs)
3.2 ONE STOP CENTRE CLEARANCE TIME
One Stop Centre Clearance Time measures the average time between passing of customs entry registration and issuance of release order.
The indicator is measured by subtracting the time when an entry is passed from Release Time. The July 2016 data for this indicator is from the Kenya Revenue Authority SIMBA system and does not include goods for transit cleared under the Single Customs Territory. Out of the 26,751 records analysed only 34 % were for transit Cargo.

Monthly Port Community Charter Report - July 2016 12
Time spent at One Stop Centre for local cargo increased from 32.5 hours in June 2016 to 33.4 hours in July 2016 while the time taken by transit cargo decreased from 46.9 hours in June to 42.9 hours in July 2016.
The data shows that performance at One Stop centre did not meet the 24 hrs Mombasa Port Charter target. This could be partly attributed to late submission ad revision of documents by clearance agents and uncoordinated joint verification of cargo that results in delays. This calls for mechanisms for speeding-up clearance of cargo processes by all the stakeholders involved to realize the required results of one day.
3.3 DELAY AFTER CUSTOMS RELEASEDelay after Customs Release refers to the time lapse between release and evacuation of cargo from the Port.
Figure 5: Delay after Customs ReleaseThe results clearly indicate a significant improvement in performance from 47.6 hours to 41.03 hours from the month of May to July 2016 respectively as shown in figure 5.
Notwithstanding this improvement, the rate of cargo pick-up by transporters and traders is still slow and higher than the 36 hours’ target. This could be partly attributed to absence of some clearing and forwarding clerks, trucks or parties responsible for clearance at the gates contributing to the build-up of queues at the exit or entry gates among others.

13 Monthly Port Community Charter Report - July 2016
3.4 TIME TAKEN AT THE DOCUMENT PROCESSING CENTRE (DPC)
This implies that there is need for all related stakeholders to identify bottlenecks for the delays and potential corrective mechanisms of addressing the issues to improve compliance while improving facilitation of trade. In addition, transport infrastructure needed in the evacuation of goods from the port should be improved and the process streamlined.
This will go a long way in eliminating inefficiencies by minimizing the Port dwell time since delays after customs release of cargo constitutes a larger portion of the dwell time.
This is the time taken by Customs to pass an entry lodged by a clearing agent. The document processing centre involves clearance by Customs. Document Processing Centre time for local cargo improved marginally from 2.43 hours to 2.19 hours in June and July 2016 respectively.
Whereas average time spent for clearance at the Document Processing Centre for transit cargo worsened in performance from 2.68 hrs in June to 2.86 hrs in July 2016; the target DPC time is 2 hours.
Figure 6: Time Taken at the Document Processing Centre (DPC)
The need to have a system in place for pre-arrival clearance of the cargo within a span of 48 hours before docking of vessels as given in the charter should be fully implemented to achieve the target. In addition, sensitization of clearing agents on proper documentation will address some of the delays.

Monthly Port Community Charter Report - July 2016 14
4. CORRIDOR INDICATORSThese are indicators that assess the performance along the Corridor by measuring weight compliance at weighbridges, volume of traffic and transit time from the port to the borders.
4.1 WEIGHBRIDGE TRAFFICThis refers to the number of trucks crossing the weighbridges. For weighbridges that have both High Speed Weigh in Motion (HSWIM) and Static, the average number of trucks weighed per day is given by the total number of vehicles weighed using HSWIM and are either flagged to proceed or diverted to the fixed static scale. As per the charter, High Speed Weigh in Motion (HSWIM) systems were to be installed at Mariakani, Athi River, Gilgil and Webuye weighbridges to stop repeated weighing of trucks.
Figure 7: Weighbridge Monthly average trafficAs indicated in Figure 7, Athi-River registered the highest average num-ber of traffic weighed followed by Mariakani whereas Busia registered the least number of traffic weighed in the month of July 2016. The high traffic in Athi River can be attributed to additional cargo originating from Namanga to Nairobi, and Nairobi and its environs. Long truck queues impede trade facilitation because of the extra costs caused by delays.
15 Monthly Port Community Charter Report - July 2016
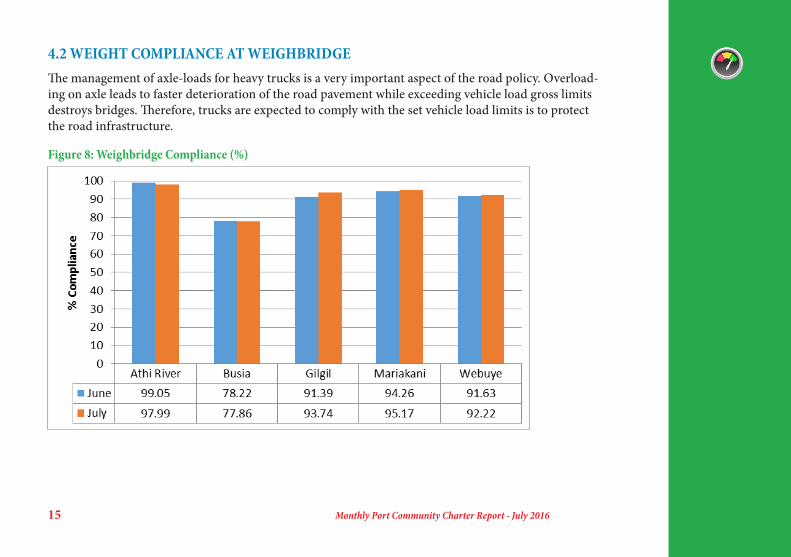
4.2 WEIGHT COMPLIANCE AT WEIGHBRIDGEThe management of axle-loads for heavy trucks is a very important aspect of the road policy. Overload-ing on axle leads to faster deterioration of the road pavement while exceeding vehicle load gross limits destroys bridges. Therefore, trucks are expected to comply with the set vehicle load limits is to protect the road infrastructure.
Figure 8: Weighbridge Compliance (%)

Monthly Port Community Charter Report - July 2016 16
Results show that most weighbridges recorded over 90 percent performance in terms of compliance level except for Busia weighbridge (which has no HSWIM) which had 77.86 % level of compliance in the month of July 2016. In addition, most traffic through Busia originates from Kisumu and within the country as opposed from the Port.
There was an improvement in compliance levels at weighbridges compared to the month of June 2016 with the exception of Athi River and Busia which registered a drop of one percent and 0.4% respectively. Notwithstanding, Athi-River Weighbridge recorded the highest compliance level yet it had the highest volume of traffic.
4.3 TRANSIT TIME IN KENYATransit time in Kenya refers to the average time for transit trucks to move from Mombasa port to Malaba and Busia exit points.
It can be estimated from the time release order is issued at the port of Mombasa to the time the export certificate is issued after crossing the border at Malaba or Busia. It’s worth noting that sometimes, there are delays in generation of export certificate whereby manual entries are done and updated far much later when a truck has already exited the border.
Table 3 provides summary of transit time from Mombasa port to Malaba & Busia

17 Monthly Port Community Charter Report - July 2016
Table 3: Transit Time in Kenya
Month Mombasa-Malaba/Kenya (hrs) Mombasa-Busia/Kenya (hrs)May 141.87 212.20June 137.05 189.76July 118.62 213.17
Target 72 72
Results indicate that Transit Time from Mombasa to Malaba has significantly improved by 24 hours from 5.9 days in May 2016 to 4.9 days in July 2016 while time taken to Busia remained static at 8.8 days in May and July 2016.
Despite improvement in the road network, the Mombasa-Malaba route has seen an increase in transit trucks and passenger vehicles which has led to congestion and longer travel time.
However, the long transit time could be attributed to border and customs clearances that prolong delays at the border. In addition, transporters make numerous stops due to personal reasons leading to longer transit time. This has consequence on related costs which leads to inefficiencies and hampers facilitation of trade.

Monthly Port Community Charter Report - July 2016 18
4.4 CONTAINER UPTAKE AT MOMBASA PORT
Container Freight Stations (CFSs) are an extension of the port and are privately managed. Decongestion of the port of Mombasa enormously depends on the efficient performance of the CFS cargo clearance process. Cargo to the CFSs is either client nominated or KPA nominated.
The Chart above provides a summary of CFS nominations in the month of July 2016 at the Port of Mombasa.
During the month of July 2016, 84% of the cargo uptake by CFSs was nominated by clients while 16% was nominated by KPA. This is an increase from 79.5 % for client nomination and decrease from 20.5 % KPA nomination recorded in June 2016.
Figure 9: CFS Nomination

19 Monthly Port Community Charter Report - July 2016
Figure 10: Container Uptake by CFSs (TEUs)
Figure 10 shows that MCT CFS had the highest uptake with 3,562 TEUs followed by MICHELL. COTTs with 3,454 and MICD with 3,169. MICD attracted the highest nominations with client evidently favouring MITCHEL COTTs CFS.
The total number of containers handled decreased to 29,849 in July from the 33,447 handled in June.

Monthly Port Community Charter Report - July 2016 20