North-South Displacement E ects of Environmental ...
23
North-South Displacement Effects of Environmental Regulation: The Case of Battery Recycling Shinsuke Tanaka Kensuke Teshima Eric Verhoogen Aug. 2021 Abstract This study examines the effect of a tightening of the U.S. air-quality standard for lead in 2009 on the relocation of battery recycling to Mexico and on infant health in Mexico. In the U.S., airborne lead dropped sharply near affected plants, most of which were battery-recycling plants. Exports of used batteries to Mexico rose markedly. In Mexico, production increased at battery-recycling plants, relative to comparable industries, and birth outcomes deteriorated within two miles of those plants, relative to areas slightly farther away. The case provides a salient example of a pollution-haven effect between a developed and a developing country. Keywords: pollution-haven hypothesis, environmental regulation, infant health JEL Codes: F18, Q56, O15 We thank the editor, Rohini Pande, four anonymous referees, Manuela Angelucci, Yutaka Arimoto, Shin-Yi Chou, Lucas Davis, Melissa Dell, Dave Donaldson, Manuel Estay, Alan Finkelstein, Laura Gee, Marco Gonzalez- Navarro, Gene Grossman, Rema Hanna, Danae Hern´ andez-Cort´ es, Akira Hibiki, Koichiro Ito, Michael Klein, Michikazu Kojima, Arik Levinson, Enrique Mart´ ınez-Garc´ ıa, Chris Moser, Junko Nishikawa, Toshihiro Okubo, Paulina Oliva, Sahar Parsa, Shomon R. Shamsuddin, Adam Storeygard, Santiago Saavedra, Masayuki Sawada, Dean Spears, Yoichi Sugita, Reed Walker, Shaoda Wang, Eric Zou, and participants at AEA-ASSA, AERE Sum- mer Meeting, Ashecon, Asian Growth Research Institute, El Colegio de M´ exico, GRIPS, Hitotsubashi University, ITAM, JETRO-IDE, Keio University, Kindai University, Kwansei Gakuin University, Kyoto University, LACEA- Health Economics Network Meeting, LACEA-LAMES meeting, LACEA-TIGN, MIT, National institute for Envi- ronmental Studies in Japan, NBER Summer Institute, NEUDC, North American Summer Meeting of the Econo- metric Society, Northeast Workshop on Energy Policy and Environmental Economics, Osaka University, PacDev, RIDGE Environmental Economics Workshop, Rosenkranz Global Health Policy Symposium, Southern Economic Association Annual Meeting, Tohoku University, Tufts University, University of Tokyo, and Waseda University for helpful comments and discussions. Some results were produced using data at the INEGI Laboratorio de Microdatos (project LM 986); we thank Natalia Volkow at INEGI for her assistance. We are grateful to David Alfaro-Serrano, Yuki Kanayama, Sofia Ram´ ırez, Omar Trejo and Paola Ugalde Araya for excellent research assistance. Financial support from JSPS KAKENHI (Grant Number 18K19955) is gratefully acknowledged. The usual disclaimer applies. Tufts University. Email: [email protected] Hitotsubashi University and Instituto Tecnol´ ogico Autonomo de M´ exico (ITAM). Email: kensuke- [email protected] Columbia University. Email: [email protected]
Transcript of North-South Displacement E ects of Environmental ...

North-South Displacement Effects of Environmental
Regulation: The Case of Battery Recycling*
Shinsuke Tanaka� Kensuke Teshima� Eric Verhoogen§
Aug. 2021
Abstract
This study examines the effect of a tightening of the U.S. air-quality standard for lead in2009 on the relocation of battery recycling to Mexico and on infant health in Mexico. In theU.S., airborne lead dropped sharply near affected plants, most of which were battery-recyclingplants. Exports of used batteries to Mexico rose markedly. In Mexico, production increasedat battery-recycling plants, relative to comparable industries, and birth outcomes deterioratedwithin two miles of those plants, relative to areas slightly farther away. The case provides asalient example of a pollution-haven effect between a developed and a developing country.
Keywords: pollution-haven hypothesis, environmental regulation, infant health
JEL Codes: F18, Q56, O15
*We thank the editor, Rohini Pande, four anonymous referees, Manuela Angelucci, Yutaka Arimoto, Shin-YiChou, Lucas Davis, Melissa Dell, Dave Donaldson, Manuel Estay, Alan Finkelstein, Laura Gee, Marco Gonzalez-Navarro, Gene Grossman, Rema Hanna, Danae Hernandez-Cortes, Akira Hibiki, Koichiro Ito, Michael Klein,Michikazu Kojima, Arik Levinson, Enrique Martınez-Garcıa, Chris Moser, Junko Nishikawa, Toshihiro Okubo,Paulina Oliva, Sahar Parsa, Shomon R. Shamsuddin, Adam Storeygard, Santiago Saavedra, Masayuki Sawada,Dean Spears, Yoichi Sugita, Reed Walker, Shaoda Wang, Eric Zou, and participants at AEA-ASSA, AERE Sum-mer Meeting, Ashecon, Asian Growth Research Institute, El Colegio de Mexico, GRIPS, Hitotsubashi University,ITAM, JETRO-IDE, Keio University, Kindai University, Kwansei Gakuin University, Kyoto University, LACEA-Health Economics Network Meeting, LACEA-LAMES meeting, LACEA-TIGN, MIT, National institute for Envi-ronmental Studies in Japan, NBER Summer Institute, NEUDC, North American Summer Meeting of the Econo-metric Society, Northeast Workshop on Energy Policy and Environmental Economics, Osaka University, PacDev,RIDGE Environmental Economics Workshop, Rosenkranz Global Health Policy Symposium, Southern EconomicAssociation Annual Meeting, Tohoku University, Tufts University, University of Tokyo, and Waseda University forhelpful comments and discussions. Some results were produced using data at the INEGI Laboratorio de Microdatos(project LM 986); we thank Natalia Volkow at INEGI for her assistance. We are grateful to David Alfaro-Serrano,Yuki Kanayama, Sofia Ramırez, Omar Trejo and Paola Ugalde Araya for excellent research assistance. Financialsupport from JSPS KAKENHI (Grant Number 18K19955) is gratefully acknowledged. The usual disclaimer applies.
�Tufts University. Email: [email protected]�Hitotsubashi University and Instituto Tecnologico Autonomo de Mexico (ITAM). Email: kensuke-
[email protected]§Columbia University. Email: [email protected]

I. Introduction
One of the animating concerns of the trade-and-environment debate is the idea that tighter envi-
ronmental regulation in richer countries may, through trade, lead to relocation of dirty production
activities to poorer countries with weaker regulations. Although not always stated, the concern
often includes worries about adverse health effects in the destination. This is one articulation of
what is commonly referred to as the pollution-haven hypothesis.
Despite the prominence of this idea in academic and policy discussions, the direct evidence that
environmental regulation can displace polluting activities from developed countries (the “North”)
to developing countries with weaker regulations (the “South”) remains thin. Several influential
papers have documented displacement effects across regions within the U.S. (Henderson, 1996;
Becker and Henderson, 2000; Greenstone, 2002), but there is less evidence for North-South dis-
placement. A leading study by Hanna (2010) finds that the Clean Air Act Amendments in the
U.S. increased outgoing foreign direct investment (FDI) but not disproportionately to developing
countries. The reviews by Copeland and Taylor (2004), Levinson (2010), Karp (2011), Cherni-
wchan et al. (2017), Dechezlepretre and Sato (2017), Cole et al. (2017), and Copeland et al.
(2021) report some evidence that regulation leads to fewer exports and more imports of pollution-
intensive goods and less inward and more outward FDI, but little direct evidence of displacement
of pollution-intensive production from North to South.
It appears that the dominant view in the policy world is that such displacement effects,
if they exist, are small and relatively innocuous. For instance, the World Bank’s 2020 World
Development Report, its flagship publication, asserts: “[E]mpirical evidence shows that strict
environmental regulation of polluting industries has not led to large relocations to countries with
less-strict standards.... The association of falling trade costs and tighter environmental regulations
could drive polluters to flee to developing countries. But this has not happened” (World Bank,
2020, p. 125, emphasis added).
Here we provide a counterexample to this anodyne view. Focusing on recycling of used lead-
acid batteries (ULAB), we document a direct effect of tightened air-quality regulation in the U.S.
on relocation of polluting activities to Mexico and on birth outcomes in Mexico. Battery recycling
has a number of features that make it both salient and amenable to empirical study. First, the
industry is an intensive emitter of lead, a particularly noxious pollutant. A recent UNICEF report
1

lists battery recycling first among concerning sources of lead exposure for children (Rees and Fuller,
2020).1 Lead exposure has been linked to retarded fetal growth, lower IQ, lower educational
achievement, and several other adverse outcomes. Second, there was a sharp experiment: in
early 2009, the U.S. tightened the National Ambient Air Quality Standard (NAAQS) for lead by
a factor of 10, from 1.5 µg/m3 to 0.15 µg/m3; the standard in Mexico remained stable at 1.5
µg/m3 over the period. Third, the data environment allows us to track the relocation of battery
recycling. We observe the locations of battery-recycling plants in the U.S., ambient lead levels at
monitoring stations nearby, ULAB trade flows from the U.S. to Mexico, industry output and the
locations of ULAB recycling plants in Mexico, and birthweight of infants born to mothers who
live near them, a particularly well-measured and fast-responding health outcome.
We have five main findings. First, the revised air-quality standard reduced ambient lead
concentrations around U.S. battery-recycling plants. Lead concentrations declined sharply in
areas where the new regulation was binding relative to areas where it was not; we estimate that
the new standard reduced concentrations by 0.242 µg/m3 from a pre-reform mean in binding
areas of 0.549 µg/m3. Second, ULAB exports from the U.S. to Mexico rose markedly after the
reform; after remaining roughly constant between 2005 and 2008, ULAB exports rose by a factor
of four between Jan. 2009 and the end of 2014. Third, the growth of value-added and output in
Mexican battery-recycling plants was sharply higher in 2008–2013 than in 2003–2008, relative to
similar industries. Value-added in battery recycling grew by 62.2% over the 5-year period from
2003–2008 (i.e. approximately 12.4% per year) and by 243.2% from 2008–2013; the comparable
numbers for non-battery plants in the same broad sector (averaging across 6-digit subsectors) are
77.5% and -2.2%. Fourth, the average incidence of low birthweight increased significantly near
Mexican battery-recycling plants (within 2 miles) relative to areas slightly farther away (between
2 and 4 miles). Averaging over all hospital types, we estimate that the policy change increased
the incidence of low birthweight by 0.020 on a pre-reform mean of 0.095. Fifth, the health effects
were concentrated among mothers in hospitals run by the Mexican Ministry of Health, who tend
to be of lower socio-economic status than mothers in other hospital types. For this disadvantaged
group, we estimate that the incidence of low birthweight rose by 0.048 on a pre-reform mean of
0.128 in our preferred specification; we find no statistically significant effect for mothers in private
1A 2017 World Health Organization (WHO) report writes, “Lead recycling is an important source of environmen-tal contamination and human exposure in many countries.... [T]he health impacts of lead exposure are significant...Young children, pregnant women and women of childbearing age are particularly vulnerable to the toxic effects oflead” (WHO, 2017, pp. 2–3, 14).
2

or other public hospitals. Together, these findings suggest strongly that the tightening of the U.S.
lead regulation induced the relocation of battery recycling and caused negative health spillovers
in Mexico. They also reinforce the argument of a large environmental-justice literature that the
poor are disproportionately affected by environmental hazards (Currie, 2011; Hsiang et al., 2019).
We provide a short review of the literature on the displacement effects of environmental
regulation in Appendix A. Our reading is that few studies using quasi-experimental designs have
focused on relocation of dirty production activities from North to South, and that those few have
found little evidence of such displacement. In addition, we are not aware of a study that has traced
the effects of rich-country environmental regulation through to health outcomes in a destination
country.
II. Background
Lead-acid batteries are a major use of lead, and much of the lead in new batteries is from recycling
of used batteries. In the U.S. in 2009, for instance, nearly 90% of lead consumption was for new
lead-acid batteries, and approximately 90% of refined lead production was from ULAB recycling
(Guberman, 2012). Moreover, 99% or more of ULABs are typically recycled, making the lead-acid
battery industry nearly a “closed loop,” in which almost all lead used in production is reused in
the same sector (Davidson et al., 2016).
The U.S. has made substantial reductions in lead in ambient air, reducing average airborne
lead concentrations by more than 90% from 1980 to 2016 (U.S. EPA, 2014), mostly by phasing
out lead in gasoline (starting in 1973) and banning lead in paint (in 1978). In Mexico, lead was
largely unregulated until the early 1990s, when limits were imposed on the lead content of paints,
toys, pens, cosmetics and several other products (Romieu et al., 1994).
Despite the regulatory measures, lead continues to endanger public health. It is known to
affect almost every organ and system in the human body. Children under six years old and fetuses
are considered most susceptible, and exposure has been linked to learning disabilities, lower IQ,
lower educational achievement, and later criminal activities (Needleman et al., 1990; Reyes, 2007;
Aizer et al., 2018; Billings and Schnepel, 2018; Gronqvist et al., 2020). A number of studies have
documented a relationship between maternal lead levels and birth outcomes, although the precise
physiological mechanisms remain unclear (Gonzalez-Cossıo et al., 1997; Torres-Sanchez et al.,
1999; Hernandez-Avila et al., 2002; Ettinger and Wengrovitz, eds, 2010; Zhu et al., 2010; World
3

Health Organization, 2017; Grossman and Slusky, 2019). Over time, the level of lead exposure
considered to be safe has declined dramatically. The Centers for Disease Control and Prevention
(CDC) progressively lowered its “level of concern” for blood-lead levels in children from 60 µg/dl
in 1960 to 10 µg/dl in 2002; in 2012, it stopped using the “level of concern” terminology and
concluded that “no safe blood lead level in children has been identified” (CDC, 2005, 2012).
In response to the growing body of evidence, the U.S. Environmental Protection Agency
(EPA) reduced the NAAQS for lead from 1.5 µg/m3 to 0.15 µg/m3 in early 2009. It issued an
Advance Notice of Proposed Rulemaking (ANPR), opening a period of debate, on Dec. 5, 2007.
The new standard was signed on May 1, 2008 and took effect on Jan. 12, 2009. The standard is
applied to three-month moving averages and enforced at the level of geographical areas, typically
counties. An area found in violation is assigned “non-attainment status,” which opens the door
to substantially more stringent regulation.2
In Mexico, the air-quality standard remained at 1.5 µg/m3 throughout our study period, and
other dimensions of the regulatory regime were also largely unchanged. Awareness of the dangers
of lead exposure from battery recycling grew over the period due to several reports and press
accounts (OKI&FC, 2011; Commission for Environmental Cooperation (hereafter CEC) 2013;
Rosenthal, 2011), and new point-of-production regulation was proposed in April 2014 and took
effect in January 2015 (Diario Oficial, 2014; 2015).
There exist technologies for reducing lead emissions from battery-recycling plants, including
systems to filter exhaust through fabric (“baghouse systems”), to remove particles from exhaust
through electrostatic precipitation, and to reduce fugitive dust emissions by enclosing production
areas (CEC, 2016). But these systems are costly. For instance, Burr et al. (2011) estimate that
the annual costs for reducing lead concentrations to the new NAAQS standard for 14 plants active
in 2009 together was $9.6 million per year.
One other important institutional detail is that the U.S. has not ratified the 1992 Basel
Convention on the Control of Transboundary Movements of Hazardous Wastes and Their Disposal,
and ratifying countries (188 total) are in principle prohibited from trading with non-ratifying
countries in the absence of a bilateral agreement. The U.S. has a bilateral agreement for export of
2In 2012, the EPA also tightened a pollution standard at the point of production, the National Emission Stan-dards for Hazardous Air Pollutants (NESHAP) for secondary lead smelting, which had been unchanged since June1997. The new standard was implemented on January 5, 2012, and existing plants were given until January 6, 2014to conform to the new rule (EPA, 2012). Given the timing of effects we document, we believe that the NAAQSchange was the primary driver of production relocation, although the NESHAP change may have contributed inlater years.
4

hazardous waste (which includes ULABs) only with Canada and Mexico.3 Thus in our context,
the “South” effectively means Mexico only.
III. Data
Here we briefly describe our data sources; additional details are in Appendix B. We focus on the
period 2002–2015.
We identify the geocoded locations of lead-emitting plants in the U.S. using the Toxic Release
Inventory (TRI). Among lead-emitting plants, we identify battery recyclers from a report by the
Commission for Environmental Cooperation (CEC, 2013). The report lists 15 battery-recycling
plants in the U.S., operated by 7 firms, in operation in 2007.
The EPA measures compliance with air-quality standards at approximately 4,000 monitors
across the country, approximately 580 of which monitor lead. Appendix Figure A.1 plots their
locations. The monitors are not located randomly: often they are placed where pollutant concen-
trations are expected to be high and measure the pollutants expected to be prevalent there. The
monitors that measure lead tend to be located close to lead-emitting plants. We define distance
for each monitor as the distance to the nearest lead-emitting plant. We focus on monitors within
two miles of a lead-emitting plant, for reasons discussed below. To reduce the possibility that our
estimates reflect the endogenous placement of monitors, we focus on monitors that were in place
prior to the 2009 reform.4 Appendix Table A.1 reports summary statistics for the 142 monitors
in our main sample and the 22 monitors near a battery-recycling plant.
We constructed a list of 26 authorized battery-recycling plants in Mexico from CEC (2013)
and from the website of the ministry overseeing the Mexican counterpart of the TRI, the Registro
de Emisiones y Transferencia de Contaminantes (RETC). Unfortunately, airborne lead concen-
trations were not systematically measured outside Mexico City during our study period. The
location of Mexican battery-recycling plants are plotted in Appendix Figure A.2.
The data on exports and imports are from the U.S. Census Bureau, Foreign Trade Division,
available on a monthly basis. Trade of used lead-acid batteries is tracked in U.S. tariff codes
8548100540, 8548100580, and 8548102500, and we aggregate these three codes.
3See CEC (2013) and the EPA summary at https://www.epa.gov/hwgenerators/international-agreements-transboundary-shipments-hazardous-waste. (Accessed July 26, 2021.)
4In the empirical analysis, we include monitor fixed effects to absorb time-invariant differences across monitorlocations.
5
The Mexican production data are from the 2004, 2009 and 2014 Economic Censuses, each of
which contains information from the previous calendar year. We provided lists of battery-recycling
plants active in 2008 and 2013 to INEGI, the Mexican statistical agency, and INEGI staff linked
them to the Census microdata. To identify plants active in 2003, INEGI used the longitudinal
links compiled by Busso et al. (2018). It was possible to identify 8 battery recycling plants in
2003, 11 in 2008, and 15 in 2013.5 Given the small number of plants, we are limited to using
the censuses, rather than Mexico’s monthly and annual industrial surveys, which have much less
extensive coverage.
Our data on Mexican birth outcomes are from two sources. The first is discharge records of hos-
pitals operated by the Mexican Ministry of Health (MH), which primarily serve a disadvantaged
population not covered by the Mexican social security system. The data report birthweight, ges-
tation period, mother’s age, and fetal death and are available on a consistent basis for 2005–2015.
The second source is birth certificates issued by the Mexican National Health System, available
beginning in 2008. While they are available for only one pre-reform year, they cover the universe
of births and report detailed demographic characteristics of mothers. The broader coverage allows
us to compare MH hospitals to private hospitals, whose patients tend to be significantly richer,
and to other public hospitals, which cover mainly formal-sector workers and their families. Both
sources report locality (localidad) of mother’s residence, corresponding roughly to neighborhood.
Appendix Table A.3 presents summary statistics for the two sources. Mothers in MH hospitals
are younger, less likely to be married, and have lower completed schooling than those in private
or other public hospitals.
IV. Results
A. Compliance with the New Lead Standard in the U.S.
In this section, we examine the effect of the tightening of the air-quality standard on airborne
lead concentrations in the U.S. Because of data constraints, two empirical strategies that might
seem natural in this setting are not feasible. One would be to compare ambient lead levels at
monitors near and slightly farther away from plants affected by the reform. The difficulty here is
5The linking process may have missed some recycling plants in 2003 that stopped producing before 2008 Census,but this would lead us to overstate the change in production between 2003 and 2008 and hence understate theacceleration in production between 2008 and 2013.
6

that the number of monitors that measure lead more than two miles away from battery-recycling
plants (or other lead emitters) is very limited. Another strategy would be to compare lead levels
at monitors near lead-emitting plants to those near non-lead-emitting plants. The difficulty in
this case is that few monitors near non-lead-emitting plants measure lead.
Given the data constraints, our strategy is to compare pollution levels at monitors near lead-
emitting plants more and less affected by the regulation. We compare monitors near lead-emitting
plants where the reform was binding, with ambient lead levels above 0.15 µg/m3 prior to the
reform, to monitors near lead-emitting plants where the reform was not binding. In implementing
this strategy, a key decision is how to define “near.” Our preferred definition is within two
miles of a lead-emitting plant. As motivation for this choice, Appendix Figure A.3 plots lead
concentrations by distance from plants for which average concentrations at nearby monitors were
above the new standard, which we refer to as “binding” plants; the concentrations fall off quickly
within the first two miles and remain roughly similar between 3 and 10 miles.6 Below we also
report results using a one-mile range, which we refer to as “very near.”
Figure 1 plots average lead concentrations over time at monitors within two miles of a lead-
emitting plant, separately for areas where the new standard was binding and where it was not.
The vertical lines indicate the dates of the ANPR, the signing of the new standard, and the
implementation of the new standard. For binding areas, there was no obvious trend pre-reform,
but there was a clear decline in lead concentrations following the reform. As a further illustration,
Appendix Figure A.4 plots the average lead concentration at monitors within two miles of a given
lead-emitting plant in 2015 versus 2007, for plants with data in both years. Eight of the ten
plants with average lead levels above the new standard in 2007 were battery-recycling plants, and
all of the plants with initial average concentration levels above the new standard had average
concentration levels below 0.15 µg/m3 by 2015.
Table 1 presents simple difference-in-difference and triple-difference estimates of the effect of
the reform. Columns (1)–(3) use the sample of monitors within two miles of any lead-emitting
plant. The coefficient on the Binding × Post interaction in Column (1) captures the differential
decline in lead concentrations at monitors where the new standard was binding relative to monitors
6The WHO (2017, p. 10) reports that a California battery-recycling plant was found to have contaminated thesurrounding area up to 1.7 miles away. Given that battery-recycling plants are particularly intensive lead emitters,we believe that it is reasonable to focus on a slightly larger range than the one used by a leading previous study,Currie et al. (2015), which considered a range of pollutants.
7

in non-binding areas.7 The pre-reform mean at the binding monitors was 0.549 and the coefficient
of -0.242 represents a decline of 44%. Column (2) shows that using an indicator for battery-
recycling plant in place of the Binding indicator yields similar results, as would be expected given
that it was mainly on such plants that the reform was binding. Column (3) adds the “very near”
indicator. The coefficient on V ery Near×Post×Binding is identified by the comparison of the
post-reform decline between monitors 0–1 and 1–2 miles from a lead-emitting plant in a binding
area. The effect of the reform is statistically significantly stronger at very near monitors. At the
same time, the Binding×Post interaction, which captures the effect on monitors 1–2 miles away,
remains significant, providing support for our definition of “near” as within two miles. Column (4)
reports the basic difference-in-difference specification for the subset of 22 monitors within 2 miles
of a battery-recycling plant. The estimate is very similar to the estimate for the larger sample
in Column (1). Overall, there is clear evidence that the reform reduced lead concentrations at
monitors where it was binding, which were primarily those near battery-recycling plants.
It is difficult to make definitive statements about U.S. lead output from battery recycling,
because confidentiality rules for the U.S. Census of Manufactures would prevent the disclosure
of information for such a small number of plants. But it appears from other sources that lead
production from recycling of ULABs fell over the same period. The U.S. Geological Survey reports
that lead output from battery recycling fell by 13% from 2007 to 2014, from 1.1 million to .96
million metric tons (Guberman, 2009, 2016).8 Of the 15 battery-recycling plants in operation in
2007 listed in CEC (2013), only 10 were still in operation at the end of 2014 (Guberman, 2016,
2017).9
B. U.S. Exports of Used Lead-Acid Batteries to Mexico
Using the trade data from the U.S. Census Bureau, Figure 2 plots monthly ULAB exports from the
U.S. to Mexico and to the rest of the world, primarily Canada. There was a small increase in 2004,
corresponding to the construction of a battery-recycling plant in Mexico by Johnson Controls,
a major auto-parts producer. But the most notable feature of the graph is the trend break in
7Standard errors are clustered at the monitor level to address the possibility of serial correlation (Bertrand etal., 2004).
8This decline came after output had risen by 10%, from 1.0 million to 1.1 million metric tons, between 2002 and2007.
9The overall decline in output was slowed by the opening of a new Johnson Controls plant (the first newbattery-recycling plant in the U.S. in 20 years) in Florence, SC, announced in June 2009.
8

early 2009. ULAB exports rose by a factor of four between January 2009 and the end of 2014. In
Appendix C.1, we test formally for a structural break using a Quandt likelihood ratio test, and
we find clear evidence of a break in May–August 2009. In Appendix C.2, we conduct a difference-
in-difference analysis, comparing ULAB exports to exports in other 10-digit trade categories
that map into the 3-digit sector in which battery recycling is typically considered to be located,
Primary Metal Manufacturing (Sector 331 in the North American Industry Classification System
(NAICS)).10 We again find clear evidence that the reform increased U.S. ULAB exports. The fact
that ULAB exports increased suggests that not all of the reduction in U.S. lead concentrations
can be attributed to adoption of cleaner technologies by U.S. plants, which as noted above can
be costly, especially for older plants.
C. Growth of Battery Recycling in Mexico
We turn now to the growth of battery-recycling plants in Mexico. The fact that we observe only
two waves of pre-reform data limits our ability to apply synthetic-control methods (Abadie, 2021),
which would otherwise be natural in this context.11 Instead, we simply compare the growth of
value-added for 2003–2008 and 2008–2013 for battery recycling and other 6-digit industries from
NAICS Sector 331. To form the battery-recycling “sector,” we aggregate the plants identified
as battery-recycling plants. Figure 3 presents a scatterplot. Battery recycling is a clear outlier.
Its value-added growth over 2003–2008 (62.2% over the 5-year period, or approximately 12.4%
per year) was modest, below the median of 6-digit industries in Sector 331, and its growth over
2008–2013 (243.2%) was markedly greater than the other industries.12 Appendix Figure A.7
presents a similar scatterplot for gross output. Growth in gross output was also high for industry
331520 (“Nonferrous Metallic Parts Molded by Casting”) but, again, battery recycling’s growth
clearly accelerated in 2008–2013 relative to almost all other industries in the broad sector.
10Plants that engage in battery recycling are typically classified in NAICS 331419, Primary Smelting and Refiningof Non-Ferrous Metal (except Copper and Aluminum), although in some cases they are classified in NAICS 335910,Battery Manufacturing.
11Given the small number of periods, this method would match battery recycling with industries based just onthe 2003–2008 change in the outcome variable (e.g. value-added); it is not clear that industries that match on thissingle change are compelling comparators for battery recycling.
12The value-added growth rates for non-battery plants reported in the Introduction were calculated by taking anunweighted average of 6-digit industries in Sector 331.
9

D. Infant Health in Mexico
To estimate the health effects in Mexico, we compare birth outcomes for mothers living in local-
ities near battery-recycling plants to those for mothers living in localities slightly farther away.
Consistent with our approach in the U.S., we define “near” as within two miles of a battery-
recycling plant and “slightly farther away” as between two and four miles away. Appendix Figure
A.8 illustrates the assignment of localities to distance bins. We focus on births to mothers residing
in localities in one of these two bins.
Our preferred model is the following:
Healthijmht = α+ βNearj × Postt + ρXit + φZj,2005 × Postt (1)
+µmt + γj + λht + εijmht
where i, j, m, h, and t denote individual, locality, municipality, hospital, and year, respectively.
Health denotes a birth outcome, e.g. an indicator for low birthweight (< 2.5 kg) or birthweight it-
self. Near is an indicator for mother’s locality being 0–2 miles from the nearest battery-recycling
plant. The Postt indicator takes the value 1 in 2009 and thereafter and 0 otherwise. The
Xit vector contains mothers’ characteristics. The Zj,2005 vector contains initial values of local-
ity characteristics, listed in Appendix B.6. The variables µmt, γj , and λht are fixed effects for
municipality-year, locality, and hospital-year. The coefficient of interest is β, which captures the
differential effect of the U.S. reform on birth outcomes for mothers living in localities 0–2 miles
from a battery-recycling plant relative to those living 2–4 miles away. The fact that we can control
for hospital-year effects is a notable advantage over previous studies (e.g. Currie et al. (2015)),
since there is extensive sorting of mothers across hospitals based on observable socio-economic
characteristics and most likely on unobservable characteristics as well.
Table 2 presents estimates of equation (1). Panel A uses the Ministry of Health (MH) hospital-
discharge records. These data contain limited information on mothers; Xit here includes only
mother’s age and age squared. Across columns, we include progressively richer sets of controls,
using the same sample. Column (1) includes just municipality-year and locality effects, Column
(2) adds the Zj,2005 ∗ Postt locality controls, Column (3) adds hospital effects, and Column (4)
adds hospital-year effects. The dependent variables are an indicator for low birthweight (< 2.5 kg)
— the primary outcome considered in the literature (e.g. Currie et al. (2015)) and our preferred
10

outcome — in Panel A.1 and birthweight itself in Panel A.2.13 The results are reasonably stable
across columns and consistent across outcomes. Our preferred specification is the most stringent
one, Column (4), with hospital-year effects. These estimates indicate that the share of low-
birthweight births mothers rose by 0.048 (i.e. 4.8 percentage points) and birthweight declined
by 38.5 g on average for mothers living in a locality within 2 miles of a battery-recycling plant
relative to mothers living in a locality 2–4 miles away who gave birth in the same hospital in the
same year.
Panel B uses the birth certificates, which are only available for one pre-reform year but are
available for all hospitals. We estimate the Panel A Column (4) specification for the different types
of hospitals. To facilitate comparison we include the same covariates as in Panel A, i.e. mother’s
age and age squared.14 In Column (1), for MH hospitals, the low birthweight indicator estimate is
very similar to the Panel A.1 Column (4) estimate and again highly significant. The birthweight
estimate is larger than the Panel A.2 Column (4) estimate — Appendix B.5 discusses differences
in the data sources that give rise to this difference in magnitudes — but is again negative and
highly significant. Pooling across hospital types, we see an increase of 0.02 in the incidence of low
birthweight on average. But this effect is driven entirely by the MH hospitals. Strikingly, there is
little evidence of a negative impact on birth outcomes in other public or private hospitals. For the
low birthweight indicator, the estimates for other public and private hospitals are both very close
to zero. For birthweight, the point estimate for other public hospitals is in fact positive, although
not statistically significant, and the point estimate for private hospitals, although negative, is
an order of magnitude smaller than the estimate for MH hospitals, and again not statistically
significant.
To illustrate the timing of the impacts, Appendix Figure A.9 plots coefficients from a speci-
fication similar to our preferred one, Table 2 Panel A.1 Column (4), but interacting Near with
dummies for each year (with 2008 as the omitted reference year). There was no obvious trend
prior to 2009; to the extent that there is a pattern, it suggests that the incidence of low birthweight
was declining in areas closer to battery-recycling plants. But there is an evident and statistically
significant increase in 2009. We cannot reject that the effect is constant thereafter. As mentioned
above, awareness of the health consequences of battery recycling increased in Mexico over the
13Appendix Tables A.5–A.6 report all coefficients for the Panel A regressions, and include an additional specifi-cation with municipality controls in place of municipality-year effects.
14Appendix Tables A.11 and A.12 report all coefficients for the Panel B regressions. Regressions using a richerset of mothers’ characteristics are reported in Appendix Tables A.13 and A.14. The results are very similar.
11

period, culminating in new regulation imposed in early 2015; public pressure may be in part
responsible for the slight decline in the effect over 2010–2015.
We have also considered the effects on other outcomes, in particular the incidence of very
low birthweight (<1.5 kg), the length of gestation period, the incidence of premature birth (<37
weeks), and the probability of live birth. Appendix Tables A.7–A.10 report the results for the MH
hospital-discharge data.15 For very low birthweight (a rare occurrence), the effect is marginally
significant in our preferred specification, but not robust across specifications. We do not find
robust effects on gestation length, the incidence of premature birth, or the probability of live
birth. The latter result suggests that selection into birth is not a major source of bias in our main
estimates.
Our estimates for birth outcomes in Ministry of Health hospitals — an 0.048 (4.8 percentage
point) increase in the incidence of low birthweight and a 38.5 gram (1.3%) decline in birthweight in
our preferred specification — are large relative to many existing estimates of the effect of pollution
on infant health, but not out of line with evidence on concentrated exposure among disadvantaged
populations. Two leading related studies find comparatively small effects. Currie and Schmieder
(2009) relate U.S. firms’ self-reported releases of lead in the TRI to infant health outcomes at
the county level, and find that a one-standard-deviation increase is associated with just a 0.00002
increase in the incidence of low birthweight and a decline in birthweight of 0.9 g. Currie et al.
(2015) consider the effects of openings of industrial plants (which emit lead and other pollutants)
on births to mothers living within 1 mile and find an increase in low-birthweight incidence of
0.002 and a decline in birthweight of 3.9 g. But other recent studies have found larger effects.
Currie and Walker (2011) find that the introduction of E-ZPass in New Jersey and Pennsylvania
was associated with a reduction of low-birthweight incidence of approximately 0.01 for mothers
living within 2 miles of toll plazas, with a larger reduction for African-American mothers (0.024).
Both estimates are about half the size of ours (0.02 on average for all hospitals, and 0.048 for
disadvantaged mothers in MH hospitals). A study of the switch to a contaminated water source
(containing lead and other pollutants) in Flint, Michigan, estimates a 175 g (5.4%) decrease in
birthweight after adjusting for selection into birth (Grossman and Slusky, 2019). Currie et al.
(2009) find that reductions of carbon monoxide in some areas of New Jersey were associated with
birthweight increases of approximately 60 g, roughly what would be expected for a mother going
15The probability of live birth cannot be examined in the birth-certificate data, since they only record live births.
12

from 10 cigarettes a day to zero. The fact that our estimates are on the high side of the range
of existing estimates may be explained by the facts that battery-recycling plants are particularly
intensive emitters, that lead is a particularly toxic pollutant, and that mothers in MH hospitals
are a particularly vulnerable population, with limited access to high-quality health care.
V. Conclusion
This short paper has provided evidence that the 2009 tightening of the U.S. airborne lead standard
led battery recycling to shift from the U.S. to Mexico and negatively affected infant health near
Mexican battery-recycling plants. The data have limitations: for instance, we are not able to track
year-to-year changes in output of Mexican battery-recycling plants, nor are air-monitor data on
lead available outside of Mexico City over the study period. But the findings provide reasonably
strong evidence of a pollution-haven effect in this industry, with adverse health consequences in
the destination. The fact that the health impacts are concentrated among disadvantaged mothers
echoes the findings of the environmental-justice literature that the costs of environmental hazards
are disproportionately borne by the poor (Currie, 2011; Hsiang et al., 2019).
Two important questions remain unanswered and merit further investigation. First, what were
the health effects in the U.S. of the policy change? As noted above, two leading studies, Currie
and Schmieder (2009) and Currie et al. (2015), suggest that the positive impact on U.S. birth
outcomes was likely small. But neither study focuses specifically on the link between airborne
lead concentrations and infant health. In addition, people living near “binding” plants tend to
be disadvantaged relative even to people near other lead-emitting plants.16 Given the income
gradient in effects of pollution, one might reasonably expect larger impacts on the vulnerable
population living near U.S. battery recyclers.
Second, to what extent is the case of battery recycling representative of broader patterns?
We have focused on the case because there was a sharp regulatory change and a conducive
data environment, but the technological characteristics of the sector may be special. Ederington
et al. (2005) argue that evidence for pollution-haven effects has been mixed in part because
industries with high pollution-abatement costs tend to be less mobile than those with lower costs.
Battery recycling may be an unusual case in which abatement costs are high and both inputs
16Appendix Table A.15 reports summary statistics from the American Community Survey indicating that theformer group has lower household income and educational attainment and is much more likely to be Hispanic. SeeAppendix D for details.
13

(used batteries) and output (lead) are relatively transportable. More research on North-South
displacement in other sectors is needed. But at a minimum, the case of battery recycling provides
a clear example that environmental regulation in the North can displace polluting activities to
the South.
From a policy perspective, a key contribution of this paper is to document an environmental
production externality between the U.S. and Mexico — a particular sense in which the envi-
ronmental fates of the two countries are linked. The externality points to a need for greater
North-South coordination of environmental policy, in the same way that terms-of-trade external-
ities provide a motivation for trade agreements (Bagwell and Staiger, 2004). Such coordination is
sure to be complicated both by differences in bargaining power between countries and by unequal
distribution of impacts and influence within countries. There are also important questions about
the extent to which trade and environmental negotiations should be linked (Copeland and Taylor,
2004; Limao, 2005). But it seems clear that North-South displacement effects make environmental
policy a legitimate subject for North-South policy negotiations.
14

References
Abadie, Alberto, “Using Synthetic Controls: Feasibility, Data Requirements, and Methodological As-pects,” Journal of Economic Literature, 2021, 59 (2), 391–425.
Aizer, Anna, Janet Currie, Peter Simion, and Patrick Vivier, “Do Low Levels of Blood LeadReduce Children’s Future Test Scores?,” American Economic Journal: Applied Economics, 2018, 10 (1),307–341.
Bagwell, Kyle and Robert W Staiger, The Economics of the World Trading System, MIT press, 2004.
Becker, Randy and Vernon Henderson, “Effects of Air Quality Regulations on Polluting Industries,”Journal of Political Economy, 2000, 108 (2), 379–421.
Bertrand, Marianne, Esther Duflo, and Sendhil Mullainathan, “How Much Should We TrustDifference-in-Differences Estimates?,” Quarterly Journal of Economics, Feb. 2004, 119 (1), 249–276.
Billings, Stephen B. and Kevin T. Schnepel, “Life after Lead: Effects of Early Interventions forChildren Exposed to Lead,” American Economic Journal: Applied Economics, 2018, 10 (3), 315–344.
Burr, Mike, Donna Lazzari, and Danny Greene, “Draft Summary of the Technology Review for theSecondary Lead Smelting Source Category,” 2011. Url: https://www.regulations.gov/document/EPA-HQ-OAR-2011-0344-0055, Accessed 23 June 2021.
Busso, Matıas, Oscar Fentanes, and Santiago Levy, “The Longitudinal Linkage of Mexico’s Eco-nomic Census 1999-2014,” 2018. IADB Technical Note IDB-TN-1477.
Centers for Disease Control and Prevention, CDC Response to Advisory Committee on ChildhoodLead Poisoning Prevention Recommendations in ‘Low Level Lead Exposure Harms Children: A RenewedCall of Primary Prevention’, U.S. Department of Health and Human Services, June 2012.
Centers for Disease Control and Prevention, CDC, Preventing Lead Poisoning in Young Children,U.S. Department of Health and Human Services, 2005.
Cherniwchan, Jevan, Brian R. Copeland, and M. Scott Taylor, “Trade and the Environment:New Methods, Measurements, and Results,” Annual Review of Economics, 2017, 9, 59–85.
Cole, Matthew A., Robert J. R. Elliott, and Liyun Zhang, “Foreign Direct Investment and theEnvironment,” Annual Review of Environment and Resources, 2017, 42, 465/487.
Commission for Environmental Cooperation, Hazardous Trade? An Examination of US-GeneratedSpent Lead-Acid Battery Exports and Secondary Lead Recycling in Canada, Mexico, and the UnitedStates, 2013.
, Environmentally Sound Management of Spent Lead-Acid Batteries in North America: Technical Guide-lines 2016. Montreal, Canada.
Copeland, Brian R. and M. Scott Taylor, “Trade, Growth, and the Environment,” Journal of Eco-nomic Literature, 2004, 42, 7–71.
, Joseph S. Shapiro, and M. Scott Taylor, “Globalization and the Environment,” Working Paper28797, National Bureau of Economic Research May 2021.
Currie, Janet, “Inequality at Birth: Some Causes and Consequences,” American Economic Review, 2011,101 (3), 1–22.
and Johannes F. Schmieder, “Fetal Exposures to Toxic Releases and Infant Health,” AmericanEconomic Review, 2009, 99 (2), 177–83.
and Reed Walker, “Traffic Congestion and Infant Health: Evidence from E-ZPass,” American Eco-nomic Journal: Applied Economics, 2011, 3 (1), 65–90.
, Lucas Davis, Michael Greenstone, and Reed Walker, “Environmental Health Risks and HousingValues: Evidence from 1,600 Toxic Plant Openings and Closings,” American Economic Review, 2015,105 (2), 678–709.
, Matthew Neidell, and Johannes F. Schmieder, “Air Pollution and Infant Health: Lessons fromNew Jersey,” Journal of Health Economics, 2009, 28 (3), 688–703.
Davidson, Alistair J, Steve P Binks, and Johannes Gediga, “Lead Industry Life Cycle Studies:
15

Environmental Impact and Life Cycle Assessment of Lead Battery and Architectural Sheet Production,”International Journal of Life Cycle Assessment, 2016, 21 (11), 1624–1636.
Dechezlepretre, Antoine and Misato Sato, “The Impacts of Environmental Regulations on Compet-itiveness,” Review of Environmental Economics and Policy, 2017, 11 (2), 183–206.
Diario Oficial de la Federacion Mexicana, “Proyecto de Norma Oficial Mexicana PROY-NOM-166-SEMARNAT-2014, Control de Emisiones Atmosfericas en la Fundicion Secundaria de Plomo,” 2014.Published April 22, 2014.
, “Norma Oficial Mexicana PROY-NOM-166-SEMARNAT-2014, Control de Emisiones Atmosfericas enla Fundicion Secundaria de Plomo,” 2015. Published Jan. 9, 2015.
Ederington, Josh, Arik Levinson, and Jenny Minier, “Footloose and Pollution-Free,” Review ofEconomics and Statistics, 2005, 87 (1), 92–99.
Ettinger, Adrienne S. and Anne M. Wengrovitz, eds, Guidelines for the Identification and Man-agement of Lead Exposure in Pregnant and Lactating Women, Centers for Disease Control, 2010.
Gonzalez-Cossıo, Teresa, Karen E Peterson, Luz-Helena Sanın, Eugenia Fishbein, EduardoPalazuelos, Antonio Aro, Mauricio Hernandez-Avila, and Howard Hu, “Decrease in BirthWeight in Relation to Maternal Bone-Lead Burden,” Pediatrics, 1997, 100 (5), 856–862.
Greenstone, Michael, “The Impacts of Environmental Regulations on Industrial Activity: Evidence fromthe 1970 and 1977 Clean Air Act Amendments and the Census of Manufactures,” Journal of PoliticalEconomy, 2002, 110 (6), 1175–1219.
Gronqvist, Hans, J. Peter Nilsson, and Per-Olof Robling, “Understanding How Low Levels ofEarly Lead Exposure Affect Children’s Life Trajectories,” Journal of Political Economy, 2020, 128 (9),3376–3433.
Grossman, Daniel S. and David J. G. Slusky, “The Impact of the Flint Water Crisis on Fertility,”Demography, 2019, 56 (6), 2005–2031.
Guberman, David E., 2007 Minerals Yearbook: Lead, U.S. Geological Survey, 2009.
, 2010 Minerals Yearbook: Lead, U.S. Geological Survey, 2012.
, 2014 Minerals Yearbook: Lead, U.S. Geological Survey, 2016.
, 2015 Minerals Yearbook: Lead, U.S. Geological Survey, 2017.
Hanna, Rema, “US Environmental Regulation and FDI: Evidence from a Panel of US-based MultinationalFirms,” American Economic Journal: Applied Economics, 2010, 2, 158–189.
Henderson, Vernon J., “Effects of Air Quality Regulation,” American Economic Review, 1996, 86 (4),789–813.
Hernandez-Avila, Mauricio, Karen E. Peterson, Teresa Gonzalez-Cossıo, Luz H. Sanın, An-tonio Aro, Lourdes Schnaas, and Howard Hu, “Effect of Maternal Bone Lead on Length andHead Circumference of Newborns and 1-Month-Old Infants,” Archives of Environmental Health: AnInternational Journal, 2002, 57 (5), 482–488.
Hsiang, Solomon, Paulina Oliva, and Reed Walker, “The Distribution of Environmental Damages,”Review of Environmental Economics and Policy, 2019, 13 (1), 83–103.
Karp, Larry, “The Environment and Trade,” Annual Review of Resource Economics, 2011, 3 (1), 397–417.
Levinson, Arik, “Offshoring Pollution: Is the United States Increasingly Importing Pollution Goods?,”Review of Environmental Economics and Policy, 2010, 4 (1), 63–83.
Limao, Nuno, “Trade Policy, Cross-Border Externalities and Lobbies: Do Linked Agreements EnforceMore Cooperative Outcomes?,” Journal of International Economics, 2005, 67 (1), 175–199.
Needleman, Herbert L., Alan Schell, David Bellinger, Alan Leviton, and Elizabeth N. Allred,“The Long-term Effects of Exposure to Low Doses of Lead in Childhood. An 11-year Follow-up Report,”New England Journal of Medicine, 1990, 322 (2), 83–88.
Occupational Knowledge International (OKI) and Fronteras Comunes (FC), Exporting Hazards:U.S. Exports of Used Lead Batteries to Mexico Take Advantage of Lax Environmental and Worker HealthRegulations 2011.
16

Rees, Nicholas and Richard Fuller, “The Toxic Truth: Children’s Exposure to Lead Pollution Under-mines a Generation of Future Potential,” Technical Report, UNICEF 2020.
Reyes, Jessica W., “Environmental Policy as Social Policy? The Impact of Childhood Lead Exposureon Crime,” The B.E. Journal of Economic Analysis and Policy, 2007, 7 (1).
Romieu, Isabelle, Eduardo Palazuelos, Mauricio Hernandez Avila, Camilo Rios, lda Munoz,Carlos Jimenez, and Gisela Cahero, “Sources of Lead Exposure in Mexico City,” EnvironmentalHealth Perspectives, April 1994, 102 (4), 384–389.
Rosenthal, Elisabeth, “Lead From Old U.S. Batteries Sent to Mexico Raises Risks,” New York Times,2011. Dec. 9.
Torres-Sanchez, L. E., G. Berkowitz, L. Lopez-Carrillo, L. Torres-Arreola, C. Rios, andM. Lopez-Cervantes, “Intrauterine Lead Exposure and Preterm Birth,” Environmental Research Sec-tion, 1999, 81 (4), 297–301.
U.S. Environmental Protection Agency, “National Emissions Standards for Hazardous Air Pollutantsfrom Secondary Lead Smelting,” Federal Register, 2012, 77 (3). Jan. 5.
, “Policy Assessment for the Review of the Lead National Ambient Air Quality Standards,” 2014. U.S.Environmental Protection Agency document EPA-254/R-14-001.
World Bank, World Development Report 2020: Trading for Development in the Age of Global ValueChains, Washington DC: World Bank, 2020.
World Health Organization, Recycling Used Lead-Acid Batteries: Health Considerations, Geneva:World Health Organization (WHO), 2017.
Zhu, Motao, Edward F Fitzgerald, Kitty H Gelberg, Shao Lin, and Charlotte M Druschel,“Maternal Low-Level Lead Exposure and Fetal Growth,” Environmental Health Perspectives, 2010, 118(10), 1471–1475.
17

Figure 1. Lead Concentrations in U.S., Binding vs. Non-Binding Areas
Implemented
Signed
ANPR
0.2
.4.6
.8Le
ad C
once
ntra
tion
(µg/
m3 )
2002
Jan
2003
Jan
2004
Jan
2005
Jan
2006
Jan
2007
Jan
2008
Jan
2009
Jan
2010
Jan
2011
Jan
2012
Jan
2013
Jan
2014
Jan
2015
Jan
BindingNon-binding
Notes: Sample is monitors within two miles of a lead-emitting plant for which we observe both pre-reform andpost-reform lead concentrations. Figure plots three-month moving averages in lead concentration levels in ambientair at monitoring stations between 2002 and 2015, separately for binding areas (concentration > .15 µg/m3 pre-2008) and non-binding areas. The leftmost vertical line indicates the date of the Advance Notice of ProposedRulemaking (ANPR), December 5, 2007; the middle line the signing of the revised standard (NAAQS), May 1,2008; the rightmost the implementation of the new standard, January 12, 2009.

Figure 2. U.S. Monthly Exports of Used Lead-Acid Batteries
ImplementedSigned
ANPR
01
23
Num
ber
(Mill
ion)
per
Mon
th
2002
Jan
2004
Jan
2006
Jan
2008
Jan
2010
Jan
2012
Jan
2014
Jan
MexicoRest of the world
Notes: Each dot indicates monthly exports (measured in millions of batteries) from the U.S. to Mexico (in blue) andthe rest of the world (in red). The fitted trend lines indicate smoothed local polynomial trends with the bandwidthof three months. The leftmost vertical line indicates the date of the Advance Notice of Proposed Rulemaking(ANPR), December 5, 2007; the middle line the signing of the revised standard (NAAQS), May 1, 2008; and therightmost line the implementation of the new standard, January 12, 2009. The trend for Mexico omits May andJune, 2008, just after the new standard was signed, when exports spiked temporarily. Source: U.S. Census BureauForeign Trade statistics. Exports are the sum for U.S. tariff codes 8548100540, 8548100580, and 8548102500.

Figure 3. Value-Added in Battery Recycling vs. Similar Industries in Mexico
331111
331112
331210
331220331310
331411
331419
331420
331490
331510
331520
Battery Recycling
-10
12
3G
row
th o
f Rea
l Val
ue-A
dded
200
8-20
13
0 2 4 6 8 10Growth of Real Value-Added 2003-2008
Notes: Value-added by industry is from 2004, 2009, and 2014 Mexican Economic Censuses (data for 2003, 2008,and 2013), for North American Industry Classification System (NAICS) sector 331 (Primary Metal Manufacturing)and for plants identified as battery recyclers. Real value-added is defined as gross output minus intermediate inputconsumption, deflated by the Mexican CPI. Growth of real value-added is defined as (vat−vat−1)/vat−1. The 6-digitindustries are: 331111 – Iron and steel mills; 331112 – Primary roughs and ferroalloy manufacturing; 331210 – Ironand steel pipe and tube manufacturing; 331220 – Other iron and steel product manufacturing; 331310 – Aluminumproduction; 331411 – Copper smelting and refining; 331412 – Precious metals smelting and refining; 331419 – Othernonferrous metals smelting and refining; 331420 – Secondary lamination of copper; 331490 – Secondary laminationof other nonferrous metals; 331510 – Iron and steel parts molded by casting; 331520 – Nonferrous metallic partsmolded by casting.

Table 1. Effect of Tightened Lead Standard on Airborne Lead in the U.S.
Dep. var.: Lead concentration (µg/m3)
Monitors nearlead-emitting plants
Monitors nearbattery-recycling plants
(1) (2) (3) (4)
Binding × Post -0.242*** -0.142*** -0.252***
(0.047) (0.003) (0.067)
Battery × Post -0.165***
(0.050)
Very Near × Post -0.020***
(0.007)
Very Near × Post × Binding -0.102**
(0.050)
N (observations) 16,858 16,858 16,858 3,133
N (monitors) 142 142 142 22
Pre-Reform Mean (binding monitors) 0.549 0.549 0.549 0.506
Monitor Effects Y Y Y Y
Year-Month Effects Y Y Y Y
Notes: “Near” is defined as ≤ 2 miles. Sample in Columns (1)–(3) is monitors near any lead-emitting plant. Sample inColumn (4) is monitors near a battery-recycling plant. In all columns, monitors are included only if they report leademissions both before and after January 1, 2009. Data are for 2002–2015. “Binding” means that lead concentrationlevels were above new standard at the most recent reading prior to January 2009. “Post” takes the value 0 prior toJanuary 2009 and 1 thereafter. “Battery” means near a battery-recycling plant. “Very near” means ≤ 1 mile from alead-emitting plant. Pre-reform mean is calculated for available years prior to 2009. Robust standard errors, clusteredat the monitor level, are in parentheses. *10% level, **5% level, ***1% level.
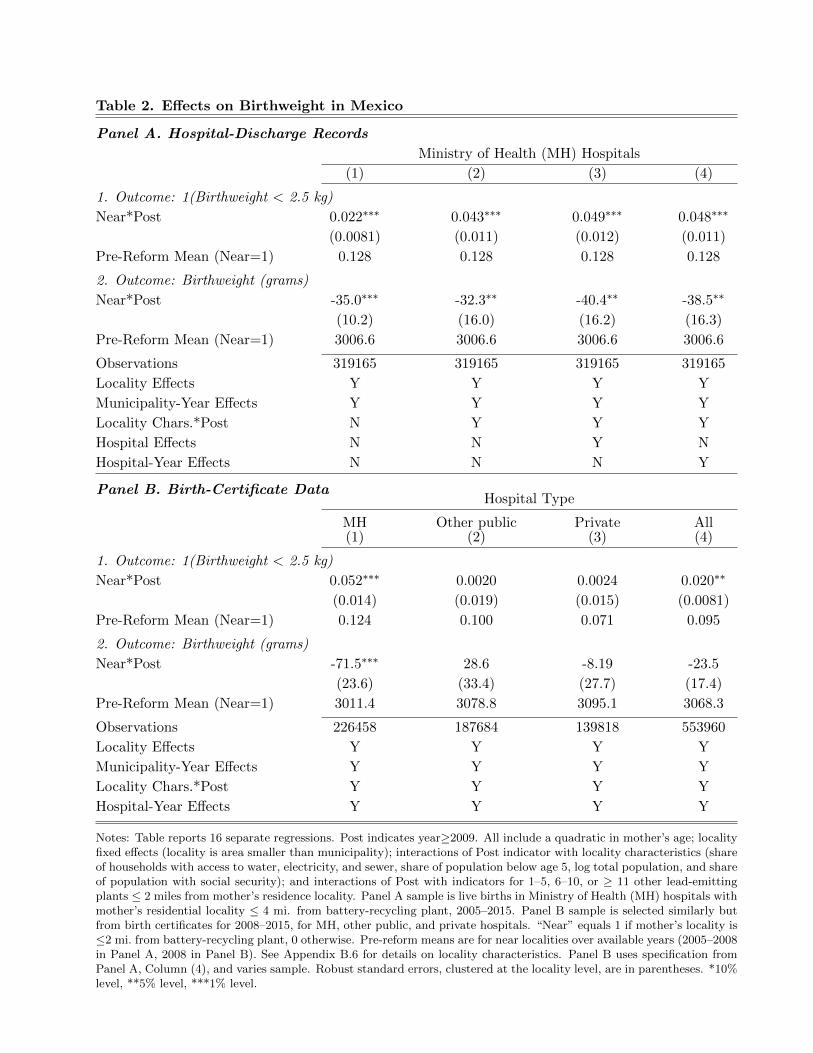
Table 2. Effects on Birthweight in Mexico
Panel A. Hospital-Discharge Records
Ministry of Health (MH) Hospitals
(1) (2) (3) (4)
1. Outcome: 1(Birthweight < 2.5 kg)
Near*Post 0.022∗∗∗ 0.043∗∗∗ 0.049∗∗∗ 0.048∗∗∗
(0.0081) (0.011) (0.012) (0.011)
Pre-Reform Mean (Near=1) 0.128 0.128 0.128 0.128
2. Outcome: Birthweight (grams)
Near*Post -35.0∗∗∗ -32.3∗∗ -40.4∗∗ -38.5∗∗
(10.2) (16.0) (16.2) (16.3)
Pre-Reform Mean (Near=1) 3006.6 3006.6 3006.6 3006.6
Observations 319165 319165 319165 319165
Locality Effects Y Y Y Y
Municipality-Year Effects Y Y Y Y
Locality Chars.*Post N Y Y Y
Hospital Effects N N Y N
Hospital-Year Effects N N N Y
Panel B. Birth-Certificate DataHospital Type
MH Other public Private All(1) (2) (3) (4)
1. Outcome: 1(Birthweight < 2.5 kg)
Near*Post 0.052∗∗∗ 0.0020 0.0024 0.020∗∗
(0.014) (0.019) (0.015) (0.0081)
Pre-Reform Mean (Near=1) 0.124 0.100 0.071 0.095
2. Outcome: Birthweight (grams)
Near*Post -71.5∗∗∗ 28.6 -8.19 -23.5
(23.6) (33.4) (27.7) (17.4)
Pre-Reform Mean (Near=1) 3011.4 3078.8 3095.1 3068.3
Observations 226458 187684 139818 553960
Locality Effects Y Y Y Y
Municipality-Year Effects Y Y Y Y
Locality Chars.*Post Y Y Y Y
Hospital-Year Effects Y Y Y Y
Notes: Table reports 16 separate regressions. Post indicates year≥2009. All include a quadratic in mother’s age; localityfixed effects (locality is area smaller than municipality); interactions of Post indicator with locality characteristics (shareof households with access to water, electricity, and sewer, share of population below age 5, log total population, and shareof population with social security); and interactions of Post with indicators for 1–5, 6–10, or ≥ 11 other lead-emittingplants ≤ 2 miles from mother’s residence locality. Panel A sample is live births in Ministry of Health (MH) hospitals withmother’s residential locality ≤ 4 mi. from battery-recycling plant, 2005–2015. Panel B sample is selected similarly butfrom birth certificates for 2008–2015, for MH, other public, and private hospitals. “Near” equals 1 if mother’s locality is≤2 mi. from battery-recycling plant, 0 otherwise. Pre-reform means are for near localities over available years (2005–2008in Panel A, 2008 in Panel B). See Appendix B.6 for details on locality characteristics. Panel B uses specification fromPanel A, Column (4), and varies sample. Robust standard errors, clustered at the locality level, are in parentheses. *10%level, **5% level, ***1% level.