North East Salary Survey 2016
48
North East Salary Survey 2016 What are you worth?
-
Upload
nigel-wright-group -
Category
Recruiting & HR
-
view
91 -
download
0
Transcript of North East Salary Survey 2016

North East Salary Survey 2016
What are you worth?
Welcome to the 2016 edition of the Nigel Wright Recruitment North East Salary Survey.
As a company that is at the core of recruitment in the region, it is essential that we acknowledge any market trends that have taken place during the previous year, without engaging in any unpredictable uncertainties caused by Brexit.
Introduction
The information in this report has been gathered from over 1000 respondents who completed our online survey, as well as data from our extensive database of candidates. This provides us with a large data-set allowing us to understand in more depth the average salary and the type of benefits people receive within the North East. Other factors include what benefits people see as an important part of their remuneration package and the reasons why people move jobs internally or externally, as well as the methods that they utilise to search for a new job. We hope that the results presented within the general overview and discipline specific sections will be of interest.
For further information and advice please contact one of our consultants specialising in your specific discipline on 0191 222 0770.
About Nigel Wright RecruitmentSince its formation in the 1980s, Nigel Wright Group has become a leading name in the recruitment industry across Europe.
Nigel Wright consultants solve business problems for clients every day through the provision of effective recruitment solutions. The business has grown from being a specialist recruiter in the finance sector to covering a full range of disciplines in a number of different industry sectors. Currently, we have thirteen offices from which to support our growing client base; each office supports either our consumer, executive or recruitment business units. Our current locations are: Newcastle, London, Teesside, Paris, Madrid, Dusseldorf, Amsterdam, Copenhagen, Aarhus, Oslo, Stockholm, Gothenburg and Malmo.
Nigel Wright Recruitment is a specialist UK division focusing on a broad range of professional disciplines and industry sectors for local, national and international businesses. The teams are able to handle executive and senior management roles,
through to junior and entry level for permanent, temporary, interim and contract assignments. We also serve the following key industry sectors: industrial and manufacturing, consumer, business and professional services, public and third sectors, scientific and digital and creative and cover the following disciplines; executive and NEDs, sales, marketing, engineering, manufacturing, supply chain and procurement, finance and accountancy, information technology and human resources.
Nigel Wright Recruitment’s specialist consultants are committed to delivering a quality service; most have an industry background and will have experience of dealing with key companies in your sector. This depth of knowledge and expertise ensures that the professional and unique service offered to our clients and candidates is second to none.
Contents
1. Executive summary 04
2. Non-monetary indicators 07
2.1 Weekly hours worked by sector 08
2.2 Ideal changes for work life balance 09
2.3 Job satisfaction by job level 10
2.4 Job satisfaction by discipline 11
2.5 Factors influencing a change of roles 12
2.6 Methods used to search for a new role 13
2.7 Hiring intentions of company 14
3. Salary, benefits and bonuses 15
3.1 Basic salary excluding benefits or bonus by type of employment 16
3.2 Basic daily rate for non-permanent employment 17
3.3 Basic salary excluding benefits or bonus by generic job title 18
3.4 Average percentage of salary increase received 19
3.5 Importance of benefits as part of a remuneration package by gender 20
3.6 Flexible working options offered by organisations 21
4. Analysis of salaries in relation to discipline 22
4.1 Executive/Board level 23
4.2 Finance and Accountancy 26
4.3 Human Resources 29
4.4 Information Technology 32
4.5 Supply Chain 35
4.6 Manufacturing and Engineering 38
4.7 Marketing 42
4.8 Sales 45
Contact details 47
04 North East Salary Survey 2016
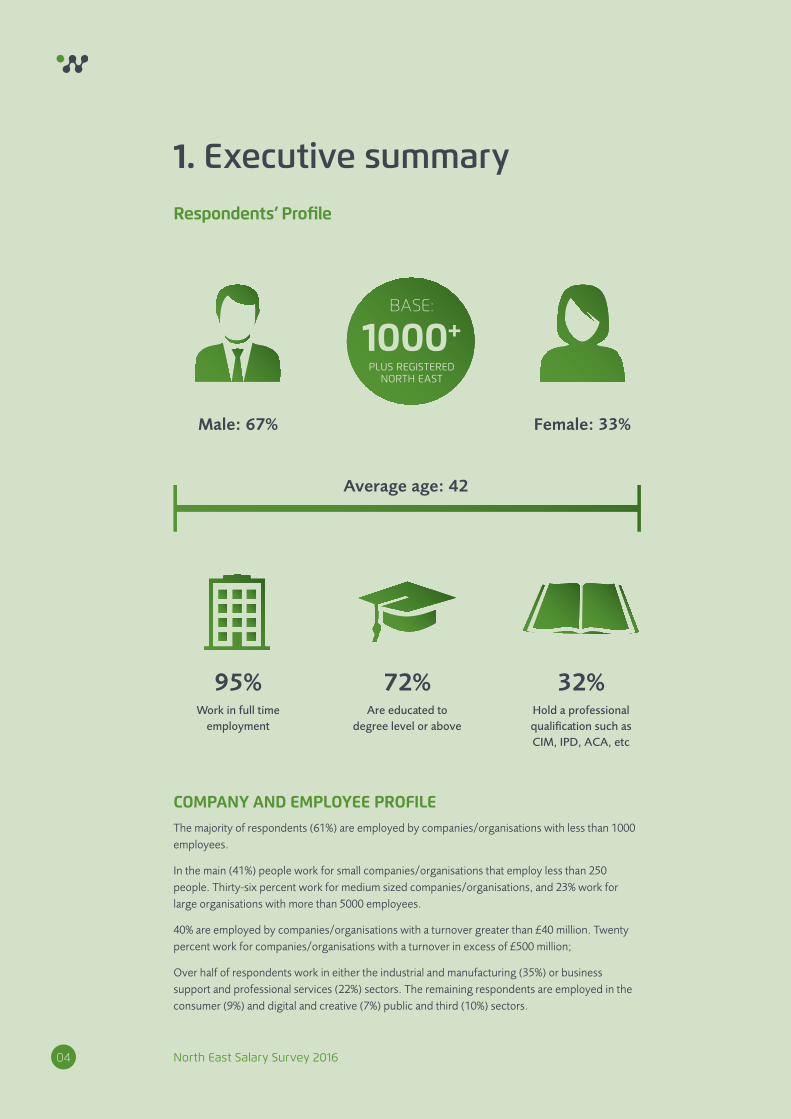
Respondents’ Profile
COMPANY AND EMPLOYEE PROFILEThe majority of respondents (61%) are employed by companies/organisations with less than 1000 employees.
In the main (41%) people work for small companies/organisations that employ less than 250 people. Thirty-six percent work for medium sized companies/organisations, and 23% work for large organisations with more than 5000 employees.
40% are employed by companies/organisations with a turnover greater than £40 million. Twenty percent work for companies/organisations with a turnover in excess of £500 million;
Over half of respondents work in either the industrial and manufacturing (35%) or business support and professional services (22%) sectors. The remaining respondents are employed in the consumer (9%) and digital and creative (7%) public and third (10%) sectors.
1. Executive summary
Male: 67% Female: 33%
BASE:
1000+PLUS REGISTERED
NORTH EAST
Average age: 42
95%Work in full time
employment
72%Are educated to
degree level or above
32%Hold a professional qualification such as CIM, IPD, ACA, etc

North East Salary Survey 2016 05
WORK HISTORY AND JOB SATISFACTION62% of respondents have worked for their current employer between one and five years. Sixteen percent have been with the same company for more than 10 years and 36% less than two years.
The majority (61%) of respondents have been in their current role for less than three years. Nineteen percent have been fulfilling the same role for more than five years, while 22% have been in their role for less than 12 months.
On average, respondents work 43 hours per week.
The majority of respondents were either satisfied (26%) or moderately satisfied (35%) in their current job. Seventeen percent described themselves as either very satisfied or moderately dissatisfied, while 5% are feeling very dissatisfied.
BASIC SALARY, EXCLUDING BENEFITS AND BONUSES As part of their last salary review respondents received, on average, a 3% increase.
Overall, respondents were expecting slightly less in their next salary review, with the average increase expected, falling to 2.6%.
On average there was a 12% difference between male and female salaries.
The majority of respondents were either satisfied (26%) or moderately satisfied (34%) with their current remuneration. Fifteen percent claimed to be very satisfied, whereas 20% say they are moderately dissatisfied. Only 6% are feeling very dissatisfied.
JOB SEEKING AND JOB CHANGING 70% of respondents in permanent employment would use Nigel Wright Recruitment’s website to search for a new job.
This was followed by other online job boards (46%) and other recruitment consultants (45%).
40% would make direct approaches to employers.
34% would use social networking sites, but only 8% would use regional or local newspapers.
Respondents in non-permanent employment rely more on online job boards (70%).
Increased remuneration, promotion and new challenges would be the most important factors for respondents, when looking to change jobs.
06 North East Salary Survey 2016
BENEFITS73% of respondents working in permanent employment receive some form of company benefit or bonus as part of their remuneration package.
Pension
36% with a pension have held their company pension fund for more than five years, with employers contributing 6% on average, and respondents personally contributing 6%.
Car allowance or loan
32% of respondents working in permanent employment are entitled to a car allowance or loan, with an average value of £7,400.
Annual leave
The majority of respondents working in permanent employment (54%) are entitled to between 21 and 25 days of leave per year. Thirty-nine percent take more than 25 days leave every year.
Healthcare
46% of respondents working in permanent employment are entitled to healthcare. Half of those with healthcare benefits (51%) receive cover for both themselves and family members.
Importance of benefits
Respondents working in permanent employment felt that the three most important employer benefits as part of a remuneration package were an employer contributory pension (64%), flexible working (57%) and holiday entitlement (57%). This was followed by a personal bonus (33%) a bonus based on company performance (23%) and health insurance (17%).
BONUS
Guaranteed bonus
Only 8% of respondents working in permanent employment receive a guaranteed bonus as part of their remuneration package. Their average bonus payment was 10%, and they anticipate their next annual bonus will be slightly higher (11%).
Company performance related bonus
46% of respondents working in permanent employment receive a company performance related bonus as part of their remuneration package, the average being 8%. They anticipate the next company performance related bonus also being 8%.
Personal performance related bonus
27% of respondents working in permanent employment receive a personal performance related bonus as part of their remuneration package, the average being 8%. They anticipate the next personal performance related bonus also being 8%.

North East Salary Survey 2016
3. Non-monetary indicators

08 North East Salary Survey 2016
2.1 Weekly hours worked by sector
This section presents information from respondents from all disciplines and levels, on their working hours, levels of satisfaction and the factors that motivate them to change roles.
On average, respondents work 42 hours per week. Forty-one percent of respondents work between 36 and 40 hours per week. Thirty-seven per cent of respondents work between 41 and 50 hours per week and a further 13% work over 50 hours per week. On average, employees in the consumer and industrial and manufacturing and sectors work slightly longer hours per week.
37
38
39
40
41
42
43
44
45
46
Sector
Avg
. N
o.
Ho
urs
publ
ic a
nd third
secto
r
busin
ess s
upport
and pr
ofess
ional s
ervic
es
scien
tific
and li
fe sc
iences
digita
l and c
reativ
e indust
ries
ener
gy
built
enviro
nment
indust
rial,
manufactu
ring a
nd logist
ics
consumer
products
and se
rvic
es

North East Salary Survey 2016 09
In the 2016 survey, we added a question that asked people what they would ideally change in order to improve their work life balance. Cross checking the results against job satisfaction, it becomes clear that the majority of people who are dissatisfied with their job would ideally like to reduce their working hours. Where respondents highlighted other issues, the keys things mentioned were that people would prefer less stress and a greater ability to work from home.
Level of satisfaction
% o
f re
spo
nd
ents
0
10
20
30
40
50
60
70
verysatisfied
all moderatelysatisfied
satisfied moderatelydissatisfied
verydissatisfied
other
nothing
working hours
personal commitments
commuting time
2.2 Ideal changes in order to improve work life balance
10 North East Salary Survey 2016
0
5
10
15
20
25
30
35
40
verysatisfied
moderatelysatisfied
satisfied moderatelydissatisfied
verydissatisfied
Level of satisfaction
% o
f re
spo
nd
ents
executive
management
non management
all
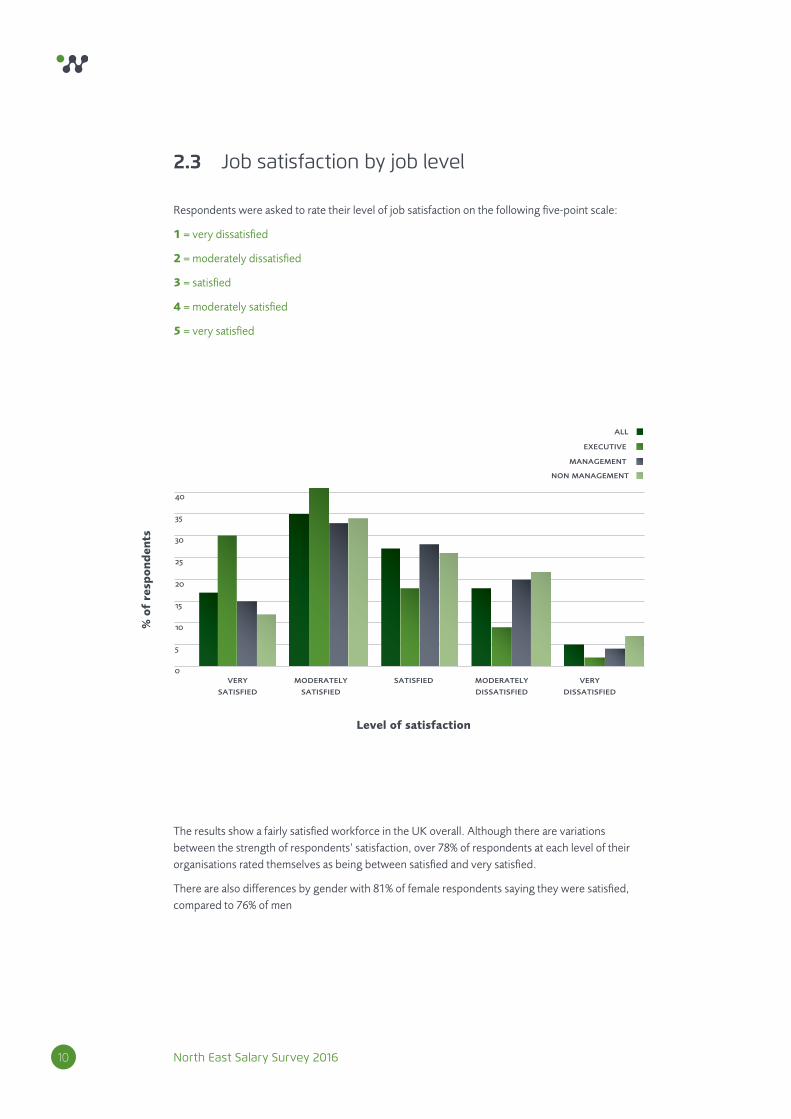
The results show a fairly satisfied workforce in the UK overall. Although there are variations between the strength of respondents’ satisfaction, over 78% of respondents at each level of their organisations rated themselves as being between satisfied and very satisfied.
There are also differences by gender with 81% of female respondents saying they were satisfied, compared to 76% of men
Respondents were asked to rate their level of job satisfaction on the following five-point scale:
1 = very dissatisfied
2 = moderately dissatisfied
3 = satisfied
4 = moderately satisfied
5 = very satisfied
2.3 Job satisfaction by job level

North East Salary Survey 2016 11
Level of satisfaction
% o
f re
spo
nd
ents
0
5
10
15
20
25
30
35
40
verysatisfied
moderatelysatisfied
satisfied moderatelydissatisfied
verydissatisfied
support services
operations
commercial
executive
all
Below executive level, those working in commercial roles are the least satisfied. For example, 28% of respondents working in marketing said that they were dissatisfied compared to only 19% in supply chain and procurement.
2.4 Job satisfaction by discipline
Executive = Board level
Commercial = Sales, Marketing & Business Development
Operations = Engineering, Supply Chain & Manufacturing
Support Services = HR, IT & Finance

12 North East Salary Survey 2016
Respondents were asked to select the top three factors that would motivate them to change jobs, both within their current company (internally) and to another organisation (externally). It is perhaps no surprise that the three most popular influencing factors are quite closely linked – one leading to the other in most cases. These were increased remuneration, new challenges and promotion.
0
10
20
30
40
50
60
70
80
Factor
% o
f re
spo
nd
ents
internal
external
change disc
iplin
e
change locatio
n
flex
ible w
orkin
g
gain n
ew sk
ills
differ
ent e
nvironmen
t/cult
ure
achieve a
n impr
oved w
ork-li
fe ba
lance
promotio
n
new c
hallen
ges
incre
ased re
muneratio
n
2.5 Factors influencing a change of roles

North East Salary Survey 2016 13
Respondents were asked to select all methods that they would utilise when looking for a new role. As the respondents surveyed were mainly people already known to Nigel Wright Recruitment, it is no surprise that within the top three methods were our website and using a recruitment consultancy. Social networking is also an increasingly important method for job seekers.
0
10
20
30
40
50
60
70
80
executive
management
non management
Method
% o
f re
spo
nd
ents
nigel
wrig
ht rec
ruitm
ent w
ebsit
e
socia
l net
work
ing si
tes
other
recru
itmen
t consu
ltancies
direct a
ppro
aches to
empl
oyers
online j
ob board
s
inte
rnal b
ullet
in bo
ards/
empl
oyer i
ntranet
s
regio
nal or l
ocal new
spape
rs
trade m
agazines
2.6 Methods used to search for a new role

14 North East Salary Survey 2016
0
5
10
15
20
25
30
35
40
Factor
% o
f re
spo
nd
ents
recru
it fe
wer
not pla
nning to
recru
it
don’t know
recru
it more
no change i
n recru
itmen
t lev
els
0
10
20
30
40
50
60
70
80
90
Factor
% o
f re
spo
nd
ents
in companies that will recruit more
all
competit
ion fr
om oth
er em
ploye
rs
immig
ratio
n rest
rictio
ns
short
age of s
uitabl
e candid
ates
applic
ants w
ith u
nrealis
tic sa
lary
require
ments
Over a third of respondents (35%) said that they expected their company to recruit more people in the next 12 months. A quarter believe their company will either recruit fewer people (14%) or have no plans to recruit (11%).
When asking respondents about challenges that their company would expect to encounter when recruiting staff over the next 12 months; over half (53%) cited a shortage of suitable candidates followed by competition from other employers (38%). In companies that are planning to recruit more people, these two challenges are exacerbated, with candidate shortage being a problem for 80% of firms.
2.7 Hiring intentions of company
2.7.2 – Challenges
2.7.1 – Hiring intentions

North East Salary Survey 2016
. Salary, benefits and bonuses

16 North East Salary Survey 2016
This section presents information from respondents from all disciplines and levels on their salary, benefits and bonuses.
Salaries have increased, on average, by 3% during the last 12 months. This is in line with expectations outlined in last year’s report and a clear indication of improving market conditions.
0
5
10
15
20
25
Basic Salary (£)
% o
f re
spo
nd
ents
permanent
non permanent
LESS
THAN
£19
,999
£20,0
00 – £29
,999
£30,0
00 – £39
,999
£40,000 –
£49,999
£50,0
00 – £59
,999
£60,0
00 – £69
,999
£70,0
00 – £79
,999
£80,0
00 – £89
,999
£90,0
00 – £99
,999
£100,0
00 OR MO
RE
3.1 Basic salary excluding benefits or bonus by type of employment

North East Salary Survey 2016 17
The average basic daily rate for respondents working in non-permanent employment is £340. Interim candidates (£375) on average tend to earn more followed by contractors (£340) and temps (£160). Nigel Wright Recruitment interim candidates are typically IT executives or CEOs of SMEs. Our temp candidates, in the main, are HR, sales and marketing professionals whereas our contractors tend to work in finance, IT and operations across all levels.
Daily Rate (£)
% o
f re
spo
nd
ents
interim
contract
temp
0
5
10
15
20
25
30
35
40
>£74
£75 –
£119
£120 –
£149
£150 –
£199
£200 –
£299
£300 –
£349
£350 –
£399
£400 – £499
£500+
3.2 Basic daily rate for non permanent employment

18 North East Salary Survey 2016
The results above are taken from our extensive database of candidates. They highlight the differences in salaries received by respondents fulfilling different, generic roles, within their companies and/or organisations. A more detailed analysis of job titles in relation to function start in Section 4. The average C Suite* salary was £132,000. On average, directors are earning £76,000 whereas functional heads are earning £64,000.
*C-suite refers to titles starting with Chief that are regularly shortened to initials such as CEO, CIO, COO, CTO.
3.3 Basic salary by generic job title
Job Title Range Average Basic Salary
C-Suite £85,000-£300,000 £132,000
Director £45,000-£200,000 £76,000
Head of £43,000-£100,000 £64,000
Manager £33,000-£80,000 £47,000
Engineer £30,000-£70,000 £45,000
Controller £28,000-£95,000 £45,000
Accountant £21,000-£57,000 £34,000
Developer £22,000-£45,000 £33,000
Coordinator £22,000-£30,000 £24,000
Assistant/Administrator £18,000-£25,000 £21,000

North East Salary Survey 2016 19
As part of their last salary review respondents received, on average, a 3% increase. The majority (63%) of respondents received between 1% and 5%, and only 5% received a pay increase of 11% or more. Analysed by job level, executives received a higher pay increase than others, with 10% reporting a salary increase of over 11%.
% Salary Increase
% o
f re
spo
nd
ents
executive
management
non-management
0
5
10
15
20
25
30
35
40
00-2 3-5 6-
10 11+
3.4 Average percentage of salary increase received
20 North East Salary Survey 2016
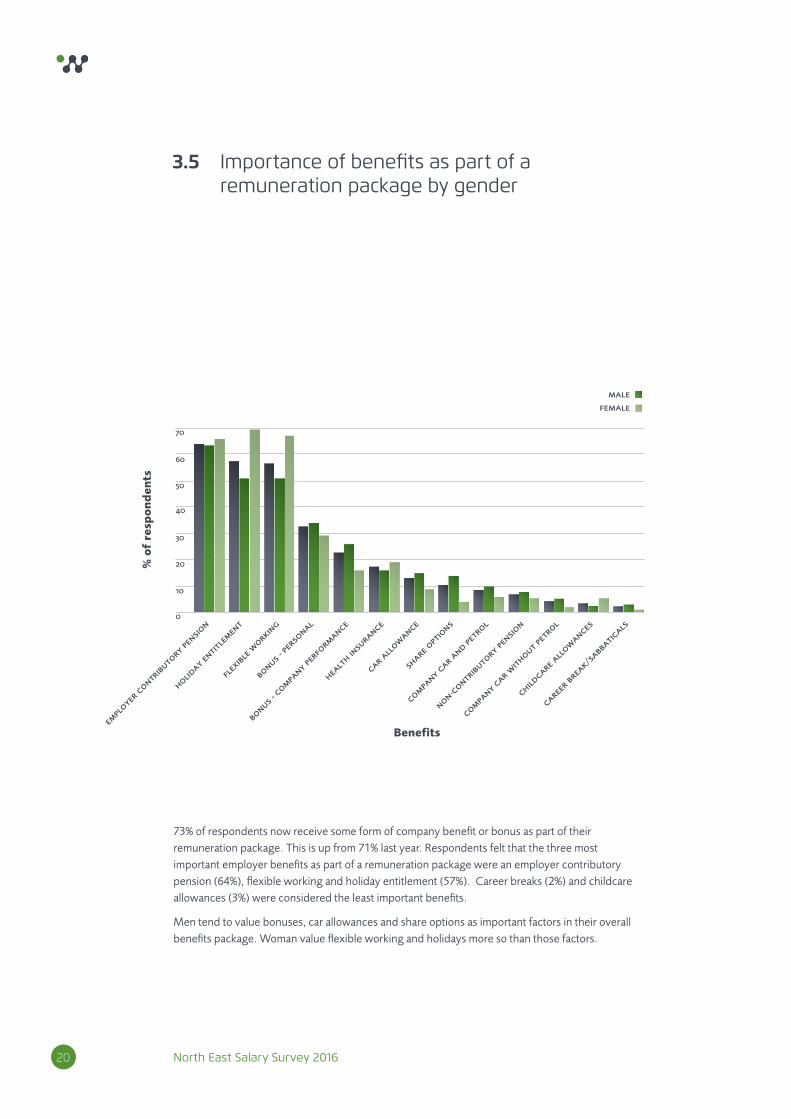
73% of respondents now receive some form of company benefit or bonus as part of their remuneration package. This is up from 71% last year. Respondents felt that the three most important employer benefits as part of a remuneration package were an employer contributory pension (64%), flexible working and holiday entitlement (57%). Career breaks (2%) and childcare allowances (3%) were considered the least important benefits.
Men tend to value bonuses, car allowances and share options as important factors in their overall benefits package. Woman value flexible working and holidays more so than those factors.
0
10
20
30
40
50
60
70
% o
f re
spo
nd
ents
Benefitsem
ploye
r contr
ibuto
ry pe
nsion
holiday e
ntitle
ment
flex
ible w
orkin
g
bonus -
pers
onal
bonus -
compa
ny per
form
ance
healt
h insu
rance
car all
owance
share
opt
ions
company c
ar and pe
trol
non-contr
ibuto
ry pe
nsion
company c
ar with
out pet
rol
childcare
all
owances
career
brea
k/sabb
aticals
malefemale
all
3.5 Importance of benefits as part of a remuneration package by gender

North East Salary Survey 2016 21
70% of people say that their company offers at least one option of flexible working. Most common was part-time (42%) followed by flexi-time (39%) and working from home (38%).
The women in our survey are more likely to work for organisations that offer them some form of flexible working (78%) than men (67%).
0
10
20
30
40
50
60
70
% o
f re
spo
nd
ents
Working options
part
-tim
e work
ing
flex
ii-tim
e
job s
haring
work
ing fr
om home
compres
sed h
ours
term
-tim
e work
ing
annual hours
none
male
all
female
3.6 Flexible working options offered by organisations

North East Salary Survey 2016
Analysis of salaries in relation to discipline

North East Salary Survey 2016 23
The salaries shown above are taken from our extensive range of executive level candidates based in the North
East. At this level, titles will indicate the size of the company. For example, small companies are less likely to
employ C-Suite officers, whereas managing directors will be found in companies of all sizes.
4.1 Executive/Board level
* Public sector and not for profit NED salaries range from between £5,000 and £15,000, the majority of which
fall at the bottom end of the range. Private sector NED salaries, on the other hand, range from between
£20,000 and £50,000 depending on ownership (i.e. Private Equity). PLC NEDs also earn more than those
employed in privately owned businesses.
Job Title Range Average Basic Salary
Chairman/ President £100,000-£300,000 £157,000
CEO (Chief Executive Officer) £90,000-£277,000 £154,000
CIO (Chief Information Officer) £82,000-£180,000 £130,000
COO (Chief Operating Officer) £70,000-£170,000 £120,000
CMO (Chief Marketing Officer) £90,000-£150,000 £120,000
CFO (Chief Financial Officer) £60,000-£110,000 £106,000
GM (General Manager) £65,000-£200,000 £106,000
VP (Vice President) £70,000-£175,000 £103,000
MD (Managing Director) £60,000-£222,000 £90,000
NED (Non- Executive Director)* £5000-£50,000+ £15,000
24 North East Salary Survey 2016
BASIC SALARYIn our 2016 salary survey, we asked executive and board level respondents to provide information about their basic salary:
Basic salary, excluding benefits
41% of respondents are either satisfied or moderately satisfied with their current remuneration. Forty-four percent are very satisfied and only 2% of respondents are very dissatisfied.
Salary increase received and expected
60% of respondents at executive and board level received between a 1% and 5% increase in their last salary review. The same percentage (60%) were expecting to receive the same percentage value as part of their next review. On average, the last pay increase was 4.9%.
BENEFITSAt executive and board level, 85% of respondents receive some form of company benefit or bonus as part of their remuneration package.
Car allowance
76% of respondents at executive and board level are entitled to a car allowance or loan. Forty-nine percent of those receive between £6,000 and £15,000 with 5% receiving more than £25,000. The average is 11%.
Annual leave
49% of executive and board level respondents take between 21 and 25 days leave per year. Fifty-one percent take more than 25 days.
Healthcare
78% of executive and board level respondents are entitled to a healthcare allowance of which 81% have cover that includes themselves and family members.
Pension
49% of executive and board level respondents have been paying into a pension fund for over five years, with 25% for less than two years. Forty-eight percent receive over 7% contributions from their employer. Just over a quarter (27%) receive in excess of 11% contributions from their employer. Typically, executive and board level respondents will contribute between 6% and 10% into their company pension fund.

North East Salary Survey 2016 25
BONUSESGuaranteed bonus
10% of respondents at executive and board level receive a guaranteed bonus. This ranged from between 6% and 25%.
Company performance related bonus
63% of respondents at executive and board level receive a company performance related bonus. Just under a third (29%) received between 6% and 20% in their last bonus and 30% are expecting to receive between 21% and 40% in their next bonus.
Personal performance related bonus
35% of respondents at executive and board level receive a personal performance related bonus. Just over a fifth (21%) received under 10% in their last bonus, while the minority of executives (15%) received over 11%.
VIEWSSkills shortages
At executive and board level, respondents highlighted that having the right personality (60%) and commercial acumen (58%), were the two key attributes that people often lack at the top.
Qualities required to be successful
To be successful at executive and board level, in the main, respondents indicated that a mix of good communication skills (83%), confident/self-assured (79%) and being flexible and adaptable (75%) are essential.
Importance of benefits
Respondents at executive and board level considered an employer contributory pension (54%), having a company bonus (46%) and a personal bonus (46%) to be the three most important benefits.

26 North East Salary Survey 2016
4.2 Finance and Accountancy
Job Title Range Average Basic Salary
Group Finance Director £55,000-£250,000 £125,000
Chief Operating Officer £70,000-£170,000 £120,000
Chief Finance Officer £60,000-£110,000 £106,000
Finance Director £40,000-£155,000 £72,000
Interim Financial Controller £35,000-£98,000 £59,000
Group/Senior Financial Controller £25,000-£90,000 £59,000
Finance Controller £25,000-£104,000 £52,000
Assistant Financial Controller £25,000-£42,000 £34,000
FP&A Manager £46,000-£75,000 £60,000
Business Partner - FP&A £52,000-£63,000 £58,000
Senior/Group Finance Manager £40,000-£70,000 £55,000
Finance Manager £24,000-£70,000 £43,000
Finance Business Partner £30,000-£68,000 £46,000
Senior/Group Accountant £25,000-£60,000 £43,000
Assistant Finance Manager £33,000-£42,000 £37,000
Financial Accountant £25,000-£65,000 £40,000
Company Accountant £21,000-£50,000 £39,000
Interim Accountant £21,000-£55,000 £37,000
Management Accountant £21,000-£57,000 £34,000
Accountant £21,000-£55,000 £33,000
Assistant Accountant £21,000-£46,000 £25,000
Senior Finance Analyst £45,000-£62,000 £51,000
European Analyst £32,000-£48,000 £42,000
Financial Analyst £21,000-£47,000 £33,000
Accounts Receivable Manager £35,000-£45,000 £39,000
Accounts Payable Manager £25,000-£43,000 £38,000
General Ledger Accountant £24,000-£46,000 £35,000
Accounts Receivable Supervisor £23,000-£29,000 £26,000
Accounts Payable Supervisor £21,000-£30,000 £26,000
Purchase or Sales Ledger Supervisor £21,000-£25,000 £23,000
Accounts Payable Clerk £22,000-£30,000 £26,000
Purchase or Sales Ledger Clerk £21,000-£21,000 £21,000
4.2.1 – Industry and commerce

North East Salary Survey 2016 27
Job Title Range Average Basic Salary
Payroll Manager £22,000-£54,000 £33,000
Payroll Supervisor £21,000-£35,000 £27,000
Payroller £21,000-£30,000 £24,000
Credit Manager £22,000-£78,000 £40,000
Credit Supervisor £24,000-£35,000 £27,000
Credit Controller £21,000-£32,000 £24,000
4.2.1 – Industry and commerce
Job Title Range Average Basic Salary
Audit
Director - Audit £45,000-£120,000 £95,000
Senior Manager - Audit £48,000-£65,000 £57,000
Audit Manager £35,000-£45,000 £43,000
Assistant Manager - Audit £33,000-£40,000 £36,000
Senior Auditor (Qualified) £26,000-£35,000 £36,000
Tax
Director - Tax £45,000-£110,000 £63,000
Senior Tax Manager £40,000-£65,000 £49,000
Tax Manager £30,000-£60,000 £39,000
Tax Senior £22,000-£38,000 £32,000
Corporate Finance
Director - Corporate Finance £60,000-£100,000 £80,000
Corporate Finance Senior Manager £55,000-£70,000 £53,000
Corporate Finance Manager £40,000-£70,000 £49,000
Corporate Finance Executive £30,000-£42,000 £32,000
General Practice
Director - General Practice £45,000-£90,000 £80,000
Manager - General Practice £40,000-£60,000 £50,000
Senior Manager - General Practice £30,000-£55,000 £37,000
Qualified senior - General Practice £25,000-£35,000 £32,000
4.2.2 – Professions
Salary ranges are broad and reflect the wide range of companies within the North East. These results should
therefore only be used as a guide.
28 North East Salary Survey 2016
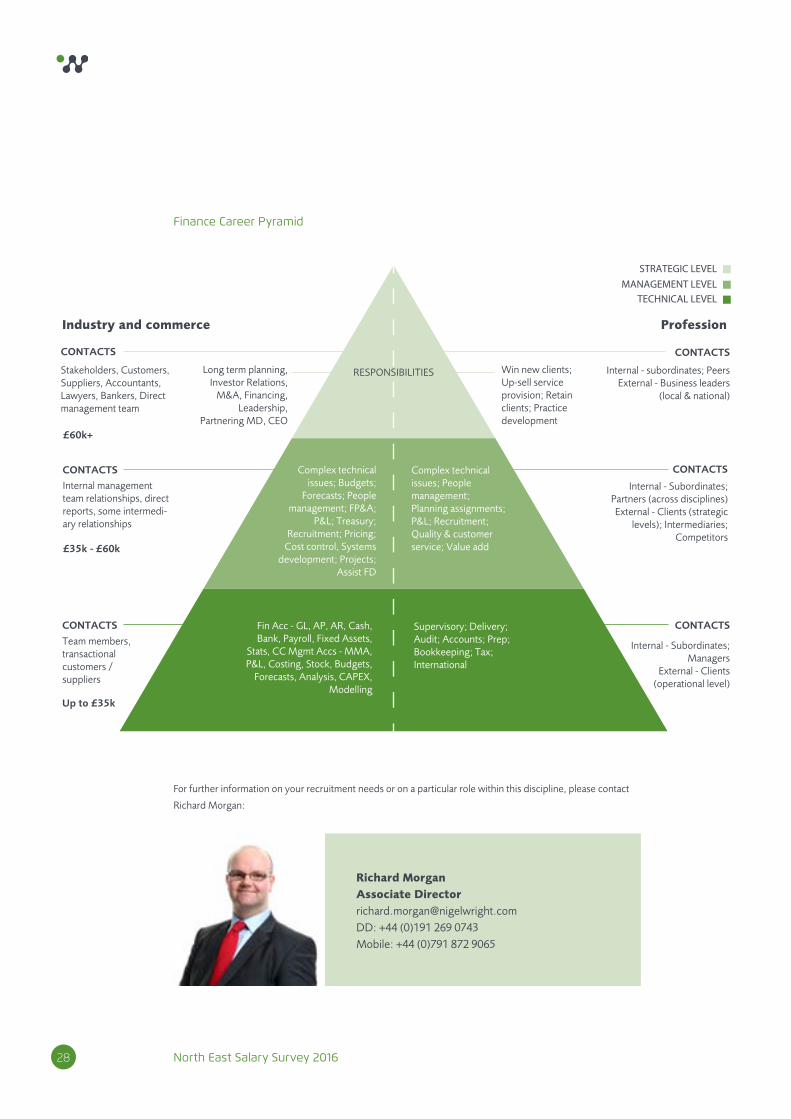
For further information on your recruitment needs or on a particular role within this discipline, please contact
Richard Morgan:
Richard Morgan Associate Director [email protected] DD: +44 (0)191 269 0743 Mobile: +44 (0)791 872 9065
Industry and commerce Profession
CONTACTS
RESPONSIBILITIESStakeholders, Customers, Suppliers, Accountants, Lawyers, Bankers, Direct management team
Long term planning, Investor Relations,
M&A, Financing, Leadership,
Partnering MD, CEO
CONTACTS
Internal - subordinates; PeersExternal - Business leaders
(local & national)
CONTACTS
Internal management team relationships, direct reports, some intermedi-ary relationships
CONTACTS
Internal - Subordinates; Partners (across disciplines)External - Clients (strategic
levels); Intermediaries; Competitors
CONTACTS
Team members, transactional customers / suppliers
CONTACTS
Internal - Subordinates; Managers
External - Clients (operational level)
STRATEGIC LEVELMANAGEMENT LEVEL
TECHNICAL LEVEL
Win new clients; Up-sell service provision; Retain clients; Practice development
Complex technical issues; Budgets;
Forecasts; People management; FP&A;
P&L; Treasury; Recruitment; Pricing;
Cost control, Systems development; Projects;
Assist FD
Complex technical issues; People management; Planning assignments; P&L; Recruitment; Quality & customer service; Value add
Supervisory; Delivery; Audit; Accounts; Prep; Bookkeeping; Tax; International
Fin Acc - GL, AP, AR, Cash, Bank, Payroll, Fixed Assets,
Stats, CC Mgmt Accs - MMA, P&L, Costing, Stock, Budgets,
Forecasts, Analysis, CAPEX, Modelling
£35k - £60k
£60k+
Up to £35k
Finance Career Pyramid

North East Salary Survey 2016 29
4.3 Human Resources
Job Title Range Average Basic Salary
HR Directors
European HR Director £62,000-£130,000 £95,000
Director of People £52,000-£175,000 £90,000
HR Director £48,000-£150,000 £81,000
Interim HR Director £60,000-£80,000 £72,000
Assistant Director of HR £50,000-£90,000 £64,000
HR Head /Partner
Head of HR - Europe £50,000-£85,000 £68,000
Head of HR £48,000-£80,000 £65,000
Senior HR Business Partner £45,000-£78,000 £59,000
HR Business Partner £30,000-£60,000 £43,000
HR Managers
Group HR Manager £32,000-£60,000 £47,000
Interim HR Manager £33,000-£80,000 £46,000
Senior HR Manager £35,000-£67,000 £46,000
Regional HR Manager £40,000-£57,000 £45,000
HR Manager £30,000-£60,000 £41,000
HR Controller £26,000-£65,000 £39,000
Interim HR Consultant £35,000-£65,000 £45,000
HR Consultant £15,000-£88,000 £41,000
HR Officer/Advisors
Senior HR Advisor/Officer £30,000-£35,000 £35,000
HR Team Leader £22,000-£42,000 £30,000
Regional HR Advisor £28,000-£40,000 £33,000
HR Advisor/Officer £25,000-£35,000 £29,000
Interim HR Advisor/Officer £25,000-£35,000 £29,000
HR Coordinator £22,000-£30,000 £24,000
HR Assistant/Administrator £18,000-£23,000 £21,000
30 North East Salary Survey 2016
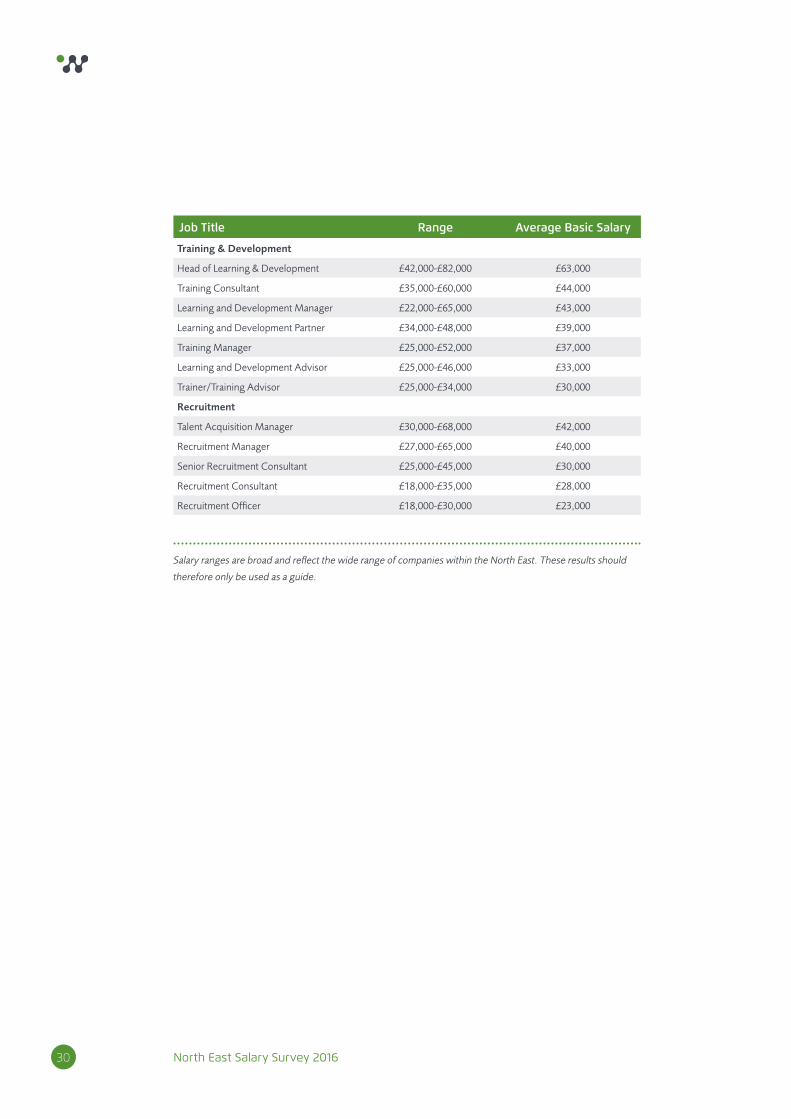
Salary ranges are broad and reflect the wide range of companies within the North East. These results should
therefore only be used as a guide.
Job Title Range Average Basic Salary
Training & Development
Head of Learning & Development £42,000-£82,000 £63,000
Training Consultant £35,000-£60,000 £44,000
Learning and Development Manager £22,000-£65,000 £43,000
Learning and Development Partner £34,000-£48,000 £39,000
Training Manager £25,000-£52,000 £37,000
Learning and Development Advisor £25,000-£46,000 £33,000
Trainer/Training Advisor £25,000-£34,000 £30,000
Recruitment
Talent Acquisition Manager £30,000-£68,000 £42,000
Recruitment Manager £27,000-£65,000 £40,000
Senior Recruitment Consultant £25,000-£45,000 £30,000
Recruitment Consultant £18,000-£35,000 £28,000
Recruitment Officer £18,000-£30,000 £23,000

North East Salary Survey 2016 31
For further information on your recruitment needs or on a particular role within this discipline, please contact
Sue O’Donovan:
Sue O’Donovan Managing Consultant [email protected] DD: +44 (0)191 269 0778 Mobile: +44 (0)784 332 9390
HR DirectorStrategy /
Legal firms / Lead team restructure
Reporting into CEO / MD or Group FD
Head of RecruitmentHead of Learning &
DevelopmentHead of HR Business
Partners
HR Business PartnersRegional HR Manager
RecruitmentConsultant£25k - £35k
£35k - £55k
£50k - £70k
£60k +
£18k - £23k
Head of HRLeading union negotiations /
restructures / Talent & succession / Tribunals / Complex employee
relations / Strategy
HR ManagersSenior recruitment / Union negotiations / Pay &
benefits / Restructures / Complex cases / Talent management / Succession planning /
Strategy / Monitor performance
HR Advisor / OfficerPolicy / Line manage / Recruitment / Advice /
Monitor performance / Interact with union reps / Interviewing / Training / Contracts
HR Administrator / AssistantLetters / Provide basic advice / Data input / Pull up reports / Coordinate meetings / Agency workers policy / Admin/ Monitor absence/ Meeting
minutes / Contracts / Recruitment / Holidays / Inductions
Typical salary Peers
HR Career Pyramid

32 North East Salary Survey 2016
4.4 Information Technology
Job Title Range Average Basic Salary
Global IT Director £84,000-£160,000 £110,000
IT Director £65,000-£150,000 £89,000
Senior Consultant £70,000-£140,000 £88,000
Senior IT Manager £37,000-£110,000 £73,000
Chief Technology Officer £63,000-£75,000 £69,000
Head of IT £43,000-£92,000 £64,000
Global IT Manager £48,000-£80,000 £62,000
IT Manager £46,000-£110,000 £61,000
Project
Project Director £65,000-£67,000 £66,000
Infrastructure Project Manager £61,000-£63,000 £62,000
Senior Project Manager £39,000-£80,000 £55,000
Digital Project Manager £38,000-£65,000 £50,000
Project Manager £25,000-£84,000 £43,000
Project Lead £30,000-£40,000 £37,000
Project Analyst £30,000-£38,000 £34,000
Project Officer £24,000-£39,000 £31,000
Programme
Programme Manager £40,000-£120,000 £65,000
Head of Programmes £50,000-£57,000 £54,000
C# Programmer £45,000-£45,000 £45,000
Programmer £26,000-£43,000 £33,000
Security
Security Manager £35,000-£180,000 £67,000
Security Analyst £33,000-£49,000 £41,000
IT Security Officer £22,000-£35,000 £28,000
Infrastructure
Infrastructure Project Manager £50,000-£63,000 £58,000
Infrastructure Delivery Team Leader £45,000-£48,000 £47,000
Infrastructure Systems Manager £28,000-£55,000 £44,000
Senior Infrastructure Analyst £30,000-£43,000 £38,000
Infrastructure Analyst £24,000-£40,000 £33,000
Infrastructure Support £26,000-£27,000 £27,000

North East Salary Survey 2016 33
Job Title Range Average Basic Salary
Enterprise Architect £57,000-£85,000 £70,000
Architect £45,000-£94,000 £61,000
Head of Product Development £31,000-£85,000 £58,000
Development Manager £34,000-£60,000 £49,000
Development Team Lead £37,000-£56,000 £48,000
Lead Developer £28,000-£53,000 £37,000
Senior Developer £24,000-£55,000 £37,000
Developers
Java J2EE £18,000-£61,000 £42,000
C#, ASP, .NET, VB £18,000-£60,000 £35,000
Javascript/HTML/CSS £18,000-£55,000 £35,000
PHP/MySQL £18,000-£50,000 £34,000
Test Manager £33,000-£55,000 £44,000
Senior Software Tester £26,000-£41,000 £35,000
Test Lead £29,000-£36,000 £33,000
Test Analyst £20,000-£42,000 £30,000
Salary ranges are broad and reflect the wide range of companies within the North East. These results should
therefore only be used as a guide.
34 North East Salary Survey 2016
For further information on your recruitment needs or on a particular role within this discipline, please contact
Sue Ormerod:
Sue Ormerod Associate Director - IT & HR [email protected] DD: +44 (0)191 269 0722 Mobile: +44 (0)791 873 3904
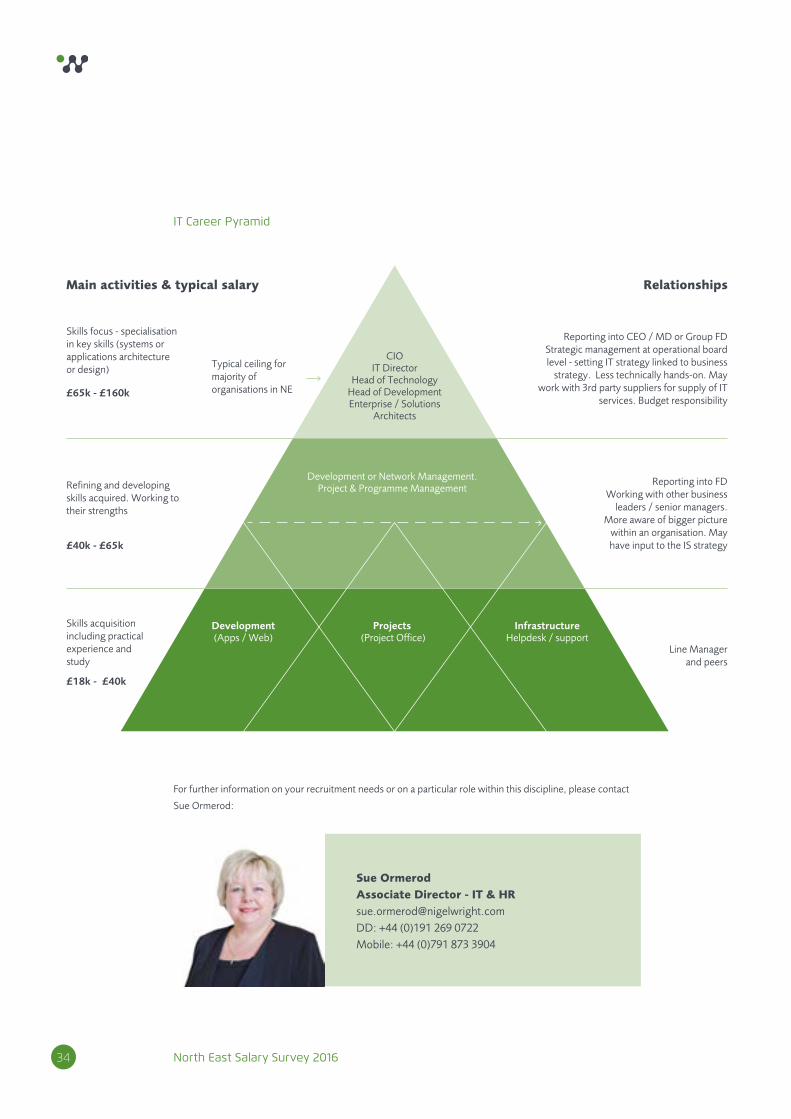
Skills focus - specialisation in key skills (systems or applications architecture or design)
Reporting into CEO / MD or Group FD Strategic management at operational board level - setting IT strategy linked to business
strategy. Less technically hands-on. May work with 3rd party suppliers for supply of IT
services. Budget responsibility
Reporting into FDWorking with other business
leaders / senior managers. More aware of bigger picture
within an organisation. May have input to the IS strategy
Line Manager and peers
CIOIT Director
Head of TechnologyHead of Development Enterprise / Solutions
Architects
£40k - £65k
£65k - £160k
£18k - £40k
Development or Network Management. Project & Programme Management
Development(Apps / Web)
Projects (Project Office)
InfrastructureHelpdesk / support
Main activities & typical salary Relationships
Typical ceiling for majority of organisations in NE
Refining and developing skills acquired. Working to their strengths
Skills acquisition including practical experience and study
IT Career Pyramid

North East Salary Survey 2016 35
4.5 Supply Chain
Job Title Range Average Basic Salary
Supply Chain
VP Supply Chain £80,000-£150,000 £115,000
Supply Chain Director £65,000-£110,000 £81,000
International Supply Chain Director £70,000-£109,000 £91,000
International Head of Supply Chain £70,000-£90,000 £75,000
Head of Supply Chain £32,000-£80,000 £55,000
International Supply Chain Manager £50,000-£70,000 £62,000
Supply Chain Manager £37,000-£60,000 £47,000
Materials Manager £56,000-£56,000 £53,000
Commodity Manager £35,000-£55,000 £42,000
Material Controller £22,000-£40,000 £28,000
Supply Chain Coordinator £20,000-£40,000 £31,000
Supply Chain Administrator £18,000-£26,000 £22,000
Procurement
Procurement Director £65,000-£120,000 £80,000
Head of Procurement £40,000-£90,000 £62,000
Senior Procurement Manager £45,000-£75,000 £53,000
Procurement Specialist £25,000-£70,000 £40,000
Project Procurement Manager £50,000-£65,000 £61,000
Procurement Manager £20,000-£60,000 £42,000
Procurement Category Manager £35,000-£60,000 £47,000
Senior Buyer £25,000-£45,000 £35,000
Buyer £18,000-£42,000 £28,000
Project Buyer £24,000-£40,000 £30,000
Commodity Buyer £20,000-£38,000 £31,000
Lead Buyer £28,000-£35,000 £33,000
Procurement Coordinator £25,000-£30,000 £27,000
Procurement Officer £20,000-£27,000 £25,000
Junior Buyer £17,000-£27,000 £21,000
Procurement Assistant £16,000-£25,000 £20,000

36 North East Salary Survey 2016
Job Title Range Average Basic Salary
Logistics
Planning Manager £36,000-£70,000 £48,000
Logistics Manager £32,000-£65,000 £44,000
Warehouse Operations Manager £26,000-£55,000 £41,000
Warehouse Project Manager £25,000-£50,000 £39,000
Transport Manager £24,000-£45,000 £35,000
Warehouse Manager £20,000-£45,000 £34,000
Warehouse Shift Manager £33,000-£40,000 £36,000
Transport Planner £23,000-£35,000 £28,000
Depot Manager £30,000-£34,000 £32,000
Planning
Senior Manager - Production Control £60,000-£65,000 £62,000
Senior Production Planner £31,000-£35,000 £34,000
Production Control Manager £28,000-£50,000 £40,000
Lead Planner £28,000-£28,000 £28,000
Senior Materials Planner £26,000-£35,000 £31,000
Production Controller £25,000-£41,000 £31,000
Transport Planner £23,000-£35,000 £28,000
Demand Planner £22,000-£29,000 £27,000
Production Planner £17,000-£40,000 £29,000
Materials Planner £17,000-£33,000 £26,000
Salary ranges are broad and reflect the wide range of companies within the North East. These results should
therefore only be used as a guide.

North East Salary Survey 2016 37
For further information on your recruitment needs or on a particular role within Supply Chain and Procurement,
please contact Peter Stephenson:
Peter Stephenson Managing Consultant [email protected] DD: +44 (0)191 269 0709 Mobile: +44 (0)791 875 8035
Strategic management at operational board level.
Budget responsibility
Reporting into CEO / MD or FD
Working with other business leaders / senior managers.
More aware of bigger picture within an organisation
Reporting to Director
VPDirector of
Supply Chain
Supply Chain and / or Procurement Director
£35k - £70k
£65k - £160k
£18k - £40k
Senior Manager
Manager / Head
LogisticsWarehousing
TransportExport / Import
Planning & Logistics Team Leader
Planning & Logistics tend to go hand in hand
ProcurementTeam Leader
Planning Supply (transactional)Demand (forecasting
and data analysis
ProcurementPurchase (transactional)
Procurement (forecasting and
data analysis
Main activities & typical salary Relationships
Long-term business planning, risk management, sustainability, budget management
Defining department objectives and ensuring team is aligned towards delivery of those objectives
Operation focus. Day to day delivery of objectives.Sales acquisition
Suppliers and customers.
3rd party logistics
Line Manager and Peers
Supply Chain Career Pyramid

38 North East Salary Survey 2016
4.6 Manufacturing and Engineering
Job Title Range Average Basic Salary
Plant/ Site Director £80,000-£130,000 £113,000
Operations Director £48,000-£132,000 £75,000
R&D Director £60,000-£89,000 £75,000
Operations Manager £40,000-£113,000 £58,000
Quality Director £60,000-£75,000 £69,000
Quality Manager £30,000-£83,000 £46,000
Quality Engineer £26,000-£46,000 £36,000
Quality Inspector £20,000-£32,000 £28,000
Quality Technician £18,000-£30,000 £24,000
Continuous Improvement Manager £32,000-£68,000 £48,000
Business Improvement Manager £30,000-£65,000 £47,000
Continuous Improvement Engineer £26,000-£45,000 £36,000
Production Manager £30,000-£60,000 £46,000
Production Shift Manager £35,000-£47,000 £41,000
Production Engineer £34,000-£52,000 £40,000
Production Team Leader/Supervisor £23,000-£65,000 £35,000
Production Controller/Coordinator £25,000-£37,000 £30,000
Production Operative £20,000-£23,000 £21,000
Group/Senior Health & Safety Manager £55,000-£150,000 £86,000
Health & Safety Manager £30,000-£72,000 £43,000
Health & Safety Officer/Advisor £24,000-£50,000 £34,000
Head of Manufacturing £52,000-£100,000 £69,000
Manufacturing Manager £35,000-£75,000 £51,000
Manufacturing Engineer £28,000-£38,000 £34,000
Manufacturing Technician £17,000-£40,000 £28,000
Engineering Manager £36,000-£120,000 £53,000
4.6.1 – Manufacturing

North East Salary Survey 2016 39
Job Title Range Average Basic Salary
Chemical & Pharmaceutical
Maintenance Manager £62,000-£62,000 £62,000
Maintenance Technician £23,000-£44,000 £35,000
Maintenance Engineer £28,000-£35,000 £32,000
Automotive
Maintenance Manager £32,000-£82,000 £49,000
Maintenance Engineer £26,000-£41,000 £33,000
Maintenance Technician £20,000-£43,000 £33,000
Food & Drink
Maintenance Manager £33,000-£44,000 £40,000
Maintenance Engineer £25,000-£41,000 £31,000
Maintenance Technician £18,000-£42,000 £27,000
Manufacturing Other
Maintenance Manager £39,000-£69,000 £45,000
Maintenance Engineer £25,000-£45,000 £35,000
Maintenance Technician £20,000-£43,000 £32,000
Salary ranges are broad and reflect the wide range of companies within the North East. These results should
therefore only be used as a guide.

40 North East Salary Survey 2016
Job Title Range Average Basic Salary
Engineering
Technical Director £45,000-£100,000 £53,000
Engineering Manager £45,000-£75,000 £53,000
Principal/Lead Engineer £50,000-£60,000 £51,000
Senior Engineer £42,000-£55,000 £51,000
Engineer £35,000-£45,000 £41,000
Graduate Engineer £20,000-£30,000 £28,000
Electrical & Mechanical*
Engineering/Technical Director £50,000-£130,000 £74,000
Engineering Manager (electrical/mechanical) £45,000-£90,000 £59,000
Principal/Lead Engineer (control systems) £48,000-£70,000 £52,000
Senior Engineer £40,000-£65,000 £47,000
Engineer (electrical & mechanical) £30,000-£60,000 £45,000
Design Engineer (electrical & mechanical) £25,000-£70,000 £36,000
Draughtsman £21,000-£30,000 £26,000
Graduate Engineer £20,000-£32,000 £25,000
Process
Principal/Lead Engineer (process) £53,000-£70,000 £62,000
Senior Process Engineer £45,000-£92,000 £59,000
Process Engineer £25,000-£50,000 £37,000
Chemical Process Engineer £35,000-£35,000 £35,000
Engineering Process Technician £21,000-£21,000 £21,000
Project Engineering
Head of projects £65,000-£90,000 £59,000
Project Manager/Senior PM £48,000-£70,000 £53,000
Senior Project Engineer £40,000-£55,000 £48,000
Project Engineer £30,000-£50,000 £38,000
Project Technician £25,000-£35,000 £30,000
Graduate Project Engineer £25,000-£28,000 £26,000
Engineering Support
Estimator £20,000-£32,000 £26,000
Technical Author £25,000-£30,000 £29,000
Cost Engineer £25,000-£48,000 £35,000
Tendering Engineer £31,000-£50,000 £40,000
*Electrical engineers tend to be paid slightly more than mechanical engineers (5%-7%)
Salary ranges are broad and reflect the wide range of companies within the North East. These results should
therefore only be used as a guide.
4.6.2 – Engineering

North East Salary Survey 2016 41
For further information on your recruitment needs or on a particular role within Manufacturing, Engineering
and Operations, please contact Lisa Taylor:
Lisa Taylor Managing Consultant [email protected] DD: +44 (0)191 269 0685 Mobile: +44 (0)771 413 3486
Engineering Director, Chief Engineer or Programme Director
Member of Professional Body
Institute of Mechanical Engineers
Institute of Electrical Engineers
Or other discipline professional body
Most senior positions require chartered status
DirectorEngineering
Research Production / Operations
£40k - £60k
£100k +
Up to £40k
Time-served apprenticeship path University degree path
£60k - £80k
Technical Manager, Principal Engineer or Programme Manager position
Managing projects, contributing to the design, development, implementation and maintainance phases of the task
Technical / Operational
Research Development RolesOperations Production Roles
Project Leader
Engineering Team LeaderProduction EngineeringEngineering Specialist
Production Roles (5-10 years)(specialising in a specific practical skill)
Graduate TraineeBlue Chip Company (1-2 years)
(learning about different areas of the business in a design and
manufacturing capacity)Modern Apprentice Engineering
Subject (2-4 years)
Product Engineer (2-10 years)
Manufacturing and Engineering Career Pyramid
42 North East Salary Survey 2016
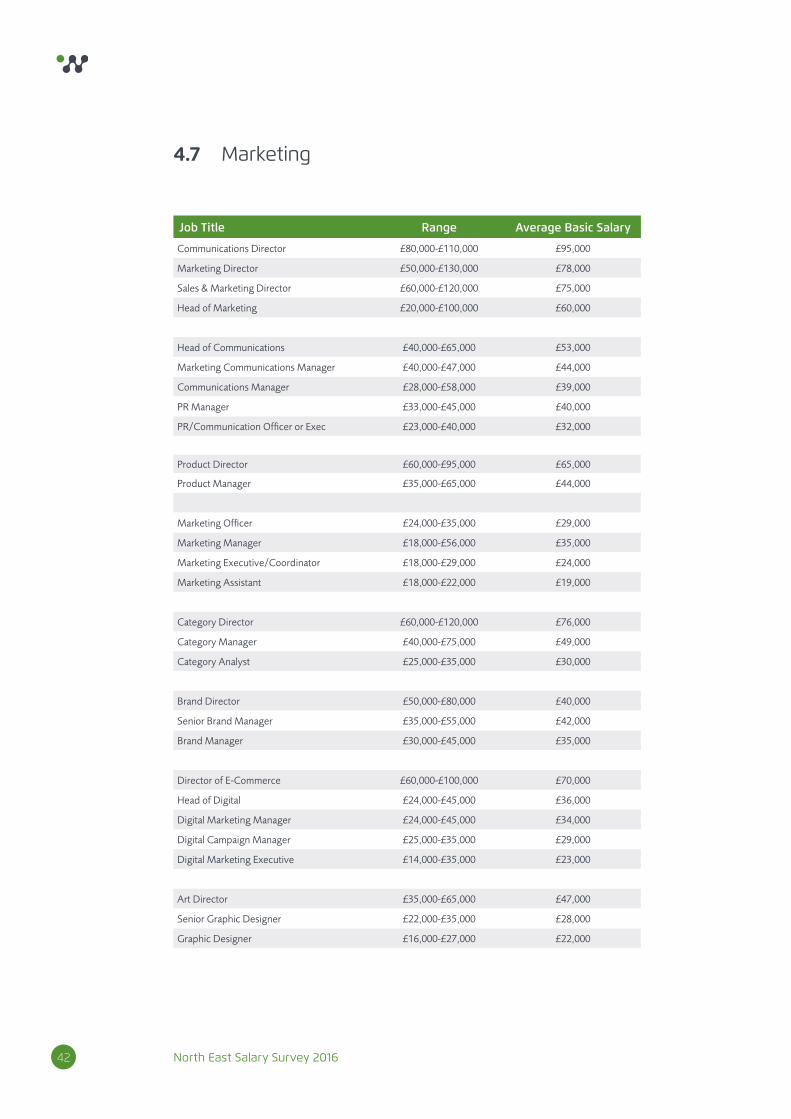
4.7 Marketing
Job Title Range Average Basic Salary
Communications Director £80,000-£110,000 £95,000
Marketing Director £50,000-£130,000 £78,000
Sales & Marketing Director £60,000-£120,000 £75,000
Head of Marketing £20,000-£100,000 £60,000
Head of Communications £40,000-£65,000 £53,000
Marketing Communications Manager £40,000-£47,000 £44,000
Communications Manager £28,000-£58,000 £39,000
PR Manager £33,000-£45,000 £40,000
PR/Communication Officer or Exec £23,000-£40,000 £32,000
Product Director £60,000-£95,000 £65,000
Product Manager £35,000-£65,000 £44,000
Marketing Officer £24,000-£35,000 £29,000
Marketing Manager £18,000-£56,000 £35,000
Marketing Executive/Coordinator £18,000-£29,000 £24,000
Marketing Assistant £18,000-£22,000 £19,000
Category Director £60,000-£120,000 £76,000
Category Manager £40,000-£75,000 £49,000
Category Analyst £25,000-£35,000 £30,000
Brand Director £50,000-£80,000 £40,000
Senior Brand Manager £35,000-£55,000 £42,000
Brand Manager £30,000-£45,000 £35,000
Director of E-Commerce £60,000-£100,000 £70,000
Head of Digital £24,000-£45,000 £36,000
Digital Marketing Manager £24,000-£45,000 £34,000
Digital Campaign Manager £25,000-£35,000 £29,000
Digital Marketing Executive £14,000-£35,000 £23,000
Art Director £35,000-£65,000 £47,000
Senior Graphic Designer £22,000-£35,000 £28,000
Graphic Designer £16,000-£27,000 £22,000

North East Salary Survey 2016 43
Job Title Range Average Basic Salary
Account Director £35,000-£55,000 £39,000
Account Manager £22,000-£40,000 £28,000
Account Executive £14,000-£22,000 £20,000
International Marketing Director £60,000-£140,000 £89,000
International Category Manager £33,000-£80,000 £58,000
International Business Manager £47,000-£75,000 £59,000
International Marketing Manager £32,000-£65,000 £47,000
International Brand Manager £29,000-£55,000 £42,000
International Business Analyst £45,000-£45,000 £45,000
International Product Manager £28,000-£45,000 £39,000
Salary ranges are broad and reflect the wide range of companies within the North East. These results should
therefore only be used as a guide.

44 North East Salary Survey 2016
For further information on your recruitment needs or on a particular role within this discipline, please contact
Ben Debnam:
Ben Debnam Managing Consultant [email protected] DD: +44 (0)191 269 0745 Mobile: +44 (0)771 413 3484
Interface with internal & external, board of directors,
shareholders, customers, trade bodies
Interface with other functional heads, particularly sales and category teams, directors &
externally with customers, agencies, trade bodies
Interface with internal management
(particularly sales) and externally with
customers and agencies
Marketing Director Business Unit Director
Head of Insights
£40k - £80k
£80k+
Up to £40k
Marketing Manager/(Senior) Brand/Product Manager / Category
Manager / Channel Marketing Manager / NPD Manager/ Insights Manager
Marketing Assistant / Assistant Brand Manager / Category Assistant / Assistant
Product Manager
Main activities & typical salary Relationships
Oversee marketing department, set budgets, grow market share, be accountable for brand/product success
Strategic
ManagerialPeople management, P&L responsibility
Managerial
Support and analysis
Technical / Tactical
Marketing Career Pyramid

North East Salary Survey 2016 45
4.8 Sales
Job Title Range Average Basic Salary
Sales Director EMEA £60,000-£140,000 £80,000
Sales/Commercial Director £45,000-£135,000 £73,000
Head of Sales/Senior Sales Manager £40,000-£95,000 £62,000
International Sales Manager £35,000-£75,000 £58,000
Commercial Manager £38,000-£85,000 £54,000
Sales Manager £40,000-£60,000 £46,000
Sales Engineer/Technical Sales Manager £28,000-£50,000 £42,000
Regional/Territory/Field Sales Executive £20,000-£40,000 £37,000
Internal Sales Manager £25,000-£40,000 £29,000
Sales Administrator £20,000-£31,000 £23,000
International Sales Coordinator £17,000-£32,000 £22,000
Sales Executive/Advisor £15,000-£32,000 £25,000
Telesales Executive £17,000-£22,000 £20,000
Internal Sales Coordinator £15,000-£25,000 £19,000
Business Development Director £50,000-£100,000 £66,000
Business Development Manager £30,000-£100,000 £44,000
Business Development Executive £20,000-£28,000 £22,000
Account Director £35,000-£75,000 £57,000
Senior National Account Manager £40,000-£60,000 £54,000
National Account Manager £30,000-£60,000 £47,000
Key Account Manager £25,000-£45,000 £35,000
International Account Manager £20,000-£55,000 £32,000
Account Manager £20,000-£55,000 £30,000
Customer Services Director £50,000-£100,000 £60,000
Customer Services Manager £30,000-£50,000 £35,000
Customer Service Representative £17,000-£26,000 £22,000
Customer Service Advisor £15,000-£25,000 £18,000
Salary ranges are broad and reflect the wide range of companies within the North East. These results should
therefore only be used as a guide.

46 North East Salary Survey 2016
For further information on your recruitment needs or on a particular role within this discipline, please contact
Ben Debnam:
Ben Debnam Managing Consultant [email protected] DD: +44 (0)191 269 0745 Mobile: +44 (0)771 413 3484
Interface internal & external, board of directors, shareholders,
trade bodies, etc
Strategic
Interface internal with other functional heads, directors &
external with customers, suppliers, trade bodies
Managerial
Interface with internal management
and externally with customers.
Technical
Sales DirectorCommercial Director
BU Manager
6 – 12 years’ experience£40k - £80k
12+ years’ experience£80k - £200k
5 – 7 years’experienceUp to £40k
KAM / NAM / BDM / Export Manager / Category Manager / Channel Manager / Field
Sales Manager
Sales Rep / Merchandiser / Forecaster / Key Account Rep / Export Sales Rep
Main activities & typical salary Relationships
Sales Career Pyramid
North East Salary Survey 2016 47
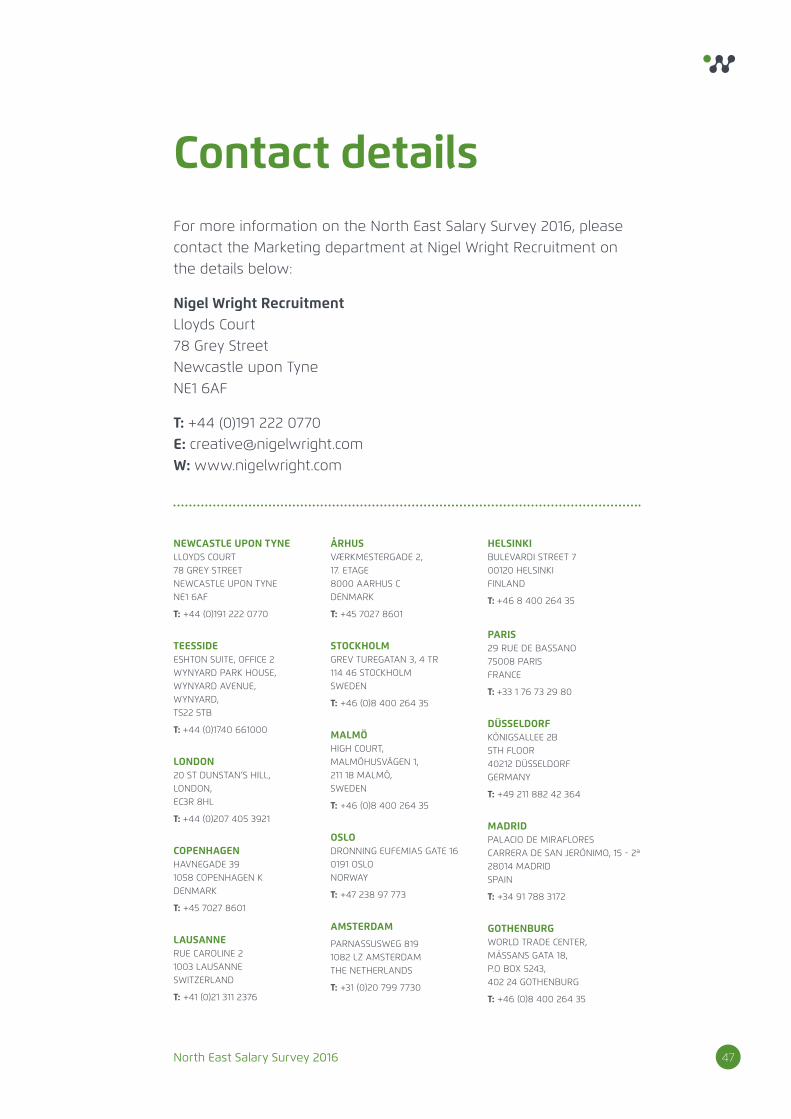
For more information on the North East Salary Survey 2016, please contact the Marketing department at Nigel Wright Recruitment on the details below:
Nigel Wright RecruitmentLloyds Court78 Grey StreetNewcastle upon TyneNE1 6AF
T: +44 (0)191 222 0770E: [email protected]: www.nigelwright.com
Contact details
NEWCASTLE UPON TYNELLOYDS COURT78 GREY STREETNEWCASTLE UPON TYNENE1 6AF
T: +44 (0)191 222 0770
TEESSIDEESHTON SUITE, OFFICE 2WYNYARD PARK HOUSE,WYNYARD AVENUE,WYNYARD,TS22 5TB
T: +44 (0)1740 661000
LONDON20 ST DUNSTAN’S HILL,LONDON,EC3R 8HL
T: +44 (0)207 405 3921
COPENHAGENHAVNEGADE 39 1058 COPENHAGEN KDENMARK
T: +45 7027 8601
LAUSANNERUE CAROLINE 21003 LAUSANNESWITZERLAND
T: +41 (0)21 311 2376
ÅRHUSVÆRKMESTERGADE 2, 17. ETAGE8000 AARHUS CDENMARK
T: +45 7027 8601
STOCKHOLMGREV TUREGATAN 3, 4 TR 114 46 STOCKHOLMSWEDEN
T: +46 (0)8 400 264 35
MALMÖHIGH COURT,MALMÖHUSVÄGEN 1,211 18 MALMÖ,SWEDEN
T: +46 (0)8 400 264 35
OSLODRONNING EUFEMIAS GATE 160191 OSLONORWAY
T: +47 238 97 773
AMSTERDAM
PARNASSUSWEG 819 1082 LZ AMSTERDAM THE NETHERLANDS
T: +31 (0)20 799 7730
HELSINKIBULEVARDI STREET 700120 HELSINKIFINLAND
T: +46 8 400 264 35
PARIS29 RUE DE BASSANO 75008 PARISFRANCE
T: +33 1 76 73 29 80
DÜSSELDORFKÖNIGSALLEE 2B5TH FLOOR40212 DÜSSELDORFGERMANY
T: +49 211 882 42 364
MADRIDPALACIO DE MIRAFLORESCARRERA DE SAN JERÓNIMO, 15 - 2ª28014 MADRIDSPAIN
T: +34 91 788 3172
GOTHENBURGWORLD TRADE CENTER,MÄSSANS GATA 18,P.O BOX 5243,402 24 GOTHENBURG
T: +46 (0)8 400 264 35