North Dakota - State Nutrition, Physical Activity, and Obesity Profile

ALCOHOL, TOBACCO, ILLICIT DRUG AND NONMEDICAL USE OF PRESCRIPTION DRUGPREVALENCE, CONSEQUENCES AND MODIFIABLE RISK FACTORS IN NORTH DAKOTA
EPIDEMIOLOGICAL PROFILE NORTH DAKOTA
Compiled and Developed by:
The North Dakota State Epidemiological Outcomes Workgroup
February 2018

i
Table of Contents Executive Summary .................................................................................................................................. iii
Alcohol.................................................................................................................................................... iii
Tobacco .................................................................................................................................................. iii
Illicit Drugs ........................................................................................................................................... iv
Nonmedical Use of Prescription Drugs ............................................................................................. iv
Introduction ................................................................................................................................................. 1
The State Epidemiological Outcomes Workgroup (SEOW) ............................................................ 1
Purpose of the Profile ........................................................................................................................... 2
Principles of the SEOW ........................................................................................................................ 3
Methods ...................................................................................................................................................... 4
Alcohol in North Dakota: Consumption ................................................................................................ 7
Alcohol Use ............................................................................................................................................. 7
Binge Drinking ..................................................................................................................................... 15
Excess Drinking .................................................................................................................................... 22
Alcohol in North Dakota: Consequences .............................................................................................. 27
Alcohol-Attributed Deaths ................................................................................................................. 27
Alcohol Use Disorder .......................................................................................................................... 30
Impaired Driving after Drinking ....................................................................................................... 33
Alcohol-Related Fatal Crashes .......................................................................................................... 39
Impaired Driving Violations .............................................................................................................. 42
Liquor Law Violation ......................................................................................................................... 46
Consequences of Alcohol on Student Academic Grades ............................................................... 47
Substance Abuse Treatment Admission ........................................................................................... 51
Alcohol in North Dakota: Modifiable Risks ........................................................................................ 57
Source of Alcohol for Youth ............................................................................................................. 57
Community Perception Related to Alcohol ..................................................................................... 60
Tobacco and Nicotine in North Dakota: Use ....................................................................................... 64
Youth Tobacco Use ............................................................................................................................. 64
Adult Tobacco Use .............................................................................................................................. 67
Tobacco Use Initiation Among Youth .............................................................................................. 69
Youth Cigarette Smoking ................................................................................................................... 71

ii
Adult Cigarette Smoking .................................................................................................................... 77
Youth Smokeless Tobacco Use ......................................................................................................... 83
Tobacco Use among Pregnant Women ............................................................................................ 87
Tobacco and Nicotine in North Dakota: Consequences ..................................................................... 88
Diseases ................................................................................................................................................ 88
Tobacco- Attributed Deaths ............................................................................................................... 91
Tobacco and Nicotine in North Dakota: Modifiable Risks ............................................................... 97
Youth Cessation/ Quit Attempts ........................................................................................................ 97
Adult Cessation/Quit Attempts ....................................................................................................... 101
Health and Professional Inquiry ...................................................................................................... 105
Source of Tobacco for Youth .......................................................................................................... 107
Cigarettes Sold and Tax Rate .......................................................................................................... 110
Illicit Drug in North Dakota: Use ........................................................................................................ 115
Marijuana Use ..................................................................................................................................... 115
Cocaine, Ecstasy, Heroin, and Methamphetamine Use ................................................................ 122
Illicit Drugs in North Dakota: Consequences .................................................................................... 128
Drug-Related Violations ................................................................................................................... 128
Overdose Deaths ................................................................................................................................ 132
Substance Abuse Treatment Admission ......................................................................................... 133
Illicit Drug Use in North Dakota: Modifiable Risks ........................................................................ 135
Access to Illicit Drugs .......................................................................................................................... 135
Prescription Drugs in North Dakota: Use .......................................................................................... 139
Nonmedical Use of Prescription Drugs .......................................................................................... 139
Nonmedical Use of Pain Relievers ................................................................................................. 144
Prescription Drugs in North Dakota: Consequences ........................................................................ 145
Poisonings and Related Deaths ........................................................................................................ 145
Pharmacotherapy Drugs ................................................................................................................... 147
Prescription Drug Use in North Dakota: Modifiable Risks ............................................................. 148
Availability of Prescription Drugs .................................................................................................. 148
Appendix ................................................................................................................................................. 153
Definition of Terms ........................................................................................................................... 153
Data Sources ...................................................................................................................................... 153

iii
Executive Summary
The state of North Dakota has made progress in the rates of substance abuse and related
consequences in recent years. Despite this, North Dakota remains above the national average in
many areas, which indicates further prevention implementation is necessary to improve the
quality of life in the state. Identifying target populations that are showing improvement in rates
of substance abuse and related consequences presents an opportunity to identify strategies that
are working, populations that are receptive to prevention efforts, and areas where prevention
efforts could be implemented or expanded.
Alcohol
Alcohol consumption, consequences, and modifiable risk factors in North Dakota have seen
positive trends in recent years. Rates of alcohol use among youth, youth riding with someone
who has been drinking alcohol, alcohol-induced causes of mortality, and alcohol-dependence in
North Dakota have declined in recent years. With the exception of alcohol-induced causes of
mortality, North Dakota remained above the national average for all categories relating to
alcohol consumption. North Dakota remained above the national average for a majority of
alcohol statistics. In addition, there was also an increase in the number of admissions to
treatment facilities for alcohol use.
Tobacco
Tobacco consumption, consequences, and modifiable risk factors in North Dakota have seen
positive trends in recent years. Rates of tobacco use before age 13, cigarette use among youth,
cigarette use among adults, number of pregnant women using tobacco, and the number of
cigarettes sold in North Dakota have declined in recent years. Middle and high school students
have reported a large increase in health care providers advising students not to use tobacco
products. Mortality rates due to age-adjusted heart disease, rates of mortality due to age-adjusted
lung and bronchus cancer, and rates of mortality due to age-adjusted cardiovascular disease have
declined in recent years as well. These mortality rates were found to be lower than the national
rates.

iv
Illicit Drugs
Illicit drug consumption, consequences, and modifiable risk factors in North Dakota have seen
positive trends in recent years. Rates of marijuana use have remained relatively stable for adults
in North Dakota, but are lower than the national rate. The rate of adults convicted and
incarcerated for drug possession has increased in recent years. The percentage of substance abuse
treatment admissions has increased in recent years with increased admissions for amphetamines
and opiates.
Nonmedical Use of Prescription Drugs
Nonmedical use of prescription drugs, related consequences, and modifiable risk factors in North
Dakota have seen positive trends in recent years. Rates of nonmedical use of prescription drugs
have remained steady or declined for specific sub-populations with an overall decrease in trend.
North Dakota was below the national average in number of opioid prescriptions per 10,000
persons.

1
Introduction
Use of alcohol, tobacco, prescription and illicit drugs takes a heavy toll on the lives and families
of North Dakotans and the state economy. Alcohol use and abuse is the greatest substance-
related problem facing the state (National Survey on Drug Use and Health [NSDUH], 2015;
Behavioral Risk Factor Surveillance System [BRFSS], 2015). North Dakota has among the
highest rates in the nation in current alcohol use and excessive drinking, regardless of age group
(NSDUH, 2015).
The State Epidemiological Outcomes Workgroup (SEOW)
State Epidemiological Outcomes Workgroups (SEOWs) are groups of data experts and
prevention stakeholders responsible for bringing data on substance abuse and related behavioral
problems to the forefront of the prevention planning process. The North Dakota SEOW was
initiated in 2006 by the North Dakota Department of Human Services (NDDHS), Behavioral
Health Division. Funding for the project is provided by the federal Substance Abuse and Mental
Health Services Administration (SAMHSA).
The mission of the North Dakota SEOW is to identify, analyze and communicate key substance
abuse and related behavioral health data to guide programs, policies and practices.
Expectations of the SEOW:
Assessment of the prevalence of substance abuse and related behavioral health issues
within specific populations and across the lifespan.
Determination of the nature, magnitude, and problems, as well as shared risk and
protective factors, associated with substance use and related behavioral health issues.
Establishment and management of all relevant data systems, including systems used to
conduct archival, evaluative, ethnographic, and perspective studies as well as those
designed to serve as an early warning network.
Development of state profiles detailing patterns and trends of substance use and related
behavioral health issues.
Engagement in systematic and analytical thinking to better understand the causes and
consequences of substance abuse and behavioral health issues.
Coordination with appropriate decision-making entities within the state to provide data
in formats that will be useful in guiding effective and efficient use of prevention
resources.
Ongoing promotion of data, including the development of templates, reports, and other
products for dissemination.

2
The SEOW is comprised of a broad representation of diverse partners and continues to provide
leadership in identifying data needs. Membership includes representatives from:
Boys & Girls Club of the Three Affiliated Tribes
Center for Rural Health, University of North Dakota
Department of Corrections & Rehabilitation
Department of Health
Department of Human Services
Department of Public Instruction
Department of Transportation
Highway Patrol
Information Technology Department
Mental Health America of North Dakota
North Dakota State University
North Dakota University System
Office of the Attorney General
Office of the State Tax Commissioner
Spirit Lake Sioux Tribe
Standing Rock Sioux Tribe
Turtle Mountain Band of Chippewa Indians, Turtle Mountain Community College
Wyoming Survey & Analysis Center, University of Wyoming
Purpose of the Profile
The SEOW is charged with developing state epidemiological profiles of key substance use
indicators.
This report constitutes the state profile. Its primary purpose is to serve as a reference document
for the SEOW to understand the available state-level data regarding alcohol, tobacco and drug
abuse. This profile will also be the foundation of additional, more accessible documents
summarizing the status of behavioral health (mental health and substance abuse) in ND. The
Center for Rural Health (CRH) completed this document through contract with NDDHS.

3
Principles of the SEOW
The SEOW is guided by the principle of outcomes-based prevention, which allows state
prevention stakeholders to lead with results, not with strategies.
To achieve this the SEOW utilizes a public health approach of focusing on preventing health
problems and promoting healthy living for whole populations of people. By definition, public
health is about populations. Public health focuses on the continuous monitoring of population-
level health, and towards identifying, preventing, and managing conditions of diseases with the
intention of improving health outcomes of a population.
Epidemiology is the study of factors affecting the health and wellness of populations. It is data-
driven and relies on a systematic and unbiased approach to the collection, analysis, and
interpretation of data. The SEOW relies on epidemiological data as the primary foundation for
all planning and decision-making at state and community levels. Epidemiological data have
proven to be very valuable for describing drug use patterns across person, place, and time; for
identifying factors associated with increased (or decreased) risk for drug use and drug use
disorders; and for informing prevention policies and strategies (Compton, Thomas, Conway, &
Colliver, 2015).
Prevention that focuses on risk and protective factors is grounded in the public health
approach, which relies on data-based predictors of problem behaviors and positive outcomes
(Hawkins & Catalano, 2005). Few problems related to substance abuse can be changed through
direct influence or attack. Rather, they are influenced indirectly through underlying factors that
contribute to the problem and its initiation, escalation, and adverse consequences.
A variety of factors – including individual competencies, family resources, school quality, and
community-level characteristics – can increase or decrease the risk that a person will develop a
substance use disorder or related problem behaviors, such as early substance use, risky sexual
behavior, or violence (National Research Council and Institute of Medicine, 2009). Specific to
substance abuse, seven causal areas have been identified by researchers, and they include: (1)
Economic/Retail Price; (2) Retail Availability; (3) Social Availability: (4) Enforcement; (5)
Promotion of Alcohol; (6) Community Norms; and (7) Individual Factors (Birckmayer, Holder,
Yacobian & Friend, 2004) Existing research and data suggest that there are number of common
or shared risk and protective factors throughout life that impact both substance abuse and mental
health outcomes (SAMHSA, 2013). Identifying shared risk and protective factors and examining
the unique issues of North Dakota’s rurality and cultural diversity are vital to increasing
collaboration, decreasing duplication, and ultimately better addressing the population as a whole.
4
Methods
The Core Workgroup for North Dakota’s SEOW project includes personnel from the North
Dakota Department of Human Services’ Behavioral Health Division (NDDHS) and the
University of North Dakota Center for Rural Health (CRH). The work on this project has been
guided by feedback, comments, advice, and data assistance from the SEOW, which has
representation from a variety of state government, tribal, university, and advocacy agencies. The
SEOW meets quarterly. The principal functions of the committee are to assist in identifying
potential data sources, assess and prioritize the quality and appropriateness of various data
sources and indicators, interpret and identify patterns and trends in substance use/consequence
data, and general guidance for developing the state’s Alcohol, Tobacco, and Other Drugs
(ATOD) Epidemiological Profile.
Data sources used in the 2017 Epidemiology Profile development include:
Youth Risk Behavioral Survey (YRBS)
Behavioral Risk Factor Surveillance System (BRFSS)
National Survey on Drug Use and Health (NSDUH)
National Centers for Health Statistics (NCHS)
North Dakota Core Alcohol and Drug Survey (NDCORE)
CDC Wonder Query System
North Dakota Division of Vital Records (NDDVR)
North Dakota Division of Tobacco Prevention and Control (NDDTPC)
North Dakota Office of Attorney General (Bureau of Criminal Investigation; NDBCI)
North Dakota Division of Cancer Prevention and Control (NDDCPC)
North Dakota Department of Transportation (NDDOT)
North Dakota Survey of Young Adults (NDSOYA)
Fatal Analysis Reporting System (FARS), National Center for Vital Statistics (NCVS)
Treatment Episode Data Set (TEDS)
North Dakota Department of Corrections and Rehabilitation (NDDOCR) principal crime
NDDOCR substance abuse treatment
National Institute on Alcohol Abuse and Alcoholism (NIAAA)
North Dakota Kids Count
North Dakota Council on Abused Women’s Services
North Dakota Community Readiness Survey (ND CRS)
Adult Tobacco Survey (ATS)
Youth Tobacco Survey (YTS)

5
Other data sets have notable shortcomings that must be considered while seizing their positive
aspects. For example, Treatment Episode Data Set (TEDS) data is a good source of substance-
related treatment admissions for North Dakota; however, one must keep in mind this system does
not collect data from all of the state’s treatment facilities. In fact, private treatment providers are
not obligated to report any of their patient or client information to TEDS. In addition, crime data
in North Dakota is a rich source of information of substance consequences, but it is not without
its limitations. The integrity of crime databases is dependent and reliant upon reporting
compliance by law enforcement agencies and personnel throughout the state.
In using data from multiple sources, it is import to mention that many sources differ in their
intended goals and in their methods of collecting and reporting information. If readers have
questions regarding the methods, strengths, or limitations of the sources used in this profile, we
recommend they consult the original data sources to maximize the usefulness of the source and
ensure accurate interpretations of the findings.
To create the state epidemiological profile report, a number of events occurred. First,
consumption/consequence items were prioritized and data was collected and presented to the
SEOW workgroup. Then, SEOW members provided feedback on grouping of data in figures,
tables, format, and information or data needing further clarification. With this feedback, the
SEOW epidemiology staff made modifications and provided the updated material to the entire
workgroup for review before submission of the draft report.

6
Substance Abuse in North Dakota
Section 1. Alcohol: Consumption, Consequences, and
Modifiable Risks

7
Alcohol in North Dakota: Consumption
Alcohol Use
About the Indicator
Seventy-two percent of North Dakota adults perceived alcohol use as a moderate or serious
problem in society among adults; 78.1% perceived alcohol use as a moderate or serious problem
in society among youth. Alcohol is the most generally used addictive substance in the United
States (NCADD, 2015). In fact, 86.4 percent of people aged 18 or older reporting drinking
alcohol at some point in their lifetime (NSDUH, 2015).
Data Source(s)
Youth
Centers for Disease Control and Prevention (CDC): Youth Risk Behavior Survey (YRBS)
Adults
Centers for Disease Control and Prevention (CDC): Behavioral Risk Factor Surveillance System
(BRFSS)
National Institute on Alcohol Abuse and Alcoholism (NIAAA)
Substance Abuse and Mental Health Services Administration (SAMHSA): National Survey on
Drug Use and Health (NSDUH)
Section Summary
Youth
In 2017, nineteen percent of North Dakota middle school students used alcohol, a percentage
that declined since 2011 (YRBS, 2017).
From 2011 to 2013 male middle school students reported higher rates of alcohol use than
females. However, from 2015 to 2017, female students consumed more alcohol when
compared to males (YRBS, 2017).
Between 2011 and 2017, high school students reported decreasing rates of ever consuming
alcohol. Females reported higher rates of ever consuming alcohol than male students over the
same time period (YRBS, 2017).

8
In 2017, the number of high school students who reported having their first drink of alcohol
before age 13 decreased from 2011. Rates of alcohol consumption before age 13 remained
consistently higher among male compared to female students over the same time period
(YRBS, 2017).
In the past six years, the number of high school students who reported drinking alcohol on at
least one day during the past month has continued on a downward trend. North Dakota high
school students reported higher rates of alcohol consumption in the past month than the
national average, with an exception in 2015; North Dakota (30.8%) was slightly lower than
the national rate (32.8%; YRBS 2017).
As North Dakota high school students move through high school, from 9th
to 12th
grade, they
were more likely to report current alcohol between the years 2011 and 2017 (YRBS, 2017).
Adults
North Dakotan adults, 21 and older, consumed over 48% and 36% more alcohol than the
national average in the form of spirits and beer, respectively in 2015. However, North Dakota
consumption for wine was reported slightly below the national average (NIAAA, 2015).
North Dakota reported a larger percentage of current alcohol use (within the past 30 days)
over the national average among those aged 18-25 and 26 and older (NSDUH, 2017).
In 2015, 70.2% North Dakotans, aged 18-25, consumed alcohol at least once in the last
month and was 11.2% higher than the national rates. (NSDUH, 2017).
Between the years 2013 and 2016, more adult males reported consuming alcohol in the past
month than females (BRFSS, 2017).
Between the years of 2013 and 2016 in North Dakota, there was a slight increase in current
alcohol consumption (having at least one drink in the past month) among both adult males
(67.4%, 68.7%) and females (54.5%, 57.9%) (BRFSS, 2017).
In the past four years, alcohol consumption among all age groups in North Dakota has
remained consistent (NSDUH, 2017).

9
Youth
Ever Drank Alcohol, Middle School Students, ND, by Gender
Data Source: YRBS
Ever Drank Alcohol, Middle School Students, ND, by Grade
Data Source: YRBS

10
Ever Drank Alcohol, High School Students, ND, by Gender
Data Source: YRBS
Ever Drank Alcohol, High School Students, ND, by Grade
Data Source: YRBS

11
Drank Alcohol before Age 13, High School Students, ND, by Gender
Data Source: YRBS
Currently Drank Alcohol, High School Students, ND vs. US
Data Source: YRBS
Data Note: 2017 YRBS data for the US was not available at publication time.

12
Currently Drank Alcohol, High School Students, ND, by Gender
Data Source: YRBS
Currently Drank Alcohol, High School Students, ND, by Grade
Data Source: YRBS

13
Adults
Per Capita Alcohol Consumption in Gallons among Persons Age 21 and Older (per 10,000)
Spirits 2012 2013 2014 2015
ND 1.56 1.56 1.57 1.49
US 0.89 0.89 0.9 0.91
Wine 2012 2013 2014 2015
ND 0.34 0.37 0.39 0.4
US 0.48 0.48 0.48 0.47
Beer 2012 2013 2014 2015
ND 1.99 1.91 1.89 1.78
US 1.28 1.26 1.23 1.23
All Beverages 2012 2013 2014 2015
ND 3.89 3.84 3.86 3.67
US 2.65 2.63 2.62 2.62
Data Source: NIAAA
Used Alcohol at Least Once in the Past Month, ND vs. US, by Age, 2015
Data Source: NSDUH

14
Alcohol Use in Past Month, Adults (18+), ND, by Gender
Data Source: BRFSS
Alcohol Use in Past Month, ND, by Age
Data Source: NSDUH

15
Binge Drinking
About the Indicator
Behavioral Risk Factor Surveillance System (BRFSS) defined binge drinking as consuming four
or more drinks for women and five or more drinks for men in a row on one occasion during the
past 30 days. Binge drinking is defined by the Youth Risk Behavior Survey (YRBS) as having
five or more drinks of alcohol in a row on one or more of the past 30 days.
Data Source(s)
Youth
Centers for Disease Control and Prevention (CDC): Youth Risk Behavior Survey (YRBS)
Adults
Substance Abuse and Mental Health Services Administration (SAMHSA): National Survey on
Drug Use and Health (NSDUH)
Centers for Disease Control and Prevention (CDC): Behavioral Risk Factor Surveillance System
(BRFSS)
Wyoming Survey & Analysis Center: North Dakota Survey of Young Adults (NDSOYA)
Section Summary
Youth
Generally, more North Dakota high school students have engaged in binge drinking
compared to their United States peers. However, in 2015 both the U.S. and North Dakota
high school students reported nearly identical binge drinking rates (YRBS, 2017).
The percentage of high school students who reported binge drinking (having five or more
drinks of alcohol in a row within a couple of hours on at least one day in the past month) has
been decreasing since 2011 (YRBS, 2017).
Between the years 2011 through 2015, more male high school students engaged in binge
drinking compared to their female peers. However, in 2017, females (18.5 %) reported higher
rates of binge drinking than males (14.4 %) (YRBS, 2017).
As high school students advanced to higher grades, the rates of binge drinking increased. The
percentage of high school students who report binge drinking (having five or more drinks of
alcohol in a row within a couple of hours on at least one day in the past month) decreased for
those in 11th
grade (16.1 %) and 12th
grade (24.1 %) between 2015 and 2017. Contrary to

16
previous years, from 2015 to 2017, binge drinking rates increased among 9th
and 10th
grade
students, (12.4%) and (13.7%) respectively (YRBS, 2017).
Adults
Adult binge drinking rates in North Dakota have been higher than the national rates from
2012 to 2016. In 2016, the ND rate of adult binge drinking in North Dakota was 24.8%
compared to 16.9% at the national level (BRFSS, 2017).
North Dakota adult males (age 18+) have consistently reported higher rates of binge drinking
than females between the years 2013 and 2016. Adult binge drinking rates for both genders
have remained relatively stable over that period (BRFSS, 2017).
North Dakota adults aged 18-24 have consistently reported the highest rates of binge
drinking among other age groups. Binge drinking rates decreased as adults age (BRFSS,
2017).
From 2013 to 2016, North Dakota adults with an income above $75,000 annually reported a
higher average binge drinking rate than any other income bracket (BRFSS, 2017).
Youth
Binge Drinking, High School Students, ND vs. US
Data Sources: YRBS
Data Note: 2017 YRBS data for the US was not available at publication time.

17
Binge Drinking, High School Students, ND, by Gender
Data Sources: YRBS
Binge Drinking, High School Students, ND, by Grade Level
Data Sources: YRBS

18
Adults
Binge Drinking at Least Once in the Past Month, by Age, ND vs. US, 2016
Data Source: NSDUH
Data Note: 2015 state binge drinking data not available.
Data Note: Binge drinking prior to 2015 was defined as males or females consuming five or
more drinks on the same occasion. Binge drinking is currently defined as consuming five or
more drinks for males or four or more drinks for females on the same occasion.

19
Binge Drinking at Least Once in the Past Month, ND, by Age
Data Source: NSDUH
Data Note: 2015 state binge drinking data not available.
Data Note: Binge drinking prior to 2015 was defined as males or females consuming five or
more drinks on the same occasion. Binge drinking is currently defined as consuming five or
more drinks for males or four or more drinks for females on the same occasion.
Binge Drinking in the Past 30 days, Adult (18+), ND vs. US
Data Source: BRFSS
Data Note: Binge drinking refers to males consuming five or more drinks on one occasion,
females having four or more drinks on one occasion in the past 30 days.

20
Binge Drinking in the Past 30 Days, Adult (18+), ND, by Gender
Data Source: BRFSS
Data Note: Binge drinking refers to males consuming five or more drinks on one occasion,
females having four or more drinks on one occasion in the past 30 days.
Binge Drinking in the Past 30 Days, Adult, ND, by Age
Data Source: BRFSS
Data Note: Binge drinking refers to males consuming five or more drinks on one occasion,
females having four or more drinks on one occasion in the past 30 days.

21
Binge Drinking in the Past 30, Adult (18+), ND, by Income Level
Data Source: BRFSS
Data Note: Binge drinking refers to males consuming five or more drinks on one occasion,
females having four or more drinks on one occasion in the past 30 days.

22
Excess Drinking
About the Indicator
The Centers for Disease Control and Prevention (CDC) reported that excessive drinking cost the
United States $249 billion in 2010 ($2.05 per drink), which was a significant increase in 2006
from $223.5 billion ($1.90 per drink). Substance Abuse and Mental Health Services
Administration (SAMHSA) defines heavy or excessive alcohol use as binge drinking on five or
more days in the past month. Heavy alcohol use is defined by Behavioral Risk Factor
Surveillance System (BRFSS) as average daily alcohol consumption greater than two drinks for
males and one drink for females.
Data Source(s)
Adults
Centers for Disease Control and Prevention (CDC): Behavioral Risk Factor Surveillance System
(BRFSS)
Wyoming Survey & Analysis Center: North Dakota Survey of Young Adults (NDSOYA)
Section Summary
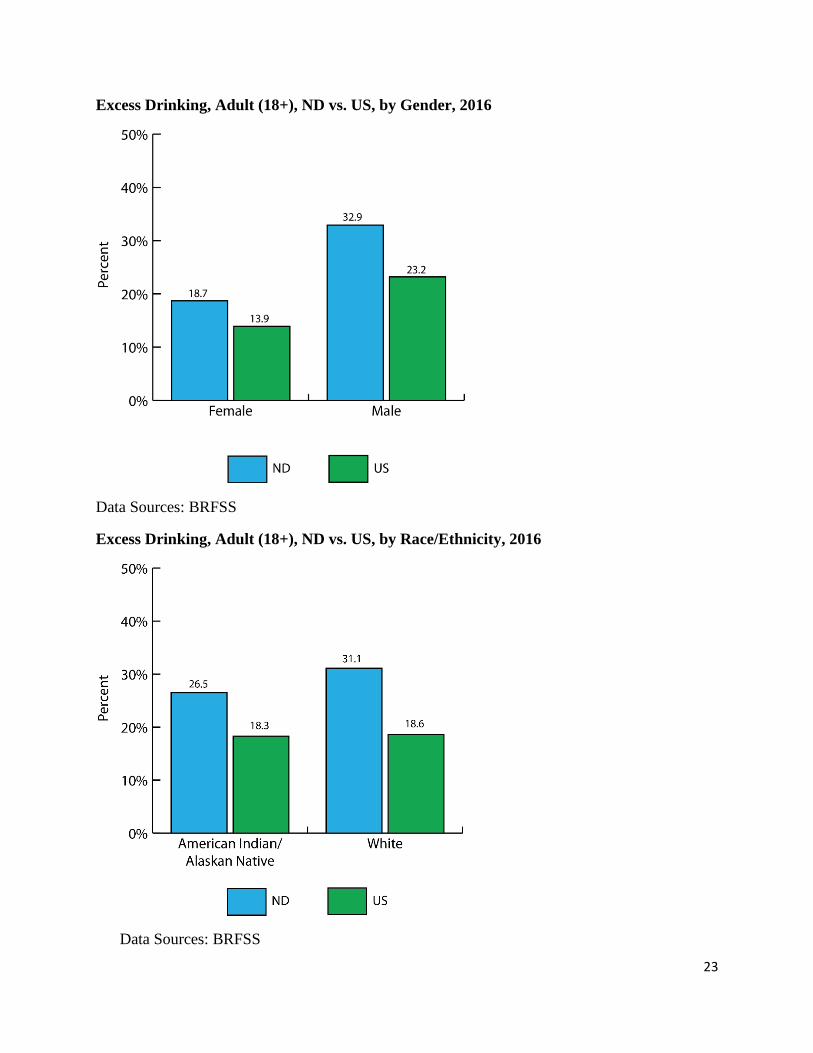
The percentage of North Dakota adults, age 18 and older, who had reported drinking in
excess was higher than the U.S. averaged national percentage of adults who reported excess
drinking in 2016 (BRFSS, 2017).
In 2016, the percentage of North Dakotan males who reported drinking in excess (more than
two drinks per day for males and one drink per day for females) was higher than females
(BRFSS, 2017).
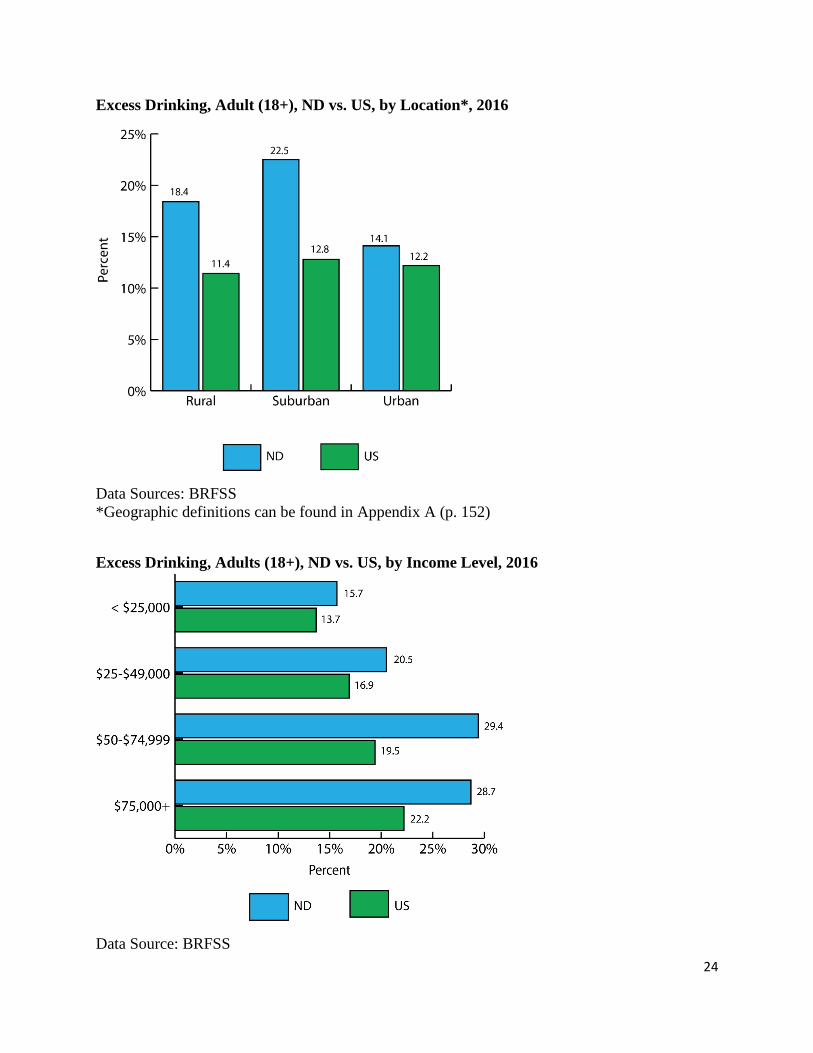
The percentage of adults who drank excessively increased with income level, in North
Dakota as well as nationally (BRFSS, 2017).
23
Excess Drinking, Adult (18+), ND vs. US, by Gender, 2016
Data Sources: BRFSS
Excess Drinking, Adult (18+), ND vs. US, by Race/Ethnicity, 2016
Data Sources: BRFSS
24
Excess Drinking, Adult (18+), ND vs. US, by Location*, 2016
Data Sources: BRFSS
*Geographic definitions can be found in Appendix A (p. 152)
Excess Drinking, Adults (18+), ND vs. US, by Income Level, 2016
Data Source: BRFSS

25
Average Number of Alcoholic Beverages Consumed on Days When Current Drinkers
Drank, Young Adults (18-29), ND, by Gender, 2016
Data Source: NDSOYA, 2016
Number of Days During the Past 30 Days Current Drinkers Binge Drank, Young Adults
(18-29), ND, by Gender, 2016
Data Source: NDSOYA, 2016

26
Actual Versus Perceived Binge Drinking among Peers, Young Adults (18-29), 2016
Data Source: NDSOYA, 2016

27
Alcohol in North Dakota: Consequences
Alcohol-Attributed Deaths
About the Indicator
Alcohol Use Disorder is the fourth leading preventable cause of death (approximately 62,000
men and 26,000 women), in the United States (NCADD, 2015; NIH, 2017).
Data Source(s)
Wyoming Survey & Analysis Center (WYSAC): North Dakota Community Readiness Survey
(CRS)
Centers for Disease Control and Prevention (CDC): National Center for Health Statistics
(NCHS)
Centers for Disease Control and Prevention (CDC): Alcohol-Related Disease Impact (ARDI)
Section Summary
North Dakota reported higher rates of drug/alcohol-induced causes of mortality when
compared to the United States from 2012 to 2015 (NCHS, 2017).
Excessive alcohol use was a contributing factor to more years of potential life lost for males
compared to females (ARDI, 2016).
In North Dakota, liver disease and alcohol dependence syndrome were the leading chronic
conditions among those who died from excessive alcohol use (ARDI, 2016).
In North Dakota, motor-vehicle traffic crashes and fall injuries were the leading acute causes
of death among those who consumed alcohol excessively (ARDI, 2016).

28
Perception of Alcohol Use in Community as a Problem among Adults, ND, 2015
Data Source: ND CRS, 2015
Drug/Alcohol-Induced Causes of Mortality: Age-Adjusted Alcohol-Induced Causes, ND vs.
US
Data Source: NCHS
Years of Potential Life Lost Due to Excessive Alcohol Use, ND vs. US, by Gender, 2006-
2010
North Dakota United States
Female 1,307 717,082
Male 3,825 1,853,788
Total 5,132 2,570,870
Data Source: ARDI

29
Alcohol-Attributable Deaths Due to Excessive Alcohol Use, Average for ND, All Ages,
2006-2010
Chronic Causes Overall 0-19 20-34 35-49 50-64 65+
Acute pancreatitis 1 0 0 < 1 0 < 1
Alcohol abuse 2 0 0 1 0 1
Alcohol dependence syndrome 10 0 0 3 5 2
Alcoholic liver disease 39 0 1 15 15 8
Breast cancer (females only) 1 0 0 < 1 < 1 1
Epilepsy < 1 0 0 0 < 1 0
Esophageal cancer 1 0 0 < 1 < 1 1
Hypertension 3 0 0 < 1 < 1 3
Ischemic heart disease 2 0 < 1 < 1 < 1 2
Laryngeal cancer < 1 0 0 0 < 1 < 1
Liver cancer 2 0 0 < 1 < 1 1
Liver cirrhosis unspecified 8 0 0 1 2 4
Low birth weight prematurity IUGR death < 1 < 1 0 0 0 0
Oropharyngeal cancer 1 0 0 0 < 1 < 1
Prostate cancer (males only) 1 0 0 0 < 1 1
Stroke hemorrhagic 3 0 < 1 < 1 1 3
Stroke ischemic 1 0 0 < 1 < 1 1
Supraventricular cardiac dysrhythmia 1 0 0 0 0 1
Subtotal 75 < 1 1 21 25 28
Acute Causes Overall 0-19 20-34 35-49 50-64 65+
Alcohol poisoning 4 0 0 3 1 0
Aspiration < 1 0 0 0 0 < 1
Child maltreatment < 1 < 1 0 0 0 0
Drowning 2 0 1 1 1 0
Fall injuries 26 0 1 2 2 22
Fire injuries 1 0 0 0 0 1
Firearm injuries < 1 < 1 0 0 0 0
Homicide 4 1 1 2 < 1 0
Hypothermia 2 0 0 1 < 1 < 1
Motor-vehicle nontraffic crashes < 1 0 < 1 0 < 1 0
Motor-vehicle traffic crashes 35 4 14 10 5 2
Occupational and machine injuries 1 0 0 < 1 < 1 < 1
Poisoning (not alcohol) 7 < 1 2 2 1 1
Suicide 21 2 7 6 4 2
Subtotal 104 8 26 26 16 29
Data Source: ARDI

30
Alcohol Use Disorder
About the Indicator
Alcohol use disorder (AUD) is a chronic disease characterized by compulsive alcohol use, loss
of control over alcohol intake, and a depressive emotional state when not consuming alcohol
(NIAAA, 2015). An estimated 16 million people in the United States have AUD. In 2015, about
6.2 percent or 15.1 million adults, aged 18 and older, had AUD; this number includes 9.8 million
men and 5.3 million women. Adolescents can be diagnosed with AUD, and in 2015, an estimated
623,000 adolescents, aged 12–17, were diagnosed with AUD (NIAAA, 2015). In the United
States, more than half of all adults have a family past that includes alcoholism or some form of
alcohol abuse, with 17.6 million people suffering from this addiction (NCADD, 2015). Within
these families, more than 7 million children live in a household with at least one parent who has
abused alcohol (NCADD, 2015).
Data Source(s)
Substance Abuse and Mental Health Services Administration (SAMHSA): National Survey on
Drug Use and Health (NSDUH)
Section Summary
The percentage of alcohol use disorder among North Dakota individuals aged 18 to 25
declined between the years 2013 and 2016; however, it remained higher than national rates
(NSDUH, 2017).
The percentage of alcohol use disorder among North Dakota individuals aged 26+ declined
between the years 2013 and 2015. From 2015 on, that percentage held at 6.2% (NSDUH,
2017).
North Dakota adults 18 and older reported higher rates of alcohol use disorder in comparison
to the national average between 2013 and 2016 (NSDUH, 2017).

31
Alcohol Use Disorder in the Past Year, Ages 18-25, ND vs. US
Data Source: NSDUH
Alcohol Use Disorder in the Past Year, Ages 26+, ND vs. US
Data Source: NSDUH

32
Alcohol Use Disorder in the Past Year, By Age, ND
Data Source: NSDUH

33
Impaired Driving after Drinking
About the Indicator
Alcohol is a substance that decreases the ability of the brain by damaging thinking processes,
impairing reasoning, and affecting muscle control; all these abilities are essential to effective
driving. Even consuming a small amount of alcohol can affect driving ability.
Data Source(s)
Youth
Centers for Disease Control and Prevention (CDC): Youth Risk Behavior Survey (YRBS)
Adult
Centers for Disease Control and Prevention (CDC): National Center for Health Statistics
(NCHS)
Centers for Disease Control and Prevention (CDC): Behavioral Risk Factor Surveillance System
(BRFSS)
Section Summary
Youth
The percentage of male middle students who rode with a driver who had been drinking
alcohol decreased from 2011 to 2017. In 2017, the percentage of middle school females
(27.9%) who rode with a driver who had been drinking alcohol increased slightly from 2015
(26.5%) (YRBS, 2017).
From 2013 to 2017, there was a 39.3% decrease in the number of North Dakota high school
students who drank alcohol and drove a vehicle in the past month (YRBS, 2017).
From 2013 to 2017, there was roughly a 25% decrease in the number of North Dakota high
school students who rode with a driver who had been drinking alcohol (YRBS, 2017).
Between the years 2013 and 2017, the percentage of both male (12.4% to 8.1%) and female
(8.9% to 4.9%) high school students who reported driving a vehicle after drinking alcohol in
the past month decreased (YRBS, 2017).
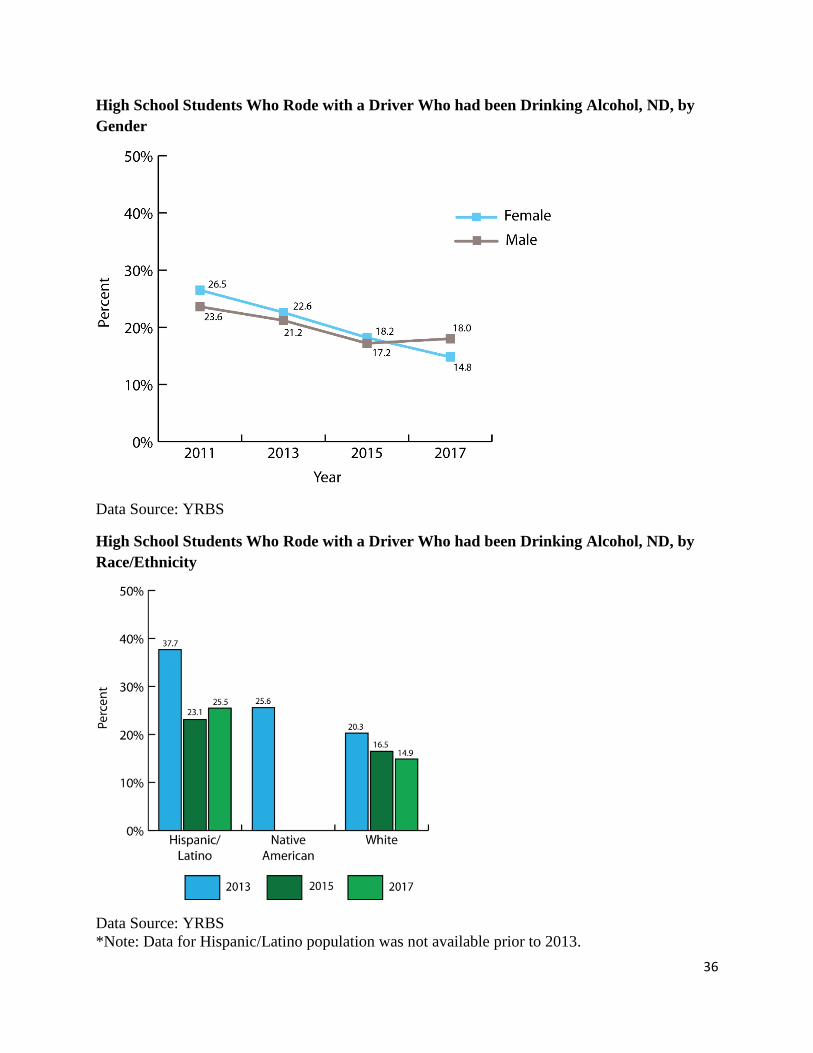
The percentage of North Dakota high school students who reported riding with a driver who
had been drinking alcohol decreased from 2011 to 2015. In 2017, while females’ percentages
continued to decrease, males reported a slight increase in percentage of reported rides with a
driver who had been dreaming alcohol (YRBS, 2017).

34
Adults
ND adults in frontier communities were least likely to agree that drinking and driving laws
are enforced when compared to adults in rural and urban communities (ND CRS, 2015).
The majority of ND adults held the perception that drinking and driving laws were enforced
in their communities (ND CRS, 2015).
The percent of North Dakota adult males who reported driving after consuming too much
alcohol is greater than females in both 2014 and 2016 (BRFSS).
North Dakota females who reported driving after consuming too much alcohol increased
from 2014 to 2016 (BRFSS).
Youth
Middle School Students Who Rode with a Driver Who had been Drinking Alcohol, ND, by
Gender
Data Source: YRBS

35
Middle School Students Who Rode with a Driver Who had been Drinking Alcohol, ND, by
Race/Ethnicity
Data Source: YRBS
High School Students Who Rode with a Driver Who had been Drinking Alcohol vs.
Students Who Drove a Vehicle After Drinking Alcohol, Past 30 Days, ND
Data Source: YRBS
36
High School Students Who Rode with a Driver Who had been Drinking Alcohol, ND, by
Gender
Data Source: YRBS
High School Students Who Rode with a Driver Who had been Drinking Alcohol, ND, by
Race/Ethnicity
Data Source: YRBS
*Note: Data for Hispanic/Latino population was not available prior to 2013.

37
High School Students Who Drove a Vehicle After Drinking Alcohol, Past 30 Days, ND, by
Gender
Data Source: ND YRBS
High School Students Who Drove a Vehicle After Drinking Alcohol, Past 30 Days, ND, by
Grade
Data Source: ND YRBS

38
Adults
Perception that Drinking and Driving Laws are being Enforced Within One’s Community,
North Dakota, 2015
Data Source: ND CRS, 2015
*Geographic definitions can be found in Appendix A (p. 152)
Driving After Consuming Too Much Alcohol, Adults (18+), ND, by Gender
Data Source: BRFSS

39
Alcohol-Related Fatal Crashes
About the Indicator
Drunk driving is responsible for many traffic crashes. Every day 28 people in the United States
die in alcohol-related vehicle crashes, which is one person every 51 minutes; drunk driving
crashes claim more than 13,000 lives per year. In 2015, 10,265 people died because of alcohol-
impaired crashes (NHTSA, 2015).
Data Source(s)
Centers for Disease Control and Prevention (CDC): National Center for Health Statistics
(NCHS)
National Highway Traffic Safety Administration (NHTSA): Fatality Analysis Reporting System
(FARS)
North Dakota Department of Transportation: North Dakota Crash Summary (NDDOT)
Section Summary
North Dakota adults in frontier communities were more likely to perceive alcohol as either
minimally contributing or in no way contributing to injuries or crashes (38.9%) than ND
adults residing in rural (28.0%) and urban (20.1%) communities (ND CRS, 2015).
The percentage of alcohol-related driving fatalities in North Dakota and the United States
decreased between 2012 and 2015 (FARS, 2015).
The percent of alcohol-related driving fatalities in North Dakota remained greater than the
United States between 2012 through 2015 (FARS, 2015).
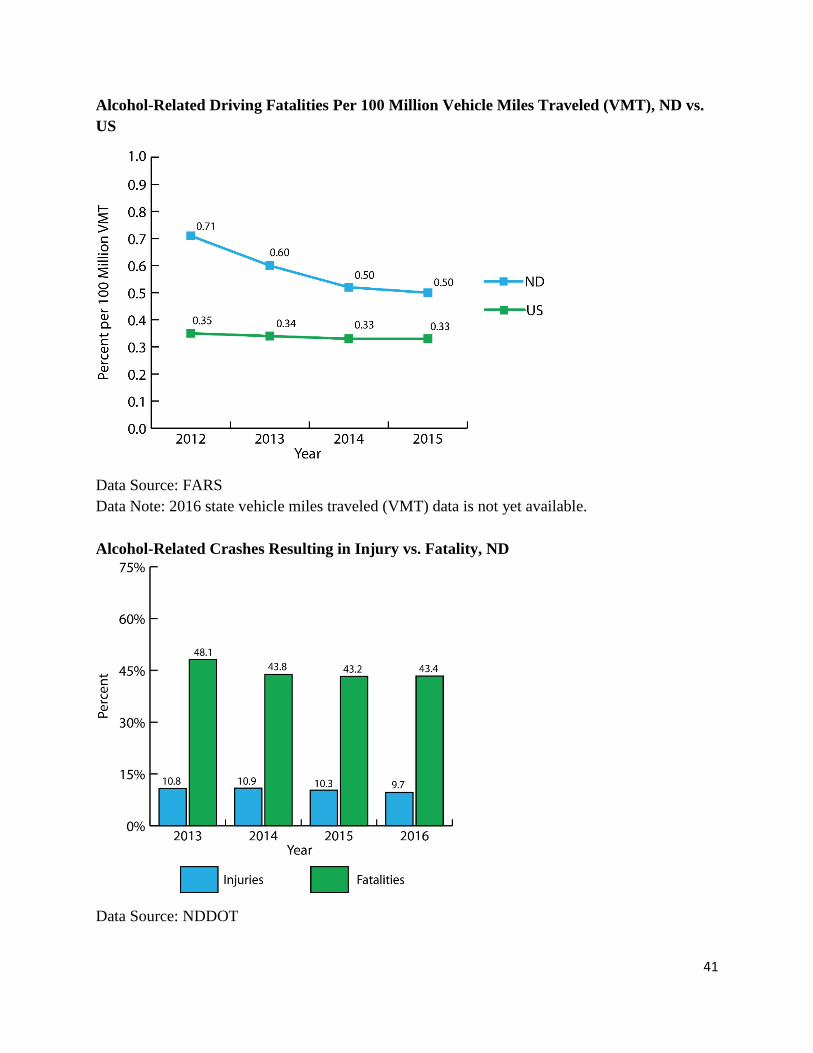
Alcohol-related driving fatalities per Vehicle Miles Traveled (VMT) in North Dakota have
declined from 2012 to 2015 but still remain higher than national rates (FARS, 2015).
The percent of alcohol-related driving injuries in North Dakota remained relatively constant
between the years 2013 and 2016 (NDDOT, 2016).
The percent of alcohol-related driving crashes in North Dakota resulting in fatalities
plateaued between 2014 and 2016 (NDDOT, 2016).

40
Perception of Alcohol/Drug Use and the Contribution towards Injuries or Crashes, by
Location*, ND, 2015
Data Source: ND CRS, 2015
*Geographic definitions can be found in Appendix A (p. 152)
Alcohol-Related Fatal Crashes, (BAC = 0.08+) ND vs. US
Data Source: FARS
41
Alcohol-Related Driving Fatalities Per 100 Million Vehicle Miles Traveled (VMT), ND vs.
US
Data Source: FARS
Data Note: 2016 state vehicle miles traveled (VMT) data is not yet available.
Alcohol-Related Crashes Resulting in Injury vs. Fatality, ND
Data Source: NDDOT

42
Impaired Driving Violations
About the Indicator
In every state, people who drive while under the influence (DUI) of drugs/alcohol are
committing a crime and will be arrested and possibly convicted of a DUI if the alcohol content
(AC) is: 1) 0.08% or more; 2) 0.02% or more, if a person is younger than 21 years old; and 3)
0.04% or more, if a person is driving a commercial vehicle (ND-DMV, 2017).
Actual Physical Control (APC) is defined by the North Dakota Highway Patrol as, “being under
immediate control or having the ability to operate the mover vehicle while being under the
influence or having a blood-alcohol concentration of .08 percent or more.” (NDHP, 2017).
Data Source(s)
State of North Dakota Office of Attorney General: Crime Statistics Online (CSO) Program
North Dakota Department of Corrections and Rehabilitation (DOCR)
North Dakota Highway Patrol (NDHP)
Section Summary
The percentage of adults arrested for driving under the influence of alcohol has been
consistently greater among males than females in North Dakota from 2013 through 2016
(State of North Dakota Office of Attorney General: CSO, 2017).
In general, the number of DUI arrests in North Dakota decreased among individuals aged 18-
24 and 45-54 from 2013 to 2016 (State of North Dakota Office of Attorney General: CSO,
2017).
The percentage of DUI arrests for adults aged 25-34, 55-64 and 65+ increased from 2013 to
2016 (State of North Dakota Office of Attorney General: CSO, 2017).
North Dakota adults aged 25-34 reported the greatest percentage of DUI arrests between the
years 2013 to 2016 when compared to all other age groups (State of North Dakota Office of
Attorney General: CSO Program, 2017).
A decline in the percentage of DUI and Actual Physical Control (APC) offenders imprisoned
occurred among both males and females for North Dakota between years from 2014 through
2016 (DOCR, 2016).
The percentage of adult male DUI and APC offenders was consistently greater than females
in North Dakota from 2013 to 2016 (DOCR, 2017).

43
The percentage of North Dakota adult DUI arrests among whites was higher than other races;
however, declined between the years 2013 through 2016. In general, the percentage of North
Dakota adult male DUI arrests among black/African Americans and American Indian/
Alaska Natives increased between the years 2013 and 2016 (State of North Dakota Office of
Attorney General: CSO, 2017).
Adult DUI Arrests, ND, by Age
Data Source: State of North Dakota Office of Attorney General: Crime Statistics Online (CSO)

44
Adult DUI Arrests, ND, by Gender
Data Source: State of North Dakota Office of Attorney General: Crime Statistics Online (CSO)
Adult DUI Arrests, ND, by Race
Data Source: State of North Dakota Office of Attorney General: Crime Statistics Online (CSO)
Program

45
Adult DUI Arrests per ND Racial Demographic Population
Data Source: State of North Dakota Office of Attorney General: Crime Statistics Online (CSO)
Program, U.S. Census Bureau
Percentage of Imprisoned DUI and APC Offenders of all Drug and Alcohol Offenders, ND,
by Gender
Data Source: DOCR

46
Liquor Law Violations
About the Indicator
Liquor laws violations (LLV) are described as any local or state liquor law violations, excluding
driving under the influence (DUI) and drunkenness. The North Dakota Office of Attorney
General gathers data of reported LLVs, which include such offenses as minor in possession,
minor in consumption, unlawful delivery to minor, a minor in liquor establishment, and illegal
manufacture of alcoholic beverages. Selling liquor without a license is illegal.
Data Source(s)
State of North Dakota Office of Attorney General: Crime Statistics Online (CSO) Program
Section Summary
The number of liquor law violations reported in North Dakota is higher among those age 18
and older compared to those younger than 18 years old between the years 2013 and 2016.
(State of North Dakota Office of Attorney General: CSO, 2017).
From 2013 to 2016, the number of liquor law violations decreased for all ages, with the
exception being an increase in violations for adults, 21 years old and over, in 2015 (State of
North Dakota Office of Attorney General: CSO, 2017).
Liquor Law Violations, ND, by Age
Data Source: State of North Dakota Office of Attorney General: Crime Statistics Online (CSO)

47
Consequences of Alcohol on Student Grades
About the Indicator
Academic performance is negatively affected by alcohol consumption. Alcohol use not only
affects brain development which includes learning, memory, verbal skills and visual-spatial
cognition but also school-related achievement and behavior (Ensuring Solutions to Alcohol
Problems, 2017).
Data Source(s)
North Dakota Department of Public Instruction (NDDPI)
North Dakota Department of Public Instruction: North Dakota Youth Risk Behavior Survey
(YRBS)
Section Summary
The number of school days missed by North Dakota students, grades kindergarten through
12th
, due to alcohol related suspensions or expulsions rose from 2013 to 2017 (NDDPI,
2017).
Middle school students, who reported drinking alcohol for the first time before age 11 years,
obtained a greater percentage of C (10.9%) and D/F (11.2%) letter grades than A (3.3%) and
B (7.0%) letter grades in 2015 (YRBS, 2017).
High school students who attended school under the influence of alcohol or other drugs on at
least one day during the month reported attaining more C, D/F letter grades than A and B
letter grades in 2015. Within this group of students, males reported having even lower grade
point averages compared to females (YRBS, 2015).
Both middle school and high school students who reported binge drinking (having five or
more drinks of alcohol in a row within a couple of hours on at least one day during the
month) reported a attaining more C, D/F letter grades than A and B letter grades in 2015
(YRBS, 2017).
High school students who reported binge drinking were more likely to have poorer grades
than middle school students who had partaken in binge drinking (YRBS, 2017).

48
Days of School Missed due to Alcohol Related Suspensions or Expulsions, Students K-12,
ND
Data Source: NDDPI
Grade Point Average among Those who Report Drinking Alcohol before Age 11, Middle
School, ND, 2015
Data Source: YRBS

49
Grade Point Average Among Those Who Report Attending School Under the Influence of
Alcohol or Other Drugs, High School, Gender, ND, 2015
Data Source: YRBS, 2015
Grade Point Average Among Those Who Report Binge Drinking, Middle and High School,
ND, 2015
Data Source: YRBS, 2017

50
Grade Point Average Among Those Who Report Binge Drinking, High School, Gender,
ND, 2017
Data Source: YRBS, 2017
51
Substance Abuse Treatment Admissions
About the Indicator
The data below shows admissions for treatment in North Dakota and the United States. This data
only includes admissions into the public behavioral health system and not any private substance
abuse treatment facility.
Data Source(s)
Substance Abuse and Mental Health Services Administration (SAMHSA): Treatment Episode
Data Set (TEDS)
Section Summary
Among all age groups, more individuals in North Dakota who needed alcohol use treatment
were not able to receive the necessary treatment compared to individuals at the national level.
Compared to all other age groups, the 18-25 age group reported the highest percentage of
individuals needing, but not receiving alcohol abuse treatment, in North Dakota as well as
nationally in 2016 (NSDUH, 2016).
The number of admissions to substance abuse treatment facilities in North Dakota increased
from 2013 (2,744) to 2016 (5,967) (TEDS, 2017).
Between 2013 and 2016, there was a continued decline in alcohol-only and alcohol with
secondary drug admissions in North Dakota (TEDS, 2017).
In 2016, males reported a larger percentage of alcohol only treatment facility admissions than
females, 65.5% to 34.2% respectively (TEDS, 2017).
In North Dakota, individuals aged 26 to 55 represented over 75% of primary alcohol
treatment admissions from 2013 to 2016 (TEDS, 2017).
When compared to treatment admissions for alcohol with a secondary drug treatment, those
admitted for alcohol treatment only represented a slightly older age demographic (TEDS,
2017).
In North Dakota, individuals aged 21 to 45 represented roughly 60% of alcohol with
secondary drug treatment admissions from 2013 to 2016 (TEDS, 2017).

52
Needing but Not Receiving Alcohol Abuse Treatment at a Specialty Facility in the Past
Year, by Age, ND vs. US, 2016
Data Source: NSDUH
Substance Abuse Treatment Admissions, Ages 12+, ND, Total vs. Alcohol Admissions
Data Source: TEDS

53
Substance Abuse Treatment Admission, Ages 12+, ND, Primary Alcohol vs. Alcohol with
Secondary Drug
Data Source: TEDS
Substance Abuse Treatment Admission, Age 12+, ND, Primary Substance
Data Source: TEDS

54
Substance Abuse Treatment Admission, Age 12+, ND, Alcohol-Only, by Gender
Data Source: TEDS
Substance Abuse Treatment Admission, Age 12+, ND, Alcohol with Secondary Drug, by
Gender
Data Source: TEDS

55
Percentage of Substance Abuse Treatment Admissions, ND, Primary Alcohol-Only, by Age
Admitted to Treatment 2013 2014 2015 2016
12-17 years 3.4% 1.5% 1.3% 1.7%
18-20 years 1.9% 1.9% 0.7% 1.6%
21-25 years 7.2% 7.5% 5.3% 7.2%
26-30 years 12.0% 12.9% 14.7% 14.2%
31-35 years 13.3% 12.0% 13.6% 15.0%
36-40 years 16.1% 12.8% 14.8% 11.0%
41-45 years 13.4% 14.3% 12.5% 11.9%
46-50 years 11.5% 12.7% 13.1% 11.7%
51-55 years 10.5% 11.8% 11.6% 13.8%
56-60 years 6.3% 7.7% 8.6% 7.5%
61-65 years 2.5% 3.2% 1.8% 3.2%
66 years and over 1.9% 1.8% 2.0% 1.2%
Data Source: TEDS
Percentage of Substance Abuse Treatment Admission, ND, Alcohol with Secondary Drug,
by Age
2013 2014 2015 2016
12-17 years 3.4% 1.5% 1.3% 1.7%
18-20 years 1.9% 1.9% 0.7% 1.6%
21-25 years 7.2% 7.5% 5.3% 7.2%
26-30 years 12.0% 12.9% 14.7% 14.2%
31-35 years 13.3% 12.0% 13.6% 15.0%
36-40 years 16.1% 12.8% 14.8% 11.0%
41-45 years 13.4% 14.3% 12.5% 11.9%
46-50 years 11.5% 12.7% 13.1% 11.7%
51-55 years 10.5% 11.8% 11.6% 13.8%
56-60 years 6.3% 7.7% 8.6% 7.5%
61-65 years 2.5% 3.2% 1.8% 3.2%
66 years and over 1.9% 1.8% 2.0% 1.2%
Data Source: TEDS

56
Substance Abuse Treatment Admission, Age 12+, ND, Alcohol-Only, by Race
Data Source: TEDS
Substance Abuse Treatment Admission, Age 12+, ND, Alcohol with Secondary Drug, by
Race
Data Source: TEDS

57
Alcohol in North Dakota: Modifiable Risks
Source of Alcohol for Youth
About the Indicator
The source from where alcohol is accessed is a crucial intervening variable impacting underage
drinking. These sources include access from retail establishments such as bars or liquor stores, or
socially by individuals such as parents, family members, and friends.
Data Source(s)
Wyoming Survey & Analysis Center (WYSAC): North Dakota Community Readiness Survey
(CRS)
Centers for Disease Control and Prevention (CDC): Youth Risk Behavior Survey (YRBS)
Section Summary
The majority (81.3%) of North Dakota adults held the perception that it was not at all
difficult or slightly difficult for youth in their community to sneak alcohol from their home or
a friend’s home (ND CRS, 2015).
In 2017, female high school students (43.3%) were more likely than male high school
students (30.9%) to obtain alcohol by someone giving it to them.

58
Perception of Youth Access to Alcohol, ND, 2015
How difficult is it for youth in your community to: (Responses show not at all difficult or
slightly difficult)?
Data Source: ND CRS, 2015
Obtained Alcohol by Someone Giving it to Them, High School Students, ND, by Gender
Data Source: YRBS

59
Obtained Alcohol by Someone Giving it to Them, High School Students, ND, by Grade
Level
Data Sources: YRBS
Note: Data for 9th
grade population was not available in 2017.

60
Community Perception Relating to Alcohol
About the Indicator
A community’s perception of social norms can color the lens by which those within a
community see and accept various practices. If communities are more likely to accept underage
drinking, it is likely that higher rates of underage drinking will occur. In like manner, the
opposite holds true, and modified perceptions and perceived risks change actions, habits, and
ultimately outcomes.
Data Source(s)
Wyoming Survey & Analysis Center (WYSAC): North Dakota Community Readiness Survey
(CRS)
Wyoming Survey & Analysis Center: North Dakota Survey of Young Adults (NDSOYA)
Centers for Disease Control and Prevention (CDC): Youth Risk Behavior Survey (YRBS)
Section Summary
The majority of ND adults (78.1%) held the belief that alcohol use in the community was a
problem among youth (ND CRS, 2015).
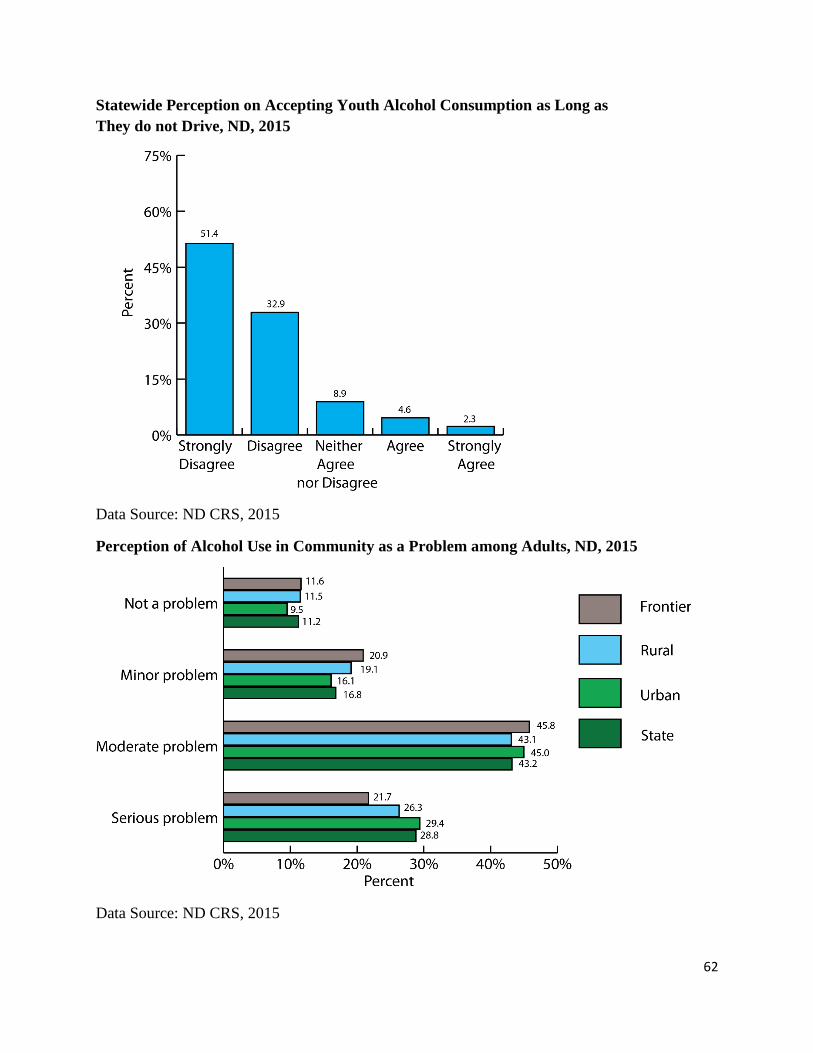
The majority of North Dakota adults disagreed (84.3% disagree or strongly disagree) that
youth should be able to drink as long as they don’t drive afterwards (ND CRS, 2015).
North Dakota adults in urban communities reported higher rates of concern regarding alcohol
use as a serious problem when compared to both rural and frontier communities. More
individuals located in frontier communities perceived alcohol use as either a minor problem
or not an issue at all (ND CRS, 2015).

61
Statewide Perception of Alcohol Use in Community as a Problem among Youth, ND, 2015
Data Source: ND CRS, 2015
Perception of Underage Drinking as a Problem, Young Adults (18-29), ND, 2016
Data Source: NDSOYA, 2016
62
Statewide Perception on Accepting Youth Alcohol Consumption as Long as
They do not Drive, ND, 2015
Data Source: ND CRS, 2015
Perception of Alcohol Use in Community as a Problem among Adults, ND, 2015
Data Source: ND CRS, 2015

63
Substance Abuse in North Dakota
Section 2. Tobacco: Use, Consequences, and Modifiable
Risks

64
Tobacco and Nicotine in North Dakota: Use
Youth Tobacco Use
About the Indicator
The Center for Disease Control and Prevention (2017) reports that the use of tobacco is started
and established mainly during adolescence age and almost 9 out of 10 cigarette smokers first
tried smoking by age 18. Each day in the United States, more than 3,200 youth aged 18 years or
younger smoke their first cigarette, and an additional 2,100 youth and young adults become daily
cigarette smokers. This report also stated that about 3.1% of middle school students and 9.6% of
high school students in the United States reported using two or more tobacco products in a
month.
Data Source(s)
North Dakota Youth Tobacco Survey (YTS)
Section Summary
Roughly 82% of middle school students in North Dakota reported no use of tobacco in their
lifetime (YTS, 2016).
More than one third (38.7%) of North Dakota high school students reported using tobacco at
least once in their lifetime (YTS, 2016).
North Dakota middle school female students (35.9%) reported higher rates of use cigarettes
than their male counterparts (33.8%) (YTS, 2016).
North Dakota high school male students (30.4%) were more likely than their female
counterparts (28.5%) to use cigarettes (YTS, 2016).
North Dakota female students, in both middle and high school were more likely to use chew,
snuff, or dip than their male counterparts (YTS, 2016).

65
Lifetime Tobacco Use, Middle School Students, ND
Data Source: YTS
Tobacco Products Ever Tried, Middle School Students, ND, by Gender
Data Source: YTS

66
Lifetime Tobacco Use, High School Students, ND
Data Source: YTS
Tobacco Products Ever Tried, High School Students, ND, by Gender
Data Source: YTS
67
Adult Tobacco Use
About the Indicator
Though the number of adults currently smoking decreased over the past decade, cigarette
smoking remains the leading cause of preventable disease and death in the United States.
Cigarette smoking accounts for more than 480,000 deaths every year, or one in every five deaths
(US Department of Health and Human Services).
Data Source(s)
Substance Abuse and Mental Health Services Administration (SAMHSA): National Survey on
Drug Use and Health (NSDUH)
North Dakota Department of Health (NDDOH): Adult Tobacco Survey (ATS)
Section Summary
There was a slight decline in the number of adults who reported tobacco use in the past
month, both in North Dakota and the United States, between 2013 and 2015 (NSDUH, 2017).
Between 2012 and 2015, the percentage of North Dakota adults (aged 18-25 and 26+) who
reported tobacco use in the past month remained higher than U.S. adult use of the same age
(NSDUH, 2017).
There was a slight reduction in the number of North Dakota adults who had reported using
cigarettes at least once in their lifetime between the years 2012 and 2015 (ATS, 2015).
From 2012 to 2015, North Dakota reported a slight increase in the percentage of adults who
had ever used chewing tobacco in their lifetime (ATS, 2015).
The percentage of North Dakota adults who reported trying e-cigarettes has more than
doubled between the years 2012 (8.9%) and 2015 (21.2%) (ATS, 2015).

68
Any Tobacco Use in past Month, ND vs. US, by Age
Data Source: NSDUH
Ever Tried Tobacco Products in Lifetime, Adults (18+), ND, by Year (2012 and 2015)
Data Source: ATS

69
Tobacco Use Initiation Among Youth
About the Indicator
Nine out of ten smokers start before the age of 18, and every day more than 3,200 youth (under
the age of 18) smoke a cigarette for the first time. Approximately 2,100 youth and young adults
became daily smokers when they were adults (U.S Department of Health and Human Services,
2017).
Data Source(s)
North Dakota Youth Tobacco Survey (YTS)
Centers for Disease Control and Prevention (CDC): Youth Risk Behavior Surveillance System
(YRBS)
Section Summary
Cigarettes were the most common form of tobacco consumption among North Dakota high
school students who reported initial use of tobacco before age 11 (YTS, 2016).
The percentages of high school students who used cigarettes before age 13 for the first time
were higher in North Dakota (7.2%) than the United States (6.6%) (YRBS, 2015).
Since 2009, fewer high school females used cigarettes before age 13 than their male
counterparts (YRBS, 2015).
Used Tobacco Products for the First Time before Age 11, High School Students, ND
Data Source: YTS 2015

70
Smoked a Whole Cigarette before Age 13 for the First Time, High School Students, ND vs.
US
Data Source: YRBS
Data Note: The 2017 YRBS does not ask this question.
Smoked a Whole Cigarette before Age 13 for the First Time, High School Students, ND, by
Gender.
Data Source: YRBS

71
Youth Cigarette Smoking
About the Indicator
The CDC reports that if smoking continues at the current rate among youth in the United States,
approximately 1 out of every 14 American youth will die early from a smoking-related illness.
Data Source(s)
Wyoming Survey & Analysis Center (WYSAC): North Dakota Community Readiness Survey
(CRS)
Substance Abuse and Mental Health Services Administration (SAMHSA): National Survey on
Drug Use and Health (NSDUH)
North Dakota Youth Tobacco Survey (YTS)
Centers for Disease Control and Prevention (CDC): Youth Risk Behavior Surveillance System
(YRBS)
Section Summary
In 2015, 90% of adults in North Dakota either disagreed or strongly disagreed with the notion
that youth cigarette smoking was ok (CRS, 2015).
The percentage of both North Dakota and United States youth, aged 12-18, who perceived a
great level of risk to one’s health if smoking one or more packs of cigarettes per day
increased from 2014 to 2016 (NSDUH, 2016).
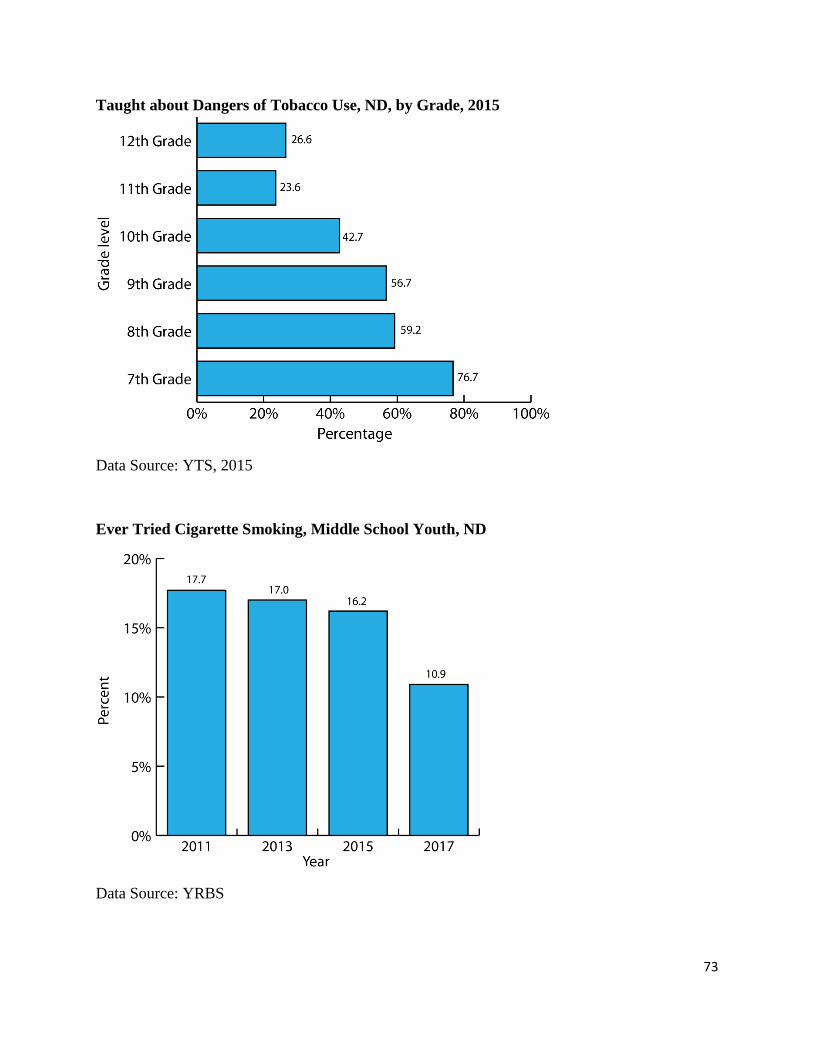
Current cigarette use among North Dakota middle school students declined between 2011
and 2017 (YRBS, 2017).
More North Dakota male middle school students engaged in cigarette smoking when
compared to their female peers between 2013 and 2015; however, the opposite was true in
2017 (YRBS, 2017).
The percentage of North Dakota and United States high school students who reported ever
using a cigarette declined from 2011 to 2015 (no U.S. data reported for 2017; YRBS).
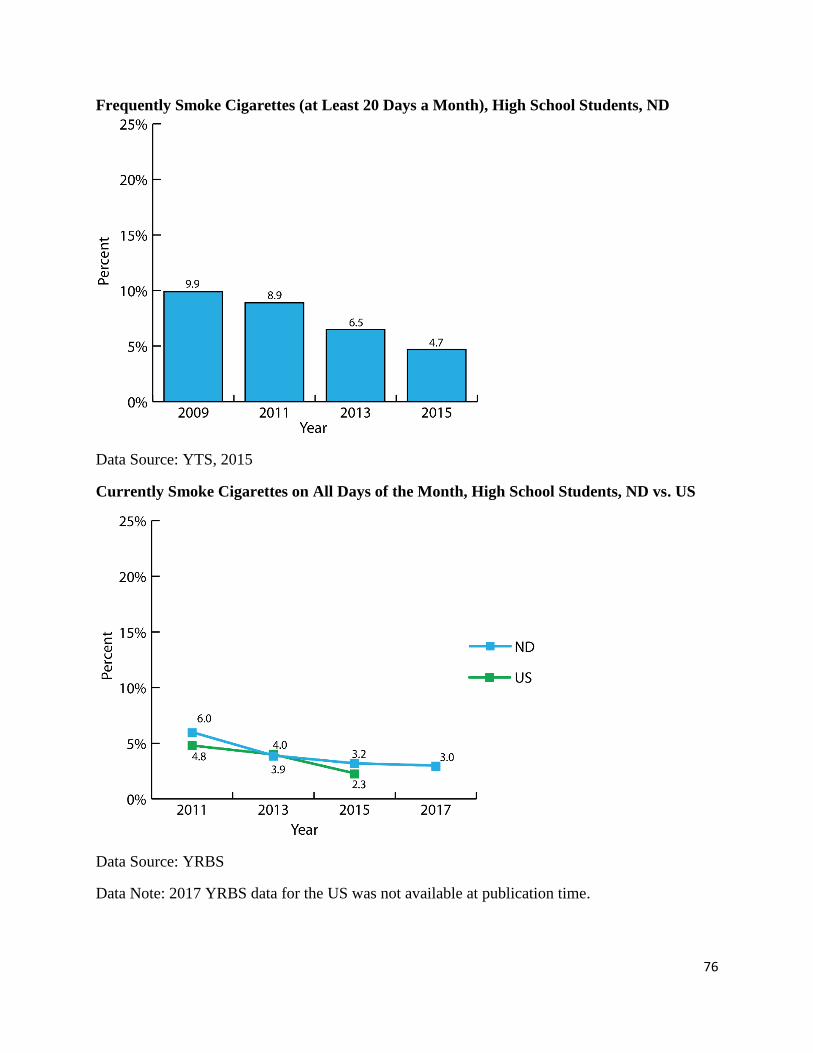
The percentage of North Dakota high school students frequently using cigarettes (20 or more
days within the past month) declined between 2009 and 2015 (YTS, 2016).
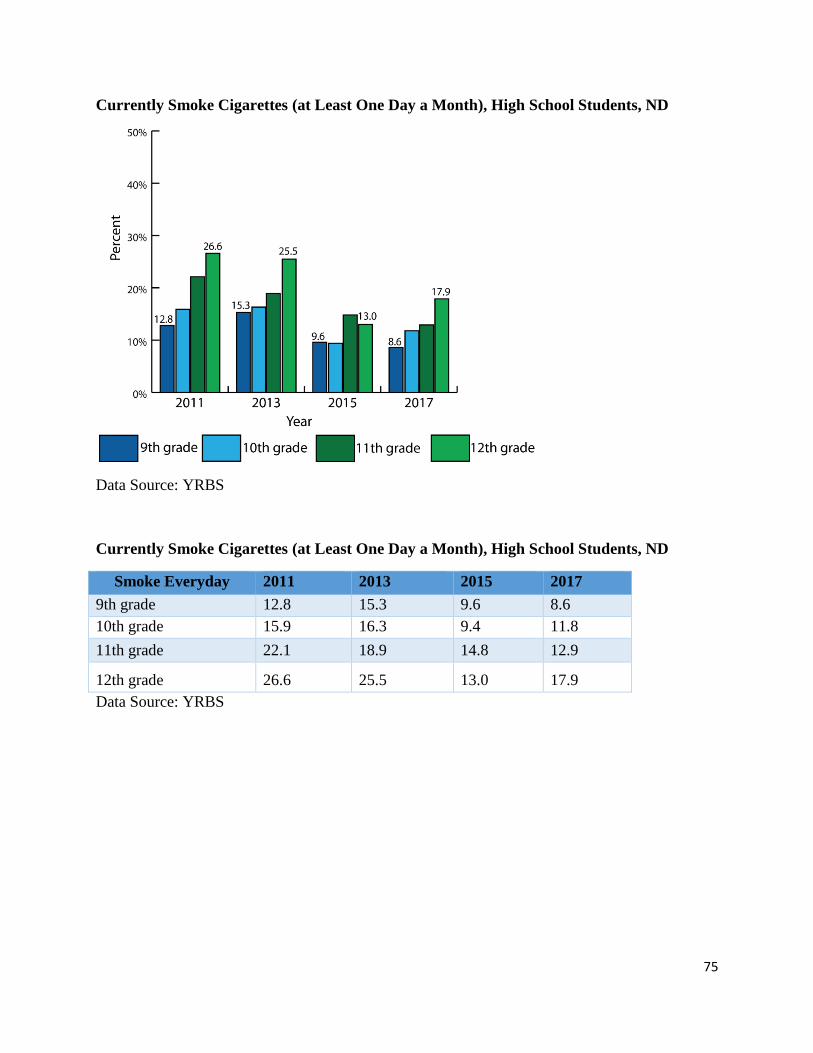
In 2015, more North Dakotan high school students (3.2 %) reported engaging in daily
cigarette use within a month compared to high school students (2.3%) nationally (YRBS,
2017).

72
Perception that it is Okay for Youth to Smoke Cigarettes, ND, 2015
Data Source: ND CRS, 2015
Youth (aged 12-18) Perception of Great Risk from Smoking One or More Packs of
Cigarettes Daily, ND vs. US, 2014, 2016
Data Source: NSDUH, 2016
73
Taught about Dangers of Tobacco Use, ND, by Grade, 2015
Data Source: YTS, 2015
Ever Tried Cigarette Smoking, Middle School Youth, ND
Data Source: YRBS

74
Ever Tried Cigarette Smoking, High School Students, ND vs. US.
Data Source: YRBS
Data Note: 2017 YRBS data for the US was not available at publication time.
Currently Smoke Cigarettes on at Least 20 Days a Month, Middle School Students, ND, by
Gender
Data Source: YRBS
75
Currently Smoke Cigarettes (at Least One Day a Month), High School Students, ND
Data Source: YRBS
Currently Smoke Cigarettes (at Least One Day a Month), High School Students, ND
Smoke Everyday 2011 2013 2015 2017
9th grade 12.8 15.3 9.6 8.6
10th grade 15.9 16.3 9.4 11.8
11th grade 22.1 18.9 14.8 12.9
12th grade 26.6 25.5 13.0 17.9
Data Source: YRBS
76
Frequently Smoke Cigarettes (at Least 20 Days a Month), High School Students, ND
Data Source: YTS, 2015
Currently Smoke Cigarettes on All Days of the Month, High School Students, ND vs. US
Data Source: YRBS
Data Note: 2017 YRBS data for the US was not available at publication time.

77
Adult Cigarette Smoking
About the Indicator
Cigarette smoking is the principal cause of preventable diseases and deaths in the United States.
The CDC (2016) reports that in 2015, about 15.1% of adults in the United States aged 18 years
or older currently smoke cigarettes. This means about 36.5 million adults in the United States
currently smoke cigarettes. Additionally, men (16.7%) are more likely to be current cigarette
smokers than women (13.6%).
Data Source(s)
Substance Abuse and Mental Health Services Administration (SAMHSA): National Survey on
Drug Use and Health (NSDUH)
Centers for Disease Control and Prevention (CDC): Behavioral Risk Factor Surveillance System
(BRFSS)
Current smoker: Those who smoked tobacco on at least one of the thirty days preceding
the survey.
Section Summary
The percentage of adults who had reported any cigarette use in the past month in both North
Dakota and the United States declined between the years 2012 and 2015 (NSDUH, 2017).
The percentage of North Dakota adults using cigarettes daily or monthly was higher than the
U.S. adult average between 2012 and 2015 (NSDUH, 2017).
North Dakota and the United States adults reported a general decrease in daily cigarette use
between 2012 to 2015 (NSDUH, 2017).
The percentage of North Dakota adult males reporting current cigarette use in the past month
was higher than females between the years 2012 and 2015 (BRFSS, 2017).
North Dakota adults aged 65 and older reported lower rates of daily smoking when compared
to other age groups. In 2015, about 5.8% of adults aged 65 and older smoked daily (BRFSS,
2017).

78
Any Cigarette Use in the Past Month, ND vs. US, by Age
Data Source: NSDUH
Smoking Status, Adults (18+), ND vs. US
Data Source: BRFSS

79
Smoking Status, Adults (18+), ND vs. US
Smoke Everyday 2012 2013 2014 2015
ND 15.5% 15.6% 14.4% 13.7%
US 13.5% 13.4% 12.9% 11.9%
Former Smoker 2012 2013 2014 2015
ND 24.7% 25.2% 24.1% 24.5%
US 25.2% 25.3% 25.0% 25.1%
Never Smoked 2012 2013 2014 2015
ND 54.1% 53.7% 56.0% 56.8%
US 54.4% 55.0% 55.9% 56.5%
Data Source: BRFSS
Daily Smoking, Adults (18+), ND vs. US
Data Source: NSDUH

80
Daily Smoking, Adults, ND, by Age
Data Source: BRFSS
Daily Smoking, Adults, ND, by Age
Age Group 2012 2013 2015=4 2016=5
18-24 14.4% 17.9% 13.8% 13.8%
25-34 21.4% 21.9% 17.5% 16.2%
35-44 19.8% 15.9% 19.0% 17.4%
45-54 19.8% 16.9% 18.3% 15.4%
55-64 13.9% 15.3% 12.6% 15.2%
65+ 5.6% 7.3% 6.9% 5.8%
Data Source: BRFSS

81
Current Smokers, Adults (18+), ND vs. US
Data Source: BRFSS
Current Smokers, Adults (18+), ND, by Gender
Data Source: BRFSS

82
Current Smokers, Adults (18+), ND vs. US, by Race/Ethnicity
Data Source: BRFSS
83
Youth Smokeless Tobacco Use
About the Indicator
Although cigarette smoking in the United States has been on the decline, the use of smokeless
tobacco among youth has remained consistent since 1999 (CDC, 2016). Smokeless tobacco is
just as unhealthy as smoking and can lead to nicotine addiction. It causes cancer of the mouth,
tongue, cheek, gum, esophagus, and pancreas, it increases the risks for early delivery and
stillbirth when used during pregnancy, and it causes nicotine poisoning in children and may
increase the risk for death from heart disease and stroke (CDC, 2016).
Data Source(s)
North Dakota Youth Tobacco Survey (YTS)
Centers for Disease Control and Prevention (CDC): Youth Risk Behavior Surveillance System
(YRBS)
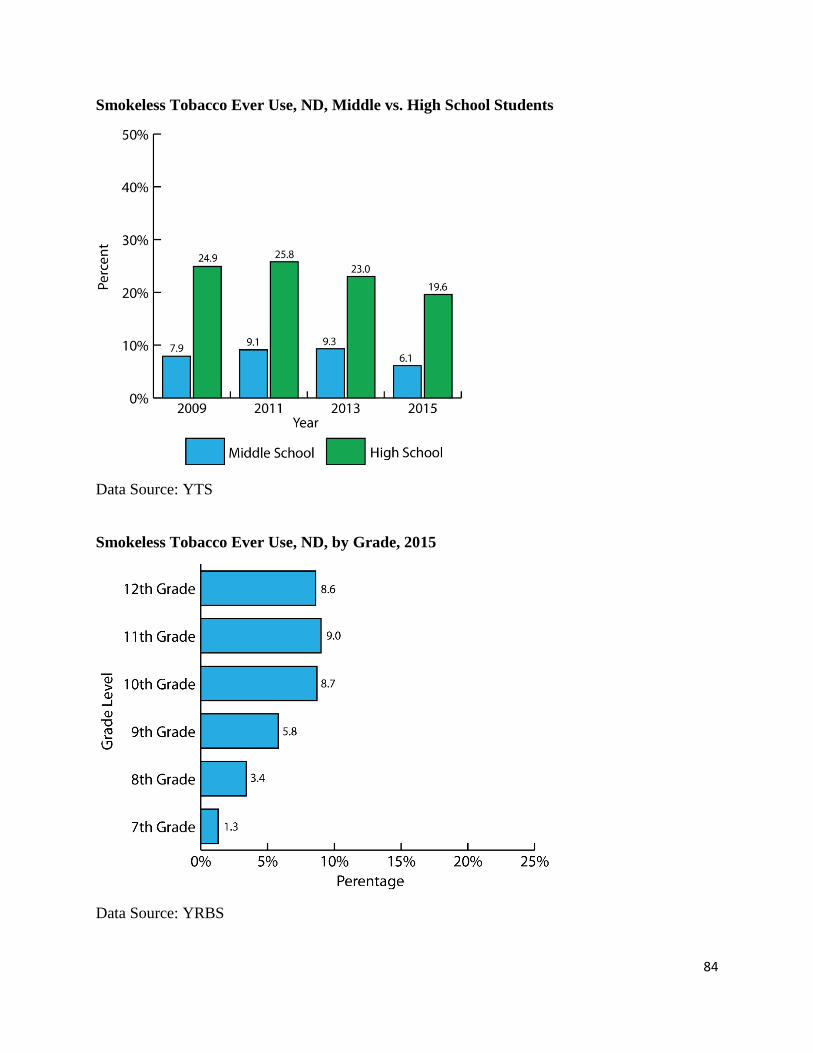
Section Summary
North Dakota high school students were more likely to use smokeless tobacco than North
Dakota middle school students between the years 2009 and 2015 (YTS, 2016).
A higher percentage of North Dakota high school students currently used smokeless tobacco
when compared to high school students nationally between the years 2011 and 2015 (YRBS,
2015).
North Dakota high school students reported decreased current smokeless tobacco use in 2017
(8.0 %) compared to 2015 (10.6 %) (YRBS, 2017).
As North Dakota students advanced to higher grades, they were more likely to engage in
frequent smokeless tobacco use (YTS, 2016).
84
Smokeless Tobacco Ever Use, ND, Middle vs. High School Students
Data Source: YTS
Smokeless Tobacco Ever Use, ND, by Grade, 2015
Data Source: YRBS

85
Current Smokeless Tobacco Use, ND, Middle vs. High School Students
Data Source: YTS
Current Smokeless Tobacco Use (at least one day during the Month), High School
Students, ND vs. US
Data Source: YRBS
Data Note: 2017 YRBS data for the US was not available at publication time.

86
Frequent Smokeless Tobacco Use, Middle vs. High School, ND
Data Source: YTS
Frequent Smokeless Tobacco Use, ND, by Grade Level
Data Source: YTS

87
Tobacco Use among Pregnant Women
About the Indicator
Smoking during and after pregnancy may cause Sudden Infant Death Syndrome (SIDS), which is
an infant death where the cause of death cannot be found. Additionally, the likelihood of a
woman experiencing a miscarriage is increased when smoking and babies born to women who
smoke are more likely to have certain birth difficulties (CDC, 2016).
Data Source(s)
North Dakota Department of Health, Tobacco Prevention and Control: Tobacco Surveillance
Data
Section Summary
In North Dakota, the percentage of women who reported tobacco use during pregnancy
decreased from 2012 to 2015 (North Dakota Department of Health, Tobacco Prevention and
Control, 2017).
Women Using Tobacco Products during Pregnancy, Adults, ND
Data Source: North Dakota Department of Health, Tobacco Prevention and Control: Tobacco
Surveillance Data

88
Tobacco and Nicotine in North Dakota: Consequences
Diseases
About the Indicator
The U.S Department of Health and Human Services (2017) reports that over 16 million
Americans live with smoking-related health problems, such as emphysema, bronchitis, heart
disease, pregnancy-related problems, among others. In addition, smokers today are much more
likely to develop lung cancer than smokers were in the past. In fact, almost 90% of lung cancers
are caused by smoking.
Data Source(s)
Adults
Estimation of Cigarette Smoking–Attributable Morbidity in the United States, Journal of
American Medical Association Internal Medicine (JAMA)
North Dakota Department of Health, Tobacco Prevention and Control
Section Summary
Prevalence ratios for both current and former smokers in the United States were higher than
those who had never smoked for most conditions among those surveyed between 2006 and
2012 (JAMA).
Lung Cancer prevalence ratios were notably higher for both current (men: 5.7, women: 4. 5)
and former (men: 5.1 women: 9.4) smokers than nonsmokers surveyed between 2006 and
2012 (JAMA).
North Dakota spent approximately $756 per capita on smoking related medical expenditures
and productivity loss costs each year (North Dakota Department of Health, Tobacco
Prevention and Control).

89
Adjusted Prevalence Ratios of Smoking- Attributable Diseases by Smoking Status, Males,
US, 2006-2012
Data Source: NHIS, Adaptation by JAMA
Data Note: Abbreviation chronic obstructive pulmonary disease (COPD).
Data Note: Other cancers include: bladder, cervix, colon/rectum, kidney,
larynx/mouth/tongue/lip/throat/pharynx, and stomach.
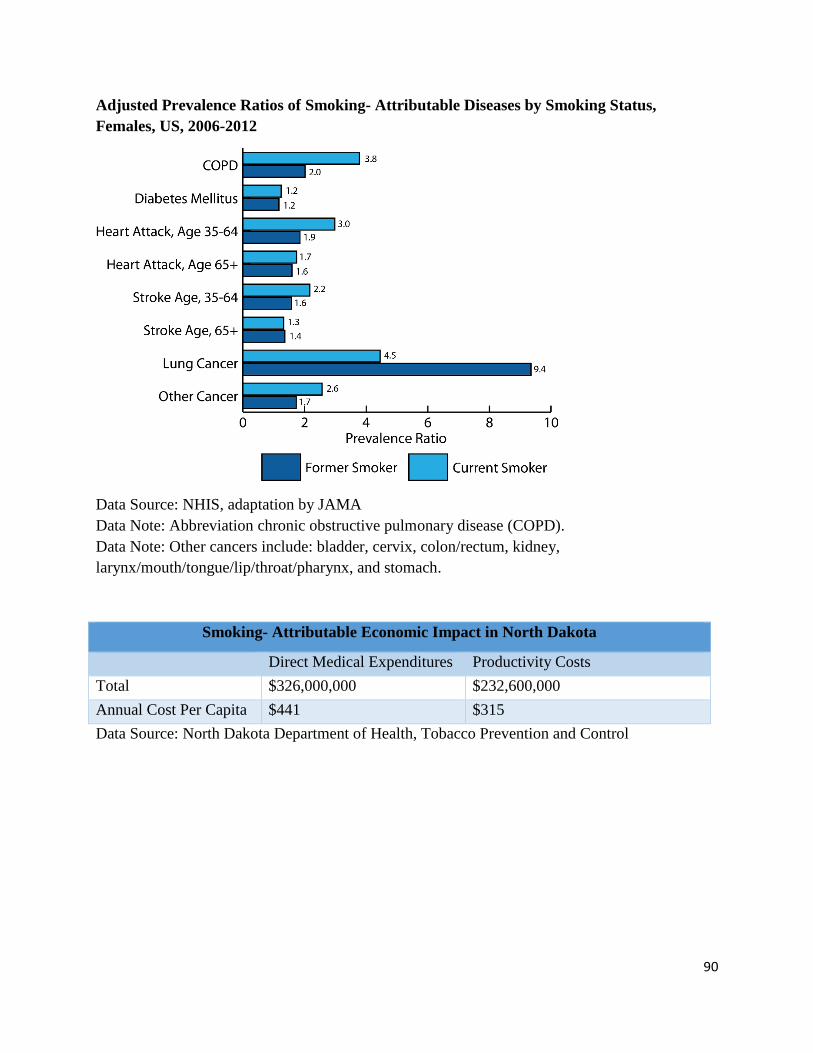
90
Adjusted Prevalence Ratios of Smoking- Attributable Diseases by Smoking Status,
Females, US, 2006-2012
Data Source: NHIS, adaptation by JAMA
Data Note: Abbreviation chronic obstructive pulmonary disease (COPD).
Data Note: Other cancers include: bladder, cervix, colon/rectum, kidney,
larynx/mouth/tongue/lip/throat/pharynx, and stomach.
Smoking- Attributable Economic Impact in North Dakota
Direct Medical Expenditures Productivity Costs
Total $326,000,000 $232,600,000
Annual Cost Per Capita $441 $315
Data Source: North Dakota Department of Health, Tobacco Prevention and Control

91
Tobacco- Attributed Deaths
About the Indicator
The U.S Department of Health and Human Services (2017) indicates that tobacco is the principal
source of preventable illness and death in the United States, resulting in one out of every five
deaths or over 480,000 deaths every year. Many people who had Chronic Obstructive Pulmonary
Disease (COPD) were smokers, and almost 8 out of 10 deaths from COPD were a result of
smoking. In addition to COPD, lung cancer is the leading cause of cancer death among both men
(90%) and women (80%) in the United States.
Data Source(s)
North Dakota Department of Health: ND Vital Records
Centers for Disease Control and Prevention (CDC): CDC Wonder
Centers for Disease Control and Prevention. Tobacco Use Data Portal: Smoking-Attributable
Mortality, Morbidity, and Economic Costs (SAMMEC)
Section Summary
The average Smoking- Attributable Mortality (SAM) in North Dakota for the years 2005 to
2009 was higher among men (610) than females (380; 19 years old and older) (380)
(SAMMEC, 2017).
In 2015, North Dakota males reported greater lung and bronchus cancer mortality rates than
females (CDC Wonder, 2017).
COPD- attributed death rates in North Dakota have increased between 2012 and 2015 (CDC
Wonder, 2017).
Age-adjusted heart disease mortality rates for North Dakota have declined slightly from 2012
to 2015, ranging from 151.6 to 142.4 per 100,000 (CDC Wonder, 2017).
Age-adjusted lung and bronchus cancer mortality rates for North Dakota have declined from
2012 to 2015, ranging from 42.2 to 34.4 per 100,000, respectively (CDC Wonder, 2017).
Between the years 2014 and 2015, the number of deaths related to cerebrovascular diseases
in North Dakota decreased slightly (35.5 to 33.4 per 100,000) (CDC Wonder, 2017).

92
Cause of Death, ND, 2016
Data Source: ND Vital Records
Average Annual Smoking-Attributable Mortality, Adults (19+), ND vs. US, 2005-2009
Average Smoking-Attributable Mortality in North Dakota
North Dakota United States
Total 980 437,400
Male 610 254,100
Female 380 183,300
Data Source: SAMMEC

93
Chronic Obstructive Pulmonary Disease Mortality Rate, ND vs. US
Data Source: CDC Wonder
Chronic Obstructive Pulmonary Disease Mortality Rate, ND, by Gender
Data Source: CDC Wonder

94
Diseases of the Heart Mortality Rate, ND vs. US
Data Source: CDC Wonder
Diseases of the Heart Mortality Rate, ND, by Gender
Data Source: CDC Wonder
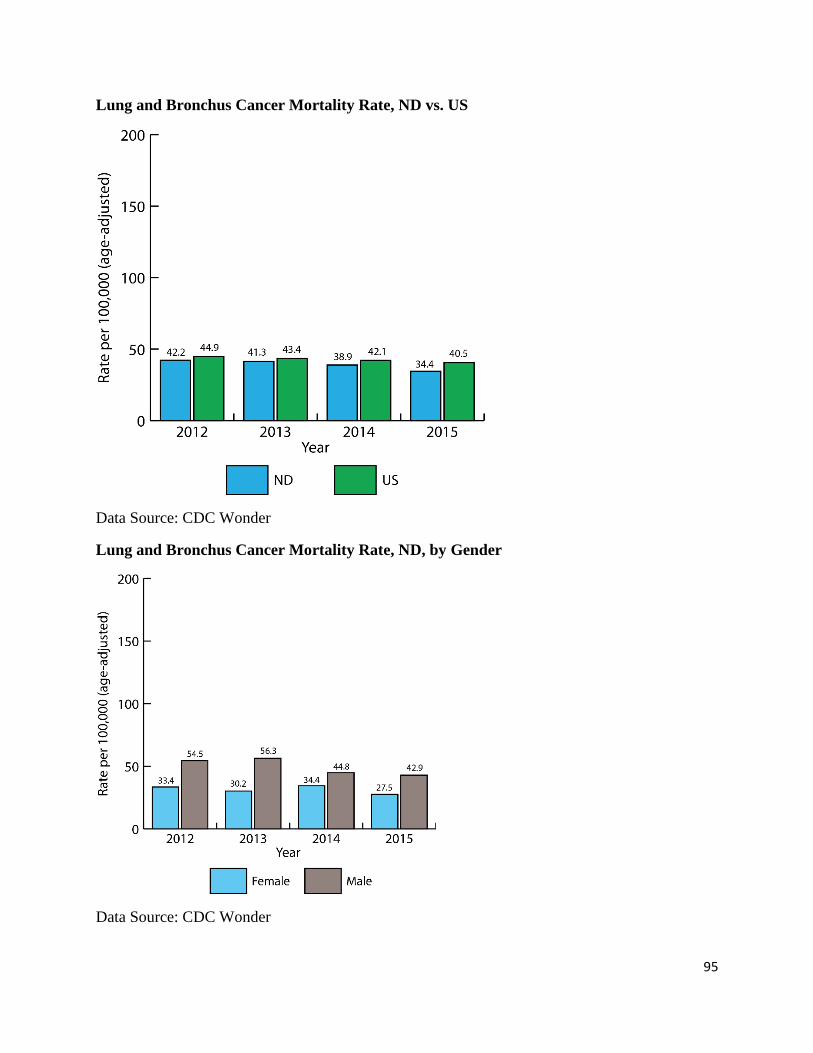
95
Lung and Bronchus Cancer Mortality Rate, ND vs. US
Data Source: CDC Wonder
Lung and Bronchus Cancer Mortality Rate, ND, by Gender
Data Source: CDC Wonder

96
Cerebrovascular Disease Mortality Rate, ND vs. US
Data Source: CDC Wonder
Cerebrovascular Disease Mortality Rate, ND, by Gender
Data Source: CDC Wonder

97
Tobacco and Nicotine in North Dakota: Modifiable Risks
Youth Cessation/ Quit Attempts
About the Indicator
Tobacco use can lead to tobacco/nicotine dependence and serious health problems. Quitting
smoking greatly reduces the risk of developing smoking-related diseases. Tobacco/nicotine
dependence is a condition that often requires repeated treatments, but there are helpful treatments
and resources for quitting. Smokers can and do quit smoking. In fact, today there are more
former smokers than current smokers (CDC).
Data Source(s)
North Dakota Youth Tobacco Survey (YTS)
Current smoker: Those who smoked tobacco on at least one of the thirty days preceding
the survey.
North Dakota Department of Public Instruction: North Dakota Youth Risk Behavior Survey
(YRBS)
Current smoker: Those who smoked tobacco on at least one of the thirty days preceding
the survey.
Frequent smoker: Those who smoked tobacco on twenty or more of the thirty days
preceding the survey.
Section Summary
Between 2011 and 2015, North Dakota reported higher rates of high school students who
tried to quit smoking cigarettes than the U.S. high school average (YRBS, 2017).
Between 2011 and 2017, a greater percentage of North Dakota male high school students had
not attempted to quit smoking compared to female students (YRBS, 2011-2017).
The percentage of North Dakota high school students who planned to quit smoking for good
decreased from 2013 (31.8%) to 2015 (27.8%); yet, more high school students reported
wanting to quit in 2015 (56.4%) than 2013 (48.9%) (YTS).

98
Perception that Frequent Smokers Would Be Able to Quit, Middle vs. High School
Students, ND
Data Source: YTS
Perception that Current Smokers Would Be Able to Quit, Middle vs. High School Students,
ND
Data Source: YTS

99
Current Smokers Who Did Not Try to Quit Smoking Cigarettes in the Past Year, ND vs.
US
Data Source: YRBS
Data Note: 2017 YRBS data for the US was not available at publication time.
Current Smokers Who Did Not Try to Quit Smoking Cigarettes in the Past Year, High
School Students, ND, by Gender
Data Source: YRBS

100
Current Smokers Who Want to Quit, Middle vs. High School Students, ND
Data Source: YTS
Current Smokers Who Plan to Quit for Good, Middle vs. High School Students, ND
Data Source: YTS

101
Adult Cessation/Quit Attempts
About the Indicator
Quitting smoking helps to reduce the risk of developing smoking-related diseases and early
death. Tobacco/nicotine dependence is a condition that often requires repeated treatments, but
effective treatments and resources for quitting are available. Smokers do succeed in quitting
smoking; today, there are more former than current smokers (CDC, 2017). Most current U.S.
adult cigarette smokers (68.0%) reported in 2015 that they wanted to quit completely.
Data Source(s)
Wyoming Survey & Analysis Center (WYSAC): North Dakota Community Readiness Survey
(CRS)
Centers for Disease Control and Prevention (CDC): Behavioral Risk Factor Surveillance System
(BRFSS)
North Dakota Department of Health, Tobacco Prevention and Control
Section Summary
The majority of North Dakota adults held the perception that peer tobacco use was a
moderate or serious problem within their community. A slightly greater percentage of adults
from rural and frontier areas of the state perceived adult tobacco use as not being a problem,
compared to those in urban areas. (ND CRS, 2015).
Approximately, one in five adults attempted to quit for the 18-24, 25-34, and 35-44 age
groups in 2015 (BRFSS, 2015).
North Dakota Department of Health, Tobacco Prevention and Control (2017) reported a
downward trend in the number of enrollees in the tobacco cessation program, NDQuits,
between the years 2012 and 2015.
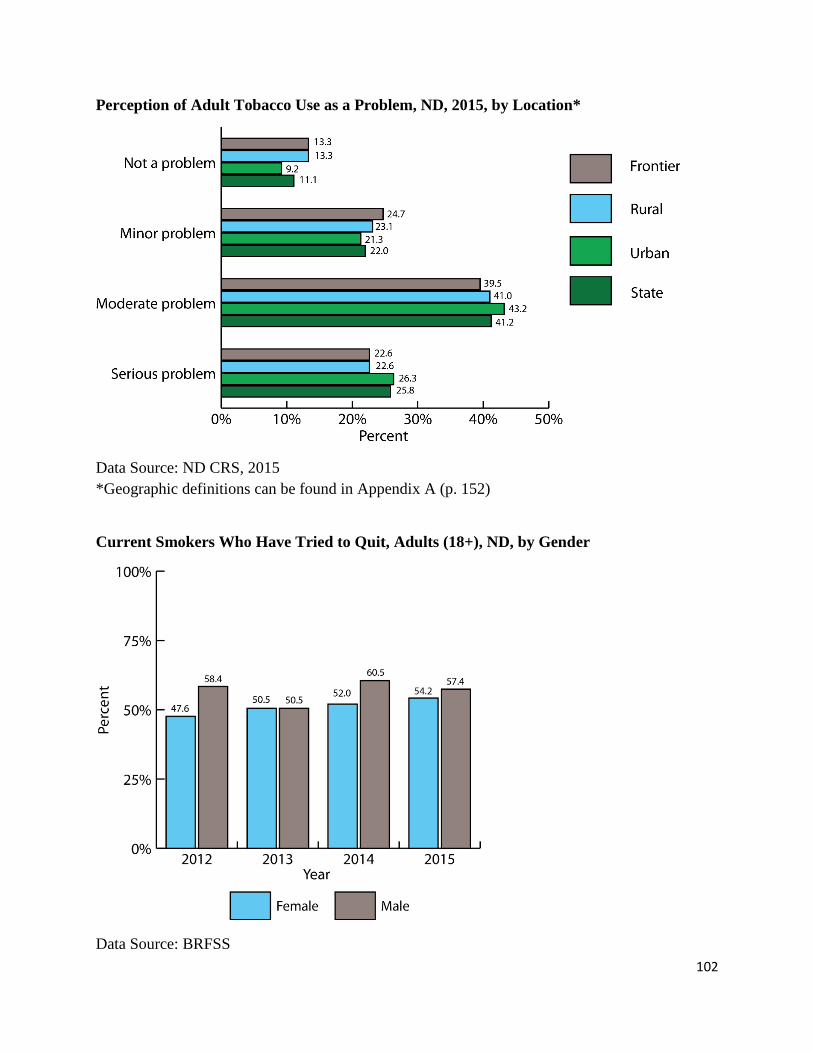
102
Perception of Adult Tobacco Use as a Problem, ND, 2015, by Location*
Data Source: ND CRS, 2015
*Geographic definitions can be found in Appendix A (p. 152)
Current Smokers Who Have Tried to Quit, Adults (18+), ND, by Gender
Data Source: BRFSS
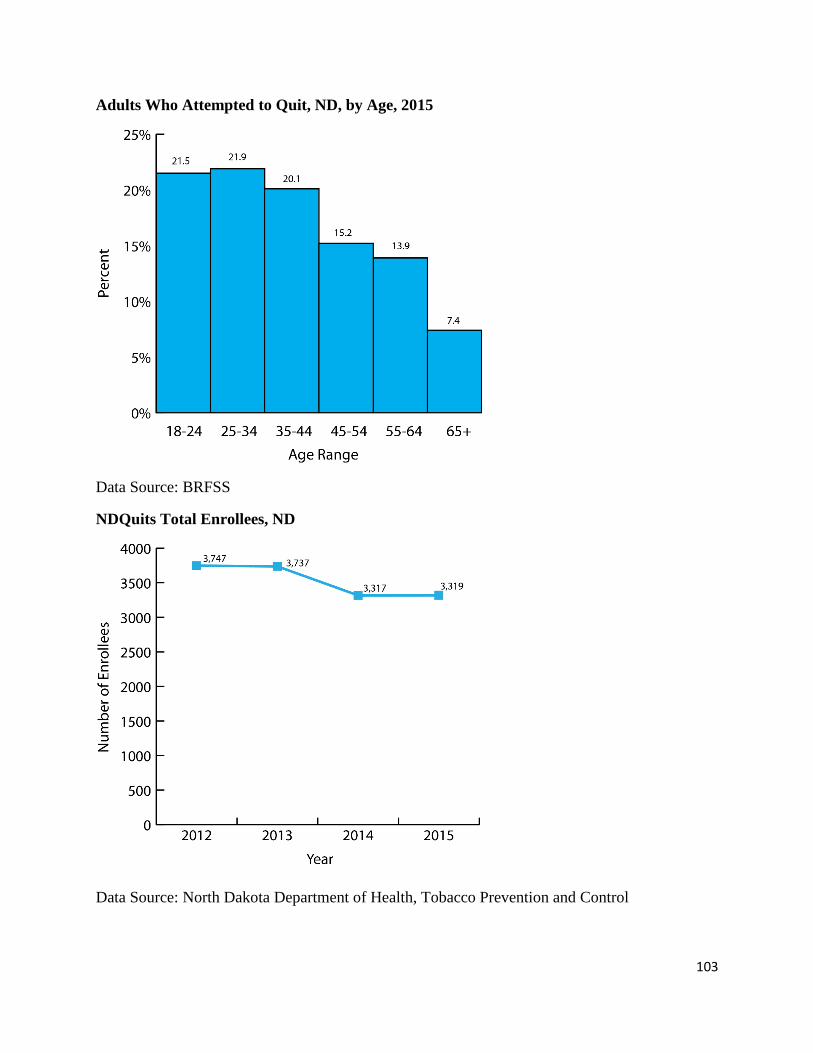
103
Adults Who Attempted to Quit, ND, by Age, 2015
Data Source: BRFSS
NDQuits Total Enrollees, ND
Data Source: North Dakota Department of Health, Tobacco Prevention and Control

104
Percentage of NDQuits Enrollees Who Successfully Quit Using Tobacco, ND, Web vs.
Phone Program
Data Source: North Dakota Department of Health, Tobacco Prevention and Control
Data Note: Quit rate criteria: report no use of cigarettes after seven months after program or no
reported use of other forms of tobacco in the past 30 days.
NDQuits Percent Reach, ND
2012 2013 2014 2015
ND Current Smokers 112,796 115,816 109,943 105,919
NDQuit Total
Enrolment
3,747 3,737 3,317 3,319
NDQuit % Reach 3.32% 3.23% 3.02% 3.13%
Data Source: North Dakota Department of Health, Tobacco Prevention and Control

105
Health and Professional Inquiry
Data Source(s)
North Dakota Youth Tobacco Survey (YTS)
North Dakota Adult Tobacco Survey (ATS)
Section Summary
The percentage of North Dakota middle and high school students who reported that a health
care provider inquired about personal tobacco use increased from 2009 to 2015 (YTS, 2009-
2015).
The percentage of North Dakota middle and high school students who reported that a doctor,
dentist, or nurse had advised them not to use tobacco had increased, in general, from 2009 to
2015 (YTS, 2009-2015).
In 2012 and 2015, the majority of North Dakota adults reported that a doctor, dentist, or other
health profession inquired about their use of cigarettes or tobacco products (ATS, 2015,
2015).
Asked About Tobacco Use by Healthcare Provider in the Past Year, Middle vs. High
School Students, ND
Data Source: YTS

106
Healthcare Provider Advised Not to Use Tobacco in the Past Year, Middle vs. High School
Students, ND
Data Source: YTS
Health Professional Inquiry of Adult (18+) Cigarettes or Tobacco Use in the Past Year, ND
Data Source: ATS

107
Source of Tobacco for Youth
About the Indicator
According to the 2016 Monitoring the Future Survey, almost half of eighth graders and more
than half of tenth graders found it easy to get cigarettes (Monitoring the Future National Survey
Results on Drug Use, 1975-2016). It is essential to know the source of where youth are getting
tobacco to address tobacco use issues among youth. Youth smokers obtained cigarettes most
regularly from retail stores or gas stations where they purchase them directly, or from a familiar
source, such as a friend or acquaintance; although, this can vary from community to community.
Strictly enforcing laws that prohibit tobacco sales to minors could be a focus of intervention.
Data Source(s)
North Dakota Youth Tobacco Survey (YTS)
Centers for Disease Control and Prevention (CDC): Youth Risk Behavior Surveillance System
(YRBS)
Section Summary
For the last decade, the source from where most high school students obtained their cigarettes
was from someone who bought it for them, followed by having asked a friend for one,
referred to as having “bummed” a cigarette (YTS, 2009 - 2015).
In 2011 and 2013, a higher percentage of U.S. high school students, under age 18, bought
cigarettes in a store or gas station compared to those in North Dakota. In 2015 however, the
opposite was true (YRBS, 2011-2017).
In 2017, the percentage of North Dakota high school students who reported buying cigarettes
in a store or gas station in the past month dropped in half from the percentage reported in
2015 (YRBS, 2015-2017).

108
Usual Source for Cigarettes, High School Students, ND
Data Source: YTS
Buying Cigarettes in a Store or Gas Station in the Past Month, High School Students
Younger than 18, ND vs. US
Data Source: YRBS
Data Note: 2017 YRBS data for the US was not available at publication time.

109
Percentage of Students who Thought it was Very Easy to Obtain Tobacco Products, ND, by
Grade Level
Data Source: YTS, 2015

110
Cigarettes Sold and Tax Rate
About the Indicator
The number of cigarettes sold in 2016 (258 billion) in the United States decreased by 2.5% from
264 billion sold in 2015 (CDC, 2016).
Data Source(s)
Wyoming Survey & Analysis Center (WYSAC): North Dakota Community Readiness Survey
(CRS)
State of North Dakota Office of State Tax Commissioner, Cigarette and Tobacco Tax Collections
Federal Transit Administration (FTA)
Orzechowski and Walker. Tax Burden on Tobacco Volume 51
Section Summary
Over 50% of adults in North Dakota were in favor of tobacco tax increases in 2015
regardless of urban/rural designation (ND CRS, 2015).
In 2015, the majority of adults in North Dakota held the perception that e-cigarettes should
be taxed the same as other tobacco products (ND CRS, 2015).
The rate of cigarettes sold in North Dakota decreased from 2014 to 2016 (North Dakota
Office of State Tax Commissioner, 2017).
Tobacco, cigarette, and combined revenues in North Dakota increased from 2013 to 2014.
However, from 2014 to 2016, the combined revenues have declined (North Dakota Office of
State Tax Commissioner, 2017).
In 2017, North Dakota had the lowest excise tax rates on cigarettes ($0.44 per pack) when
compared to surrounding states (FTA, 2017).
The U.S. average excise tax rate was more than triple North Dakota’s rate in 2017 (Tax
Burden on Tobacco, 2017).

111
Perceptions on Tobacco Tax Increases, ND, by Location*, 2015
Data Source: ND CRS, 2015
*Geographic definitions can be found in Appendix A (p. 152)
E-Cigarettes Should be Taxed the Same as Other Tobacco Products, ND, by Location*,
2015
Data Source: ND CRS, 2015
*Geographic definitions can be found in Appendix A (p. 152)

112
Cigarettes Sold, ND
Data Source: North Dakota Office of State Tax Commissioner
Tribal Tobacco Tax Revenue, ND
Data Source: North Dakota Office of State Tax Commissioner

113
Tobacco Product Revenue, ND
Data Source: North Dakota Office of State Tax Commissioner
State Excise Tax Rates on Cigarettes, ND, 2017
State Tax Rate (cents per pack)
North Dakota 44
South Dakota 153
Montana 170
Minnesota 304
U.S. Median 153
Data Source: FTA
States Average Retail Price per Pack (with all taxes), ND, 2016
States States Average Retail Price Per Pack
North Dakota $4.81
South Dakota $6.25
Montana $6.44
Minnesota $8.32
U.S. Average $6.48
Data Source: Orzechowski and Walker. Tax Burden on Tobacco

114
Substance Abuse in North Dakota
Section 3. Illicit Drugs in North Dakota: Use, Consequences,
and Modifiable Risks

115
Illicit Drugs in North Dakota: Use
Marijuana Use
About the Indicator
The National Institutes of Health (NIH) (2016) defines marijuana as the dried leaves, flowers,
stems, and seeds from the hemp plant, which contains the mind-altering chemical delta-9-
tetrahydrocannabinol (THC) and other compounds. Among states recognizing it as an illicit
drug, marijuana, also known as weed, pot, or cannabis, is the most commonly used illegal drug
with 22.2 million users. Marijuana use has many side effects on health including brain damage,
especially among teens because their brain is still developing until the mid-20s (CDC, 2017).
Data Source(s)
Youth
Wyoming Survey & Analysis Center (WYSAC): North Dakota Community Readiness Survey
(CRS)
Centers for Disease Control and Prevention (CDC): Youth Risk Behavior Survey (YRBS)
Adults
Wyoming Survey & Analysis Center (WYSAC): North Dakota Community Readiness Survey
(CRS)
Substance Abuse and Mental Health Services Administration (SAMHSA): National Survey on
Drug Use and Health (NSDUH)
Section Summary
Youth
Roughly two-thirds of the adults in North Dakota held the perception that youth marijuana
use was a problem in their community (moderate or serious problem, 66.3%) (ND CRS,
2015).
The percentage of both North Dakota and United States high school students who reported
first time use of marijuana before age 13 remained relatively stable from 2011 to 2015,
noting a slight increase in 2017 among North Dakota students (YRBS, 2011-2017).
The percentage of male North Dakota high school students who used marijuana for the first
time before age 13 remained higher than their female peers between the years 2011 and 2017
(YRBS, 2011-2017).

116
The percentage of North Dakota high school students who reported current marijuana use (at
least once in the past month) was lower than US rates between 2011 and 2015 (YRBS, 2017).
Among ND high school students who reported using marijuana in the past month, greater use
was reported among those who are Hispanic or Latino in 2015 (YRBS, 2017).
Current marijuana use among ND high school students was higher among males than females
from 2011 to 2015; however, female use was higher than male use in 2017 (YRBS, 2011-
2017).
Adults
Roughly half of the adults in North Dakota (51.4%) perceived adult marijuana use as a
moderate or serious problem in their community (ND CRS, 2015).
North Dakota reported relatively consistent percentages of marijuana use in the last month
for most age groups between years 2012 and 2015, with ND 18-25 year olds reporting the
largest increase between the years 2013 and 2014.
First time marijuana use occurred most frequently among those aged 18-25 in North Dakota
between the years 2012 and 2015 (NSDUH, 2017).
Youth
Perception of Youth Marijuana Use in Community as a Problem ND, by Location*, 2015
Data Source: ND CRS, 2015

117
First Time Using Marijuana before Age 13, High School, ND vs. US
Data Source: YRBS
Data Note: 2017 YRBS data for the US was not available at publication time.
First Time Marijuana Use before Age 13, High School, ND, by Gender
Data Source: YRBS

118
Current Marijuana Use (at Least Once in past Month), High School, ND vs. US
Data Source: YRBS
Data Note: 2017 YRBS data for the US was not available at publication time.
Current Marijuana Use (at Least Once in past Month), High School, ND vs. UD, by
Race/Ethnicity, 2015
Data Source: YRBS
Data Note: 2017 YRBS data for the US was not available at publication time.

119
Current Marijuana Use (at Least Once in past Month), High School, ND, by Gender
Data Source: YRBS
Adult
Perception of Adult Marijuana Use as a Problem in Community, ND, by Location*, 2015
Data Source: ND CRS, 2015
*Geographic definitions can be found in Appendix A (p. 152)

120
Past Year Marijuana Use, ND vs. US, by Age
Data Source: NSDUH
Perception of Great Risk when Smoking Marijuana Once a Month, ND, by Age
Data Source: NSDUH

121
Past Month Marijuana Use, ND vs. US, by Age
Data Source: NSDUH
Initial Marijuana Use Occurring Within the Past Year, ND, by Age
Data Source: NSDUH
122
Cocaine, Ecstasy, Heroin, and Methamphetamine Use
About the Indicator
Commonly reported illicit drugs in the United States include cocaine, ecstasy, heroin, and
methamphetamine. According to the CDC (2015), 10.1% of all individuals over the age of 12
have used illicit drugs in the past month. In 2016, of the 20.1 million Americans with substance
use disorder, 37% struggle with illicit drug use (NSDUH 2017.)
Data Source(s)
Youth
Wyoming Survey & Analysis Center (WYSAC): North Dakota Community Readiness Survey
(CRS)
Centers for Disease Control and Prevention (CDC): Youth Risk Behavior Survey (YRBS)
Adults
2016 Comprehensive Status and Trends Report (ND Trend Report): North Dakota Office of
Attorney General
Substance Abuse and Mental Health Services Administration (SAMHSA): National Survey on
Drug Use and Health (NSDUH)
Wyoming Survey & Analysis Center (WYSAC): North Dakota Community Readiness Survey
(CRS)
Section Summary
Youth
The percentage of North Dakota high school students who reported illicit drug use (cocaine,
ecstasy, or heroin) ever in their lifetime was lower than the United States in 2015 (YRBS,
2015).
In 2015, the largest percentage of cocaine use for students who had ever used was among
Hispanic or Latino high school students, in ND and the US when compared to other races
(YRBS, 2015).

123
Adults
In 2015, the majority of North Dakotan adults (64.8%) perceived adult cocaine use within
their community as not a problem or only a minor problem, regardless of location. Notably,
approximately 85% of those living in the frontier area didn’t perceive adult cocaine use as a
problem (moderate or serious) within their community (ND CRS, 2015).
Between the years 2012 and 2015, the number of amphetamine/methamphetamine, (1,644 to
4,527) marijuana, (4,882 to 5,143) and, heroin (48 to 508) drug cases submitted to the State
Crime Laboratory have increased, respectively (ND Trend Report).
Youth
Perception of Cocaine Use in Community a Problem Among Youth by Location*, ND,
2015.
Data Source: ND CRS, 2015
*Geographic definitions can be found in Appendix A (p. 152)

124
Ever Used Cocaine, Ecstasy, or Heroin, High School Students, ND vs. US, 2015
Data Source: YRBS
Data Note: 2017 YRBS data for the US was not available at publication time.
Data Note: Ever Use Cocaine and Ecstasy data not available on 2017 North Dakota YRBS
report.
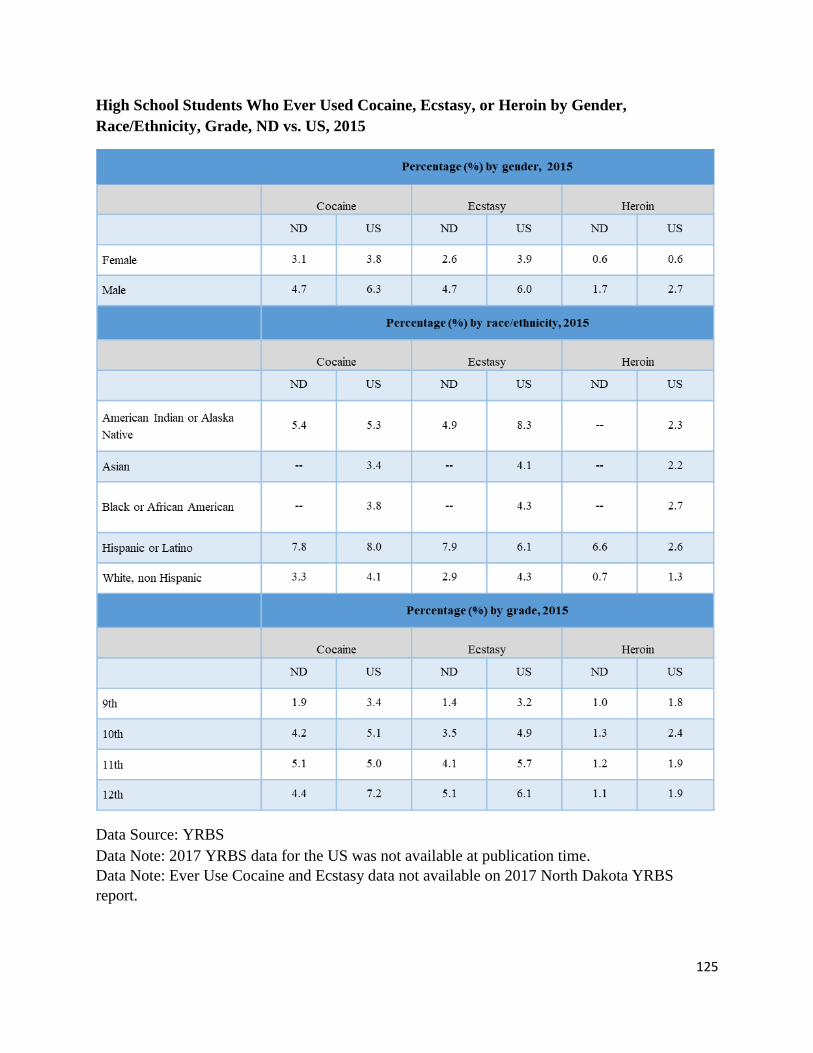
125
High School Students Who Ever Used Cocaine, Ecstasy, or Heroin by Gender,
Race/Ethnicity, Grade, ND vs. US, 2015
Data Source: YRBS
Data Note: 2017 YRBS data for the US was not available at publication time.
Data Note: Ever Use Cocaine and Ecstasy data not available on 2017 North Dakota YRBS
report.

126
Adults
Perception of Cocaine Use in Community as a Problem Among Adults, by Location*, ND,
2015
Data Source: ND CRS, 2015
*Geographic definitions can be found in Appendix A (p. 152)
Cocaine Use in the Past Year, by Age, ND vs. US
Data Source: NSDUH

127
Analyzed Drug Samples by State Crime Lab, Drug Type, ND
Data Source: ND Trend Report, 2016
Analyzed Drug Samples by State Crime Lab, Drug Type, ND
Type of Drug Tested 2012 2013 2014 2015
Methamphetamine/Amphetamine 1,644 2,505 3,968 4,527
Marijuana 4,884 4,793 5,826 5,143
Cocaine 222 123 223 191
Heroin 48 99 310 508
Data Source: ND Trend Report, 2016

128
Illicit Drugs in North Dakota: Consequences
Drug-Related Violations
About the Indicator
The North Dakotan Attorney General reported in 2017 that North Dakota's crime rate per capita
dropped 0.5 percent from 2015, even though the number of drug arrests increased to 11 percent.
According to the North Dakota Code (2016), it is unlawful for any person to
willfully manufacture, distribute, or dispense, or possess with intent to manufacture, distribute,
or dispense, a controlled substance except as authorized.
Data Source(s)
Office of Attorney General Bureau of Criminal Investigation: Crime in North Dakota, 2016
North Dakota Department of Corrections and Rehabilitation (DOCR)
Section summary
The percentage of drug/narcotic violation-related arrests rose from 2013 to 2016 (Crime in
North Dakota, 2016).
From 2013 to 2016, the majority of drug/narcotic violation-related arrests were among males
(Crime in North Dakota, 2016).
The majority of drug/narcotic violation-related arrests were among individuals between the
ages of 18 and 34 (Crime in North Dakota, 2016).
The percentage of adult inmates convicted of drug possession and incarcerated in North
Dakota rose between the years 2013 to 2016 (DOCR, 2016).
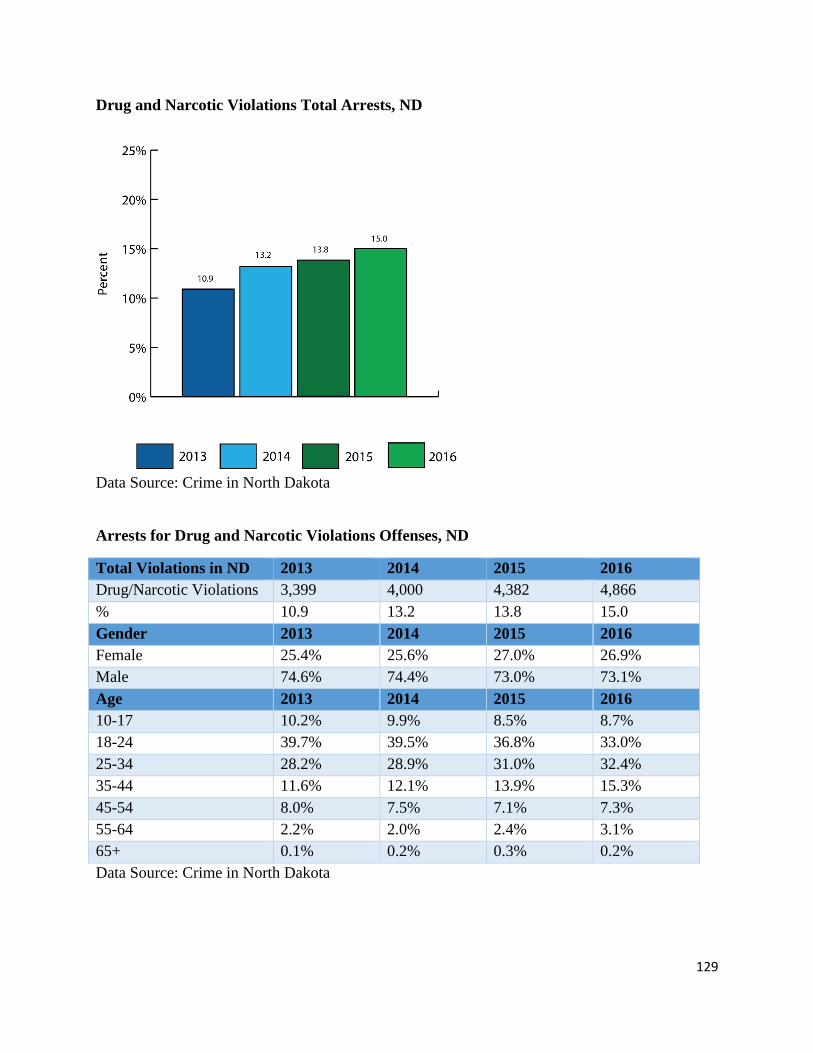
129
Drug and Narcotic Violations Total Arrests, ND
Data Source: Crime in North Dakota
Arrests for Drug and Narcotic Violations Offenses, ND
Total Violations in ND 2013 2014 2015 2016
Drug/Narcotic Violations 3,399 4,000 4,382 4,866
% 10.9 13.2 13.8 15.0
Gender 2013 2014 2015 2016
Female 25.4% 25.6% 27.0% 26.9%
Male 74.6% 74.4% 73.0% 73.1%
Age 2013 2014 2015 2016
10-17 10.2% 9.9% 8.5% 8.7%
18-24 39.7% 39.5% 36.8% 33.0%
25-34 28.2% 28.9% 31.0% 32.4%
35-44 11.6% 12.1% 13.9% 15.3%
45-54 8.0% 7.5% 7.1% 7.3%
55-64 2.2% 2.0% 2.4% 3.1%
65+ 0.1% 0.2% 0.3% 0.2%
Data Source: Crime in North Dakota

130
Drug Types Seized in Drug and Narcotic Violations (for up to Three Drugs), ND
Data Source: Crime in North Dakota
Drug Types Seized in Drug and Narcotic Violations (for up to Three Drugs), ND
Type of Drug Tested 2012 2013 2014 2015
Marijuana/Hashish 61.2% 58.4% 53.1% 51.1%
Stimulants 18.5% 22.0% 25.3% 27.7%
Narcotics 8.0% 9.1% 10.7% 12.0%
All Drug Types 9.7% 8.1% 8.4% 6.3%
Depressants 1.2% 1.3% 1.3% 1.6%
Hallucinogens 1.4% 1.1% 1.2% 1.3%
Data Source: Crime in North Dakota

131
Adult Inmate Population Incarcerated for Drug-related Crimes, ND
Data Source: DOCR

132
Overdose Deaths
About the Indicator
Drug overdose refers to the absorption of a drug or other substance in quantities greater than are
the recommended amount, and an overdose can lead to a toxic state or death. More than 63,600
drug overdose deaths occurred in the United States in 2016 and the rates of drug overdose deaths
increased from 1999 to 2016 for all age groups (CDC, 2017).
Data Source(s)
Centers for Disease Control (CDC): National Center for Health Statistics (NCHS)
Section Summary
Between 2014 and 2015, there was an observed increase in the number of overdose deaths both
in North Dakota and at the national level (NCHS, 2017).
Overdose Deaths in ND and the US
Data Source: NCHS

133
Substance Abuse Treatment Admissions
About the Indicator
Drug addiction is a chronic disease, and individuals with a substance use disorder may require
long-term care to recover. Addiction is a complex but treatable disease that affects people’s
behavior; however, it can be treated more efficiently if quick access to treatment is available.
Data Source(s) Substance Abuse and Mental Health Services Administration (SAMHSA): Treatment Episode
Data Set (TEDS)
Section Summary
The percentage of all substance abuse treatment admissions among North Dakota youth aged
12 to 17 decreased from 2013 to 2016 (TEDS, 2017).
The percentage of substance abuse treatment admissions among the age group 12 and older
in North Dakota for amphetamines and opiates rose from 2013 to 2016 (TEDS, 2017).
The percentage of substance abuse treatment admissions among North Dakota adults aged 26
to 35 increased from 2013 to 2016 (TEDS, 2017).
Substance Abuse Treatment Admissions, ND, by Age
Data Source: TEDS

134
Substance Abuse Treatment Admissions, ND, Age 12 and older, by Substance
Data Source: TEDS
Data Note: The primary and secondary substances of abuse reported to TEDS are those
substances which led to the treatment episode, and not necessarily a complete enumeration of all
drugs used at the time of admission.
All Substance Abuse Treatment Admissions, ND, Age 12 and older, by Race
Data Source: TEDS

135
Illicit Drugs in North Dakota: Modifiable Risks
Access to Illicit Drugs
About the Indicator
The use of illicit drugs is costly to the North Dakota and the United States. This indicator
illustrates how illicit drugs, such as marijuana, cocaine, heroin, methamphetamine, and ecstasy
are offered, given, or sold.
Data Source(s)
Wyoming Survey & Analysis Center (WYSAC): North Dakota Community Readiness Survey
(CRS)
Centers for Disease Control and Prevention (CDC): Youth Risk Behavior Survey (YRBS)
Section Summary
North Dakota adults (77.7%) perceived little difficulty in obtaining marijuana within their
community (ND CRS, 2015).
The percentage of North Dakota high school students who offered, gave, or sold illegal drugs
on school property decreased from 18.2 % in 2015, to 12.1 % in 2017 (YRBS, 2017).
A higher percentage of male high school students (both in North Dakota and the United
States) reported that they were offered, gave, or sold illegal drugs on school property, when
compared to females (YRBS, 2011-2017).
Larger percentages among Hispanics or Latino high school students in both North Dakota
and the United States were offered, gave, or sold illegal drugs on school property when
compared to other races (YRBS, 2017).
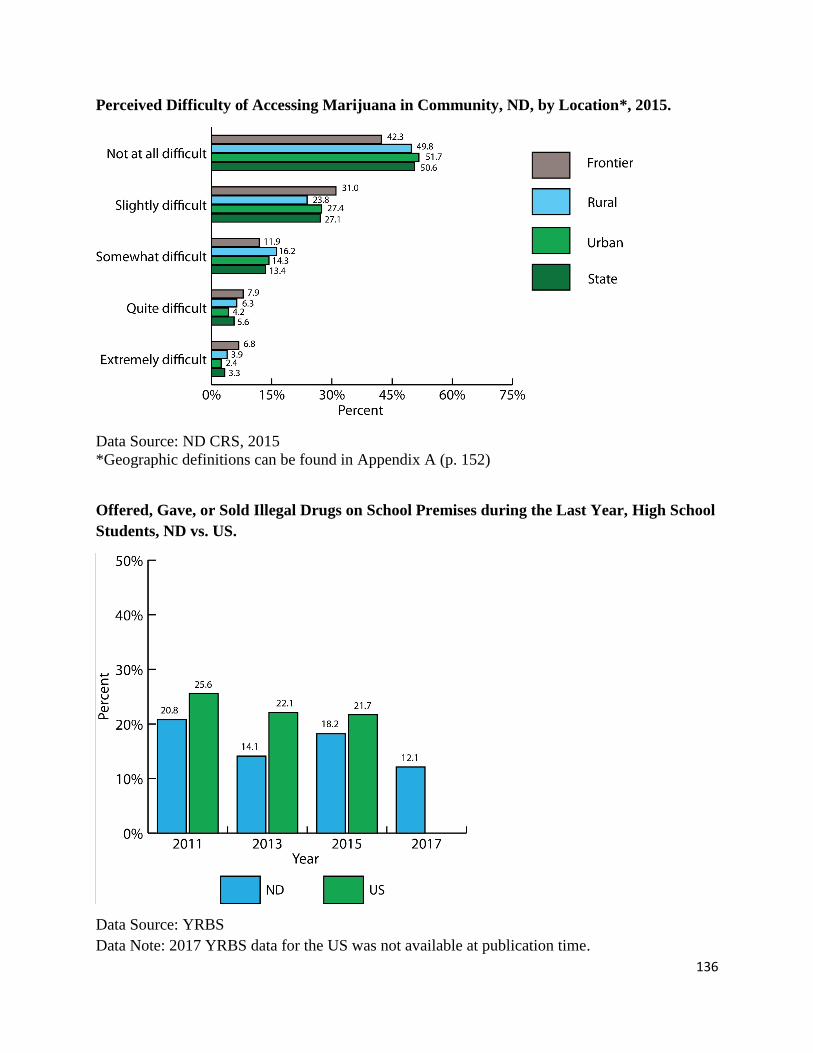
136
Perceived Difficulty of Accessing Marijuana in Community, ND, by Location*, 2015.
Data Source: ND CRS, 2015
*Geographic definitions can be found in Appendix A (p. 152)
Offered, Gave, or Sold Illegal Drugs on School Premises during the Last Year, High School
Students, ND vs. US.
Data Source: YRBS
Data Note: 2017 YRBS data for the US was not available at publication time.

137
Offered, Gave, or Sold Illegal Drugs on School Premises during the Last Year, High School
Students, ND vs. US, by Gender
ND 2011 2013 2015 2017
Females 20.2% 12.2% 16.3% 9.9%
Males 21.5% 15.5% 20.0% 14.1%
US 2011 2013 2015 2017
Females 21.7% 19.7% 19.1% -
Males 29.2% 24.5% 24.2% -
Data Source: YRBS
Data Note: 2017 YRBS data for the US was not available at publication time.
Offered, Gave, or Sold Illegal Drugs on School Premises during the Last Year, High School
Students, ND vs. US, by Grade
ND 2011 2013 2015 2017
9th
20.4% 13.1% 16.6% 11.2%
10th
20.2% 15.1% 20.7% 11.5%
11th
23.0% 12.4% 15.7% 15.4%
12th
19.8% 15.3% 19.5% 10.2%
US 2011 2013 2015 2017
9th
23.7% 22.4% 21.6% -
10th
27.8% 23.2% 21.9% -
11th
27% 23.2% 22.7% -
12th
23.8% 18.8% 20.3% -
Data Source: YRBS
Data Note: 2017 YRBS data for the US was not available at publication time.
Offered, Gave, or Sold Illegal Drugs on School Premises during the Last Year, High School
Students, ND vs. US by Race, Percentage (%)
ND 2011 2013 2015 2017
American Indian or Alaska Native -- 16.2% -- --
Hispanic or Latino -- 27.5% 27.3% 20.6%
White, non-Hispanic 19.9% 13% 16.8% 11.4%
US 2011 2013 2015 2017
American Indian or Alaska Native 40.5% 25.5% 19.8% --
Hispanic or Latino 33.2% 27.4% 27.2% --
White, non-Hispanic 22.7% 20.4% 19.8% --
Data Source: YRBS
Data Note: 2017 YRBS data for the US was not available at publication time.

138
Substance Abuse in North Dakota
Section 4. Prescription Drugs: Use, Consequences, and
Modifiable Risks

139
Prescription Drugs in North Dakota: Use
Nonmedical Use of Prescription Drugs
About the Indicator
According to data from the NSDUH (2014), 6.2% of youth aged 12-17, and 11.8% of young
adults aged 18-25 use nonmedical pain relievers in the past year. These two age groups were
more likely to misuse prescription drugs than adults aged 26 or older. This same report states that
on an average day during the past year, 5,784 adolescents used prescription pain relievers non-
medically for the first time (SAMHSA).
Data Source(s)
Youth
Wyoming Survey & Analysis Center (WYSAC): North Dakota Community Readiness Survey
(CRS)
Centers for Disease Control and Prevention (CDC): Youth Risk Behavior Survey (YRBS)
Adults
Wyoming Survey & Analysis Center (WYSAC): North Dakota Community Readiness Survey
(CRS)
Wyoming Survey & Analysis Center: North Dakota Survey of Young Adults (NDSOYA)
Section Summary
Youth
North Dakota adults who lived in rural and urban communities were more likely to perceive
youth prescription drug abuse as a serious problem when compared to their counterparts
living in frontier communities (ND CRS, 2015).
In North Dakota, there was a slight reduction in the percentage of high school students who
used prescription drugs without a doctor’s prescription, from 2011 (16.2%) to 2017 (14.4%)
(YRBS, 2017).
The percentage of North Dakota high school students who reported ever taking prescription
drugs without a doctor’s prescription is lower than the national rate (YRBS, 2017).

140
Adults
In 2015, North Dakotans who resided in urban or rural areas perceived adult prescription
drug use as more of a problem when compared to those located in the frontier areas (ND
CRS, 2015).
Perceived prescription drug misuse was much greater than actual reported misuse among
young adults, aged 18-29, in North Dakota in 2015 (NDSOYA, 2016)
When North Dakota young adults were asked about prescription drug misuse, 98.6%
responded with zero days of prescription misuse in the past 30 days (NDSOYA, 2016)
Youth
Perception of Youth Prescription Drug Use in the Community as a Problem by Location*,
Youth, ND, 2015
Data Source: ND CRS, 2015
*Geographic definitions can be found in Appendix A (p. 152)

141
Lifetime Non-Medical Use of Prescription Drugs, Middle School Students, ND, by Gender
Data Source: YRBS
Lifetime Non-Medical Use of Prescription Drugs, Middle School Students, ND, by Gender
and Race
ND by gender 2011 2013 2015 2017
Females 5.2% 5.5% 4.5% 4.4%
Males 4.1% 4.5% 4.1% 4.0%
ND by race 2011 2013 2015 2017
American Indian or
Alaska Native
8.3% 8.0% 9.2% 6.7%
Hispanic or Latino 12.5 % 9.7% 9.4% 7.6%
White, non-Hispanic 3.7% 4.3% 3.5% 3.1%
Data Source: YRBS

142
Lifetime Non-Medical Use of Prescription Drugs, High School Students, ND vs. US
Data Source: YRBS
Data Note: 2017 YRBS data for the US was not available at publication time and the 2017 ND
data cannot be directly compared to the previous data because the question changed that year.
Lifetime Non-Medical Use of Prescription Drugs, High School Students, ND, by Gender
Data Source: YRBS
Data Note: The 2017 data cannot be directly compared to the previous data because the question
changed that year.

143
Adults Prescription Drug Use in the Community as a Problem by Location*, Adults, ND, 2015
Data Source: ND CRS, 2016
*Geographic definitions can be found in Appendix A (p. 152)
Actual Versus Perceived Prescription Drug Misuse Among Young Adults (Age 18-29) in
the Past 30 Days, ND, 2015
Data Source: NDSOYA, 2016

144
Nonmedical Use of Pain Relievers
About the Indicator
The Center for Behavioral Health Statistics and Quality (2015) states that prescription pain
relievers are the nation’s second most prevalent illicit drug misused after marijuana, although a
majority of the people who use prescription pain relievers do not misuse them. Since 2002, more
than 26 million people used nonmedical prescription pain relievers, with four percent of people
aged 12 or older using this drug nonmedically. It is safe to use prescription pain relievers to
reduce pain and suffering when used under medical supervision and with necessary instructions
followed.
Data Source(s)
Substance Abuse and Mental Health Services Administration (SAMHSA): National Survey on
Drug Use and Health (NSDUH)
Section Summary
Past year nonmedical use of pain relievers among all ages in North Dakota was lower than
national rates in 2013 (NSDUH, 2017).
Past year nonmedical use of pain relievers is highest among North Dakotans age 18-25
(NSDUH, 2017).
Past Year Nonmedical Use of Pain Relievers, ND vs. US, by Age Group
ND 2013-2014
12-17 4.4%
18-25 7.3%
26+ 3.0%
US 2013-2014
12-17 4.7%
18-25 8.3%
26+ 3.3%
Data Source: NSDUH

145
Prescription Drugs in North Dakota: Consequences
Poisonings and Related Deaths
About the Indicator
Prescription drugs such as hydrocodone (e.g., Vicodin), oxycodone (e.g., OxyContin), and
methadone can be medically beneficial to help reduce pain and suffering. However, when used
without a physician's guidance, there is a high risk of consequences such as substance use
disorder, overdose, or death. Prescription pain reliever overdoses have resulted in almost 15,000
deaths since 2008 (SAMSA, 2017).
Data Source(s)
Centers for Disease Control and Prevention (CDC): CDC Wonder
Section Summary
From 2013 through 2015, North Dakota reported fewer deaths caused either by illicit or
prescription opioid poisoning when compared to the United States (CDC Wonder, 2017).
Between 2014 and 2015, deaths in North Dakota caused either by illicit or prescription
opioid poisoning decreased while the national rates continued to increase (CDC Wonder,
2017).
Age-adjusted overdose drug rates for North Dakota and at the national level have increased
from 2013 through 2016. (CDC Wonder, 2017).
Age-adjusted overdose drug rates have been higher at the national level when compared to
for North Dakota from 2013 through 2016. (CDC Wonder, 2017).
Deaths Related to Either Illicit or Prescription Opioid Poisoning, ND vs. US
Mortality rate per 100,000, 2013-2015 ND 2013 2014 2015 Crude rate per 100,000 --- 4.1 3.4 Age Adjusted Rate per 100,000 --- 4.4 3.7 US 2013 2014 2015 Crude rate per 100,000 7.6 8.8 10.1 Age Adjusted Rate per 100,000 7.6 8.8 10.2 Data Source : CDC Wonder

146
Deaths Related to Either Illicit or Prescription Opioid Poisoning, ND vs. US
Data Source : CDC Wonder
Data Note: Data for ND was not available prior to 2014.
Deaths Related to Drug Overdose, ND vs. US
Data Source : CDC Wonder
Data Note: Age Adjusted Rate Per 100,000.

147
Pharmacotherapy Drugs
About the Indicator
Pharmacotherapy is a therapy or treatment procedure that uses pharmaceutical drugs (that is,
prescription or over the counter medications). The 2016 National Survey of Substance Abuse
Treatment Services (N-SSATS) asserts that at least one pharmacotherapy was provided by 57
percent of all facilities in the United States and that the rates were higher in federal government-
operated facilities (84%). The same report observed that medications for psychiatric disorders
were the most frequently available pharmacotherapies and were provided in 44 percent of all
facilities.
Data Source(s)
National Survey of Substance Abuse Treatment Services (N-SSATS)
Section Summary
A smaller percentage (36.7%) of substance abuse treatment facilities in North Dakota offered
any type of pharmacotherapy when compared to the United States (57.4%) in 2016 (N-
SSATS, 2016)
Pharmacotherapies Offered by Substance Abuse Treatment Facilities, ND vs. US, by Type,
2016
Data Source: N-SSATS

148
Prescription Drugs in North Dakota: Modifiable Risks
Availability of Prescription Drugs
About the Indicator
The Center for Disease Control and Prevention (CDC, 2017) states that the supply of
prescription opioids remains high in the United States, with an estimated one out of five patients
with non-cancer pain or pain-related diagnoses receiving opioids. As access to prescription drugs
increases, the likelihood of prescription drug abuse and related consequences also increases.
Data Source(s)
Wyoming Survey & Analysis Center (WYSAC): North Dakota Community Readiness Survey
(CRS)
Centers for Medicare and Medicaid Services (CMS)
North Dakota Board of Pharmacy
Centers for Disease Control and Prevention (CDC): National Prescription Audit (NPA)
CDC National Center for Injury Prevention and Control: Annual Surveillance Report of Drug-
Related Risks and Outcomes
Section Summary
In 2015, more North Dakota adults felt that it was slightly or somewhat difficult for them to
access prescription drugs in their community irrespective of their locations (ND CRS, 2015).
The number of controlled substance prescriptions dispensed in North Dakota increased
between 2014 and 2015. However, since 2015, ND reported decreasing numbers of
controlled substance prescriptions dispensed (North Dakota Board of Pharmacy).
From 2013 to 2014, North Dakota saw a slight increase in the opioid prescription rate among
those enrolled in Medicare part D (CMS, 2017).
In 2012, health care providers in North Dakota prescribed 75 painkiller prescriptions per 100
people, which places North Dakota in the bottom half of states for painkiller prescriptions per
person ratios (NPA, 2014).
Nationally, the Medicare Part D opioid prescription rate decreased from 2013 to 2014 (CMS,
2017).

149
From 2014 through 2016, the rate of opioid prescriptions dispensed per 100 persons in North
Dakota remained lower than the national level (Annual Surveillance Report of Drug-Related
Risks and Outcomes, 2017).
From 2014 through 2016, the most common/prevalent opioid prescriptions dispensed per 100
persons in North Dakota had a strength of less than 50 morphine milligram equivalents per
day (Annual Surveillance Report of Drug-Related Risks and Outcomes, 2017).
Perceived Difficulty of Accessing Prescription Drugs in Community, ND, 2015, by Location
Data Source: ND CRS, 2015
*Geographic definitions can be found in Appendix A (p. 152)

150
Medicare Part D Opioid Prescription Rates, ND vs. US.
ND 2013 2014
Opioid Claims 164,414 166,071
Overall Claims 3,569,815 3,560,066
Opioid Prescribing Rate 4.61 4.66
Opioid Prescribing Rate Difference 0.06
US 2013 2014
Opioid Claims 78,045,683 79,645,620
Overall Claims 1,342,096,654 1,386,374,879
Opioid Prescribing Rate 5.82 5.74
Opioid Prescribing Rate Difference -0.08
Data Source: CMS
Controlled Substance Prescriptions Dispensed, ND
Data Source: North Dakota Board of Pharmacy
*Data Note: 2017 data is current as of October 25, 2017.

151
Number of Prescription Painkillers per 100 People, US, by State, 2012
Data Source: NPA

152
Opioid Prescriptions Dispensed per 100 Persons, ND, by Dosage and Type
Data Source: Annual Surveillance Report of Drug-Related Risks and Outcomes
Opioid Prescriptions Dispensed per 100 Persons, ND vs. US, by Dosage and Type
ND 2014 2015 2016
All Opioid Types 58.1 53 47.8
Long or Extended Acting 6.8 6.4 5.7
Daily Dosage Per Prescription: (MME/Day)
<50 41.8 38.7 35.7
>50 but <90 11.6 10.2 8.5
≥90 4.8 4.2 3.6
US 2014 2015 2016
All Opioid Types 75.6 70.6 66.5
Long or Extended Acting 6.9 6.7 6.3
Daily Dosage Per Prescription: (MME/Day)
<50 55.1 51.6 48.9
>50 but <90 13.4 12.4 11.5
≥90 7.1 6.7 6.1
Data Source: Annual Surveillance Report of Drug-Related Risks and Outcomes
Data Note: Rate per 100 persons adjusted to the U.S. census population. MME = morphine
milligram equivalents. LA/ER represents opioids that are long acting (LA) or extended release
(ER).

153
Substance Abuse in North Dakota
Appendix A
Definition of Terms
Current use is defined as persons who reported using a product at the time they participated in
the survey.
Last 30 days (a month) refers to those who used a product on 1 or more of the 30 days previous
to the survey.
Frontier refers to a county with a population density less than six people per square mile
(Wyoming Survey & Analysis Center, 2016).
Rural is defines as a county with a population density greater than six people per square mile,
with a higher density except for Minot, Grand Forks City, Fargo, West Fargo, Jamestown,
Bismarck, Mandan, Dickinson, and Williston (Wyoming Survey & Analysis Center, 2016).
Urban refers to a county with a population density greater than six people per square mile with a
population of at least 15,000 people, which includes Minot, Grand Forks City, Fargo, West
Fargo, Jamestown, Bismarck, Mandan, Dickinson, and Williston (Wyoming Survey & Analysis
Center, 2016).
Suburban refers to a smaller community adjacent to or within the commuting distance of a city.
It is also the residential area on the outskirts of a city or a large town or an outlying part of a city
or town (Suburban, 2017: Merriam Webster Online).
Data Sources
North Dakota Community Readiness Survey (CRS): Wyoming Survey & Analysis Center
The 2015 Community Readiness Survey (CRS) was first developed in 2008. Under contract with
North Dakota State University, the Wyoming Survey & Analysis Center at the University of
Wyoming (WYSAC) accepted this project as part of the North Dakota Department of Human
Services Strategic Prevention Framework State Incentive Grant. In developing this survey, the
North Dakota Department of Human Services (DHS) modified the Minnesota survey to account
for North Dakota specific needs. The selection for participation in this survey required a North
Dakota Household with a mailing address. The 2015 data collection took the form of a mixed
mode in which case, possible participants were given the option to complete the survey online or
use the paper copy mailed to them. Data was collected from early July until mid-December 2016
and by the close of data collection a total of 2,328 adults completed the surveys. Data can be

154
assessed at https://prevention.nd.gov/sites/default/files/North%20Dakota%20Community%20Re
20Readiness%2 0 Report%20Final%2003292016.pdf
North Dakota Survey of Young Adults (NDSOYA): Wyoming Survey & Analysis Center
The North Dakota Survey of Young Adults (NDSOYA) was developed using similar surveys led
in Wyoming and Oregon as part of their Strategic Prevention Framework State Incentive Grants
and their State Epidemiological Outcome Workgroup (SEOW) data collection efforts. The
Wyoming Survey & Analysis Center (WYSAC) was involved by the North Dakota Department
of Human Services to conduct a telephone survey, among North Dakota young adults between
the ages 18 and 29, to assess substance abuse and other health related behaviors, awareness, and
attitudes. A double sampling frame was used to include both landline and cell phone numbers
and the survey was conducted in the summer of 2016, with 1026 participants completing the
surveys.
Centers for Disease Control and Prevention (CDC): Youth Risk Behavior Survey (YRBS)
This survey is conducted nationally, state-wide, and locally every two years among middle and
high school students throughout the United States. These surveys gather information on health
risk behaviors such as, violence, tobacco, alcohol, and other drug use. More than 15,000 high
school students from 37 states and 19 large urban school districts participated in the 2015
National YRBS. This present report included data from other years to show trends. Data can be
assessed at https://www.cdc.gov/healthyyouth/data/yrbs/results.htm
*Data from the 2017 North Dakota YRBS was included in this document. However, 2017
national data was not available. Data for the North Dakota report can be assessed at
https://www.nd.gov/dpi/SchoolStaff/SafeHealthy/YRBS/
Centers for Disease Control and Prevention (CDC): Behavioral Risk Factor Surveillance
System (BRFSS)
BRFSS is the largest confidential health survey system in the world. It was established in 1984
and it has been conducted continuously. It is a telephone survey interview that collects data from
adults regarding health-related risk behaviors, chronic health conditions, and use of preventive
services in all 50 states as well as the District of Columbia and three U.S. territories. BRRSS data
can be accessed at http://www.cdc.gov/brfss
National Institute on Alcohol Abuse and Alcoholism (NIAAA)
The National Institute on Alcohol Abuse and Alcoholism (NIAAA) is sponsored by the National
Institutes of Health (NIH). NIAAA gather data on the impact of alcohol use on human health and
well-being. Data is available at https://pubs.niaaa.nih.gov/publications/surveillance.htm

155
Substance Abuse and Mental Health Services Administration (SAMHSA): National Survey
on Drug Use and Health (NSDUH)
NSDUH nationwide survey interviews approximately 70,000 randomly selected individuals that
are at least 12 years of age and data are presented as two-year averages. This survey provides
national and state-level data on the use of tobacco, alcohol, illicit drugs and mental health.
NSDUH is supported by the Substance Abuse and Mental Health Services
Administration (SAMHSA), an agency in the U.S. Department of Health and Human
Services (DHHS). Data can be retrieved at https://nsduhweb.rti.org/respweb/homepage.cfm
North Dakota Department of Corrections and Rehabilitation (DOCR)-
DOCR is an integral part of the criminal justice system. It was established in 1989 and it is made
up of the Adult Services Division and the Juvenile Services Division. Its main responsibility is to
carry out general administrative supervision, provide guidance, and to plan adult and juvenile
correctional facilities and programs with North Dakota. ND DOCR can be accessed at
https://www.nd.gov/docr/
National Highway Traffic Safety Administration (NHTSA): Fatality Analysis Reporting
System (FARS)
FARS collects and reports annual data on fatal traffic crashes within the 50 states in the US,
District of Columbia, and Puerto Rico. It is sponsored by the National Center for Statistics and
Analysis (NCSA) of the National Highway Traffic Safety Administration (NHTSA). Available at
https://www.nhtsa.gov/research-data
North Dakota Crash Summary: North Dakota Department of Transportation (NDDOT)
The North Dakota Crash Summary in prepared yearly by the North Dakota Department of
Transportation (NDDOT) to provide data about motor vehicle crashes, deaths, and injuries in
North Dakota. Data for this document is collected by North Dakota law enforcement officers
who complete a crash report when an accident occurs on a public road involving death, injury, or
at least $1,000 in property damage. Crashes that occur off of a public road (for example, on
private property or parking lots) are not included. Available at
https://www.dot.nd.gov/divisions/safety/docs/crash-summary.pdf
Substance Abuse and Mental Health Services Administration (SAMHSA): Treatment
Episode Data Set (TEDS)
TEDS contains information regarding the number of treatment admissions for substance abuse in
the United States. This information is collected from states on an annual basis and is maintained
by the Substance Abuse Mental Health Services Administration (SAMHSA). TEDS can be
accessed at https://www.samhsa.gov/data/client-level-data-teds
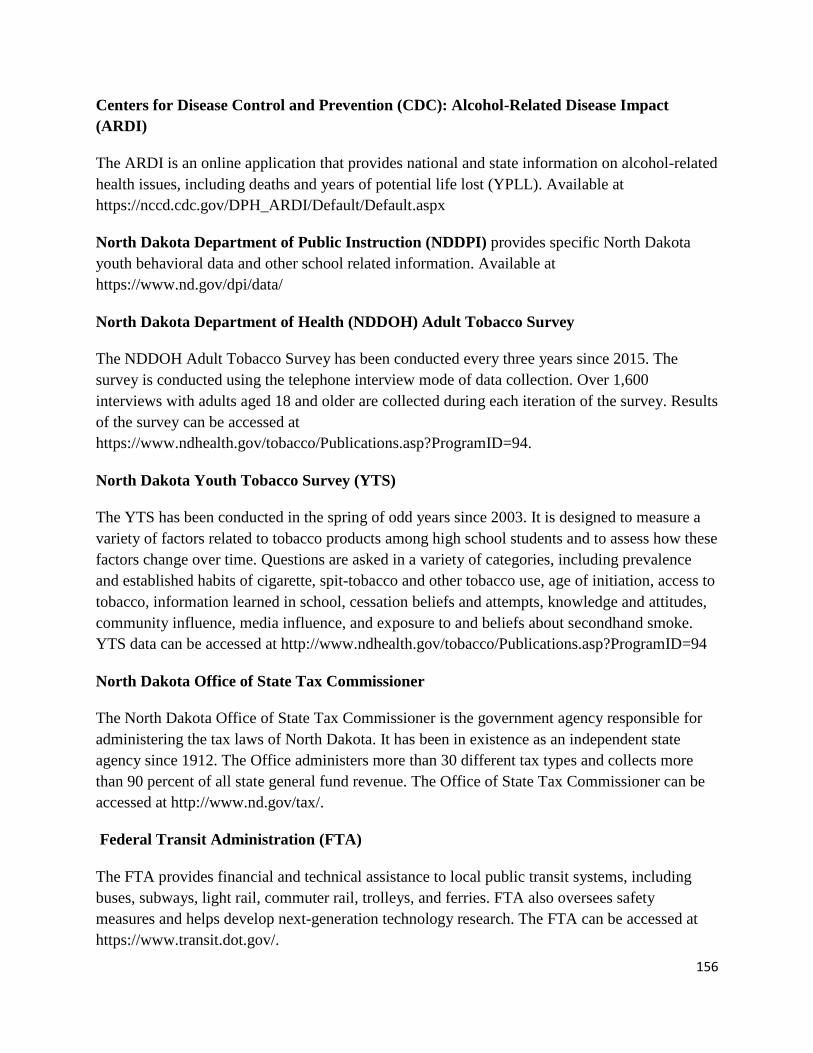
156
Centers for Disease Control and Prevention (CDC): Alcohol-Related Disease Impact
(ARDI)
The ARDI is an online application that provides national and state information on alcohol-related
health issues, including deaths and years of potential life lost (YPLL). Available at
https://nccd.cdc.gov/DPH_ARDI/Default/Default.aspx
North Dakota Department of Public Instruction (NDDPI) provides specific North Dakota
youth behavioral data and other school related information. Available at
https://www.nd.gov/dpi/data/
North Dakota Department of Health (NDDOH) Adult Tobacco Survey
The NDDOH Adult Tobacco Survey has been conducted every three years since 2015. The
survey is conducted using the telephone interview mode of data collection. Over 1,600
interviews with adults aged 18 and older are collected during each iteration of the survey. Results
of the survey can be accessed at
https://www.ndhealth.gov/tobacco/Publications.asp?ProgramID=94.
North Dakota Youth Tobacco Survey (YTS)
The YTS has been conducted in the spring of odd years since 2003. It is designed to measure a
variety of factors related to tobacco products among high school students and to assess how these
factors change over time. Questions are asked in a variety of categories, including prevalence
and established habits of cigarette, spit-tobacco and other tobacco use, age of initiation, access to
tobacco, information learned in school, cessation beliefs and attempts, knowledge and attitudes,
community influence, media influence, and exposure to and beliefs about secondhand smoke.
YTS data can be accessed at http://www.ndhealth.gov/tobacco/Publications.asp?ProgramID=94
North Dakota Office of State Tax Commissioner
The North Dakota Office of State Tax Commissioner is the government agency responsible for
administering the tax laws of North Dakota. It has been in existence as an independent state
agency since 1912. The Office administers more than 30 different tax types and collects more
than 90 percent of all state general fund revenue. The Office of State Tax Commissioner can be
accessed at http://www.nd.gov/tax/.
Federal Transit Administration (FTA)
The FTA provides financial and technical assistance to local public transit systems, including
buses, subways, light rail, commuter rail, trolleys, and ferries. FTA also oversees safety
measures and helps develop next-generation technology research. The FTA can be accessed at
https://www.transit.dot.gov/.

157
North Dakota Department of Health, Tobacco Prevention and Control
The North Dakota Department of Health Tobacco Prevention and Control program provides
information related to tobacco use in North Dakota. The program aims to improve and protect
the health of North Dakotans by reducing the negative health and economic consequences of
tobacco use. It can be accessed at https://www.ndhealth.gov/tobacco/.
Smoking-Attributable Mortality, Morbidity, and Economic Costs (SAMMEC)
The Smoking-Attributable Mortality, Morbidity, and Economic Costs data is published by the
Centers for Disease Control and Prevention. It provides information regarding smoking-
attributable expenditures (SAEs), which are excess health care expenditures attributable to
cigarette smoking, by type of service, among adults aged 19 years of age and older. It can be
accessed at https://chronicdata.cdc.gov/Health-Consequences-and-Costs/Smoking-Attributable-
Mortality-Morbidity-and-Econo/ezab-8sq5?.
ND Vital Records
The North Dakota Division of Vital Records provides registration and certification of the vital
events that occur in North Dakota. These events include births, deaths, fetal deaths, marriages
and divorces. They also provide statistical information on a wide range of categories relating to
these events. ND Vital Records can be accessed at http://ndhealth.gov/vital/.
Centers for Disease Control and Prevention (CDC) WONDER
The CDC Wide-Ranging Online Data for Epidemiologic Research (WONDER) provides
information resources of the Center for Disease Control and Prevention (CDC) available to
health professionals and the public at large. It provides access to a wide array of public health
information, and can be accessed at https://wonder.cdc.gov/.
Ensuring Solutions to Alcohol Problems
This is a tool used to calculate the human and economic consequences of alcohol problems. Such
information is used to improve access to treatment.
Centers for Medicare and Medicaid Services (CMS)
The Centers for Medicare & Medicaid Services, CMS, is part of the Department of Health and
Human Services (HHS). This program works in partnership with state governments to
administer Medicaid, the Children's Health Insurance Program (SCHIP), and health
insurance portability standards. CMS can be accessed at https://www.cms.gov/
158
North Dakota Board of Pharmacy
The North Dakota Board of Pharmacy is a program that provides guides for North Dakota
pharmacies on how to offer drugs. In this program, participating pharmacies are provided with
the best way to dispose control substances to their patients. North Dakota Board of Pharmacy’s
information is available at https://www.nodakpharmacy.com/
National Survey of Substance Abuse Treatment Services (N-SSATS)-
N-SSATS is a survey consisting of all the private and public substance abuse treatment facilities
in the United States. It is a part of the Behavioral Health Services Information System also
known as the BHSIS and is managed by the Center for Behavioral Health Statistics and Quality
(CBHSQ), Substance Abuse and Mental Health Services Administration (SAMHSA). The
surveys collect the information about the facilities such as characteristics of the treatment
facilities, client count census and general information like certification or accreditation. The
survey can be accessed at https://www.samhsa.gov/data/substance-abuse-facilities-data-nssats
North Dakota Courts
North Dakota Courts are made up of North Dakota Supreme Court, District Court and Municipal
Court. North Dakota Supreme Court being the highest court in the state consists of one chief
justice and four justices with a ten-year term. District courts are the state trial courts of general
jurisdiction and all 53 counties provide district court services. District court consists of eight
judicial districts and 51 judges with six-year terms. Municipal Courts consists of 73 judges with
four-year terms. The North Dakota Courts can be accessed at
https://www.ndcourts.gov/court/Courts.htm
Crime in North Dakota
The crime data in North Dakota is managed by the Bureau of Criminal Investigation under the
Uniform Crime Reporting (UCR) program. It carries out the collection and analysis of crime data
provided by the North Dakota law enforcement agencies. The crime statistics data of all criminal
offenses is in the Crime Statistics Online (CSO) program. The Themed Orientated Public Site
(TOPS) program contains specific public interest data like Violent, Property and Drug/DUI
crimes. The Crime in North Dakota can be access at https://attorneygeneral.nd.gov/public-
safety/crime-data.