North Carolina Mineral and Land... · The North Carolina Energy Assurance Plan (EAP) was developed...
244
State Energy Office State Energy Office North Carolina Energy Assurance Plan
Transcript of North Carolina Mineral and Land... · The North Carolina Energy Assurance Plan (EAP) was developed...

State Energy OfficeState Energy Office
North CarolinaEnergy
Assurance Plan

i
North Carolina
Energy Assurance
Plan Task 3.0 of the Enhancing State Government Energy
Assurance Program
Funded by the American Recovery and Reinvestment Act of 2009
(Funding Opportunity DE-FOA-0000091)
Original Report Issue Date: August 30, 2013
Revised and Updated: July 31, 2019

ii
Address inquiries to: Star Hodge Department of Environmental Quality Office of the Secretary – Energy Group, State Energy Program, State Energy Office 217 West Jones Street, Room 5426 Mail Services Center 1613 Raleigh, North Carolina 27699-1613 (919) 707-8750

iii
Acknowledgements
This Energy Assurance Plan was prepared for the U.S. Department of Energy (Award Number DE-OE0000091, Enhancing State Government Energy Assurance Capabilities and Planning for Smart Grid Resiliency through the American Recovery and Reinvestment Act). This plan was created by the State Energy Office of North Carolina located within the Division of Energy at the N.C. Department of Environmental Quality. Contributors to this effort included members of municipal and state government, representatives from the electric, natural gas, petroleum, and propane industries and numerous non-profit and research institutions.
Disclaimer
This report was prepared as an account of work sponsored by an agency of the United States Government. Neither the United States Government nor any agency thereof, nor any of their employees, makes any warranty, express or implied, or assumes any legal liability or responsibility for the accuracy, completeness, or usefulness of any information, apparatus, product, or process disclosed or represents that its use would not infringe privately owned rights. Reference herein to any specific commercial product, process, or service by trade name, trademark, manufacturer, or otherwise does not necessarily constitute or imply its endorsement, recommendation, or favoring by the United States Government or any agency thereof. The views and opinions of authors expressed herein do not necessarily state or reflect those of the United States Government or any agency thereof.
Plan Summary
The North Carolina Energy Assurance Plan (EAP) was developed (using funds provided by the U.S. Department of Energy) to strengthen and expand state energy assurance planning. The EAP is the responsibility of the North Carolina State Energy Office. When the EAP is approved, it will be integrated into North Carolina Emergency Operations Plan.
The North Carolina Emergency Operations Plan was developed by the Division of Emergency Management (DEM), in the North Carolina Department of Public Safety. The Energy Assurance Plan is also a supporting document for the Emergency Support Function -12 (Energy) annex to the North Carolina Emergency Operations Plan. The EAP was generated from research and collaboration between government agencies, industry representatives and research institutions. The EAP’s goal is to minimize the impact of energy supply disruptions resulting from adverse economic and safety conditions in North Carolina (NC).
Energy is essential to the health, safety and welfare of the people of NC and to the operation of its economy (N.C.G.S. § 113B-1). Energy emergencies can result in significant economic losses, harm public welfare, and degrade government services. Disruption of energy supplies can result from natural disasters, accidents, criminal acts,

iv
systemic factors, geopolitical events, or market forces producing a rapid, unsustainable increase in energy prices. The State Energy Office (SEO)/Energy Office (EO) endeavors to facilitate the availability and delivery of a reliable and secure supply of energy for NC despite adverse conditions.
This EAP establishes a comprehensive framework that will assist in all phases of emergency management: mitigation, preparedness, response, and recovery. The plan identifies legal authorities and responsibilities of energy stakeholders. It describes relationships and lines of communication between federal, state, local, and private sector stakeholders. The purpose of the plan is for it to work in conjunction with the North Carolina Emergency Operations Plan, developed and maintained by the DEM. The plan describes NC’s energy profile through a discussion of key demographics, historical energy consumption, and past disruptive energy events. The Plan incorporates a disruption tracking process intended to identify energy disruptions before they become large-scale events, and suggests mechanisms for responding to supply disruptions in electricity, natural gas, and petroleum. Finally, the Plan identifies emerging issues within the energy infrastructure including Smart Grid technologies, electric vehicles, and alternative fuels.
In effort to reduce disruptive energy event impacts and to increase the likelihood of a timely recovery from such events, the SEO/EO will coordinate efforts with the DEM, State Emergency Response Team (SERT) partners, the Public Staff of the North Carolina Utilities Commission (NCUC), and other agencies as appropriate.

v
Introduction
In 2009, the U.S. Department of Energy provided a funding opportunity through the American Recovery and Reinvestment Act (ARRA), for states to create or update their energy assurance plans. The purpose of the initiative was to assist states in developing plans to aid with recovery from energy supply disruptions and to enhance the reliability of energy infrastructure. NC applied for and received funding. The North Carolina Energy Assurance Plan (NCEAP) was developed and submitted as a deliverable of the ARRA funding award.
Purpose The purpose of the Energy Assurance Plan is to establish a systematic approach for addressing disruptive energy events. This Plan was created to help NC prepare for and react to unforeseen interruptions in energy services. It is intended to reduce the impact of energy emergencies and ultimately support a timely recovery. Meeting National Incident Management System (NIMS) compliance requirements is the intention of the plan.
Scope The Energy Assurance Plan is designed to address disruptive energy events, whether planned or unplanned, real or perceived. The Plan will provide a context for energy assurance planning and describes a process that is applicable in any energy reduction/emergency in NC. It is designed for the support of ESF-12 activities within state government. Certain aspects of the Plan rely on conservation measures, observations of market behaviors, and other agencies’ plans (such as the North Carolina Emergency Operations Plan) and their respective incorporated sub-plans.
Organization
The Energy Assurance Plan consists of the following:
Volume 1 - Relationships and Responsibilities - This section discusses the principal authorities and interrelationships of federal, state, and local agencies.
Volume 2 - Energy Vulnerabilities and Levels of Disruptions - This section discusses energy vulnerabilities and levels of energy disruptions.
Volume 3 - North Carolina’s Energy Profile - This section discusses demographics, energy infrastructure, energy expenditures, comparative use and historical events that have affected NC’s infrastructure.
Volume 4 - North Carolina Energy Disruption Tracking Process - This section describes the daily, weekly, and monthly energy monitoring activities of the SEO.
Volume 5 - Emergency Support Function 12 (ESF-12) Contingencies and Response - This section discusses emergency communication procedures, public information initiatives, and emergency response plans for electric, natural gas, and

vi
petroleum disruptions. It outlines driver hour waivers, fuel specification waivers and the Jones Act Waiver.
Volume 6 - Critical Infrastructure and Resiliency Plans- This section discusses emerging technologies that will significantly impact NC’s energy reliability and consumption. Specific topics include plug-in hybrid electric vehicles (PHEV) and electric vehicles (EV), the Smart Grid, and energy storage technology (batteries).
Record of Changes and Revisions
Change Number Date of Change Name of Person Initials
Revision 1 7/31/2019 Russell W. Duncan RD

vii
Volume 1- Organizational Relationships and Responsibilities
Volume 1 - Organizational Relationships and Responsibilities .......................................... 1-1
Table of Contents .........................................................................................................................vii
Table of Figures ...........................................................................................................................vii
Table of Tables ....................................................................................................................... ....viii
1.1 Principal Authorities and Roles of Government Agencies ........................................... 1-11.1.1 Federal Government ............................................................................................ 1-11.1.2 State Government ................................................................................................ 1-2
1.2 Energy Suppliers ......................................................................................................... 1-61.2.1 Electricity Stakeholders ........................................................................................ 1-61.2.2 Duke Energy Corporation ..................................................................................... 1-71.2.3 Dominion Resources ............................................................................................ 1-81.2.4 North Carolina Electric Cooperatives ................................................................... 1-9
1.2.5 North Carolina Public Power ................................................................................ 1-9
1.2.6 Nuclear Stakeholders ......................................................................................... 1-111.2.7 Natural Gas Stakeholders ...................................................................................1-121.2.8 Renewable Energy Stakeholders ........................................................................1-141.2.9 Petroleum Stakeholders ......................................................................................1-151.2.10 Pipeline Operations .............................................................................................1-161.2.11 Propane ...............................................................................................................1-181.2.12 Home Heating Oil ................................................................................................1-19
1.3 Legal Authorities .........................................................................................................1-191.3.1 Interrelationships of Agencies and Authorities ....................................................1-23
Bibilography....................................................................................................................1-25
Appendix A. Federal Energy Emergency Authorities ............................................................... .1-28
Appendix B. Acronyms and Abbreviations in NC EAP, Volumes 1-6 .......................................1-42
Table of Figures
Figure 1-1 State Energy Office Interactions ............................................................................... 1-3Figure 1-2 Duke Energy Service Areas ..................................................................................... 1-8Figure 1-3 Dominion Resources Service Area ........................................................................... 1-8Figure 1-4 North Carolina’s Electric Cooperatives ..................................................................... 1-9
Figure 1-5 NCEMPA Service Areas .........................................................................................1-10Figure 1-6 NCMPA-1 Service Areas ........................................................................................1-10Figure 1-7 North Carolina Public Power ..................................................................................1-11Figure 1-8 North Carolina Nuclear Stations .............................................................................1-12Figure 1-9 North Carolina Natural Gas Service Areas .............................................................1-12Figure 1-10 Piedmont Natural Gas Central Region Districts ...................................................1-13

viii
Figure 1-11 Piedmont Natural Gas Eastern Region .................................................................. 1-13Figure 1-12 PSNC Service Area ................................................................................................ 1-14Figure 1-13 Fossil Fuels ............................................................................................................ 1-15Figure 1-14 Colonial Pipeline ..................................................................................................... 1-17Figure 1-15 Plantation Pipeline .................................................................................................. 1-17Figure 1-16 State Energy Office Interactions ............................................................................. 1-23Figure 1-17 Lines of Authority .................................................................................................... 1-23Figure 1-18 North Carolina Emergency Management ............................................................... 1-24Figure 1- 19 Operations Section ................................................................................................ 1-24Figure 1-20 Infrastructure Support Group .................................................................................. 1-24
Table of Tables Table 1-1 NC EMC Electric Cooperatives .................................................................................. .. 1-6Table 1-2 Ten Largest Plants by Generating Capacity in NC ......................................................1-7Table 1-3 PADD-3 Petroleum Imports ....................................................................................... 1-16Table 1-4 Top Five Petroleum Producers .................................................................................. 1-16

1-1
1 Organizational Relationships and Responsibilities
1.1 Principal authorities and roles of government agencies
Several organizations are involved in the protection of the Critical Infrastructure and Key Resources (CI/KR) of North Carolina (NC). The primary agencies involved in the protection, preparation, response, and recovery efforts associated with energy disruptions are the State Energy Office (SEO), the North Carolina Utilities Commission (NCUC), and the North Carolina Division of Emergency Management (NCEM). There are other state agencies whose authorities can influence energy concerns, such as the North Carolina Department of Environmental Quality (NCDEQ), formerly known as the Department of Environment and Natural Resources (NCDENR), and the Department of Transportation (NCDOT). The primary agencies have established relationships with local, county, regional, and private stakeholders that are involved in responding to disruptive energy events. The primary agencies have also established relationships with stakeholders from surrounding states and the federal government. Each agency’s contact information is secured in an electronic and paper format by the State Energy Office (SEO). Nonetheless, this information is not published for general distribution due to its sensitive nature.
1.1.1 Federal Government
The U.S. Department of Energy has been designated by the U.S Department of Homeland Security as the agency responsible for Emergency Support Function-12 (ESF-12) at the federal level. The National Response Framework directs ESF-12 to facilitate the restoration of damaged energy systems and components when activated by the Secretary of Homeland Security. During an energy emergency, ESF-12 will advise state and local authorities on restoration priorities and assist with locating resources and requesting federal support (National Response Framework). The Office of Electricity Delivery and Energy Reliability, Infrastructure Security and Energy Restoration (ISER) Division is the primary organization responsible for coordination of the federal response to energy emergencies and supply disruptions. ISER coordinates with the National Association of State Energy Officials (NASEO), the National Association of Regulatory Utility Commissioners (NARUC), state energy offices, utility commissions, investor-owned utilities (IOU’s), private industry, and other agencies related to energy. The U.S Department of Energy also administers the Strategic Petroleum Reserve.
The Federal Energy Regulatory Commission (FERC) is an independent agency that regulates the interstate transmission of natural gas, oil, and electricity. FERC also regulates natural gas and hydropower projects. The Federal Emergency Management Agency (FEMA) provides advice and assistance to states to mitigate, prepare for, respond to, and recover from all hazards.

1-2
The Department of Transportation (U.S. DOT) oversees federal highway, air, railroad, maritime and other transportation functions. The U.S. DOT approves driver hour waivers for drivers during emergency situations.
1.1.2 State Government
The Office of the Governor of NC has the authority to declare a “state of emergency.” Upon the declaration of an energy crisis, the Governor shall order the Energy Policy Council (EPC), the NC Utilities Commission (NCUC), the NC Attorney General, and other appropriate State and local agencies to implement and enforce the Emergency Energy Program. The Governor’s office may call for energy conservation through voluntary appeals and/or mandatory directives. The Governor may rescind mandatory directives once the energy emergency has been resolved and a state of recovery is achieved.
The EPC is the coordinating State entity for energy emergencies pursuant to Article 2 of by N.C. General Statute 113B. The EPC identifies and determines the nature and severity of expected energy shortages, gathers and analyzes information about ongoing disruptive energy events, and maintains daily communications with energy generators, distributers, transporters, and consumers. The EPC provides the Governor and the Legislative Committee on Energy Crisis Management with assessments and action recommendations for developing situations.
The Legislative Committee consults with the Governor on issues including energy-related topics and statutorily directed to review emergency orders, rules, and regulations that may be employed during disruptive energy events.
The State Energy Office (SEO) is administratively housed within the NC Department of Environmental Quality (NCDEQ). The SEO is the lead technical agency for responding reacting to fuel shortages, power outages, and capacity shortages that impact or threaten large numbers of citizens. It maintains situational awareness of factors that influence energy supply and demand within the nation, region, and State. It surveys multiple global, national, and regional information sources, energy sector resources (e.g., DOE’s Energy Information Administration) and state agencies, such as the NC Utilities Commission. The SEO analyzes data to identify trends or conditions that are likely to interrupt the distribution of energy throughout NC. Additionally, the SEO administers the “Fuel Set Aside” program. The Fuel Set Aside program is a mitigation strategy designed to assist end users of petroleum who are unable to obtain fuel during an energy emergency.
The SEO manages federal and State energy efficiency programs. It serves as staff to the EPC, with the responsibility of suggesting emergency response measures to the Governor and administering measures recommended by the Governor and approved by the Legislative Committee on Crisis Management.

1-3
As seen in Figure 1-1, the SEO maintains a formal relationship with the U.S. Department of Energy (USDOE), and informal relationships with the DEM and the NCUC in support of federal requirements contained in Emergency Support Function 12 (ESF-12). ESF-12 establishes policies and procedures for the response and recovery from energy disruptions and shortages that impact the state’s citizens and visitors. The SEO maintains relationships with other State agencies that with interest in the State’s energy infrastructure.
The SEO maintains informal relationships with the SEO’s of the surrounding states for situational awareness and to facilitate a regional approach to energy assurance. Additionally, the SEO manages communications with Investor Owned Utilities (IOUs), natural gas Local Distribution Companies (LDCs), and petroleum pipeline and terminal operators to maintain an awareness of infrastructure issues.
The USDOE serves as the lead federal agency for ESF-12, by providing both funding and technical support to the SEO for energy-related issues and opportunities. The SEO manages several initiatives sponsored by the USDOE.
Figure 1-1 State Energy Office Interactions
The NCUC is an independent state agency that regulates rates and services of public utilities in NC. The NCUC regulates electric, natural gas, and pipeline activities as well as other utilities including telephone, water, wastewater, busses, brokers, and ferryboats.
Information MonitoringRegulated Entities
State Energy Office
Division of Emergency
Management
NC Utilities Commission
Energy Policy
Council
U.S. DOE
News & Industry
Monitoring
ElectricityProviders
NC Department of Environmental
Quality
Surrounding States SEO’s
Natural Gas Providers
Petroleum Pipeline &Terminals
Governors Office
State Energy Office InteractionsLines of Authority-Lines of Communication-
Public Staff
Figure 1-1 State Energy Office Interactions

1-4
The Public Staff of the Commission is an independent agency within the NCUC whose director is appointed by the Governor. The Public Staff represents the interests of the using and consuming public by reviewing, investigating and making utility-related recommendations to the NCUC. The activities of the Public Staff’s two sections, the Electric Division and the Natural Gas Division, can have direct impacts on energy assurance.
The Electric Division examines technical issues pertaining to the generation,transmission, sale, and consumption of electricity. It makes recommendations to theNCUC on the siting of electric generation facilities, rates and tariffs, transmissioninfrastructure, and other issues relating to electricity.
The Natural Gas Division’s duties are similar to those of the Electric Division forissues pertaining to natural gas. They make recommendations concerningcertificates of public convenience and necessity, rates, tariffs, and quality of service.
Both Public Staff divisions work with regulated utilities on matters such as safety, fuel and infrastructure restoration, long-range market conditions, company plans, operations, and governmental policies relating to adequate energy supply at reasonable prices.
The NC Department of Administration, the lead state agency for purchasing and contracting, is responsible for the management of the State’s motor fleet.
The NC Department of Agriculture and Consumer Services’ (NCDA&CS) Motor Fuels Section is the lead state agency responsible for enforcing motor fuel (gasoline and diesel), heating fuel (kerosene and fuel oil), and motor oil quality standards within the State. The Motor Fuels Section performs on-site fuel testing and testing at its laboratory in Raleigh. NCDA&CS can assist in the process of applying for federal and State Reid Vapor Pressure (RVP) waivers. The RVP waiver is required as part of the State Implementation Program (SIP) of federal Fuel Volatility Regulations contained in 40 CFR 80.27.
The NC Department of Public Safety is the parent organization of the NC Emergency Management Division (NCEM), the State Highway Patrol, and other related agencies.
NCEM manages all state emergency functions in coordination with county and municipal emergency agencies and directs efforts to protect the public and mitigate the impact of disasters and emergencies. NCEM is an Emergency Management Accreditation Program (EMAP) certified agency, operating in compliance with the National Incident Management System (NIMS) and Incident Command System (ICS) standards. NCEM operates the State’s Emergency Operations Center (EOC) in Raleigh, regional warehouses, and branch offices across the State. NCEM works closely with county emergency management agencies, supports local government emergency management activities, and coordinates requests for federal assistance as needed.

1-5
NC disaster response activities are coordinated through the activation of the State Emergency Response Team (SERT). Depending on the event, the SERT can include representatives from State and federal government agencies, private sector stakeholders, and voluntary agencies active during disasters. The scope of SERT’s activities and the extent of its activation depends on the level of the emergency. During an emergency, SERT members, co-located at the State EOC, can utilize the expertise of many public and private organizations to assist one another.
When the SERT is activated, the SEO participates as a member of the Infrastructure Support Group. During times of energy shortages, the SEO will develop and/or maintain relationships with the electric, natural gas, and petroleum industry representatives, as support for infrastructure agencies. The SEO seeks information pertaining to the state of the emergency and the expected functional return of electrical, natural gas, or petroleum services. Additionally, the SEO facilitates communications with appropriate agencies to support timely recovery.
The NC Highway Patrol coordinates law enforcement activities such as traffic control and security for energy resources, as needed. The NC National Guard (NCNG) responds to emergencies at the request of the Governor. Its role is to protect life and property and preserve peace, order and public safety in the State. During disruptive energy events, the NCNG may provide bulk fuel transportation, mobile fueling, and/or aviation support to survey energy infrastructure damage.
The NC Department of Environmental Quality (DEQ), previously known as the Department of Environment and Natural Resources (DENR), is the lead agency for the preservation and protection of the State’s natural resources. DEQ administers regulatory programs designed to protect air quality, water quality, and public health. DEQ also offers technical assistance to businesses, farmers, local governments, and the public. The SEO was relocated to DEQ in 2013.
The DEQ’s Division of Air Quality (DAQ) is the lead agency for enforcing federal airquality laws and regulations in NC. During energy emergencies or disruptions, DAQprepares and submits RVP waiver requests to the Environmental Protection Agencyon behalf of the State. The RVP fuel waiver is required by the State ImplementationProgram (SIP) of Federal Fuel Volatility Regulations contained in 40 CFR 80.27. It isrequested if an appropriate alternative fuel cannot be found.
DEQ’s Division of Water Resources (DWR) is responsible for administering riverbasin management, water supply assistance, water conservation, and waterresources development. DWR conducts studies on in-stream flow needs and servesas the State liaison with federal agencies on major water resource-related projects.DWR also assists in licensing hydroelectric power stations and with droughtmanagement issues that may affect hydroelectric power generation or watersupplies for nuclear plant operations the State.

1-6
The NC Department of Transportation (NCDOT), the lead transportation agency for the state, is charged with transportation safety, improving the efficiency of transportation networks, and ensuring that the transportation infrastructure is in good order. NCDOT oversees issues relating to transportation that include road maintenance and safety as well as maintaining adequate fuel supplies for NCDOT vehicles. During disruptive energy events, NCDOT may assist the State by releasing and/or delivering emergency motor fuels, or by facilitating applications for driver-hour waivers. The SEO interacts with the NCDOT on an as-needed basis. County and municipal government stakeholders perform duties during energy emergencies or disruptions according to their respective emergency management plans. They coordinate with the appropriate State agencies and/or SERT as needed.
1.2 Energy Suppliers
1.2.1 Electricity Stakeholders
NC has several electric generation plants of varying capacity and primary fuel sources. The SEO maintains a comprehensive list of all generation plants, cataloged by generation potential, primary, and secondary fuels. This list and other information are available through secure map applications operated in partnership between the NC Department of Public Safety and the United States Department of Homeland Security. System access requires clearance authorization.
According to the NCUC, NC electric power providers include three generation and distribution (IOU’s)(Duke Energy Carolinas, Duke Energy Progress, and Dominion Energy North Carolina), thirty-one Electric Membership Corporations (EMC) distribution systems, and about seventy-five municipal and university distribution systems.
Twenty-five of the thirty-one EMCs are members of the NC Electric Membership Corporation (NCEMC). Five of the NCEMC members use out-of-state power generation sources as listed in Table 1-1.
Table 1-1 NC EMC Electric Cooperatives (http://www.ncuc.commerce.state.nc.us/statbook/2017report.pdf)
French Broad EMC (a non-NCEMC member) generates some power at its Capitola Hydroelectric Plant and purchases the remainder from Duke Energy Progress and the Southeastern Power Administration (SEPA). The municipal systems, owned by local city governments, purchase generation through ElectriCities of NC. ElectriCities purchases power from Duke Energy for its 52 members from either the Eastern Municipal Power Agency or the North Carolina Municipal Power Agency-1.
Electric Co-Op Counties Served Headquarters Power Source Blue Ridge Mountain Cherokee and Clay Young Harris, GA TVA
Broad River Cleveland Gaffney, SC Central Electric Pwr. Co-op.
Mecklenburg Granville and Warren Chase City, VA SEPA, Old Dominion
Tri-State Cherokee McCaysville, GA TVA
Mountain Electric Avery, Burke, Watauga, McDowell Mountain City, TN TVA

1-7
In 2014, the EIA estimated NC’s electric generation capacity at 26,674 MW (summer capacity). Of the estimated net summer generation capacity, 17,489 MW (65%) is produced by the ten largest electric generators that are listed in Table 1-2.
1. Roxboro Coal Duke Energy Progress (2,422 MW)
2. McGuire Nuclear Duke Energy Carolinas (2,316 MW)
3. Belews Creek Coal Duke Energy Carolinas (2,240 MW)
4. Marshall (NC) Coal Duke Energy Carolinas (2,090 MW)
5. Smith Complex Natural Gas Duke Energy Progress (1,084 MW)
6. Brunswick Nuclear Duke Energy Progress (1,870 MW)
7. Rogers Complex Coal Duke Energy Carolinas (1,396 MW)
8. Lincoln Combust Natural Gas Duke Energy Carolinas (1,267 MW)
9. G. G. Allen Coal Duke Energy Carolinas (1,127 MW)
10. Harris Nuclear Duke Energy Progress (928 MW) Table 1-2 Ten Largest Plants by Generating Capacity in NC (EIA, State Energy Price and Expenditure Estimates, Table 2, 2014)
Duke Energy (includes Progress Energy-Carolinas) and Dominion Resources provide electric generation services to NC. The two own most generation facilities and transmission lines within the State. Several aspects of IOU activities are regulated by the NCUC, particularly resource planning, operations, safety, rates, and expansion of facilities. The IOU’s report their activities to the NCUC and to USDOE.
1.2.2 Duke Energy Corporation
Duke Energy is the largest electric power company in the nation. It is headquartered in
Charlotte and owns several franchised electric utilities that provide electricity to
customers in six states. It serves 3.2 million customers in NC. Duke Energy operates
three nuclear power plants, eleven power coal-fired plants, five natural gas combined-
cycle power plants, over a dozen gas combustion turbine stations, and over twenty
hydroelectric generation stations in NC. Duke Energy completed a merger with
Progress Energy in July of 2012. Figure 1-2 illustrates the service area of the new Duke
Energy (Duke Energy, 2013). The franchised generation plants located in other states
will not be addressed in this report.

1-8
Figure 1-2 Duke Energy Service Areas
1.2.3 Dominion Resources
Dominion Resources is one of the largest producers and transporters of energy in the nation. Dominion Resources serves the mid-west, mid-Atlantic and north-east regions of the country. Dominion Transmission Company provides electric transmission services to Virginia and portions of NC using the PJM Interconnection. Dominion Resources-North Carolina Power Company distributes electricity to Virginia and NC. In NC, Dominion serves the northeastern portion of the State near the Virginia border and the Atlantic coast stretching out to the I-95 corridor (Dominion, 2010). Figure 1-3 illustrates Dominion’s service areas.
Figure 1-3 Dominion Resources Service Area

1-9
1.2.4 North Carolina Electric Cooperatives
The North Carolina Electric Membership Corporation is a customer-owned electric utility. It consists of 26 Electric Membership Cooperatives (EMC) operating within NC as shown in Figure 1-4. The Electric Membership Cooperatives serve an estimated 2.5 million customers in NC. Each Co-op is member-owned, not-for-profit, and overseen by a board of directors elected by its members. EMCs are generally distribution entities delivering power to consumers, although some transmit energy to other utilities.
1.2.5 North Carolina Public Power
North Carolina Public Power (NCPP) is a municipality-owned and operated organization. The NCPP membership serves over 500,000 residential, commercial, and industrial customers. NC Public Power is the collective organization to the North Carolina Eastern Municipal Power Agency (NCEMPA) and the North Carolina Municipal Power Agency Number-1 (NCMPA-1).
1.2.5.1 North Carolina Municipal Power Agency (NCEMPA)
NCEMPA pans from Raleigh eastward to the Atlantic coast, as shown in Figure 1-5 below. NCEMPA, with 1,600 MW of demand, provides power to 32 cities in eastern NC. Since 1975, the NCEMPA owned a portion of five electric generating stations (Brunswick 1 and 2, Harris, Mayo, and Roxboro) operated by Duke Energy Progress/DEP (NC Public Power, 2012). In July of 2015, DEP and NCEMPA completed an approximately $1.25 billion sale of NCEMPA's generating assets back to Duke Energy Progress. The sale represented NCEMPA's ownership interest of approximately
Figure 1-4 North Carolina’s Electric Cooperatives

1-10
700 MW of generating capacity at five generating stations.
1.2.5.1.1 North Carolina Municipal Power Agency Number-1 (NCMPA-1)
The North Carolina Municipal Power Agency Number-1 (NCMPA-1) spans westward from the vicinity of Highpoint and Albemarle to the western NC border, as shown in Figure 1-6. NCMPA1 (1,100 MW of demand) provides power to 19 cities in NC. The agency has partial ownership of the Catawba Nuclear Station as well as several peak power units (NC Public Power, 2012).
1.2.5.1.2 French Broad Electric Membership Corporation
The French Broad Electric Membership Corporation is not a member of the NCMPA-1. It does, however, serve 38,000 customers in western NC (Buncombe, Madison, Mitchell, and Yancey counties) and two Eastern Tennessee counties (French Broad Electric Membership Corporation, 2018).
Figure 1-5 NCEMPA Service Areas
Figure 1-6 NCMPA-1 Service Areas

1-11
1.2.5.1.3 ElectriCities
ElectriCities is a member organization of public power providers located in North Carolina, South Carolina, and Virginia. ElectriCities provides management services to the NCMPA-1 and NCEMPA as well as customer service and safety training, emergency and technical assistance, communications, government affairs, and legal services to participating cities (Electricities, 2014).
Figure 1-7 North Carolina Public Power
1.2.6 Nuclear Stakeholders
Duke Energy Carolinas (DEC) operates two nuclear power facilities, the McGuire nuclear station in Huntersville, NC, and the two-unit Catawba nuclear Station in York County, SC. The Catawba plant is jointly owned by Duke Energy Carolinas, NCMPA-1 Piedmont Municipal Power Agency, and the NCEMC.
Duke Energy Progress (DEP) operates and maintains both the Brunswick nuclear plant and the Harris nuclear plant. The Brunswick nuclear plant is located near Southport, NC while the Harris nuclear plant is located near New Hill, NC. Until 2015, NCEMPA owned approximately 18.33% of the Brunswick nuclear plant and 16.17% of the Harris Nuclear Plant. Both Brunswick and Harris are now solely owned by DEP.

1-12
Figure 1-8 North Carolina Nuclear Stations
1.2.7 Natural Gas Stakeholders
Figure 1-9 North Carolina Natural Gas Service Areas
1.2.7.1 Piedmont Natural Gas Company
Piedmont Natural Gas Company (PNGC) provides natural gas and propane services to approximately one million customers. PNGC’s service areas include Charlotte, Greensboro, Winston-Salem, counties in the eastern and south-central portion of NC, and some customers in South Carolina and Tennessee. In October of 2016, Duke Energy acquired PNGC, adding PNGC’s customers to its existing natural gas customer base of 525,000. PNGC retained its name and operates as a business unit of Duke Energy in Charlotte where both companies are headquartered.
Piedmont Natural Gas Service Areas are illustrated in Figure 1-10 and 1-11 (Piedmont Natural Gas, 2010).

1-13
Figure 1-11 Piedmont Natural Gas Eastern Region
1.2.7.2 Public Service Company of North Carolina
Public Service Company of North Carolina (PSNC), headquartered in Gastonia, provides natural gas services to 28 NC counties (PSNC Energy, 2018). PSNC serves approximately 508,000 customers across the State including the municipalities of
Figure 1-10 Piedmont Natural Gas Central Region Districts

1-14
Raleigh, Durham, Gastonia and Asheville. PSNC was purchased from the SCANA Corporation in 2019 by Dominion Energy. Figure 1-12 illustrates PSNC’s service areas.
1.2.7.3 Frontier Natural Gas, LLC
Frontier Natural Gas, LLC is headquartered in Elkin, NC, and provides natural gas services to approximately 2,000 residential, commercial, and municipal customers in Surry, Yadkin, Wilkes, Watauga, Ashe and Warren Counties. Frontier Natural Gas is affiliated with Energy West in Great Falls, Montana.
1.2.7.4 Municipal Gas Authority/City of Toccoa
The Town of Franklin, NC is located in Macon County near the Georgia border. The Town of Franklin and Macon County contract with the City of Toccoa, GA, and the Municipal Gas Authority of Georgia for natural gas service.
1.2.7.5 Municipality-owned Natural Gas Utilities
Eight municipalities in NC own their natural gas utility. Each utility is a member of the American Public Gas Association. The cities of Greenville, Rocky Mount, and Wilson account for almost 60% of the municipal natural gas customers. The municipalities of Bessemer City, Kings Mountain, Lexington, Monroe, and Shelby account for the remainder.
1.2.8 Renewable Energy Stakeholders
As of September 2018, 10% of the State’s total electricity generation is derived from renewable resources. NC adopted a renewable energy and energy efficiency portfolio standard in 2007 that requires electric utilities to meet 12.5% of retail electricity demand through renewable energy or energy efficiency measures by 2021. Electric membership corporations and municipalities that sell electric power in the State must meet a 10% standard by 2018. For more information on the North Carolina Renewable Energy and Energy Efficiency Portfolio Standard (REPS) refer to Session Law 2007-397, also known as Senate Bill 3 (SB-3).
Figure 1-12 PSNC Service Area (PSNC Energy, 2010)

1-15
According to the EIA, NC’s renewable energy resources include hydroelectric, solar, onshore wind, biogas, wood, waste, landfill gas, and other biofuels. In 2017, North Carolina ranked second, after California, in the amount of installed solar power generation capacity at 4400 megawatts. Most solar facilities are operated by private entities in partnership with IOUs to meet broader generation needs.
Also in 2017, North Carolina became home to the Southeast’s largest wind generation facility of 208 megawatts, powered by 108 turbines in the northeastern part of the State. NC’s hydroelectric operations are generally operated by IOUs and are located close to several lakes and rivers in western and central NC.
North Carolina also hosts a growing number of biomass, biogas, and other waste-to-energy operations. In 2018, the State was ranked third nationally by the National Renewable Energy Lab for its abundant biogas resources.
The National Renewable Energy Lab has developed an interactive map that allows the reader to view the locations of bioenergy renewable energy sites. NC GreenPower developed a graphical representation of the renewable generators located within NC. The NC GreenPower map can be accessed by following this link.
1.2.9 Petroleum Stakeholders
North Carolina imports all of the petroleum it consumes. The majority of the petroleum product flowing into NC originates from refinery operations located on the Gulf Coast. Petroleum products come into the State via one of two interstate pipelines, a seaport operation, or by tanker truck. The sources of petroleum, pipelines, petroleum terminals, and distribution network will be discussed in the following paragraphs.
The SEO utilizes data from the EIA in order to discern where NC fits into the national petroleum market. States are placed into one of five Petroleum Administration for Defense Districts (PADD) based on geography. NC geographically fits into PADD-1C, which includes the southeast Atlantic states.
Since most of NC’s petroleum supply comes from two inter-state pipelines originating along the Gulf Coast in PADD-3, it is important to understand where that petroleum comes from. EIA’s 2016 data provides that about 58% of PADD-3’s petroleum originates from within the US, while 42% is imported from an international source. In terms of 2017 imports, about 36% originates from OPEC and about 64% from non-OPEC nations.
Fig
Figure 1-13 Fossil Fuels (Source: Argonne National Laboratory 2010)

1-16
Error! Reference source not found.Table 1-3, below details the total of 2017 imported petroleum into PADD-3. OPEC Nations 2017 Imports in
Thousand Barrels Non-OPEC Nations 2017 Imports in
Thousand Barrels
Venezuela 214,390 Mexico 203,520
Saudi Arabia 170,886 Canada 140,003
Iraq 168,421 Columbia 58,199 Table 1-3 PADD-3 Petroleum Imports
Of the PADD-3 domestic petroleum products refined in 2016, approximately 30% originate from federal off-shore operations and about 59% stem from Texas. Table 1-4 below provides additional details.
United States Domestic Production in PADD-3 2016 Totals in Thousand Barrels
Federal Off-Shore 584,744
Texas 1,176,041
New Mexico 146,026
Louisiana 56,432
Mississippi 20,385 Table 1-4 Top Five Petroleum Producers
1.2.10 Pipeline Operations
A majority of NC’s gasoline and diesel supplies come into the state via interstate pipelines. As such, to follow is a discussion of the pipelines and the key stakeholders in the petroleum industry.
1.2.10.1 Colonial Pipeline
Colonial Pipeline is owned by CDPQ Colonial Partners, L.P.; IFM (US) Colonial Pipeline 2, LLC; KKR-Keats Pipeline Investors, L.P.; Koch Capital Investments Company, LLC; and Shell Pipeline Company, LP. Colonial’s headquarters is in Alpharetta, Georgia. Originating in Houston, Texas, the pipeline crosses Louisiana, Mississippi, Alabama, Georgia, and South Carolina before reaching NC. In our State, it services terminals in Charlotte, Greensboro, and Selma as well as other minor pipeline spurs. From Greensboro, the pipeline continues its northward path through Virginia, Maryland, Pennsylvania, and New Jersey before terminating in New York, as illustrated below in Figure 1-14 Colonial Pipeline.

1-17
1.2.10.2 Plantation Pipeline
Plantation Pipeline is co-owned by Kinder Morgan (51.2%) and Exxon Mobil (48.6%). Originating in Louisiana, it crosses Mississippi, Alabama, Georgia, and South Carolina before entering NC. In our State, it has terminals in Charlotte, at Charlotte International Airport, and in Greensboro. The pipeline terminates in Virginia as shown below in Figure 1-15 Plantation Pipeline (Kinder Morgan, 2010)
Figure 1-14 Colonial Pipeline
Figure 1-15 Plantation Pipeline (Kinder Morgan, 2010)

1-18
1.2.10.3 Terminal Operations
The Greensboro pipeline terminal is regarded as the state’s most important since it offers easy access to east/west ground transportation via Interstate Highway 40. Interstate 40 is the major east/west NC artery, traveling from the NC/Tennessee border to the Atlantic coast. The cities of Asheville, Hickory, Winston-Salem, Greensboro, Durham, Raleigh, Wilmington, and a north/south interconnection to Interstate-95 are all serviced by Interstate 40. As a spur-line from Greensboro, the Selma terminal provides petroleum products to the eastern/coastal region and supports a majority of the state’s agricultural operations. The Charlotte terminal provides petroleum service to the southwestern and western portions of the State as well as areas in South Carolina. Terminals in neighboring states service some markets along NC’s boundaries. The Wilmington terminal, a seaport operation, has been traditionally serviced by the Hess Corporation. Located on the Cape Fear River, it services the southeastern portion of the state offering easy access to east/west travel via Interstate 40, US Highways 421, 74 and 76, all of which intersect with Interstate 95 for north/south travel. The Wilmington port also has access to coastal markets along Highway 17’s north/south route.
1.2.10.4 Wholesale Distributors
North Carolina has several wholesale distributors of petroleum products. Some are subsidiaries of national or regionally branded entities; others are independent.
1.2.10.5 Petroleum Associations
The principal petroleum associations in NC are the North Carolina Petroleum Council and the North Carolina Petroleum and Convenience Marketers Association (NCPMA). The North Carolina Petroleum Council, the state branch of the American Petroleum Institute (API), supports and lobbies for its NC members. The Council’s executive director works with the State’s oil company executives as well as the executive director of NCPCMA. The NCPCMA, a trade organization composed of wholesale/retail petroleum marketers and convenience stores/service stations, represents 370 mid-level and local delivery companies throughout NC. NCPCMA provides assistance and ensures that there is “neutral coordination” during petroleum shortages. Many of their member organizations market propane as well.
1.2.11 Propane
The Dixie Pipeline delivers 99% of the propane consumed in NC. The Dixie Pipeline transports propane from refinery operations located in Louisiana, Mississippi, and Texas through the southeast. The pipeline enters NC from Cheraw, SC, and terminates in Apex, NC. A map of the pipeline can be accessed here. The primary storage terminal for NC’s propane is located near the town of Apex. The propane is either stored in aboveground tanks or loaded into trucks for delivery to local distributors. Propane is primarily stored at either the distributor’s site or the consumer’s site and is commonly used for residential heating and water heating and for some vehicle use. Since propane is primarily used during the winter months, storage tanks are a vital part of the infrastructure. Propane travels via ground transportation to distribution points throughout

1-19
the State and then to consumers. The principal propane trade association is the North Carolina Propane Gas Association (NCPGA).
1.2.12 Home Heating Oil
Home heating oil is delivered to NC using the interstate pipelines. Like other petroleum products, its volume is based on demand. Demand usually increases during the winter months as its primary use is for home heating. Since it is a seasonal demand item, it takes careful planning to ensure the supply is shipped “just-in-time” and of a sufficient amount to meet demand. Heating oil is transported throughout the state by commercial carriers that deliver to local distributors.
1.3 Legal Authorities Mounting an effective and efficient governmental response to disruptive energy events requires a clear understanding of legal authorities and the relationships between stakeholder agencies. Statutes define the roles, relationships, and responsibilities of the Energy Policy Council, Legislative Committee, the Governor, and federal agencies. Continuous communications between these government stakeholders facilitates effective decision-making by State and federal leadership.
The following North Carolina General Statutes (N.C. Gen. Stat §) authorize State entities to respond and react to energy crises:
N.C. Gen. Stat § 113B-2 establishes the Energy Policy Council. The followingsubsections further define the council’s responsibilities and authorities.
N.C. Gen. Stat § 113B-3 through 113B-12 defines purpose, organization, dutiesand responsibilities, energy efficiency programs, energy emergency program,energy research and development, powers, authority, and reporting for theCouncil.
N.C. Gen. Stat § 113B-20 through 113B-24 defines an energy crisis, defines thepurpose, organization, and duties of the Legislative Committee on Energy CrisisManagement, and establishes plans and enforcement penalties.
N.C. Gen. Stat §113B-20 establishes that the Governor may find that an energy crisisexists “when the health, welfare or safety of the citizens of NC are threatened by reasonof an actual or impending acute shortage in usable, necessary energy resources.”
When the Governor declares an energy crisis, N.C. Gen. Stat § 113B-23 designates the Energy Policy Council as the energy emergency coordinating body for the State. N.C. Gen. Stat § 113B-9 directs the Council to develop contingency and emergency plans to deal with protection of public health, safety, welfare, and basic state economy during energy shortages. The Energy Policy Council is directed to gather from electric, natural gas, and petroleum providers’ curtailment plans that prioritize energy recipients in the event of emergencies. The Energy Policy Council also collects contingency plans from all appropriate governmental agencies when developing the Emergency Energy Program. Additionally, the Energy Policy Council develops and recommends strategies to the Governor for potential action during energy shortages.

1-20
Within 24 hours of the energy crisis declaration by the Governor made pursuant to N.C. Gen. Stat §113B-20, N.C. Gen. Stat §113B-21 directs the formation and organization of the Legislative Council on Energy Crisis Management. N.C. Gen. Stat §113B-22 sets out procedures for adopting energy emergency proposals and emergency powers, which are found here.
During an energy crisis, the Governor is expected to order the Energy Policy Council, the NCUC, the Attorney General, affected IOU’s, and other appropriate State and local agencies to implement and enforce the Emergency Energy Program created pursuant to N.C. Gen. Stat §113B-9 and any other emergency rules or orders. The Governor is authorized to issue rules and regulations to address the energy crisis.
N.C. Gen. Stat §113B-24 provides for the Attorney General and the law enforcementauthorities of the State to enforce the provisions and measures contained in theEmergency Energy Plan and orders from the Governor and establishes penalties forviolations.
N.C. Gen Stat. §166A-2 describes “the authority and responsibility of the Governor,State Agencies and local governments in prevention of, preparation for, response to,and recovery from natural or man-made disasters or hostile military or paramilitaryaction and to:
(1) Reduce vulnerability of people and property of this State to damage, injury,and loss of life and property;
(2) Prepare for prompt and efficient rescue, care and treatment of threatenedor affected persons;
(3) Provide for the rapid and orderly rehabilitation of persons and restoration ofproperty; and
(4) Provide for cooperation and coordination of activities relating to emergencyand disaster mitigation, preparedness, response and recovery among agencies and officials of this State and with similar agencies and officials of other states, with local and federal governments, with interstate organizations and with other private and quasi-official organizations.”
N.C. Gen Stat. § 75-38 pertains to price gouging and provides for the protection fromexcessive pricing during a declared state of emergency, disaster, or abnormal marketdisruption. The statute prohibits the sale or rental of goods used to preserve, protect,sustain life health safety, or economic well-being of persons with the knowledge andintent to charge a price that is unreasonably excessive. The statute applies to areaswhere the state of disaster or emergency has been declared or the abnormal marketdisruption has been found. The duration of the protection is 45 days from the triggeringevent and may be renewed by the Governor provided the disruption continues toadversely affect the State.
The State Energy Office (SEO) serves as the staff for the Energy Policy Council, and as such, prepares and updates procedures to respond to an energy emergency. Additionally, the SEO serves as the lead technical agency for advising and coordinating

1-21
efforts with energy providers and NCEM during fuel shortages, power outages, and capacity shortages that impact or threaten large numbers of citizens under the North Carolina Emergency Operations Plan, developed by the Department of Public Safety and the Division of Emergency Management. The SEO also serves on an assessment group led by the Division of Water Resources to identify the potential economic impact of drought conditions on the State.
Federal statutes may provide assistance or a foundation to the State when discussing energy assurance and emergency planning. A comprehensive list of the Federal Emergency Authorities can be found in Appendix A beginning on page 1-36.
The Protected Critical Infrastructure Information (PCII) Program of the Critical Infrastructure Information (CII) Act of 2002 is an information-protection tool that facilitates the sharing of PCII between the government and the private sector. The Protected Critical Infrastructure Information Management System (PCIIMS) is an Information Technology (IT) system and the means by which PCII submissions from the private sector are cataloged. This act serves to assure private industry of information security when discussing sensitive infrastructure information such as volumes of petroleum or the location of energy resources. Information cataloged under this act is exempt from the Freedom of Information Act (FOIA).
Federal Motor Carrier Safety Administration 49 C.F.R. 390.23 provides for a waiver of federal motor carrier safety regulations, such as driver-hour waivers, in order to provide relief in a regional or local emergency declared by the following authorities: presidential; governor; or their authorized representative. These waivers can be necessary for responding to energy emergencies as discussed elsewhere in this document.
The Energy Policy and Conservation Act, Sections 151-180, authorize the U.S. Department of Energy to establish and operate the Strategic Petroleum Reserve (SPR). Section 161(d)(1) authorizes the President to release portions of the SPR to prevent or reduce the effects of severe energy supply disruption.
The Energy Policy Act of 2005 attempts to combat growing energy problems by providing tax incentives and loan guarantees for energy production of various types. It was intended to establish a comprehensive, long-range energy policy, provide incentives for traditional energy production as well as newer, more efficient energy technologies, and conservation.
The Low-Income Home Energy Assistance Act of 1981 (amended 1998) authorizes DOE to advise the U.S. Department of Health and Human Services (HHS) on the fuel supply situation for HHS’s emergency funding of the Low-Income Home Energy Assistance Program (LIHEAP).
The Natural Gas Policy Act authorized the DOE to order any interstate pipeline or local distributor-served by an interstate pipeline to set aside natural gas to meet the needs of high-priority consumers during a natural gas emergency.

1-22
The Public Utilities Regulatory Policy Act of 1978 (P.L. 95-617) and the Power Plant and Industrial Fuel Use Act of 1978 authorize the President to prohibit any major fuel-burning installation or power plant from using natural gas or petroleum as a primary fuel during an energy emergency.
Section 27 of the Merchant Marine Act of 1920, as amended (Jones Act), 46 U.S.C. 883 The Jones Act requires the use of U.S.-flagged, U.S.-built, and U.S.-crewed vessels in coastwise trade. However, in situations when the Secretary of Homeland Security deems it necessary in the interest of the national defense, such as Hurricane Katrina in 2005, a waiver may be granted to bring relief to the affected areas. The waiver may be performed by the Secretary’s own initiative or upon the written recommendation of the head of another agency. If, in the event of a drawdown of Strategic Petroleum Reserve, the President may direct the Secretary of Homeland Security to waive the Jones Act, if the volume of crude oil to be moved is significantly greater than the capacity of the existing, Jones Act crude oil tanker fleet. Interagency procedures have been established to expedite actions on Jones Act waiver requests during a petroleum supply disruption.
The Energy Policy and Conservation Act (EPCA) of 1975. The Strategic Petroleum Reserve (SPR) is a product of the EPCA. The purpose of the SPR is to reduce the impacts of a petroleum shortage from both a national and international perspective. The SPR is estimated to contain approximately 727 million barrels of crude oil and petroleum products and is estimated to hold the equivalent of 75 days of petroleum imports. The estimated drawdown capability of the SPR is 4.4 million barrels per day for 90 days. The President of the United States may authorize a full or partial release of the SPR. The presidential decision is based upon a finding of “severe petroleum supply disruption” or to meet “IEA obligations.” There have been two SPR emergency drawdowns in the past twenty years: Operation Desert Shield/Storm in 1990-1991 and Hurricane Katrina in 2005. In June 2011, 30 million barrels were released in coordination with the IEA (U.S. Department of Energy, 2010). The Secretary of Energy may release some of the SPR as a test sale, releasing a maximum of 5 Million barrels or as an exchange to acquire oil or to alter the mix of crude oil.
The Stafford Act (P.L 100-707) constitutes the statutory authority for most federal disaster response activities, especially as they pertain to FEMA and FEMA programs.
Conservation of Power and Water Resources § 388.113 Accessing Critical Energy Infrastructure Information addresses access to critical energy infrastructure information (CEII). In general, the statute states that the owner/operator of the facility may obtain CEII. Landowners may obtain CEII, providing that they can prove that their property is in the vicinity of the project. Other requestors, such as the state, may file the request and if approved, may receive the CEII and sign a non-disclosure statement. Understanding the efforts may be beneficial for the provider in taking to protect its CEII from threats. This information is protected from FOIA.

1-23
1.3.1 Interrelationships of Agencies and Authorities
The following charts show the interrelationships of the various local, state and federal agencies that may be involved in the response/recovery from an energy emergency.
State Energy Office
Division of Emer. Mgt
NC Utilities Commission
Department of Public Safety
NC Department of Environmental Quality
Governor of North Carolina
Public Utilities
Public Utilities
Public Utilities
Figure 1-17 Lines of Authority
Information MonitoringRegulated Entities
State Energy Office
Division of Emer. Mgt
NC Utilities Commission
Energy Policy
Council
U.S. DOE
News & Industry
Monitoring
ElectricityProviders
NC Department of Environmental
Quality
Surrounding States SEO’s
Natural Gas Providers
Petroleum Pipeline &Terminals
Governors Office
State Energy Office InteractionsLines of Authority-Lines of Communication-
Public Staff
Figure 1-16 State Energy Office Interactions

1-24
Figure 1-18 North Carolina Emergency Management
Figure 1- 19 Operations Section
Figure 1-20 Infrastructure Support Group
SERT Leader
Operations Planning Logistics FiscalGeospatial and
Technology Management
Public Information
Recovery

1-25
Bibliography
Anguelov, C., Hilgert, M., & Hogarth, J. (2004). U.S. Consumers and Electronic Banking, 1995-
2003. U.S. Federal Reserve: https://core.ac.uk/download/pdf/6825641.pdf
Colonial Pipeline. (2008). Owners and Customers. Colonial Stockholders and Ownership
Percentages: http://www.colpipe.com/home/about-colonial/owners
Colonial System Map (2018). http://www.colpipe.com/home/about-colonial/system-map
Dominion Energy. (2018). Generating Power Stations. Dominion Energy website:
https://www.dominionenergy.com/about-us/making-energy
Duke Energy. (2018). Electric Generating Power Stations. Duke Energy:
https://www.duke-energy.com/our-company/about-us/power-plants
Duke Energy. (2018). Duke Energy System Map and Service Area: https://www.duke-
energy.com/_/media/pdfs/our-company/duke-energy-fast-facts.pdf?la=en
Duke University Markets & Management Capstone Course. (2004). North Carolina and the
Global Economy. Retrieved August 17, 2010, from Duke University Markets &
Management Capstone Course: http://www.soc.duke.edu/~ggere/web/mms190.pdf
U.S. Energy Information Administration (EIA): 2017 Residential, Commercial and Manufacturing
Energy Consumption Survey:
http://www.eia.doe.gov/emeu/cbecs/cbecs2003/detailed_tables_2003/detailed_tables_2
003.html#enduse03
EIA: 2017 State Energy Data System (SEDS). https://www.eia.gov/state/seds/
EIA. 2017 State Energy Consumption Estimates 1960-2015.
https://www.eia.gov/state/seds/sep_use/notes/use_print.pdf
EIA: 2017 State Energy Price and Expenditure Estimates.
https://www.eia.gov/state/seds/sep_prices/notes/pr_print.pdf
EIA: 2018 Glossary. http://www.eia.doe.gov/glossary/index.cfm?id=C
EIA: 2017. Natural Gas Consumption by End Use.
http://www.eia.doe.gov/dnav/ng/ng_cons_sum_dcu_SNC_m.htm
EIA: 2015. Updates by Energy Source, State Energy Data System (SEDS), Table E,
Primary Energy, Electricity, and Total Energy Price Estimates, 2015. Energy Information
Administration:
http://www.eia.doe.gov/emeu/states/hf.jsp?incfile=sep_fuel/html/fuel_pr_pa.html

1-26
EIA: 2016 Imports/Exports & Pipelines International & Interstate Movements of Natural
Gas by State. http://www.eia.gov/dnav/ng/ng_move_ist_a2dcu_SNC_a.htm
EIA: 2017 Natural Gas Prices.
http://www.eia.doe.gov/dnav/ng/ng_pri_sum_dcu_SNC_m.htm
EIA: 2018 Weekly Retail Gasoline and Diesel Prices,
http://www.eia.doe.gov/dnav/pet/pet_pri_gnd_dcus_r1z_w.htm
EIA: 2018 Spot Prices. http://www.eia.doe.gov/dnav/pet/pet_pri_spt_s1_d.htm
EIA: 2017 Prime Supplier Sales Volumes.
http://www.eia.doe.gov/dnav/pet/pet_cons_prim_dcu_SNC_m.htm
EIA: 2018 State Energy Profile, NC. https://www.eia.gov/state/index.php?sid=NC
EIA: 2016 U.S. Coal Distribution Report.
http://www.eia.doe.gov/cneaf/coal/page/coaldistrib/2007/d_07state.pdf
EIA: 2017. Monthly Electric Disturbance Events:
http://www.eia.doe.gov/cneaf/electricity/page/disturb_events.html
EIA: 2017. PAD District Imports by County of Origin:
http://www.eia.doe.gov/dnav/pet/pet_move_impcp_a2_r30_ep00_ip0_mbbl_m.htm
Electricities. (2018). About Electricities.
http://www.electricities.com/Default/AboutUs/AboutElectriCities.aspx
Electricities. (2018). Electricities Members Map
http://www.electricities.com/Default/AboutUs/ElectriCitiesMembership/MapofMembership
inNC.aspx
Federal Emergency Management Agency. (2008). National Response Framework.
https://www.fema.gov/pdf/emergency/nrf/nrf-core.pdf
French Broad Electric Membership Corporation. (2018). Homepage and Welcome:
http://www.frenchbroademc.com/
Google Maps. (2018): https://www.google.com/maps/@35.7833211,-78.6419766,15z
Kinder Morgan. (2018). Corporate Profile. Retrieved July 02, 2010, from Corporate Profile:
http://www.kindermorgan.com/about_us/about_us_corp_profile.cfm
Kinder Morgan. (2018). System/Southeast Terminal Map:
https://www.kindermorgan.com/pages/business/terminals/southeastOperations.aspx
NC Cooperative Electric Cooperatives. (2018). North Carolina Electric Cooperatives:
http://www.ncelectriccooperatives.com/co-ops/coops.htm

1-27
NC Public Power. (2018). North Carolina Eastern Municipal Power Agency:
http://www.ncpublicpower.com/AboutUs/NCEMPA.aspx
NC Public Power. (2018). North Carolina Municipal Power Agency Number 1:
http://www.ncpublicpower.com/AboutUs/NCMPA1.aspx
NC Department of Commerce. (2018). Business Development Program Support:
http://www.nccommerce.com/business
NC Department of Environmental Quality, formerly DENR. (2010). Division of Air Quality:
https://files.nc.gov/ncdeq/Air%20Quality/news/leg/2010_Clean_Smokestacks_Act_Repo
rt_Final.pdf
NC Public Staff of the North Carolina Utilities Commission (NCUC):
http://www.pubstaff.commerce.state.nc.us/psngas/index.html
North Carolina State Legislature. Energy policy Act of 1975, N.C.G.S. § 113B-1:
http://www.ncga.state.nc.us/gascripts/statutes/StatutesTOC.pl?Chapter=0113B
North Carolina Utilities Commission. http://www.ncuc.net/
North Carolina's Electric Cooperatives. Who We Are:
http://www.ncelectriccooperatives.com/about/who.htm
Piedmont Natural Gas. (2018). Service Area Map:
http://www.piedmontng.com/about/aboutpng/servicearea/ncterritory.aspx
Duke Energy-Progress (formerly Progress Energy. (2018). North Carolina and South Carolina
Service Area and Power Plants: https://www.duke-energy.com/our-company/about-us
Public Service of North Carolina (PSNC) Energy. (2018). Service Area Map:
http://www.psncenergy.com/en/residential-services/service-area-map/
U.S. Census Bureau. (2018). North Carolina Quick Facts.
https://www.census.gov/quickfacts/NC
U.S. Department of Energy. (2011). U.S. Department of Energy, Buildings Energy Data Book (p.
Table 3.1.1 Commercial Sector Energy Consumption):
https://ieer.org/resource/energy-issues/2011-buildings-energy-data-book/
US DOE. (2010). Hardening and Resiliancy. U.S. Department of Energy, , Office of
Electricity Delivery and Energy Reliability: https://www.oe.netl.doe.gov/docs/HR-Report-
final-081710.pdf
US DOE. (2010, June 21). U.S. Petroleum Reserves. Retrieved September 7, 2010,
from Strategic Petroleum Reserve: http://fossil.energy.gov/programs/reserves/spr/

1-28
APPENDIX A: Federal Energy Emergency Authorities Authorities Affecting Multiple Segments of the Energy Sector
Homeland Security Presidential Directive 5 (HSPD - 5)
This directive enhances the ability of the United States to manage domestic incidents by establishing a single, comprehensive national incident management system. It requires all federal departments and agencies to cooperate with the Secretary of Homeland Security by providing their full and prompt cooperation, resources and support as appropriate and consistent with their own responsibilities for protecting the nation’s security. The directive provides for federal assistance to state and local authorities when their resources are overwhelmed or when federal interests are involved.
Presidential Policy Directive 21 - Critical Infrastructure Security and Resilience
This directive establishes the national policy on critical infrastructure security and resilience. The directive also refines and clarifies the critical infrastructure-related functions, roles, and responsibilities across the Federal Government. Identifying 16 critical infrastructure sectors, the directive names sector-specific agencies to oversee each sector, including the Department of Energy as the Sector-Specific Agency for the energy sector. This directive revoked HSPD-7, but stated that plans developed pursuant to HSPD-7 would remain in effect until specifically revoked or superseded.
Presidential Policy Directive 41 - United States Cyber Incident Coordination
This directive sets forth the principles governing the Federal Government’s response to any cyber incident, whether involving government or private sector entities. For significant cyber incidents, this PPD also establishes lead Federal agencies and architecture for coordinating the broader Federal Government response. This PPD also requires the Departments of Justice and Homeland Security to maintain updated contact information for public use to assist entities affected by cyber incidents in reporting those incidents to the proper authorities.
Federal Information Security Management Act of 2002 (FISMA); E-Authentication Guidance for Federal Agencies, Office of Management and Budget (OMB) (December 16, 2003); FIPS Publication 199, Standards for Security Categorization of Federal Information and Information Systems (February 10, 2004); National Information Assurance Acquisition Policy for National Security Systems (NSTISSP 11); Federal Preparedness Circular 65, Federal Executive Branch Continuity of Operations (June 2004)
DOE, like other Federal agencies, is responsible for complying with FISMA as well as guidelines and practices developed by OMB that implement the law. While FISMA applies strictly to Federal Government agencies, DOE has carefully implemented requirements that support protection of the energy infrastructure. These include, for example, OMB’s e-authentication guidance for remote authentication, National Institute of Standards and Technology guidelines for securing and procuring national security systems, and other related guidance.
Protected Critical Infrastructure Information (PCII) Program of the Critical Infrastructure Information (CII) Act of 2002, 6 U.S.C. §§ 131-134
The PCII Program, established pursuant to the CII Act, creates a framework that enables members of the private sector to voluntarily submit sensitive information to the Department of Homeland Security (DHS) regarding the nation’s critical infrastructure with the assurance that the information, if it satisfies the requirements of the CII Act, will be protected from public disclosure. To implement and manage the program, DHS has created the PCII Program Office

1-29
within DHS’s National Protection and Programs Directorate (NPPD). The PCII Program Office or other Federal agencies designated by the PCII program manager can receive critical infrastructure information to be validated as PCII if such information qualifies for protection under the CII Act. On September 1, 2006, DHS issued a Final Rule on Procedures for Handling Critical Infrastructure Information.
Chemical Facility Anti-Terrorism Standards (“CFATS”), 6 C.F.R. Part 27
In Section 550 of the Department of Homeland Security Appropriations Act of 2007, Public Law 109-295, Congress gave DHS the authority to require high-risk chemical facilities to completevulnerability assessments, develop site security plans, and implement protective measuresnecessary to meet DHS-defined performance standards. In accordance with this authority, onApril 2, 2007, DHS released the Chemical Facility Anti-Terrorism Standards as an interim finalrule.
Through the CFATS, DHS established risk-based performance standards for the security of the Nation’s chemical facilities. The CFATS requires covered chemical facilities to prepare Security Vulnerability Assessments (SVA), which identifies facility security vulnerabilities and to develop and implement Site Security Plans, which include measures that satisfy the identified risk-based performance standards. It also allows certain covered chemical facilities, in specified circumstances, to submit Alternate Security Programs (ASPs) in lieu of an SVA, Site Security Plan, or both.
CFATS also contains associated provisions addressing inspections and audits, recordkeeping, and the protection of information that constitutes Chemical-terrorism Vulnerability Information (CVI). Finally, the rule provides the Department with authority to seek compliance through the issuance of Orders, including Orders Assessing Civil Penalty and Orders for the Cessation of Operations.
Bonneville Project Act of 1937, 16 U.S.C. 832 et seq.; Reclamation Act of 1939, as amended, 43 U.S.C. 584 et seq.; Flood Control Act of 1944, 16 U.S.C. 825(s); Colorado River Storage Act of 1956, 43 U.S.C. 620 et seq.; Pacific Northwest Preferences Act of 1964, 16 U.S.C. 837; Federal Columbia River Transmission System Act of 1974, 16 U.S.C. 838; Department of Energy Organization Act, Section 302, 42 U.S.C. 7152; Pacific Northwest Electric Planning and Conservation Act of 1980, 16 U.S.C. 839; and Energy and Water Development Appropriation Act of 1985, 16 U.S.C. 837g-1
DOE’s power marketing associations have general powers under enabling legislation to manage multiple areas of critical infrastructure protection. These range from protection to response and restoration covering generation, transmission, and related facilities. Congress provides similar authority to the Tennessee Valley Authority (TVA) to protect and reconstitute TVA generation, transmission, and related facilities.
Federal Power Act (FPA), 16 U.S.C. 791a-825r; Public Utility Regulatory Policies Act (PURPA) of 1978, codified in 16 U.S.C. 2601 et seq.; Energy Policy Act of 1992, 42 U.S.C. 13201 note
Congress provides a statutory foundation for the Federal Energy Regulatory Commission’s (FERC) oversight of power markets. While generation siting intrastate transportation, retail sales are generally regulated by state or local entities. Wholesale sales and interstate transportation generally fall under federal regulation, primarily by FERC.
One of FERC’s strategic goals is to protect customers and market participants through vigilant and fair oversight of energy markets in transition. To pursue this goal, the Commission promotes understanding of energy market operations and assesses market conditions using

1-30
objective benchmarks to create pro-competitive market structure. FERC’s Office of Market Oversight and Investigations is charged with assessing the competitive performance and efficiency of U.S. wholesale natural gas and electricity markets.
FPA, as amended, 202(a) (16 U.S.C. 824a(a)) and 215 (16 U.S.C. 824o), and the Public Utility Regulatory Policies Act, Section 209(b) (16 U.S.C. 824a-2)
Under FPA section 215, FERC has authority with regard to the reliability of the interstate electric power transmission system. Under FPA section 202(a), FERC “is empowered and directed to divide the country into regional districts for the voluntary interconnection and coordination of facilities for the generation, transmission, and sale of electric energy,” and has the authority to encourage interconnection and coordination within and between regions. DOE also has the authority to gather information regarding reliability issues and to make recommendations regarding industry security and reliability standards.
Defense Production Act (DPA) of 1950, as amended, 101(a), 101 (b), 101(c), and 708 (50 U.S.C. 2071 (a), (c), and 2158)
The Secretaries of Energy and Commerce have been delegated the President’s authorities under sections 101(a) and 101(c) of DPA to require the priority performance of contracts or orders relating to materials (including energy sources), equipment, or services, including transportation, or to issue allocation orders, as necessary or appropriate for the national defense or to maximize domestic energy supplies. DPA section 101(a) permits the priority performance of contracts or orders necessary or appropriate to promote the national defense. “National defense” is defined in DPA section 702(13) to include “emergency preparedness activities conducted pursuant to title VI of the Robert T. Stafford Disaster Relief and Emergency Act and critical infrastructure protection and assurance.” The Secretary of Energy has been delegated (Executive Orders 12919 and 11790) the DPA section 101(a) authority with respect to all forms of energy. The Secretary of Commerce has been granted (Executive Order 12919) the section 101(a) authority over most materials, equipment, and services relevant to repair of damaged energy facilities. Section 101(c) of the DPA authorizes contract priority ratings relating to contracts for materials (including energy sources), equipment, or services in order to maximize domestic energy supplies, if the Secretaries of Commerce and Energy, exercising their authorities delegated by Executive Order 12919, make certain findings with respect to the need for the material, equipment, or services for the exploration, production, refining, transportation, or conservation of energy supplies.
The DPA priority contracting and allocation authorities could be used to expedite repairs to damaged energy facilities, and for other purposes, including directing the supply or transportation of petroleum products, to maximize domestic energy supplies, meet defense energy needs, or support emergency preparedness activities. In the case of both section 101(a) and 101(c) authorities, if there are contracts in place between the entity requiring priority contracting assistance and one or more suppliers of the needed good or service, DOE (with respect to the section 101(c) authority) or DOC (with respect to the section 101(a) authority) would issue an order requiring suppliers to perform under the contract on a priority basis before performing other non-rated commercial contracts. If no contracts are in place, DOE or DOC would issue a directive authorizing an entity requiring the priority contracting assistance to place a rated order with a supplier able to provide the needed materials, equipment or services. That contractor would be required to accept the order and place it ahead of other nonrated commercial orders.
Section 101(b) provides authority to facilitate transportation of energy supplies during an emergency by requiring pipelines, marine terminals, and other facilities to perform transportation contacts to promote the national defense. The authority to control the general distribution of

1-31
petroleum supplies in the civilian market can be used if a finding is made that supplies are “scarce and critical” and defense needs cannot be met without causing dislocations that will create an appreciable hardship.
DPA section 708 provides a limited antitrust defense for industry participating in voluntary agreements “to help provide for the defense of the United States through the development of preparedness programs and the expansion of productive capacity and supply beyond levels needed to meet essential civilian demand in the United States.” In the event of widespread damage to energy production or delivery systems, this authority, for example, could be used to establish a voluntary agreement of service companies to coordinate the planning of the restoration of the facilities.
Robert T. Stafford Disaster Relief and Emergency Assistance Act, as amended, 42 U.S.C. 5121 et seq.
The Federal Emergency Management Agency (FEMA), following a presidential declaration of emergency or major disaster, provides assistance and may require other Federal agencies to provide resources and personnel to support state and local emergency and disaster assistance efforts. Requests for a presidential declaration of an emergency or major disaster must be made by the Governor of the affected state based on a finding by the Governor that the situation is of such severity and magnitude that effective response is beyond the capabilities of the State. DOE supports DHS/ FEMA relief efforts by assisting Federal, state, and local government and industry with their efforts to restore energy systems in disaster areas. When necessary, DOE also may deploy response staff to disaster sites. DOE is the lead agency directing Emergency Support Function-12 (Energy), which assists the restoration of energy systems and provides an initial point-of-contact for the activation and deployment of DOE resources. These activities are performed pursuant to the Stafford Act and HSPD-5 (Management of Domestic Incidents) and National Response Plan (NRP).
Executive Order 13636 - Improving Critical Infrastructure Cybersecurity
According to the Department of Homeland Security, this Executive Order directs the Executive Branch to develop a technology-neutral voluntary cybersecurity framework; promote and incentivize the adoption of cybersecurity practices; increase the volume, timeliness, and quality of cyber threat information sharing; incorporate strong privacy and civil liberties protections into every initiative to secure our critical infrastructure; and explore the use of existing regulation to promote cybersecurity.
Executive Order 13800 - Strengthening the Cybersecurity of Federal Networks and Critical Infrastructure
The Order initiates action on several fronts, including 1) securing the Federal network; 2) encouraging collaboration with industry to protect critical infrastructure; 3) strengthening the deterrence posture of the U.S. and building international coalitions; and 4) building a stronger cybersecurity workforce.
Executive Order 11912, Department of Energy Organization Act, Sections 102 and 203 (42 U.S.C. 7112, 7133); Energy Policy and Conservation Act (EPCA), Sections 251-254 (42 U.S.C. 6271-6274); Agreement on an International Energy Program (IEP)
DOE and the Department of State share responsibility for U.S. participation in the energy emergency preparedness activities of the International Energy Agency (IEA). IEA, consisting of 26 member countries, was established by IEP following the 1973 oil crisis with the goal of developing and maintaining cooperative oil emergency response policies and programs. DOE leads U.S. participation in IEA’s oil emergency response programs. The Department develops

1-32
plans for U.S. emergency response actions, develops the U.S. position on an appropriate international response, and makes recommendations for action to the President.
Section 27 of the Merchant Marine Act of 1920, as amended (Jones Act), 46 U.S.C. 883
Public Law 81-891(64 Stat. 1120) directs the Secretary of Homeland Security to waive the provisions of section 27 of the Merchant Marine Act of 1920 (“Jones Act”) which requires the use of U.S.-flag, U.S.-built, and U.S.-crewed vessels in coastwise trade, upon the request of the Secretary of Defense to the extent the Secretary of Defense deems necessary in the interest of the national defense. Public Law 81-891 authorizes the Secretary of Homeland Security to waive compliance with the Jones Act either upon his own initiative or upon the written recommendation of the head of another agency whenever the Secretary determines that waiver is necessary for the interest of the national defense. In the event of a drawdown of SPR, the President may direct the Secretary of Homeland Security to waive the Jones Act, if the volume of crude oil to be moved is significantly greater than the capacity of the existing, available U.S.-flag “Jones Act” crude oil tanker fleet. Interagency procedures have been established to expedite actions on Jones Act waiver requests during a petroleum supply disruption.
Interstate Commerce Commission Termination Act of 1995 (Pub. L. No. 104-88, 109 Stat.803)
This authorizes the Surface Transportation Board and the Department of Transportation to issue priority orders during an emergency situation for rail movement of commodities including petroleum. (49 U.S.C. Section 11123)
Federal Motor Carrier Safety Administration 49 C.F.R. 390.23
This provides for waiver of federal motor carrier safety regulations to provide emergency relief during a regional or local emergency declared by the President, governor of a state or the Regional Director of Motor Carriers. An emergency is defined to include natural disasters, explosions, blackouts or other occurrences, natural or man-made, which interrupts the delivery of essential services such as electricity, medical care, sewer, water, telecommunications and telecommunications transmission or essential supplies such as food and fuel, or otherwise immediately threaten human life or public welfare. For example, the waivers may exempt motor carriers and drivers from limits on on-duty hours when providing direct assistance in such emergencies and provides exemptions from inspections, record keeping, hazardous materials, and other requirements.
Department of Energy Organization Act, Section 205 and Federal Energy Administration Act of 1974, Sections 51 to 59
U.S. Department of Energy, the National Association of State Energy Officials (NASEO), the National Association of Regulatory Utility Commissioners (NARUC), and the National Emergency Management Association (NEMA) agreed that DOE and States will develop, maintain, and distribute a contact list of state and federal individuals responsible for energy market assessment and energy emergency responses. The states and DOE will participate in the effort by sharing timely assessments of energy markets with DOE and other states in the event of an energy supply disruption. In support of this effort, each state identified one or more Energy Emergency Assurance Coordinators (EEACs).
Community Opportunities, Accountability and Training and Educational Services Act of 1998, Title III, Sec 301-309, and the Low Income Home Energy Assistance Act of 1981
The Department of Health and Human Services (HHS) can make the Low-Income Home Energy Assistance Program (LIHEAP) emergency contingency funds available to help eligible low-income households meet their home heating and/or cooling needs arising from a natural

1-33
disaster or another emergency such as extremely high energy prices. DOE may advise HHS on the fuel supply situation for such emergency funding.
In addition to the availability of discretionary emergency funds, HHS also annually awards energy assistance block grants to the 50 states, the District of Columbia, eligible Indian tribes/tribal organizations, and insular territory areas, who in turn make payments directly to eligible households to help meet the costs of home energy.
Ports and Waterways Safety Act, Natural Gas Pipeline Safety Act, and the Hazardous Liquids Pipeline Safety Act, 33 U.S.C. 1221 et seq.
The Ports and Waterways Safety Act authorizes the Secretary of Transportation to establish vessel traffic systems for ports, harbors, and other navigable waters and control vessel traffic in areas determined to be hazardous (e.g., because of conditions of reduced visibility, adverse weather, vessel congestion, etc.) (33 U.S.C. 1223).
Two statutes provide the framework for the federal pipeline safety program. The Natural Gas Pipeline Safety Act of 1968 as amended authorizes DOT to regulate pipeline transportation of natural (flammable, toxic, or corrosive) gas and other gases as well as the transportation and storage of liquid natural gas (LNG). Similarly, the Hazardous Liquid Pipeline Safety Act of 1979 as amended authorizes DOT to regulate pipeline transportation of hazardous liquids (crude oil, petroleum products, anhydrous ammonia, and carbon dioxide). Both of these Acts have been re-codified as 49 U.S.C. Chapter 601. The federal pipeline safety regulations (1) assure safety in design, construction, inspection, testing, operation, and maintenance of pipeline facilities in the location, construction, operation, and maintenance of LNG facilities; (2) set out parameters for administering the pipeline safety program; and (3) delineate requirements for onshore oil pipeline response plans. The regulations are written as minimum performance standards.
The Magnuson Act (50 U.S.C. 191 et seq.) directs the Secretary of Transportation to issue regulations governing the movement of any vessel within U.S. Territorial waters, upon a presidential declaration of a national emergency by reasons of actual or threatened war, insurrection or invasion, or disturbance or threatened disturbance of the international relations of the United States (50 U.S.C. 191).
Maritime Transportation Security Act (MTSA), Public Law 107-295, 46 U.S.C. 2101 note
MTSA, which amended the Merchant Marine Act of 1936, requires implementation of regulations for improving the security of ports, waterfront facilities, and vessels, including those involved with the oil and gas sectors. Most energy sites with waterfront facilities are impacted by MTSA and must conduct vulnerability assessments and develop security plans to be approved by the U.S. Coast Guard (USCG).
Aviation and Transportation Security Act (ATSA), Public Law 107-71, 115 Stat. 597, November 19, 2001
As established by ATSA, TSA is responsible for security in all modes of transportation. The six modes of transportation include mass transit, aviation, maritime, highway, rail, and pipeline systems. As further noted in NIPP, TSA is the sector-specific agency (SSA) for all modes of transportation except maritime, for which the USCG is the SSA.
Critical Energy Infrastructure Information, FERC Orders 630 and 630A
FERC issued a final rule restricting access to Critical Energy Infrastructure Information and establishing new procedures for requesting access to Critical Energy Infrastructure Information.
International Emergency Economic Powers Act (IEEPA) (50 U.S.C. Section 1701 et seq.)

1-34
The IEEPA authorizes the president to declare a national emergency to deal with a threat to the national security, foreign policy, or economy of the United States that originates in whole or substantial part outside the United States. Upon declaration of a national emergency, it further authorizes the president, after such a declaration, to block transactions and freeze assets to deal with the threat. In the event of an actual attack on the United States, the president can also confiscate property connected with a country, group or person that aided in the attack. For instances, if a petroleum shortage is sufficiently severe to invoke a presidentially declared emergency, the IEEPA could be used to control supplies of petroleum products in which foreign countries or foreign nationals have an interest.
Federal Energy Management Program (FEMP)
The Department of Energy’s Federal Energy Management Program (FEMP) works to reduce the cost and environmental impact of the federal government by advancing energy efficiency and water conservation, promoting the use of distributed and renewable energy, and improving utility management decisions at federal sites. In a severe emergency, the President may order increased conservation in federal facilities and operations, including the federal vehicle fleet. The FEMP helps federal agencies reach their energy savings goals by aggressively raising awareness of energy efficiency activities and making it easier for agencies and utilities to save energy and money.
1. Authorities Affecting Electric Power
Fixing America’s Surface Transportation (FAST) Act: Grid Security Emergency Orders
The FAST Act added Section 215A to the FPA. Subsection 215A(b) allows the Secretary of Energy to issue an emergency order after the President, in writing, declares a “Grid Security Emergency.” A Grid Security Emergency is essentially a large-scale power grid disruption due to a cyberattack, physical attack, or geomagnetic storm, but not a natural disaster. An order issued during a Grid Security Emergency may encompass “emergency measures as are necessary for the judgment of the Secretary to protect or restore the reliability of critical electric infrastructure or of defense critical electric infrastructure during such emergency,” and may apply to the Electric Reliability Organization, a regional entity, or any owner, user, or operator of critical electric infrastructure or of defense critical electric infrastructure within the United States.”
Energy Policy Act of 2005, Public Law 109-58, Title XII: Electricity, Subtitle A: Reliability Standards, Section 1211: Electric Reliability Standards; Electricity Modernization Act of 2005, August 5, 2005, 42 U.S.C. 15801 note; 16 U.S.C. 824o
This subtitle provides for federal jurisdiction over certain activities that are required to support the reliability of the U.S. bulk power system. Title XII authorizes FERC to certify a national electric reliability organization to enforce mandatory reliability standards for the bulk power system. FERC will oversee the electric reliability organization in the U.S. and all-electric reliability organization standards must be approved by FERC. The electric reliability organization can impose penalties on a user, owner or operator of the bulk power system for violations of any FERC-approved reliability standard. However, such penalties are subject to FERC review and potential change.

1-35
FERC Order Issued in Docket No. RR06-1-000, Certifying the North American Electric Reliability Council (NERC) as the Electric Reliability Organization (ERO), July 20, 2006
Pursuant to the Energy Policy Act of 2005, FERC conditionally certified NERC as the Nation’s ERO. NERC must make specified changes to the electric reliability organization and file those changes with FERC in order to continue as the electric reliability organization.
As the electric reliability organization, NERC will be responsible for developing and enforcing mandatory electric reliability standards under FERC’s oversight. The standards will apply to all users, owners and operators of the bulk power system.
FERC Order 706 Issued in Docket No. RM06-22-000, Mandatory Reliability Standards for Critical Infrastructure Protection, January 18, 2008
Pursuant to section 215 of the FPA, FERC approved eight Critical Infrastructure Protection (CIP) Reliability Standards submitted to FERC for approval by the North American Electric Reliability Corporation (NERC). The CIP Reliability Standards require certain users, owners, and operators of the Bulk-Power System to comply with specific requirements to safeguard critical cyber assets.
FERC Order Issued in Docket No. RD09-7-000, Approving Revised Reliability Standards for Critical Infrastructure Protection and Requiring Compliance Filing, September 30, 2009
Pursuant to section 215(d)(5) of the FPA, FERC in Order 706 directed NERC to develop modifications to the eight Critical Infrastructure Protection (CIP) Reliability Standards using its Reliability Standards Development Process. On May 22, 2009, NERC filed revised Reliability Standards for Critical Infrastructure Protection. In its filing, NERC indicates that it is developing responsive modifications in multiple phases and the instant filing represents the results of the first phase of the initiative. The revised CIP Reliability Standards will become effective on April 1, 2010.
FPA, 16 U.S.C. 791a-825r; Public Utility Regulatory Policies Act, 16 U.S.C. 2705; DOE Organization Act, 42 U.S.C. 7101-7352; 18 CFR Parts 4, 12, and 16; MOU between FERC and U.S Army Corps of Engineers (USACE) and Bureau of Reclamation (BOR)
Congress authorizes FERC to oversee the nation’s nonfederal hydropower infrastructure. Congressional and other legal delegations also define hydropower responsibilities among FERC and other agencies, such as USACE and BOR.
With regard to FERC authorities, delegations in FPA include a range of activities, such as issuing licenses for nonfederal hydropower projects; requiring safety and operating conditions; investigating and taking over facilities (or levying fines) for administrative violations, such as safety and security; defining construction, maintenance, and operation requirements by licensees; and other acts to carry out the purposes of the FPA. In addition, section 405(d) of PURPA, 16 U.S.C. 2705, authorizes a hydropower project’s exemption from licensing under certain conditions. Finally, DOE Organization Act, 42 U.S.C. 7101-7352: Title IV establishes FERC (as the successor agency to the Federal Power Commission) and enumerates FERC’s authority regarding hydropower facilities. In addition to congressional delegations, regulations further define FERC authorities over hydropower facilities. These rules address such issues as project safety and security, procedures for relicensing or Federal takeover of licensed hydropower projects, and investigations.
FERC has several Memorandums of Understandings (MOUs) with regard to hydropower facilities:

1-36
• USACE, which has responsibility for ownership and operation of federal dams forelectric power production and other purposes. This MOU describes procedures foragency cooperation during the processing of hydropower applications to facilitate theinvestigation, construction, operation and maintenance of FERC-licensed hydro projectsat USACE dams.
• BOR, which has responsibility for ownership and operation of dams for electric powerproduction and other purposes. This MOU describes procedures for agency cooperationduring the processing of hydropower applications to facilitate the investigation,construction, operation and maintenance of FERC-licensed hydro projects at BORdams.
Executive Order 10485, Providing for the Performance of Certain Functions Heretofore Performed by the President with Respect to Electric Power and Natural Gas Facilities Located on the Borders of the United States, September 3, 1953, as amended by Executive Order 12038, Relating to Certain Functions Transferred to the Secretary of Energy by the Department of Energy Organization Act, February 3, 1978
DOE is authorized to issue presidential permits for the construction, operation, maintenance, and connection of electric transmission facilities at U.S. international borders if it determines that the issuance of such a permit is in the public interest. In determining whether issuance of the permit is consistent with the public interest, DOE considers the impact the proposed project would have on the operating reliability of the U.S. electric power supply and the environmental impacts of the proposed project pursuant to the National Environmental Policy Act (NEPA) of 1969, and any other factors that DOE may also consider relevant to the public interest. DOE must also obtain favorable recommendations from the Secretary of State and the Secretary of Defense before issuing a permit.
Department of Energy Organization Act, FPA, 10 CFR Sections 205.350——205.353
DOE has the authority to obtain current information regarding emergency situations on the electric supply systems. It may establish mandatory reporting requirements for electric power system incidents or possible incidents. This reporting is required to meet national security requirements and other responsibilities contained in the NRP for emergencies.
FPA, as amended, 202(c), 16 U.S.C. 824a(c)
The Secretary of Energy has authority in time of war or other emergencies to order temporary interconnections of facilities and generation, delivery, interchange, or transmission of electric energy that the Secretary deems necessary to meet an emergency.
This authority may be utilized upon receipt of a petition from a party requesting the emergency action or it may be initiated by DOE on its own initiative.
FPA, as amended, 202(e), 16 U.S.C. 824a(e)
Exports of electricity from the United States to a foreign country are regulated by DOE pursuant to sections 301(b) and 402(f) of the Department of Energy Organization Act (42 U.S.C. 7151(b), 7172(f)) and require authorization under section 202(e) of FPA (16 U.S.C. 824a(e)).
FPA, as amended, 210 and 211 (16 U.S.C. 824i and 824j)
These sections authorize FERC to order interconnections and wheeling transmission services if such actions are, among other requirements, in the public interest and not detrimental to reliability.

1-37
Department of Energy Organization Act and FPA, 10 CFR 205.350-205.353
DOE has authority to obtain current information regarding emergency situations on the electric supply systems in the United States. DOE has established mandatory reporting requirements for electric power system incidents or possible incidents. This reporting is required to meet DOE’s national security requirements and other responsibilities contained in NRP.
Power Plant and Industrial Fuel Use Act (FUA), 404(a), 42 U.S.C. 8374(a)
Under section 404(a), the president has authority by order to allocate coal (and require the transportation of coal) for use by any power plant or major fuel-burning installation during a declared severe energy supply interruption as defined by section 3(8) of the Energy Policy and Conservation Act, 42 U.S.C. 6202(8). The president may also exercise such allocation authority upon a published finding that a national or regional fuel supply shortage exists or may exist that the president determines is, or is likely to be, of significant scope and duration, and of an emergency nature; causes, or may cause, major adverse impact on public health, safety, welfare or on the economy; and results, or is likely to result, from an interruption in the supply of coal or from sabotage, or from an act of God. Section 404(e) stipulates that the president may not delegate his authority to issue orders under this authority. It does not, however, prevent the president from directing any federal agency to issue rules or regulations or take other action consistent with section 404, in the implementation of such order.
The FUA section 404(a) authority could be used to help provide coal as an alternative fuel source to electric power plants and other major fuel-burning installations that have received orders prohibiting the burning of natural gas or petroleum as a primary energy source, assuming these facilities actually have the capability to burn coal. More likely than not, so the authority may be of limited utility. This authority also could be used during a coal supply shortage to ensure that coal-burning electric power plants or major fuel-burning installations have adequate supplies of coal.
As an alternative to the use of FUA section 404(a), the president or the president’s delegate(s), could allocate coal supplies under the authority of section 101(a) of the Defense Production Act, 50 U.S.C. App. 2071(a) and Executive Order 12919 (1994).
Clean Air Act, 42 U.S.C. 7401 et seq.
Section 110(f) of the Clean Air Act permits a state governor to issue an emergency temporary suspension of any part of a State Implementation Plan (SIP) (as well as a temporary waiver of penalties for excess SOx or NOx emissions) in accordance with the following: (1) the owner/operator of a fuel-burning source petitions the state for relief; (2) the governor gives notice and opportunity for public hearing on the petition; (3) the governor finds that an emergency exists in the vicinity of the source involving high levels of unemployment or loss of necessary energy supplies for residential dwellings and that the unemployment or loss can be totally or partially alleviated by an emergency suspension of SIP requirements applicable to the petitioning source; (4) the president, in response to the governor’s request, declares a national or regional emergency exists of such severity that a temporary SIP suspension may be necessary and other means of responding to the energy emergency may be inadequate; and (5) the governor issues an emergency suspension to the source. DOE may be asked to advise the president of fuel supply situations regarding requests for presidential emergency declarations for SIP relief.
2. Authorities Affecting Natural Gas
Natural Gas Act, Sections 3 and 7, 15 U.S.C. 717 et seq

1-38
DOE has authority under section 3 to issue orders, upon application, to authorize imports and exports of natural gas. Section 3 requires DOE to approve, without modification or delay, applications to import LNG and applications to import and export natural gas from and to countries with which there is a free-trade agreement in effect requiring national treatment for trade in natural gas. Section 7 provides FERC the authority to approve the siting of and abandonment of interstate natural gas facilities, including pipelines, storage, and LNG facilities. FERC authority under the Natural Gas Act is to review and evaluate certificate applications for facilities to transport, exchange, or store natural gas; acquire, construct, and operate facilities for such service; and to extend or abandon such facilities. In this context, FERC approvals include the siting of said facilities and evaluation of alternative locations. FERC jurisdiction does not include production, gathering, or distribution facilities, or those strictly for intrastate service. In reference to regulating imports and exports of natural gas under section 3 of the Natural Gas Act, Executive Order 10485, as amended by Executive Order 12038, and sections 301(b), 402(e), and (f) of the Department of Energy Organization Act (42 U.S.C. 7101 et seq.), the Secretary has delegated to FERC authority over the construction, operation, and siting of particular facilities, and with respect to natural gas, that involves the construction of new domestic facilities, the place of entry for imports or exit for exports. FERC also has authority to approve or deny an application for the siting, construction, expansion, and operation of an LNG terminal under section 3 of the Natural Gas Act.
Natural Gas Policy Act, Title III, Sections 301-303, 15 U.S.C. 717 et seq.
DOE may order any interstate pipeline or local distribution company served by an interstate pipeline to allocate natural gas in order to assist in meeting the needs of high-priority consumers during a natural gas emergency. DOE has delegated authority (Executive Order 12235) under sections 302 and 303, respectively, of the Natural Gas Policy Act, to authorize purchases of natural gas and to allocate supplies of natural gas in interstate commerce to assist in meeting natural gas requirements for high priority uses, upon a finding by the president under section 301 of an existing or imminent natural gas supply emergency (15 U.S.C. 3361-3363). The declaration of a natural gas supply emergency is the legal precondition for the emergency purchase and allocation authority in sections 302 and 303, respectively, of the Natural Gas Policy Act.
Although Executive Order 12235 delegates to the Secretary of Energy the emergency purchase and allocation authorities in sections 302 and 303, respectively, the president has not delegated his authority to declare a natural gas supply emergency. Nothing in the Natural Gas Policy Act would preclude such a presidential delegation.
Under section 301 of the Natural Gas Policy Act, the president may declare a natural gas supply emergency if he makes certain findings. The president must find that a severe natural gas shortage, endangering the supply of natural gas for high-priority uses, exists or is imminent in the United States or in any region of the country. Further, the president must find that the exercise of the emergency natural gas purchase authority under section 302 of the Natural Gas Policy Act, of the emergency allocation authority under section 303 of the Natural Gas Policy Act, or of the emergency conversion authority of section 607 of PURPA is reasonably necessary, having exhausted other alternatives to the maximum extent practicable, to assist in meeting natural gas requirements for high-priority uses. The emergency terminates on the date the president finds that a shortage either no longer exists or is not imminent or 120 days after the date of the emergency declaration, whichever is earlier.
Public Utility Regulatory Policies Act of 1978, Section 607, 15 U.S.C. 717z, and Section 404(b) of the Power Plant and Industrial Fuel Use Act, 42 U.S.C. 8374(b)

1-39
There are two authorities that can be used in emergency situations to require utilities to switch from natural gas and petroleum for electric power generation. DOE has delegated authority (Executive Order 12235) under section 607(a) of PURPA, following the president’s finding of a natural gas supply emergency, to prohibit the burning of natural gas by any electric power plant or major fuel-burning installation. The required emergency finding is identical to that in the Natural Gas Policy Act (15 U.S.C. 717z). As explained in the previous section discussing the Natural Gas Policy Act, under section 301 of the Natural Gas Policy Act and 607(a) of PURPA, the president may declare a natural gas supply emergency if he makes certain findings. The president must find that a severe natural gas shortage, endangering the supply of natural gas for high-priority uses, exists or is imminent in the United States. The PURPA fuel-switching authority is similar to the presidential authority contained in section 404(b) of the Power Plant and Industrial Fuel Use Act (FUA), 42 U.S.C 8374(b), to prohibit the burning of natural gas or petroleum by electric power plants or major fuel-burning installations.
Section 404(b) of FUA provides that the president may by order prohibit the use by any power plant or major fuel-burning installation of petroleum or natural gas, or both, as a primary energy source. A legal precondition to such a presidential order is the president’s finding of a severe energy supply interruption, as defined by section 3(8) of EPCA, 42 U.S.C. 6202(8). Section 404(e) stipulates that the president may not delegate his authority to issue orders under this authority. It does not, however, prevent the president from directing any Federal agency to issue rules or regulations or take other action consistent with section 404, in the implementation of such order.
Emergency Reconstruction, FERC Order 633
Amended FERC regulations enable interstate natural gas pipeline companies to replace mainline facilities using, if necessary, a route other than the existing right-of-way and waiving the 45-day prior notice requirement and cost constraints, when immediate action is required to restore service in an emergency because of a sudden unanticipated loss of natural gas or capacity in order to prevent loss of life, impairment of health, or damage to property. In such emergencies, the amended regulations allow pipeline companies to proceed with construction before the end of the separate 30-day prior notice period to landowners if all necessary easements have been obtained. This initiative was implemented in the wake of the events of September 11, 2001, to help ensure the security of the natural gas pipeline infrastructure without compromising FERC’s responsibilities under the NEPA.
3. Authorities Affecting Petroleum
Energy Policy and Conservation Act, Sections 151-180, 42 U.S.C. 6231-6251
Sections 151-191 of EPCA authorize DOE to establish and operate the Strategic Petroleum Reserve (SPR). Section 161(d)(1) authorizes the President to order drawdown and sale of products from the SPR upon a finding that drawdown is required either by a “severe energy supply interruption” or obligations of the United States under the Agreement on an International Energy Program (42 U.S.C. 6241(d)(1)).
Section 161(h) empowers the President to drawdown the SPR in circumstances other than a “severe energy supply interruption” or a need to meet U.S. obligations under IEP, if the President finds that a circumstance “exists that constitutes, or is likely to become, a domestic or international energy supply shortage of significant scope and duration” and the President determines that drawdown “would assist directly or significantly in preventing or reducing the adverse impact of such a shortage” and the Secretary of Defense has found that the action

1-40
taken will not impair national security. However, there are several limitations to the use of this authority: The reserve may not be drawn down for more than 30 million barrels or for longer than 60 days with respect to a single event, or if the reserve would be reduced below the level of 500 million barrels (42. U.S.C. 6241(h)). EPCA gives the President authority to authorize the export of crude oil withdrawn from the SPR during a drawdown for refining or exchange outside the United States in connection with an arrangement for the delivery of refined petroleum products to the United States (42. U.S.C. 6241(i)). In recognition of this authority, DOC has provided for automatic approval for export of SPR oil for these purposes in its Export Administration Regulations at 15 CFR Part 754.
The sale of oil withdrawn from the SPR would be in accordance with the SPR competitive sales procedures in 10 CFR Part 625.E E
Energy Policy and Conservation Act, Sections 181-184, 42 U.S.C. 6250-6250c
Pursuant to section 181 of EPCA, 42 U.S.C. 6250, the Secretary established and maintains a 2-million-barrel home heating oil reserve in the Northeast. This reserve is not part of the SPR. The Secretary may sell products from the Northeast Home Oil Reserve dependent on a presidential finding that there is a “severe energy supply interruption” in accordance with section 183(a) of the EPCA, based upon a finding that a dislocation in the heating oil market has resulted from such interruption or the existence of a regional supply shortage of significant size and duration, and that action under this section would assist directly and significantly in reducing the adverse impact of such shortage.
Energy Policy and Conservation Act, Section 363, 42 U.S.C. 6322(e)
To be eligible for financial assistance to assist in the development and implementation of energy
conservation plans, a State must submit to the Secretary of Energy, as a supplement to its
energy conservation plan, an energy emergency planning program for an energy supply
disruption as designated by the State consistent with applicable Federal and State law. The
contingency plan, “... shall include an implementation strategy or strategies (including regional
coordination) for dealing with energy emergencies.”
4. Additional Materials
National Infrastructure Protection Plan
PPD-21 directed DHS to update the National Infrastructure Protection Plan (NIPP). The NIPP is designed to create “a national unity of effort to achieve critical infrastructure security and resilience.” Its “Call to Action” section “guides the collaborative efforts of the critical infrastructure community to advance security and resilience under three broad activity categories: building upon partnership efforts; innovating in managing risk and focusing on outcomes.”
Energy Sector-Specific Plan
Within the NIPP framework, the Energy Sector-Specific Plan “helps to guide and integrate the sector’s continuous effort to improve the security and resilience of its critical infrastructure and to describe how the Energy Sector contributes toward the national critical infrastructure security and resilience goals.” Acknowledging that “security and resilience efforts are a shared responsibility between the government and industry” given widespread private sector ownership of energy infrastructure, the Plan specifically implements items from the NIPP Call to Action.

1-41
The Department of Energy, as the SSA for the energy sector, led the development of the most recent Plan.
Energy Sector Cybersecurity Framework Implementation Guidance
The Department of Energy released this guidance to help the energy sector establish or align existing cybersecurity risk management programs to meet the objectives of the Cybersecurity Framework released by the National Institutes of Standards and Technology (NIST) in February 2014. The voluntary Cybersecurity Framework consists of standards, guidelines, and practices to promote the protection of critical infrastructure and was developed in response to EO 13636. In developing the guidance, the Department collaborated with private sector stakeholders through the Electricity Subsector Coordinating Council and the Oil & Natural Gas Subsector Coordinating Council and worked with other SSA representatives and interested government stakeholders.

1-42
APPENDIX B: Acronyms and Abbreviations in North Carolina Emergency Assurance Plan (NCEAP), Volumes 1-6
AC Air Conditioning
ACP Atlantic Coast Pipeline
AFV Alternative Fuel Vehicle
ALA-CEE Advanced Lead Acid with Carbon Enhanced Electrodes
AMI Advance Metering Infrastructure
API American Petroleum Institute
ARPA-E Advanced Research Projects Agency-Energy
ASPs Alternate Security Programs
ATM Automated Teller Machine
ATSA Aviation and Transportation Security Act
ATV Advanced Technology Vehicle
BFB Bubbling Fluidized Bed
BOR Bureau of Reclamation
BTU British Thermal Unit
CAES Compressed Air Energy Storage
CCS Carbon Capture and Sequestration
CDL Commercial Driver’s License
CEDS Cybersecurity for Energy Delivery Systems
CESER Cybersecurity, Energy Security, and Emergency Response
CFATS Chemical Facility Anti-Terrorism Standards
CFR Code of Federal Regulations
CII Critical Infrastructure Information
CIKR Critical Infrastructure and Key Resources

1-43
CIP Critical Infrastructure Protection
CNG Compressed Natural Gas
COOP Continuity of Operations Plan
CPUC California Public Utilities Commission
CT Combustion Turbine
CVI Chemical-terrorism Vulnerability Information
DAQ Division of Air Quality
DE Duke Energy
DEC Duke Energy Carolinas
DENR Department of Environment and Natural Resources
DEP Duke Energy Progress
DAQ Division of Air Quality
DEQ Department of Environmental Quality
DMS Distribution Management Systems
DHS U.S. Department of Homeland Security
DOD U.S. Department of Defense
DOE U.S. Department of Energy
DOT Department of Transportation
DPA Defense Production Act
DPI Department of Public Instruction
DPS Department of Public Safety
DR Demand Response
DWR Division of Water Resources
EAP Energy Assurance Plan
EC Electrochemical Capacitor
EEAS Energy Emergency Assurance Coordinator

1-44
EIA Energy Information Center, U.S. Department of Energy
EISA Energy Independence and Security Act
EPA Environmental Protection Agency of United States
EM Division of Emergency Management
EMAC Emergency Management Assistance Compact
EMAP Emergency Management Accreditation Program
EMC Electric Membership Cooperative
EMP Electromagnetic Pulse
EMS Energy Management System
EOC Emergency Operations Center
EOP Emergency Operations Plan
EPA U.S. Environmental Protection Agency
EPCA Energy Policy and Conservation Act
EPC Energy Policy Council
EPIC Energy Production and Infrastructure Center
EPRI Electric Power Research Institute
ERC Engineering Research Center, North Carolina State University
ERO Electric Reliability Organization
ESF Emergency Support Function
ESRMO Enterprise Security and Risk Management Office
EV Electric Vehicle
FAN Field Area Network
FAST Fixing America’s Surface Transportation Act
FCEV Fuel Cell Electric Vehicle
FCO Federal Coordinating Officer
FEMA Federal Emergency Management Agency
FEMP Federal Energy Management Program

1-45
FERC Federal Energy Regulatory Commission
FISMA Federal Information Security Management Act of 2002
FMCSA Federal Motor Carrier Safety Administration
FOIA Freedom of Information Act
FPA Federal Power Act
FREEDM Future Renewable Electric Energy Delivery and Management
FUA Power Plant and Industrial Fuel Use Act
GOA Government Accounting Office
GS General Statute
HEV Hybrid Electric Vehicle
HHS U.S. Department of Health and Human Services
HOV High Occupancy Vehicle
HSPD-5 Homeland Security Presidential Directive 5
HVAC Heating, Ventilation and Air Conditioning
IC Internal Combustion
ICS Incident Command System
ICS Industrial Control System
IEEPA International Emergency Economic Powers Act
IEP International Energy Program agreement
IOU Investor Owned Utility
ISER Infrastructure Security and Energy Restoration, U.S. Department of Energy
IS Information Systems
ISI Independent System Operator
IT Information Technology

1-46
JFHQ Joint Force Headquarters
kHz Kilohertz
kW Kilowatts
kWh Kilowatt hour
LAN Local Area Network
LCD Local (Natural Gas) Distribution Company
LFG Landfill Gas
LIHEAP Low-Income Home Energy Assistance Program
Li-ion or LIB Lithium Ion Battery
LNG Liquid Natural Gas
LPG Liquefied Propane Gas
Mcf Million Cubic Feet
MBTU Thousand British Thermal Units
MMBTU Million British Thermal Units
MOU Memorandum of Understanding
MPG Miles Per Gallon
MPH Miles Per Hour
MSL Mean Sea Level
MSW Municipal Solid Waste
MTSA Maritime Transportation Security Act
MW Megawatts
NAN Neighborhood Area Network
NARUC National Association of Regulatory Utility Commissioners
NaS Sodium Sulfur

1-47
NASEO National Association of State Energy Officials
NCDA&CS North Carolina Department of Agriculture and Consumer Services
NCDEQ North Carolina Department of Environmental Quality
NCDPI North Carolina Department of Public Instruction
NCDIT North Carolina Department of Information Technology
NCDOT North Carolina Department of Transportation
NCDPS North Carolina Department of Public Safety
NCDSS North Carolina Division of Social Services
NCEM North Carolina Division of Emergency Management
NCDWQ North Carolina Division of Water Quality
NCEAP North Carolina Energy Assurance Plan
NCEOP North Carolina Emergency Operations Plan
NCEM North Carolina Electric Cooperatives
NCESF North Carolina Emergency Support Function
NCEMPA North Carolina Eastern Municipal Power Agency
NCMPA-1 North Carolina Municipal Power Agency Number-1
NCGA North Carolina General Assembly
NCGS North Carolina General Statutes
NCNG North Carolina National Guard
NCPC North Carolina Petroleum Council
NCPCM North Carolina Petroleum and Convenience Marketers Association
NCPGA North Carolina Propane Gas Association
NCPP North Carolina Public Power
NCSL National Conference of State Legislatures
NCSU North Carolina State University
NCUC North Carolina Utilities Commission
NG Natural Gas
NGV Natural Gas Vehicle

1-48
NEMA National Emergency Management Association
NERC North American Electric Reliability Council
NGA National Governors Association
NIMS National Incident Management System
NIST National Institute of Standards and Technology
NPPD National Protection and Programs Directorate
NRC U.S. Nuclear Regulatory Commission
NRF National Response Framework
NREL National Renewable Energy Laboratory
NSF National Science Foundation
NSTISSP National Information Assurance Acquisition Policy for National Security Systems
OE Office of Electric Delivery and Energy Reliability, U.S Department of Energy
OMB Office of Management and Budget
OMS Outage Management System
PADD Petroleum Administration for Defense District
PC Pulverized Coal
PCII Protected Critical Infrastructure Information
PCIIMS Protected Critical Infrastructure Information Management System
PDP Petroleum Displacement Plan
PEV Plug-in Electric Vehicles
PH Pumped Hydroelectric
PHEV Plug-In Hybrid Electric Vehicle
PHMSA Pipeline and Hazardous Materials Safety Administration
PIO Public Information Officer
PJM Pennsylvania-New Jersey-Maryland Interconnection (electric grid)
PLC Power Line Carrier

1-49
PNGC Piedmont Natural Gas Company
PSA Public Service Announcement
PSNC Public Service Company of North Carolina
PTC Production Tax Credits
PURPA Public Utility Regulatory Policies Act
PV Photovoltaic
PWC Public Works Commission in Fayetteville, NC
PWR Pressurized Water (Nuclear) Reactor
RCC Regional Coordination Center
RECS Residential Energy Consumption Survey
REPS Renewable and Energy Efficiency Portfolio Standard
RF Radio Frequency
RFG Reformulated Gasoline
ROI Return on Investment
RTO Regional Transmission Operator
RTP Research Triangle Park
RVP Reid Vapor Pressure (gasoline)
SCADA Supervisory Control and Data Acquisition System
SCANA Corporate name of South Carolina energy company
SCO State Coordinating Officer
SEO State Energy Office
SEOC State Emergency Operations Center
SEP State Energy Program
SERC Southern Electric Reliability Council
SERT State Emergency Response Team
SGIP Smart Grid Interoperability Panel

1-50
SHP State Highway Patrol
SMES Superconducting Magnetic Energy Storage
SPR Strategic Petroleum Reserve
SVA Security Vulnerability Assessments
TLA Traditional Lead Acid Battery
TSA Transportation Security Administration
TVA Tennessee Valley Authority
ULSD Ultra-Low-Sulfur Diesel
UNCC University of North Carolina at Charlotte
USACE United States Army Corps of Engineers
US-CERT United States Computer Emergency Readiness Team
USCG United States Coast Guard
USDOE United States Department of Energy
USDOT United States Department of Transportation
VMT Vehicle Miles Travelled
VRB Vanadium Redox Battery
WAN Wide Area Network
ZnBr Zinc-Bromide

i
Volume 2 - Energy Vulnerabilities and Disruption Levels Volume 2 - Energy Vulnerabilities and Disruption Levels ..........................................................i Table of Contents ............................................................................................................................i
Table of Figures ..............................................................................................................................i
Table of Tables ........................................................................................................................... ... ii
2.1 Energy Vulnerability........................................................................................................... 2-1
2.1.1 Geography ................................................................................................................. 2-1
2.1.2 Weather ..................................................................................................................... 2-2
2.1.3 Electricity ................................................................................................................... 2-4
2.1.4 Natural Gas ................................................................................................................ 2-6
2.1.5 Renewable Energy ..................................................................................................... 2-7
2.1.6 Petroleum................................................................................................................... 2-7
2.2 Phases of Energy Emergency ......................................................................................... 2-13
2.2.1 Phase I - Monitor and Alert ........................................................................................2-14
2.2.2 Phase II - Assess and Determine ..............................................................................2-15
2.2.3 Phase III - Action and Feedback ...............................................................................2-20
2.2.4 Phase IV - Recovery and Lessons Learned ..............................................................2-21
2.3 Types of Energy Shortage ............................................................................................... 2-21
2.3.1 Electricity ..................................................................................................................2-21
2.3.2 Natural Gas ...............................................................................................................2-22
2.3.3 Petroleum..................................................................................................................2-23
2.3.4 Energy Disruption Impacts ........................................................................................2-23
2.3.5 Restoration Priorities .................................................................................................2-25
Bibliography ..............................................................................................................................2-29
Table of Figures
Figure 2- 1 Causes of electrical disruptions ................................................................................ 2-5 Figure 2- 2 Petroleum Supply Overview ..................................................................................... 2-8 Figure 2- 3 Sequence of flow through pipeline ........................................................................... 2-9 Figure 2- 4 Monitor and Alert Phases ........................................................................................2-14 Figure 2- 5 Phase 1: Monitor and Alert ......................................................................................2-15 Figure 2- 6 Phase 2: Assess and Determine .............................................................................2-16

ii
Figure 2- 7 Action and Feedback ..............................................................................................2-20 Figure 2- 8 Restoration Diagram ...............................................................................................2-27
Table of Tables
Table 2-1 Mild Shortage ............................................................................................................2-17 Table 2-2 Moderate Shortage ...................................................................................................2-18 Table 2-3 Severe Shortage .......................................................................................................2-19

2-1
2 Energy Vulnerabilities
2.1 Energy Vulnerability
The assessment of U.S. energy infrastructure vulnerabilities and risks is complex and continuous. In recognition of its many different stakeholders and systems, the DOE's Office of Electricity Delivery and Energy Reliability (OE) has developed a State and Regional Energy Risk Assessment. This collaborative effort with OE, the National Association of State Energy Officials (NASEO), the National Association of Regulatory Utility Commissioners (NARUC), the National Conference of State Legislatures (NCSL), and the National Governors Association (NGA) is intended to help states better understand energy infrastructure risks and vulnerabilities. Improved energy risk assessment and awareness information for the east coast region and North Carolina (NC) is available in the OE Assessment.
The unique geography of NC contributes to a variety of weather-based effects on the State’s energy infrastructure. Since each energy resource has its own vulnerabilities, the State is vulnerable to a variety of energy disruptions. It is important to discuss the weather events that may affect NC’s energy infrastructure as well as the vulnerabilities associated with the energy sources.
2.1.1 Geography
North Carolina is comprised of three geographical regions – the Mountains, Piedmont, and Coastal Plain, for a total area of 53,819 square miles. Each region has unique energy requirements and vulnerabilities that require comprehensive plans to mitigate any disruption or reduction of the State’s energy supply.
The Appalachian Mountain range in NC consists of the Great Smoky Mountains and the Blue Ridge Mountains. The highest peak is Mount Mitchell, which reaches 6,684 feet above mean sea level (MSL). Valleys in this region drop to an estimated elevation of 1,000 feet above MSL. NC’s mountain ranges share borders with Virginia to the north, Tennessee to the west, and Georgia and South Carolina to the south. The mountain region is known for its tourism and farming activities, as well as manufacturing and technology entities.
The downward sloping geography of the Piedmont region transitions from the foot of the mountain region to the middle and upper Coastal Plain. The Piedmont region accounts for at least one-third of NC’s landmass. It also contains the five most populous metropolitan areas in the state: Charlotte, Greensboro, Raleigh, Durham, and Winston-Salem. The region supports a diverse range of agricultural, manufacturing, research and technology, and government activities. The Coastal Plain can be subdivided into the middle, upper and tidewater Coastal Plains. The Coastal Plain consists of the shoreline, barrier islands, and approximately one-half of the state’s landmass. The region is home to several military installations

2-2
and supports significant tourism and agricultural activities. The Outer Banks of the Tidewater Coastal Plain are predominantly known for tourism and fishing industries.
2.1.2 Weather
Severe weather causes the majority of NC’s disruptive energy events. NC’s energy infrastructure is vulnerable to the effects of hurricanes, tropical storms, winter ice storms, and other natural hazards. Historically, NC experiences the secondhand effects of hurricanes and tropical storms through high winds, tornadoes, flooding, and mud/rock slides. Hurricane Arthur (2014) produced 100 mph winds on the Outer Banks, Tropical Storms Hermine (2016) and Julia (2016) brought high winds, power outages and up to a foot of rain to parts of the State, and Hurricanes Matthew (2017), Florence (2018), and Michael (2018) flooded a majority of southeastern NC including portions of the I-95 corridor. Hurricanes Arthur and Maria affected the coastal region with high winds and flooding. Thousands of residents can be left without electricity for several days when major storms impact the state. Flooding from hurricanes renders roadways impassable, which precludes the transportation of supplies or repair crews. Reduced mobility negatively affects the restoration of electricity and fuel delivery for business, government and consumer use.
Winter storms adversely affect NC. High winds, extreme cold, and freezing rain result in electrical disruptions caused by trees falling on power lines. Winter outages are prolonged by icy road conditions that prevent repair workers from reaching damaged equipment. The extreme cold increases demand for electricity, heating oil, propane, and natural gas, which then puts upward pressure on energy rates.
The summer season presents the greatest opportunity for rainfall and July historically experiences the most amount of rain. Fall is the driest season with November historically being the driest month.
A brief discussion of weather-related hazards and electronic links to other sources of information are provided in the following paragraphs.
• Tornadoes often produce disruptive energy events by damaging power lines andother infrastructure. According to the State Climate Office, tornadoes areresponsible for millions of dollars’ worth of property damage each year in NC,affecting every part of the state. They are more frequent in the southeastern andsouth-central regions, but most of the intense tornadoes occur in central NC. Formore information on tornadoes, please consult the State Climate Office of NorthCarolina. A detailed risk analysis of NC’s tornado vulnerability can be found onthe North Carolina Department of Public Safety website.
• Hurricanes usually spin up and strike between June and November during thehurricane season. NC has experienced several strong hurricanes in past yearsthat produced severe damage to the State’s infrastructure. Hurricanes presentthe greatest risk to eastern NC, but large storms can produce wind and flooding

2-3
damage in the central and western regions. For more information on hurricanes, please consult the State Climate Office of NC. A detailed risk analysis of NC’s hurricane vulnerability can be found on the North Carolina Department of Public Safety website.
• Thunderstorms are common in NC. The State Climate Office of NC estimatesthat the State experiences at least 40 to 50 days of thunderstorms each year.Thunderstorms bring strong winds and lightning strikes, both of which havehistorically disrupted electrical service. For more information on thunderstorms,please consult the State Climate Office of NC. A detailed risk analysis of NC’sthunderstorm vulnerability can be found on the North Carolina Department ofPublic Safety website.
• Lightning strikes are a common occurrence in NC and can negatively affectenergy infrastructure. In 2010, the National Weather Service reported thatlightning strikes the State approximately 500,000 times annually. The centralregions of the State experience an average of 9 to 12 strikes per square mile(National Weather Service, 2011). Thirty percent of power outages are related tolightning. Furthermore, 16 out of 20 accidents involving petroleum productstorage tanks were caused by lightning strikes, according to the NationalLightning Safety Institute.
• Winter storms can adversely affect the State’s energy systems. Winter stormsoften bring snow, sleet, freezing rain, or a wintry mix which can cause powerlines to fail and prevent the movement of fuels on the roadways. For moreinformation on winter storms, please consult the State Climate Office of NorthCarolina.
• Drought conditions adversely affect energy infrastructure. Electric generationneeds an ample supply of water for use in hydroelectric and steam generation,as well as for cooling at nuclear facilities. For more information on drought,please consult the State Climate Office of North Carolina.
• Wildfires can affect energy infrastructure by damaging distribution and generationinfrastructure. A detailed risk analysis of North Carolina’s wildfire vulnerability canbe found on the North Carolina Department of Public Safety website.
• Earthquakes - a detailed risk analysis of North Carolina’s earthquake vulnerabilitycan be found on the North Carolina Department of Public Safety website.
• Extreme temperatures, measured in terms of either heating-degree days orcooling-degree days, can impact the delivery of electricity. High heating orcooling days are associated with higher energy demands, which increases thepotential for power disruptions.

2-4
• Electromagnetic disturbances or space weather can be categorized asgeomagnetic storms, solar radiation storms, radio blackouts, or electromagneticpulses (EMP). These types of events can cause disruptions to the electric grid byinterfering with transmission systems, transformers, and discrete componentoperations. In some cases, high frequency communications can also be affected,resulting in the degradation of communications that monitor energy transmissionsystems in the electric, natural gas, and petroleum pipeline systems.
• Other hazards, that may not be directly related to weather, could includesabotage/deliberate human attacks, cyber–attacks, human error andinfrastructure failures such as the 2016 Colonial Pipeline breach.
2.1.3 Electricity
Electricity is a fundamental part of NC’s energy profile. According to the NCUC, there are 3 IOUs, 2 municipal power agencies, 32 electric membership cooperatives and 76 municipally-owned electric utilities interconnected within the existing electric infrastructure. A high-voltage electric transmission grid/system allows electric power to be directed both into and out of the State, while a complex distribution system transmits electricity within the State.
Since electricity accounts for most of all commercial, industrial, and residential sector energy consumption, any electricity supply disruptions can have immediate and significant economic impacts. Without electricity, consumers are unable to make credit or debit card purchases, manufacturers cannot produce goods, financial services cannot complete transactions, and some government services may cease to operate. Electrical disruption could also impact the transportation sector by rendering fuel pumps inoperable or, if severe enough, by stopping the interstate pipeline’s petroleum flow.
The U.S. Energy Information Administration reported NC’s 2017 electric generation mix as: coal (25%); natural gas (32%); nuclear energy (34%); and renewable resources (8%). NC imports virtually all of its electrical generation fuel, making transportation a critical dependency. Prolonged severe weather events could constrain delivery of fuel to generation facilities. It should be noted that in accordance with the NCUC, utility providers are required to maintain an adequate supply of the appropriate fuel source. After electricity is generated, it is transmitted and distributed on what is commonly referred to as the grid. An adequate supply of electricity is necessary, especially during the summer months when increased consumer demand for climate control may outstrip generation capacity.

2-5
2.1.3.1 Disruptive Events
Severe weather causes one-third of electric disruptions. The remaining two-thirds of disruptions are caused by vehicle accidents, faulty equipment/human error, animals contacting transmission/distribution lines, maintenance, and unknown causes. Figure 2-1 illustrates national electrical disruptions causes.
Figure 2- 1 Causes of electrical disruptions
2.1.3.2 Market Forces
Since nearly all of the fuels used to generate electricity do not originate in North Carolina, the State depends on the delivery of coal, natural gas, petroleum products, and nuclear fuel for most of its generation. In 2017, approximately 25% of the electricity consumed in NC was produced by a coal-burning generator. Over the past five years, electricity generated from coal-fired power plants has been cut in half, while natural gas generation has nearly doubled. This turnaround has been influenced by the retirement of nearly 30 coal-fired units since 2011 and falling natural gas prices. 2.1.3.3 Nuclear Generation
North Carolina’s nuclear generation capacity exceeds that of many other states and accounted for approximately 34% of the State’s 2017 total electric generation. Nuclear power provides a major portion of the integrated electric system’s base-load generation. Disruption of nuclear generation would require deploying other more costly facilities and source fuels, increasing electric rates, and potentially causing electricity shortages.
REPORTED ELECTRICAL DISRUPTION CAUSES IN 2016
Animal (4%) Faulty Equipment/Human Error (24%)
Planned Outage (5%) Unknown (21%)
Vehicle Accident (12%) Weather/Trees (33%)
Overdemand (.0007%) Theft/Vandalism (.003%)

2-6
There are three nuclear generating sites in North Carolina, operating a total of five generators. These facilities are located across the State, making it unlikely that one event would disrupt operations at all three sites. Each site produces a significant amount of energy, however, so a disruption at even one facility could affect consumers. Although the nuclear power industry has robust disaster management programs and emergency operations plans, some hazards could still disrupt their operation.
Severe drought conditions could disrupt nuclear power generation if reservoir levels drop too low or water temperatures rise above predetermined limits. If water supplies are inadequate for cooling and steam generation, the IOU may initiate a shutdown of the affected facilities. If a shut down or reduction of operations is required, it will be done in accordance with established protocols and involve notification to the appropriate authorities. The reduction in generation may cause other generators to increase their output or cause the IOU to purchase energy from other sources.
If a natural disaster (severe weather) or other event causes the shutdown of a nuclear generation facility, FEMA and the Nuclear Regulatory Commission will conduct a disaster-initiated review to determine the presence or extent of any damage and whether or not operations can safely be restored. The nuclear facility will be shut down while this review is conducted, potentially leaving it out of service for a prolonged period. The reduction in generation may require other facilities to increase their output or cause the IOU to purchase energy from other sources.
2.1.4 Natural Gas
Natural gas is increasingly used for electricity generation; therefore, a disruption in the delivery of natural gas could trigger cascading effects on the electrical supply. In 2017, natural gas accounted for approximately 32% of electricity generated annually in NC. It is used for both traditional and peak demand generation. Peak demands can occur during the high cooling degree-days of mid-summer and during the high heating degree-days of late fall and winter as temperatures drop. A disruption in either peak period could result in electricity shortages.
Natural gas is used across multiple sectors of the economy. NC’s natural gas consumption in 2017 was split among the following end uses: electrical power generation (57%); industrial sector (21%); residential sector (21%); and commercial sector (10%). A natural gas supply disruption could produce significant economic damage affecting suppliers and consumers.
The increasing natural gas production from U.S. fracking wells has reduced pipeline imports from Canada and increased the exportation of more natural gas. As a result, the U.S. has now become a net natural gas exporter for the first time since 1957.
2.1.4.1 Distribution Network
Two interstate pipelines serve North Carolina’s natural gas infrastructure: The Columbia Gas Transmission Company pipeline and the Williams Transcontinental Gas Pipe Line Corporation (Transco). The State is dependent on these pipelines for its supply of

2-7
natural gas. Pressurized gas is transferred through these two pipelines and several spur lines to local distribution companies. Depending on severity and cause, a loss of pressure on the pipeline can reduce or sever the supply of natural gas. The pipeline operators and the local distribution companies keep close watch on the pipeline and amount of demand drawn from the pipeline.
2.1.4.2 Aging Infrastructure
To date, NC has not experienced a major disruption in natural gas infrastructure. However, other states have experienced significant disruptions affecting the delivery of natural gas. The delivery of natural gas is susceptible to several hazards. There is a potential for failure of the pipeline infrastructure itself, as was evidenced by a transmission pipeline explosion in San Bruno, California. Delivery can also be affected by environmental factors such as wildfire and severe weather anywhere from the point of extraction to final delivery. As NC increases its demand for natural gas, and as the demand elsewhere increases, so too does the vulnerability associated with the resource.
2.1.4.3 Extraction
An examination of supply issues indicates that the industry is able to extract enough natural gas to support ongoing demand. Natural gas exploration has identified gas trapped within shale formations in the central part of the State. The gas in these formations has not been quantified, and no gas is currently being produced. There are additional proven and unproven natural gas reserves in other states.
2.1.5 Renewable Energy
Renewable energy generation depends on sources such as solar radiation, wind velocity, or the flow of a volume of water. Renewable energy is a growing segment of the State’s electricity generation portfolio. In 2017, the EIA reported that NC’s net generation from renewable sources was estimated at 8%. NC’s renewable generators include conventional hydroelectric, biomass (wood/wood waste), and municipal solid waste/landfill gas. Solar and wind generation are becoming more popular sources of renewable generation. Some renewable energy sources are vulnerable to environmental changes in environmental conditions such as cloud cover, intermittent wind, time of day, rain, or drought.
2.1.6 Petroleum
The Colonial and Plantation pipelines (liquid petroleum) and the Dixie pipeline (propane) serve NC’s petroleum markets. These pipelines, originating in Texas and Louisiana, transport fuels through several states before reaching NC. NC’s petroleum supply is vulnerable to disruption anywhere along this supply chain, and to any severe Gulf of Mexico weather/hurricane events that could significantly impact the pipelines. One such event occurred in 2016, when a breach in the Colonial Pipeline reduced NC’s motor fuel supply. The Port of Wilmington terminal operations alone are not able to serve the

2-8
consumption of the State. Local pipeline and terminal operators maintain a watchful eye on upstream pipeline and terminal operations, monitoring for potential impacts on markets here.
Figure 2- 2 Petroleum Supply Overview
2.1.6.1 Distribution Network
The primary vulnerabilities of the petroleum sector are in transportation and delivery. Petroleum pipelines, in general, can transport either crude or refined products. Since there are no crude oil pipelines or refineries in North Carolina, this discussion will be focused on finished petroleum products. Two interstate pipelines transport finished petroleum products approximately 1,000 miles from refineries in Louisiana and Texas to terminals in Charlotte, Greensboro, and Selma. After refined products such as gasoline, home heating oil, jet fuel, diesel, and lubricants are delivered to a terminal, they can be stored or loaded onto transfer trucks for delivery to retail locations.
There are several agencies that regulate pipelines. U.S. Department of Transportation (U.S. DOT) and the Pipeline and Hazardous Materials Safety Administration (PHMSA) regulate the safety and reliability of the pipelines. The Federal Energy Regulatory Commission (FERC) ensures that each oil company has equal access to space on the pipeline and that the rates charged by the pipeline owners are reasonable. Intrastate pipeline rates are regulated by their respective state public utility commissions. Trucks and drivers must meet requirements set by local terminals and state and county officials, including insurance requirements, safety issues, and load requirements.

2-9
The major petroleum pipelines range in diameter from 8 inches to 48 inches, narrowing inside to maintain pressure as product is diverted to feed markets along their paths. Finished product travels through the pipelines at approximately 3 to 8 miles per hour. Travel speed varies based on factors such as the viscosity of the product, terrain, and volume. On average, it takes approximately 10 to 14 days to move product from Houston, Texas to Greensboro, NC. The pipeline relies on electricity to operate the pumps that move products.
Pipelines are “common carriers,” as defined by the Interstate Commerce Act. As common carriers, pipelines provide transportation services to petroleum refineries and other companies that own the products that are shipped. The pipeline has control over the logistics of transporting the product (i.e. temporary storage, routing, and estimated delivery), much like UPS or FedEx for conventional packages.
The various petroleum companies contract space on the pipeline. Petroleum products travel in “packages.” Each “package” is a discrete product destined for a particular terminal and retailer. As with UPS, it is not acceptable to stop the UPS delivery person and “hijack” the packages destined for our neighbor’s house, nor is it acceptable to show up at the distribution center and ask for your package without first arranging to take delivery. Out-of-state tankers cannot just arrive at a terminal and load fuel. This is why an area can experience a petroleum shortage even though there is product sitting in local terminals waiting for transport further down the pipeline.
The refinery loads product “packages” into the pipeline, and at times two dissimilar products (diesel and gas) travel next to each other as seen in Figure 2-3. There is always a certain amount of intermixing between the first product and the second at the interface, the point where they meet. If the products are similar, such as two grades of gasoline, the resulting mixture is added to the lower value product. If the products are dissimilar, such as diesel and gasoline, the "transmix," a hybrid product created by intermixing at the interface, must be channeled to a separate storage and reprocessed. This reprocessing typically happens at the terminal.
Figure 2- 3 Sequence of flow through pipeline

2-10
2.1.6.2 Propane Distribution
Propane delivery is similar to that of petroleum products. Propane is delivered to NC via the Dixie Pipeline at its terminal facility in Apex. Local distribution companies then transport the propane throughout the region with tanker trucks and other ground transportation methods. Many of the same authorities that regulate petroleum transportation govern propane transportation.
2.1.6.3 Severe Weather’s Effects on Petroleum Delivery
The weather events that have the most impact on NC’s petroleum system are those that affect supply sources in and around the Gulf of Mexico. The Gulf Coast is home to the bulk of U.S. refining capacity and is the origin of the pipelines that serve NC. If a hurricane is expected to impact the Gulf of Mexico, it may initiate a chain of events that result in a petroleum disruption. This is especially true if the storm is expected to affect the region where refineries and offshore drilling operations are located.
Up to one week prior to the anticipated landfall of a hurricane, refinery production and port receipt of imports are reduced or shut down. When a hurricane is expected to impact the petroleum production region, refinery and terminal operators may wish to fill storage tanks to a certain level as a precaution against tank movement from storm surge or flooding. This precautionary measure prevents the pipelines/refineries/terminals from moving a significant amount of existing stored product into the marketplace. If the storage tanks must achieve a certain volume for self-protection, producers may have to further reduce the amount of product released into the market.
Consumers tend to purchase additional fuel to top off tanks in anticipation of future price increases, which in turn elevates demand. When consumers rush to the pump to fill up, as some emergency procedures encourage them to do, the consumer, as well as governmental agencies, may be doing so from an already diminished supply system. Increasing demand pressure on constrained supplies can produce shortages, where prices rise until they reach a new equilibrium. Speculative market activity may produce additional upward pressure on price as investors see opportunities for profit. The result may be that fuel is no longer available at prices consumers are willing or able to pay.
When supplies are limited, pipeline systems may slow their deliveries and impose an allocation on customers. The allocation becomes a compounding factor when the diminished supply meets with increased demand from an apprehensive or panicked population. When terminals are on allocation, only petroleum wholesalers under existing contracts may receive product. This is a concern, as North Carolina has a large population of non-contract wholesalers, especially in the western region of the State. Non-contract wholesalers purchase fuel on the spot market, where market forces may dramatically drive up price. Consumers will see this manifest as an increase in pump prices. If non-contracted wholesalers are unable to obtain fuel, they may appeal to a variety of sources for assistance including the media, government officials, and the SEO.

2-11
Hurricanes often strike in mid-September when gasoline supplies are turning over from summer grades to winter grades. At this time of year, refinery, pipeline, and terminal operators begin to reduce their lower volatility grades and begin building up winter-grade stocks. This transition may complicate the ability to maintain a steady supply of gasoline during a fall storm event. As a result, refiners and terminal operators cannot always assist each other with supplies without special waivers from the U.S. EPA and/or State agencies. If there is a shortage of fuel that meets blend requirements and waivers cannot be obtained, the shortage will drive up prices and require interagency coordination to obtain RVP waivers to maintain sufficient fuel supplies through the crisis.
Severe Gulf of Mexico weather events such as hurricanes can affect petroleum operations and supporting infrastructure. Gulf Coast region electricity outages can create/extend refinery shut downs or prevent introduction of petroleum into the pipeline.
2.1.6.4 Market Forces
Gasoline and diesel are two products of refining crude oil. Crude oil is obtained from international and domestic sources and is vulnerable to disruption by geopolitical events. Crude oil is a fungible product, meaning that a barrel of crude oil from Russia may substitute for a barrel of crude oil from Canada with little difference in quality. The global crude oil market trades efficiently because of this fungibility, matching supply and demand through substitution of identical types of oil. Real or perceived reductions in supply can dramatically affect the price of crude oil, and thereby the price of gasoline, diesel, jet fuel, and other petroleum-based products. For example, if one nation’s oil production suddenly decreased, a second oil producing country could increase their production to fill the deficit. However, market uncertainty about the ongoing availability and reliability of the first nation’s oil reserves could push up the price of crude oil. If demand remains the same and supply comes into question, producers can charge a premium for their product.
In 2017, net imports of crude and petroleum products to the U.S. averaged about 3.73 million barrels per day. Projections by the EIA suggest that under three scenarios, the U.S. will become a net exporter of petroleum, including the reference case that projects this may occur around the year 2030. The risk of the loss of petroleum imports is less today than it was when the U.S. imported over half of its daily needs. The greater risk today is the potential loss of refining and pipeline operations due to hurricanes, earthquakes, and other large-scale events such as a cyber-attack. Long term power outages that affect refining centers, such as those on the Gulf Coast, could result in a serious petroleum product shortage.
There are no refineries located in NC, but refinery shut downs/slowdowns in other states or a reduction in crude oil supplies would adversely affect the flow of petroleum into the State. The interdependent nature of petroleum’s long supply chain creates vulnerability for net-importing states like NC. For example, when 2017’s Hurricane Harvey shut down several major refineries in Texas and Louisiana, NC’s reduced

2-12
petroleum supply from the Colonial Pipeline created supply issues for both suppliers and consumers.
The majority of the fuel NC’s resellers and state contractors receive is contracted for in advance. There are options for non-contract resellers to purchase product. The difference between contract and non-contract are:
Contract: having a contract with a major oil company for fuel. Their supplier and contract dictate from where their supply will come. While the price for contracted fuel may cost more, it does come with the guarantee that when product becomes available, the reseller is guaranteed resupply in accordance with the contract.
Non-Contract usually refers to independent distributors who do not have contracts for their fuel supply and instead purchase fuel on the spot market. While this has the potential to provide lower prices for consumers, it comes with the risk that in times of petroleum shortages, the non-contracted reseller may not be able to secure adequate supplies.
There is some potential to buy on the spot for product that has not been promised to resellers or that resellers are willing to part with for a premium. The Energy Information Administration defines the spot market as, “the price for a one-time open market transaction for immediate delivery of a specific quantity of product at a specific location where the commodity is purchased ‘on the spot’ at current market rates.”
Purchasing fuel on the spot market can be profitable, as it is often cheaper than the prices paid for fuel on contracts with major oil companies. Resellers can then attract customers by setting prices below their contracted competition or sell at the same price and keep a larger margin. Resellers who rely on spot purchases risk being unable to obtain product when there is a reduction in supply. This is because oil suppliers are obligated to service their contracts, and may not have any remaining product to sell on a spot basis. Areas served predominately by resellers relying on the spot market are at additional risk of fuel shortages, as their retailers may be unable to obtain affordable resupply while contract resellers receive at least partial resupply.
2.1.6.5 Management Decision Process
The decision-making process is heavily dependent upon the availability of data. Leadership decisions are more likely to be flawed when they are made without the benefit of accurate and timely information. Sub-optimal decisions can adversely affect the economy and the people of North Carolina. The following discussion identifies who makes decisions pertaining to energy shortages and provides a framework for determining the relative severity of a shortage in any particular fuel or energy source. The SEO provides information to the Energy Policy Council, which ultimately informs the Governor.
Energy disruptions can lead to shortages and energy crises. According to NC General Statue §113B-20(a), “an energy crisis exists when the health, welfare, or safety of the

2-13
citizens of North Carolina are threatened by reason of an actual or impending acute shortage in usable, necessary energy resources.” One of the goals of an energy assurance program is to recognize and address disruptions and shortages promptly, when there is the greatest opportunity to prevent it from developing into a crisis.
NC General Statute §1 13B-20(b) authorizes the governor to declare an energy emergency, or an energy crisis “upon a finding that the conditions stated in subsection (a) do exist…” (1975, c. 877, s. 4.)
NC General Statute §113B-22 directs the Governor, upon declaration of an energy crisis, to submit emergency orders, rules, and regulations that are deemed necessary to alleviate the crisis to the Legislative Committee on Energy Crisis Management for review.
NC General Statute §113B-23 identifies the Energy Policy Council as the emergency energy coordinating body for the State. The Energy Policy Council is directed to: identify and determine the nature and severity of expected energy shortages; communicate with and gather information from energy producers; distributors, and consumers; and to make continuing assessments of the situation and prudent recommendations to the Governor and Legislative Committee. The SEO serves as staff to the Energy Policy Council. The Energy Assurance Program Manager, with assistance from Energy Assurance Planner, and the Smart Grid Specialist make up other SEO Team members, supports the SEO’s response to energy disruptions in our State.
2.2 Phases of Energy Emergency
The Energy Assurance Plan defines the four phases of energy emergencies: Phase I-Monitor and Alert, Phase II- Assess and Determine Action, Phase III- Action and Feedback, and Phase IV- Recovery and Lessons Learned. The phases are intended to serve as a guide to assist in the decision-making process once a shortage or crisis has occurred.
The SEO Energy Assurance (EA) Team will provide daily communications and data updates pertaining to the energy shortage to the SEO Director. The EA Team will consult numerous sources and contact several organizations to ascertain and validate the severity of the disruption. Specifically, the SEO will identify the source of supply, mode of transport, amount of supply, and the problem associated with the distribution of the commodity. Additionally, the SEO will determine what is being done to resolve the shortage and work closely with State emergency managers to provide the public with accurate and timely information.
The EA Team will communicate recommended actions designed to alleviate the disruption to the SEO Director, or if the situation requires SERT activation, to appropriate personnel in the Infrastructure/Operations Cell. Figure 2-4 is a visual representation of the four phases of an energy emergency.

2-14
Phase 3 “Action and Feedback”Phase 2 “Assess and Determine”
News Feeds Retail ActivityDistributionTransmissionSupply
Phase 1 “Monitor and Alert”
NC Dept. of Environmental
Quality
SEO
Assessment
State
Region
County
Municipal
Respond Yes
Governors Office
SERT
Weather
Option’s
Phase 4“Recovery”
Problem
Energy Policy
Council
Legislative Council
Success
No,Go to Phase 1Yes
YesNo Recovery Actions
No,Go to Phase 1
Figure 2- 4 Monitor and Alert Phases
2.2.1 Phase I - Monitor and Alert
The State Energy Office (SEO) is responsible for monitoring and reporting energy conditions. The SEO provides accurate and timely situational awareness of the energy infrastructure and supply that affects the State. The SEO has documented the normal conditions for the commercial, industrial, transportation, and residential sectors’ typical energy demand. [For more information on historical demand, please view the Energy Profile chapter of this report.] Additionally, the SEO identified each sector’s vulnerability. This information is used to predict and report what effects an observed change in the supply of an energy commodity may have on each sector and the State. If there is a verified change in the normal energy parameters, the SEO will transition from the Monitor and Alert phase into the Assess and Determine “Assess and Alert” phase. Figure 2-5 shows a schematic diagram of the Monitor and Alert Phase.
• Monitor local, State, regional, national, and international energy inputs.• Identify normal activities within the sphere of energy.• Understand and plan for disruptions.• Observe and report changes within the sphere of energy commodities.

2-15
Daily Monitoring Activities
Disruption
SEO Staff Notified
Yes
No
Verified
Yes
Yes
Move to Assess and Determine
Continue Monitoring
No
Phase 1- Monitor and Alert
Figure 2- 5 Phase 1 - Monitor and Alert
During the Monitor and Alert stage, the SEO stays alert for events that could adversely affect the delivery or normal use of energy. These events could be weather-related (i.e. hurricanes, tornadoes, ice storms, drought, or flooding), geopolitical (i.e. an international crisis in a petroleum rich region) or another disaster in a region that either supplies or transfers energy (i.e. Gulf of Mexico). The SEO also monitors for shortages in other states or regions. The SEO tracks energy prices to observe changes in the pricing structure with respect to developing or existing scenarios.
2.2.2 Phase II - Assess and Determine
The SEO assesses and classifies energy disruptions after they are determined to have disrupted, or have the potential to disrupt, the normal operations of the State. The SEO will research and analyze the situation utilizing a variety of tools in order to determine the cause and the level of disruption. There are three shortage levels: mild, moderate, and severe. The assessment process will also determine which entities are or could be affected and to what extent the disruption will affect the people or commerce of North Carolina. The SEO will develop policy options for possible implementation, and make recommendations to appropriate stakeholders and government officials according to the communication plan. Figure 2-6 provides a pictorial representation of Phase II - Assess and Determine.

2-16
Classification Process
Mild
Moderate
Yes
No
Public Information
YesYes
Inform Key Stakeholders?
Continue Monitoring
No
Phase 2- Assess and Determine
Response Required?
SERT
Severe
Response Required?
Public Information Inform Key Stakeholders?
Yes Yes
No
Figure 2- 6 Phase 2 - Assess and Determine
2.2.2.1 Mild Shortage
A mild shortage involves a reduction in petroleum supplies in one or more regions that may or may not be noticeable across the entire State. Petroleum demand may increase as customers attempt to fill up prior to future price increases. A disruption may cause a reduction in petroleum imports or alter the schedules of terminals or jobbers for at least a week. There may also be a reduction of natural gas volumes in pipelines or storage facilities. Localized storm damage (causing electric outages) may hinder natural gas or petroleum delivery. This “mild” shortage could be felt for approximately two weeks.
Petroleum supplies may experience a 5%-10% reduction for a week or more and natural gas may see a 5%-10% reduction for up to two weeks. Table 2-1 below details some conditions, impacts, and media actions that may occur during a mild shortage.

2-17
Conditions (in addition to previous phase; one or more may
apply)
Probable Impacts Observed Media/Public Relations
The Department of Energy (DOE), American Petroleum Institute (API) or other sources report a decrease in the availability of product (e.g., from the Middle East, South America, and domestic refineries).
Some jobbers report supply and delivery problems or related issues (such as long queues at fuel loading racks). Deliveries extend into evenings and weekends to keep up with demand.
National news reflects events indicating that particular energy supplies will be delivered short of expected amounts. Petroleum retailers speak in terms of “being put on allocation” lower than (or equal to because under normal circumstances they draw above 100%) their contract amount. Stories about energy may be featured in the media.
Spot prices increase rapidly. National and regional oil companies (prime suppliers) put more dealers on “allocation.”
Dealers are uncertain about product availability and question information received from prime suppliers.
Media may feature reports about high prices. If spot shortages occur, media will inquire.
Natural gas supplies available to LDCs in the state are lower than normal.
Gas distribution companies may temporarily curtail interruptible contract customers according to curtailment rules approved by the NCUC.
No media reaction is likely.
Severe demand outside the state may affect the electric supply for state customers. A local generating plant has to be shut down temporarily. Electric lines may be out of service.
Electric utilities consider load management steps.
Some news reports likely.
Regional prices rise due to temporary imbalances between supply and demand. Causes may include refinery outages, transportation problems or sudden increases to tertiary (consumer level) storage and higher spot market prices.
Government assistance in removing retail driver hour limitations may be sought.
Some news reports. Some reports become feature stories.
Heating oil and propane dealers, if queried, will report concern about continuity of supply.
Dealers complain to associations.
Some news reports possible. Dealers may complain to the SEO or other agencies.
Dealers report increased pressure on their ability to deliver fuel.
Some customers call dealers to top off home storage tanks.
Some news reports, mainly feature stories, possible. Public inquiries received by agencies.
Table 2-1 Mild Shortage
During a mild energy shortage, the Energy Assurance Team will:
• Monitor energy supplies and coordinate with energy providers to determinepotential actions to reduce the impacts of the disruption.
• Inform the State Energy Office leadership team.

2-18
2.2.2.2 Moderate Shortage
A moderate shortage may involve an extended reduction in energy supplies. Petroleum supplies may be reduced by 10% to 15% for three weeks or more. There may also be a noticeable reduction (10% to 15%) in the natural gas supply nominations on interstate pipelines, which may prompt curtailments by local gas distribution companies for two weeks or more. Damage from severe storms may damage the electric transmission/distribution infrastructure, producing electricity outages and hindering the transportation of petroleum and natural gas. The table below details some of the conditions, impacts, and media/public interactions that may occur during a moderate shortage.
Conditions (in addition to previous phase; one or more may apply)
Probable Impacts Observed Media/Public Relations
Petroleum product imports to the state drop 5% from the previous year or other base period. Allocations for a growing number of petroleum retailers are reduced.
Jobbers report difficulty in obtaining or delivering enough supply to satisfy customers. Queuing at wholesale loading racks keeps drivers in line for several hours or more.
News reports about shortage appear on regional and national broadcasts. Federal and state officials are interviewed.
Local weather or storms in other regions result in problems that lead to temporary curtailment in North Carolina.
Some transportation companies add a “fuel charge” to their usual price.
The U.S. DOE, or other federal agencies, and energy companies may publicly confirm shortage.
Product prices are rising steadily. Prices for key fuels rise at a rate of 10% or more per week.
Some retail dealers have difficulty meeting contract obligations.
Energy shortage in affected area is highlighted on national news.
Natural gas supplies fall below state demand for firm customers. LDCs project inadequate storage.
In winter, many industrial and commercial interruptible gas customers are curtailed but this does not mean a natural gas shortage. However, demand increases for heating oil and propane.
News media begin to air or publish shortage stories regularly. Public asks for temperature controls for business and industry.
Demand from other countries draws product away from the U.S.
Supplies diminish as demand for heating oil increases. Prices increase significantly.
News media begin to use the words “energy crisis.”
Interstate generation capacity is strained by wide area severe weather (cold or heat).
Utilities curtail load leading to brownouts and threat of blackouts. Actions are covered in the General Load Reduction Plan (GLRP).
Media coverage likely. Public tolerates mild inconvenience. Economic impact felt. Officials ask for explanations.
Growing numbers of low-income customers have difficulty paying for fuel. Natural gas interruptions increase, thereby putting additional pressure on the heating oil and propane supply.
Requests for federal Low-Income Heating Program (LIHEAP) assistance increase and State agencies receive calls from individual households for help.
News media begin to cover energy problems several times a week. Low-income advocates demand help. Volunteer programs accelerate.
Table 2-2 Moderate Shortage
During a moderate energy shortage, the Energy Assurance Team will:
• Continue all monitoring and determination actions.• Coordinate with energy providers to classify energy disruption’s magnitude and
expected duration.• Coordinate with energy providers to determine appropriate voluntary
interventions.

2-19
• Provide updates to the State Energy Office leadership team, as appropriate.• Alert NCEM and coordinate with SERT, if activated.
2.2.2.3 Severe Shortage
A severe shortage is an acute reduction in energy supplies (15% or more) which may last for one month or more. The volumes of petroleum or natural gas products pushed via pipeline may be reduced. Pipelines may be inoperable due to lack of electricity or logistical support. Natural gas nominations may fall more than 20% due to weather, interstate pipeline failure, or production problems. Severe damage to the electrical grid may produce outages lasting several weeks. Table 2-3 details some of the conditions, impacts, and media/public interactions that may occur during a severe shortage.
Conditions (in addition to previous phase; one or more may
apply)
Probable Impacts Observed Media/Public Relations
Regional and state fuel dislocation is brought on by Hurricane-scale storms; extended, widespread, winter cold; embargo or terrorist acts.
In peak driving seasons, gasoline stations curtail operating hours and motorists form lines to purchase available fuel regardless of price.
Government may be criticized for not acting quickly enough.
Prices do not level off but continue to rise.
During winter months, noncontract customers have serious difficulty locating heating oil even if they can afford it.
Fuel issues are reported regularly by the media, and rumors are abundant.
Local product storage is extremely low or exhausted.
Petroleum fuel hoarding is observed.
Regulated energy company officials are called upon to explain the shortage.
Dealers are on less than 75% allocation and have difficulty maintaining contract delivery.
Suppliers sharply reduce allocations to dealers and dealers cannot manage customer inquiries.
Some consumption is reduced as users turn to alternatives or go without.
Shortages are regional and possibly broader.
Government agencies are called upon to provide relief.
The public is willing to tolerate intervention such as odd/even gasoline purchase days and will respond to calls for voluntary conservation such as carpooling or reliance on mass transit.
Firm gas contract supplies fall below 80% of normal.
Industrial customers face ongoing higher fuel cost. Commercial customers are asked to curtail hours. Some residential customers are displaced from homes in cold weather.
Economic impact noted. Media attention likely. Public will demand mandatory temperature control measures for commercial and government facilities. Energy company officials questioned by public authorities.
Long term power problems due to fuel prices or lack of fuel, weather or infrastructure failure.
Rolling brown and blackouts occur. Media attention constant. Economic impact noted.
Low-income families require significant assistance to obtain fuel.
Economic dislocation occurs. The danger to vulnerable citizens is featured in the media.
Table 2-3 Severe Shortage
During a severe energy shortage, the Energy Assurance Team will: • Continue all monitoring and determination actions.• Coordinate with energy providers to classify the energy disruption’s
magnitude and expected duration.

2-20
• Coordinate with energy providers to determine appropriate mandatoryinterventions.
• Provide updates to the State Energy Office leadership team, as appropriate.• Alert NCEM and coordinate with SERT, if activated.
2.2.3 Phase III - Action and Feedback
Planners must be aware of energy interdependencies and how shortages in one energy sector can produce cascading effects in others. The combination of these factors may affect daily traffic patterns, operation of public safety services, water and sewer operations, or financial operations. Petroleum shortages may cause widespread panic as people are unable to secure fuel at a price they are willing to pay, or where retailers are unable to pump fuel due to electrical outage. Natural gas disruptions can have similar effects on consumers as the commodity is widely used for climate control, cooking, electric generation, and industrial operations. Policy options will be evaluated and recommended for implementation once an energy disruption has been identified, verified, and categorized. Once a policy option is implemented, it must be monitored to evaluate its effectiveness. The SEO will communicate with appropriate stakeholders to ascertain the performance of implemented policies and to collect feedback and recommendations for corrective action. Figure 2-7 provides a pictorial representation of Phase III - Action and Feedback process.
Mandatory Measures
No
Yes
Governor’s Office
No
Phase 3- Action and Feedback
Success
Enforcement Actions
Voluntary Actions?
Yes No
Energy Policy Council/SEO
Legislative Committee
Success
Declare Crisis?
ImplementMandatory
Actions
Identify Nature of Disruption
Identify Severity of Disruption
Continue to Assess Situation
Recommend Action
Mild
Moderate
Severe
ImplementVoluntary Actions
No
Yes
Yes
Yes
Enforcement Actions
Yes
No
Success
TerminateAnd
Recover
TerminateAnd
Recover
TerminateAnd
Recover
Yes
Yes
Monitor
Yes
SuccessRe-Evaluate
No
SERT/SEO
Figure 2- 7 Action and Feedback

2-21
2.2.4 Phase IV - Recovery and Lessons Learned
The SEO will contact all relevant stakeholders to survey and evaluate the emergency response of each stakeholder in an after-action report. Some items of interest will include, but are not limited to, solution effectiveness, timely implementation of the solution, and recommendations to improve response efficiency and effectiveness. The aggregated results will be vetted by the SEO and the relevant information may be incorporated into the Energy Assurance Plan.
2.3 Types of Energy Shortage 2.3.1 Electricity
In North Carolina, each electricity retailer is responsible for the generation, transmission, and distribution of power to its customers. The operator of the particular energy commodity is responsible for the management and restoration of the resource. Each IOU files a restoration plan with NCUC. Municipal power providers are an exception to the NCUC filing requirement. Municipal power providers are responsible to their governmental owners (North Carolina Utilities Commission).
2.3.1.1 Planned Outages
Electricity supplies may fail to meet demand due to planned or unplanned outages. Planned outages sometimes occur due to routine maintenance and upgrades of transmission or distribution equipment such as lines, poles, or transformers. The duration of planned outages generally ranges from a few minutes to several hours. Traditionally, advance notice is provided to utility customers and the outages occur in accordance with the rules and regulations of the NCUC. If conditions are such that the supply of electricity is in jeopardy, the provider may institute curtailment measures. Providers must submit curtailment plans to the NCUC for approval. If an electricity provider implements load-shedding procedures to offset a power deficiency, the utility must comply with the rules and regulations of the NCUC, Chapter 8, Electric Power and Light, Article 7, “Power Reliability.” https://www.ncuc.net/ncrules/Chapter08.pdf Additionally, the IOUs must contact the NCUC to report the following:
• A decision to issue a public request to reduce customer demand load.• Actions to reduce customer demand load by reducing voltage to maintain an
adequate bulk electric power supply.• Actions to reduce firm customer loads by manual switching, automatic load-
shedding devices, or any other means to maintain an adequate bulk electricpower supply.
• Any loss in service for 15 minutes or more of bulk electric power supply toaggregate loads in excess of 200,000 kW.
• Outages in bulk power supply facilities, accidents to system facilities, delays inconstruction or substantial delays in repairs following unscheduled outages thatare of consequence on a regional or State basis, or which may constitute anunusual hazard to the reliability of electric service.

2-22
2.3.1.2 Unplanned Outages
Unplanned outages may occur due to adverse weather conditions, equipment failure, accidents, intentional damage, or system overloads. Once the cause of an unplanned outage is determined and the conditions are safe, crews will begin corrective action and restoration activities according to the restoration plan provided by the IOUs.
There are some typical actions associated with a reduction of electrical power. In the event of power loss, an additional electrical supply may be procured according to the provider’s operations plan. The provider may attempt to procure energy from its sources or may attempt to purchase electricity from other entities. If sufficient energy cannot be procured, the provider will institute a series of actions to alleviate the situation. In many cases, the IOUs may have agreements with the surrounding providers to assist in the restoration of services. For example, if a widespread electrical problem occurs, there may be an understanding within the IOU’s parent organization to respond and assist in the restoration, which has historically been the case responding to widespread outages after hurricanes. In the case of the EMC or Electricities, restoration activities will occur between the municipal utility manager and the large-scale energy provider. IOUs continually update the NCUC on restoration activities. When possible, the IOUs communicate similar information to the SERT.
Appeals for voluntary customer demand load reduction or mandatory load reduction may be implemented if the electrical supply cannot be restored in a reasonable amount of time. The EPC and SERT will advise the Governor on an appropriate course of action. In the event of a mandatory reduction, the Governor would declare an energy emergency and notify the Legislative Committee of the relevant emergency orders, rules, and regulations.
The State Energy Office monitoring activities are detailed in the Disruption Tracking Process, located in Chapter IV.
2.3.2 Natural Gas
Local distribution companies (LDC) are responsible for the distribution of natural gas to customers and are regulated by the NCUC. In the event of an outage, the SEO will communicate with both the LDCs and the NCUC. The operator of the particular energy commodity is responsible for the management and restoration of the resource. If a natural gas shortage or interruption should occur, the LDC must implement a curtailment of service, under Rule R6-19.2 of the Rules and Regulations of the NCUC. The LDC will attempt to ensure the residential sector maintains service wherever possible. The curtailment will begin with the customers paying the least margin per dekatherm in the affected area.
If the natural gas supply cannot be restored in a reasonable amount of time, appeals for voluntary customer demand load reduction or mandatory load reduction may be implemented. The EPC and SERT will advise the Governor on an appropriate course of action. In the event of a mandatory reduction, the Governor would declare an energy

2-23
emergency and notify the Legislative Committee of the relevant emergency orders, rules, and regulations.
The State Energy Office monitoring activities are detailed in the Disruption Tracking Process, located in Chapter IV.
2.3.3 Petroleum
Interstate pipelines deliver the majority of the petroleum consumed within North Carolina. The operation of these pipelines depend upon the electrical grid to power the pumps that push product. Petroleum terminals depend upon power from the electrical grid to move product within their facilities and to transfer fuel for ground transportation. The jobbers depend upon both the pipeline to deliver fuel to the terminal and the terminal to deliver fuels to tanker trucks. Retail marketers depend upon the jobbers to deliver the product, and are consequently also dependent upon the State’s ground transportation network. Consumers depend upon the entire transmission and distribution system to service their petroleum needs.
Just like with the electric utilities, refineries and pipelines are subject to both planned and unplanned outages. Unplanned outages are more difficult to manage and the impacts of the outage are compounded the longer the outage lasts.
In times of petroleum shortages, the SEO is the principal coordinating agency that liaises with the petroleum industry to determine the cause of the shortage. The SEO will identify any assistance the state may offer to the petroleum industry. Once the disruption is verified and it is determined to have a lasting impact on consumers, the SEO may suggest that voluntary or mandatory actions be implemented. The EPC and SERT will advise the Governor on an appropriate course of action. In the event of a mandatory reduction, the Governor would declare an energy emergency and notify the Legislative Committee of the relevant emergency orders, rules, and regulations.
The State Energy Office monitoring activities are detailed in the Disruption Tracking Process, located in Chapter IV.
2.3.4 Energy Disruption Impacts
2.3.4.1 Mild disruptions
Electricity - There may be no readily observable effects of a mild electricity disruption as this type of disruption may be localized and the result of downed power lines. If the state experiences a reduction in the flow of electricity, the IOU will likely perform internal load management activities and notify the appropriate authorities.
Natural Gas - The majority of the state is supplied by the Transco pipeline. In a sole supplier situation, even a mild disruption is likely to be felt. The extent to which the disruption is felt may be driven by the season. If the disruption occurs during the heating months, its effects may be more severe in the residential sector. Conversely, if the disruption occurs during the cooling months, the electric generation sector may notice a

2-24
reduced supply of natural gas as some IOUs use natural gas for combustion turbine (CT) intermediate generation. Ultimately, consumers may see the disruption affect their electric bills, as IOUs pass along cost increases from higher gas prices or switch to less economical alternative fuels. If a mild disruption increases to a severe disruption, then it is likely that the pipeline/LDCs will curtail customers until it is rectified. If LDCs curtail customers, it will occur in accordance with the North Carolina Utility Commission’s Rules and Regulations, Rule R6-19.2.
Petroleum - There may be allocations at the pipeline; non-contracted retailers may experience a reduction in available product, and if they can obtain product, they will do so at a premium. Contracted retailers may be on allocation. The transportation sector is likely to feel the effects of even a mild disruption. The transportation sector is the primary consumer of petroleum products. Motor fuel prices are sensitive to the forces acting on supply and demand. This sensitivity is likely to result in higher prices during and following a disruption. Of the petroleum products supplied to NC in 2015, 67% were gasoline products and 20% were distillate oil, including diesel fuel products. Some factors that will affect the petroleum market are geopolitical events, pipeline or refinery disruptions, or severe weather events in the producing or refining regions.
2.3.4.2 Moderate disruptions
Electricity - A moderate electricity disruption may result in a reduction in service and requests for either voluntary or mandatory conservation measures. Residential and commercial customers are likely to feel the effects of this type of disruption as they depend upon the delivery of electricity for daily operations. The impacts of this type of disruption may be seasonal. A reduction in the resources available to generate electricity may cause in-State generation to be at or near maximum potential. There may be a reduction in the interstate flow of electricity.
Natural Gas - The effects of a moderate natural gas disruption may be observed if supplies fall 5% below the month-on-month annual supply levels or below the 5-year average. The effects of a shortage may result in an increase in the spot and retail prices. Low-income customers may be vulnerable to price increases if disruptions occur during the heating months.
Petroleum - The effects of a moderate petroleum disruption may be realized in a 5% reduction in the month-on-month supply when compared to the previous years or five-year average. In making this assessment, a close review of the EIA’s Prime Supplier Report as a baseline with an examination of other factors (e.g., severe weather, pricing spikes, etc.) should be included in this evaluation. The fundamentals of supply and demand may induce the retail sector to increase costs associated with deliveries or shipments of finished products. The increased costs will likely be passed on to consumers in the form of increased pump prices. If the reduction in supply is persistent, local petroleum delivery companies may not be able to procure product, due to either increased costs and/or the reduced availability of fuel. Pump prices may increase 10-15% (for example, if gas is $3.50 per gallon, an increase to $3.85-$4.02 per gallon may

2-25
be observed). The effects may be observed in a reduction in consumer spending and vehicle miles travelled.
2.3.4.3 Severe disruptions
Electricity - If a severe electric supply disruption occurs, rolling blackouts may be observed. Commercial, industrial, transportation, and residential customers will likely feel the effects of this type of disruption, as they may be required to implement voluntary and mandatory measures. Health and public safety organizations may be required to use standby generation. Those with electricity may be asked to reduce climate controls and the commercial sector may limit operating hours. The IOU may report the use of reserve generation, decreased level of stocks, and announce planned curtailments or system outages.
Natural Gas - If a severe disruption affects the natural gas industry, the impacts and impacted parties will vary based on the season. If in the winter months, the residential sector may be directly affected, and during the summer months, the residential sector may be indirectly affected. The commercial, industrial, transportation, and residential customers will likely feel the effects in this type of disruption as they may be required to not only implement voluntary conservation measures, but mandatory conservation measures as well. There may be an increase in residence throughput at shelters for those seeking heat in the winter months.
Petroleum - In severe petroleum disruption, there may be some fuel stations without product for extended periods of time. Those stations that do have product may see long lines at their gas pumps and increased prices. Retailers and motorists may be required to implement both voluntary and mandatory measures. There may be an increase the use of carpools and public transportation. Some consumers may engage in fuel hoarding.
2.3.5 Restoration Priorities
2.3.5.1 Electricity
Each electricity provider has its own plan to respond to and to restore electricity to its customers. Each utility is required to file its restoration plan with the NCUC. If electrical lines are damaged, the utility will likely follow an accepted protocol that begins with an assessment of the disruption.
The utility may use logical troubleshooting to determine what type of problem is affecting the system, shortage, or disruption. If the utility determines that it is not producing enough energy to support its customers’ needs, a business decision to acquire more electricity will be made according to the utility’s internal protocol. If the utility cannot produce or obtain a sufficient amount of electricity, it may implement load management steps such as voltage reductions or rolling blackouts. If the utility is producing enough electricity and a physical disruption is suspected, the following general steps could be followed.

2-26
The utility will determine if conditions are safe enough to work on restoration. If conditions are not safe, such as downed power lines, the utility may need to further reduce service in order to make the conditions safe for restoration crews. If the utility must temporarily reduce its service, it will notify critical facilities, such as hospitals or public safety complexes, of the temporary reduction. Once conditions are determined safe, restoration activities may begin. Restoration may occur according to the utility’s restoration plan submitted to the NCUC.
2.3.5.1.1 Priorities
To restore power in any community, utility companies generally begin with repairing the equipment that serves the greatest number of customers and work through the remainder of its system in the same manner. Work typically begins with the transmission system and works through the distribution system until the last customer’s electricity is restored. Priority is given to critical facilities and infrastructure, including: public health facilities; hospitals; fire departments; law enforcement; emergency shelters; nursing homes; water treatment and pumping stations; sewage treatment and pumping stations; and schools. Special-needs customers, such as those who are identified as medical alert customers, receive priority restoration whenever possible. However, special needs customers should have a contingency plan for widespread or persistent energy disruptions. Figure 2-8 below illustrates the electric delivery system.
The typical steps taken to restore power to the electric delivery system include:
Pre-Restoration Activities
• Assess the damage.• Activate company emergency centers and repair facilities.• Notify public safety, neighboring utilities, ISOs, and regulatory entities.• Determine how many crews and where they are needed.• Deploy repair crews, and if needed, request additional repair crews.• Inform media and assure customers.• Inform State government and provide updates.
Restoration Activities
• Repair transmission lines, towers, and other distribution equipment.• Repair distribution substations.• Repair main distribution lines or feeders (from substations to customers).• Repair tap lines, poles and associated equipment as required.• Repair service lines to individual customers.

2-27
• Verify restoration and report completion to appropriate entities.
Figure 2- 8 Restoration Diagram
2.3.5.2 Natural Gas Each natural gas local distribution company (LDC) has its own plan to respond to disruptions and to restore service to its customers. Each LDC is required to file its restoration plan with the NCUC. If distribution lines are damaged, the utility will likely follow an accepted protocol that begins with an assessment of the disruption.
The LDC may use logical troubleshooting to determine what type of problem is affecting the system, shortage, or disruption. If the LDC determines that it is experiencing a supply shortage, curtailment activities may occur until it can acquire more supply. Supply increases will be dependent upon the successful operation and ability of the interstate system to deliver product to the LDC or the LDC’s ability to use stored gas to supplement the flow.
If system-wide curtailment activities must be implemented, they will be done in accordance with the NCUC’s Rules and Regulations, Rule R6-19.2.
A summary of the curtailment rule is as follows:
Priority 1: Residential. Essential human needs with no alternate fuel capability. Commercial less than 50 Mcf/day. Commercial less than 50 Mcf/day.
Source: DEP, https://wwwint.progress-energy.com/carolinas/home/safety-information/storm-safety-tips/restoration.page

2-28
Priority 2: Industrial Less Than 50 Mcf/day. Process, feedstock, and plant protection with no alternate fuel capability. Large commercial requirements of 50 Mcf or more per day, except for large commercial boiler fuel requirements greater than 300 Mcf/day.
Priority 3: All other industrial requirements not greater than 300 Mcf/day.
Generally, the rule provides that if curtailment is necessary, it must begin with the customers who pay the least margin per dekatherm. If conditions are such that the disruption is geographically centered, then curtailment by margin will only occur with those customers in the affected area.
If the LDC suspects a physical disruption or if a physical disruption is reported, the following general steps could be followed: determine if conditions are safe enough to work on restoration; if not safe (such as discovery of a ruptured line) the LDC may need to further reduce service in order to make the conditions safe for restoration crews.
2.3.5.2.1 Priorities
To restore service in any community, LDCs generally begin with the lines that serve the greatest number of customers and work through the remainder of its system in the same manner. Usually, work begins with the interstate transmission lines and intrastate distribution lines, then moves towards compressor stations and works through the distribution system until the last customer’s service is restored.
Pre-Restoration Activities
• Assess the damage.• Activate company emergency centers and repair facilities.• Notify public safety, neighboring LDCs, and regulatory entities.• Determine how many and where crews are needed.• Deploy repair crews, and if needed, request additional repair crews.• Inform media and assure customers.• Inform State government and provide updates.
Restoration Activities
• Repair inter- and intra-state transmission lines and compressor stations.• Repair local distribution lines.• Repair service lines to individual customers.• Verify restoration and report restoration completion to appropriate entities.

29
Bibliography
Colonial Pipeline, Gasoline Pipeline Spill/Breach: http://www.al.com/news/birmingham/index.ssf/2016/09/gasoline_pipeline_spill_cleanu.html Duke Energy Progress, Restoration diagram:
https://www.duke-energy.com//_/media/pdfs/outages/140210-how-duke-energy-restores-power.pdf
U.S. Department of Energy, Energy Information Administration, Natural Gas Consumption by End Use: https://www.eia.gov/dnav/ng/ng_cons_sum_dcu_nus_a.htm
Eaton, Electric Disruptions: https://switchon.eaton.com/blackout-tracker
U.S. Environmental Protection Agency, RVP Waivers: https://www.epa.gov/gasoline-standards/gasoline-reid-vapor-pressure#G National Lightning Safety Institute: http://www.lightningsafety.com/nlsi_lls/nlsi_annual_usa_losses.htm
National Weather Service, North Carolina Severe Weather Awareness Week: https://www.weather.gov/ilm/SvrWxAwarenessWeek North Carolina Department of Public Safety website: https://rmp.nc.gov/portal/#riskContent
North Carolina Department of Environmental Quality (formerly NCDENR), Division of Air Quality: https://files.nc.gov/ncdeq/Air%20Quality/news/leg/2014_Clean_Smokestacks_Act_Report.pdf
North Carolina Utilities Commission (NCUC)
NCUC--Electric Industry: http://www.ncuc.net/industries/electric/electric.html
NCUC--Natural Gas, Rule R6-192: http://www.ncuc.net/ncrules/Chapter06.pdf
National Oceanic and Atmospheric Administration, Space Weather Storms: NOAA/Space Weather Prediction Center.
State Climate Office of North Carolina: http://climate.ncsu.edu/
U. S Department of Energy (DOE) Office of Electricity Delivery and Energy Reliability
DOE--State and Regional Energy Risk Assessment: [https://www.energy.gov/oe/activities/energy-assurance/state-and-regional-energy-risk-assessment-initiative
DOE--Product Supply Overview, PADDs 1 and 3: https://www.eia.gov/analysis/transportationfuels/padd1n3/
DOE--Prime Supplier Report: https://www.eia.gov/petroleum/marketing/prime/
DOE--Large-scale events; cyber-attack: https://www.energy.gov/oe/articles/liberty-eclipse-exercise-summary-report

i
Volume 3 - Energy Profile Volume 3 - Energy Profile .......................................................................................................... i
Table of Contents .......................................................................................................................i Table of Figures ...................................................................................................................... ii
Table of Tables ....................................................................................................................... ii
3.1 Energy Interdependencies .................................................. .............................................3-1
3.2 North Carolina State Demographics ...............................................................................3-4
3.2.1 Residential Sector ................................................................................................... 3-7
3.2.2 Commercial Sector .................................................................................................. 3-8
3.2.3 Industrial Sector .................................................................................................... 3-10
3.2.4 Transportation Sector ............................................................................................ 3-11
3.3 Summary of Energy Infrastructure ................................................................................ 3-15
3.3.1 Electricity .............................................................................................................. 3-15
3.3.2 Natural Gas ........................................................................................................... 3-21
3.3.3 Renewable Energy ................................................................................................ 3-23
3.3.4 Petroleum.............................................................................................................. 3-30
3.4 Energy Expenditures and Comparative Use ................................................................. 3-33
3.4.1 Residential Sector ................................................................................................. 3-35
3.4.2 Commercial Sector ................................................................................................ 3-36
3.4.3 The Industrial Sector ............................................................................................. 3-38
3.4.4 Transportation Sector ............................................................................................ 3-39
Bibliography .......................................................................................................................... 3-42
Table of Figures
Figure 3- 1: Example of Critical Infrastructure Interdependencies ........................................... 3-1 Figure 3- 2: Geographic Interdependencies ............................................................................ 3-2 Figure 3- 3: Logical Interdependencies ................................................................................... 3-3 Figure 3- 4: Cyber Dependencies............................................................................................ 3-4 Figure 3- 5: NC Electricity Sales Forecast ............................................................................... 3-5 Figure 3- 6: North Carolina Population .................................................................................... 3-5 Figure 3- 7: North Carolina's Top Six Growth Counties ........................................................... 3-6 Figure 3- 8: NC Energy Consumption per Sector .................................................................... 3-7 Figure 3- 9 Energy User by Mode and Type South East Census Region .............................. 3-11 Figure 3- 10 North Carolina Population and Licensed Drivers ............................................... 3-12 Figure 3- 11 NC Population and Registered Vehicles............................................................ 3-12 Figure 3- 12 NC Annual Taxed Fuel vs. Population ............................................................... 3-13 Figure 3- 13 NC Vehicle Miles Traveled ................................................................................ 3-14 Figure 3- 14 Average Fuel Efficiency .................................................................................... 3-14 Figure 3- 15 Historical Electricity Generation & Sales in NC.................................................. 3-16 Figure 3- 16 Basic Electrical Infrastructure. ........................................................................... 3-16 Figure 3- 17 Electric Generation ........................................................................................... 3-17 Figure 3- 18 NC Retail Electric Revenue ............................................................................... 3-18

ii
Figure 3- 19 NC Average Retail Electricity Price by Sector ................................................... 3-19 Figure 3- 20 Origin of Coal for NC Generation ...................................................................... 3-19 Figure 3- 21 Diagram of Shearon Harris Nuclear Plant ......................................................... 3-20 Figure 3- 22 Westinghouse AP1000 Nuclear Reactor Design ............................................... 3-21 Figure 3- 23 Southeast’s Interstate and Intrastate Gas Pipelines .......................................... 3-23 Figure 3- 24 Conventional Hydroelectric Generation ............................................................. 3-24 Figure 3- 25 Pumped Storage Hydroelectric Generation ....................................................... 3-25 Figure 3- 26 Duke Energy Solar Power Projects in North Carolina ........................................ 3-26 Figure 3- 27 U.S. Methane Generation Potential from Biomass Resources .......................... 3-27 Figure 3- 28 Municipal Waste/LFG Power Generation .......................................................... 3-28 Figure 3- 29 North Carolina Offshore Wind Resources at 90 meters above sea level ........... 3-29 Figure 3- 30 U.S East Coast and Gulf Coast transportation fuel product flows ...................... 3-31 Figure 3- 31 Colonial and Plantation Pipeline Terminals ....................................................... 3-32 Figure 3- 32 NC Energy Use by Source, All Sectors ............................................................. 3-33 Figure 3- 33 NC Energy Use by Sector Excluding Electricity, All Sources ............................. 3-34 Figure 3- 34 NC Expenditures by Sector Including Electricity ................................................ 3-34 Figure 3- 35 NC Residential Energy Consumption by Source ............................................... 3-35 Figure 3- 36 NC 2015 Residential Energy Expenditures by Source. ...................................... 3-36 Figure 3- 37 NC Commercial Energy Expenditures by Source .............................................. 3-37 Figure 3- 38 NC Commercial Energy Use ............................................................................. 3-37 Figure 3- 39 NC Industrial Energy Expenditures by Source................................................... 3-38 Figure 3- 40 NC Industrial Sector Energy Use....................................................................... 3-39 Figure 3- 41 NC Transportation Sector Energy Expenditures by Source ............................... 3-39 Figure 3- 42 NC Transportation Sector Energy Use .............................................................. 3-40 Figure 3- 43 NC Transportation Sector Energy Cost ............................................................ 3-41
Table of Tables
Table 3-1: Housing Demographics ......................................................................................... 3-6 Table 3-2: Demographics ........................................................................................................ 3-8 Table 3-3: Commercial Sectors Electric End Use .................................................................... 3-9 Table 3-4: NC Energy Disruptions 2012-2017 ....................................................................... 3-10 Table 3-5: NC Electric Generation Comparison by Source .................................................... 3-18 Table 3-6: List of Nuclear Generation Stations in NC ............................................................ 3-20

3-1
3 Energy Profile
Energy Interdependencies
Energy is essential to the health, safety, and welfare of the people and the economy of North Carolina. Figure 3-1 (Example of Critical Infrastructure Interdependencies) below, illustrates the complexities of energy systems and the many interdependencies between different sources and delivery methods.
Figure 3- 1: Example of Critical Infrastructure Interdependencies
(Source: Argonne National Laboratory)
North Carolina’s Energy Assurance Plan (EAP) addresses certain critical infrastructure elements such as electricity, natural gas, nuclear, and petroleum. It examines the energy consumption of the commercial, industrial, residential, and transportation sectors of the State’s economy. Each sector depends upon other sectors for its resiliency. The geographic, logical, and cyber interdependencies will also be explored in this Chapter.
Geographic interdependencies are produced by the State’s dependence on common corridors through which energy and information services are imported into the state. These corridors include petroleum pipelines, electric transmission lines, telephone lines, railways, and highways. For example, electric generation relies on the delivery of coal for use in coal generation plants. Coal is delivered via rail, where engines are powered by petroleum products. Petroleum is transported through a pipeline that requires electricity to operate pumping stations. Figure 3- 2 illustrates geographic interdependencies.

3-2
Figure 3- 2: Geographic Interdependencies
Logical interdependencies in the context of energy systems are the subtle interactions which take place between two or more systems of variables. An example of a logical interdependency is the relationship between electric generation and financial markets. To generate electricity, an electric utility must acquire resources through a purchase process that requires both funding and financing mechanisms. Regional, national, and international financial markets can affect NC’s economy. Charlotte, the home of Bank of America Corporation, is the nation’s third-largest banking center behind only New York City and San Francisco. History has demonstrated that no entity is truly immune to turmoil in the financial market. Since petroleum is traded in U.S.
Common Corridor
Electricity
Transmission
Inter-stateCyber/ Logical Dependency
Intra-stateCyber/ Logical Dependency
DistributionConsumers
Generation FuelsCyber/ Logical Dependency
Petroleum Pipeline TransportationCyber/ Logical Dependency
Natural Gas
Electric Generation
Cyber/ Logical Dependency
Peak Generation
Consumer
Cyber/Logical Dependency
Health and Comfort
Communications Voice/Data
Residential Sector
Cyber/Logical Dependency
Commercial Sector
Cyber/ Logical
Dependency
Transportation Air/Ground
PassengerCyber/Logical Dependency
FreightCyber/Logical Dependency

3-3
dollars, its value is directly tied to the dollar’s current value. Fluctuations in dollar values, relative to other world currencies, can have dramatic effects on retail energy prices that impact almost every other economic sector. Petroleum markets are especially dependent upon the financial market. If the value of the dollar declines (relative to other currencies), then petroleum becomes more affordable to foreign buyers. This results in both increased global demand and higher domestic pump prices. Figure 3-3 illustrates logical interdependencies.
Figure 3- 3: Logical Interdependencies
Cyber-interdependency describes how information technology (IT) disruptions to one or more energy infrastructure sectors can affect other seemingly unrelated sectors. The past twenty-plus years has witnessed a transition in the State’s economy; from a traditional manufacturing and goods economy, based on tobacco, furniture and textiles, to a knowledge-based enterprise economy driven by advanced manufacturing, software and information technology, bio-pharmaceuticals and financial services. By re-positioning its economy to compete internationally, NC continues to see the growth of these knowledge- and service-based sectors as well as their respective energy demands. The IT infrastructures of these industries require adequate and reliable electricity to power data-intensive operations. If NC’s electronic commerce or information communication systems are compromised or denied, then the State could suffer considerable economic losses. Figure 3-4 illustrates cyber interdependencies.
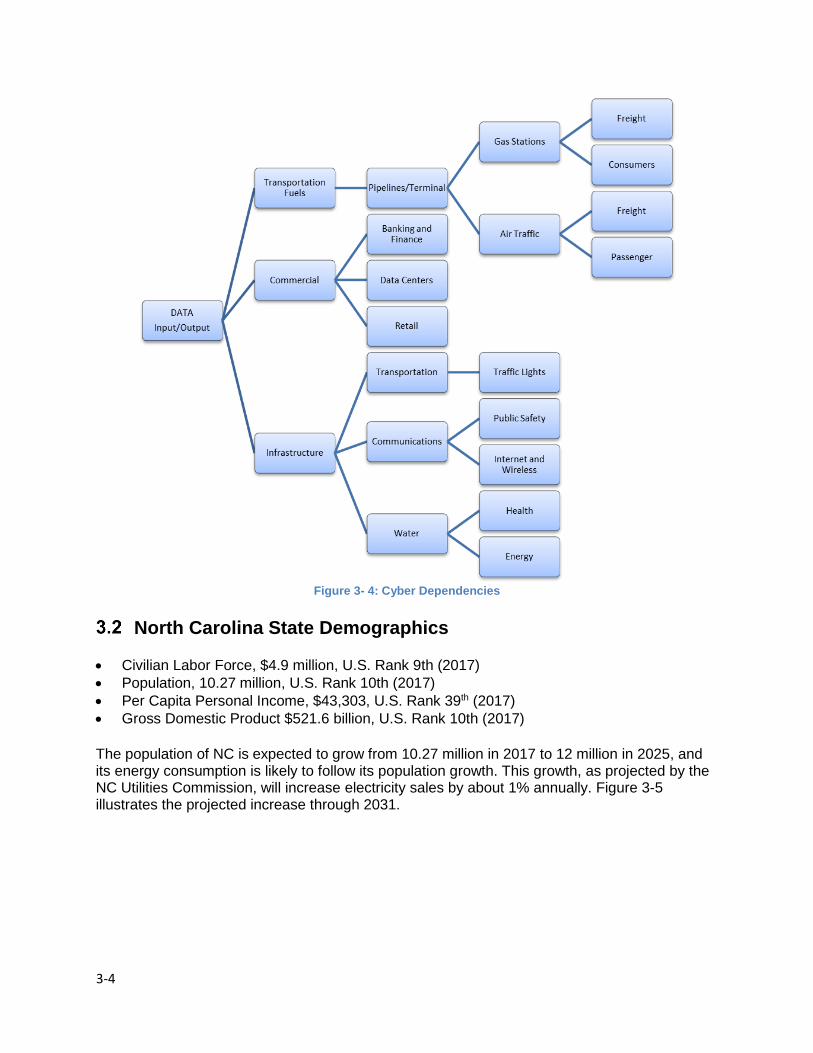
3-4
Figure 3- 4: Cyber Dependencies
North Carolina State Demographics
Civilian Labor Force, $4.9 million, U.S. Rank 9th (2017)
Population, 10.27 million, U.S. Rank 10th (2017)
Per Capita Personal Income, $43,303, U.S. Rank 39th (2017)
Gross Domestic Product $521.6 billion, U.S. Rank 10th (2017)
The population of NC is expected to grow from 10.27 million in 2017 to 12 million in 2025, and its energy consumption is likely to follow its population growth. This growth, as projected by the NC Utilities Commission, will increase electricity sales by about 1% annually. Figure 3-5 illustrates the projected increase through 2031.

3-5
Figure 3- 5: NC Electricity Sales Forecast 2015-2031 (Source: NCUC)
The population in NC has grown significantly over the past 118 years. Population growth from 1990-2000 was 21%, growth from 2000-2010 was 18.5% and projected growth from 2010-2037 is expected to be almost 25% as shown in Figure 3-6 below.
Figure 3- 6: North Carolina Population 1990-2037
0
40000
80000
120000
160000
Electricity Sales Forcast in GigaWatt-hours (GWH) - Source NC Utilities Commisssion(NCUC) - [http://starw1.ncuc.net/NCUC/ViewFile.aspx?Id=2292ba92-d5a1-4b05-b2b7-b158c915655d]
5
6
7
8
9
10
11
12
13
1990 2000 2010 2020 2030
Po
pu
lati
on
in M
illio
ns
47 Year View
NC POPULATION G ROWTH 1990-2037

3-6
The six counties projected to grow the fastest by 2020, in order of highest percentage increase, are: Brunswick; Chatham; Johnston; Pender; Mecklenburg, and Wake as seen in Figure 3-7.
Figure 3- 7: North Carolina's Top Six Growth Counties 2010-2020
Population growth has contributed to an increased housing stock in the State. According to the American Housing Survey conducted by the U.S. Census, it is estimated that the housing stock increased 24% from 1990-2000; which corresponds with population growth over the same period. Housing stocks grew by 20% from 2000-2010, but decreased to about 4.4% from 2000 to 2015. As shown in Table 2-1, NC has a greater number of detached single-family homes and mobile homes, and fewer apartments than the national average. Since much of NC’s housing stock is geographically dispersed and in less densely populated areas, it can contribute to higher energy use.
Single Family Detached
Single Family Attached
Apartment,
2-4 Units
Apartment,
5 or more
Mobile Home
Other
U.S. 63.1% 7.3% 7.5% 16.2% 5.8% 0.1%
North Carolina
65% 3.9% 4.9% 12.6% 13.4% 0.1%
Table 3-1: Housing Demographics
Source (United States Census Bureau, 2015)
0
200000
400000
600000
800000
1000000
1200000
Brunswick(+31.7%)
Chatham(+25.2%)
Johnston(+24.9%)
Pender(+24.4%)
Mecklenburg(+24.4%)
Wake+24.0%)
Six Fastest Growing NC Counties 2010 -2020
2010 Population 2020 Increase Estimate

3-7
The EIA itemizes energy consumption by four sectors: commercial, industrial, residential, and transportation. Figure 3-7 illustrates the sector distribution in NC. The energy demands of each sector vary considerably. A firm understanding of these energy demands by each sector can assist State planners in developing strategies to address future demands and mitigate unexpected disruptions or supply shortages.
Figure 3- 8: NC Energy Consumption per Sector
(Source: EIA, 2017)
Residential Sector
The Residential Sector includes single- and multi-family homes, manufactured or mobile homes, and apartments. Institutional living facilities such as correctional facilities, military barracks, assisted living facilities, nursing homes, or college dormitories are not included in this sector. The residential sector is highly dependent on electricity for heating, ventilation, air conditioning (HVAC), lighting, cooking, refrigeration, and entertainment. The majority of NC’s housing stock is owner-occupied. According to the 2016 U.S. Census, 64.2% of all homes are owner-occupied, while 35.8% are renter-occupied. Approximately 85.5% of the housing stock is occupied, 14.5% is vacant, and 22.3% of the housing structures are multi-family units as shown in Table 3-2 below.
Retail electricity purchases, according to the 2016 U.S. Census, account for approximately 63.2% of home heating expenditures while natural gas heats 24.3% of the NC homes. According to the EIA’s 2015 Residential Energy Consumption Survey (RECS), more homes in the South Atlantic Region (that includes NC), have electric central heat/pump air conditioning, water heaters, and stoves. Conversely, coal and kerosene consumption in the residential sector is negligible.
Residential27%
Commercial22%
Industrial 22%
Transportation28%
NC Energy Consumption by Sector - 2017
Residential
Commercial Sector
Industrial Sector

3-8
Description North Carolina
Nation
Housing Units 4,453,767 134,054,899
Homeownership Rate 64.2% 63.6%
Multi-Unit Structures 22.3% 26.5%
Household 3,815,923 117,716,237
Persons Per Household 2.52 2.62
Persons under 6-yrs old 6.3% 6.2%
Persons under 18-yrs old
28.2% 22.3%
Persons 65-yrs or older 24% 24.1%
Median Household Income
$48,256 $55,322
Persons with Income Below $19,999/year
19.6% 17.2%
Table 3-2: Demographics
(Source: US Census Bureau 2016)
Commercial Sector
The EIA defines the commercial sector to include “service-producing facilities and equipment of businesses; Federal, State, and local governments; and other private and public organizations, such as religious, social, or fraternal groups. The commercial sector includes institutional living quarters. It also includes sewage treatment facilities.” EIA estimates that within the sector, approximately 15% consists of retail spaces, 14% office spaces, 10% educational facilities, 8% health care facilities, 6% consists of lodging (hotels, dorms, and assisted living facilities), and the remainder consists of smaller categories. Common sector energy end-uses include space heating, lighting, HVAC, refrigeration, and computers/office equipment (EIA, 2017).
The commercial sector, like the residential sector, is highly dependent upon electricity. In 2012, electricity accounted for about 61% of its energy and 32% was met with natural gas (U.S. Department of Energy, 2012).
The EIA estimates that in the South Atlantic region, commercial energy use in 2012 was dominated by HVAC (47% of total), and cooking and refrigeration (28%). Table 3-3 details the percentage of the total energy use within the national commercial sector.

3-9
Energy Use Percentage of the total use
Lighting 11%
Space Heating 27%
Cooling 10%
Ventilation 10%
Water Heating 8%
Refrigeration 11%
Cooking 17%
Computers 6%
Office Equipment 3%
Table 3-3: Commercial Sectors Electric End Use (Source EIA 2012)
North Carolina is a national leader in information technology (IT) and home to numerous data center operations. The State’s economy is projected to continue to grow quickly in this area. The availability of affordable, highly-reliable electricity is a determining factor for where site data centers. Data centers are electricity-intensive operations that operate continuously and may demand as much as 10 times the electricity per square foot as the average commercial space. As a result, NC’s electrical generation and distribution infrastructure could see significantly increased demand as firms expand and new companies establish facilities.
Several large financial institutions and IT companies are based in NC. These include Bank of America; New Dominion Bank; Carolina Premier Bank; Branch Banking and Trust Company; IBM; Lenovo; Red Hat; SAS; Microsoft; and Cisco. The continued financial and operational solvency of these corporations depend upon a constant source of power to support daily operations. In turn, NC relies on these corporations’ operation to contribute to the success of the state economy.
As these industries grow, so too does dependence on the secure delivery of electricity. Electricity is necessary to perform daily electronic operations, such as data transfers for banking, finance, and credit/debit transactions. For example, banking activities are increasingly electronic through direct deposit of salaries, the availability of online banking activities, automated teller machines (ATM), and use of debit cards.
Power quality is a significant challenge to the commercial sector as well as NC’s infrastructure in general. The majority of grid failures within NC are weather-related, as indicated in Table 3-4. Approximately 30% of all power outages are lightning-related, with associated costs approaching $1 billion. The DOE estimates that each year, power failures result in $25 billion in economic losses nationwide.

3-10
DATE UTILITY COMPANY(IES) AREA AFFECTED REASON LOSS in MW
CUSTOMERS AFFECTED
10/23/2017 Duke Energy North & South Carolina
Severe Weather
440 115,144
9/19/2017 NCEMCs Eastern NC Hurricane Jose
Unknown (Unk)
Unknown (Unk)
9/11/2017 Duke & NCEMCs North & South Carolina
Severe Weather
365 265,729
4/24/2017 Duke Union County Vandalism Unk Unk 10/31/2016 Colonial Pipeline NC & Southeast U.S. Pipeline leak Unk Unk 10/8/2016 Duke & NCEMCs Eastern NC & SC Hur. Matthew 300 44,875 9/15/2016 Duke & NCEMCs Eastern NC Hurricane
Julia Unk Unk
9/9/2016 Colonial Pipeline NC & Southeast U.S. Pipeline fire Unk Unk 9/2/2016 Duke & NCEMCs Eastern NC TS Hermine Unk Unk 7/8/2016 Duke & NCEMCs Western NC Severe
Weather 600 203,345
5/30/2016 Duke & NCEMCs Eastern NC TS Bonnie Unk Unk 2/24/2016 Duke & NCEMCs North & South
Carolina Winter Storm 400 284,610
5/7/2015 Duke & NCEMCs Eastern NC TS Ana Unk Unk 2/16-26/15 Vandalism North & South
Carolina Severe Cold 1,020 414,776
12/14/2014 NC Eastern Muni Pwr Agency
Fayetteville Vandalism N/A 29376
7/3/2014 Duke & NCEMCs Eastern North Carolina
Hurric. Arthur Unk Unk
3/7/2014 Duke & NCEMCs NC Triad Region Winter Storm 1,500 370,900 10/16/2013 Duke/Progress Energy Roxboro power plant Cyber event Unk Unk 6/13/2013 Dominion Central & Eastern NC Severe T-
storm 1,000 228,000
12/21/2012 NCEMPA North Carolina Transmission interruption
40 1,200
Table 3-4: NC Energy Disruptions 2012-2017
Industrial Sector
North Carolina continues its transition from an agricultural and manufacturing-centric
economy to a knowledge and service-based economy. The EIA defines the Industrial
Sector as “an energy-consuming sector that consists of all facilities and equipment used
for producing, processing, or assembling goods.” In other words, organizations that
process raw materials and manufacture products comprise the industrial sector. The NC
Department of Commerce’s 2016 Annual Economic Report provides that significant
finance, biotechnology, pharmaceutical, advanced manufacturing, and IT operations are
growing and thriving in the State.
In 2015, NC’s industrial sector energy needs were met predominately by electricity
(66%), followed by natural gas (20%), and other petroleum products (13%). Industrial
energy consumption is primarily associated with manufacturing processes, heating, and
cooling. The industrial sector is depends upon the transportation sector to acquire
inputs and to send finished products to market.

3-11
Transportation Sector
The Transportation Sector consists of the vehicles that transport people or goods from one location to another and includes personal vehicles, trucks, trains, buses, aircraft, pipelines, and ships. The commercial and industrial sectors depend upon transportation to sustain their activities.
North Carolina is located in the Petroleum Administration for Defense District 1C (PADD-1C) along with five other southeastern states. The following data from EIA examines transportation sector energy consumption within PADD-1C. Motor fuels constitute the overwhelming majority of energy consumed by the transportation sector. 74% of the sector’s fuel use is motor gasoline (inclusive of regular, mid- and premium grade gasoline), 20% is distillates, and 4% jet fuel. The on-road category is subdivided into highway use, non-highway and military use.
Highway Use
Figure 3-9 provides that light-duty vehicles consume about 76% of the sector’s fuel. The light-duty vehicle category consists of passenger cars, small trucks, vans, and sport utility vehicles. The segment includes motorcycles but their aggregate consumption is negligible. Large freight trucks use about 23% of the transportation sector’s fuel.
Non-highway Use
The non-highway sector is comprised of the aviation, water, rail, lubricant, and pipeline sectors. Not counting the lubricant and pipeline operations, aviation dominates this sector (about 56% of total), followed by water transportation at 31%, and rail at 13%.
Figure 3- 9: Energy User by Mode and Type South East Census Region
(Source: Table 45, EIA Energy Outlook 2010)

3-12
Figure 3- 10 North Carolina Population and Licensed Drivers: 1949-2015
The demand for transportation energy resources is increasing as the population of North Carolina continues to increase, like what has been seen in the housing sector. Population and the number of licensed drivers have increased at similar rates, as illustrated in Figure 3-10.
Figure 3-11 illustrates how the number of registered vehicles has increased along with the state’s population growth. However, there appears to be a decoupling effect between 1996 and 2008 when rate in number of vehicles appears to be decreasing while the population rate increases.
Figure 3- 11 NC Population and Registered Vehicles, 1900-2014 (Source: Federal Highway Administration)
0
2,000,000
4,000,000
6,000,000
8,000,000
10,000,000
12,000,000
1949 1955 1961 1967 1973 1979 1985 1991 1997 2003 2009 2015
North Carolina Population and Licensed Drivers
Licensed Drivers Population
0
2,000,000
4,000,000
6,000,000
8,000,000
10,000,000
12,000,000
1900 1912 1924 1936 1948 1960 1972 1984 1996 2008 2014
North Carolina Population and Registered Vehicles, 1900-2014
Registered Vehicles Population

3-13
It is important to consider the relationship between the fuel efficiency of vehicles and the increased fuel consumption due to an increasing population, number of licensed drivers, and registered vehicles within NC. Figure 3-12 shows an increase in population over time (as measured in millions) and the consumption of taxed fuel measured in billions of gallons. It appears as if the population is remaining on a steadily rising course while the annual taxed fuel number numbers is fluctuating below 2010 levels. The rising NC population, coupled with additional licensed drivers and their vehicles may ultimately lead to an increased demand for gasoline and diesel products.
Figure 3- 12 NC Annual Taxed Fuel vs. Population 1996-2016
(Source: Federal Highway Administration & U.S. Census Bureau)
Figure 3-13 shows increased vehicle miles traveled (VMT) growth. NC residents traveled over 111 billion VMTs in 2015. The increase in VMTs may be attributed to several factors including improved highways, urban sprawl, and a thriving economy prior to the December 2007 recession. It should be noted that over a period of 55 years, the only decreases in VMTs followed the energy crises in the 1970s and the economic downturn that started in 2008.
0
2,000,000
4,000,000
6,000,000
8,000,000
10,000,000
12,000,000
19
96
19
97
19
98
19
99
20
00
20
01
20
02
20
03
20
04
20
05
20
06
20
07
20
08
20
09
20
10
20
11
20
12
20
13
20
14
20
15
20
16
North Carolina Annual Taxed Fuel Vs. Population, 1996-2016
Taxed Fuel (Billions of Gallons) Population (Millions)

3-14
Figure 3- 13 NC Vehicle Miles Travel 1957-2010 (Source: Federal Highway Administration)
Vehicle fuel efficiency has consistently increased over the past 25 years. Efforts to improve fuel efficiency for passenger cars, as shown in Figure 3-14 below, shows that the average fuel economy of the national fleet is now over 35 miles per gallon. This increase in overall vehicle efficiency may have some effect on the overall consumption of transortation fuels.
Figure 3- 14 Average Fuel Efficiency (Source: U.S. Department of Transportation )
0
20,000,000
40,000,000
60,000,000
80,000,000
100,000,000
120,000,000
1960 1965 1970 1975 1980 1985 1990 1995 2000 2005 2010 2015
An
nu
al V
eh
icle
Mile
s Tr
ave
lled
(b
illio
ns)
Year
North Carolina Vehicle Miles of Travel, 1960-2015
Annual Vehicle Miles Travelled (billions)
0
5
10
15
20
25
30
35
40
1980 1985 1990 1995 2000 2005 2010 2015
National Fuel Efficiency Averages, 1980-2015
All Vehicles Passenger Cars

3-15
Behavior enhances the vulnerability of NC’s commuters to increases in motor fuel prices. The 2010 Census reports that 81% of workers aged 16 and older who commute to work drive alone, 10% of workers carpool, and 19% use public transportation. This sector requires a reliable petroleum resource in order to maintain its ability to transport people or goods from one location to another.
Summary of Energy Infrastructure
The State’s diverse energy portfolio includes petroleum, propane, natural gas, nuclear, coal, and renewable resources. Our renewable resources include biomass, hydro-electric, solar, and wind energy. The EIA reports that most of NC’s net generated electricity is derived from imported fossil-fuel resources and that about one-tenth is from renewable sources. The in-state renewable sources supplement fossil fuel generation with electricity from hydroelectric dams in central and western NC, solar farms, biomass installations, and some wind facilities. The following is a brief overview of NC energy sources and their respective impacts.
Crude Oil Reserves - None Natural Gas Reserves - None Renewables – Provides about one-tenth of net electricity generated; NC is 3rd largest
U.S. solar electric generator Electric Generation - Ranks 6th in the nation (2016) Nuclear Generation of Electricity - Ranks 4th in the nation in net electricity generation
with 5.3% of the U.S. total (2016)
Electricity
A constant and reliable energy source is essential to the health, safety, and welfare of the people and the economy of NC. The electric grid, the foundation of our modern society, is necessary for the residential, commercial, industrial, and transportation sectors to function. The growing need for efficient demand response, power reliability, and power quality necessitates investment in modernizing the NC electric delivery system. Electricity is needed for a variety of interdependent infrastructure operations such as powering the pumps that operate petroleum and natural gas pipelines throughout the state. Reliable power is necessary to sustain the finance, information technology, and research sectors that underpin the economic livelihood of the State.
In 2015, NC consumed 2.5 trillion Btus (of the 97 quadrillion Btus consumed nationally) and generated approximately 128 million MWh. Statewide electricity generation capacity is very close to meeting aggregate demand with energy generated in-state being transmitted to an integrated electric system that operates on an interstate basis. Approximately 90% of electric power used in NC is generated in-state or at plants operated by the State’s three-principal investor-owned utilities (IOUs), Duke Energy Progress (DEP), Duke Energy Carolinas (DEC) and Dominion Energy North Carolina.
Figure 3-15 shows that electricity sales have risen steadily since 1996. It’s future growth is projected to flatten/increase much more slowly over the next two decades. This slower growth is due to several factors including population growth, improved efficiency of almost all electric equipment and appliances, and the economy’s movement toward industries which use less electricity. Even with emerging technologies such as plug-in hybrid electric vehicles (PHEV) and electric vehicles (EV), electric use is projected to be below one percent through 2040.

3-16
Figure 3- 15 Historical Electricity Generation & Sales in NC, 1996-2016
(Source: EIA, 2016)
Basics of Electricity
The electrical infrastructure is divided into generation, transmission, and distribution, as represented in Figure 3-16. NC utilizes several generation stations that produce both baseload and auxiliary power. Coal, hydroelectric, or nuclear energy plants usually provide baseload generation. These power plants operate at or close to capacity, providing lower-cost electricity during periods of normal demand. Periods of high demand require the activation of auxiliary generation plants to absorb the extra electrical load. Auxiliary peaking unit plants typically use natural gas or petroleum as fuel.
0
20,000
40,000
60,000
80,000
100,000
120,000
140,000
160,000
1996 2001 2006 2011 2016
North Carolina’s Electric Generation vs. Sales , 1996-2016
Electricity Generation in Giga-Watt-hours (GWh) Electricity Sales (GWh)
(Source: science.howstuffworks.com/environmental/energy/power.htm)
Figure 3- 16 Basic Electrical Infrastructure.

3-17
Once power is generated a step-up power transformer increases the voltage for transmission on high-voltage transmission lines. Power is transmitted over high-voltage lines to reduce losses (i.e., heat) along the lines. A step-down transformer at a local distribution plant takes this high-voltage power and reduces the voltage for use by the distribution substation. Another step-down transformer further reduces the voltage at the distribution substation. Power is then transmitted to neighborhoods on local distribution lines. At this point, a transformer mounted on a power pole, in an under-street vault, or on a concrete pad reduces the voltage (to 480V, 240V, or 208V) for consumer use.
Electricity is a function of voltage, current, and resistance. When electricity is transmitted it is referred to in terms of voltage and measured in volts or kilo-volts (kV). Electrical power is measured in Watts. Power is a function of the voltage multiplied by the current. When consumers use electricity, it is usually measured in amperes (Amps) and Watt/hours (Wh). The watt-hour is a function of the power multiplied by the time.
An example of this measurement can be illustrated by using an electric device that demands 1,000 watts. If operated for one-hour would it would theoretically use one kilowatt-hour of energy or 1 kWh. The total of energy used by a home or business is usually measured in kWh.
Electricity Sources
Coal generation plants in NC are primarily supplied with coal from West Virginia and Kentucky delivered by railcar. Hydroelectric generation is driven by rivers in the central and western regions of the State. Interstate pipelines supply natural gas and petroleum products. An extensive transmission and distribution network within the state distributes electricity to consumers. Each utility is responsible for its own maintenance and repair of its respective lines and systems.
Since 2010, a large increase in natural gas usage and a steep decline in coal usage has occurred. Additionally, significant increases in renewable resources and nuclear have displaced coal. Over this period, natural gas generation increased by about 28% while coal use declined by 41%. As illustrated in Figure 3-17 and
Table 3-5, the combined generation from nuclear and natural gas comprise more than 70% of NC’s electricity generation.
Figure 3- 17 Electric Generation
(Source: EIA, 2017)
Nuclear
Petroleum
CoalRenewables
Natural Gas
Hydro
NC Electric Generation Sources –2017
Nuclear=35.7%
Petroleum=3.1%
Coal=14.1%
Renewables=7.3%
NaturalGas=34.4%
Hydro=4.6%

3-18
Generation Source 2010 share or percent (%)
2017 share or percent (%)
Change
Coal 55.9% 14.9% -41
Petroleum 0.2% 0.3% + 0.1
Natural Gas 6.6% 34.4% +27.8
Nuclear 31.7% 35.7% +4
Hydroelectric 3.7% 4.6% +0.9
Other Renewables 1.6% 7.3% +5.7
Table 3-5: NC Electric Generation Comparison by Source 2010 and 2017 (Source: EIA, State Energy Data System,
2017)
All retail electric revenues by sector have risen since 2010, with the most noticeable increases occurring in the residential and commercial sectors, as shown in Figure 3-18.
Figure 3- 18 NC Retail Electric Revenue 1990-2016
(Source: EIA, State Energy Data System)
The cost per kwh for electricity, as shown in Figure 3-19, has risen annually in the residential, commercial, and industrial sectors since 2001.
0
1,000,000
2,000,000
3,000,000
4,000,000
5,000,000
6,000,000
7,000,000
2000 2002 2004 2006 2008 2010 2012 2014 2016
Tho
usa
nd
s o
f D
olla
rs
NC Retail Electric Revenue by Sector, 2000-2016
Other Industrial Commercial Residential

3-19
Figure 3- 19 NC average retail electricity price by sector, 2001-2017
(Source: U.S. EIA State Energy Data System, 2018)
Coal
100% of the coal consumed in NC is imported. Figure 3-20 illustrates the place of origin of NC’s coal imports. Over 99% of all coal imports are transported using rail lines. The primary consumers of coal are the IOUs that use it to generate electricity. The dependency on coal for electrical generation makes rail lines a critical component of NC’s energy infrastructure.
0
0.02
0.04
0.06
0.08
0.1
0.12
2001 2003 2005 2007 2009 2011 2013 2015 2017
$/
KW
H
Residential Commercial Industrial
(Source: EIA, 2007)
West Virginia
66%
Kentucky27%
Virginia4%
Tennessee2%
Maryland1%
Figure 3- 20 Origin of coal for NC generation

3-20
Basics of Nuclear Power
All nuclear power plants (NPP) generate electricity from steam that turns a turbine linked to a generator. The heat needed to turn water into steam results from nuclear fission. The most common fissile fuel is U-235, a natural metallic element found in rocks, soil, and water. The uranium is processed into ceramic pellets that are stacked in bundled fuel rods within the reactor core. When a U-235 atom is struck by a free neutron, it breaks apart into two lighter elements, releasing heat and two to three additional free neutrons. These freed neutrons can then strike additional U-235 atoms, sustaining a chain reaction. This heat is used to boil water and produce steam. Table 3-6 lists NC’s NPPs.
NPP Name Utility Location Capacity (MW) # of Reactors/Type
Brunswick DEP Southport, NC 2,114 2/BWRs
Harris DEP New Hill, NC 900 1/PWR
McGuire DEC Huntersville, NC 2,316 2/PWRs
Table 3-6: List of Nuclear Generation Stations in NC
Brunswick Nuclear Power Plant, Southport, NC
The Brunswick Nuclear Power Plant (NPP), operated by Duke Energy Progress (DEP), has an operating capacity of 2,114 megawatts (MW). Unit 1 was the first NPP built in North Carolina in 1975. When the second unit was added in 1977, the total power increased from 1,8750 MW to 2,114 MW.
Shearon Harris Nuclear Power Plant, New Hill, NC
The Shearon Harris NPP is operated by Duke Energy Progress. Its operating capacity is 900 MW. The station draws water for cooling and steam generation from nearby Harris Lake. It became operational in 1987, and incorporates safety upgrades mandated following the Three-Mile Island accident. Figure 3-21 illustrates the pressurized-water reactor (PWR) design of the station’s single reactor. The PWR design is used in two-thirds of the nation’s nuclear generating fleet.
Figure 3- 21 Diagram of Shearon Harris Nuclear Plant
(Progress Energy)

3-21
In 2008, Duke Energy Progress (DEP) applied to the Nuclear Regulatory Commission (NRC) for the licenses to add two Westinghouse AP1000 reactors to the site. The AP1000 is modern PWR design and is the first NRC-approved Generation III+ design. A diagram of the AP1000 reactor is shown in Figure 3-22. This new generation of reactors incorporates new safety features. In a core shutdown or loss of power event, it is designed to initiate a passive cooling process without operator input or external power. A gravity-fed cooling water tank above the reactor vessel is used to cool the core for up to 72 hours without the need for pumping, external power, or resupply. DEP requested NRC to suspend its license application until further notice, effective January 13, 2017.
McGuire Nuclear Plant, Charlotte, NC
The McGuire NPP is operated by Duke Energy Carolinas (DEC). With an operating capacity of 2,316 MW, the station uses two Westinghouse pressurized water reactors (in service since 1981 and 1984, respectively) to generate steam. The station draws cooling and steam generation water from nearby Lake Norman, NC’s largest man-made lake. Lake Norman, built by Duke Energy in 1963, was created when Duke built the Cowans Ford Hydroelectric Station dam on the Catawba
River. In addition to McGuire, the lake provides cooling water for DEC’s Marshall Steam Station.
Natural Gas Natural gas is an increasingly important part of NC’s energy resource portfolio. In 2008, NC consumed 244,962 MMBtu of natural gas, which accounted for approximately 10% of the state’s total energy use and approximately 1.1% of national consumption. Currently, natural gas is primarily used for electrical generation, climate control (heating), water heating, and cooking. This report focuses on natural gas as it pertains to electricity production. Expanding domestic gas production has decreased its cost relative to other fuel sources, which has contributed to wider adoption as an auxiliary generation fuel. Some commercial, industrial, and electric generators have developed the capability to switch between petroleum and natural gas, allowing them to operate off the most economical fuel at a given time and mitigating some of the price volatility associated with petroleum. Historically, natural gas consumption increased in the colder months along with the need to heat homes and buildings. The summer demand for natural gas may increase as new gas-fired auxiliary plants come online to produce the electricity needed for cooling.
In June 2002, the N.C. General Assembly enacted the Clean Smokestacks Act, officially titled the Air Quality/Electric Utilities Bill (SB 1078), which required significant actual emissions reductions from coal-fired power plants in North Carolina. Under the Act, power plants were directed to reduce nitrogen oxide emissions by 77% in 2009, and sulfur dioxide emissions by
Figure 3- 22 Westinghouse AP1000 Nuclear Reactor Design
(Source: Vollmer, 2011)

3-22
73% in 2013. Combined-cycle gas turbines are more efficient and release fewer emissions than coal-fired generators of similar output. Consequently, IOUs increasingly turn to natural gas to generate electric power. The demand for natural gas has steadily increased over the last 12years. A 54% increase in demand in MWH or MMBTU was observed from 1997 to 1998, and in the period from 2001 to 2002, a 43% increase in demand was observed. A 160% increase in demand was observed during the 10-year period from 1998 to 2008 (EIA, State Energy Consumption Estimates 1960-2007, Table 5, 2009).
Basics of Natural Gas
The natural gas industry includes the production, transmission, and distribution of fuel. These three activities affect the availability, price, and quantity of the final product. NC does not produce any natural gas; rather, it is imported via an interstate pipeline. Frontier Natural Gas Company, Piedmont Natural Gas Corporation (Piedmont) and Public Service Company of North Carolina, Inc. (PSNC) are local distribution companies (LDC) that provide natural gas services within the State.
Natural gas is transported to and within NC through transmission, distribution, and service pipelines. NC receives natural gas via an interstate transmission pipeline that serves much of the east coast. The interstate pipeline moves a large volume of natural gas between several states under very high pressure (200 to 1500 pounds per square inch). Gas destined for NC is transferred to a facility where it may be routed to underground storage, liquefied natural gas (LNG) storage, or rerouted to an intrastate distribution line for delivery to consumers.
Natural gas is measured by volume (cubic feet) and by energy content (British thermal unit or Btu). One Btu is the amount of heat required to raise the temperature of one pound of water from 39° to 40° Fahrenheit. One cubic foot of natural gas contains about 1,031 Btu. Natural gas is usually measured in quantities of thousands of Btu (MBtu) or millions of Btu (MMBtu). For retail sales, natural gas is usually measured in units of therms (th). One therm equals 100,000 Btu (100 MBtu).
Sources of Natural Gas
In 2016, natural gas was predominately produced in Texas, Pennsylvania, Oklahoma, Louisiana, Wyoming, and Colorado. The number two natural gas producer, Pennsylvania, has more than doubled its total output since 2012. Although there is currently no gas production in North Carolina, there may be potential for limited natural gas production in the central piedmont region and along the Atlantic Coast.
Once natural gas is extracted and refined, it is transported using an interstate pipeline. Two interstate pipelines serve NC; the Columbia Gas Transmission Company pipeline and the Williams Transcontinental Gas Pipe Line Corporation (Transco).
The Transco line extends from south Texas on the Gulf Coast, northward through NC, to New York and is the primary source of natural gas to the State. Transco has an extension, the Cardinal Pipeline, that diverts natural gas to the PSNC and Piedmont Natural Gas lines in the city of Burlington. The Cardinal Pipeline is owned and operated by PSNC and Piedmont Natural Gas. A small amount of natural gas is delivered to NC via the Columbia line. Figure 3-23 illustrates the network of gas pipelines in the Southeast Region.

3-23
Pine Needle LNG Company, LLC (a major LNG gas storage facility located in Guilford County) is partially owned by Williams, Piedmont Natural Gas, and PSNC. It is estimated to hold a ten-day supply of natural gas.
The Atlantic Coast Pipeline (ACP) is under construction having obtained all the necessary permits. Scheduled for completion in late 2019, this 600-mile underground natural gas transmission pipeline will transport natural gas from West Virginia to communities in Virginia and eastern NC, terminating in Robeson County. A joint-venture of Dominion Energy, Duke Energy, and The Southern Company, ACP plans pipeline connections to two Dominion Energy plants in Brunswick and Greenville Counties.
Renewable Energy
The EIA defines renewable energy resources as those that are naturally replenished. NC’s renewable energy resources include hydroelectric, solar, wind, wood/wood waste, and biomass.
About 8% to10% of NC’s total energy generation is derived from all renewable resources. In 2007, NC enacted a Renewable and Energy Efficiency Portfolio Standard (REPS) to diversify the State’s energy sources and facilitate renewable energy industry growth. REPS required IOUs to meet 12.5% of retail electricity demand through renewable energy or energy efficiency measures by 2021. Electric Membership Cooperatives (EMC) and municipalities (Munis) must meet a 10% standard by 2018. The NCUC said that electric suppliers have met or are on track to meet 2017’s general REPS requirements https://www.ncuc.net/reports/repsreport2017.pdf .
Hydroelectric
A constant, high volume flow of water is required for hydroelectric generation to be viable. Hydroelectric generation is vulnerable to disruption if the amount of available water declines below certain thresholds. Hydroelectric dams may also adversely affect the fish mobility and other wildlife that reside in lakes and rivers.
Figure 3- 23 Southeast’s Interstate and Intrastate Gas Pipelines
(Source: EIA Office of Oil & Gas, and Natural Gas Division, Gas Transportation Information System)

3-24
Hydroelectric generation stations are generally operated by an IOU. These are typically located in the western and central regions of the State and are in close proximity to a lake, reservoir, or river. In 2012, hydroelectric generation produced only 3,342 MWh of power. However, in 2015, hydroelectric generation rose to 4,731 MW-hours; a 29% increase. Anecdotal evidence suggests that the notable 2012 reduction may have resulted from lower rainfall totals or drought conditions in the respective watersheds.
Conventional Hydroelectric Generation
Conventional hydroelectric generation uses the natural flow of stream or river water as shown in Figure 3-24. Typically, the water is stored by constructing a dam. A controlled volume/flow of water is directed through the dam to drive a generator-connected turbine to create electricity, which flows to the grid in the traditional manner. In 2015, conventional hydro generated 4,731 million kwh, or 78% of NC’s total renewable energy generation.
Figure 3- 24 Conventional Hydroelectric Generation
Pumped-Storage Hydroelectric Generation
Pumped-storage hydroelectric generation is primarily used to provide additional electricity during peak demand periods. Its operation, similar to that of a conventional hydroelectric system, uses water from an elevated reservoir instead of a free-flowing stream to drive the turbine. Water is pumped into the elevated reservoir for storage until it is needed for generation. When additional electricity is required, the water is released to flow through a generator-connected turbine. Figure 3-25 illustrates a pumped-storage generation station. Pumped-storage hydroelectric generation has declined significantly over the past few years however, Duke Energy still operates the Jocassee Hydroelectric Station and Bad Creek Hydroelectric Station pumped-storage plants.

3-25
Figure 3- 25 Pumped Storage Hydroelectric Generation
Solar
Solar energy, derived from the radiant energy of the sun, can be converted into other useful forms of energy such as electricity and thermal energy. Most solar energy installations in NC employ solar photovoltaic (PV) panels to generate electricity or solar thermal plates to heat water. According to the EIA, NC’s solar energy generation capacity has grown from 2 MW in 2008 to a total installed capacity of 3,288 MW in 2016. Only California has more total solar generation capacity than NC.

3-26
Figure 3- 26 Duke Energy Solar Power Projects in North Carolina (Source: Duke Energy, 2018)
There are several large and small-scale solar facilities in the state. Most large-scale solar facilities are in the commercial or industrial sectors, and often in partnership with an IOU. Figure 3-26 illustrates Duke Energy’s current solar power projects that are primarily clustered in northeastern NC. Duke presently owns and operates about 600 megawatts of solar power across its multi-state service territory.
The greatest impediment to solar generation is reliability. Solar energy, an intermittent energy source only available during daylight hours, can be negatively impacted by adverse weather conditions. Batteries, an efficient energy storage mechanism helps to mitigate this disadvantage, are being utilized and this technology is continually improving. Solar PV operates efficiently on sunny summer days and may have potential to reduce the conventional generation needed to meet peak electric demands for needs such as air-conditioning.
Bioenergy
Energy derived from organic sources bioenergy includes anaerobic digestion of animal waste, landfill gas, and wood waste/forest residue; the three most prominent sources in NC. According to the NC Sustainable Energy Association, 75 biogas projects currently operate in NC. The NREL ranks North Carolina #3 in biogas resources; recently the NC Energy Policy Council discussed various opportunities by which greater bioenergy and biogas development might take place in the state. Figure 3-27 shows annual potential U.S. methane biomass generation.

3-27
Figure 3- 27 U.S. Methane Generation Potential from Biomass Resources (Source: National Renewable Energy
Laboratory)
Municipal Solid Waste (MSW)/Landfill Gas (LFG)
Although MSW and LFG account for a very small (less than 0.1%) portion of the overall renewable energy portfolio, the electricity generated by these two sources has increased by approximately 5% annually over the past few years. There are approximately 40 LFG sites, geographically spread across the State in 22 counties.

3-28
Municipal solid waste is converted to biogas by anaerobic digestion; the processes of several microorganisms in an oxygen-free environment. The digestion process breaks down complex organic materials such as carbohydrates, proteins, and lipids, and produces biogas consisting primarily of methane and carbon dioxide. The recovered gas is 60-80% methane, with a heating value of approximately 600-800 Btu/ft3.
Landfill gas is created when organic waste in a MSW in a landfill decomposes. LFG is primarily methane (CH4), the primary component of natural gas, carbon dioxide (CO2), and a small amount of non-methane organic compounds. Instead of allowing LFG to escape into the air, it is captured, converted, and used as an energy source. The methane that would otherwise escape into the atmosphere is instead combusted, producing heat and carbon dioxide. Capturing and burning LFG helps to reduce unpleasant odors, environmental impacts such as local smog and global climate change, and the risk fire due to unintended ignition. Methane is a potent greenhouse gas, with 21 times more heat-trapping potential than CO2. Figure 3-28 illustrates the energy conversion processes.
Wood/Wood Waste
Wood and wood waste includes tree limbs, wood chips, bark, saw dust, and pulp. NC’s net summer capacity for wood and wood-derived fuels was 75 MW in 2009 or about 30% of the total hydroelectric and non-hydroelectric renewable energy capacity. Wood/wood waste operations are located in Charlotte, Faison, Garysburg, Kenansville, Laurinburg, New Bern, Roxboro, and Southport and account for roughly 1% of NC electricity generation.
Wood and wood waste produce steam for electrical generation through direct combustion in stoker boilers and fluidized bed boilers. Stoker boilers feed pelletized fuel onto a travelling grate that passes through a combustion chamber. In a fluidized bed boiler, wood fuel feeds into a bed of sand that is agitated by upward jets of air. The hot bed of moving sand quickly heats the incoming wood fuel, which combusts in the presence of air. Stoker boilers and fluidized bed boilers use the hot combustion gases to generate steam, which then drives a turbine to generate electricity.
Figure 3- 28 Municipal Waste/LFG Power Generation
(Source: rise.org.au)

3-29
In gasification or pyrolysis, biomass undergoes partial combustion in the presence of controlled amounts of oxygen or steam. The products this process are wood char and a combustible gas, the primary combustible components of the gas being hydrogen, carbon monoxide and CH4. This gas can be burned in internal combustion engines or turbines, or in a combined-cycle system that combines the hot exhaust gases from the engine or turbine with hot flue gases from the gasification process to generate steam and utilize the steam in a steam turbine. The efficiency of the combined cycle is generally higher than that of straight combustion approach used in the stoker or fluidized bed boilers.
Wind
Wind turbines are the primary method of generating electricity from wind power. Most turbines consist of a large propeller and generator assembly set atop a tower or mast. As wind turns the propeller, it causes the generator to rotate and generate electricity. An individual turbine may be installed to offset a facility’s electrical demand from the grid, but turbines are more commonly deployed in groups to generate energy that is then fed back into the grid. These multi-turbine installations are known as wind farms.
As shown in Figure 3-29, the National Renewable Energy Laboratory (NREL) has found NC to have some of the strongest onshore and offshore wind energy resources on the Atlantic Coast. Due to a number of studies in recent years, that have evaluated wind farm feasibility for the State, projects have been added to both onshore and offshore generation. In early 2017, a 208-MW onshore wind facility nearElizabeth City was completed byAmazon. Off of the Atlantic shoreacross from Kitty Hawk, a developer(Avangrid Renewables) has purchased an expansive ocean tract where it plans to conduct meteorological assessments in preparation for potential construction and operation of a large offshore wind facility. Companies and organizations facilitating the development of a wind power supply chain are concentrated in the Charlotte, Piedmont, and Research Triangle regions. Additional wind-related operations and logistics (involved in the receiving and transporting of parts for wind generation) may commercially benefit the State’s ports and rail authorities as well.
(Source: NREL, 2015)
Figure 3- 29 North Carolina Offshore Wind Resources at 90 meters above sea level

3-30
Petroleum
North Carolina’s citizens and its economy rely almost exclusively on petroleum as a transportation fuel. Petroleum (motor gasoline and diesel) is essential for producing goods and services, transporting products to market, commuting, and many other aspects of daily life. It is necessary for the delivery of critical support services such as fire protection, emergency medical services, law enforcement, water and wastewater treatment, and sanitation. Petroleum is also used by IOUs as a fuel for auxiliary electric generation.
Petroleum is dependent upon the operation of other energy infrastructures for its effective delivery. Petroleum pipelines must have electricity to maintain pressure and flow rates, and to operate the terminals where fuel is blended and transferred to trucks for ground transport. Gas stations must have electricity to power lift pumps and to complete the electronic financial transactions commonly used to purchase fuel. Tanker trucks must have petroleum to deliver their fuel supplies throughout the State.
Basics of Petroleum
NC does not have the resources or infrastructure required to produce or refine crude oil. Motor gasoline, distillates, aviation fuels, lubricants, and other consumer fuels must be imported. Gasoline is currently the primary petroleum product consumed in NC, predominantly within the transportation sector. NC receives refined petroleum products from the Colonial and Plantation interstate pipelines. The two pipelines enter the state from South Carolina, travel northeastward into Virginia, and then continue northward to serve many northeastern states as far as New York. The pipelines serve terminals in Charlotte, Greensboro, and Selma through feeder lines that branch off the main pipeline. Terminal operators at the three sites extract petroleum to temporarily hold the product in tanks for blending and transportation/distribution. Some portion of the petroleum held in terminal tanks is re-inserted into the pipeline later for transporting to the north to serve other markets.
Most of the finished petroleum products travel throughout the State via commercial tanker trucks that are owned by and/or contracted to large distributors. Marketers, known as “jobbers” operate NC’s petroleum distribution system and transport petroleum products to retailers and consumers across the State. Wholesale jobbers, who work directly with terminal operators, transport the finished petroleum product to local distributors or re-sellers who market it to the public throughout the State. Some jobbers who have contracts with name-branded companies deliver products to that company’s stations only. Other independent jobbers deliver to a variety of unbranded stations. NC petroleum re-sellers may deliver product to either branded or non-branded stations.
The major difference between branded and unbranded re-sellers is that branded re-sellers have delivery contracts with the petroleum supplier. A branded re-seller will normally pay a slightly higher price for products than unbranded re-sellers, with the expectation that when there are curtailments or supply reductions, the petroleum supplier will prioritize re-supply to their contracted re-sellers. The petroleum industry is not regulated, but a defined system of distribution priorities operates within the industry.

3-31
Sources of Petroleum
NC imports 100% of its petroleum via interstate pipelines and at the Port of Wilmington. In 2017, net petroleum imports (imports minus exports) into the U.S. was equal to approximately 19% of its petroleum consumption; the lowest percentage since 1967. This change is closely related to the fracking of oil fields in the northeast and western states. During the past nine years, the U.S. has been the world’s top producer of petroleum, with a 60% increase through 2017. In that same year, EIA reported that approximately 33% of PADD-1’s petroleum came from the OPEC nations of Algeria, Angola, Iraq, Libya, Nigeria, Saudi Arabia, and Venezuela. Since these nations are subject to political instability, NC’s vulnerability to petroleum disruptions caused by geopolitical events may be affected though offset somewhat by our national production.
NC receives almost all of its petroleum supply from two interstate pipelines that carry product from the Gulf Coast to markets in central and eastern NC. Our State and the lower Atlantic states are included in the Petroleum Administration for Defense District-1C (PADD-1C), but our petroleum imports come from PADD-3, located on the Gulf Coast as illustrated in Figure 3-30. PADD-3 pipelines originate near several large Gulf Coast refinery operations, and events affecting them can significantly impact NC petroleum markets.
Figure 3- 30 U.S East Coast (PADD 1) and Gulf Coast (PADD 3) transportation fuel product flows
(Source: EIA)
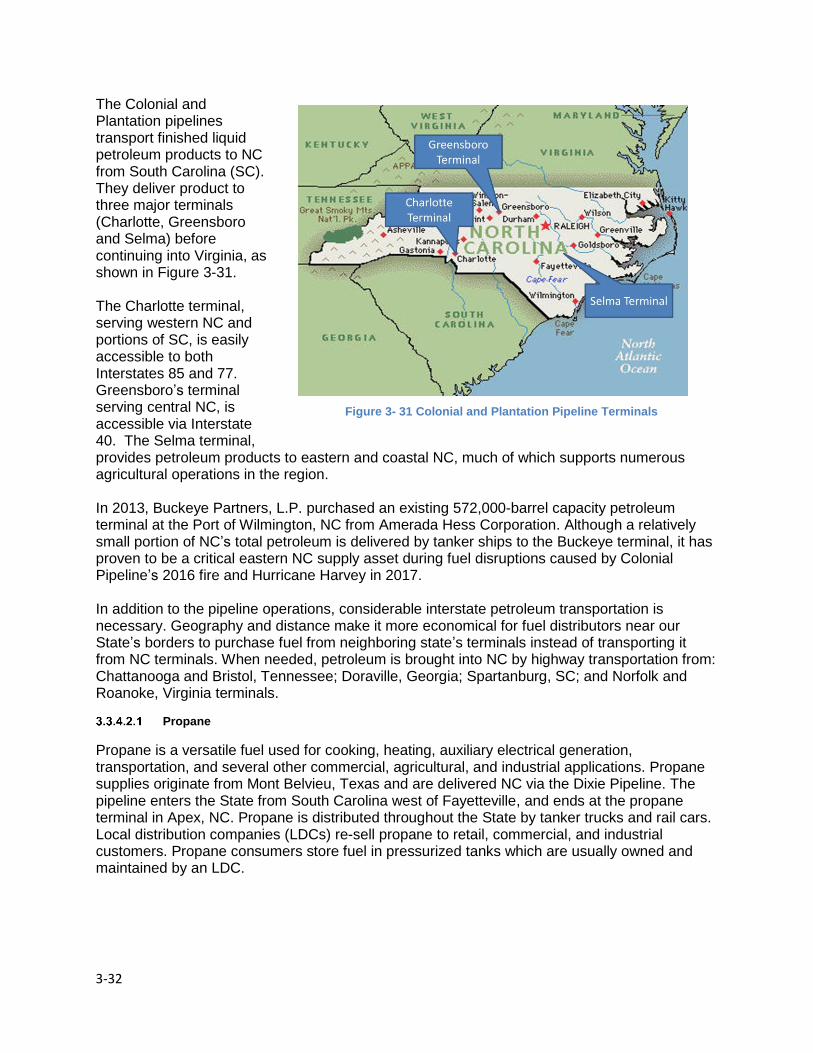
3-32
The Colonial and Plantation pipelines transport finished liquid petroleum products to NC from South Carolina (SC). They deliver product to three major terminals (Charlotte, Greensboro and Selma) before continuing into Virginia, as shown in Figure 3-31.
The Charlotte terminal, serving western NC and portions of SC, is easily accessible to both Interstates 85 and 77. Greensboro’s terminal serving central NC, is accessible via Interstate 40. The Selma terminal,provides petroleum products to eastern and coastal NC, much of which supports numerousagricultural operations in the region.
In 2013, Buckeye Partners, L.P. purchased an existing 572,000-barrel capacity petroleum terminal at the Port of Wilmington, NC from Amerada Hess Corporation. Although a relatively small portion of NC’s total petroleum is delivered by tanker ships to the Buckeye terminal, it has proven to be a critical eastern NC supply asset during fuel disruptions caused by Colonial Pipeline’s 2016 fire and Hurricane Harvey in 2017.
In addition to the pipeline operations, considerable interstate petroleum transportation is necessary. Geography and distance make it more economical for fuel distributors near our State’s borders to purchase fuel from neighboring state’s terminals instead of transporting it from NC terminals. When needed, petroleum is brought into NC by highway transportation from: Chattanooga and Bristol, Tennessee; Doraville, Georgia; Spartanburg, SC; and Norfolk and Roanoke, Virginia terminals.
Propane
Propane is a versatile fuel used for cooking, heating, auxiliary electrical generation, transportation, and several other commercial, agricultural, and industrial applications. Propane supplies originate from Mont Belvieu, Texas and are delivered NC via the Dixie Pipeline. The pipeline enters the State from South Carolina west of Fayetteville, and ends at the propane terminal in Apex, NC. Propane is distributed throughout the State by tanker trucks and rail cars. Local distribution companies (LDCs) re-sell propane to retail, commercial, and industrial customers. Propane consumers store fuel in pressurized tanks which are usually owned and maintained by an LDC.
Figure 3- 31 Colonial and Plantation Pipeline Terminals

3-33
Biofuels
Biofuels reduce, enhance, or displace the use of petroleum as a motor fuel. Its use has increased but is still a very small portion of overall transportation fuel consumption. As an emerging source of energy it will be further discussed in Volume six of this plan. The primary biofuels currently used in NC are ethanol and biodiesel.
Ethanol is alcohol produced from corn using a fermentation and distillation process. It is commonly blended with gasoline to a ratio of 10% ethanol/90% gasoline or E10, or as 85% ethanol/15% gasoline, marketed as E85. Most gasoline-powered vehicles can operate using E10. The “flex-fuel” vehicles can operate using E85 blended fuel. NC imports ethanol via rail transportation to the petroleum terminals where it is blended with gasoline and distributed for resale.
Biodiesel is a form of diesel fuel produced from vegetable oils or animal fats through a process called trans esterification. The most common biodiesel feedstock is soybean oil, but a wide variety of feedstocks can be used depending on availability and cost. It is commonly sold as a blend of biodiesel and petroleum diesel, ranging from B2 (2% biodiesel/98% diesel) to B100 (100% biodiesel). Biodiesel is suitable for use in standard diesel engines, although some recently mandated emissions control equipment is incompatible with higher blends. Several NC companies currently produce biodiesel, using locally sourced feedstocks, for sale to consumers and fleet operators. As a locally produced fuel, biodiesel could enhance the resiliency of NC’s motor fuels portfolio.
Energy Expenditures and Comparative Use
NC’s primary energy consumption consists of petroleum, natural gas, nuclear, or coal, all of which are imported. Figure 3-32 shows energy use by sources from 1960 to 2014. NC used about 2,375 billion Btu’s in 2014.
Figure 3- 32 NC energy use by source, all sectors (Source: U.S. EIA and State Energy Data Systems)
0
500
1000
1500
2000
2500
3000
196
0
196
2
196
4
196
6
196
8
197
0
197
2
197
4
197
6
197
8
198
0
198
2
198
4
198
6
198
8
199
0
199
2
199
4
199
6
199
8
200
0
200
2
200
4
200
6
200
8
201
0
201
2
201
4
Trill
ion
BTU
Petroleum Nuclear Coal Natural Gas Hydro Biomass Solar

3-34
North Carolina’s energy use and expenditures can be seen in Figures 3-33 and 3-34, below.
Figure 3- 33 NC energy use by sector excluding electricity, all sources
(Source: U.S. EIA and State Energy Data Systems)
0
500
1000
1500
2000
2500
300019
60
196
3
196
6
196
9
197
2
197
5
197
8
198
1
198
4
198
7
199
0
199
3
199
6
199
9
200
2
200
5
200
8
201
1
201
4
Trill
ion
BTU
Residential Commercial Industrial Transportation Electricity
Residential$7.9B
Commercial$5.3B
Industrial$4B
Transportation$16.3B
Figure 3- 34 NC expenditures by sector (billions of dollars) including electricity, 2015
(Source: EIA, State Energy Data)

3-35
Residential Sector
The residential sector uses a variety of energy sources. Figure 3-35 (below) illustrates that the residential consumption of coal, distillate fuel oil, and kerosene has declined over time. Conversely, the consumption of electricity and natural gas has increased significantly.
Figure 3- 35 NC residential energy consumption by source
(Source: U.S. EIA, State Energy Data System)
0
50
100
150
200
250
300
350
400
196
0
196
2
196
4
196
6
196
8
197
0
197
2
197
4
197
6
197
8
198
0
198
2
198
4
198
6
198
8
199
0
199
2
199
4
199
6
199
8
200
0
200
2
200
4
200
6
200
8
201
0
201
2
201
4
Trill
ion
BTU
Coal Natural Gas Distillate Kerosene LPG Biomass Electricity

3-36
Figure 3-36 illustrates NC’s 2015 residential energy expenditures. Though energy costs have risen over time, cost fluctuations (possibly impacted by weather and higher efficiency standards) have occurred.
While energy costs have risen for most energy sources, the largest increases occurred in retail electricity, natural gas, and liquefied propane gas (LPG). The EIA reports that residential sector saw significant electric energy use increases from 1997 to 2010 (about 92%), but from 2010 to 2015 residential sector use declined by about 7%. Lower electricity use may be attributed to higher energy efficiency standards in the sector. Natural gas use from 1997 to 2010 increased by about 96%, but declined by about 15% in 2015 when compared to 2010 consumption. LPG use increased approximately 173% from 1997 to 2010, but fell by about 33% from 2010 to 2015. Changes in total energy use may be attributed to higher efficiency standards, weather conditions, and increasing energy costs. Residential consumption has been and continues to be affected by the total number of households, the growth of entertainment devices, wireless routers, cell phone chargers, and similar standby electrical products.
Commercial Sector
The commercial energy sector’s profile, similar to that of the residential sector, primarily relies on electricity, natural gas, and petroleum. Figure 3-37 describes the sector’s energy expenditures for 2015.
(Source: U.S. EIA, State Energy Data, Price and ExpenditureEstimates)
$747
$160$14
$421$48
$6,532
Natural Gas Distillate
Kerosene LPG
Wood Retail Electricity
Figure 3- 36 NC 2015 residential energy expenditures (millions of dollars) by source.

3-37
Figure 3- 37 NC commercial energy expenditures (millions of dollars) by source, 2015 (Source: U.S. EIA, State
Energy Data, Price and Expenditure Estimates)
As shown above, retail electricity accounted for over three-quarters of the sector’s energy expenditures. This is an indication of the commercial sector’s reliance on electricity, and suggests the sector is particularly vulnerable to electrical supply disruptions.
As seen in Figure 3-38, annual commercial sector energy use has risen steadily for several years, with significant increases in retail electricity and natural gas consumption.
Figure 3- 38 NC Commercial Energy Use 1975-2015 (Source: EIA, State Energy Prices and Expenditures)
$4
$57
$7
$7$20
$3$1
$165
Coal Natural Gas Distillate Fuel LPGMotor Gasoline Biomass Solar Retail Electricity
0
50
100
150
200
250
300
1975 1980 1985 1990 1995 2000 2005 2010 2015
North Carolina Commercial Energy Use in Trillion of Btus 1975-2015
Retail Electricity Natural Gas Petroleum Coal Biomass

3-38
The Industrial Sector The industrial sector accounts for about 22% of NC’s annual energy consumption. In 2015, the primary industrial sector energy expenditures were for natural gas, electricity, and biomass as shown in Figure 3-39.
Figure 3- 39 NC industrial energy expenditures (millions of dollars) by source, 2015
(Source: U.S. EIA, State Energy Data System, Price and Expenditure Estimates)
Figure 3-40 illustrates the diversity of the industrial sector’s energy profile. Changes in the cost of energy can have dramatic impacts on the market competitiveness of industrial activities since energy often constitutes a significant portion of production costs. Although the sector derives some resiliency by using multiple forms of energy, individual industries, often dependent on a single energy source, may not have the ability to fuel switch. The sector’s energy consumption has declined from 787 trillion Btu’s in 1995 to 545 trillion Btu’s in 2015. NC’s transition from a manufacturing economy to a knowledge-based one most likely affected the change.

3-39
Figure 3- 40 NC Industrial Sector Energy Use 1975-2015 (Source: EIA, State Energy Data System)
Transportation Sector
The transportation sector is almost entirely dependent on petroleum as a source of energy. Figure 3-41 shows the sector’s petroleum expenditures in 2015. Most of NC’s motor vehicles are powered by motor gasoline followed by distillate or diesel fuel. Jet fuel consumes the smallest portion of our transportation sector costs.
Figure 3- 41 NC transportation sector energy expenditures (millions of dollars) by source, 2015 (Source: EIA)
Figure 3-42 indicates that the transportation sector’s fuel consumption has increased by about 65% over the last 40 years. In 2015, motor vehicle fuels accounted for 96% of the transportation sector’s energy consumption. Petroleum consumption has decreased by about
1975 1980 1985 1990 1995 2000 2005 2010 2015
North Carolina Industrial Energy Use in Trillion of Btus 1975-2015
Retail Electricity Natural Gas Petroleum Coal Biomass
$151
$21
$517
Distillate Fuel
Jet Fuel
Motor Gasoline

3-40
6% from 2005 to 2015. During the same period, jet fuel usage decreased 55%, and diesel fuel decreased 6%.
Figure 3- 42 NC Transportation Sector Energy Use 1975-2015
(Source: EIA, State Energy Data System)
Figure 3-43 illustrates the transportation sector cost increases and cost declines over the past 40 years. From 2010 to 2015, motor gasoline costs have been trending downward because of lower fuel prices and an increasing number of more fuel-efficient vehicles on the road. Going forward, transportation fuels costs will most likely continue to oscillate because of the increase in U.S. fuel production and the potential impact of world-wide geopolitical issues on fuel supplies.
1975
1980
1985
1990
1995
2000
2005
2010
2015
North Carolina Transportation Sector Energy Use in Trillion of Btus 1975-2015
Residual Fuel Oil Motor Gasoline Lubricants LP Gas
Jet Fuel Distilate Fuel Oil Aviation Fuel Natural Gas

3-41
Figure 3- 43 NC Transportation Sector Energy Cost 1975-2015
(Source: EIA, State Energy Data System)
$0 $100 $200 $300 $400 $500 $600 $700 $800
1975
1980
1985
1990
1995
2000
2005
2010
2015
North Carolina Transportation Sector Costs in Millions of Dollars 1975-2015
Natural Gas Aviation Fuel Distilate Fuel Oil Jet Fuel
LP Gas Lubricants Motor Gasoline Residual Fuel Oil

3-42
Bibliography
Anguelov, C., Hilgert, M., & Hogarth, J. (2004). U.S. Consumers and Electronic Banking, 1995-2003. U.S. Federal Reserve: https://core.ac.uk/download/pdf/6825641.pdf
Appalachian State University. (2011). North Carolina Wind Energy. Retrieved from Wind Maps and Resource Assessment: http://www.wind.appstate.edu/resources/wind-maps-and-resource-assessment
Argonne National Laboratory. State Energy Resilience Framework, Global Security Sciences Division, prepared by J. Phillips, M. Finster, J. Pillon, F. Petit, and J. Trail (2016): https://www.energy.gov/sites/prod/files/2017/01/f34/State%20Energy%20Resilience%20Framework.pdf
Colonial Pipeline. (2018). Owners and Customers, from About Colonial: http://www.colpipe.com/home/about-colonial/owners
Dominion Energy. (2018). Electric Generating Stations, from Dominion Corporate: https://www.dominionenergy.com/about-us/making-energy
Duke Energy. (2018). Franchised Electric Utilities, from Duke Energy: https://www.duke-energy.com/our-company/about-us/power-plants
Duke Energy. (2018). North Carolina Solar Distributed Generation, from Duke Energy: https://www.duke-energy.com/our-company/environment/renewable-energy/solar-energy
Duke Energy, LLC. (2010). Service Area Map. Retrieved July 13, 2010, from Duke Enery: https://www.duke-energy.com/_/media/pdfs/our-company/duke-energy-fast-facts.pdf?la=en
Duke University Markets & Management Capstone Course. (2006). North Carolina and the Global Economy, from Duke University Markets & Management Capstone Course: http://www.soc.duke.edu/~ggere/web/mms190.pdf
Durkin, T. (2000). Credit Cards: Use and Consumer Attitudes, 1970-2000, from U.S. Federal Reserve: https://www.federalreserve.gov/pubs/bulletin/2000/0900lead.pdf
Electricities. (2018). About ElectriCities, from Electricities: http://www.electricities.com/Default/AboutUs/AboutElectriCities.aspx
Electricities. (2018). Electricities Map of NC Members: http://www.electricities.com/Default/AboutUs/ElectriCitiesMembership/MapofMembershipinNC.aspx
French Broad Electric Membership Corporation. (2018) Welcome, from French Broad Electric Membership Corporation: http://www.frenchbroademc.com/
Google. (2018). Google Maps: https://www.google.com/maps

3-43
Hotz, R. L., & Levitz, J. (March 29, 2011). Environment & Science, from The Wall Street Journal: http://online.wsj.com/article/SB10001424052748704471904576228833487550772.html
Kinder Morgan. (2018). Corporate Profile and System Map: https://www.kindermorgan.com/about_us
Lochbaum, D. (2010). Regulatory Roulette: The NRC's Inconsistent Oversight of Radioactive Releases from Nuclear Power Plants, From Union of Concerned Scientists: https://www.ucsusa.org/sites/default/files/legacy/assets/documents/nuclear_power/nuclear-power-radioactive-releases.pdf
Montopoli, B. (2011). Poll:Support for new nuclear plants drops, CBS News: https://www.cbsnews.com/news/poll-support-for-new-nuclear-plants-drops/
National Renewable Energy Laboratory. (2016). Biomass: https://www.nrel.gov/gis/biomass.html
National Weather Service. (2011). Storm Prediction Center, from NOAA: https://www.spc.noaa.gov/
NC Electric Cooperatives. (2018). North Carolina Electric Cooperatives, from NC Electric Cooperatives: https://www.ncelectriccooperatives.com/our-members/
NC Public Power. (2018). North Carolina Eastern Municipal Power Agency, from NC Public Power: http://www.ncpublicpower.com/AboutUs/NCEMPA.aspx
NC Public Power. (2018). North Carolina Municipal Power Agency Number 1: https://www.electricities.com/public-power/the-value-of-public-power/
North Carolina Department of Commerce (NCDOC). (2018). Business Services: https://www.nccommerce.com/business
NCDOC. (2018). North Carolina Public Utilities Laws and Regulations, from Department of Commerce, NC Utilities Commission: http://www.ncuc.net/ncrules/rulstoc.html
North Carolina Department of Environmental Quality (DEQ/DENR). (2018). DAQ, Air Legislation Reports: https://deq.nc.gov/about/divisions/air-quality/air-quality-data/air-legislation-reports
North Carolina Public Staff. (ND). Items of Interest, from NC Public Staff - Utilities Commission: http://www.pubstaff.commerce.state.nc.us/psngas/index.html
North Carolina Utilities Commission (NCUC). (2018). NC Rules Chapter 8, from NCUC: https://www.ncuc.net/ncrules/Chapter08.pdf
NCUC. (2017). Annual Report Regarding Renewable Energy and Energy Efficiency Portfolio Standard in North Carolina: https://www.ncuc.net/reports/repsreport2017.pdf
Piedmont Natural Gas. (2010). Service Area Map, from Piedmont Natural Gas: http://www.piedmontng.com/about/aboutpng/servicearea/home.aspx

3-44
Duke Energy-Progress (DEP, formerly Progress Energy). (2018). NC and SC Service Area: https://www.duke-energy.com/_/media/pdfs/our-company/duke-energy-fast-facts.pdf?la=en
DEP. (2018). Power Plants: https://www.duke-energy.com/our-company/about-us/power-plants
PSNC Energy. (2018). Service Area Map: http://www.psncenergy.com/en/residential-services/service-area-map/
U.S. Census Bureau. (2017). North Carolina Quick Facts: https://www.census.gov/quickfacts/fact/table/nc/PST045217
Census Bureau. (2016). American Community Survey: https://factfinder.census.gov/faces/nav/jsf/pages/searchresults.xhtml?refresh=t#
U.S Department of Energy (DOE). (2018). What the Smart Grid Means to You and the PeopleYou Represent: https://www.energy.gov/oe/downloads/what-smart-grid-means-you-and-people-you-represent
U.S. DOE. (2011). Buildings Energy Data Book-Commercial Sector Energy Consumption: https://openei.org/doe-opendata/dataset/buildings-energy-data-book
U.S. DOE. (2010). Hardening and Resiliancy: https://www.oe.netl.doe.gov/docs/HR-Report-final-081710.pdf
U.S. DOE. (2018). U.S. Petroleum Reserves: http://fossil.energy.gov/programs/reserves/spr/
U.S. Energy Information Administration (EIA). (2016). Updates by Energy Source, State Energy Data System (SEDS), Total Petroleum Price and Expenditure Estimates by Sector: http://www.eia.doe.gov/emeu/states/hf.jsp?incfile=sep_fuel/html/fuel_pr_pa.html
EIA. (2012). Commercial Buildings Energy Consumption Survey: http://www.eia.doe.gov/emeu/cbecs/cbecs2003/detailed_tables_2003/detailed_tables_2003.html#enduse03
EIA. (2016). Annual Destribution Report: http://www.eia.doe.gov/cneaf/coal/page/coaldistrib/2007/d_07state.pdf
EIA. (2016). North Carolina Energy Profile: https://www.eia.gov/state/?sid=NC
EIA. (1960-2015). State Energy Data System (SEDS): Consumption Estimates, and Energy Prices and Expenditures Estimates: https://www.eia.gov/state/seds/seds-data-complete.php?sid=US
EIA. (2018). Annual Energy Outlook: https://www.eia.gov/outlooks/aeo/
EIA. (2018). Glossary: http://www.eia.doe.gov/glossary/index.cfm?id=C
EIA. (2018). Natural Gas Consumption End Use: http://www.eia.doe.gov/dnav/ng/ng_cons_sum_dcu_SNC_m.htm

3-45
EIA. (2016). International & Interstate Movements of Natural Gas by State: http://www.eia.gov/dnav/ng/ng_move_ist_a2dcu_SNC_a.htm
EIA. (2018). Natural Gas Prices: http://www.eia.doe.gov/dnav/ng/ng_pri_sum_dcu_SNC_m.htm
EIA. (2010). North Carolina Renewable Electricity Profile: https://www.eia.gov/renewable/state/NorthCarolina/
EIA. (2018). Petroleum Navigator, Prices, Retail Prices: http://www.eia.doe.gov/dnav/pet/pet_pri_gnd_dcus_r1z_w.htm
EIA. (2018). Petroleum Navigator, Prices, Spot Prices: http://www.eia.doe.gov/dnav/pet/pet_pri_spt_s1_d.htm
EIA. (2018). Prime Supplier Sales Volumes: http://www.eia.doe.gov/dnav/pet/pet_cons_prim_dcu_SNC_m.htm
EIA. (2016). North Carolina State Energy Profile Overview: http://www.eia.doe.gov/state/state_energy_profiles.cfm?sid=NC#overview
EIA. (2015). Residential, Commercial, Industrial and Transportation Sector Energy Expenditure Estimates; State Energy Data System (SEDS): http://www.eia.gov/state/seds/hf.jsp?incfile=sep_sum/html/sum_ex_com.html
EIA. (2017). PAD District Imports by County of Origin, Petroleum & Other Liquids: http://www.eia.gov/dnav/pet/pet_move_impcp_a2_r10_ep00_ip0_mbbl_a.htm
EIA. (2017). U.S. Crude Oil Supply & Disposition (Annual): http://www.eia.gov/dnav/pet/pet_sum_crdsnd_k_a.htm
EIA. (2015). Monthly Disturbance Events: https://www.eia.gov/electricity/data/disturbance/disturb_events_archive.html
EIA. (2009). Updates by Energy Source, State Energy Data System (SEDS), Table F11b: Total Petroleum Price and Expenditure Estimates by Sector, 2008: http://www.eia.doe.gov/emeu/states/hf.jsp?incfile=sep_fuel/html/fuel_pr_pa.html

i
Volume 4 - Energy Supply Disruption Overview Volume 4 - Energy Supply Disruption Overview…………………………………………………i
Table of Contents ..................................................................................................................... i
4. Energy Supply Disruption Overview ................................................................................... 4-1
4.1 Introduction ....................................................................................................................... 4-1
4.2 Dependencies .................................................................................................................. 4-1
4.3 Policies ............................................................................................................................. 4-2
4.4 Energy Tracking and Monitoring ...................................................................................... 4-3
4.5 Tracking Procedures ........................................................................................................ 4-9
4.6 Energy Assurance Coordination ..................................................................................... 4-10
Bibliography ............................................................................................................................. 4-12
Tables of Figures
Figure 4-1 Reporting Channels .................................................................................................. 4-3
Figure 4-2 Average Petroleum Prices ........................................................................................ 4-4
Figure 4-3 Crude Oil Spot Prices ............................................................................................... 4-5
Figure 4-4 Monthly Average Spot Pricing of Refined Crude...............................................…....4-5
Figure 4-5 Coal Spot Prices ....................................................................................................... 4-7
Figure 4-6 Total Coal Consumption 1960-2015 ......................................................................... 4-7
Figure 4-7 Natural Gas Prices by Consumer Sector .................................................................. 4-8
Figure 4-8 Natural Gas Consumption by Consumer Sector ...................................................... 4-9

4-1
Energy Supply Disruption Overview
Introduction Access to reliable and affordable energy is essential to sustaining North Carolina’s (NC)
economy and technologically dependent society. The State Energy Office (SEO) endeavors to
identify and track potential and active energy disruptions that could affect citizens. The SEO
strives to collect data on energy disruptions for analysis and to understand the possible
consequences of disruptions for the State. This volume details an overview of potential energy
supply disruption events and actions associated with these events.
Dependencies
Energy disruptions can be categorized into four categories or interdependencies: cyber,
geographic, logical, and physical. Each of the categories can have distinct impacts on NC’s
energy availability.
Cyber-interdependencies
Cyber-interdependencies exist when systems or infrastructure depend on information
technology (IT) to sustain operations. Degradation of IT systems threaten the State’s
ability to communicate, to control IT-enabled infrastructure, and to engage in
electronic commerce. Over the past 25 years, NC has transitioned from a traditional
economy based on tobacco, furniture, and textiles to an economy driven by
knowledge- and service-based enterprises. This new economy includes advanced
manufacturing, software and information technology, biopharmaceuticals, and
financial services. It is expected that these sectors and their associated energy
demand will continue to grow, as NC competes in the global economy. A
considerable amount of energy is required to operate the computers, servers, and
communications infrastructure for these sectors. If the State’s electronic commerce
or IT communication systems are significantly degraded, the State could suffer
considerable economic losses.
Geographic Interdependencies
Geographic interdependencies exist when systems or infrastructure depend on a
common corridor to transport energy inputs or outputs. Examples of these common
corridors include petroleum pipelines, electric transmission lines, telephone lines,
railways, and highways. Almost all of the State’s energy resources are imported.
Fuel for transportation, coal, and nuclear material for electric generation and natural
gas and propane are transported to NC from other states or countries. Historically,
events in other countries and states have affected the availability and cost of NC’s
energy. Geopolitical instability, as was seen in the Middle East and North Africa
since 2011, can affect global markets and, consequently, fuel prices locally. Natural
disasters, such as hurricanes in the Gulf Coast, are likely to disrupt or slow-down
refinery and pipeline operations. In 2005, NC experienced a petroleum supply
4

4-2
shortage after Hurricanes Katrina and Rita shut down refinery and pipeline
operations for an extended period of time. More recent events, such as the Colonial
Pipeline leak in 2016 and Hurricane Harvey in 2017, reduced access to motor fuels
from Gulf Coast refineries. Because NC’s energy sector is dependent on fuel
supplies from outside of the state, the SEO regularly monitors global, national,
regional, and local issues that could affect the common corridors through which
energy is imported into the state.
Logical Interdependencies
Logical interdependencies describe how financial markets connect different parts of
the energy sector. Commerce in NC is affected by intrastate and national financial
markets. Several financial institutions that are headquartered in NC include
Charlotte’s Bank of America, New Dominion Bank, Carolina Premier Bank, and
Winston Salem’s Branch Banking and Trust Company. Disturbances in the global
financial market can have significant effects on North Carolina’s economy. The
global financial crisis of 2008-2009 directly affected some of the financial institutions
within the State, and the constriction of credit markets affected businesses and
consumers nationwide. Energy costs are influenced by many factors in the financial
system including the value of the U.S. dollar, the state of credit markets, and futures
speculation. Petroleum markets are especially subject to market volatility because
oil is traded globally in U.S. dollars, and therefore its value fluctuates along with
currency exchange rates. The lower the value of the dollar, relative to other
currencies, the more affordable petroleum is to overseas consumers and this
increases global demand. The SEP monitors global, national, and regional news to
identify developments that may affect NC’s energy markets.
Physical Interdependencies
Physical interdependencies exist when one sector of the energy system requires the
outputs of another system to operate. The infrastructure for distributing fuel and
energy in the State relies upon a number of physical interdependencies. For
example, the petroleum distribution system requires electricity to operate pipeline
pumping stations and the lift pumps at retail gas stations. Coal used in coal-fired
generation plants to produce some of NC’s electricity is delivered here by rail on
diesel-powered locomotives.
Policies The SEO strives to ensure a sustainable energy future for NC citizens by administering energy
assurance programs and providing energy-related technical expertise. These actions are
intended to: improve our energy resiliency; advance energy efficiency in the public sector;
encourage the growth and development of our energy economy; and to help NC become a
leader in the creation of green jobs.
In addition to our working within the Department Environmental Quality (DEQ), the SEO also
regularly communicates with staff in other government agencies such as the NC Utilities

4-3
Commission (NCUC) and the Department of Public Safety’s Division of Emergency
Management (EM). Through this interaction, the SEO seeks to obtain and share information
regarding any ongoing or potential disruptive energy event. Additionally, SEO developed
relationships with private sector entities that operate NC’s energy infrastructure. These close
relationships allow SEO to facilitate information sharing and collaboration to enhance the
resiliency and security of NC’s energy supply.
Public utilities in NC are required to report to the NCUC any essential information regarding the
status of transmission, generation, distribution systems, and any disruptive events and
restoration efforts. Public utilities must report to DEQ on environmental monitoring and to EM on
homeland security concerns. Public utilities are not required to share information with the SEO.
The NCUC, DEQ, and EM maintain most of the information to meet reporting requirements. The
SEO strives to strengthen existing working relationships with entities to improve data sharing,
maintain communications, and to meet our reporting responsibilities without additional reporting
requirements on the public utilities.
Figure 4-1 Reporting Channels
Energy Tracking and Monitoring The State Energy Office (SEO) tracks and monitors the energy markets within the State and
surrounding region. If abnormalities in the normal behavior of the energy landscape
Governor
Department of
Environmental
Quality
Department of
Crime Control
and Public Safety
Department
of Commerce Utilities
Commissions
Public Utilities
Division of
Emergency
Management
Required reporting
Optional reporting
State Energy
Office
Public Staff
North Carolina Energy Reporting Channels

4-4
surface, the SEO will communicate with the energy providers to determine the cause of the
situation and what action, if any, can be taken to reduce or mitigate the abnormality. The SEO’s
analysis is communicated through the SEO Program Manager to DEQ’s Energy Director who
then communicates energy-related information to the DEQ management, the Energy Policy
Council and other entities of interest. The SEO Manager alerts decision-makers to potential
events that may or may not cause an increase in energy prices or a decrease in energy supply.
The SEO monitors the energy sector by tracking energy consumption and production
information from a variety of sources collected and analyzed in previous years for NC. The data
collection examines energy use by sector (commercial, industrial, residential, and
transportation) as well as source (coal, natural gas, petroleum, retail electricity, and renewable
resources). The SEO applies this historical data to establish a baseline of energy usage,
determine trends, and identify dependencies. As new data is acquired, it is incorporated with
existing data to identify trends or indications that an energy emergency may be imminent. The
frequency of data collection is based upon its availability and the information needs of DEQ
leadership.
Petroleum
NC is wholly dependent upon interstate pipeline operations for its petroleum supply. The
SEO closely monitors the petroleum market to track trends by watching data from the Oil
Price Information Service (OPIS), several news feeds, and consumer fuel prices as
indicated in Figure 4-2. Spot market prices are illustrated in Figures 4-3 and 4-4. The
refinery and pipeline operations that support the Colonial and Plantation pipelines are
also monitored by the SEO.
Figure 4-2: U.S. average gasoline and diesel prices, 2003 – 2018. (Source: U.S. EIA https://www.eia.gov/dnav/pet/pet_pri_gnd_dcus_nus_m.htm)
1.50
2.00
2.50
3.00
3.50
4.00
4.50
5.00
PR
ICE
($)
Regular Midgrade Premium Diesel

4-5
Figure 4-3: Monthly average spot pricing of crude, U.S. (West Texas Intermediate/WTI) and European (Brent) estimates (Source: EIA https://www.eia.gov/dnav/pet/pet_pri_spt_s1_m.html)
Figure 4-4: Monthly average spot pricing of refined crude product, U.S. estimates. (Source: U.S. EIA https://www.eia.gov/dnav/pet/pet_pri_spt_s1_m.html)
20
40
60
80
100
120
140P
rice
($
/ B
arre
l)
WTI Brent
0
0.5
1
1.5
2
2.5
3
3.5
Jan
-08
Jul-
08
Jan
-09
Jul-
09
Jan
-10
Jul-
10
Jan
-11
Jul-
11
Jan
-12
Jul-
12
Jan
-13
Jul-
13
Jan
-14
Jul-
14
Jan
-15
Jul-
15
Jan
-16
Jul-
16
Jan
-17
Jul-
17
Jan
-18
Pri
ce (
$ /
gal
lon
)
NY Harbor US Gulf Coast

4-6
4.4.1.1 External Factors Affecting Petroleum Supply
Pipelines that deliver NC’s petroleum supplies originate in Texas and Louisiana,
and pass through several states on their way here. Severe weather in the Gulf of
Mexico can disrupt refinery and pipeline operations, reducing or curtailing the
flow of petroleum to NC. Severe weather within the State can disrupt petroleum
supplies by damaging terminals, preventing ground transportation, or resulting in
power outages that impede retail fuel sales. The SEO maintains awareness of
possible severe weather by monitoring local (Wilmington, Morehead City and
Raleigh), regional, national, and global weather events.
NC’s petroleum supply may also be influenced by geopolitical instability or events
in oil-producing nations. The U.S. imports crude oil from around the world used to
produce finished petroleum products (EIA, 2017 and EIA, 2011). We receive
petroleum products from PADD-3, which sources more than 33% of its imports
from OPEC member nations (EIA, 2017 and EIA, 2011). The SEO monitors for
potential disruptions of domestic petroleum supplies by following news from local,
regional, national and international media outlets for events that may affect the
volume and price of petroleum imports.
The SEO monitors several information streams to maintain situational awareness
of national petroleum markets and prices within the state, such as the Wall Street
Journal for market data on Crude Oil futures and cash prices for refined products.
The EAPM also collects petroleum industry news from sources including OPIS
and statistical information made available on EIA’s website.
Electricity Monitoring
Electricity, an essential part of NC’s energy profile, is consumed by every sector of the
State’s economy, and is also required to provide and distribute other forms of energy.
Maintaining awareness of issues that may affect electric generation, transmission, and
distribution systems is a fundamental responsibility of the SEO’s role in the Energy
Assurance Plan. The SEO monitors electrical generation inputs and the transmission
and distribution infrastructure needed to deliver electricity to end users. Monitoring is
done to identify potentially disruptive situations before they interrupt normal operations.
4.4.2.1 Coal Generation
Coal is no longer the primary source of energy used to generate electricity in NC,
comprising about 14% of the energy-source mix as compared to nuclear energy
(36%) and natural gas (34%). The EIA stopped reporting annual/monthly coal
prices in 2011 (see Figure 4-5), but it does provide NC’s historical coal
consumption as illustrated in Figure 4-6.

4-7
Figure 4-5: Coal Spot Prices (Source: EIA)
Figure 4-6: Total N.C. coal consumption (millions of short tons), all sources.
(Source: EIA State Energy Data System)
4.4.2.2 Coal Supply
NC imports coal from other states and depends upon external factors affecting
those states and the rail systems that transport coal to our generation plants. As
such, the SEO monitors weather events that may either disrupt rail operations or
damage rail infrastructure.
$0.00
$20.00
$40.00
$60.00
$80.00
$100.00
Do
llars
pe
r Sh
ort
To
n
Coal Spot PricesSource: http://www.eia.gov/coal/news_markets/
Cent App
North App
0
5
10
15
20
25
30
35
40
1960 1965 1970 1975 1980 1985 1990 1995 2000 2005 2010 2015
Mill
ion
of
sho
rt t
on
s

4-8
A map of the railroads is linked here and freight lines are represented on this
interactive freight map. CSX and Norfolk Southern are two of the major rail lines
that serve NC.
4.4.2.3 Natural Gas Generation
Electric utility producers in NC have increased natural gas for primary,
intermediate, and auxiliary power generation. Natural gas has achieved greater
market penetration in the residential sector as well. As such, the SEO monitors
industry news sources to maintain awareness of the flow, stock, and price of
natural gas. The SEO also monitors weather events that may affect natural gas
sector operations or negatively impact consumer demand for natural gas.
4.4.2.4 Pipeline Supply
The SEO monitors inter- and intra-state pipelines, including the Dixie Pipeline
(propane), the Transco Pipeline and Colonial Pipeline (both natural gas), and
local distribution companies (LDC) such as Frontier, PSNC, Piedmont and
TOCCOA. To stay informed about industry activities, the SEO maintains
relationships with NC providers/distributors, and trade associations such as NC
Propane Gas Association (NCPGA).
Average annual natural gas prices have decreased since peaking in 2006 (see
Figure 4-7). Significant U.S. shale discoveries and increased horizontal drilling
and hydraulic fracturing have most likely contributed to the decline in price.
Figure 4-7: Average annual natural gas price by sector in N.C.
(Source: U.S. EIA https://www.eia.gov/state/seds/seds-data-complete.php?sid=NC#Consumption)
0
2
4
6
8
10
12
14
16
18
19
70
19
72
19
74
19
76
19
78
19
80
19
82
19
84
19
86
19
88
19
90
19
92
19
94
19
96
19
98
20
00
20
02
20
04
20
06
20
08
20
10
20
12
20
14
Do
llars
per
Mill
ion
BTU
Residential Commercial Industrial

4-9
As seen in Figure 4-8, NC’s annual natural gas consumption has almost doubled since 2008.
This increase is primarily driven by its use for electric power generation.
Figure 4-8: Average monthly natural gas consumption by sector in N.C.
(Source: U.S. EIA https://www.eia.gov/dnav/ng/ng_cons_sum_dcu_SNC_m.htm).
Tracking Procedures
The SEO continues to maintain and improve communications processes with State agencies,
public utilities, and other energy entities serving NC. The proposed procedures are as follows:
1) The SEO will maintain continual energy situational awareness by:
a. Monitoring various news sources and media outlets
b. Communicating with local, state, federal governmental agencies, and public
sector entities about energy assurance (EA) issues
c. Developing an energy-related stakeholder notification contact list
d. Contacting appropriate organizations on the EA list if/when a potential or actual
energy disruption is identified
e. Maintaining and updating the EA list in both electronic and paper formats
2) The SEO will contact the appropriate agency or entity upon detection of an energy
disruption to gather the following information:
a. Entity/source impacted
0
10000
20000
30000
40000
50000
60000
70000
Jan
-20
08
Jul-
20
08
Jan
-20
09
Jul-
20
09
Jan
-20
10
Jul-
20
10
Jan
-20
11
Jul-
20
11
Jan
-20
12
Jul-
20
12
Jan
-20
13
Jul-
20
13
Jan
-20
14
Jul-
20
14
Jan
-20
15
Jul-
20
15
Jan
-20
16
Jul-
20
16
Jan
-20
17
Jul-
20
17
Jan
-20
18
Mill
ion
cu
bic
fee
t (M
Mcf
)
Residential Commercial Industrial Electric Power

4-10
i. Cause of event
ii. Number of customers/residents impacted
iii. Identify ongoing concerns
iv. Cascading issues
v. Response
vi. Information sharing efforts
b. Actions taken by state/regional/local government
i. Response actions taken (example: fire department response)
ii. Interactions with media
iii. Recommendations for voluntary or involuntary curtailment measures
3) The SEO will collect and report the following information:
a. Event trigger (time, date, and location)
b. Estimated time required for response measures (e.g., time to put out fire)
c. Initial assessment of the event
d. Estimated time required for restoration of services
e. Estimated time for recovery (return to normal operations)
f. Predicted duration of event (timeline)
g. Impact on resource reserves
h. Investigation of event
Energy Assurance Coordination The SEO Energy Assurance Manager serves as energy assurance coordinator and reports to
the SEO Program Manager under DEQ’s Chief Deputy Secretary and its Energy Director.
Energy Contacts
Due to the sensitive nature of personal contact information, such information is not
published for general consumption. However, 24-hour energy emergency contact
information is maintained by the SEO in both electronic and paper formats.

4-11
Assessing an Energy Emergency
The SEO will assess each energy disruption by identifying and understanding the
impacts to citizens, commerce, and any downstream energy infrastructure that
transits the State. This analysis will include an examination of the disruptive event
within the context of current and projected future energy demands in order to
determine and recommend an appropriate response. For example, a shortage of
home heating oil in July may not warrant response actions; however, the same
shortage in January during record cold temperatures would demand immediate
response actions. The analysis will examine: the nature and extent of the disruption;
the anticipated duration; the number of affected citizens or entities; the severity of
impacts; available remedies; current/expected weather events; and other appropriate
factors. Once completed, the results of the analysis will be communicated to SEO
leadership.
Measuring Recovery The SEO endeavors to mitigate future events (by root-cause analysis of past events) to
understand the cause and effects of disruptive energy events. The SEO will identify the
following information during its analysis:
a. The estimated and actual time to achieve initial recovery
b. The estimated and actual time to full recovery
c. Key successes or failures
d. Lessons learned by SEO, independently owned utilities, and public/private
entities
e. Suggestions from partners on approaches to improve response to future event

4-12
Bibliography
American Broadcasting Company (ABC). https://abcnews.go.com/
British Broadcasting Corporation (BBC). http://www.bbc.com/
Colonial Pipeline. http://www.colpipe.com/home/about-colonial/owners
Columbia Broadcasting System (CBS). https://www.cbsnews.com/
Dixie Pipeline. (https://www.enterpriseproducts.com/operations/ngl-pipelines-services/ngl-
pipelines)
EIA (U.S. Energy Information Administration).
http://www.eia.doe.gov/emeu/states/hf.jsp?incfile=sep_fuel/html/fuel_pr_pa.html
Google Maps. (2018). from Google: https://www.google.com/maps/@35.784121,-
78.6490929,15z
Kinder Morgan, Plantation Pipeline. https://www.kindermorgan.com/about_us
National Broadcasting Company (NBC), https://www.nbcnews.com/
National Weather Service. https://www.spc.noaa.gov/
North Carolina Railroad Company. https://www.ncrr.com/nc-rail-map/
OPIS (Oil Price Information Service). https://www.opisnet.com/
Piedmont Natural Gas. http://www.piedmontng.com/about/aboutpng/servicearea/home.aspx
Plantation Pipeline. http://ir.kindermorgan.com/
PSNC Energy. http://www.psncenergy.com/en/residential-services/service-area-map/
TOCCOA (City of) Natural Gas. http://www.cityoftoccoa.com/natural-gas.cfm
Transco (Williams) Pipeline. (http://www.1line.williams.com/Transco/index.html)
Wall Street Journal. http://www.wsj.com/mdc/public/page/2_3023-
cashprices.html?mod=topnav_2_3024

i
Volume 5 - Emergency Support Function 12 Contingencies and Response Volume 5 - Emergency Support Function 12 (ESF-12) Contingencies and Response ........i
Table of Contents ....................................................................................................................i
Table of Figures ........................................................................................................................ i
Table of Tables ......................................................................................................................... i
5.1 Introduction ...................................................................................................................... 5-1
5.1.1 Purpose ..................................................................................................................... 5-1
5.1.2 Scope ......................................................................................................................... 5-2
5.1.3 Organization .............................................................................................................. 5-2
5.2 Emergency Communication Procedures .......................................................................... 5-4
5.2.1 Points of Contact ....................................................................................................... 5-5
5.2.2 Communications During Normal Conditions .............................................................. 5-5
5.2.3 Communication During Emergency Operations ........................................................ 5-5
5.3 Public Information Program .............................................................................................. 5-8
5.4 Energy Emergency Response Plans ............................................................................. 5-11
5.4.2 Electric Disruption Procedures ................................................................................ 5-13
5.4.3 Natural Gas (NG) ..................................................................................................... 5-21
5.4.4 Petroleum ................................................................................................................ 5-27
Bibliography ............................................................................................................................. 5-46
Table of Figures
Figure 5-1: State Energy Office Interactions .............................................................................. 5-5
Figure 5-2: Communications Flow Under Emergency Operations ............................................. 5-6
Figure 5-3: SEO Detailed Flow of Communications Under Emergency Operations .................. 5-7
Figure 5-4: Trigger Chart of Taxable Gallons of Gasoline ....................................................... 5-31
Figure 5-5: Trigger Chart of Taxable Gallons of Diesel Fuel ................................................... 5-31
Table of Tables
Table 5-1 Communication Actions ............................................................................................. 5-8
Table 5-2 Public Relations Steps ............................................................................................. 5-10

5-1
Emergency Support Function 12 (ESF-12) Contingencies
and Response
Introduction
Access to reliable and affordable energy is essential to sustaining our modern, technologically-dependent society. Energy emergencies can produce significant economic losses, harm public welfare, and degrade government services. Supply disruptions can result from natural disasters, accidents, deliberate acts, systemic factors, geopolitical events, or market forces producing a rapid, unsustainable increase in energy prices. Energy Assurance aims to improve the resiliency of our energy system, to reduce the risk of energy emergencies, and accelerate restoration when disruptions do occur. The State Energy Office (SEO) strives to facilitate the provision and delivery of reliable and secure energy supplies to consumers and businesses despite adverse conditions. The SEO fosters collaboration and partnerships between stakeholders involved with critical energy infrastructure. This plan was created to help North Carolina (NC) prepare for and react to unforeseen interruptions in energy service. It is intended to reduce the impact of energy emergencies and ultimately support a timely recovery. Planning must be done in an atmosphere of trust and mutual understanding with the best interests of the people of NC in mind. While the SEO understands that it cannot plan for every potential hazard, it can coordinate and develop a general plan that is adaptable in any crisis. By developing a model that considers the lifecycle of a potential crisis, all entities can identify effective methods to achieve a positive result. This Energy Assurance Plan (EAP) establishes a comprehensive framework that will assist in all phases of emergency management: mitigation, preparedness, response, and recovery. The EAP identifies stakeholder authorities and responsibilities and provides options for addressing disruptive energy events. It describes both the relationships and the lines of communication between federal, State, local, and non-governmental stakeholders. The development of this EAP has benefited from the assistance and support (before, during, and after NC energy emergencies) from the U.S. Department of Energy (DOE) and the National Association of State Energy Officials (NASEO). The EAP is designed to be used in conjunction with the NC Emergency Operations Plan (EOP), that was developed and is maintained by the Department of Public Safety (DPS), Division of Emergency Management (EM). The SEO is responsible for maintaining the EAP and for submitting any revisions to DPS and EM.
Purpose
The purpose of the EAP is to establish a systematic approach to address disruptive energy events. This plan was created to help NC prepare for and react to unforeseen interruptions in energy service. It is intended to reduce the impact of energy emergencies and ultimately support a timely recovery. The plan also provides State energy and emergency officials with pre-identified consumption reduction measures to

5-2
reduce the impact of a disruptive energy event. The plan is intended to be National Incident Management System (NIMS) compliant.
Scope
The EAP is designed to address planned, unplanned, real, or perceived disruptive energy events. It provides a context for energy assurance planning and describes a process that is applicable in any event affecting energy supply or in an energy emergency. The plan is designed for use within State government in support of Emergency Support Function 12 (ESF-12) activities. Certain features of the EAP rely on conservation measures, observations of market behaviors, and other agencies’ plans (such as the NC EOP and its incorporated sub-plans or annexes).
Organization
This ESF-12 Contingencies and Response section consists of the following elements:
Situation and Assumptions
Geographical Characteristics
Hazards and Vulnerability Analysis
Assumptions
Emergency Communications
Public Information Program
Disruption Response Plans for Electricity, Natural Gas and Petroleum
Situation and Assumptions
Energy is essential to the health, safety, and welfare of the people of this State and to the workings of the State economy, as stated in N.C.G.S. § 113B-1. Energy emergencies can produce significant economic losses, harm public welfare, and degrade government services. Disruption of energy supplies can result from natural disasters, accidents, criminal acts, or systemic factors, geopolitical events, or market forces producing a rapid, unsustainable increase in energy prices. It is important to recognize that energy disruptions are inevitable. The duration of a disruptive energy event depends on the scope of its impact and the market forces acting upon the disrupted commodity. In many cases, the market will correct itself and not require governmental intervention, however, there are situations when governmental intervention will be required.
Geographical Characteristics
Please refer to NC Energy Assurance Plan (EAP), Volume 3, Section 3.4.1, Geography
Hazards and Vulnerability Analysis
Some hazards to which NC’s energy infrastructure is vulnerable are briefly described below. For additional detailed information on each vulnerability and electronic links to other sources, please refer to NC EAP Volume 2, Section 2.1.2, Weather.

5-3
Tornadoes often produce disruptive energy events by damaging power lines
and other energy infrastructure.
Hurricanes usually strike during the months of June through November. NorthCarolina has experienced several strong hurricanes in the past that resulted insevere damage to infrastructure.
Thunderstorms are common in NC with an estimated 40 to 50 days ofthunderstorms each year.
Winter storms can have an adverse effect on energy infrastructure, oftenbringing snow, sleet, freezing rain, or a wintry mix that causes power lines tofail and creates hazardous road conditions.
Drought adversely affects NC’s energy infrastructure in the way of adequatewater for a hydroelectric/steam generation and for nuclear plant cooling.
Wildfires affect energy infrastructure by damaging transmission, distribution,and generation infrastructure.
Earthquakes can damage or destroy the transmission, distribution, andgeneration infrastructure.
Electromagnetic disturbances (geomagnetic storms, solar radiation storms,radio blackouts, or an electromagnetic pulse) can cause electric grid disruptionsthat interfere with transmission systems and transformers. In some cases,high-frequency communications may be affected, resulting in inoperable energytransmission system monitors for electricity, natural gas, etc.
Plan Assumptions
As previously stated, energy is essential to the health, safety, and welfare of the citizens of NC and to its economy (N.C.G.S. § 113B-1). Energy disruptions threaten our state’s commerce, transportation, communications, government, and the health of its residents. In any given year, NC faces the possibility of an energy disruption through natural, accidental, systematic or deliberate incidents. Such energy emergencies have the potential to result in substantial cascading effects that could adversely affect the delivery of essential services such as food, water, shelter, and medical treatment.
The EAP assumes that State agencies possess the emergency resources and expertise that will assist in preparing for, responding to, and recovering from energy disruptions. The Plan also assumes that county and local governments will develop plans to respond to localized energy disruptions. Further, the Plan assumes that investor-owned utilities, local distribution companies, and all other energy providers serving NC have developed operational energy disruptions plans.

5-4
The EAP recognizes that federal resources and expertise can be mobilized to augment local and State efforts in relieving energy disruptions that are beyond the capabilities of both State and local governments.
During energy emergencies, the SEO will provide staff representatives to serve in the infrastructure cell of the NC Emergency Operations Center (EOC). The EOC, located at the NC National Guard Joint Force Headquarters,1636 Gold Star Drive, Raleigh, is the primary location for State emergency operations. The EOC is under the direction and control of the State Emergency Response Team (SERT) leader, usually the Director of the Division of Emergency Management (EM). If conditions cause the primary EOC to be inoperable, it will relocate to an alternate location in accordance with the NC Emergency Management Continuity of Operations Plan (COOP).
Emergency Communication Procedures
Emergency communication procedures are vital elements of the EAP because they
promote the accurate and timely flow of information during an energy assurance event.
Information should flow both up and down the chain of command as well as laterally
between and among supporting agencies. In addition, the flow of information must also
include private energy resource entities such as the investor-owned utilities (IOUs),
petroleum marketers, and local delivery companies (LDCs).
SEO’s energy assurance manager (EAM) will access, analyze, and disseminate vital information pertaining to energy supply, demand, pricing, and infrastructure. The EAM surveys several sources of information (as noted in NCEAP Volume 3, NC Energy Disruption Tracking Process) regularly to acquire pertinent energy-related information. During an energy crisis, the information monitoring frequency may increase as the situation requires. Periodically, the EAM will provide data and assessments (of current and forecasted energy situations affecting the State) to the SEO Manager for communication to the Department of Environmental Quality’s (DEQ) Deputy Chief Secretary for dissemination, and as needed, to DEQ leadership and to the Energy Policy Council.
The EAM maintains and builds communication relationships with energy suppliers and consumers, State agencies, and local government stakeholders. These relationships foster sharing pertinent information to SEO, DEQ, the Energy Policy Council, the NC DEM and the NC Utilities Commission (NCUC). Communication channels include e-mail, telephone, and in-person conversations. Figure 5-1 illustrates the information sharing and reporting flow prior to or during an energy crisis.

5-5
Information MonitoringRegulated Entities
State Energy Office
Division of Emergency
Management
NC Utilities Commission
Energy Policy
Council
U.S. DOE
News & Industry
Monitoring
ElectricityProviders
NC Department of Environmental
Quality
Surrounding States SEO’s
Natural Gas Providers
Petroleum Pipeline &Terminals
Governors Office
State Energy Office InteractionsLines of Authority-Lines of Communication-
Public Staff
Figure 5-1: State Energy Office Interactions
Both formal and informal communications occur before, during, and after an energy emergency event. Prior to identifying an energy emergency, informal communications are continuous and on-going. Examples of informal communication include: regular phone calls; emails; or personal visits that foster the relationships between the SEO staff and energy stakeholders. These pre-existing relationships improve formal communication effectiveness during an actual energy emergency.
Points of Contact
The SEO EAM maintains a regularly updated 24-hour emergency contact list of NC energy stakeholders. Due to the sensitive nature of the list, is not publicized.
Communications During Normal Conditions
During normal conditions, the EAM regularly analyzes the energy landscape and informally communicates with SEO management about any potential NC or surrounding region energy disruption. If abnormalities are identified outside of the “normal” energy environment, the EAM communicates with energy providers to determine the cause of the situation and what action, if any, can be taken to reduce or mitigate the issue. This analysis is communicated through the SEO Manager. The SEO Manager then communicates with DEQ’s Chief Deputy Secretary who may, if necessary, distribute the findings DEQ leadership, the Energy Policy Council, or other government agencies. DEQ’s Chief Deputy Secretary alerts decision makers about potential events that may or may not increase energy prices or reduce energy supply.
Communication During Emergency Operations
During energy emergencies, SEO representatives serve on the SERT. SERT activation procedures are detailed in the NCEOP NC Emergency Operation Plan (EOP). The

5-6
SEO participates in the SERT Operations Section as a member of the Infrastructure Sub-Section. SEO participants communicate with various energy stakeholders to determine the present and forecasted energy situation. The SEO communicates with established contacts at IOUs, LDCs, petroleum pipelines/terminal operations, and other relevant stakeholders. Additional communications with the U.S. DOE and NASEO’s Energy Emergency Assurance Coordinators (www.naseo.org/eeac) assist in determining supply line conditions and time estimates for the return to normal service. Figure 5-2 illustrates the NC government communications flow during emergency operations. Figure 5-3 illustrates the SEO communications flow during emergency operations.
Energy Consumers
Local Government
Energy Suppliers
NC Emergency Management
Governors Office
AppealsCourts
Legislative Committee
EnforcementAttorney General
Energy Policy Council
NC Utilities Commission
PIO SEO/ESF-12
State Energy Office
Figure 5-2: Communications Flow Under Emergency Operations

5-7
Energy Consumers
Local GovernmentEnergy Suppliers
InfrastructureSEO Members
Operations
State Emergency Response Team (SERT)
Media
Public Information
Officer
Figure 5-3: SEO Detailed Flow of Communications under Emergency Operations
The SEO reviews requests for assistance, assists with the prioritization of response strategies, and helps determine resources needed to initiate a response to the situation (as needed) during an energy emergency.
The SEO may be tasked with assessing energy infrastructure damages related to energy supply, energy demand, and what is required to restore services. It may also be asked to obtain fuel for transportation and emergency operations, and provide energy information, education, and conservation guidance to NC citizens. As the designated lead technical agency during energy emergencies, the SEO may provide assistance to governmental agencies’ review of emergency fuel requests and to other organizations in procuring needed assistance to restore normal operations. The SEO will also assist in the development of recovery strategies to meet the State’s energy needs.
During large-scale events, such as a widespread electric grid failure, petroleum shortages, or severe storms, the EAM will prepare information that identifies the geographic area affected, cascading effects that are or may be experienced, and recommended mitigation strategies for both the energy demand and supply sides. The EAM will disseminate information in accordance with the SEO’s communication process.
The phases of and actions for energy disruptions are summarized in Table 5-1 below.

5-8
Table 5-1 Communication Actions
NCEM operates and maintains the Governor’s Emergency Information Bilingual Hotline that is staffed by State employees during emergencies. The hotline operators provide information to callers about evacuations, shelters, feeding sites, highway conditions, donations, or any pertinent information about the current situation. Energy information may be relayed to the operators if the situation requires. The hotline number is (888) 835-9966 and is staffed 24/7 during emergency situations.
Public Information Program
During an emergency, it is important to maintain public confidence in both government and the marketplace. This becomes increasingly important during energy shortages
Phase Communication Actions that may be required
Monitor
and Alert
Keep Governor’s staff and Legislators informed
Review/prepare graphical energy market handouts and othermaterials to explain consumption patterns and anomalies
Update NCEM public relations officer
Provide basic supply and demand data
Coordinate with NCEM on media contacts to help reportersunderstand basic energy facts and issues
Review weather forecasts
Estimate the probability of greater shortage
Prepare briefings on possible supply and demand restraint measuresshould shortage intensify
Mild
Shortage
Maintain information actions described above, plus:o Coordinate with NCEM to draft energy conservation
recommendations if shortage is predicted to reach moderatelevel
o Prepare advisories on recommended energy conservationtechniques
Moderate
Shortage
Maintain information actions described above, plus:o Be prepared to explain conservation recommendations to
Legislative Committee or at NCEM media briefingso Follow-up messages may be made by the Governor to assure
the public and encourage continued cooperation andcompliance
Severe
Shortage
Maintain information actions described above, plus:o Governor recommends mandatory measures to the
Legislative Committeeo NCEM or SEO may explain details of mandatory measures
during media briefingso NCEM, Attorney General, or the Governor announces
enforcement actions, if any

5-9
since the public relies on energy products for transportation, climate control, sustenance, and virtually every aspect of daily life. One way to foster public confidence is by informing them about the nature, severity, and possible duration of the current or impending situation. It is also important to provide information on the measures that are being implemented to alleviate the situation and what actions the public can take to assist. Providing accurate and timely information can reduce public apprehension and increase confidence. Providing information that educates the public on what actions they can take to reduce energy demand and alleviate the situation is helpful.
The level of government or media involvement depends on the nature and severity of the situation. It is beneficial to provide the public and decision makers with accurate and official information on the status of the shortage, voluntary or mandatory measures, and any energy efficiency measures that they can implement.
During localized energy disruptions, there may be little or no media involvement. If the media contacts SEO for statements, all information and responses will be routed through the DEQ Public Information Officer (PIO) and SEO Management.
In the event of a statewide or regional energy disruption, media involvement will increase. If this occurs, a focused information-sharing effort should be encouraged with coordinated communication responses from the involved governmental agencies such as NCEM, the NCUC, DEQ, Energy Policy Council, Governor’s office, and private energy providers.
When energy disruptions are prolonged or increase to a larger scale that requires SERT activation, public information will be released in accordance with the accepted protocol of the Governor’s office, NCEM’s PIO, and (if needed) DEQ. The SEO and NCEM will establish a central information center to facilitate the collection, analysis, and distribution of pertinent information. To avoid contradictory statements, stakeholders will compile all information for review prior to its release. All public information should be validated and released in a uniform manner. Interagency meetings and teleconferences to discuss a coordinated message prior to any public release are recommended. Public information may be released using a variety of means including radio and television stations, the internet and social media, direct telephone contact, and newspapers.
PIOs from EM, DEQ, and other agencies will respond according to the nature and severity of the disruption. In a SERT activation, there will be an EM PIO stationed at the EOC. The SEO assists EM, in providing information to the public and responding citizen’s inquiries as needed. Table 5-2 provides public relations actions that may occur in the different phases of an energy emergency.

5-10
Phase Detailed Public Relations Steps for the SEO Monitor and Alert
Review and reinforce communications within the SEO
Ensure all personnel know the current facts and what can and CANNOT be said
Communicate with NCEM SERT, DEQ, and the Governor’s office
Communicate with the NCEM’s Watch Commander and PIO
Prepare (as requested) graphical representations of current situation, including energysupply, demand, and historical data
Keep apprised of developing weather situations
Estimate “worst case scenario” probability with ensuing impacts and the “best casescenario”
Identify conservation and energy efficiency measures that reduce demand
Mild Shortage
Maintain all actions described above, plus:o Coordinate with NCEM to develop energy conservation measures, if the
situation does not resolve itself in a timely mannero Consult with industry resources and the U.S. DOE to determine best practices
for conservation techniqueso Announce voluntary conservation actions
Moderate Shortage
Maintain all actions described above, plus:o Governor may suggest conservation measures to the Legislative Committeeo SEO and/or NCEM may need to amplify/explain reasons for the measures to
the Governor’s office and Legislative Committeeo Follow-up communications may be necessary for the Governor’s office in
order to facilitate information dissemination in the Governor’s press releases
Severe Shortage
Maintain all actions described above, plus:o Governor may recommend mandatory measures to the Legislative Committeeo NCEM may hold media briefingso NCEM, Attorney General, or Governor’s office may announce enforcement
actions, if necessaryTable 5-2 Public Relations Steps
The educational portion of the message may include information provided by representatives from the affected industry, such as electricity or natural gas. Because of the petroleum industry’s unregulated status, it may not appropriate for their representatives to educate the public through official State PIO channels. The industry representatives should be able to provide energy conservation actions that the public may take in order to alleviate the situation.
The information campaign should help to educate the public on what it can do to alleviate the stress on the energy system during the disruption. Educational information should focus on the efforts needed to mitigate the current energy situation.
Some possible topics for informational educational campaigns may include:
Increasing fuel efficiency by using more efficient vehicles for travel
Alternatives to single-occupant vehicle travel (public transit, ridesharing, etc.)
Home heating conservation tips
Tips on general energy conservation both at home and in the workplace
Energy supply availability and pricing

5-11
Energy Emergency Response Plans
The two types of energy disruptions are planned and unplanned. Planned disruptions are usually transparent to customers since the energy provider took proactive steps to mitigate any customers’ loss of service. These disruptions may include corrective or preventive maintenance on existing infrastructure or the addition of new infrastructure. For the most part, customers rarely know the event even occurred.
Unplanned energy disruptions range from unforeseen and immediate acts of God, (such as lightning, or slower on-set situations such as hurricanes), and geopolitical events or deliberate attacks on the physical and/or cyber-systems. No one can predict what sector will be disrupted or when an energy disruption takes place. Both providers and government officials will react when an unplanned energy disruption occurs.
In the event of a major energy supply disruption, both industry and government will play significant roles to manage the incident and its consequences. The energy providers (electricity, natural gas, or petroleum) will be responsible for the practical and operational management decisions of the incident. The energy providers have the intimate knowledge and experience to manage the incident operations safely and quickly restore energy services.
The role of State government and the SEO is to understand and manage the broader effects of an energy supply disruption such as a statewide or geographically-isolated supply disruption. The State can also assist the private sector in its recovery efforts, as needed, by providing resources and waivers that facilitate response and recovery efforts. The SEO will assist industry representatives with coordination of efforts to develop and implement policies to restore services. The SEO will work closely with both State and federal agencies (i.e. EM, DOT, and DOE, respectively) to support recovery.
Many of the organizations involved in energy production and distribution manage complex operational situations on a daily basis and have contingency plans in place for a variety of less-common events. An example of this contingency planning is evident in the recent Colonial Pipeline break and fire; industry representatives, southeastern U.S. emergency management organizations, and local emergency workers were able to respond and to resolve the incident’s impact effectively. The event’s response and recovery were mitigated as a result of a well-developed and exercised industry and government emergency plans. The SEO can provide similar assistance to private sector partners by fostering effective communication and cooperation with State and local government agencies.
It may be beneficial to follow a standard template for all commodities when planning for energy emergencies. This template should serve as a foundation to which actions are either added or removed as appropriate for individual situations or commodities. The SEO should ensure that the EAP is reviewed and updated periodically with current information about the energy infrastructure and contacts. In addition, the SEO should

5-12
ensure that the energy-related working groups and stakeholders are aware of the EAP and have access to it.
State Energy Office (SEO) and Governmental Agencies General Checklist for
Energy Disruptions
When an energy disruption is suspected the SEO should:
Assess the commodity market by examining the current and historical pricing,and supply and demand indicators within the State and region
Assess and quantify, when possible, potential economic and humanconsequences
Contact relevant industry representatives to verify the existence of a disruption ormarket fluctuation
Contact local government officials in affected regions to confirm the disruption ormarket fluctuation and other impacted states in larger-scale events
Contact the surrounding states to confirm the disruption or market fluctuation
Upon confirmation of an energy disruption, the SEO should:
Prepare a written report for the SEO Manager and Deputy Director/Operations
Chief of NCEM that describes the preceding investigation.
Continue tracking current and historical pricing and usage in the State and
region.
Contact industry representatives to determine:
o The cause of the disruption
o Who and how many customers may be affected by the disruption
o The estimated time to repair, replace, or restore service
o If an alternate energy source may be obtained
o Advice and assistance
Coordinate with surrounding states’ SEOs to facilitate a regional disruption
approach by individual communications with them and via NASEO participation.
Suggest public appeals for energy-use reduction.
Prepare for mandatory measures.
Prepare a Situational Analysis Report that includes:
o General description of the situation and cause
o Steps underway being taken to alleviate the disruption
o Required support
When completed, the Situational Analysis Report should be approved by
appropriate state agencies and forwarded to the U.S. DOE.
Assist local and state agencies with energy-related requests as needed.
Assist EM and NC authorities in initiating energy conservation measures.

5-13
When transitioning into the recovery phase of an energy disruption, the SEO should:
Continue tracking the current and historical pricing and usage in the State andregion
Track the duration of the energy disruption
Assist the State Coordinating Officer (SCO) and the Federal Coordinating Officer(FCO) in the restoration of damaged energy systems
Verify with industry representatives that the disruption is managed and conditionsare returning to normal
Verify with local government officials that the recovery is taking place
Assist in the coordination of resupply efforts
Communicate with surrounding states about recovery/resupply efforts
Prepare to terminate voluntary and/or mandatory actions
Inform the public of restorationAfter the recovery is complete, the SEO should prepare an After Action Report that:
Examines the factors leading up to and after the event
Determines what went wrong and what could have been done differently toprevent or mitigate the effects of the event
Documents what worked well and if response and recovery efforts weresuccessful
Amends the EAP to reflect the problems and solutions
Electric Disruption Procedures
We cannot predict when or what will cause a disruption the flow of electricity. However, we can examine the current infrastructure and the historical events that affected the delivery of electricity in the State. By identifying historical events and their effects, we can develop a course of action to mitigate the impacts of similar future disruptions.
As previously discussed, NC generates and consumes a considerable amount of electricity. It is recognized that electricity is vital to the State’s economy and welfare of its citizens. It is also recognized that electricity has an interdependency associated with the delivery of petroleum from the pipeline to terminals and retail stations as well as the commercial, industrial, transportation, and residential sectors. The banking and finance industry is dependent upon the constant delivery of electricity to power the IT infrastructure that enables and records transactions. It is necessary to determine how energy will be distributed as well as limited in times of a supply disruption. Understanding interdependencies between and within sectors is important for both planning and response.
Electrical energy suppliers may need to curtail delivery of service to some of their customers during a disruptive energy event. If an electricity curtailment must be instituted, it is done in accordance with the Rules and Regulations of the NCUC (Chapter 8, Article 7 of the NCUC’s Rules and Regulations). Under Rule R8-141 (a) and (b), “Filing of emergency load reduction plans and procedures,” each regulated utility is

5-14
required to design and adopt an emergency load reduction plan and procedure that is judicious to all affected customers. Regulated utilities are also required to file the emergency load reduction plan with the NCUC. The electric utilities review and update the emergency load reduction plan annually. Energy consumers are encouraged to conserve electricity to reduce aggregate demand and the risk of disruption due to system overload. Suggested conservation measures for residential consumers include: utilizing Energy Star-labelled appliances; adjusting home thermostats for less cooling in summer and less heating in winter; lowering water heater temperatures; and installing energy efficient lighting. To mitigate an energy emergency’s impact on the electric grid, commercial/industrial/governmental customers can initiate performance contracting beforehand to reduce energy consumption/demand through increased efficiency. Performance contracting (or Guaranteed Energy Savings Contract) involves a comprehensive energy efficiency audit and a guarantee that the savings can repay the incurred efficiency upgrade’s debt. Performance contracting’s audit includes information about organizational constraints (money, personnel or time) needed to produce a viable energy efficiency improvement plan. After the improvements are completed, another audit is performed to quantify efficiency improvements, measure and verify savings, and determine the return on investment (ROI).
It is important to note that savings are measured in kWh and therms, and then turned into dollars using the current market price for the energy resource. A carefully monitored measurement and verification must occur to ensure the performance of the improvements. For example, an enterprise should measure the energy consumption before the intervention, install the intervention, and make continual measurement after the intervention has been installed to ensure the intervention is effectively reducing usage/demand. Verified and continued performance is vital to the fiscal worthiness of the initiative, especially when the energy savings fund the repayment or ROI.
Several potential threats affect the delivery of electricity; some are more common than others. History suggests that weather events such as winter ice storms or summer hurricanes pose the greatest threat to electrical service. Damage to distribution lines is the most common variable in the loss of delivery. Depending on the season, the majority of the disruptions occur in either the coastal plain or mountains. It is important to recognize that even though distribution line disruption is the most common threat, the possibility of transmission lines or logistical lines that transport the fuels (coal, nuclear, or petroleum) used for electrical generation could be impeded cannot be discounted. Because of the variety of hazards that can disrupt electrical services, it is prudent to develop plans to mitigate their effects by including recommended actions for pre-season, pre-event, and during an actual disruption.
Pre-Season Planning Checklist for SEO and Governmental Agencies
Prior to entering the high-risk seasons (winter or summer), the following actions should take place:
Coordinate with the utility and State-owned property facility management toencourage line maintenance and vegetation management

5-15
Verify communications call list and check contacts’ phone numbers, emails, etc.
Encourage critical agencies to obtain and/or verify their ability to perform fuelswitching
Categorize critical assets by what is vital, essential, and non-essential; thisprocess helps with the business decision of whether or not to curtail a particularservice
Establish a plan to implement reductions, if needed, from non-essential to vital
Encourage energy conservation through energy efficiency/conservationtechniques
Provide information to the public for actions that can be taken by citizens
Pre-Event Electric Disruption Planning Checklist for SEO and Governmental Agencies
When managing the energy resources transmitted across the grid and consumed by citizens and State entities, consider taking the following actions as recommended by the USDOE:
Coordinate with State EM and the U.S. Department of Homeland Security(USDHS) to identify critical energy infrastructure such as distribution,transmission, and data pipelines because early identification could lead toimproved response and recovery
Identify load reduction measures appropriate for the facility
Categorize electrical loads into the following categories and coordinate with theenergy provider:
o Life, health, and safety driveno Mission critical and non-mission critical
Monitor total facility demand and demands within the categorized loads
Monitor weather forecasts and identify the high-degree or low-degree days
Communicate the weather forecasts to employees so they can prepareaccordingly (i.e. appropriate dress)
Prepare an impact statement that outlines the effects of a long-term poweroutage on government operations
Prepare an impact statement outlining the effects of a long-term power outage onthe health, welfare, and safety of citizens in the affected areas
Identify priority service areas such as public health, public safety, governmental,and economic centers for restoration activities
Categorizing electrical loads early and communicating organizational priorities from the utilities will assist in the decision-making process when loads need to be shed or critical restoration activities must take place. If the disruption causes serious problems for which an exception to the existing prioritization occurs, a conversation with the respective utilities on re-prioritization is warranted. Once informed of expected weather, employees can make appropriate attire choices to withstand temperature variation, reducing the need for climate control and relieving some demand for electricity.

5-16
The SEO recognizes that natural gas and electricity utility providers will maintain and repair their systems and that plans are in place to facilitate timely restoration of services. The utilities will execute restoration plans when the situation requires it. The SEO also understands that entities requiring priority restoration have been pre-identified and recorded by both the utility and NCEM.
Additional assumptions include a generally accepted prioritized restoration schedule of:
Downed power lines or life threatening situations and public health and safetyfacilities without power
Transmission lines that serve thousands of customers
Substations
Main distribution lines, in order of customer volume
Secondary distribution lines, neighborhoods
Service lines to business and residences
Event Execution Checklist for SEO and Governmental Agencies
Provide a SEO representative to the EOC, Infrastructure Cell.
Communicate with utilities to verify reports of power disruptions.
Communicate with utilities to establish estimated time of restoration.
Coordinate with utilities to exchange critical information that the EOC may have(such as road closures or flooding) that could assist in recovery operations.
Coordinate a schedule to receive updates on the estimated time to repair/recovero 8:00 A.M, 2:00 P.M., and 8:00 P.M are accepted intervals used in the
past.
Summarize disruptions by county and prepare for the further analysis of the data.
Coordinate with utilities to develop an impact statement outlining the effects of along-term power outage on government operations.
Coordinate with utilities to develop an impact statement outlining a long-termpower outage’s effect on the health, welfare, and safety of citizens in affectedareas.
Inform employees of demand reduction activities.
Initiate load reduction measures based on previously identified categories.
Reduce use of overhead lighting, personal computers, and high demandappliances such as microwave ovens.
Contact Facilities Maintenance or energy service company’s (ESCOs) to employmeasures to conserve on heating, ventilation, and cooling (HVAC).
SEO and ESF-12 Checklist for Mild Electric Disruptions
Trigger: Isolated incident or degradation of service reliability

5-17
Monitor utilities’ web-based outage pages and U.S. DOE’s Eagle I for outage-related information.
Monitor the price and consumption of coal and natural gas products.
Alert key personnel per standard operating procedures (SOP).
Communicate with utilities.
Communicate the following information to State Emergency Operationsleadership and Joint Information Center:
o Location of the outageo Duration of the outageo Reason for the outage, if knowno The number of line crews and other resources deployedo Additional level Mutual Aid that may have been requested or committed to
SEO and ESF-12 Checklist for Moderate Electric Disruptions
Continue actions in previous Mild Electric Disruption Checklist phase, above.
Communicate with electric utilities as needed.
Identify if voluntary reductions will be requested from utilities and plan formessages reflecting the decision.
Plan for mandatory measures.
Alert key personnel in accordance with SOP.
Request Governor appeal for energy-use reduction.
Provide information through a variety of media to inform the governmentalagencies and the general public.
Suggest compressed workweek.
SEO and ESF-12 Checklist for Severe Electric Disruptions
Continue actions implemented in previous phases.
Implement mandatory measures.
Request Emergency Declaration by the Governor.
Confirm that the U.S. DOE has been notified.
Voluntary Measures for Electric Disruptions
Perform HVAC Temperature Set-backsEncourage commercial and residential customers to adjust building temperaturesto a maximum of 65-degrees during winter and minimum of 78-degrees during
Trigger: Escalating existing incident, continued degradation of service reliability, confirmed incident,
impending threat of allocation that will last for several weeks or request for assistance from utilities
Trigger: An event that has persisted for several weeks and timely resolution does not appear possible.

5-18
summer. The U.S. DOE estimates an approximate 3% energy savings per degree set-back during the heating months and 6% energy savings per degree during the cooling months.
The 2018 EIA Annual Energy Outlook reports that cooling and ventilation accounted for about 20% of residential and 18% of commercial electricity consumption in 2017 (the most recent year for which this data is available according to EIA). In the same year, space heating accounted for about 6% of residential and 4% of commercial electrical consumption.
The 2018 EIA State Energy Consumption Estimate states that NC residential customers consumed 691 trillion Btu and commercial customers consumed 582 trillion Btu.
At these rates, it is possible to estimate the potential electricity savings that could be achieved should all NC consumers implement thermostat setbacks. However, this annual estimates assumes 100% compliance, which is unlikely to be achieved.
Reduce Hot Water TemperatureEncourage commercial and residential users to reduce water heatertemperatures to 105-degrees. According to the U.S. DOE, setting-back waterheater thermostats by 10-degrees will result in a 3% to 5% savings on energyexpenditures. EIA’s 2018 Annual Energy Outlook reports that water heatingaccounted for about 8.5% of residential and 4.5% of commercial electricityconsumption in 2017. EIA’s 2018 State Energy Consumption Estimate says thatNC residential customers consumed 691 trillion Btu and commercial customersused 582 trillion Btu.
HVAC Set-Back Heating Months:
Residential electric demand for heating = 691 trillion Btu x .06 = 41.5 trillion Btu
Commercial electric demand for heating = 582 trillion Btu x .04 = 23.3 trillion Btu
Combined demand = 64.8 trillion Btu
3% saving associated with heating set-back= 1.94 trillion Btu or 568,560 MW/h
HVAC Set-Back Cooling Months:
Residential electric demand for cooling = 691 trillion Btu x .20 = 138.2 trillion Btu
Commercial electric demand for cooling = 582 trillion Btu x .18 = 104.8 trillion Btu
Combined demand = 243.0 trillion Btu
6% saving associated with cooling set-back= 14.58 trillion Btu or 4,272,975 MW/h

5-19
This annual estimate assumes 100% compliance, which is unlikely. Exceptions may be required for healthcare facilities, food service industries, and other entities in the health industry.
Efficient lighting use and installationThe Energy Star (ES) “How Energy-Efficient Light Bulbs Compare withTraditional Incandescents” guide promotes lighting upgrades for residentialcustomers. According to the guide, annual savings of $75 are possible iftraditional incandescent lights are replaced by either energy-efficient compactfluorescent (CFLs) or light emitting diodes (LEDs) ones. ES provides that theseenergy-efficient units generally use 25% to 80% less energy and can last from 3to 25 times as long.
Residential and commercial users can lower their energy consumption by:o Reducing lighting load (use energy-efficient units vs. standard)o Reducing outdoor illumination to essential (i.e. security-only) lighting
The EIA’s 2018 Annual Energy Outlook states that lighting accounted for approximately 12% of residential and 8% of commercial electricity use in 2017. EIA’s 2018 State Energy Consumption Estimate says that NC residential customers used 691 trillion Btu and commercial customers consumed 582 trillion Btu. This is annual estimate assumes 100% compliance, which is unlikely.
Protective measures by Electric UtilitiesIf utilities determine that a disruptive-event could affect overall system reliability,they may implement actions to preserve reliability (at their discretion) as follows:
Electric Hot Water Set-Back:
Residential electric demand for water heating = 691 trillion Btu x .085 = 58.7 trillion Btu
Commercial electric demand for water heating = 582 trillion Btu x .045= 26.19 trillion Btu
Combined demand = 84.9 trillion Btu
3-5% saving from temperature setback= 2.55 to 4.24 trillion Btu or 747,331 to 1,242,621
MW/h
Installing Efficient Lighting:
Residential electric demand for lighting = 691 trillion Btu x .12 = 82.92 trillion Btu
Commercial electric demand for lighting = 582 trillion Btu x .08 = 46.6 trillion Btu
Combined demand = 129.48 trillion Btu
50% saving from energy efficient lighting = 64.74 trillion Btu or 18,973,416 MW/h

5-20
o Curtail/shed non-essential loads (those unrelated to life and safety)o Curtail non-firm loadso Implement voltage reductions
Mandatory Measures for Electric Disruptions
Adjust Indoor Regulated Space Temperature
The Governor could issue an executive order for all commercial, industrial, and government customers that use electricity for heating and/or cooling to adjust building temperatures to a maximum of 65-degrees in winter and a minimum of 78-degrees during the summer. Possible exceptions could be healthcarefacilities, food service industries, and other entities in the health industry.
Enforcement: This may be enforced by building code officials or inspectors.
Reduce Hot Water TemperatureThe Governor could issue an executive order for commercial, industrial andgovernment to lower the temperature of the hot water in their buildings to 105-degrees. Possible exceptions could be healthcare facilities, food serviceindustries, and other entities in the health industry.
Enforcement: This may be enforced by building code inspectors, who determine water temperature readings at faucet heads on the first floor of the building.
Government Facility Hours Reduction/ClosuresThe Governor could issue an executive order requiring reduced operating hoursat State government facilities that use electricity for heating or cooling.Depending on the circumstances, the Governor may determine that somegovernment facilities should be temporarily closed. The order may follow theprocess below:
o Non-critical personnel and activities will reduce operating hours/close firsto Mission critical personnel and activities will reduce operating hours/close
on ordero Life, health, and safety driven activities will be the last to reduce operating
hours/close
Enforcement: Department leadership is expected to follow appropriate orders.
Electronic Signage/Advertising LightingThe Governor may issue an executive order restricting the use of electricadvertising signs and window displays. Commercial, retail, and other serviceestablishments may keep signs lighted during business hours only, and onlykeep lighted signs essential to direct customers to the business or identify it.
Enforcement: Building codes and law enforcement personnel.

5-21
Restrict Retail Establishment Operating TimesThe Governor could issue an executive order to restrict the hours of operation forretail establishments. This measure should be used as a last resort as it hasadverse implications on the economic stability of the State.
Enforcement: Building code and law enforcement personnel.
SEO and ESF-12 Recovery Action Checklist for Electric Disruptions
Verify that the utility is returning to normal operations. Notify Director of SEO and NCEM Personnel. Inform the general public using a variety of traditional and social media. Conduct after-action to include:
Estimated and actual time to initial recovery
Estimated and actual time to full recovery
Key successes and failures
Lessons learned from the SEO, utilities, public and private entities
Improvements to the plan
Natural Gas (NG)
Disruptions to the flow of natural gas cannot be accurately predicted, however, an examination of the current infrastructure and the historical events that affected the delivery of natural gas within the State may lessen its impact. Identifying historical use and events help to develop actions to mitigate some of the effects of the disruption.
As previously discussed, NC depends upon the Transco and Columbia pipelines to supply all of its natural gas needs. Pipeline safety has become a matter of public concern since the San Bruno natural gas explosion in California on September 9, 2010. The NCUC is responsible for pipeline safety as pursuant to NC Gen. Stat. 62-50(c). This statute authorizes the NCUC to collaborate with the U.S. Department of Transportation to regulate and inspect the safety procedures associated with the transmission of natural gas within the State.
The demand for natural gas at one time was seasonal, increasing during winter months due to the need for residential heating and falling off during the summer. Summer demand is currently trending upward. This demand increase can be attributed to electric utilities using more natural gas to operate primary, peaking, and intermediate generation.
If there is a disruption in the NC natural gas supply, pipeline suppliers may need to curtail delivery of service to some of their customers. If instituted, a natural gas curtailment is done in accordance with Rules and Regulations of the NCUC (Chapter 6 under Rule R6-19.2. (Curtailment of Service)), which states that curtailment shall occur

5-22
with, “the customers paying the least margin per dekatherm first.” The rule also provides guidance for geographical disruption of a particular service area, “…curtailment by margin should be applied only to those customers within the affected areas.” This link NCUC Curtailment of Service provides curtailment priorities and is included below:
Priority 1. Residentialo Essential Human Needs with No Alternate Fuel Capability oro Commercial less than 50 thousand cubic feet (Mcf) per day.
Priority 2. Industrialo Industrial less than 50 Mcf/dayo Commercial between 50 and 100 Mcf/dayo Commercial greater than 100 Mcf/day, non-boiler useo Commercial greater than 100 Mcf/day, with no alternate fuel capabilityo Industrial process, feedstock and plant protection between 50 and 300
Mcf/day, with no alternate fuel capabilityo Industrial process, feedstock and plant protection between 300 and 3,000
Mcf/day, with no alternate fuel capabilityo Industrial process, feedstock and plant protection greater than 3,000
Mcf/day, with no alternate fuel capabilityo Commercial over 100 Mcf/day (excluding commercial Priorities 2.3 and 2.4
and commercial boiler fuel requirements over 300 Mcf/day)
Priority 3. All other industrial requirements not greater than 300 Mcf per day.o Industrial non boiler between 50 and 300 Mcf per dayo Other industrial between 50 and 300 Mcf per day
Priority 4. Non-boiler use between 300 and 3,000 Mcf/day
Priority 5. Non-boiler use greater than 3,000 Mcf/day
Priority 6. Boiler fuel requirements of more than 300 Mcf per day but less than1,500 Mcf per day.
Priority 7. Boiler fuel requirements between 1,500 and 3,000 Mcf/day
Priority 8. Boiler fuel requirements between 3,000 and 10,000 Mcf/day
Priority 9. Boiler fuel requirements greater than 10,000 Mcf/day
The NCUC Regulations stipulate for a timely restoration of service, provided the restoration is performed in a safe manner. In a disruption, the provider will restore service when the cause for the disruption has been identified, a necessary corrective action performed, operational tests performed, and it is deemed safe for distribution service. The utility must submit a report to the NCUC identifying the cause, date and time, duration, location, and number of customers affected by the disruption.
To ensure that the natural gas service is performed in a safe and consistent manner, the NCUC provides guidance under Article 8, Safety. Please follow the link for more information pertaining to this topic.

5-23
Emergency contacts for natural gas issues include the NCUC, the Pipeline Safety Director, and each of the utility providers. Due to the sensitive nature of this information, these contacts are held by the SEO and not made available to the public.
SEO and Governmental Agencies Pre-Season Planning Checklist for Natural Gas
Disruptions
Prior to entering the high-risk seasons (winter or summer), the following actions should be taken:
Coordinate with the utilities and state-owned property facilities management toencourage line maintenance and vegetation management.
Verify communications call list names and contact information.
Identify priority natural gas users and encourage them to either obtain or verifytheir ability to perform fuel switching.
Categorize critical assets by what is vital, essential, and non-essential; thisprocess helps with the business decision to curtail or not-curtail a particularservice.
Establish a plan to implement reductions, if needed, from non-essential to vital.
Encourage energy conservation through energy efficiency/conservationtechniques.
Provide information to public actions for citizens as addressed in Section 5.3.
SEO and Governmental Agencies Pre-Event Planning Checklist for Natural Gas
Disruptions
Prepare an impact statement that addresses the economic and humanconsequences of the effects of a long-term natural gas interruption ongovernment operations.
Prepare an impact statement outlining long-term natural gas interruption effectson the health, welfare, and safety of citizens located in the affected areas.
Identify, in general terms, how customers can perform demand-sidemanagement through conservation and energy efficiency.
Provide public information identifying conservation measures for customers, suchas recommended temperature set-backs for water heaters.
The SEO is aware that the natural gas industry will provide for the maintenance and repair of its system. Historically, it has executed Memorandums of Understanding (MOUs) to facilitate timely restoration of services and a priority restoration list that has been pre-identified and recorded by both the utility and NCEM.

5-24
SEO and Governmental Agencies Event Execution Checklist for Natural Gas Disruptions
Provide a SEO representative to the EOC, Infrastructure Cell
Respond to reports of service disruptions
Provide updates on affected areas that include the estimated time to
repair/recover
Prepare an impact statement that outlines the effects of a long-term natural gas
interruption on government operations
Prepare an impact statement that outlines long-term natural gas interruption
effects on the health, welfare, and safety of citizens in the affected areas
Coordinate restoration activities
SEO, Governmental Agencies, and ESF-12 Checklist for Mild Natural Gas Disruptions
Monitor natural gas utility web-based pages for outage-related information
Monitor the price and consumption of natural gas products
Alert key personnel according to standard operating procedures
Communicate with the utility
Determine the location, duration, and cause of the outage
Inform citizens via a public information campaign as provided in Section 5.3
SEO, Governmental Agencies, and ESF-12 Checklist for Moderate Natural Gas
Disruptions
Communicate with utilities
Request voluntary reductions using pre-scripted messages
Plan for mandatory measures
Alert key personnel in accordance with standard operating procedures
Request Governor appeal for conservation
Provide information through a variety of media to inform the public
Suggest compressed workweek
Trigger: Isolated incident or degradation of service reliability
Trigger: Escalating existing incident, continued degradation of service reliability, confirmed incident,
impending threat of allocation that will last for several weeks or request for assistance from utilities.

5-25
SEO and ESF-12 Checklist for Severe Natural Gas Disruptions
Continue actions implemented in previous phases
Request Declaration of Emergency by Governor
Notify U.S. DOE if the agency has not yet been notified
Implement mandatory measures such as the following:
Require adjusting Indoor Regulated Space Temperature The Governor will issue an Executive Order that all commercial, industrial, and government customers that use natural gas for heating to adjust their building temperatures to a maximum of 65- degrees in winter. Possible exceptions could be made for healthcare facilities, food service industries, and other related entities.
Enforcement: Yet-to-be determined; one option may be to use state employees (e.g., building code officials or law enforcement personnel).
Reduce Hot Water Temperature The Governor will issue an Executive Order to commercial, industrial, and government users to lower the temperature of the water in their buildings to 105-degrees. Possible exceptions could be made for healthcare facilities, food service industries, and other health-related entities.
Enforcement: Yet-to-be determined; one option may be to use state employees (e.g., building code officials or law enforcement personnel).
Government Facility Hours Reduction/Closures The Governor may issue an Executive Order requiring operating hours at state government facilities using natural gas for heating be reduced or, depending on the circumstances, temporarily closed. The order of priority follows procedures below:
o Non-critical personnel and activities will reduce/close firsto Mission critical personnel and activities will reduce/close on ordero Life, health, and safety-driven activities will be the last to reduce/close
Enforcement: Division heads are expected to follow Executive Orders.
Voluntary Action Checklist for Natural Gas Disruptions
Reduce Indoor Heated Space TemperatureEncourage commercial and residential customers using natural gas heating toreduce building temperatures to a maximum of 65-degrees, or to a temperaturerecommended by the natural gas industry. Possible exceptions may be made for
Trigger: An event that has persisted for several weeks and a timely resolution does not appear
possible.

5-26
public and private healthcare facilities, the food service industry, or public health facilities.
Reduce Hot Water TemperatureEncourage commercial and residential customers using natural gas waterheating to lower water temperatures to 105-degrees. Possible exceptions may bemade for public and private healthcare facilities, the food service industry, orpublic health facilities.
Reduced Operating Hours through a compressed workweekLarge employers (100 or more employees at one location) with offices usingnatural gas as the primary heat source will be encouraged to reduce operatinghours and/or allow employees to telecommute.
Perform weatherization of structures
Mandatory Action Checklist for Natural Gas Disruptions
Reduce Indoor Heated Space Temperature The Governor may issue an Executive Order requiring all commercial, industrial, and government customers that use natural gas for heating to reduce their building temperatures to a maximum of 65-degrees. Possible exceptions may be made for public/private healthcare facilities, the food service industry, or those industries centered on public health.
Enforcement: Yet-to-be determined; one option may be to use state employees
(e.g., building code officials or law enforcement personnel).
Reduce Hot Water Temperature The Governor may issue an Executive Order requiring all commercial, industrial, and government users to lower the water temperature in their buildings to 105-degrees. Possible exceptions may be made for public/private healthcare facilities, the food service industry, or those industries centered on public health.
Enforcement: Yet-to-be determined; one option may be to use state employees
(e.g., building code officials or law enforcement personnel).
Notify Interruptible Natural Gas Customers Natural gas customers with interruptible natural gas contracts will be notified by their natural gas utility that their service will be temporarily curtailed.
Government Facility Hours Reduction/Closures The Governor may issue an Executive Order requiring operating hours at state government facilities (using natural gas for heating or cooling) be reduced or, depending

5-27
on the situation, temporarily closed. The order of priority will follow the procedures below:
o Non-critical personnel and activities will reduce/close firsto Mission critical personnel and activities will reduce/close on ordero Life, health, and safety-driven activities will be the last to reduce/close
Enforcement: Division heads are expected to follow Executive Orders
Provide a Post-Event ReportDetail essential facts such as the cause of the disruption, date/time, duration,location, number of customers affected, and actions taken to restore service
Recovery Actions for Natural Gas Disruptions
Verify that the utility is returning to normal operations.
Notify Director of SEO and NCEM leadership/personnel the recovery’s status.
Inform public through PIO channels.
Conduct after-action report to include:o Estimated and actual time to initial recoveryo Estimated and actual time to full recoveryo Key successes and failureso Lessons learned from the SEO, utility, public and private entitieso Improvements to the plan
Petroleum
It is impossible to predict when or what will disrupt the flow of petroleum. However, we can examine the current situation and the historical events that have affected the delivery of petroleum within the state. By identifying the infrastructure, external factors that affect it, and historical events that have previously interrupted petroleum flow, we can develop a course of action to mitigate some of a disruption’s effects.
As previously discussed, North Carolina imports virtually all of its petroleum. Severe weather events are the most common threat to the petroleum distribution system. Armed with this knowledge, it may be prudent to develop a plan to mitigate the effects of a weather-induced disruption through pre-season, pre-event, and actual disruption plans. Although the following discussion is performed with severe weather in mind, it can be adapted to any petroleum disruption.
Pre-Event planning
Areas prone to severe storm activity should begin to prepare for the hurricane season in the spring or early summer. Some actions may include encouraging state and local government, and businesses to determine the current existing amount of fuel and to

5-28
predict how much fuel will be needed for daily and emergency operations. To assist in determining fuel needs, the NCEM website has an ESF-12 Plan Generator template (https://rmp.nc.gov/portal/#) that is available to county and municipal emergency management organizations. Additional considerations may include maintaining greater than a 50% capacity of automotive grade fuels (motor gas and diesel) in their tanks or to participate in a voluntary pre-event re-fueling program. If an emergency resupply is required during a disruptive energy event, state and industry representatives will have a greater ability to deliver re-supply on an already partially satisfied fuel storage resource.
Public awareness campaigns should include recommendations for individuals to maintain enough fuel in their private vehicles to evacuate west of I-95 in the event of a hurricane. Reducing the need for last-minute refueling prior to evacuation will avoid some premature depletion and preserve supplies for essential emergency services.
It may prove beneficial for entities to examine their critical assets, such as day tanks for generators or storage of petroleum products. By identifying the assets and examining each asset’s average daily petroleum requirements, one may determine how much product is needed to support operations for an extended period of time. Anticipating the amount of petroleum used to operate specific equipment for a period of time, without resupply, could facilitate seamless operations during a petroleum disruption. In addition, by understanding what is critical and non-critical will assist in the business decision to curtail or not-curtail a particular service.
Preparations for emergency evacuation should include ensuring adequate fuel supplies along evacuation routes’ stations to meet the anticipated demands of the public, emergency responders, and other governmental agencies. To achieve this assurance (prior to the event), the SEO, State Emergency Response Team (SERT), and industry stakeholders should request fuel status reports from local governments and fuel retailers along evacuation routes. Additionally, continued communications with critical fuel providers should be maintained for situational awareness. Obtaining an estimated fuel inventory assists in determining how much fuel may be needed to support essential functions including evacuations, if necessary. Before and during the event, the SEO and SERT may consider evaluating evacuation routes and performing an inventory of service stations along the evacuation route. The status of service station fuel supplies along the route(s) should be monitored and analyzed to determine if they can support evacuations and/or essential operations.
Maintaining a supply of gasoline and diesel during restoration and recovery from the emergency is critical. If a commercial fuel station resupply is needed, stations closest to the evacuation route should be identified first. Tanker trucks transporting the fuel should be pre-staged in secure areas and routed on non-evacuation route roads to the pre-determined stations. Routing tankers on non-evacuation routes allows the main evacuation routes to remain clear for passenger traffic and assists with a timely evacuation. The NCDOT, an active SERT member, can offer valuable information on appropriate fuel tanker routing. During severe shortages, escorts by law enforcement may be helpful in expediting tanker travel and securing fuel assets.

5-29
Electricity, a vital interdependency associated with petroleum delivery, is required at the retail level to pump and dispense fuel and to complete electronic transactions. Positioning emergency generators at key fuel stations along evacuation routes is an essential component of pre-event planning. These stations can provide critical fuel and supplies to residents and responders before, during, and after an evacuation. Fueling stations should be pre-wired for generators to facilitate timely installation. Information about the station’s generator availability can be found on an interactive map maintained online by the NC Department of Agriculture and Consumer Services.
In recent years, the state of Florida enacted legislation requiring retail stations within a half mile of evacuation routes to be equipped with a generator to power the pumps. In addition, all owners of more than ten retail stations in a Florida county must, within 24 hours of an emergency declaration, have a generator installed at 10% of their retail stations (U.S. Department of Energy, 2010). To assess North Carolina station generator availability, a recent NCEM study (sponsored by the SEO) found that approximately 15% of NC’s fuel stations either had generators or were pre-wired for their installation. This increase in generator-availability, possibly influenced by Hurricane Sandy’s impact on the northeast, will be beneficial for North Carolina in future energy emergencies. In addition, NCEM has contracted with Macro Companies to provide emergency fuel for first responders during petroleum shortage emergencies.
SEO and Governmental Agencies Pre-Event Planning Checklist for Petroleum
Disruptions
Review and verify the Points of the Contact list.
Coordinate with the NC Petroleum Council (NCPC), NC Petroleum Convenience
Marketers Association (NCPCMA), as well as NCEM to encourage stations in the
projected affected area to maintain at least 50% capacity.
Obtain status of commercial and government fuels 72-hours prior to a known
weather event.
Identify a reporting mechanism that will identify municipal fuel availability.
Identify fuel re-supply routes and security protocol (if needed).
Confirm the location of stations with generators (see NC DA&CS gas station
locator map).
Identify priority end users and determine identification method to:
o Identify types of petroleum that priority end users require
o Identify priority end user daily non-emergency consumption
o Identify priority end user 72-hour emergency consumption

5-30
Identify historical usage in large, medium, and small-sized communities in the
coastal, central, and mountain regions.
Identify and verify petroleum suppliers that can supply product to the State.
Work with NCEM to initiate its existing contract with Macro Companies to support
first-responders in the affected areas.
Work with NCEM to execute the contract for large long-haul fuel delivery.
SEO and Governmental Agencies Event Execution
When a potential petroleum disruption is identified, the SEO examines the historical data, such as product throughput and price, and compares it with the current market trends. For example, a hurricane threat in the Gulf of Mexico has traditionally affected petroleum’s spot and rack prices. Reasons for price fluctuations range from pure speculation to the possibility of reduced production or refinery operations. And petroleum prices across the state or in specific regions may increase as consumers increase demand by filling their tanks in preparation for the potential event. As North Carolina consumers and those in neighboring states demand more petroleum, the regional supply may become restricted. North Carolina must be prepared to take action to mitigate the impacts of a widespread reduction in petroleum supplies on its citizens.
The SEO will maintain contact with the NC Petroleum Council, the NC Petroleum Marketers Association, and pipeline officials to determine the effects of the shortage on the pipelines, terminals, and/or retail establishments. Consumer behavior at the retail level provides a good indicator of the petroleum climate within the state.
The SEO will compare current petroleum prices to that of historical prices (i.e. the previous week, month, quarter, or year) to determine what effect the current disruption has on retail prices. The reduced supply and increased demand will likely drive prices up, and it is important to understand what is considered acceptable market behavior and what is considered unreasonably excessive pricing. It is prudent to examine the guidance per North Carolina General Statute § 75-38, “Prohibit excessive pricing during states of disaster, states of emergency or abnormal market disruptions.”
There are three accepted levels of petroleum shortages, mild shortage (5%-10% deficit), moderate shortage (10%-15% deficit), and severe shortage (15% or more deficit). Figure 5-5-4 and Figure 5-5 depict examples of mild, moderate, and severe petroleum levels by month and volume for gasoline and diesel fuel, respectively. Data for these examples was obtained from an average of the state’s taxable gallons, as reported to the N.C. Department of Administration.

5-31
The SEO is aware that the petroleum industry provides for the maintenance and repair of its pipelines, terminals, and local distribution systems. Historically, the petroleum industry has initiated previously established Memorandums of Understanding (MOU) with other petroleum infrastructure organizations that can assist and facilitate timely restoration of services.
Figure 5-4: Trigger Graph of Taxable Gasoline Gallons
220,000,000
240,000,000
260,000,000
280,000,000
300,000,000
320,000,000
340,000,000
360,000,000
380,000,000
400,000,000
420,000,000G
allo
ns
Normal Conditions
5 Percent Reduction
10 Percent Reduction
15 Percent Reduction
Figure 5-5: Trigger Chart of Taxable Gallons of Diesel Fuel
50,000,000
55,000,000
60,000,000
65,000,000
70,000,000
75,000,000
80,000,000
85,000,000
90,000,000
95,000,000
Normal Conditions
5 Pecent Reduction
10 Percent Reduction
15 Percent Reduction

5-32
Trigger: Isolated disruption that persists for one week or more and/or a 5-10% reduction in supply
volume. Can be triggered by weather, national, or international events.
Public Information Campaign
A Public Information Campaign is one way to inform the public of pre-event and early-stage actions to reduce demand in the face of a petroleum disruption. Providing timely information about the current and forecasted energy situation will educate the public and afford citizens the opportunity to cope with or manage the situation with little or no governmental intervention. Information about conservation and efficiency measures should be provided through media outlets such as radio, television, social media, and printed publications. Enlisting partners (Department of Transportation/Motor Vehicles, local, county, and regional governmental entities) is beneficial to the campaign.
Mild Disruption Actions for Petroleum
Mild shortages are reflected in relatively short lines at fuel pumps (one to five vehicles). As the petroleum shortage situation increases, the SEO may determine that some intervention needs to be taken. The voluntary fuel-use reduction is one method to reduce demand. When policymakers ask the public for fuel-use reduction, it is their choice to comply voluntarily. Generally, a public appeal for voluntary action is estimated to net anywhere from a five to a ten-percent reduction in consumption. Measuring the impact is difficult since there are many other factors affecting the result. Some specific actions (e.g., not topping off the tank) should reduce the immediate demand for petroleum.
SEO, Governmental Agencies, and ESF-12 Checklist for Mild Disruptions
Determine the extent of the disruption and anticipated duration.
Monitor and track prices, supply and demand; the U.S. Energy Information
Administration (www.eia.gov), one of the most complete public energy data and
markets resources for supply and price data, which can assist in analyzing and
quantifying the market data energy markets information.
Identify the amount of available fuel in the ground.
Identify how much fuel may be available for transport.
Identify where the fuel may be needed the most.
Identify and confirm the entities that can transport fuel.
Identify how much fuel can be moved and in what time interval.
Governmental operations (state and local agencies) may consider the following actions:
Ask the Governor to initiate a public information message requesting that citizens
and agencies reduce non-essential travel.

5-33
Combine necessary travel with others; choose the shortest route to accomplish
tasks.
Initiate no-idling policy for government vehicles.
Voluntary Action Checklist for Mild Petroleum Disruptions
Encourage travel reduction by combining trips, mapping out routes efficiently,
walking instead of driving (if possible).
Encourage use of multi-passenger travel (public transportation, carpools, etc.).
Encourage alternative transportation such as walking or riding bicycles.
Encourage drivers to increase vehicle fuel efficiency by:
o Reducing average speeds
o Reducing idling (could save 15% in fuel efficiency)
o Perform regular vehicle maintenance (increases fuel economy by 4%)
o Inflate tires properly (+3% inefficiency)
o Use the most fuel-efficient vehicle for the task
Encourage speed limit compliance; lower speeds increase gas mileage (e.g., 60
MPH vs. 55 MPH drops efficiency by 6% and 75 MPH vs. 55 MPH drops it 24%).
Inform public of negative impacts of speeding (e.g., citation and insurance costs).
Utilize selective speed limit enforcement to increase public awareness; it should
be an educational tool, not a sanction to emphasize benefits and necessity of
conformity.
While voluntary checklist actions are being employed, the SEO Office and governmental agencies (city, county, and state entities) should consider a “no-idle” policy discussion.
At idle, vehicles achieve zero miles per gallon; a great loss when compared to its efficiency when in motion. The U.S. DOE estimates that a passenger vehicle idling for one hour uses 0.5 gallons of gasoline while heavy trucks use one gallon of diesel for every hour it idles. According to U.S. Department of Transportation, Federal Highway Administration, in 2016 there were 3,546,363 registered automobiles and 4,469,137 trucks in North Carolina. If the average automobile idles for 30 minutes/day (consider warm-up, traffic lights, slow-downs, etc.) and the average large truck idles for 4 hours per day (1,456-hours/year) then multiplying the gallons per day by the number of vehicles provides an estimate of potential fuel savings. Using this formula, potential fuel savings are estimated below.
Passenger Vehicle Idle Savings:
3,546,363 vehicles X 0.25 gallons/day= 887,000 gallons/day avoided
887,000 gallons’/day x 5-day work week= 4.435 million gallons/week avoided

5-34
For school bus “no idle” information, visit the U.S. Environmental Protection Agency’s Clean School Bus Idle Reduction website.
Moderate Disruption Actions for Petroleum
Moderate shortages occur when lines of five to ten vehicles are waiting at fuel pumps. The implementation of additional demand reduction measures can reduce lines and relieve pressure on limited supplies. During a moderate disruption, measures that target business, government, and educational organizations are added to those preceding initiatives that target the public during a mild disruption. Suggested additional initiatives from the SEO and ESF-12 Moderate Petroleum Disruptions Checklist follow below.
SEO and ESF-12 Checklist for Moderate Petroleum Disruptions
Continue all actions initiated in the Mild Disruption Phase.
Contact petroleum terminals, pipeline operators, and prime suppliers to obtainan estimate of available supplies.
Contact NC Petroleum Marketers and NC Petroleum Council for informationon:
o Current priceso Number of vehicles waiting in lines at station fuel pumps
o Estimate of supply levels
Discuss implementation of conservation options with appropriate entities.
Consider employer and school travel reduction planning (possible 25%demand reduction); public or private entities; schools/colleges, employerswith 50+ employees may implement the following actions:
o Employers encourage carpooling, vanpools, or public transportationo Offer carpoolers preferential parking to encourage multiple-occupancy
commuteso Vary work hours to avoid rush-hour congestiono Allow employees to telecommute based on longest commute,
congested routes, etc.
Truck Idle Savings:
4,496,137 trucks x 4 gallons/day= 17,984,548 gallons/day avoided
17,984,548 gallons’/day x 5-day week= 89.92 million gallons/week avoided
Trigger: Persistent and expanding supply disruption. May notice a 10-15% reduction is supply,
curtailments may be in place, and price may increase rapidly. Persistence two-or more weeks.

5-35
o Reduce vehicle commuting by work-related travel limits, webcasts, etc.o Increase the workday by two hours (10-hour day vs. 8-hour day) to
shorten work-week by one-day (4-day vs. a 5-day work week)
Secondary schools may discourage students from driving to/from school vs.riding the bus and by limiting field trips or distant travel to sporting events
o Coordinate with the Department of Public Instructiono Coordinate with local government officialso Coordinate with the school boardo Compile rules for students who drive to schoolo Determine enforcement actions
Governmental agencies should consider:o Encouraging teleconferencing and web-hosted conferences/meetingso Encouraging alternative work schedules (4 x 10/hour/day work week)o Encouraging carpools/vanpoolso Suspending non-essential travelo Essential travel only, consolidate trips, utilize the most efficient routeso Initiate a no-idling policy for vehicleso Consider one day (Friday) as a no travel day
Flexible Work Hours Discussion: A flexible work-hour option reduces vehicle travel idle time. Idling vehicles achieve zero miles per gallon; an inefficient use of a limited resource. If traffic volume is staggered, it may reduce vehicle idle time and make commuting more efficient while reducing overall fuel consumption.
There are several options when considering a flexible work hour plan.
1. Option 1: Divide the workforce into three separate groups. Group A may berequired to arrive two hours early, Group B may be required to arrive at theregular (8:00 am) time, and Group C may be required to arrive at 10 am.
2. Option 2: An individual flex schedule allows employees to set their ownschedule to avoid their normally heavy commute. This option allowsemployees to select the most efficient commute route/time, save gas, andreduce their own expenses.
3. Option 3: Initiate a four-day work-week so that employees work 10 hours/day. Their day off should be either on Monday or Friday. Additional energysavings can occur if the institution shuts down for the day. If it chooses toremain open, the organization could stagger employee schedules so that halfwould work Monday-Thursday and the other half would work Tuesday-Friday.This option could result in a 20% reduction in fuel consumption throughreduced employees driving. To achieve the intended effect, a publicinformation campaign, urging employees to participate, should support it.
No Travel Day Discussion: A “no travel day” helps avoid costs associated with routine daily travel. If the average employee drives 10 additional miles during the workday (incidental travel, lunch, etc.) in a 20 MPG vehicle, then 0.5 gallons would be consumed

5-36
daily. If only 25% of NC’s 3,546,363 registered passenger vehicles participate in “no travel,” over 440,000 gallons of fuel costs could be avoided, as shown below.
Severe Disruption Actions for Petroleum
A severe shortage is characterized by many long lines at fuel station pumps (more than ten vehicles waiting). Some stations may be out of fuel; compounding the problem and agitating the public. Severe shortage measures should include all measures implemented in the mild and moderate disruption checklists. This action adds actions such as minimum and maximum fuel purchase limits and lowering speed limits. The condition may lead to mandatory reductions and other reduction methods.
SEO, Governmental Agencies, and ESF-12 Checklist for Severe Petroleum Disruptions
Continue all actions included in the Mild and Moderate Disruption Phases.
Discuss issues and options with industry and governmental resources.
Discuss implementation strategies for the following interventions:o Odd/even day purchase plano Minimum fuel purchaseo Maximum fuel purchaseo Priority end userso Reduction in highway speed limitso Speed enforcement intensifiedo Fuel set aside
Request Governor to declare the State of Emergency
Contact U.S. DOE
No Travel Day Calculation:
Incidental travel= 10 miles/day
Vehicle efficiency around town= 20 Mpg
Registered passenger vehicles= 3,546,363
25% compliance= 886,590 passenger vehicles
649,069 X 0.5 gallons’ incidental travel= 443,295 gallons/day avoided
Trigger: Persistent and expanding supply disruption. A supply reduction of 15% or more is likely,
curtailments are in place, prices continue to increase, long lines at pumps. The situation has
persisted for several weeks and a timely resolution does not appear possible.

5-37
The Odd/Even Purchase Plan helps to relieve consumers from waiting in long lines at service stations. This schema allows only half of the motoring public purchase fuel on a given day. The state should identify that on odd numbered days (1st, 3rd, 5th….) only those vehicles with license plates ending with an odd number can purchase gasoline or diesel. The other half (even numbered plates) can purchase on even numbered days. For personalized plates, the last character could determine re-fueling for the vehicle; letters A-M re-fuel on odd days and letters N-Z re-fuel on even days.
Exceptions may be made for motorcycles/mopeds, priority end-users (public safety, public transportation), U.S. Postal Service, utility (electric and gas companies) and emergency vehicle recovery (tow-trucks), or any credentialed recovery-activity organization.
A minimum fuel purchase helps avoid the daily fuel tank “top-off” that some consumers practice during a fuel crisis. This action avoids the time consumed by “topping-off” the tank and the fuel consumed while other vehicles are idling as they wait to refuel. A minimum six-gallon purchase should discourage consumers from engaging in top-off behavior. This initiative may help discourage “topping-off” since drivers who practice it have to wait until they can purchase another full allotment of fuel.
Exceptions may be made for motorcycles/mopeds, priority end-users (public safety, public transportation), U.S. Postal Service, utility (electric and gas companies) and emergency vehicle recovery (tow-trucks), or any credentialed recovery-activity organization.
The maximum fuel purchase plan provides customers with the ability to purchase needed fuel to perform essential functions. A maximum limit should both discourage hoarding and encourage economical use of limited fuel resources. Initially, a 10-gallon limit should be instituted. A 10-gallon limit, when calculated with the average commute to work distance estimated as 30-mile round-trip per day and an assumed vehicle fuel efficiency of 20 miles per gallon (MPG), should allow 6.6 days of travel, (see below).
Exceptions may be made for include motorcycles/mopeds, priority end-users (public safety, public transportation), U.S. Postal Service, utility (electric and gas companies) and emergency vehicle recovery (tow-trucks), or any credentialed recovery-activity organization.
The odd/even, minimum, and maximum fuel purchase plans work best when implemented as a suite of conservation efforts. By themselves, the plans achieve some conservation, but when combined conservation increases overall.
10 Gallon Maximum Purchase Volume:
10 gallons X 20 MPG average= 200 miles per fill-up (average)
200 miles ÷ 30 miles/day commute= 6.6 days of travel

5-38
Enforcement of these actions could be problematic for station owners since implementation may be difficult if consumers become overly excitable. Law enforcement personnel availability may prevent timely response to incident disturbances or to supervise the implementation efforts. The success of the combined plans relies on the integrity of both station owners/operators and the public. An effective governmental public information campaign/public appeal can add to the success of these initiatives.
Priority End User Program
Priority end users should be exempt from the minimum and maximum purchase requirements. Priority end users (public safety, public transportation, U.S. Postal Service, electric and gas utilities, and emergency recovery vehicles) are essential to response and recovery activities. In advance of an energy emergency, priority end users should identify and develop relationships with owners/operators/distributors of local bulk fuel. Refueling at a distribution facility instead of a retail location allows priority end users to both avoid long lines and perceived/undue preferential treatment.
If a priority end users Memorandum of Understanding (MOU) is established, it should:
Coordinate with the Department of Transportation
Coordinate with the Department of Agriculture and Consumer Services
Coordinate with NCEM and municipal emergency management agencies toidentify/develop organizations to participate
Coordinate with transportation sector stakeholders
Identify critical organizations for priority
Establish agreements with fuel vendors
Establish an authorized priority end user database and an identification system(e.g., serialized stickers or credentialing system) designation for them
Reduction in Highway Speed Limit
A reduction in highway speed limits can reduce fuel demand if implemented. The U.S. DOE reports a vehicle speed of 60 miles per hour (MPH) vs. 55 MPH results in a 6% fuel efficiency loss (a 6% reduction for each 5 MPH increase). This loss is primarily due to increased wind resistance. Restricting speed limits to 55 MPH can produce significant aggregate fuel savings. To calculate potential savings, we must recognize and identify some “normal” condition characteristics, as follows. If a normal/average vehicle travels about 15,000 miles annually at a fuel efficiency of approximately 20 miles per gallon (MPG), then it uses about 750 gallons/year (15,000 miles at 20 MPG=750 gallons/year). Then this annual fuel demand is divided by 12 (months) to produce a monthly demand of 62.5 gallons per vehicle per month (750/12= 62.5). If the North Carolina registered vehicle total is multiplied by the monthly demand, then we can estimate monthly fuel demand in gallons. This calculation, based on 100% compliance, is unlikely to reach that level.

5-39
If the vehicle’s speed increases to 75 MPH, then its fuel efficiency falls by about 24% (6% x 4 increments of 5 MPH) which translates to increased demand at the pump. A 24% efficiency reduction indicates that the average vehicle will consume approximately 930 gallons per year (750 X 1.24=930 gallons/year). When divided by 12 (number of months in a year), a monthly demand of 77 gallons per vehicle per month (930/12= 77) is generated. To estimate aggregate monthly demand in gallons, we multiply the individual monthly demand by the number of registered vehicles.
Fuel consumed, when driving at 55 MPH vs. 75 MPH, equals about 14.5 gallons per vehicle per month. If all motorists adhered to a 55 MPH limit, a potential savings of 51 million gallons/month could be realized statewide. The calculation, based on 100% compliance, is unlikely to reach that level.
Strict Speed Limit Enforcement
Strict speed limit enforcement is a tool used to increase public awareness of the law. The enforcement should be as much a sanction as it is an educational tool. The educational message should emphasize the necessity of compliance.
Petroleum Set-Aside
Events that may lead to implementing a “petroleum set-aside” include a statewide or regional shortage similar to those experienced after Hurricanes Katrina and Harvey. When supply problems are widespread, state petroleum distributors may be on an allocation from the national suppliers or wholesalers. Mandatory action may be necessary to ensure that priority end-users have needed fuel to continue public safety
Passenger Vehicle Monthly Demand at 55 MPH:
3,546,363 vehicles X 62.5 gallons/month = 222 million gallons/month
Total Passenger Vehicle Demand at 75 MPH:
3,546,363 vehicles X 77 gallons/month= 273 million gallons/month
Mandatory Speed Reduction Avoided Consumption:
3,546,363 vehicles X 14.5-gallons/month= 51 million gallons/month statewide

5-40
and infrastructure-impacted recovery measures on behalf of the citizens. To be successful, this action requires coordination among the following agencies:
The NC Convenience Store and Petroleum Marketers Association
The NC Petroleum Council
The NC Department of Transportation
The NC Department of Agriculture and Consumer Services
The NC Department of Public Safety
Regional agencies such as Councils of Government
County, city, or town governments
The petroleum set-aside allocates limited volumes (~5%) of fuel to designated priority users to maintain essential governmental functions. This action strives to ensure the continuation of essential functions (such as public safety, trash removal, or mail services) during times of supply restrictions. It is for governmental use in the support of the people, and not for their direct use. However, the action may affect the public’s ability to procure petroleum products, since all petroleum set-aside fuels demand the current market price. Fuel may be more expensive because of its low supply and high demand.
The State Energy Office, in collaboration with DEM and DEQ leadership, may identify a fuel allocation manager to allocate a certain percentage (~5%) of the monthly fuel supply type to priority end users. The amount may be increased or decreased depending on the impending or forecasted situation. No single supplier will be required to set-aside more than the designated volume. The wholesaler, retailer, and/or prime supplier will maintain the set aside petroleum until SEO/DEM/DEQ orders its release. Actions necessary by the SEO are as follows:
Pre-Implementation Actions
Identify priority end user categories (e.g., public safety, sanitation, mail, electricand natural gas utility maintenance, etc.)
Identify consumption history of the government user (i.e. any agency uses X-gallons of X-fuel type daily and X-gallons of X-type fuel in emergencies)
Identify a reporting mechanism that utilizes NCEM’s WebEOC
Implementation Actions
Establish a list of approved priority end users
Determine the affected fuel type shortage
Within the first 7 days of the month, determine how much fuel is available from:o The most recent copy of the U.S. EIA’s 782C (Monthly Report of Prime
Supplier Sales of Petroleum) from EIA and/or prime suppliers
Determine fuel amounts/types allocated to set-aside (estimate percentage)o Use the historical demand for each entity.

5-41
o Compare historical vs. new demand(s) amount (current demand/normaldemand = ____ set-aside gallons needed).
Coordinate with the Energy Policy Council to determine the appropriate fuel mixfor set aside and obtain Governor’s approval
Evaluate and prioritize priority end user hardship requests
Coordinate with wholesaler/reseller to resupply approved priority end-users
Ensure the reseller is only selling to approved priority end-users
During the last 7 days of the month, determine remaining fuel amount inallocation
Determine how to expend the remaining fuel by consideration of:o Dividing remainder among the approved priority end userso Releasing the remainder for public consumption.
Determine if the fuel set aside must continue
Fuel set-aside program applicants may include those involved in agricultural production/distribution, aviation, cargo services (freight and mail), emergency services, utilities, and governmental entities. Organizations that wish to apply for the fuel set aside program are encouraged to:
Apply to become listed as a priority end-user
Make an honest determination whether or not it needs relief
Estimate how much fuel will be needed on a monthly basis
Apply for relief
Determine where resupply will take place
Receive and disperse fuel allocation
Determine the next month’s need and re-apply if necessary
Driver Hour Waiver
North Carolina is a consumer state that does not produce any petroleum so the prospect of increasing supply may prove difficult, especially during a regional shortage situation. The state can, however, open discussions with petroleum entities and facilitate an honest broker approach in procuring an alternative source of petroleum. It should be noted that the volume of petroleum that the pipeline moves restrict the state’s options. Additionally, the fuel volume is even more restricted when using ground transportation. Ground transportation raises several issues such as cost and time.
Time becomes an issue when drivers have to transport petroleum products such as gasoline, diesel, fuel oil, and propane for longer than normal distances. NC fuel distributors may have to take out-of-state round-trip excursions to procure petroleum from neighboring states or facilities. At either location, the round-trip driving time is likely to have an adverse effect on the timely delivery of the product. To alleviate the driver time restrictions, driver waivers may be requested to assist the State in acquiring the needed products. The driver hour waiver process begins with the NC Department of Transportation. A discussion about the Federal Driver Hour Waiver process follows.

5-42
The transportation of hazardous materials, such as petroleum, is governed by the Federal Motor Carrier Safety Administration (FMCSA). Safety is a transportation sector priority. To ensure the safety of the motoring public, drivers’ limits on the number of hours per day a driver may perform are required. However, there are instances when the limits may be waived. The first instance is when an emergency has been declared either by the President of the United States, the governor of a state, or by their authorized representatives who are authorized to declare emergencies. The second instance occurs when the FMCSA Field Administrator declares that a regional emergency (which justifies an exemption) exists.
The exemption applies to the drivers, who provide direct assistance or emergency relief to the affected area. The exemption expires once they are no longer engaged in direct assistance and can last no longer than 30 days from the date of the initial declaration. For example, if an emergency was declared in NC on August 1, the exemption would expire by August 31. If a driver is delivering supplies to an affected area, the waiver applies. However, if the driver is delivering to an unaffected area (e.g., Nebraska), the waiver does not apply. In a declared energy emergency, such as a severe petroleum shortage, petroleum delivery drivers have an exemption. The waiver allows drivers to drive additional hours for delivery or to reach distant supply terminals and return expeditiously. Drivers passing through multiple states do not require that waivers be in effect in those states if they are providing supplies to an area where an emergency has been declared. Detailed information about the Driver Waiver and regulation relief is available on the FMCSA site.
The following checklist may be used to assist in the business decision to apply for the Driver Hour Waiver, and to effectively gather essential facts and organize them into a succinct document:
5.4.4.16.1 Initial Data Acquisition Checklist:
Determine if the event is/will be disrupting petroleum flow or essentialservices/supplies.
Contact the petroleum industry to:o Determine if they want to request waiver assistanceo Identify the disruption cause(s), the degree of severity, affected area(s),
and estimated time to return to normal service
Determine current supplies and estimate how long they will last.
Determine effects on the economy and people if the disruption continues.
Determine which retailers/suppliers are/will be affected by identifying:o How many fuel suppliers are on contract vs. not on contract for the
product?o Are all available drivers delivering the product?o Which portion of the state is affected the most?
Determine which terminals are or will be affected by asking:o Are allocations in place for contract/non-contract carriers?

5-43
o Are there lines waiting for the product?o How many trucks are in line?o What is the estimated wait time?o Have third-party drivers been contracted?
Determine if both pipelines serving NC are/will be affected by asking:o Has the pipeline been damaged?o How long before it/they return to normal?
Determine where the disruption originates (in state, region, or country)
Determine if the disruption is/will cause significant harm to NC’scitizens/economy
Contact surrounding PADD-1C states to determine if the disruption has/isdisrupting the flow of petroleum, essential services, or supplies and if:
o Are the other states getting supplies?o If so, how and from what source(s)?
Consult with the NC Department of Transportation regarding the needed durationof a driver waiver (consider round trip distance/time in the calculations).
Considerations for Driver Hour Waiver Requests
Has an emergency been declared?
Weather forecast (will it improve or worsen)?
Status of secondary roads, highways, bridges, and Interstate highways.
How long (estimated) will it take to get supplies?
How many persons or homes will be affected?
How many vehicles/trucks are/will be impacted?
Pertinent regulations include:o Hazardous Materials regulations under 49 CFR Parts 100-185.o Controlled substance and alcohol use and testing under 49 CFR Part 382.o Commercial Driver’s License (CDL) standards; requirements, and
penalties under 49 CFR Part 383.o Minimum levels of financial responsibility (insurance) under 49 CFR Part
387.
Fuel Specification Waivers
Severe petroleum product emergencies usually result from national or international events that are beyond the ability of state agencies to influence. Recent examples of fuel emergency waivers include 2016’s Hurricane Matthew and the Colonial Pipeline leak/fire and 2017’s Hurricanes Harvey and Irma. The events impacted fuel supplies, deliveries, and in the Colonial event, Federal Reformulated Gasoline (RFG) Requirements were waived by the federal government. The Clean Air Act, Section 211(c)(4)(C), which authorizes fuel waivers, specifies the criteria for granting a fuel waiver, and the conditions that must be included in a fuel waiver.

5-44
A federal fuel waiver can be granted during a gasoline or diesel fuel supply emergency by the U.S. Environmental Protection Agency (EPA) with the agreement of the U.S. Department of Energy (DOE). Fuel or fuel additive requirements may be temporarily waived to alleviate the fuel supply emergency. Several agencies assist in the request including the NC DEQ, NC DPS, the NC DOT, and representatives from the petroleum industry. However, only the Governor may request an EPA fuel waiver via a formal written request to the EPA Administrator. The request should include the following information:
The nature of the event
The geographical areas affected
Type(s) of fuel that is/are unavailable
An explanation of why prior planning did not or could not prevent the shortage
The effects being experienced (gas stations and/or citizens without fuel)
The expected duration of the shortage
The type(s) of fuel(s) being waived
The expected effects and duration of the waiver
The waivers will apply to the smallest possible area for a maximum of 20 calendar days
that includes a transitional period. Since any liability resulting from the waiver resides
with the requesting state, careful consideration must be given when requesting the
waiver. In order to expedite the request, it may prove beneficial to:
Coordinate with surrounding states to form a waiver group.
Coordinate internally with NC Governor’s staff, DEQ, Department of Agriculture
and Consumer Services, and other agencies to determine if any state regulations
must also be waived.
Compile fuel supply and projected consumption data that includes impacted and
alternate fuels to substantiate the request.
Outline current and future efforts to seek alternative sources of compliant fuel.
Written fuels waiver requests should be addressed to:
Administrator
U.S. Environmental Protection Agency
1200 Pennsylvania Avenue, N.W.
Washington, DC 20460

5-45
The request should be mailed to the following address:
Assistant Administrator for Enforcement and Compliance Assurance
Mail Code 2201A, Room AR 3204
U.S. Environmental Protection Agency
1200 Pennsylvania Avenue, N.W.
Washington, DC 20460
A copy of the waiver request should also be sent by facsimile to the following telephone
numbers: (202) 501-3842; (202) 564-0069; and (303) 312-6003. Once submitted, the
U.S. EPA and the U.S. DOE will jointly evaluate its validity/justification and grant the
waiver if warranted. The U.S. EPA administrator will issue the waiver if approved.
More information on Federal waivers, including the Jones Act, can be found on the
Energy Waiver Library page at (https://www.energy.gov/ceser/energy-waiver-library).
Jones Act Waiver
A Jones Act waiver may be needed to assist and relieve the state during a severe petroleum shortage. The Act prohibits ships that are not registered in the U.S. from delivering cargo to U.S. ports. A waiver of the Jones Act enables the U.S. DOT and the U.S. DOE to deliver fuel into U.S. ports, by using any available (foreign) cargo shipping vessels.
The Governor must request the waiver through the U.S. DOT and the U.S. DOE. If needed, the SEO should contact the DOE’s Office of Electricity Delivery and Energy Reliability (OE), Infrastructure Security and Energy Restoration (ISER) for assistance with this process.
SEO and ESF-12 Checklist for Recovery
Verify that the NC pipelines, terminals, and infrastructure is returning to normal.
Notify DEQ/SEO leadership and NCEM leadership.
Inform the public via public information protocol.
Prepare an after-action report to:
Review and document estimated time and actual time to initial recovery.
Review and document estimated time and actual time to full recovery.
Review and document the key successes and the failures.
Identify lessons learned from the SEO, utilities, public, and private entities.
Incorporate findings/improvements into this EAP.

5-46
Bibliography
Code of Federal Regulations (CFR). Title 49, Subtitle B, Chapter 3, Subchapter B, Part 390-Federal Motor Carrier Safety Regulations; General: (https://www.ecfr.gov/cgi-bin/retrieveECFR?gp=1&ty=HTML&h=L&mc=true&=PART&n=pt49.5.390
CFR. Hazardous Materials Regulations-Title 49,Parts 100-185 : https://www.gpo.gov/fdsys/pkg/CFR-2010-title49-vol2/pdf/CFR-2010-title49-vol2.pdf
CFR. Controlled Substance and Alcohol Use and Testing-Title 49, Part 382: https://www.fmcsa.dot.gov/regulations/title49/part/382
CFR. Commercial Driver’s License-Title 49 CFR Part 383: https://www.fmcsa.dot.gov/regulations/title49/part/383
CFR. Minimum levels of financial responsibility (insurance)-Title 49 CFR Part 387: https://www.fmcsa.dot.gov/regulations/title49/part/387
Macro Companies. NCEM Emergency Fuel Contractor : http://www.macrocompanies.com/service-areas/emergency-fuel-management
National Association of State Energy Officials’ (NASEO). Energy Emergency Assurance Coordinators: (www.naseo.org/eeac)
NASEO. Energy Assurance Planning: http://www.naseo.org/energyassurance
NC Department of Agriculture and Consumer Services. Gas Station Locator : (http://www.ncmhtd.com/Standards/GasStations/).
NC General Statute (GS) 113-B-1. Electric light and Power : https://www4.ncleg.net/enactedlegislation/sessionlaws/pdf/2013-2014/sl2013-365.pdf
GS 75-38. Prohibit Excessive Pricing During States of Disaster: https://www.ncleg.net/enactedlegislation/statutes/pdf/bysection/chapter_75/gs_75-38.pdf
NC Utilities Commission (NCUC). Commission Rules and Regulations, Chapter 8, Article 7: https://www.ncuc.net/ncrules/Chapter08.pdf
NCUC. Natural Gas Safety Standards for Pipeline Facilities: https://www.ncleg.net/EnactedLegislation/Statutes/HTML/BySection/Chapter_62/GS_62-50.html
NCUC. Natural Gas-Chapter 6, Rule R6-19.2, Curtailment of Service : https://www.ncuc.net/ncrules/Chapter06.pdf

5-47
NCUC. Natural Gas-Chapter 6, Article 8, Safety : https://www.ncleg.net/EnactedLegislation/Statutes/HTML/BySection/Chapter_62/GS_62-50.html
NC Department of Public Safety-Division of Emergency Management (NCDPS-EM). NC Emergency Operation Plan (EOP): (https://files.nc.gov/ncdps/documents/files/Divisions/EM/EOP/NCEOP_2017_FINAL.pdf)
NCDPS-EM. ESF-12 Planning Tool: https://rmp.nc.gov/portal/#
U.S. Department of Energy (DOE). How Energy-Efficient Light Bulbs Compare with Traditional Incandescents: https://www.energy.gov/energysaver/save-electricity-and-fuel/lighting-choices-save-you-money/how-energy-efficient-light
DOE. Cybersecurity, Energy Security, and Emergency Response: https://www.energy.gov/ceser/energy-assurance
DOE. Fuel Economy.gov : (http://www.fueleconomy.gov/feg/drive.shtml
DOE. Energy Waiver Library : https://www.energy.gov/ceser/energy-waiver-library
U.S. Energy Information Administration (EIA). 2018 Annual Energy Outlook: (https://www.eia.gov/outlooks/aeo/ )
EIA. Energy Outlook 2018: https://www.eia.gov/outlooks/aeo/
EIA. Today in Energy: www.eia.gov
EIA. EIA-782C - Monthly Report of Prime Supplier Sales of Petroleum Products Sold for Local Consumption: https://www.eia.gov/survey/form/eia_782c/instructions.pdf
U.S. Environmental Protection Agency (EPA). Clean School Bus Idle Reduction: (https://www.epa.gov/cleandiesel/clean-school-bus-idle-reduction#WhyIdle

i
Volume 6 - Critical Infrastructure Protection and Resiliency Plans Volume 6 - Critical Infrastructure Protection and Resiliency Plans ....................................... i
Table of Contents ....................................................................................................................i
Table of Figures ................................................................................................................... ii
Table of Tables .................................................................................................................... ii
6.1 Aging Generation Fleet .............................................................................................. 6-1
6.2 The Smart Grid............................................................................................................. 6-3
6.2.1 Advanced Metering Infrastructure (AMI) ................................................................ 6-6
6.2.2 Transmission and Distribution ............................................................................... 6-6
6.2.3 Utilities .................................................................................................................. 6-6
6.2.3.1 Demand Response (DR) ................................................................................ 6-6
6.2.3.2 Common Interoperability Standards ............................................................... 6-7
6.2.4 Not in My Backyard (NIMBY) ................................................................................ 6-8
6.2.5 Policymakers ........................................................................................................ 6-8
6.2.5.1 Policy Initiatives Introduced ............................................................................ 6-9
6.2.6 Local Partnerships ............................................................................................. 6-9
6.2.7 Regulators ....................................................................................................... 6-10
6.2.8 Smart Grid Pilot Deployments ......................................................................... 6-10
6.3 Transportation ........................................................................................................... 6-15
6.3.1 Ethanol and Biodiesel Supply .......................................................................... 6-16
6.3.2 Federal Policy Initiatives .................................................................................. 6-16
6.3.3 State Policy Initiatives ...................................................................................... 6-17
6.3.4 Laws and Regulations ..................................................................................... 6-18
6.4 Plug-In Hybrid Electric (PHEV) and Plug-in Electric Vehicles (PEV) ........................ 6-21
6.4.1 Policy Incentives ............................................................................................... 6-22
6.4.2 PEV Charging Infrastructure ............................................................................. 6-22
6.4.3 Federal Initiatives ............................................................................................. 6-23
6.4.4 State and Private Sector Initiatives ................................................................... 6-23
6.4.5 Impact on the Existing Infrastructure ................................................................ 6-24
6.4.6 Challenges ....................................................................................................... 6-25
6.5 Energy Storage ........................................................................................................ 6-26
6.5.1 Technologies .................................................................................................... 6-26

ii
6.5.2 Applications ...................................................................................................... 6-27
6.5.3 Challenges ....................................................................................................... 6-28
6.5.4 Federal Initiatives ............................................................................................. 6-28
6.5.5 State Deployments ........................................................................................... 6-29
6.6 Cyber Security .......................................................................................................... 6-29
6.6.1 Security Issues ................................................................................................. 6-30
6.6.2 Interoperability and Cyber Security Standards .................................................. 6-33
6.6.3 Regulatory Hierarchy and Federal Initiatives .................................................... 6-33
6.6.4 State Initiatives ................................................................................................. 6-33
6.6.5 Challenges ....................................................................................................... 6-34
Bibliography..........……...………………………………………………………………………….....6-36
Table of Figures
Figure 6-1 Hierarchy of Infrastructure Upgrades ......................................................................6-1 Figure 6-2 Regulated Power Plants ..........................................................................................6-2 Figure 6-3 Smart Grid System ..................................................................................................6-4 Figure 6-4 Data Flow Through a Smart Grid System ................................................................6-4 Figure 6-5 U.S. Electric Distribution Smart Grid Upgrade Cost .................................................6-5 Figure 6-6 Smart Devices to Monitor Individual Consumption ................................................. 6-6 Figure 6-7 Fayetteville Customer Electric Savings ................................................................. 6-10 Figure 6-8 Demand Response Program Illustrates a Reduction in Customer Load ................ 6-12 Figure 6-9 Duke Energy Envision Charlotte Digital Display Concept ...................................... 6-13 Figure 6-10 Controlled Event Capturing Energy Usage on Comparable Days ....................... 6-14 Figure 6-11 Some Alternate Fuel Sources ............................................................................. 6-16 Figure 6-12 NC Government Fuel Portfolio Pre-PDP ............................................................. 6-20 Figure 6-13 NC Government Fuel Portfolio Post-PDP ............................................................ 6-20 Figure 6-14 HEV, PHEV and EV ............................................................................................ 6-21
Table of Tables
Table 6-1 Comparison of New Power Plant Costs ...................................................................6-3
Table 6-2 Current Utility Pricing Scenarios ...............................................................................6-7
Table 6-3 Common Alternative Fuels ..................................................................................... 6-16
Table 6-4 Alternative Fuel Incentives ..................................................................................... 6-17
Table 6-5 Laws and Regulations Promoting Alternative Fuel in North Carolina ...................... 6-18
Table 6-6 NC’s State Vehicle Purchases from PDP Implementation ..................................... 6-19
Table 6-7 NC’s State Vehicle Petroleum Displacement Since PDP Implementation ............... 6-19
Table 6-8 Savings from Fuel Reduction ................................................................................. 6-20

iii
Table 6-9 Engines for HEV, PHEV and EVs ........................................................................... 6-21
Table 6-10 PHEV and PEV Incentives .................................................................................. 6-22
Table 6-11 Vehicles Powered by Petroleum vs. Electricity .................................................... 6-22
Table 6-12 Federal Initiatives ................................................................................................. 6-23
Table 6-13 NC Get Ready! Initiatives ..................................................................................... 6-24
Table 6-14 EV Charging Levels ............................................................................................. 6-25
Table 6-15 Kelly Blue Book Electric Cars: PEV & EV ............................................................ 6-26
Table 6-16 Overview of Energy Storage Technologies ..........................................................6-27
Table 6-17 Energy Storage Functions ................................................................................... 6-27
Table 6-18 Examples of Cyber Security Attacks on Public Infrastructure ............................... 6-32
Table 6-19 Cyber Security Issues .......................................................................................... 6-32

6-1
6 CRITICAL INFRASTRUCTURE PROTECTION AND RESILIENCY
PLANS
The EIA projects in its 2018 Annual Energy Outlook that total U.S. electricity demand will increase 0.9% annually through 2050, when the national electricity consumption will be 5,110 billion kilowatt-hours. To meet this projected demand, EIA provides that 58.8 gigawatts of electric power capacity must be added to existing electrical generation infrastructure.
In recent years, there has been an increase in the number and cost of outages caused by natural weather conditions or high demand load. Additionally, some coal-fired generation plants and transformers are approaching the end of their expected useful life. Utilities are responding to the challenge by upgrading their electric grid infrastructures. Figure 6-1 (above) displays one example of a hierarchy of electrical infrastructure system upgrades.
In addition, much of the grid operations and maintenance workforce is nearing retirement. Even though increased automation may mitigate the impending impact of a shrinking utility workforce, utilities are now partnering with local community colleges to fill the expected workforce gap.
Although nearly 40 states, including North Carolina, have adopted a Renewable Energy and Efficiency Portfolio Standard (REPS) that requires greater use of renewable energy sources, the existing power grid cannot adequately respond to intermittent generation. Electrical load growth, including all electric vehicles (EVs) and plug-in hybrid electric vehicles (PHEVs), can add stress to utilities’ aging infrastructure.
Aging Generation Fleet
Electric generation plants in North Carolina and in the U.S. at large are nearing the end of their lifecycles. According to David Fountain, immediate past president of Duke Energy North Carolina: “when we improve our energy infrastructure, we not only improve power quality and reliability for everyone, but we help grow our economy and create jobs while keeping energy at a reasonable price… and now we must invest to make the system that delivers that energy even smarter.” Figure 6-2 shows information about Duke Energy’s (DE) existing major regulated electric power plants and the utility’s recently retired coal plants in North Carolina.
Figure 6-1: Hierarchy of Infrastructure Upgrades
Cybersecurity
Transmission & Distribution
Power Generation
Energy Storage
AMI
EV

6-2
Seven coal-fired plants, ranging from 64 to 95 years old, were retired from the DE generation fleet between 2011 and 2013. To compensate for these retirements, DE (the largest U.S. electric utility and the state’s primary electric provider) spent approximately $9 billion on power plant capital construction from 2011 to 2013. In 2017, DE initiated Power Forward Carolinas, a 10-year project set to invest $13 billion to harden their grid against outages, cyber-attacks and physical threats, and help expand renewable energy. According to DE, this construction and modernization project will: replace retiring assets; increase generating capacity; and stimulate economic growth. This plan is currently pending NCUC decisions and may be subject to significant revision.
A 2013 to 2016 comparison of capital cost estimates and generation capacities for new U.S. power plants construction is shown in Table 6-1. During that period, coal and nuclear plant costs stabilized, as did the costs for natural gas combined-cycle and combustion turbines which generally remained unchanged. Changes in capital costs for wind and solar show significant reductions of 25% and 67%, respectively.
Biomass bubbling fluidized bed (BFB) capital costs increased by approximately 12% during the same period. Federal production tax credits (PTC) for biomass plants were available (for the first 10 years of operation) if the plants commenced construction by the end of 2016. PTCs have no longer been available since 2017, with the exception of wind energy facilities.

6-3
Overnight Capital Cost ($/kW) Nominal Capacity MW's
2013 2016 % Change 2013 2016
Coal
Single Unit Advanced PC $3,246 N/A N/A 650 N/A
Dual Unit Advanced w/CCS $5,026 N/A N/A 1,300 N/A
Ultra Super Critical w/CCS N/A $5,084 N/A N/A 650
Natural Gas
Conventional CC $976 $978 0.03% 620 702
Advanced CC $1,088 $1,104 1% 400 429
Advanced CC with CCS $2,229 N/A N/A 340 N/A
Conventional CT $1,035 $1,101 6% 85 100
Advanced CT $719 $678 -6% 210 237
Fuel Cells $7,562 N/A N/A 10 N/A
Nuclear
Nuclear $5,883 $5,945 1% 2,234 2,234
Renewables
Biomass BFB $4,377 $4,985 12% 50 50
Geothermal $6,641 N/A N/A 50 N/A
MSW - Landfill Gas $8,312 N/A N/A 50 N/A
Conventional Hydropower $2,936 N/A N/A 500 N/A
Wind Onshore $2,213 $1,177 -25% 100 100
Wind Offshore $6,230 N/A N/A 400 N/A
Solar Thermal $5,390 N/A N/A 20 N/A
Solar Photovoltaic $4,450 $2,671 -67% 20 20
Table 6-1 Comparison of New Power Plant Costs (Source: EIA, November 2016)
The Smart Grid
An electricity distribution system “smart grid” incorporates two-way automatic digital communications to manage electrical power delivery and stability. It upgrades the existing power grid, which was designed in 1920s, to incorporate 21st century digital communications technology. A smart grid has the potential to reduce operational costs and increase reliability and power quality. Figure 6-3 illustrates an example of a comprehensive smart grid system.

6-4
A smart grid enables consumers to proactively manage power usage. For example, they will have the choice to operate electric clothes dryers during periods of lower electric rates or to turn off electric water heaters when no one is home. Since power systems cannot communicate the hourly electric rate information, presently, consumers cannot make informed choices about power cost and usage options. When a home has smart meters installed and is connected to a smart grid, two-way digital communications between the home and the utility are established. With smart meters and a smart grid,
Figure 6-4: Data flow through a smart grid system
Figure 6-3: Smart Grid System (Source: Automation Nation)

6-5
the consumer now has options to consider hourly, fluctuating real-time pricing, and the ability to avoid energy use during peak and critical-peak periods. Figure 6-4 illustrates the two-way flow of information.
In 2011, the Electric Power Research Institute (EPRI) estimated costs from $338 to $476 billion to implement a fully-functioning national smart grid. EPRI estimated potential benefits of between $1.3 and $2 trillion for a national smart grid installation (EPRI, 2011). The estimate included costs of new hardware, communication and information technologies, market structures, demands of an increasingly digital society, increasing deployment of renewable power production and grid integration, expansion and maintenance of existing infrastructure, and technologies and systems to address grid security. EPRI’s low to high-cost analysis is shown in Figure 6-5.
Figure 6-5: U.S. Electric Distribution Smart Grid Upgrade Costs (EPRI: Estimating the Cost and Benefits of the
Smart Grid)
0
10,000
20,000
30,000
40,000
50,000
60,000
DistributionAutomation
Intelligent UniversalTransformers
Advanced MeteringInfrastructure
Local EnergyNetworks
$ in
Mill
ion
s
Smart Grid Upgrade Cost Estimate for Existing U.S. Distribution System
Low Cost Estimate High Cost Estimate

6-6
Advanced Metering Infrastructure (AMI)
Advanced metering infrastructure (AMI) allows consumers to reduce electricity costs and system demand loads. Consumers have energy choice options that fit their lifestyles and allow them to manage their home’s energy consumption. AMI allows for smart appliances, such as thermostats and water heaters, to communicate to a Home Area Network (HAN) either through a wireless or cable connection. The HAN transmits energy consumption data using the utility’s smart meter. Data collected by the HAN may be accessible by consumers using computers or smart phones, as shown in Figure 6-6. Plug-in electric vehicles (PEVs), energy storage devices, and renewable energy technologies may also be connected to the HAN. The smart meter’s HAN data is transmitted to the utility through a limited-range network such as a field area network (FAN) or a neighborhood area network (NAN). The FAN/NAN collects data from smart meters within its range and sends it to the local utility substation’s Wide Area Network (WAN).
Transmission and Distribution
The utility’s WAN collects data from several area FANs/NANs, transmission lines, distribution nodes, and substation transformers to improve power quality and track energy usage. Synchro-phasors, next-generation sensors installed at substations to maintain the reliability of the power grid, help utilities avoid unplanned failures, reduce maintenance costs and extend useful transformer life. When used, synchro phasors improve utility maintenance response time and reduce system failure. In addition, these sensors facilitate the integration of renewable power generation, identify localized power outages caused by equipment failure, and rapidly reroute power in real-time to meet consumer demands.
Utilities
The utility substation’s WAN aggregates the collected energy data and transmits it to the Local Area Network (LAN) at the utility’s central location using Meter Data Management (MDM) software. The utility’s LAN transmits the data to its control center to be analyzed through a grid optimization program. This program will automatically take action to optimize power grid function for maximum efficiency. For example, if a power line goes down, the grid optimization program will automatically notify the utility operators and reroute power to the affected areas.
6.2.3.1 Demand Response (DR)
Demand response (DR) allows utilities to manage customer electricity consumption in response to power supply conditions. DR is becoming a more prevalent management
Figure 6-6: Smart Devices to Monitor Individual Consumption

6-7
strategy, especially during peak consumption periods, such as early afternoon in the summer or early morning in the winter. This technology implementation can have a significant effect on reducing load demands. To meet this “peak” demand, utilities would normally activate their seldom-used, expensive, and high-carbon emission internal combustion turbine (CT) generator power plants (also called peaking plants). Once consumer load demand has been reduced, CTs can be taken offline. Demand response load reduction programs are often referred to as a “virtual power plants.”
With the integration of additional smart grid applications, demand load reduction programs are expected to increase and result in additional virtual power plants. DR growth may ultimately reduce the number of power plants required to meet consumer demand. As a result, hard assets and initial capital investments are reduced. It also provides consumers with some flexible pricing options as shown in Table 6-2.
Real-time Peak-time Critical-Peak
Rates are based on hourly fluctuations in wholesale markets, which enables consumers to plan their electric use to coincide with low prices.
The traditional blended rate applies, but customers can qualify for rebates by reducing demand load during peak periods.
Prices can increase by 500% during these periods; limited to a small number of hours/year. Customers on this rate will pay slightly lower rates for the remainder of the year.
Table 6-2: Current Utility Pricing Scenarios
6.2.3.2 Common Interoperability Standards
The Supervisory Control and Data Acquisition system (SCADA) monitors and controls the generation, transmission, and distribution of electrical power. SCADA collects data from monitoring devices (i.e. sensors, switches, or relays) to remotely control utility computers and databases. SCADA is the common language different electric grid systems use to communicate with each other.
Communications between smart devices (i.e. thermostats, PEV, etc.), HANs, smart meters, FAN/NANs, and WANs may use different software protocols to operate. They may all, in fact, speak different “languages” that depend on the individual vendor-installed software. To “translate” the data from the different sources, a “common language" or platform must be used. Organizations such as the National Institute of Standards and Technology (NIST), Federal Energy Regulatory Commission (FERC), the Universal Smart Network Access Port Alliance (USNAP), and the Electric Power Research Institute (EPRI) are working to establish common interoperability standards to which the various software vendors must adhere.
Communication channels may vary. Those most commonly utilized in the U.S. include radio frequency (RF), power line communications (PLC), Wi-Fi, 3G, 4G/WiMax, and cables. Because of the high density of aggregate information that is transmitted from each smart meter to a FAN/NAN, latency (the time for data to travel from point A to point B) challenges the utilities’ attempts to react and to provide customers with real-time information. Smart grid pilot deployments in North Carolina and others throughout

6-8
the nation are assisting in determining the appropriate equipment technologies and computer software protocols needed based on their locations, climate, and performance efficiency.
Not in My Backyard (NIMBY)
North Carolina’s historically strong association with agriculture and a rural lifestyle gives a high priority to maintaining green spaces. A study by Trust for Public Lands’ found that from 1998 to 2009, North Carolina spent $73 million annually to acquire or protect 289,000 acres of wetlands, forests, and farmland. In 2017 alone, the Conservation Trust for North Carolina protected over 16,000 acres, for a total of over 450,000 acres protected over about 25 years. North Carolina continues to see its population increase, bringing the rapid spread of urban development. The expansion and modernization of existing power systems creates a significant challenge because of difficulties in locating and siting new overhead transmission lines in electrical load growth areas. Resolving this dilemma requires deploying electronic solutions to increase power density flow through existing power lines and developing low impact grid solutions that consider land-use concerns while continuing to provide service to smaller, remote areas and towns.
For example, some California utility customers participating in smart grid deployments and those in other locations have voiced electromagnetic hypersensitivity health concerns because of the radio frequencies (RF) used by AMI or wireless smart meters. AMI advocates claim that smart meter RF–generated amounts are relatively low when compared to cell phones, Bluetooth headsets, and Wi-Fi routers. An EPRI study shows that since most Americans already live in areas permeated by RF, AMI does not pose a known health risk. Similarly, a study by the California Council on Science and Technology found that “to date, scientific studies have not identified or confirmed negative health effects from potential non-thermal impacts of RF emissions such as those produced by existing common household devices and smart meters”. Notwithstanding these studies, Pacific Gas and Electric filed a California Public Utilities Commission (CPUC) proposal that allows its customers to opt-out of smart meter installations.
The integration of information and communications technology with consumer energy usage creates a new suite of privacy concerns. Traditionally, utilities are custodians and not the owners of customer data. Since utilities own the system(s) that collect and store the customer’s data, consumer advocates hold the utility accountable for ensuring that this data is not misused. Concerns exist that consumer energy data, automatically collected and analyzed daily, could be a valuable resource to private firms.
Policymakers
As the State’s population and consumer electric power demand increases, major infrastructure improvements have become a national priority. The smart grid system provides resilient operation against cyber and physical attack, and it allows authorities to respond quickly and efficiently to natural disasters. An innovative “smart grid” industry

6-9
is developing new products, services, and markets. To facilitate a smooth transition in this integration of new systems, state government officials have introduced policy initiatives in the North Carolina General Assembly.
6.2.5.1 Policy Initiatives Introduced
Some significant state initiatives to improve energy reliability are now part of North Carolina’s General Statutes.
The Energy Policy Council (EPC), created by Chapter 113B of the NC General Statutes, advises the Governor and the General Assembly on the “development of a long-range unified energy policy to encompass comprehensive energy resource planning and efficient management of existing energy resources in relation to economic growth, to effectively meet an energy crisis, to encourage development of alternative sources of energy that are capable of achieving a positive benefit-to-cost ratio, and to ensure efficient utilization of energy resources in a manner consistent with assuring a reliable and adequate supply of energy for North Carolina.” The SE Office serves as staff to the EPC’s quarterly meetings and to its subcommittee meetings as requested. The SE Office also assists in compiling, developing, and distributing the Energy Policy Council Biennial Report which serves as “comprehensive report providing a general overview of the energy conditions of the State of North Carolina.”
In 2007, the Renewable Energy and Energy Efficiency Portfolio Standard (REPS) was enacted by the North Carolina General Assembly to: diversify the resources used to reliably meet the energy needs of consumers in the State; provide greater energy security through the use of indigenous energy resources available within the State; encourage private investment in renewable energy and energy efficiency; and provide improved air quality and other benefits to energy consumers and citizens of the State.
Local Partnerships
The Research Triangle Park (RTP), a hub of research, academia and industry triangulated between the cities of Raleigh, Durham, and Chapel Hill, is poised to help North Carolina become a leader of the U.S smart grid industry. North Carolina’s strong governmental relationships and participation with the organizations from RTP, Raleigh, and Charlotte will assist our transition toward a leadership role in clean energy technology.
As one of the top-ranked engineering schools in the U.S., North Carolina State University (NCSU) has strong ties to utilities and to RTP’s technology industry. The ABB Group has provided significant financial support to NCSU’s Department of Electrical and Computer Engineering for its power engineering and research efforts. NCSU’s Centennial Campus, the home to one of two ABB Corporate Research Centers, has established its Smart Grid Center of Excellence with a $10 million initial investment. ABB also provides additional funding to NCSU for research and fellowships.
The Future Renewable Electric Energy Delivery and Management (FREEDM) Systems Center, a National Science Foundation (NSF) Engineering Research Center, is

6-10
headquartered at NCSU. The FREEDM Center is developing technologies to help modernize the nation’s energy grid.
The Energy Production & Infrastructure Center (EPIC) at the University of North Carolina-Charlotte (UNC-C) is a state-of-the-art research center that offers opportunities for education and research to students who are interested in energy studies. Some of EPIC’s affiliates include Duke Energy, EPRI, Siemens, Energy United, Piedmont Natural Gas, and Power Engineers.
Regulators
Expansion of the smart grid is depends on regulatory agencies that are directed to balance competing energy-supply priorities. Regulators must keep utility service reliable and affordable, diversify the electrical energy portfolio with renewable sources, and modernize transmission and distribution equipment. To assist with this goal, the Federal Energy Regulatory Commission (FERC) and NARUC Smart Response Collaborative was created. The Collaborative is focused on facilitating the smart electric grid transition by helping regulators understand new developments and how they may impact consumers.
Regulators also collaborate with public and private sector stakeholders to determine regulatory and market solutions that yield private sector investments in electric systems. This process includes recognizing that smart grid deployments should reflect regional needs and conditions. Regulators must plan for the evolution of regulatory changes as technology develops by recognizing the new challenges in communications, data management, and cybersecurity.
Smart Grid Pilot Deployments
Utilities believe that smart grid deployment may be an important component of meeting future energy needs. Prior to installing smart grid systems throughout their entire service territory, utilities implement small-scale pilot projects in North Carolina to determine the effectiveness of the smart grid as a long-term investment and solution.
Fayetteville, NC
In 2010, the Public Works Commission (PWC) in Fayetteville partnered with Consert, Inc. to deploy smart meters in a smart grid pilot program. The 12-month pilot consisted of 84 locations and 94 customers. It included 11 PWC employees, 72 residential customers and 11 non-residential customers. Using Verizon Networks to communicate smart meter information
Figure 6-7: Fayetteville Customer Electric Savings
22%
59%
8%
11% 0%
Less than 10%
10-19%
20-29%
30-39%
40% or greater

6-11
and Consert’s meter data management solutions, the pilot led to a 20% reduction in energy consumption. Figure 6-7 (above) shows the electrical savings from participating customers. Peak capacity savings for PWC’s 50 MW generating plant follows below:
Savings in $kW/Month
Generation (MW) $10/Customer $15/Customer $20/Customer $25/Customer
50 $500,000 $750,000 $1,000,000 $1,250,000

6-12
Figure 6-8 (below) shows that the planned PWC demand load control events on June
24 and August 4 show a significant drop in energy consumption during peak periods.
McAlpine Creek substation
Duke Energy has been testing a micro-grid technology pilot installation at its McAlpine Creek substation in Charlotte since 2009. Duke Energy installed 213 solar panels to provide electricity to 100 residential customers served by the substation. The solar panels provided up to 5kW of power; enough to service five homes. Used in conjunction with a 500 kW storage battery and energy management systems, this pilot
Figure 6-8: Demand response program illustrates a reduction in consumer load demand during peak period

6-13
demonstrates how a “virtual power plant” can be created from energy savings by combining renewable energy with energy storage technology. The pilot also included the installation of about 8,100 smart meters that reveal average customer monthly energy savings of 8% fewer kWh used or approximately $9 per month.
Catawba College
At Catawba College in Salisbury, Duke Energy installed digital smart grid technology devices to gather and aggregate real-time energy usage data from seven of the college’s campus buildings. Smart meters were also installed on transformers owned by the college. This pilot provided Catawba with a better understanding of energy cost allocations for the seven buildings. The data tracked through the pilot program will also be utilized as part of the sustainability course content offered in several academic majors, which includes the Sustainability and Community Development degree that is offered by the college.
Envision Charlotte
An ongoing joint sustainability effort between the City of Charlotte and Duke Energy began in 2010. The goal was to reduce energy use by up to 20% by 2016, to avoid about 220,000 metric tons of greenhouse gas emissions. A key objective was to build a public-private energy efficiency partnership that could be replicated in municipal commercial buildings across the U.S. Figure 6-9 (above) shows a typical customer online portal that is used to communicate energy consumption data. Duke Energy funded 80% of the $5.3 million initiative and 20% of the cost was provided by Cisco. Local Charlotte business and government leaders, who operate over 12 million square feet of space, expressed a commitment to participate in the project. Owners of 61 of the 64 eligible buildings signed a 20% energy reduction pledge and agreed to install aggregate energy use kiosks (similar to that displayed in Figure 6-8, above) in their respective buildings.
Figure 6-9: Duke Energy Envision Charlotte Digital Display Concept (Source: Duke Energy, 2011)

6-14
Wake Electric: Wake Forest, Rolesville and Youngsville
Wake Electric Membership Corporation (EMC) in partnership with Consert, Inc., conducted a smart grid pilot program in 2010. Of the 200 residents who applied to participate in the project, 100 were selected. Smart meters were used to collect energy usage data for analysis. The data was available to participants via an online customer portal. Customers were able to see a graphical representation of hourly individual system energy consumption over a 24-hour period. With this information, Wake EMC could project future use based on the previous days’ energy consumption analysis and outside air temperature forecasts. By remotely reading electric meters in real-time, Wake EMC developed reports showing current kWh usage for individual and selected meter groups in specific billing cycles. Wake EMC read meters more effectively, collected and used data to increase reliability, presented customers’ energy usage information, and enabled them to manage their energy consumption. The pilot program resulted in customer energy savings ranging from 7% to 54%, with total average energy savings of 19%.
Figure 6-10 (above) illustrates the results of a controlled demand response Wake EMC event. January 11, 2011, is used as the reference day of normal energy usage and January 13, 2011, was the control day. By systematically adjusting pilot participants’ devices to power on/off within the approved parameters set by each participant, Consert, Inc. showed a 38.71% energy reduction and peak demand period savings of 73.04 kWh during the 2-hour and 26-minute test period.
Figure 6-10: Controlled Event Capturing Energy Usage on Two Climatically Comparable Days (Source: Consert 2011)

6-15
Following the pilot, Wake EMC fully implemented its Monitor & Manage Program which allowed customers to choose the free “Select Option.” Wake EMC’s online energy monitoring system collects energy usage data from participating homes and makes it available to all customers. With this information, customers can make informed decisions regarding their energy usage. To participate in Wake EMC’s “Premier Option”, customers must choose it and pay a participation fee. In addition to obtaining energy usage information, this option allows customers to monitor and control the energy consumption of their electric appliances.
Duke Energy Progress Distribution System/Demand Response
Duke Energy Progress DEP deployed several smart grid technologies to improve to its distribution network. DEP has invested $520 million in these initiatives, including a $100 million grant from the U.S. Department of Energy under the American Recovery and Reinvestment Act.
DEP’s distribution feeder segmentation initiative improves the isolation of power outages and equipment problems in its transmission and distribution network. In its NCUC filing, DEP/Progress Energy proposed to “reduce demand by lowering system voltage at the substation while controlling the magnitude of the voltage drop along the distribution feeder.”
Implementation included installation of a new distribution management system (DMS) that serves the substation as a centralized “brain” and provides intelligent controls on feeders and substations to make existing devices “smarter.” These upgrades allow the DMS to monitor the “state of the system.” In addition, DEP installed 160,000 smart meters in its North Carolina, South Carolina, and Florida service territories.
The EnergyWise Home program offered by DEP allows it to communicate with customers’ central air conditioning (AC) system controls. As a result, grid operators can temporarily reduce AC energy consumption during high energy demand periods by periodically cycling the air conditioner compressor’s power off and on periodically. This automatic process requires no input from the customer.
Transportation
The EIA stated that gasoline and diesel accounted for about 66% and 22% of NC’s 2015 petroleum expenditures, respectively. Because of this dependency, fuel disruption emergencies can create difficult situations for our State. In 2005, Hurricane Katrina created both a regional and a North Carolina petroleum shortage. During the 2008 economic downturn, gasoline and diesel prices increased to $4.08 per gallon $4.80 per gallon, respectively. As previously discussed in Volumes IV and V of the Energy Assurance Plan, NC’s petroleum supply is vulnerable to: technological failures (the Deepwater Horizon oil spill in 2010); geopolitical events (the Middle Eastern revolts in 2011); and more recently, to the Colonial Pipeline’s 2016 leak, fire, and shutdown. To

6-16
prepare for, mitigate, and respond to impacts of such events, North Carolina can utilize advanced alternative vehicle technologies and locally derived alternative fuels.
Ethanol and Biodiesel Supply
Advanced technology vehicles (ATV) operate on alternative fuels as transportation energy sources. ATVs include plug-in electric vehicles (PEV), hybrid electric vehicles (HEV), fuel cell vehicles, and anti-idling technologies. Figure 6-11 illustrates some alternative fuel sources. Alternative fuels are energy producing fuels that are not 100% gasoline, diesel, or kerosene, and may include liquefied petroleum gas (LPG), compressed natural gas (CNG), or liquefied natural gas (LNG). One source of energy emergency preparedness is the NASEO “Baseline Assessment: Alternative Fuel Vehicles in State and Municipal Emergency Operations Plans” publication. NASEO’s guide offers AFV information found in emergency operation plans, reviews findings from state and local plans that included AFV options, and ways to include AFVs in emergency plans.
Table 6-3 (below) illustrates the most common petroleum and ethanol mixtures.
Fuel Composition Engine
E10 90% petroleum gasoline and 10% ethanol Any gasoline engine
E85 15% petroleum gasoline and 85% ethanol Flex-Fuel Vehicle (FFV)
B20 80% petroleum diesel and 20% plant/animal oil-based fuel (biodiesel)
Any diesel engine
B100 100% plant/animal oil-based fuel Consult with manufacturer
Table 6-3 Common Alternative Fuels
Federal Policy Initiatives
In 2007, a Memorandum of Understanding (MOU) to advance cooperation on biofuels was signed by the U.S and Brazil. In March 2011, the MOU was expanded to include a U.S./Brazil Green Economy Partnership for the development of aviation biofuels. Keygoals in the agreement included developing sustainable aviation biofuels (to reduce
Figure 6-11: Some Alternative Fuel Sources

6-17
greenhouse gas emissions), establishing common standards and specifications, and strengthening private sector partnerships. Since half of all Brazilian vehicles are flex- fuel capable and primarily use biofuels, the country is viewed by other nations as a model for transitioning to alternative fuels.
State Policy Initiatives
To encourage and increase the use of AFV, electric vehicles and alternative fuel production, North Carolina has introduced several incentives that are described in Table 6-4 below.
Program Description Incentive
Sta
te
Biodiesel Tax Exemption Individuals producing biodiesel for use their individual private passenger vehicle are exempt from the state motor fuel excise tax
Plug-In Electric Vehicle (PEV) and Fuel Cell Electric Vehicle (FCEV) Emissions Inspection Exemption
Qualified PEVs and FCEVs are exempt from state emissions inspection requirements
Renewable Fuel Production Facility Tax Credit
To encourage the development of alternative fuel infrastructure.
Alternative Fuel and Idle Reduction Grants
Provided grants for incremental cost of original equipment manufacturer AFVs, vehicle conversions, and implementing idle reduction programs (funding is not currently available for this incentive)
Natural Gas Vehicle (NGV) Weight Exemption
Vehicles primarily powered by NG may exceed NC's gross vehicle weight limits by a weight equal to the difference between its average weight with the NG tank and fueling system, and the average weight of a comparable vehicle with a diesel tank and fueling system; NGV maximum gross weight may not exceed 82,000 pounds
Alternative Fuel Vehicle (AFV) and Hybrid Electric Vehicle (HEV) Support
Reduce transportation-related emissions in non-attainment and maintenance counties for National Ambient Air Quality Standards
Alternative Fuel and Alternative Fuel Vehicle (AFV) Fund
Allows state agencies to offset the incremental costs of purchasing biodiesel blends (at least 20%- B20) or ethanol blends (at least 85% - E85), develop alternative fueling infrastructure, and purchase AFVs and HEVs
Alternative Fuel Tax Exemption To encourage the development of alternative fuel infrastructure.
Bond Exemption for Small Biofuels Suppliers
Fuel blenders or suppliers of ethanol or biodiesel are not required to file a bond with the NC Department of Revenue when expected motor fuel tax liability is less than $2,000
Pri
va
te S
ec
tor
Duke Energy customer rebate for Nissan Leaf purchase
To increase PEV market penetration, Nissan is offering a $3,000 incentive to Duke Energy customers
Duke Energy purchase of PEVs Commitment that all new vehicle purchases will be plug-in electric vehicles by 2020
Duke Energy’s Plug-in NC Program A $1 million electric vehicle charging infrastructure awards project with assistance from Advanced Energy in Raleigh
Duke Energy and Ford Motor Company’s Escape PHEVs test
Three-year test of Ford PHEV technology/smart-charging systems to compare factory-built and converted PHEVs performance
Table 6-4 Alternative Fuel Incentives

6-18
Laws and Regulations
Several North Carolina initiatives that encourage AFV and alternative fuel deployment
have been implemented, as shown in
Table 6-5, below.
Description North Carolina General Statutes and Organizations
Ethanol Blend Requirement G.S. 75-90, 105-449.60
Biodiesel Warranty Requirement G.S. 20-351.11, 136-28.15, and 143-341(8)(i)
Biodiesel Requirement for School Buses G.S. 115C-240(c) and 115C-249(a)
Fuel-Efficient Vehicle Acquisition Requirements G.S. 143-341(8)(i)
Alternative Fuel Vehicle (AFV) Acquisition Requirements
G.S 143-215.107C
School Bus Idle Reduction Requirement North Carolina School Board Association
Table 6-5 Laws and Regulations Promoting Alternative Fuel in North Carolina
In 2004, North Carolina instituted a Petroleum Displacement Plan (PDP) initiative to reduce the petroleum demand in North Carolina’s vehicle fleet (§19.5 of S.L. 2005-276, and §1 of 2006 Senate Bill 2051). The PDP required state agencies, universities, and community colleges to reduce or displace 20% (adjusted to 17.5 based on provision criteria) of their current petroleum use by 2010. The 17.5% reduction applied to state fleets (10+ vehicles) and state-owned vehicles, while emergency and educational vehicles required a 10% reduction. At the close of the PDP implementation in 2012, petroleum use by state vehicles decreased by 19.9% during fiscal year 2011-12, when compared to fiscal year 2004-05’s fuel use baseline.
Since PDP implementation, North Carolina’s internal combustion (IC) motor vehicle purchases have decreased, while hybrid, flex-fuel, diesel, and electric vehicle purchases have increased as shown in Table 6-6.

6-19
State Vehicle Purchases and Percent (%) of Change Between Baseline Fiscal Year (FY) 2004-05, FYs 2010-11 and 2011-12
Vehicle Type Baseline # (FY04-05)
# FY10-11 # FY11-12 % Change from
Baseline
Gasoline only 11,436 8,952 8,847 -22.64%
E85/flex-fuel (FFVs) 5,168 7,186 7,670 48.40%
Diesel 4,559 4,940 5,225 14.60%
Electric 16 239 292 1,738.96%
Propane 192 130 115 -40.23
Hybrid Electric 85 118 104 22.32%
Natural Gas (CNG) 15 4 5 -65.61
Emergency/Educational 5,817 6,099 5,597 -3.78%
Totals 27,288 27,668 27,855 +2.08%
Table 6-6 NC’s State Vehicle Purchases from PDP Implementation in FY 2004 to FY 2012
Reductions of state-purchased ICs have displaced NC’s gasoline, diesel, CNG, and propane consumption, while at the same time increase the use of E10, E85, and B20, as seen in Table 6-7.
Petroleum Displacement by Fuel/Activity: Fiscal Year (FY) 2011-12 Compared to Fiscal Year 2004-05 Baseline
Alternate Fuel Percent (%) Displaced Number of Gallons Displaced
E10 4.94% 1,279,704
Biodiesel (B5,B20, B100) 4.75% 1,229,811
E85 0.49% 127,995
Propane and CNG 0.01% 1,623
Other factors (conservation & efficiency) 9.73% 2,521,040
Total Petroleum Displaced 19.9% 5,160,173
Table 6-7 NC’s State Vehicle Petroleum Displacement (Thousands of Gallons) Since PDP Implementation: FY 2004 to FY 2012
As a result of the PDP initiative, gasoline consumption fell from 57% to 13%, while E-10 use rose from 2% to 46%. Similarly, diesel consumption was reduced from 33% to 7% and B20 use increased from 7% to 33%. Figures 6-12 and 6-13 (below) illustrate NC’s pre-PDP (2004) and post-PDP (2010) state fleet fuel portfolio.

6-20
Challenges
Consumer behavior in vehicle operation, in both the public and private sector, significantly impacts petroleum consumption in North Carolina (NC) and nationwide. As noted in Volume 5, Section 5.4.4.7 (Voluntary Action for Mild Petroleum Disruption) of this Plan, reducing vehicle speed from 60 mph to 55 mph, increases its efficiency by about 6%. By using this Plan’s scenario in conjunction with some NC cost/consumption estimates from EIA, we can calculate estimated potential annual petroleum savings as shown in Table 6-8. The estimate assumes that if all NC drivers reduced their speed to 55 mph from 60 mph, approximately $2.4 million in petroleum savings would be realized. Despite the significant savings shown, there are other unresolved challenges to increasing AFV penetration in NC’s existing vehicle market.
Fuel Type Fuel Consumed
(gal) Retail Price
2016 ($) Savings from a 6%
Reduction (gal) Annual Savings from
Reduction ($)
Motor Gasoline 11,200,000 $2.89 672,000 $1,942,080
ULSD 2,304,000 $3.25 138,240 $449,280
Table 6-8 Savings from Fuel Reduction (Source: EIA)
Section 1 of 2006 Senate Bill 2051 (S.L. 2006-206) directed the Department of Administration to develop a plan for the targeted conversion of fuel-dispensing facilities to provide greater availability of biodiesel (B20 and B100), ethanol (E10 and E-85), and other alternative fuels to meet the requirement of Section 19.5 of S.L. 2005-276.
Figure 6-12: NC Government Fuel Portfolio Pre-PDP (2004-2005)
Gas57%
E102%
E851%
Diesel33%
B207%
CNG0%
PROPANE0%
Figure 6-13: NC Government Fuel Portfolio Post-PDP (2009-2010)
Gas13%
E1046%
E851%
Diesel7%
B50%
B2033%
B1000%
PROPANE0%

6-21
Compliance with the PDP included the installation of fueling stations to service the state
government fleet. Although some progress has been made, an extensive AF station
network (comparable numbers of existing conventional gasoline stations) does not
currently exist throughout the state. To make deeper penetrations into North Carolina’s
vehicle market, significant alternative fuel infrastructure investments are needed.
Plug-In Hybrid Electric (PHEV) and Plug-in Electric Vehicles (PEV)
The transportation
sector consumed about
70% of the national daily
petroleum consumption
in 2017. Electrifying the
U.S. transportation fleet
provides an opportunity
to significantly reduce
petroleum consumption.
One related study
concluded that over
70% of all light duty
vehicles could be
powered by the existing
capacity in the electric
grid and result in a
significant reduction in
U.S. petroleum
consumption.
Plug-in hybrid electric vehicles (PHEVs) and battery electric vehicles (BEVs) are sub-
categories of plug-in electric vehicles (PEVs). PEVs became available to the public in
2002 and may reduce the demand for petroleum. Figure 6-14 and
Table 6-9 outline the different PEV types.
Popular PEV Vehicle Engine Types
Examples
Hybrid Plug-in Hybrid All Electric
Toyota Prius, Honda Civic, Ford Fusion, Nissan Altima,
Chevrolet Volt, Ford C-Max, Toyota Prius Prime
Nissan Leaf, Tesla, Ford Focus, Chevrolet Bolt, BMW i3
Engine Type
Internal Combustion + Small Battery
Small Internal Combustion Engine + Large Battery
Battery
Table 6-9 Engines for HEV, PHEV and EVs
Figure 6-14: HEV, PHEV and EV (Source: Duke Energy)

6-22
Through 2015, the nearly 4 million hybrid electric vehicles (HEVs) sold in the U.S. equaled almost 2% of all vehicles sold. During the same year, the U.S. DOE said that NC had 0.43 HEV’s per 1,000 residents and it recognized NC as one of the top twenty states in HEV total sales.
Policy Incentives
The current federal laws, incentives, regulations, funding opportunities, and other initiatives related to alternative fuels and vehicles are listed below in Table 6-10.
Federal
Qualified Plug-In Electric Vehicle (PEV) Tax Credit
Low and Zero Emission Public Transportation Research, Demonstration, and Deployment Funding
Advanced Technology Vehicle (ATV) and Alternative Fuel Infrastructure Manufacturing Incentives
Airport Zero Emission Vehicle (ZEV) and Infrastructure Incentives
Improved Energy Technology Loans
Advanced Energy Research Project Grants
Alternative Fuel and Advanced Vehicle Technology Research and Demonstration Bonds
Table 6-10 PHEV and PEV Incentives (U.S. Department of Energy, 2018)
PEV Charging Infrastructure
Using EIA and U.S. Census data, Table 6-11 shows a 77% annual cost reduction when comparing electricity mpg to unleaded gasoline mpg.
Fuel Annual Vehicle Miles Traveled
Cost (2018)
Annual Fuel Consumption
Annual Cost
Gasoline 15,000 $2.89/gal 500 gallons $1,445
Electricity 15,000 $0.0898/kWh 3,750 kWh $337
Table 6-11 Vehicles Powered by Petroleum vs. Electricity: A Cost Comparison (Source: EIA and U.S. Census)
Another possible cost reduction approach is using “Time of Use” discounts offered by electric utilities to PEV owners who recharge their vehicles during periods of low demand.
Residential Units
Charging costs will vary based on battery capacity and the amount of electricity used. For example, customers who drive fewer than 40 miles a day at $0.11 per kilowatt-hour (the national average electric rate), should expect to spend less than $1.50 a day to recharge a PEV at their residence. If gasoline costs $3 per gallon and the cost to operate a standard vehicle varies from $0.08 to $0.20 per mile, then the PEV cost per

6-23
mile is $0.02 to $0.04. Duke Energy states that “your electric bill will likely go up, but your monthly gasoline expenses should drop considerably more.”
Public/Commercial Units
As electric vehicles (EV) enter the mainstream marketplace, more mobile applications and web-based tools are emerging to help owners find public charging stations. Google is integrating EV charging data into its Maps Application and the U.S. DOE has an interactive alternative fuel station locator map that identifies PEV charging locations in both the U.S. and Canada.
Federal Initiatives
Date Description
08/05/09 $2.4 billion in American Recovery and Reinvestment Act (ARRA) of 2009 funds was allocated for 48 advanced battery and electric vehicle projects
08/05/09 Celgard & nine other battery manufacturers receive a $49 million ARRA grant to increase production for the growing demand lithium ion batteries; U.S. DOE reported that each federal dollar was matched by the recipient companies
04/01/11 The National Clean Fleets Partnership (between the U.S. DOE, AT&T, FedEx, PepsiCo, UPS and Verizon), proposed to reduce both fuel consumption and the number of gasoline and diesel-powered vehicles on the road
04/13/11 U.S. DOE launched of the EcoCar2: Plugging into the Future competition; sixteen university teams, including NCSU) were selected to participate
04/19/11 U.S. DOE allocated $5 million in new funding to deploy EV infrastructure and charging units in communities nationwide
04/19/11 U.S. DOE partnered with Google and 80 other companies to launch the GeoEVSE Forum; a database of all charging stations and electric vehicle supply equipment (EVSE) locations; will be maintained by the DOE’s Clean Cities Initiative and NREL; will be made available to third parties
12/04/15 Fixing America’s Surface Transportation Act, or “FAST Act.” by the U.S DOT will provide long-term funding for surface transportation, allowing States and local governments to move forward with critical transportation projects with a Federal partner over the long term
Current Federal Tax credit of up to $7,500 for EVs and PEVs purchased in or after 2010
Table 6-12 Federal Initiatives
State and Private Sector Initiatives
The City of Raleigh is one of four U.S. cities participating in “Project Get Ready,” a pilot initiative to help cities prepare for PEVs. Raleigh used a multidisciplinary team to address logistical issues. These issues included electric vehicle supply equipment (EVSE) permitting/installation streamlining, PEV consumer education, PEV grid-compatible charging infrastructure, and relationship building with PEV manufacturers and component suppliers. Initiatives like Raleigh’s help to ensure PEV availability and explore opportunities for PEV economic development in North Carolina. Table 6-13 summarizes the goals of this initiative.

6-24
Table 6-13 NC Get Ready! Initiatives
Raleigh’s “Project Get Ready” installed 29 EV charging stations; 18 public charging stations and 11 fleet charging stations. In addition to the EV infrastructure installations, the project: removed and reduced barriers to plug-in vehicle adoption; streamlined the permitting and inspections process for EV equipment installation; upgraded the vehicle fleet to include PEVs; and partnered with DEP to install a solar-powered PEV charging station for research and development.
In May 2011, the North Carolina General Assembly exempted PEVs from the minimum passenger requirements necessary to use high-occupancy vehicle (HOV) lanes and from annual North Carolina emissions testing.
Duke Energy made a commitment that all new vehicle purchases will be electric vehicles by 2020. The commitment represents an investment of $600 million, and it has the potential to reduce greenhouse gas emissions by more than 125,000 metric tons over 10 years.
As part of its ARRA grant, Progress Energy (now Duke Energy Progress) installed several hundred smart charging stations to accommodate the arrival of PEVs in its service territory and to gather valuable real-world data as part of its EVSE Project.
Impact on the Existing Infrastructure
Although PEVs can reduce petroleum dependency, there are infrastructure and emergency planning challenges that must be addressed if they are to be viable substitute for ICE vehicles. Experts agree that connecting PEVs to the existing power grid can increase electrical demand. This additional electric load can also increase the risk of power disruptions, but the threat can be mitigated through proper planning. The issue will require collaborative efforts between the NCUC, electric utilities and other industry organizations to develop an effective and efficient PHEV/EV charging infrastructure plan that reduces the negative impact on the existing power grid.
Working Group Purpose Stakeholders
NC Get Ready Steering Committee
Provide oversight and guidance Subject matter experts, government officials and other relevant organizations
Infrastructure Working Group
Support development of viable charging infrastructure
Utilities, construction, transit, architects, engineers, city planners, parking garage owners, electricians and business owners
Vehicle Facilitation Group Build a viable market and purchasing channels
Fleet owners, leasing companies/lenders, dealerships, manufacturers and vehicle owners.
Vehicle Technologies Working Group
Facilitate research and development of new or improved technologies
Researchers, academics, automotive manufacturers, component manufacturers and infrastructure component developers.
Standards Working Group Quantify the issues and opportunities associated with drivers such as incentives and permits.
Representation includes legislative bodies, city planners, utilities, and universities.

6-25
Load Demand
According to a National Renewable Energy Laboratory (NREL) report, charging an electric vehicle adds “on average ~6 kWh per day” to existing local transformer load. In this report, NREL projected NC population increases of 159% between 2010 and 2050 and PEV saturation growth from 0.009 in 2010, to 1.04 in 2030, and to 5.55 in 2050. These load growth projections can have significant impacts on NC’s electric power grid. Table 6-14 describes EV charging levels and some possible impacts on the power grid.
Charging Model Description Voltage Impact
No utility control (Level I)
Charging begins after the last trip of the day.
120V / 1.4 kW 1. Minimum impact on power grid.
Opportunity (Level I)
Charge PEV whenever the vehicle is parked.
120V / 1.4 kW 1. Increases daytime PEV loads2. Increases total energy demand3. Increases battery wear
Managed (Level II)
PEV charging is based on the utility energy demand.
240V / 3 kW 1. Minimum impact on power grid.
Table 6-14 EV Charging Levels (Source: NREL)
Vehicle to Grid
Since battery price is a PEV’s largest cost component, charging its battery pack is important. The U.S. DOE states that a one hour (1 kWh) charge adds four miles to its driving range. Additionally, EV battery pack costs have declined from $400/kWh in 2011, to $600 in 2012, and to $268 in 2017. DOE’s 2020 battery cost goal is $125/kWh.
Challenges
Although typical vehicle miles traveled per day do not exceed 100 miles in the U.S., travel range anxiety is a major challenge. Range anxiety is a fear that a PEV battery will not have enough charge to complete a trip. The PEV industry must overcome this anxiety if it is to achieve significant penetration into the ICE market.
Currently, AFVs, HEVs and PEVs cost from $24,000 to $75,000 (as shown in Table 6-15). Major automobile manufacturers are continuing to develop additional alternative-fuel models. As PEVs saturate the transportation sector in higher production volumes, Incentives and continue improving electric drive train technologies, lower vehicle costs may result for PEV purchasers over the next five years.

6-26
Year Make & Model Miles per gallon equivalent (mpg) Approximate Starting
Price ($)
2018 Nissan Leaf (EV) 125 (city) to 100 (highway) MPG $32,000
2018 Chevy Volt (EV) 106 MPG $34,000
2018 Toyota Prius (HEV) 58 to 53 MPG $24,000
2018 Toyota Camry (HEV) 51 to 53 MPG $29,000
2018 Honda Accord (HEV) 47 to 47 MPG $30,000
2018 Ford Fusion (HEV) 42 to 97 MPG $32,000
2018 Tesla S 75D (EV) 105 to 102 MPG $75,000
2018 Kia Soul (EV) 124 to 93 MPG $35,000
2018 Chevy Bolt (EV) 128 to 110 MPG $42,000
2018 Hyundai Ioniq (EV) 150 to 122 MPG $30,000
2018 Chevy Malibu (HEV) 49 to 43 MPG $29,000
2018 Toyota RAV4 (HEV) 34 to 32 MPG $28,000
Table 6-15 Kelly Blue Book Electric Cars: PEV & EV (Source: KBB, 2018)
Most available PEVs are limited to a travel distance of about 100 miles per charge. Coastal areas (susceptible to evacuation due to natural disasters) may experience difficulty evacuating danger zones if PEVs are prevalent in that area. Additionally, battery performance can be severely compromised by extreme thermal conditions that reduce travel-distances for a PEV, which could impede emergency evacuations.
Energy Storage
The existing electrical grid does not have the capacity to store the power it generates, since generated power is immediately delivered to consumers. The rising popularity of intermittent renewable energy sources (wind and solar) requires the development of energy storage technologies to help renewable sources reach utility-scale application.
Technologies
Energy storage technologies, including voltage regulation and load balancing to improve power quality, can provide simultaneous solutions to energy assurance and reliability issues. An energy storage system could provide a steady power supply during brief power interruptions and reduce the financial losses resulting from the outages. A local utility-scale storage application would promote the decentralization of the power transmission and distribution network and reduce the required capital investments to build new and maintain existing transmission lines. Table 6-16 illustrates the most prevalent energy storage technologies. It should be noted that a vast majority of these technologies may be cost prohibitive and are still in the development stage.
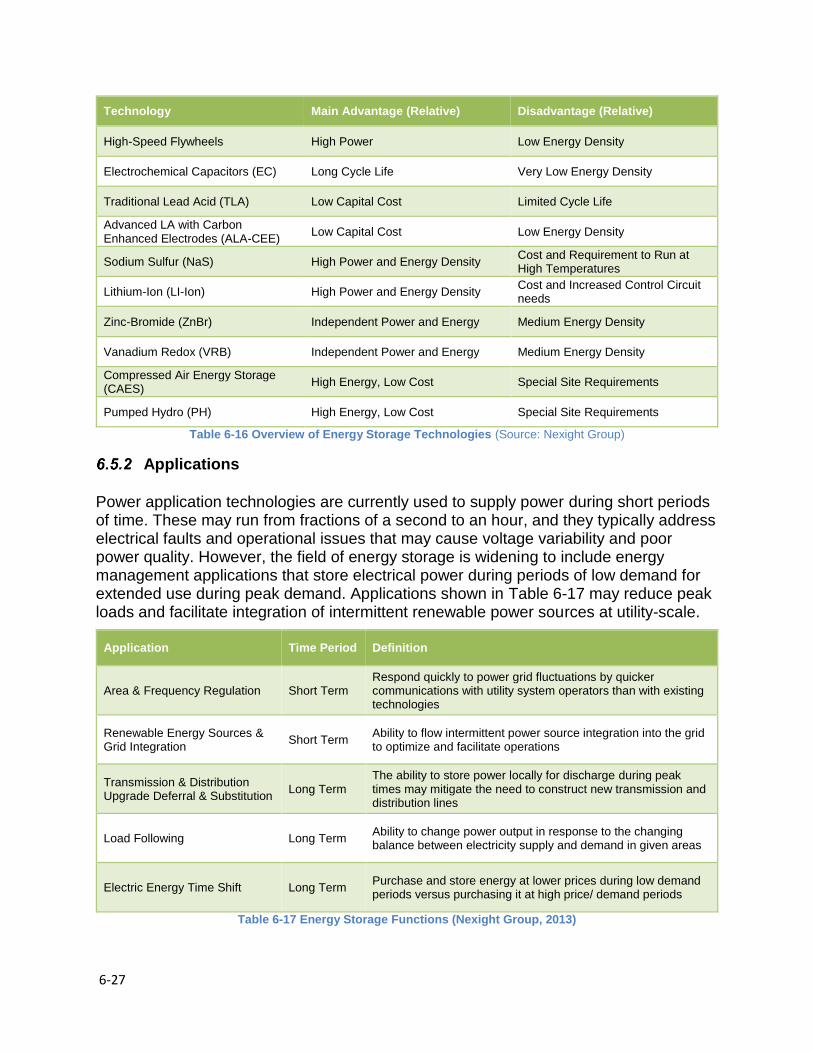
6-27
Technology Main Advantage (Relative) Disadvantage (Relative)
High-Speed Flywheels High Power Low Energy Density
Electrochemical Capacitors (EC) Long Cycle Life Very Low Energy Density
Traditional Lead Acid (TLA) Low Capital Cost Limited Cycle Life
Advanced LA with Carbon Enhanced Electrodes (ALA-CEE)
Low Capital Cost Low Energy Density
Sodium Sulfur (NaS) High Power and Energy Density Cost and Requirement to Run at High Temperatures
Lithium-Ion (LI-Ion) High Power and Energy Density Cost and Increased Control Circuit needs
Zinc-Bromide (ZnBr) Independent Power and Energy Medium Energy Density
Vanadium Redox (VRB) Independent Power and Energy Medium Energy Density
Compressed Air Energy Storage (CAES)
High Energy, Low Cost Special Site Requirements
Pumped Hydro (PH) High Energy, Low Cost Special Site Requirements
Table 6-16 Overview of Energy Storage Technologies (Source: Nexight Group)
Applications
Power application technologies are currently used to supply power during short periods of time. These may run from fractions of a second to an hour, and they typically address electrical faults and operational issues that may cause voltage variability and poor power quality. However, the field of energy storage is widening to include energy management applications that store electrical power during periods of low demand for extended use during peak demand. Applications shown in Table 6-17 may reduce peak loads and facilitate integration of intermittent renewable power sources at utility-scale.
Table 6-17 Energy Storage Functions (Nexight Group, 2013)
Application Time Period Definition
Area & Frequency Regulation Short Term Respond quickly to power grid fluctuations by quicker communications with utility system operators than with existing technologies
Renewable Energy Sources & Grid Integration
Short Term Ability to flow intermittent power source integration into the grid to optimize and facilitate operations
Transmission & Distribution Upgrade Deferral & Substitution
Long Term The ability to store power locally for discharge during peak times may mitigate the need to construct new transmission and distribution lines
Load Following Long Term Ability to change power output in response to the changing balance between electricity supply and demand in given areas
Electric Energy Time Shift Long Term Purchase and store energy at lower prices during low demand periods versus purchasing it at high price/ demand periods

6-28
Challenges
The associated costs of utilizing energy storage technologies as an energy management application must be comparable, if not better, than the most commonly used power solution (intermittent peaking plants) that addresses peak load. The cost for energy storage capacity today far outweighs the operational costs of a peak plant. There are a limited number of U.S. large-scale energy storage demonstrations, but they are important because they provide useful performance data and identify the need for utility industry infrastructure development.
Current technologies to facilitate seamless integration of energy storage technology into the electrical power grid have yet to advance. The absence of appropriate standards and modes contributes to low interoperability capabilities and proprietary systems. Limited stakeholder understanding of clean technology appears to be a major challenge in markets that are transitioning from planning to deployment, such as California, Texas and Illinois.
Federal Initiatives
There is some concern that the U.S. is trading its current dependence on imported energy resources for future battery resource development and reliability. In his book “Bottled Lightning: Superbatteries, Electric Cars, and the New Lithium Economy”, author Seth Fletcher writes that “The U.S. relies on other countries for 90% of its ‘energy-critical elements’ - 29 elements, including rare earths, whose intrinsic properties make them essential ingredients in thin-film solar panels, high-efficiency wind turbines, advanced electric-vehicle motors, high-capacity batteries and other clean-energy innovations.” He also states that China provides about 90% of global rare-earth production. To address this important energy resource concern, the Federal Energy Regulatory Commission (FERC) and several other private-sector organizations are exploring options to extend battery life to use as a backup energy reserve.
FERC issued its Order No. 841 in February 2018 that required “system operators to remove barriers to the participation of electric storage resources in the capacity, energy, and ancillary services markets. Each Independent System Operator (ISO) or Regional Transmission Operator (RTO) must revise its tariff to include market rules that recognize the physical and operational characteristics of electric storage resources.”
Advanced Research Projects Agency-Energy (ARPA-E), an agency of the U.S. DOE, awarded $4.5 million to ABB and its partners, SuperPower, Inc. and Brookhaven National Laboratory, to research a superconducting magnetic energy storage (SMES) system with a direct power electronics interface. General Motors has entered into an electric car battery research agreement with ABB, a power and automation technology company. This agreement’s goal is to examine reusing GM’s electric cars’ spent lithium-ion battery packs to provide energy storage capacity and improve the efficiency electrical systems’ as they advance into smart grid technology. Nissan Motor Company,

6-29
LTD. has joined forces with 4R Energy Corporation to research and field test the reuse of Nissan vehicle’s lithium-ion batteries for increased sustainability and renewable energy use.
The National Renewable Energy Laboratory (NREL) is collaborating with industry and academia to study secondary uses for lithium-ion batteries. Potential application options include residential/commercial electric power management, electric grid stabilization and integration of intermittent renewable energy resources, such as solar and wind.
State Deployments
Fort Bragg – Fayetteville
Fort Bragg, a U.S. Army installation located outside of Fayetteville, NC, partnered with Honeywell to install a $3.4 million micro-grid system. The project, Federal Energy Management Program Fort Bragg (FEMP), incorporated several distributed generation technologies. Using a central energy management system, the micro-grid integrates geothermal heat pumps, micro-hydro generation, solar panels, co-generation, thermal energy storage and waste to energy into their existing electric distribution system.
FREEDM Systems Center Green Energy Hub – Raleigh
The Future Renewable Electric Energy Delivery and Management (FREEDM) Systems Center on North Carolina State University’s (NCSU) Centennial Campus has developed a one-megawatt green energy hub system to power the Engineering Research Center (ERC) headquarters and other buildings on the Centennial Campus. The system uses a combination of solar, wind, PEV and other technologies at the ERC headquarters.
Duke Energy – Charlotte
See NCEAP Volume 4, pg. 12 on Smart grid Deployment – McAlpine Creek substation
Cyber Security
Electric, petroleum and natural gas utilities’ energy transmission and distribution infrastructure operators rely on networks of sensors and controllers to monitor and manage their respective systems. To provide cost-effective and scalable connectivity, these control devices are increasingly linked to the public internet. The internet-connected protocol (IP) devices utilities use track and direct the movement of their energy sources, monitor system operating conditions, provide communications and implement safety policies. Since IP technologies allow utility operators to increase the safety and management of their systems more efficiently, their operating costs can be reduced. Internet connectivity, however, also presents new system vulnerabilities that require supervision by sophisticated security programs. According to the U.S. Department of Homeland Security (DHS), “these connections increase the network’s

6-30
vulnerability to direct cyberattacks that could potentially disrupt power and increase risk”. Unsecured infrastructure control systems open them to vulnerable cyber-attacks that could result in physical damage, service disruptions or loss of life.
IP technologies are being implemented throughout our nation, and the energy sector is no exception. Remote sensors and controls allow operators to manage utility infrastructures from a central location, but they can also introduce new attack points when third parties attempt to access control systems. Evaluation and analysis of these new risks has challenged policymakers, regulators, industry and academia involved in developing protective standards for utilities and other service providers.
On April 16, 2018, a joint technical alert (issued by Homeland Security, the FBI and the United Kingdom’s National Cyber Security Centre) alerted authorities about a worldwide cyber exploitation of network infrastructure devices by Russian state-sponsored cyber actors. Their primary targets were identified as government and private-sector organizations, critical infrastructure providers (including the energy sector) and the Internet service providers (ISPs) supporting these sectors.
In 2018, the Transportation Security Administration (TSA) released an updated version of its Pipeline Security Guidelines. The TSA has oversight responsibility for the more than 2.6 million miles of U.S. natural gas and oil pipelines. Their guidelines provide these at-risk organizations with protective, mitigating measures that they can incorporate to protect their pipeline assets from cyberattacks.
Security Issues
In past years, malicious computer activity has been associated with hobbyists or amateur operators. More recently however, there has been an increase in organized criminal cyber operations and a dramatic increase in implicitly approved or state-sponsored cyber-attacks. The U.S. Computer Emergency Readiness Team (US-CERT) is a national hub for cyber and communications information, technical expertise, operational integration and incident response. US-CERT has stated that malware development has now transitioned to a profit-driven business controlled by cyber criminals. According to federal intelligence officials, recent widespread penetrations of energy systems by foreign cyber criminals are increasing.
According to a study from Accenture, an international consulting and technology services company, annual cyber security crime costs in 2017 increased by over 20% from the previous year. Accenture’s study shows that the utility and energy sector is a close second in annual cyber-crime costs (at over $17 million) as compared to the costs ($18 million) incurred by the first-place financial sector.
Cyber-attacks can harm an organization in several ways:

6-31
Data theft – Cyber criminals can capture proprietary and/or customer information(financial data, trade secrets, etc.) that can be used in future attacks. Loss ofsuch data can harm an organization’s reputation and create liability implications.
Denial of service – Cyber attackers can suppress or disable services andequipment to preventing their legitimate use.
Injection of false information – An attacker can manipulate sensor and controlsystems to display incorrect readings or to change operational settings.
Direct harm to equipment – Cyber criminals can exploit SCADA system’svulnerabilities by hijacking controls and potentially producing physical damage.
Website defacement – Criminals may obtain, alter or replace organizationalwebsites to embarrass it or to deceive visitors into divulging personal information.
Cyber-attacks can come in various forms, including are but not limited to:
Penetration attacks – Cyber criminals can directly attack systems by exploitingsoftware/operating system vulnerabilities or gaining access/system control.
Social engineering – Criminals may obtain information or access to systemsthrough deception or manipulation, as opposed to using a technological route.
“Phishing” and “spear phishing” – Phishing e-mails/websites masquerade as atrusted entity to capture credentials/other information; a spear phishing attacktargets a specific individual by using personal information to appear authentic.
Denial of service – Cyber criminals may overload a system’s data connection toprevent legitimate users from accessing the system.
Viruses and worms – Criminals may introduce a variety of self-propagatingprograms that can disrupt operations, corrupt data and disable other software.
Trojans and malware – Attackers may introduce malicious software to get“backdoor” access (usually installed without the owner’s knowledge), allowing theattacker system control.
Cyber vulnerabilities may exist wherever systems connect to the internet. Primary cyber security concerns for energy assurance are the injection of false information, penetration attacks and Trojans. These attacks could directly disrupt utilities, pipeline operations or force operators to revert to labor intensive manual control that could reduce supply deliveries to end-users.
Despite increased protection efforts, a report issued by the U.S. Government Accounting Office (GAO) cited a substantial increase in cyber-attacks on federal agencies. Cyber incidents totaled 41,776 in 2010 for a 650% increase in five years. The GOA predicts that increasing attacks are likely to continue in all sectors, including the energy grid. Since that time, the GOA stated that “additional efforts have been taken to improve cybersecurity in the (energy grid) sector.” One such effort is NERC’s 2013 issue of updated standards addressing cybersecurity. Additionally, in 2014 the National Institute of Standards and Technology (NIST) revised cybersecurity standards for the smart grid and also created a critical infrastructure cybersecurity framework for adoption. Both DOE and DHS are promoting the NIST framework’s adoption. Table 6-18 outlines a few of the notable cyber-attacks on critical infrastructure.

6-32
Table 6-18 Examples of Cyber Security Attacks on Public Infrastructure
The economy’s increasing reliance on integrated advanced information and communications technologies has fueled the development of an information security industry. According to a 2011 report issued by Pike Research, smart grid cyber security spending was expected to increase by 62% between 2010 and 2011. By 2015, annual worldwide market cyber security spending for all sectors was $75 billion, and it is projected to reach $170 billion by 2020. Table 6-19 outlines some prevalent cyber security issues.
Table 6-19 Cyber Security Issues
Event Description Impact
Stuxnet Computer Worm
Penetrated a part of Iran’s nuclear power infrastructure in mid-2009.
Physically damaged uranium enrichment centrifuges
Maroochy Waste Water Release
More than 750,000 gallons of untreated sewage intentionally released into parks, rivers, and hotel grounds
Loss of marine life, public health jeopardized, $200,000 in cleanup and monitoring costs
2007 Estonian-Russian Conflict
Political/cultural conflict devolved into widespread DDoS attacks on Estonian infrastructure
Disrupted internet connectivity within Estonia for several hours, caused economic losses, disrupted government services
2012 Natural Gas Pipeline Intrusion Campaign
Coordinated and sustained effort targeting industrial control systems for interstate and intrastate gas pipelines
DHS ICS-CERT published alerts informing industry of an ongoing campaign; up to 20 companies may have been infiltrated; Purpose/intent of intrusions unclear
2013 Intrusions on the Energy Sector (Source: ICS-CERT)
“Havex” campaign uses spam e-mail to distribute a remote access Trojan tool for system control access
Used watering hole attacks to compromise supervisory controls and SCADA vendor websites
2014 Un-named Public Utility (Source: ICS-CERT)
Utility was compromised via remote access; its control system software was accessible from internet; weak password
No long-term attributable damages/costs; ICS-CERT recommended control system upgrades
Consumer Privacy
Identity management and protection
Consumer energy data
Stronger cyber security software on smart meters
Data privacy for electric vehicle billing data and recharging transactions
Smart Grid Applications
Automating demand response requests
Protecting the physical infrastructure of the utility delivery system
Data integrity for electric vehicle recharging transactions
End-to-end data encryption from a home area network (HAN) to the utility’scentral site
Transmission Equipment and Communication Software
Communications between substations and central transmission equipment
Resiliency throughout the advanced metering infrastructure (AMI)
Stronger security on SCADA control systems
More secure interfaces between IT and Industrial Control Systems (ICS) networks
Management Procedures
Multi-factor authentication on powerful consoles
Change asset management and configuration management
Business continuity planning
Video monitoring capabilities for substations and control rooms
Security awareness education for all affected employees

6-33
Interoperability and Cyber Security Standards
Addressing cyber security issues requires collaboration between government agencies and industry leaders to develop proper cyber-security interoperability standards. The Department of Homeland Security (DHS), the National Institute of Standards and Technology (NIST), the U.S. DOE, and the Department of Defense (DOD) provide a cyber security forum. It allows cyber-physical systems security researchers, experts and practitioners to assess the current state of the technology, identify its challenges, and provide input to develop strategies for dealing with these challenges.
Regulatory Hierarchy and Federal Initiatives
The Energy Independence and Security Act (EISA) of 2007 gave NIST the authority to develop interoperability and cyber security standards. NIST assigned the creation of these standards to the North American Electric Reliability Corporation (NERC) and the Smart Grid Interoperability Panel (SGIP). NERC collaborates with industry stakeholders to develop standards. SGIP worked with the smart grid community and NIST to develop priority action plans categorizing and defining challenges and objectives for developing smart grid interoperability standards. In July of 2018, NERC released an updated version of its Reliability Standards for the Bulk Electric Systems of North America document. It addresses control of grid interconnection frequency and includes requirements, measures and compliance information for electric grid operators.
The U.S. DOE released its “Cyber Strategy” report in 2015. It outlines DOE’s strategic goals and addresses the challenges of our nation’s complex cyber environment. Major DOE objectives include: enhanced decision-making via streamlined, inclusive, and transparent governance; advanced cyber science/information security; fostering inter-agency/public-private/international partnerships; and cyber mission performance measures to for informed decision-making, communications and accountability.
More recently, DOE took additional actions to meet its Cyber Strategy objectives. In February of 2018, it launched the new Office of Cybersecurity, Energy Security, and Emergency Response (CESER) with $96 million in new funding provided by President Trump’s budget. In April of 2018, DOE released the Cybersecurity for Energy Delivery Systems (CEDS) funding opportunity announcement (FOA) for $25 million to support energy sector cybersecurity research, development and demonstration (RD&D). On May 14 of 2018, CESER announced its Multiyear Plan for Energy Sector Cybersecurity, an integrated strategy to “improve cybersecurity and resilience of the nation’s energy system.”
State Initiatives
NC’s Risk Management Services, a subsection of the Enterprise Security and Risk Management Office (ESRMO) in the NC Department of Information Technology

6-34
(NCDIT), “supports the State CIO in the performance of duties and responsibilities associated with information technology risk management, continuity of operations/continuity of government, and assessments as they relate to information technology.” Risk Management cooperates with the NC Department of Public Safety in “developing their business continuity and disaster recovery plans with respect to information technology, as prescribed by N.C.G.S § 143B-1331 and other legal and regulatory requirements.”
In March of 2017, the NC General Assembly (NCGA) proposed Senate Bill 394, an act establishing the Legislative Cybersecurity Committee or LCC. The NCGA proposal stated that, “The Committee is charged with examining, on a continuing basis, the cybersecurity practices of State agencies in order to make ongoing recommendations to the General Assembly on ways to improve the effectiveness, efficiency, and quality of the State's cybersecurity and data loss prevention practices and measures.” At this time, the proposed Bill’s status is “pending.”
Duke Energy, NC’s electric utility provider and the country’s largest electricity company, conducts most of the energy cybersecurity in the state. According to Duke Energy Vice President A.R. Mullinex, the company’s computer systems are under “constant attack.” Consistent with Mullinex’s statement, some cybersecurity experts have said that from 2005 to 2015, U.S. power grid operations were compromised by foreign hackers over a dozen times. Federal and state agencies often require utilities to meet certain cybersecurity standards, but, as of August 2018, the NCUC has not issued utility cyber-attack preparedness requirements or regulations for grid security systems. Additionally, the Southern Electric Reliability Council (SERC) reported that more than 500 alleged cybersecurity rule violations occurred from 2008 to 2015 in the 16 Southern and Midwest states that it manages.
In its 2017 Sustainability Report, Duke Energy says that it is continuing to install security layers for rapid cyber-attack detection and response to properly isolate any impacted devices or systems. It is taking action to avoid the potentially catastrophic costs of a severe cyber-attack by maintaining an “around-the-clock response team of highly-skilled cybersecurity professionals.” Duke collaborates with national labs, government agencies, industry partners and vendors to protect technology systems, share information, develop standards and protect data. The report states that they have “detailed cybersecurity reporting requirements” and “enforceable cybersecurity standards to protect critical infrastructure.”
Challenges
Both the electric power industry and the petroleum pipeline industry have many years of experience in protecting their respective infrastructures from physical security threats. However, the integration of information technologies within electricity and petroleum delivery systems has introduced new potential attacks for their security professionals to mitigate. Just as electric grid operators need to expand their security systems to prevent and recover from cyber-attacks, so do the petroleum pipeline providers, since

6-35
both are threatened by potential attacks that can create real-world negative effects on their delivery infrastructures.
In March of 2018, Energy Services Group, a Duke Energy affiliate, that manages a part of Duke Energy’s natural gas operation was compromised by a large-scale cyber-attack, along with four other natural gas pipeline companies. Cyber-attacks such as these illustrate the difficulties of securing system data and vulnerabilities across the independently-operating networks in large organizations such as Duke Energy.
IT integration will challenge cyber security professionals who are familiar with securing local servers and networks but unfamiliar with large regional industrial control systems that control our national and state energy infrastructures. New IT security models will have to adapt and address the changes associated with moving from a physical to a digital interface. Some IT functions may take a relatively long time to cycle (such as a control input to close a mechanical valve) while other applications may require shorter integration periods (such as electric grid protective equipment) that must be able to self-isolate in less than two milliseconds. IT professionals will need to understand how the equipment connected to these systems operate to identify and mitigate potential vulnerabilities associated with the new control systems.
Both the Federal Energy Regulatory Commission (FERC) and the North American Electric Reliability Corporation (NERC) have the legal authority to establish security standards, monitor and adjudicate compliance and assess penalties as required. These national bodies oversee interstate energy markets while local distribution systems and retail sales are regulated by state public utility commissions (PUCs) such as our NCUC. These multi-level regulatory federal and state agencies, along with their appropriate legislative bodies, are challenged to establish the voluntary and/or mandatory security standards necessary to protect our energy infrastructures from growing cyber security threats. To help NC mitigate future cyberattacks, continuing comprehensive research in the public and private sector, supporting regulatory initiatives, and developing a statewide strategic implementation plan should to be considered.

6-36
Bibliography
ABB Group. (2010). ABB and GM to Collaborate on Electric Car Battery Research:
http://www.abb.com/cawp/seitp202/d3e2f486303c1d47c12577a500479955.aspx
Accenture. (2017). 2017 Cost of Cyber Crime Study:
https://www.accenture.com/t20171006T095146Z__w__/us-en/_acnmedia/PDF-
62/Accenture-2017CostCybercrime-US-FINAL.pdf#zoom=50
Advanced Research Projects Agency-Energy (ARPA-E). (2018). Superconducting
Magnet Energy Storage System with Direct Power Electronics Interface: https://arpa-
e.energy.gov/?q=slick-sheet-project/magnetic-energy-storage-system
Association of Defense Communities. (2014). Fort Bragg Microgrid to Bolster Energy
Reliability: https://www.defensecommunities.org/blog/energy/ft-bragg-microgrid-to-
bolster-energy-reliability/
Automation Nation. (2011). Smart Grid and Digital Electricity with Smart Meters:
https://automationation.wordpress.com/2011/01/14/smart-grid-and-digital-electricity-
with-smart-meters/
Bloomberg. (2018). The Cyberattack That Crippled Gas Pipelines is Now Hitting another
Industry: https://www.bloomberg.com/news/articles/2018-04-04/cyberattack-bleeds-into-
utility-space-as-duke-sees-billing-delay
California Council on Science and Technology. (2011). Health Impacts of Radio
Frequency from Smart Meters: https://ccst.us/publications/2011/2011smart-final.pdf
Catawba College. (2018). Environment and Sustainability Degree-Bachelor of Science:
https://catawba.edu/academics/programs/undergraduate/environment-and-
sustainability/
City of Raleigh. (2019). Electric Vehicles Infrastructure Project Wrap-Up:
https://www.raleighnc.gov/environment/content/AdminServSustain/Articles/ElectricVehic
les.html
Conservation Trust for North Carolina. (2017). Cumulative Land Protection Totals:
(https://www.ctnc.org/north-carolina-local-land-trusts/find-local-land-trust/)
Duke Energy. (2017) Duke Energy embarks on a 10-year initiative…:
(https://news.duke-energy.com/releases/duke-energy-embarks-on-a-10-year-initiative-
to-strengthen-north-carolina-s-energy-grid
Duke Energy. (2018). Electric Vehicles: https://www.duke-energy.com/energy-
education/energy-savings-and-efficiency/plug-in-electric-vehicles/faq

6-37
Duke Energy. (2017). 2017 Sustainability Report: https://sustainabilityreport.duke-
energy.com/2017/
Electric Power Research Institute (EPRI). (2011). Costs and Benefits of Smart Grid:
https://www.smartgrid.gov/files/Estimating_Costs_Benefits_Smart_Grid_Preliminary_Es
timate_In_201103.pdf
EPRI. (2002) Radio Frequency Exposure Fundamentals:
https://www.epri.com/#/pages/product/000000000001005495/?lang=en
Energy Information Administration. (2018). AEO Table 8. Electricity Supply, Disposition,
Prices, and Emissions: https://www.eia.gov/outlooks/aeo/data/browser/#/?id=8-
AEO2018&cases=ref2018&sourcekey=0
EIA. (2016). Capital Cost Estimates for Utility Scale Electricity Generating Plants:
https://www.eia.gov/analysis/studies/powerplants/capitalcost/pdf/capcost_assumptio
n.pdf
EIA. (2018). Annual Energy Outlook 2018 Energy Information Administration, Table
9. Electricity Generating Capacity:
https://www.eia.gov/outlooks/aeo/data/browser/#/?id=9-
AEO2018&cases=ref2018&sourcekey=0
EIA. (2017). U.S. Petroleum Flow, 2017- Million Barrels per Day:
https://www.eia.gov/totalenergy/data/monthly/pdf/flow/petroleum.pdf
EIA. (2017). North Carolina -State Profile and Energy Estimates:
https://www.eia.gov/state/seds/data.php?incfile=/state/seds/sep_sum/html/sum_ex_t
ot.html&sid=NC
EIA. (2016). NC Transportation Sector Energy Consumption Estimates, 1960-2016:
(https://www.eia.gov/state/seds/data.php?incfile=/state/seds/sep_use/tra/use_tra_N
C.html&sid=NC
EIA. (2016).Primary Energy, Electricity, and Total Energy Expenditure Estimates:
https://www.eia.gov/state/seds/data.php?incfile=/state/seds/sep_sum/html/sum_ex_t
ot.html&sid=NC
EIA. (2016). U.S. Battery Storage Market Trends:
https://www.eia.gov/analysis/studies/electricity/batterystorage/pdf/battery_storage.pd
f
ENGIE Storage. (2015). Nissan and 4R Energy Partner with Green Charge Networks
for Commercial Energy Storage Featuring Second-Life Electric Vehicle Batteries:

6-38
http://www.engiestorage.com/nissan-and-4r-energy-partner-with-green-charge-
networks-for-commercial-energy-storage-featuring-second-life-electric-vehicle-batteries/
Fletcher, Seth. (ND) How 29 Long-Ignored Elements Could Make or Break the Clean-
Energy Revolution: https://www.popsci.com/science/article/2011-05/29-long-ignored-
elements-could-make-or-break-clean-energy-revolution#page-2
Forbes. (2015). Cybersecurity Market Reaches $75 Billion In 2015…:
https://www.forbes.com/sites/stevemorgan/2015/12/20/cybersecurity%E2%80%8B-
%E2%80%8Bmarket-reaches-75-billion-in-2015%E2%80%8B%E2%80%8B-
%E2%80%8Bexpected-to-reach-170-billion-by-2020/#786a3e6430d6
Industrial Control Systems Cyber Emergency Response Team (ICS-CERT). (2014).
ICS-CERT Monitor: https://ics-cert.us-cert.gov/monitors/ICS-MM201404
Kelly Blue Book. (2018). Electric Cars: PEV & EV: https://www.kbb.com/new-cars/
Mission Critical. (2012). Pike Research Releases Report on Smart Grid Cyber Security: https://www.missioncriticalmagazine.com/articles/84683-pike-research-releases-report-on-smart-grid-cyber-security
National Association of State Energy Officials (NASEO). (2013). Baseline Assessment: Alternative Fuel Vehicles in State and Municipal Emergency Operations Plans: https://www.naseo.org/data/sites/1/documents/publications/iREV_BaselineAssessmentMemo_Final.pdf
National Conference of State Legislatures. (2017). State Efforts to Promote Hybrid and Electric Vehicles: http://www.ncsl.org/research/energy/state-electric-vehicle-incentives-state-chart.aspx
National Institute of Standards and Technology. (2013). Smart Grid Interoperability Panel: https://www.nist.gov/programs-projects/smart-grid-national-coordination/smart-grid-interoperability-panel-sgip
National Renewable Energy Laboratory (NREL). (2010).Transportation Electrification Load Development for a Renewable Future Analysis: https://www.nrel.gov/docs/fy11osti/49181.pdf
NREL. (2011). NREL Team Investigates Secondary Uses for Electric Drive Vehicle Batteries: https://www.nrel.gov/news/press/2011/959.html
Nexight Group. (2010). Electric Power Industry Needs for Grid-Scale Storage Applications: http://nexightgroup.com/wp-content/uploads/2013/02/electric-power-industry-needs-for-gridscale-storage.pdf

6-39
North American Electric Reliability Council (NERC). (2019). Reliability Standards for the Bulk Electric Systems of North America: https://www.nerc.com/pa/Stand/Reliability%20Standards%20Complete%20Set/RSCompleteSet.pdf
NERC. (2017). CIP Standards: https://www.nerc.com/pa/Stand/Pages/CIPStandards.aspx
North Carolina Clean Energy Technology Center. (2018). Database of State Incentives for Renewables & Efficiency: http://programs.dsireusa.org/system/program?type=38&
NC Dept. of Environmental Quality. (2018). Energy Policy Council Biennial Report: https://files.nc.gov/ncdeq/Energy%20Mineral%20and%20Land%20Resources/Energy/Energy%20Policy%20Council/2018%20EPC%20Biennial%20Report%20-%20FINAL.pdf
NC General Statutes (NCGS): Chapter 113B: NC Energy Policy Act of 1975: https://www.ncleg.net/gascripts/Statutes/StatutesTOC.pl?Chapter=0113B
NCGS. Chapter 143B: Executive Organization Act of 1973: https://www.ncleg.net/EnactedLegislation/Statutes/HTML/ByChapter/Chapter_143B.html
NCGS. 62-2. Renewable Energy and Energy Efficiency Portfolio Standard: https://www4.ncleg.net/enactedlegislation/statutes/pdf/bysection/chapter_62/gs_62-2.pdf
NCGS. Chapter 75-90. Availability of gasoline suitable for blending…: https://www.ncleg.net/gascripts/statutes/statutelookup.pl?statute=75
NCGS. Chapter 105-449.130. Alternative Fuel: https://www.ncleg.net/gascripts/statutes/statutelookup.pl?statute=105
NCGS. Chapter 20-351. New Motor Vehicles Warranties Act: https://www.ncleg.net/gascripts/statutes/statutelookup.pl?statute=20
NCGS. Chapter 136-28.15. Diesel vehicles purchase warranty requirement: https://www.ncleg.net/gascripts/statutes/statutelookup.pl?statute=136
NCGS. Chapter 143-341.2 (a). Duties of the Department of Administration: https://www.ncleg.net/gascripts/statutes/statutelookup.pl?statute=143
NCGS. Chapter 115C-240(c) and 249(a). Transportation: https://www.ncleg.net/gascripts/statutes/statutelookup.pl?statute=115C

6-40
NCGS. Senate Bill 394-Legislative Cybersecurity Committee (proposed in 2017): https://www.ncleg.net/Sessions/2017/Bills/Senate/PDF/S394v1.pdf
NCGS. S.L. 2006-206, SENATE BILL 2051. An Act to Reduce Energy, Fuel… : https://www.ncleg.net/EnactedLegislation/SessionLaws/PDF/2005-2006/SL2006-206.pdf
NCGS. Session 2005-Senate Bill 2051. Energy Independence Act: https://www.ncleg.net/sessions/2005/bills/senate/html/s2051v1.html
NC Department of Information Technology. (2018). Enterprise Risk Management Services: https://it.nc.gov/statewide-resources/cybersecurity-and-risk-management/enterprise-risk-management
NC Department of Public Safety, Division of Emergency Management. (2012). North Carolina Emergency Operations Plan: https://files.nc.gov/ncdps/div/EM/Documents/NC_EOP_2012-FINAL.pdf
NC State University FREEDM Systems Center. (2018). FREEDM Systems Center modernizing the electric grid and shaping energy leaders: https://www.freedm.ncsu.edu/
Security Week.Com. (2012). GAO: 680 Percent Increase in Government Cyber Attacks: http://www.infosecisland.com/blogview/21131-GAO-680-Percent-Increase-in-Government-Cyber-Attacks.html
The Trust for Public Lands. (2011). North Carolina’s Return on the Investment in Land
Conservation: https://www.tpl.org/sites/default/files/cloud.tpl.org/pubs/benefits-nc-
return-on-investment.pdf
U.S. Census. (2011). Average Prices of Selected Fuels and Electricity:
https://www.census.gov/library/publications/2011/compendia/statab/131ed/prices.html
U.S. Department of Energy (DOE). (2017). U.S HEV Sales by Model:
https://www.afdc.energy.gov/data/10301
DOE. (2015). Plug-in Electric Vehicle Penetration by State:
https://www.energy.gov/eere/vehicles/fact-876-june-8-2015-plug-electric-vehicle-
penetration-state-2014
DOE. (2018). Alternative Fuels Data Center:
https://www.afdc.energy.gov/laws/all?state=US#Incentives
DOE. (2018). Alternative Fueling Station Locator:
https://www.afdc.energy.gov/stations/#/find/nearest

6-41
DOE. (2015). Costs Associated with Non-Residential EV Supply Equipment:
https://www.afdc.energy.gov/uploads/publication/evse_cost_report_2015.pdf
DOE. (2016). Overview of the DOE VTO Advanced Battery R&D Program:
https://www.energy.gov/sites/prod/files/2016/06/f32/es000_howell_2016_o_web.
Advanced Research Projects Agency-Energy (ARPA-E). (2018).
Superconducting Magnet Energy Storage System with Direct Power Electronics
Interface: https://arpa-e.energy.gov/?q=slick-sheet-project/magnetic-energy-
storage-system
DOE. (2018). Cyber Strategy:
https://www.energy.gov/sites/prod/files/2018/07/f53/EXEC-2018-
003700%20DOE%20Cybersecurity%20Strategy%202018-2020-Final-FINAL-
c2.pdf
DOE. (2018). Secretary of Energy Rick Perry Forms New Office of Cybersecurity,
Energy Security, and Emergency Response:
https://www.energy.gov/articles/secretary-energy-rick-perry-forms-new-office-
cybersecurity-energy-security-and-emergency
DOE. (2018). DOE Announces Investment to Strengthen and Secure Nation’s
Critical Energy Infrastructure: https://www.energy.gov/articles/doe-announces-
investment-strengthen-and-secure-nation-s-critical-energy-infrastructure
DOE. (2018). Multiyear Plan for Energy Sector Cybersecurity:
https://www.energy.gov/sites/prod/files/2018/05/f51/DOE%20Multiyear%20Plan
%20for%20Energy%20Sector%20Cybersecurity%20_0.pdf
U.S. Environmental Protection Agency (EPA). (2017). Summary of the Energy
Independence and Security Act: https://www.epa.gov/laws-regulations/summary-
energy-independence-and-security-act
U.S. Government Accountability Office. (2015). Critical Infrastructure Protection:
Cybersecurity of Nation's Electricity Grid… : https://www.gao.gov/products/GAO-16-
174T
U. S. Department of Homeland Security (DHS). (2014). Sector Risk Snapshots:
https://www.hsdl.org/?view&did=754033
DHS. (2018). Russian State-Sponsored Cyber Actors Targeting Network
Infrastructure Devices: https://www.us-cert.gov/ncas/alerts/TA18-106A

6-42
DHS-United States Computer Emergency Readiness Team (US-CERT). (2017).
Year in Review: https://www.us-
cert.gov/sites/default/files/publications/NCCIC_Year_in_Review_2017_Final.pdf
DHS. (2015). Biggest US Electric Company Battles Off Steady Cyberattacks:
https://inhomelandsecurity.com/biggest-us-electric-company-battles-off-steady-
cyberattacks/
The Trust for Public Land. (2011). North Carolina’s Return on the Investment in Land
Conservation: https://www.tpl.org/sites/default/files/cloud.tpl.org/pubs/benefits-nc-return-
on-investment.pdf
Transportation Security Administration (TSA). (2018). Pipeline Security Guidelines:
https://www.tsa.gov/sites/default/files/pipeline_security_guidelines.pdf
20 copies of this public document were printed at a cost of $1,132.24 or approximately $56.61 per copy.

State Energy OfficeState Energy Office
State Energy Office | 217 W. Jones Street | Raleigh, NC 27603 | 919.707.8750