Seog Oh/ Duke University/September, 2003 TRT Workshop/ Peniscola, Spain Duke TRT Progress.

LOGO
DUKE ENERGY PROGRESS
NORTH CAROLINA INTEGRATED RESOURCE PLAN
2018
PUBLIC
Exhibit 1A Docket No. E-2, Sub 1257
Page 1

DEP NC 2018 IRP CONTENTS:
ABBREVIATIONS ................................................................................................................................................ 3
CHAPTER 1: EXECUTIVE SUMMARY ......................................................................................................... 7
CHAPTER 2: SYSTEM OVERVIEW ..............................................................................................................14
CHAPTER 3: ELECTRIC LOAD FORECAST ..............................................................................................17
CHAPTER 4: ENERGY EFFICIENCY AND DEMAND-SIDE MANAGEMENT .....................................20
CHAPTER 5: RENEWABLE ENERGY STRATEGY / FORECAST ...........................................................22
CHAPTER 6: INTEGRATED SYSTEMS AND OPERATIONS PLANNING (ISOP) AND
BATTERY STORAGE ..............................................................................................................31
CHAPTER 7 SCREENING OF GENERATION ALTERNATIVES ............................................................35
CHAPTER 8 RESOURCE ADEQUACY ........................................................................................................37
CHAPTER 9 CAPACITY VALUE OF SOLAR .............................................................................................44
CHAPTER 10 NUCLEAR AND SUBSEQUENT LICENSE RENEWAL (SLR) ..........................................48
CHAPTER 11 COMBINED HEAT AND POWER ..........................................................................................50
CHAPTER 12 WESTERN CAROLINAS MODERNIZATION PROJECT (WCMP) .................................51
CHAPTER 13 EVALUATION AND DEVELOPMENT OF THE RESOURCE PLAN ...............................54
CHAPTER 14 SHORT-TERM ACTION PLAN ...............................................................................................75
APPENDIX A: QUANTITATIVE ANALYSIS ..................................................................................................84
APPENDIX B: DUKE ENERGY PROGRESS OWNED GENERATION ....................................................111
APPENDIX C: ELECTRIC LOAD FORECAST ............................................................................................119
APPENDIX D: ENERGY EFFICIENCY AND DEMAND-SIDE MANAGEMENT ...................................133
APPENDIX E: FUEL SUPPLY .........................................................................................................................160
APPENDIX F: SCREENING OF GENERATION ALTERNATIVES ..........................................................167
APPENDIX G: ENVIRONMENTAL COMPLIANCE ...................................................................................189
APPENDIX H: NON-UTILITY GENERATION AND WHOLESALE ........................................................197
APPENDIX I: DEP QF INTERCONNECTION QUEUE ..............................................................................202
APPENDIX J: TRANSMISSION PLANNED OR UNDER CONSTRUCTION ...........................................203
APPENDIX K: ECONOMIC DEVELOPMENT .............................................................................................210
APPENDIX L: CROSS-REFERENCE OF IRP REQUIREMENTS AND SUBSEQUENT ORDERS......211
ATTACHMENT I: NC REPS COMPLIANCE PLAN ....................................................................................216
ATTACHMENT II: COMPETITIVE PROCUREMENT OF RENEWABLE ENERGY PLAN ...............248
Duke Energy Progress North Carolina Integrated Resource Plan
2018 Biennial Report PUBLIC
Page 2

ABBREVIATIONS:
10 CFR Title 10 of the Code of Federal Regulations
AC Alternating Current
AEO Annual Energy Outlook
BCFD Billion Cubic Feet Per Day
CAIR Clean Air Interstate Rule
CAMA North Carolina Coal Ash Management Act of 2014
CAMR Clean Air Mercury Rule
CAPP Central Appalachian Coal
CC Combined Cycle
CCR Coal Combustion Residuals
CCS Carbon Capture and Sequestration
CECPCN Certificate of Environmental Compatibility and Public Convenience and Necessity (SC)
CFL Compact Fluorescent Light bulbs
CO2 Carbon Dioxide
COD Commercial Operation Date
COL Combined Construction and Operating License
COWICS Carolinas Offshore Wind Integration Case Study
CPCN Certificate of Public Convenience and Necessity (NC)
CPRE Competitive Procurement of Renewable Energy
CSAPR Cross State Air Pollution Rule
CT Combustion Turbine
DC Direct Current
DCA Design Certification Application
DEC Duke Energy Carolinas
DEF Duke Energy Florida
DEI Duke Energy Indiana
DEK Duke Energy Kentucky
DEP Duke Energy Progress
DER Distributed Energy Resource
DIY Do It Yourself
DOE Department of Energy
DOJ Department of Justice
DSM Demand-Side Management
EE Energy Efficiency Programs
EIA Energy Information Administration
EPA Environmental Protection Agency
EPC Engineering, Procurement, and Construction Contractors
EPRI Electric Power Research Institute
FERC Federal Energy Regulatory Commission
FGD Flue Gas Desulfurization
Duke Energy Progress North Carolina Integrated Resource Plan
2018 Biennial Report PUBLIC
Page 3
ABBREVIATIONS:
FLG Federal Loan Guarantee
FPS Feet Per Second
GALL-SLR Generic Aging Lessons Learned for Subsequent License Renewal
GEH GE Hitachi
GHG Greenhouse Gas
GWh Gigawatt-hour
HB 589 North Carolina House Bill 589
HVAC Heating, Ventilation and Air Conditioning
HRSG Heat Recovery Steam Generator
IA Interconnection Agreement
IGCC Integrated Gasification Combined Cycle
ILB Illinois Basin
ILR Inverter Load Ratios
IRP Integrated Resource Plan
IS Interruptible Service
ISOP Integrated Systems and Operations Planning
IT Information Technologies
ITC Investment Tax Credit
IVVC Integrated Volt-Var Control
JDA Joint Dispatch Agreement
kW Kilowatt
kWh Kilowatt-hour
LCR TABLE Load, Capacity, and Reserves Table
LEED Leadership in Energy and Environmental Design
LED Light Emitting Diodes
LEO Legally Enforceable Obligation
LFE Load Forecast Error
LNG Liquified Natural Gas
LOLE Loss of Load Expectation
MACT Maximum Achievable Control Technology
MATS Mercury Air Toxics Standard
MGD Million Gallons Per Day
MW Megawatt
MWh Megawatt-hour
NAPP Northern Appalachian Coal
NAAQS National Ambient Air Quality Standards
NAP Northern Appalachian Coal
NEMS National Energy Modeling Systems
M&V Measurement and Verification
NC North Carolina
NCCSA North Carolina Clean Smokestacks Act
Duke Energy Progress North Carolina Integrated Resource Plan
2018 Biennial Report PUBLIC
Page 4
ABBREVIATIONS:
NCDAQ North Carolina Division of Air Quality
NCEMC North Carolina Electric Membership Corporation
NCMPA1 North Carolina Municipal Power Agency #1
NCTPC NC Transmission Planning Collaborative
NCUC North Carolina Utilities Commission
NERC North American Electric Reliability Corp
NESHAP National Emission Standards for Hazardous Air Pollutants
NOx Nitrogen Oxide
NES Neighborhood Energy Saver
NPDES National Pollutant Discharge Elimination System
NRC Nuclear Regulatory Commission
NSPS New Source Performance Standard
NYMEX New York Mercantile Exchange
NUREG Nuclear Regulatory Commission Regulation
OATT Open Access Transmission Tariff
O&M Operating and Maintenance
PD Power Delivery
PEV Plug-In Electric Vehicles
PJM PMJ Interconnection, LLC
PMPA Piedmont Municipal Power Agency
PPA Purchase Power Agreement
PPB Parts Per Billion
PROSYM Production Cost Model
PSCSC Public Service Commission of South Carolina
PSD Prevention of Significant Deterioration
PURPA Public Utility Regulatory Policies Act
PV Photovoltaic
PVDG Solar Photovoltaic Distributed Generation Program
PVRR Present Value Revenue Requirements
QF Qualifying Facility
RCRA Resource Conservation Recovery Act
REC Renewable Energy Certificates
REPS Renewable Energy and Energy Efficiency Portfolio Standard
RFP Request for Proposal
RICE Reciprocating Internal Combustion Engines
RIM Rate Impact Measure
RPS Renewable Portfolio Standard
RRP Refrigerator Replacement Program
SAE Statistical Adjusted End-Use Model
SAT Single-Axis Tracking
SC South Carolina
Duke Energy Progress North Carolina Integrated Resource Plan
2018 Biennial Report PUBLIC
Page 5
ABBREVIATIONS:
SCE&G South Carolina Electric & Gas
SC DER or SC ACT
236 South Carolina Distributed Energy Resource Program
SCR Selective Catalytic Reduction
SEPA Southeastern Power Administration
SERC SERC Reliability Corporation
SERVM Strategic Energy Risk Valuation Model
SG Standby Generation
SIP State Implementation Plan
SLR Subsequent License Renewal
SMR Small Modular Reactor
SO System Optimizer
SO2 Sulfur Dioxide
SRP – SLR Standard Review Plan for the Review of Subsequent License Renewal
T&D Transmission & Distribution
TAG Technology Assessment Guide
TRC Total Resource Cost
TVA Tennessee Valley Authority
THE COMPANY Duke Energy Progress
THE PLAN Duke Energy Progress Annual Plan
UEE Utility Energy Efficiency
UG/M3 Micrograms Per Cubic Meter
UCT Utility Cost Test
VACAR Virginia/Carolinas
VAR Volt Ampere Reactive
WERP Weatherization and Equipment Replacement Program
ZELFRS Zero – Emitting Load Following Resources
Duke Energy Progress North Carolina Integrated Resource Plan
2018 Biennial Report PUBLIC
Page 6

1. EXECUTIVE SUMMARY
For more than a century, Duke Energy Progress (DEP or the Company) has provided affordable
and reliable electricity to customers in North Carolina (NC) and South Carolina (SC) now
totaling approximately 1.6 million in number. The Company continues to serve its growing
number of customers by planning for future resource needs in the most reliable and economic
way possible while using increasingly clean forms of energy to meet those needs.
Historically, each year, as required by the North Carolina Utilities Commission (NCUC) and the
Public Service Commission of South Carolina (PSCSC), DEP submits a long-range planning
document called the Integrated Resource Plan (IRP). The IRP details potential infrastructure
needed to match the forecasted electricity requirements and a reasonable reserve margin to
maintain system reliability for our customers over the next 15 years.
The Company files separate IRPs for North Carolina and South Carolina. However, the IRP
analyzes the system as one DEP utility across both states including customer demand, energy
efficiency (EE), demand-side management (DSM), renewable resources and traditional supply-
side resources. As such, the quantitative analysis contained in both the North Carolina and South
Carolina filings is identical, while certain sections dealing with state-specific issues such as state
renewable standards or environmental standards may be specific to that state’s IRP.
This report is intended to provide stakeholders insight into the Company’s planning process for
meeting forecasted customer peak demand and cumulative energy needs over the 15-year planning
horizon. Such stakeholders include: legislative policymakers, public utility commissioners and their
staffs, other regulatory entities, retail customers, wholesale customers, environmental advocates,
renewable resource industry groups and the general public.
2018 IRP SUMMARY
Objectives:
The 2018 IRP is the best projection of how the Company’s resource portfolio is expected to
evolve based on current data and assumptions. This projection may change over time as variables
such as the projected load forecasts, fuel price forecasts, federal and state regulations, technology
performance and cost characteristics and other outside factors change.
Consistent with the Company’s commitment to a smarter energy future, the resource plan
presented within this IRP meet the following objectives:
Duke Energy Progress North Carolina Integrated Resource Plan
2018 Biennial Report PUBLIC
Page 7

• Improve the environmental footprint of the resource portfolio reducing carbon dioxide
(CO2) emissions by at least 40% from 2005 levels by 2030 with approximately 60% of
electricity coming from carbon free clean energy sources.
• Ensure adequate resource reserves are available over the planning horizon to provide
reliable electric service 365 days a year, 24 hours a day, especially during periods of high
demand such as cold winter mornings.
• Develop resource plans that result in the lowest reasonable cost to customers in order to
provide affordable power for the residents, businesses and communities that depend on
DEP.
• Produce robust plans that recognize current trends and future uncertainty in the way
power is both produced and consumed given technology advancements in power supply
and consumer usage.
Resource Need:
To maintain long-term reliability, new resource additions are required to meet growing customer
demand and to allow for the retirement of aging resources. While extensive Company-sponsored
energy efficiency programs help to reduce energy consumption, industry, businesses and
residents continue to grow and expand in DEP’s service territory. The Company projects the
addition of 201,000 new customers contributing to approximately 1,560 MW of additional winter
peak demand on the system with annual energy consumption growing by approximately 5,100
GWh between 2019 and 2033. This represents an annual demand growth rate of 0.7 % and an
energy growth rate of 0.5%. In addition to growing demand, DEP is planning for the potential
retirement of some of its older, less efficient generation, creating an additional need of 2,183
MW. The Company also has approximately 1,850 MW of purchased power contracts that expire
during the planning period. Finally, beyond just meeting expected consumer demand and
replacing retired resources, the plan must also be capable of covering uncertainty caused by
variables such as extreme cold weather events or unexpected resource outages. Planning for this
uncertainty requires the incorporation of a 17% winter planning reserve margin ensuring that
adequate resources are available to reliably serve customers despite these uncertainties. In total,
customer growth, retirements, contract expirations and additional reserves will result in the need
for approximately 6,300 MW of new resources over the planning horizon.
Planned Additions:
As discussed in more detail in this report, the Company examined several different resource
portfolio options to see how each would perform under varying future state assumptions. The
Duke Energy Progress North Carolina Integrated Resource Plan
2018 Biennial Report PUBLIC
Page 8

development of the base resource plans (one base plan assuming a carbon constrained future and
one base plan assuming no future carbon legislation) that best meet the previously stated objectives
resulted in the addition of a diverse mix of energy efficiency (EE), Demand-Side Management
(DSM), renewable energy resources, and natural gas resources. The plans also contemplate the
addition of grid-connected battery storage projects, given their potential to provide solutions for
the transmission and distribution systems with the possibility of simultaneously providing
benefits to the generation resource portfolio. Technical advancements and declining cost trends
in distributed energy resources such as battery storage, distributed solar generation and demand-
side management initiatives give rise to a future resource portfolio that is comprised of both
centralized resources, as well as, a growing penetration of distributed resources. This document
discusses the Company’s efforts to evolve its planning models to better evaluate these distributed
resources as they are integrated into the generation, transmission and distribution systems along
with centralized generation such as natural gas and nuclear generation facilities. The figure
below shows the Company’s 2019 starting resource portfolio capacity mix in the upper left pie
figure, while the upper right figure shows the 2033 projected portfolio at the end of the planning
horizon. The figure on the bottom illustrates the incremental resources made over the planning
horizon.
Figure Exec-1: 2019 and 2033 Capacity Mix and Sources of Incremental Capacity Additions
Duke Energy Progress North Carolina Integrated Resource Plan
2018 Biennial Report PUBLIC
Page 9

As shown in Figure Exec-1, DEP continues to reduce its dependence on coal fired generation
with installed coal capacity dropping from 19% of the total portfolio in 2019 to a projection of
only 9% by 2033. Renewable resources, energy efficiency and demand-side management also
growing from 18% of the capacity mix in 2019 to 22% in 2033, while natural gas resources
increase by 18% growing to 51% of the mix by 2033.
As the bottom figure indicates, the plan calls for the significant additions of predominantly
dispatchable natural gas generation, as well as, renewable generation, battery storage, EE and
DSM resources. Together, this combination provides customers with a balanced portfolio with
natural gas resources providing dispatchable power at night or when solar output is interrupted
due to cloud cover, snow cover or other factors. The additional storage will further help to
integrate distributed solar resources into the resource portfolio.
A small amount of nuclear capacity is expected to be added to existing nuclear resources over the
15-year study period due to planned uprates within the existing nuclear fleet. However, nuclear
capacity will make-up a slightly smaller percentage of total capacity as the total system grows
throughout the planning period. No new nuclear generation units are added to the system, nor do
the base plans contemplate nuclear retirements over the planning period.
Nuclear Generation:
Low natural gas prices, the absence of national carbon regulation and other industry factors have
collectively moved the need for new nuclear generation outside the current planning window.
However, shown in the figure above, clean, carbon-free nuclear generation from existing units
provides approximately 20% of the installed capacity in DEP’s resource portfolio. DEP nuclear
resources collectively account for nearly one-half of the total energy produced.
Unlike almost all other resource options, nuclear units provide clean power around the clock
every day of the year, except for small periods of outages for refueling and maintenance. As
such, nuclear generation is an essential component of the Company’s commitment to the
provision of affordable, reliable and increasingly clean power.
DEP currently has operating licenses from the Nuclear Regulatory Commission (NRC) that
allow the Company to operate its units for sixty years. To ensure these valuable resources are
available for the next generation, the Company is working within the framework established by
the NRC to evaluate the potential for subsequent license renewals (SLR) of its nuclear units.
Duke Energy Progress North Carolina Integrated Resource Plan
2018 Biennial Report PUBLIC
Page 10

SLR would give the Company the option to operate its nuclear facilities an additional twenty
years. Chapter 10 describes the Company’s ongoing efforts toward the evaluation of SLR.
Renewable Energy and Energy Efficiency:
DEP continues to aggressively pursue additional cost-effective renewable resources as a growing
part of its energy portfolio. The Company’s commitment, coupled with supporting federal tax
credits and state legislation such as North Carolina’s Renewable Energy and Energy Efficiency
Portfolio Standard (NC REPS), NC House Bill 589 (HB 589) and South Carolina’s Distributed
Energy Resource Program Act (SC DER or SC Act 236), have led to significant growth in
renewable resource development in the Carolinas. The 2018 IRP calls for installed solar capacity
to grow from approximately 2,758 MW in 2019 to 4,199 MW in 2033. Chapter 5 of the plan
discusses the importance of the Competitive Procurement of Renewable Energy (CPRE) process
as a mechanism to acquire new solar resources at the lowest possible cost for customers.1
Additionally, Chapter 5 discusses future physical and economic factors that will ultimately
influence the amount of solar generation that can reliably and affordably be incorporated into
DEP’s resource portfolio.
In addition to growing renewable generation in the plan, DEP is actively investing in EE and
DSM programs that promote, educate and incentivize the efficient utilization of power. DEP
offers a wide range of EE programs to its residential, commercial and industrial customers to
help them reduce their power consumption. These efforts are expected to help decrease the
projected growth in annual energy consumption by approximately 22% over the planning
horizon.
Dispatchable Natural Gas:
An important component of DEP’s resource portfolio is the addition of dispatchable natural gas
resources that are required for long-term system reliability, as well as for the provision of day-to-
day, hour-to-hour and even minute-to-minute load following capabilities. Improvements in
natural gas turbine technology provide additional flexibility to the resource portfolio relative to
older assets that are being retired, while efficiency improvements reduce the amount of fuel
required to produce the same amount of electricity. These technology developments make these
natural gas technologies attractive, resulting in a resource portfolio with a smaller environmental
1 The DEP CPRE Plan is included as Attachment II of this IRP document.
Duke Energy Progress North Carolina Integrated Resource Plan
2018 Biennial Report PUBLIC
Page 11

footprint, while also providing additional real-time ramping capabilities to better follow changes
in system load requirements and varying levels of solar output. At times, these resources may be
needed for short durations to provide power during high load periods caused by extreme
temperatures. In other instances, these dispatchable resources are needed to run for days, or even
weeks at a time, to provide power when other units are offline for maintenance or during periods
of extended cloud cover that reduce the output of solar generation. DEP’s resource plans call for
the addition of approximately 2,760 MW of simple cycle combustion turbine (CT) technology
and 3,236 MW of combined cycle (CC) generation technology to help meet load growth, replace
unit retirements and expiring purchase power contracts, and optimally meet the needs of the
system.
Conclusion:
In summary, the 2018 IRP Base Cases, discussed later in this document, show planned resource
additions necessitated by load growth, retirement of aging generation resources and expiration of
purchased power contracts. The plans are consistent with DEP’s commitment to a smarter energy
future, providing customers with reliable, affordable and increasingly clean sources of energy.
Additionally, they maintain the Company’s sustainability goals to reduce DEP’s carbon
emissions by more than 40% from 2005 levels by 2030. The plans accomplish this goal, despite
serving significantly more customer demand over the planning period and without federal or
state carbon mandates. Achieving robust base plans that balance the previously stated objectives
requires a diverse mix of additional EE, DSM, renewable resources, energy storage and new
efficient dispatchable natural gas resources. Plans that concentrate too much on a single resource
result in additional customer costs, higher carbon emissions or both.
The following chapters of this document provide an overview of the assumptions, inputs, analysis
and results included in the 2018 IRP. In addition to two Base Case plans, five different resource
portfolios were analyzed under multiple sensitivities. The appendices to the document give even
greater detail and specific information regarding the input development and the analytic process
utilized in the 2018 IRP. A more detailed presentation of the Base Cases described above is
included in this document in Chapter 12 and Appendix A.
Finally, DEP will continue to closely monitor changes in key variables such as technology cost
trends, the system load forecast, fuel price forecasts, emerging technology performance
characteristics, the pace of adoption of distributed resources, advancements in storage
technologies, new federal or state energy policies and other key variables. To the extent these
Duke Energy Progress North Carolina Integrated Resource Plan
2018 Biennial Report PUBLIC
Page 12

variables change over time, DEP will incorporate such changes in subsequent annual IRP
reports.
Duke Energy Progress North Carolina Integrated Resource Plan
2018 Biennial Report PUBLIC
Page 13

2. SYSTEM OVERVIEW
DEP’s service area covers approximately 32,485 square miles, including a substantial portion of
the coastal plain of North Carolina extending from the Piedmont to the Atlantic coast between
the Pamlico River and the South Carolina border, the lower Piedmont section of North Carolina,
an area in western North Carolina in and around the city of Asheville and an area in the
northeastern portion of South Carolina. In addition to retail sales to approximately 1.56 million
residential, commercial and industrial customers, the Company also sells wholesale electricity to
incorporated municipalities and to public and private utilities.
DEP currently meets energy demand, in part, by purchases from the open market, through longer-
term purchased power contracts and from the following electric generation assets. All capacities
represent winter ratings, unless otherwise noted:
• Three nuclear generating stations with a combined net capacity of 3,705 MW
• Three coal-fired stations with a combined capacity of 3,592 MW
• Four hydroelectric stations with a combined capacity of 227 MW
• Ten combustion turbine stations including four combined cycle units with a combined
capacity of 6,388 MW
• Four utility-owned solar facilities with a combined capacity of 141 MW (nameplate) 2
DEP’s power delivery system consists of approximately 75,836 miles of distribution lines and 6,241
miles of transmission lines. The transmission system is directly connected to all of the Transmission
Operators that surround the DEP service area. There are 42 tie-line circuits connecting with six
different Transmission Operators: Duke Energy Carolinas (DEC), PJM, Tennessee Valley Authority
(TVA), Cube Hydro, South Carolina Electric & Gas (SCE&G), and Santee Cooper. These
interconnections allow utilities to work together to provide an additional level of reliability. The
strength of the system is also reinforced through coordination with other electric service providers in
the Virginia-Carolinas (VACAR) sub-region, SERC Reliability Corporation (formerly Southeastern
Electric Reliability Council), and North American Electric Reliability Corporation (NERC).
The map on the following page provides a high-level view of the DEP service area.
2 The capacity represented in this listing only includes utility-owned solar capacity. Capacity from purchased power
contracts are not included.
Duke Energy Progress North Carolina Integrated Resource Plan
2018 Biennial Report PUBLIC
Page 14

Figure 2-A: Duke Energy Progress Service Area
Page 15
Duke Energy Progress North Carolina Integrated Resource Plan
2018 Biennial Report PUBLIC
Page 15

With the closing of the Duke Energy Corporation and Progress Energy Corporation merger, the
service territories for both DEP and DEC lend to future opportunities for collaboration and potential
sharing of capacity to create additional savings for North Carolina and South Carolina customers of
both utilities. An illustration of the service territories of the Companies is shown in the map below.
Figure 2-B: DEP and DEC Service Area
Duke Energy Progress North Carolina Integrated Resource Plan
2018 Biennial Report PUBLIC
Page 16
3. ELECTRIC LOAD FORECAST
The Duke Energy Progress Spring 2018 forecast provides projections of the energy and peak
demand needs for its service area. The forecast covers the time period of 2019 – 2033 and
represents the needs of the retail and wholesale customers.
Energy projections are developed with econometric models using key economic factors such as
income, electricity prices, industrial production indices, along with weather, appliance efficiency
trends, rooftop solar trends, and electric vehicle trends. Population is also used in the Residential
customer model. Regression analysis is utilized and has yielded consistently reasonable results over
the years.
The economic projections used in the Spring 2018 Forecast are obtained from Moody’s Analytics, a
nationally recognized economic forecasting firm, and include economic forecasts for the states of
North and South Carolina.
Moody’s Analytics supplies the Company with economic and demographic projections, which are
used in the energy and demand models. Preliminary analysis of Moody’s historical projections
versus actuals resulted in smaller variances and minimum bias during normal economic
periods. However, the likelihood of greater forecast variance and forecast bias increases during
unique disruptive economic periods like the Great Recession. Load Forecasting will continue to
monitor Moody’s forecast error going forward.
The Retail forecast consists of the three major classes: Residential, Commercial and Industrial.
The Residential class sales forecast is comprised of two projections. The first is the number of
residential customers, which is driven by population. The second is energy usage per customer,
which is driven by weather, regional economic and demographic trends, electricity prices and
appliance efficiencies.
The usage per customer forecast was derived using a Statistical Adjusted End-Use Model (SAE).
This is a regression-based framework that uses projected appliance saturation and efficiency trends
developed by Itron using Energy Information Administration (EIA) data. It incorporates naturally
occurring efficiency trends and government mandates more explicitly than other models. The
outlook for usage per customer is essentially flat through much of the forecast horizon, so most of
the growth is primarily due to increases in the number of customers being added to the system. The
Duke Energy Progress North Carolina Integrated Resource Plan
2018 Biennial Report PUBLIC
Page 17

average annual energy growth rate of Residential in the Spring 2018 forecast, including the impacts
of Utility EE (UEE) programs, rooftop solar and electric vehicles from 2019 to 2033 is 1.1%.
The Commercial forecast also uses an SAE model in an effort to reflect naturally occurring, as well
as, government-mandated efficiency changes. The three largest sectors in the Commercial class are
Offices, Education and Retail. Commercial energy sales are expected to grow 0.6% per year over
the forecast horizon.
The Industrial class is forecasted by a standard econometric model with drivers such as total
manufacturing output, textile output, and the price of electricity. Overall, Industrial energy sales are
expected to grow 0.2% per year over the forecast horizon, after all adjustments.
Peak Demand and Energy Forecast:
The load forecast projection for energy and capacity, including the impacts of UEE, rooftop solar,
and electric vehicles, that was utilized in the 2018 IRP is shown in Table 3-A.
Duke Energy Progress North Carolina Integrated Resource Plan
2018 Biennial Report PUBLIC
Page 18

Table 3-A: Load Forecast with Energy Efficiency Programs
YEAR SUMMER
(MW)
WINTER
(MW)
ENERGY
(GWH)
2019 13,317 14,011 64,038
2020 13,322 14,016 63,669
2021 13,324 14,001 63,613
2022 13,416 14,089 63,393
2023 13,510 14,139 63,809
2024 13,658 14,308 64,622
2025 13,796 14,415 65,178
2026 14,014 14,568 65,145
2027 14,118 14,713 65,726
2028 14,336 14,903 66,593
2029 14,473 15,032 67,080
2030 14,605 15,155 67,548
2031 14,762 15,303 68,108
2032 14,941 15,475 68,787
2033 15,054 15,575 69,125
Avg. Annual
Growth Rate 0.8% 0.7% 0.5%
A detailed discussion of the electric load forecast is provided in Appendix C.
Duke Energy Progress North Carolina Integrated Resource Plan
2018 Biennial Report PUBLIC
Page 19

4. ENERGY EFFICIENCY AND DEMAND-SIDE MANAGEMENT
DEP is committed to making sure electricity remains available, reliable and affordable and that it
is produced in an environmentally sound manner and, therefore, DEP advocates a balanced
solution to meeting future energy needs in the Carolinas. That balance includes a strong
commitment to energy efficiency (EE) and demand-side management (DSM).
Since 2009, DEP has been actively developing and implementing new EE and DSM programs
throughout its North Carolina and South Carolina service areas to help customers reduce their
electricity demands. DEP’s EE and DSM plan is designed to be flexible, with programs being
evaluated on an ongoing basis so that program refinements and budget adjustments can be made
in a timely fashion to maximize benefits and cost-effectiveness. Initiatives are aimed at helping
all customer classes and market segments use energy more wisely. The potential for new
technologies and new delivery options is also reviewed on an ongoing basis in order to provide
customers with access to a comprehensive and current portfolio of programs.
DEP’s EE programs encourage customers to save electricity by installing high efficiency
measures and/or changing the way they use their existing electrical equipment. DEP evaluates
the cost-effectiveness of EE/DSM programs from the perspective of program participants, non-
participants, all customers and total utility spending using the four California Standard Practice
tests (i.e., Participant Test, Rate Impact Measure (RIM) Test, Total Resource Cost (TRC) Test
and Utility Cost Test (UCT), respectively) to ensure the programs can be provided at a lower
cost than building supply-side alternatives. The use of multiple tests can ensure the development
of a reasonable set of programs and indicate the likelihood that customers will participate. DEP
will continue to seek approval from State utility commissions to implement EE and DSM
programs that are cost-effective and consistent with DEP’s forecasted resource needs over the
planning horizon. DEP currently has approval from the North Carolina Utilities Commission
(NCUC) and the Public Service Commission of South Carolina (PSCSC) to offer a large variety
of EE and DSM programs and measures to help reduce electricity consumption across all types
of customers and end-uses.
For IRP purposes, these EE-based demand and energy savings are treated as a reduction to the
load forecast, which also serves to reduce the associated need to build new supply-side
generation, transmission and distribution facilities. DEP also offers a variety of DSM (or
demand response) programs that signal customers to reduce electricity use during select peak
hours as specified by the Company. The IRP treats these “dispatchable” types of programs as
Duke Energy Progress North Carolina Integrated Resource Plan
2018 Biennial Report PUBLIC
Page 20
resource options that can be dispatched to meet system capacity needs during periods of peak
demand.
In 2016, DEP commissioned an EE market potential study to obtain estimates of the technical,
economic and achievable potential for EE savings within the DEP service area. The final report
was prepared by Nexant, Inc. and was completed in December 2016. The results of the market
potential study are suitable for integrated resource planning purposes and use in long-range
system planning models. However, the study did not attempt to closely forecast short-term EE
achievements from year to year. Therefore, the Base Case EE/DSM savings contained in this IRP
were projected by blending DEP’s five-year program planning forecast into the long-term
achievable potential projections from the market potential study.
DEP prepared a Base Portfolio savings projection that was based on DEP’s five-year program
plan for 2018-22. For periods beyond 2027, the Base Portfolio assumed that the Company could
achieve the annual savings projected in the Achievable Portfolio presented in Nexant’s Market
Potential Study. For the period of 2023 through 2027, the Company employed an interpolation
methodology to blend together the projection from DEP’s program plan and the Market Potential
Study Achievable Potential.
DEP also prepared a High EE Portfolio savings projection based on the Enhanced Scenario
contained in Nexant’s Market Potential Study, which assumed the implementation of potential
new technologies and programs not currently offered by DEP can encourage additional customer
participation and savings.
Additionally, for both the Base and High Portfolios described above, DEP included an
assumption that, when the EE measures included in the forecast reach the end of their useful
lives, the impacts associated with these measures are removed from the future projected EE
impacts. This concept of “rolling off” the impacts from EE programs is explained further in
Appendix C.
See Appendix D for further detail on DEP’s EE, DSM and consumer education programs, which
also includes a discussion of the methodology for determining the cost effectiveness of EE and
DSM programs.
Duke Energy Progress North Carolina Integrated Resource Plan
2018 Biennial Report PUBLIC
Page 21

5. RENEWABLE ENERGY STRATEGY / FORECAST
The growth of renewable generation in the United States continues to outpace that of non-renewable
generation. According to EIA, in 2017, including small-scale solar, 14.5 GW of wind and solar
capacity were installed nationwide compared to 9.3 GW of natural gas. About 4 GW of natural gas
was retired in 2017 and over 6 GW of coal was retired with no new coal-fired generation installed.3
North Carolina ranked second in the country in solar capacity added in 2017, and remains second
behind only California in total solar capacity online. According to GTM Research, South Carolina
also cracked the top 10 in 2018, adding nearly 400 MW in 2017. Duke Energy’s compliance with
the North Carolina Renewable Energy and Energy Efficiency Portfolio Standards (NC REPS), the
South Carolina Distributed Energy Resource Program (SC DER), the Public Utility Regulatory
Policies Act (PURPA), as well as the availability of the Federal Investment Tax Credit (ITC) were
key factors behind the high penetration of solar.
The interconnection queue has continued to grow, with the DEP and DEC combined solar queue
representing approximately 12 GW. Key drivers to queue growth have been the upcoming
procurement for HB 589 (described below), North Carolina’s historically favorable avoided cost
rate and 15-year contract terms for qualifying facilities (QFs) under PURPA, and the
implementation of SC DER.
The implementation of North Carolina House Bill 589 (HB 589), which calls for the addition of
2,660 MW of competitively procured renewable resources over a 45-month period, is significant to
the amount of solar projected to be operational during the planning horizon. Growing customer
demand, the federal ITC, and declining installed solar costs make solar capacity the Company’s
primary renewable energy resource in the 2018 IRP. The following key assumptions regarding
renewable energy were included in the 2018 IRP:
• Installed solar capacity increases in DEP from 2,758 MW in 2019 to 4,199 MW in 2033;
• Compliance with NC REPS continues to be met through a combination of solar, other
renewables, EE, and Renewable Energy Certificate (REC) purchases;
• Achievement of the SC Act 236 goal of 39 MW of solar capacity located in DEP; and
• Implementation of HB 589 and continuing solar cost declines drive solar capacity growth
above and beyond NC REPS requirements and SC Act 236 requirements.
3 All renewable energy GW/MW represent GW/MW-AC (alternating current) unless otherwise noted.
Duke Energy Progress North Carolina Integrated Resource Plan
2018 Biennial Report PUBLIC
Page 22
HB 589 Competitive Procurement of Renewable Energy (CPRE):
HB 589 establishes a competitive solicitation process, known as the Competitive Procurement of
Renewable Energy (CPRE), which calls for the addition of 2,660 MW of competitively procured
renewable resources across the Duke Energy Balancing Authority Areas over a 45-month period.
On July 10, 2018, Duke issued a request for bids for the first tranche of CPRE, requesting 600 MW
in DEC and 80 MW in DEP. North Carolina and South Carolina projects may submit proposals into
CPRE. See the annual CPRE Program Plan included as Attachment II for additional details.
The Companies expect to issue three “tranches” of requests for bids. Future tranches of CPRE may
be affected by capacity referred to in this document as the “Transition MW.” “Transition MW”
represents the total capacity of renewable generation projects in the combined Duke Balancing
Authority area that are (1) already connected; or (2) have entered into purchase power agreements
(PPAs) and interconnection agreements (IAs) as of the end of the 45-month competitive
procurement period, provided that they are not subject to curtailment or economic dispatch. The
total CPRE target of 2,660 MW will vary based on the amount of Transition MW at the end of the
45-month period, which HB 589 expected to total 3,500 MW. If the aggregate capacity in the
Transition MW exceeds 3,500 MW, the competitive procurement volume of 2,660 MW will be
reduced by the excess amount; conversely, if the Transition falls short of 3,500 MW the Companies
will conduct additional competitive procurement. The Company believes the Transition MW will
easily total 3,500 MW and possibly exceed it by as much as 1,200 MW.
In preparation for the HB 589 competitive procurement process, the Company continues to build its
relationships with suppliers, Engineering, Procurement, and Construction Contractors (EPCs), and
other entities to create greater efficiencies in the supply chain, reduce construction costs, reduce
operating and maintenance costs (O&M), and enhance system design. In anticipation of future solar
growth, DEP is positioning itself to properly integrate renewable resources to the grid regardless of
ownership.
In addition to ensuring DEP has operational control over future solar associated with HB 589, the
intermittency of solar output will require the Company to evaluate and invest in technologies to
provide solutions for voltage, volt-ampere reactive (VAR), and/or higher ancillary reserve
requirements.
Duke Energy Progress North Carolina Integrated Resource Plan
2018 Biennial Report PUBLIC
Page 23
Interconnection Queue:
Through the end of 2017, DEP had more than 2,000 MW of utility scale solar on its system, with
over 600 MW interconnecting in 2017. When renewable resources were evaluated for the 2018 IRP,
DEP reported another approximately 1,000 MW of third party solar under construction and more
than 6,000 MW in the interconnection queue. Table I-1 contains interconnection queue information
which provides details on the number of pending projects and pending capacity by state.
Projecting future solar connections from the interconnection queue presents a significant challenge
due to the large number of project cancellations, ownership transfers, interconnection studies
required, and the unknown outcome of which projects will be selected through the CPRE program.
DEP’s contribution to the Transition depends on a number of variables including connecting
projects under construction, the expected number of projects in the queue with a PPA and IA, and
SC DER Program Tier I. As of May 31, 2018, DEP had approximately 2,500 MW of solar capacity
with a PPA and IA, and roughly 100 MW of non-solar renewable capacity with PPAs that extend
through the 45-month CPRE period. A number of additional projects in the queue with a legally
enforceable obligation (LEO) are expected to acquire both a PPA and IA prior to the expiration of
the 45-month period defined in HB 589, potentially resulting in approximately an additional 1,000
MW contributing to the Transition. In total, DEP may contribute roughly three-quarters of the
Transition MW with DEC accounting for the remaining quarter.
NC REPS Compliance:
DEP remains committed to meeting the requirements of NC REPS, including the poultry waste,
swine waste, and solar set-asides, and the general requirement, which will be met with additional
renewable and energy efficiency resources. DEP’s long-term general compliance needs are
expected to be met through a combination of renewable resources, including RECs obtained
through the HB 589 competitive procurement process. For details of DEP’s NC REPS
compliance plan, please reference the NC REPS Compliance Plan, included as Attachment I to
this IRP.
Duke Energy Progress North Carolina Integrated Resource Plan
2018 Biennial Report PUBLIC
Page 24
HB-589 Competitive Procurement and Utility-Owned Solar:
DEP continues to evaluate utility-owned solar additions to grow its renewables portfolio. DEP
owns and operates four utility-scale solar projects as part of its efforts to encourage emission
free generation resources and help meet its compliance targets, totaling 141 MW-AC:
• Camp Lejeune Solar Facility – 13MW, located in Onslow County, NC placed in service
in November 2015;
• Warsaw Solar Facility – 65MW, located in Duplin County, NC placed in service in
December 2015;
• Fayetteville Solar Facility – 23MW, located in Bladen County, NC placed in service in
December 2015; and
• Elm City Solar Facility – 40MW, located in Wilson County, NC placed in service in
March 2016.
No more than 30% of the CPRE Program requirement may be satisfied through projects in which
Duke Energy or its affiliates have an ownership interest at the time of bidding. DEP intends to bid
into the first and future tranches of the CPRE and will also evaluate the potential for acquiring
facilities where appropriate. HB 589 does not stipulate a limit for DEP’s option to acquire projects
from third parties that are specifically proposed in the CPRE RFP as acquisition projects, though
any such project will not be procured unless determined to be among the most cost-effective
projects submitted.
Additional Factors Impacting Future Solar Growth:
A number of factors impact the Company’s forecasting of future solar growth. First, potential
changes in the Company’s avoided cost may impact the development of projects under PURPA and
HB 589. Avoided cost forecasts are subject to variability due to changes in factors such as natural
gas and coal commodity prices, system energy and demand requirements, the level and cost of
generation ancillary service requirements and interconnection costs. PURPA requires utilities to
purchase power from QFs at or below the utility’s avoided cost rate. HB 589 requires that
competitive bids are priced below utility’s avoided cost rates, as approved by the NCUC, in order to
be selected. Therefore, the cost of solar is a critical input for forecasting how much solar will
materialize in the future.
Solar costs are also influenced by other variables. Panel prices have decreased at a significant rate
and are expected to continue to decline. However, in January 2018, President Trump announced a
Duke Energy Progress North Carolina Integrated Resource Plan
2018 Biennial Report PUBLIC
Page 25
tariff on solar modules and cells with a rate of 30% in year 1, declining 5% until the fourth and final
year in which the tariff rate is 15%. Additional factors that could put upward pressure on solar costs
include direct interconnection costs, as well as costs incurred to maintain the appropriate operational
control of the facilities. Finally, as panel prices have decreased, there has been more interest in
installing single-axis tracking (SAT) systems and/or systems with higher inverter load ratios (ILR)
which change the hourly profile of solar output and increase expected capacity factors. DEP now
models fixed tilt and SAT system hourly profiles with a range of ILR’s as high as 1.6 (DC/AC
ratio).
In summary, there is a great deal of uncertainty in both the future avoided cost applicable to
solar and the expected price of solar installations in the years to come. As a result, the
Company will continue to closely monitor and report on these changing factors in future IRP
and competitive procurement filings.
HB 589 Customer Programs:
In addition to the CPRE program, HB 589 offers direct renewable energy procurement for major
military installations, public universities, and other large customers, as well as a community solar
program. These programs will complement the existing SC Act 236 Programs.
As part of HB 589, the renewable energy procurement program for large customers such as military
installations and universities enables large customers to procure renewable energy attributes from
new renewable energy resources. The program allows for up to 600 MW of total capacity, with set
asides for military installations (100 MW of the 600 MW) and the University of North Carolina
(UNC) system (250 MW of the 600 MW). The 2018 IRP base case assumes all 600 MW of this
program materialize, with the DEP/DEC split expected to be roughly equal. If all 600 MW are not
utilized, the remainder will roll back to the competitive procurement, increasing its volume.
The community solar portion of HB 589 calls for up to 20 MW of shared solar in DEP. This
program is similar to the SC Act 236 shared solar program, and allows customers who cannot or do
not want to put solar on their property to take advantage of the economic and environmental
benefits of solar by subscribing to the output of a centralized facility. The 2018 IRP Base Cases
assume that all 20 MW of the HB 589 shared solar program materializes.
HB 589 also calls for a rebate program for rooftop solar. The rebate program opened in July and the
program has already proven to spur greater interest in solar installations and therefore, more net
Duke Energy Progress North Carolina Integrated Resource Plan
2018 Biennial Report PUBLIC
Page 26
metered customers in NC. Thru May 2018, DEP has installed nearly the same capacity of rooftop
solar as was installed in all of 2017. Enough customers were processed in the first two weeks of the
rebate program to fill the 2018 allotment for Residential and Commercial customers.
SC Act 236:
Steady progress continues to be made with the first two tiers of the SC DER Program summarized
below, completion of which would unlock the third tier:
• Tier I: 13 MW of solar capacity from facilities each >1 MW and < 10 MW in size.
• Tier II: 13 MW of behind-the-meter solar facilities for residential, commercial and industrial
customers, each ≤1 MW, 25% of which must be ≤ 20 kilowatts (kW). Since Tier II is behind
the meter, the expected solar generation is embedded in the load forecast as a reduction to
expected load.
• Tier III: Investment by the utility in 13 MW of solar capacity from facilities each >1 MW
and <10 MW in size. Upon completion of Tiers I and II (to occur no later than 2021), the
Company may directly invest in additional solar generation to complete Tier III.
DEP has executed two PPAs to complete Tier I which will result in 15 MW, 5 MW of which are
currently operational. Tier II incentives have resulted in growth in private solar in DEP, although it
hasn’t been as significant as DEC to this point.
The Company launched its first Shared Solar program as part of Tier I. Duke Energy designed its
initial SC Shared Solar program to have appeal to residential and commercial customers who rent or
lease their premises, residential customers who reside in multifamily housing units or shaded
housing or for whom the relatively high up-front costs of solar PV make net metering unattainable,
and non-profits who cannot monetize the ITC.
Wind:
DEP considers wind a potential energy resource in the long term to support increased renewables
portfolio diversity and long-term general compliance need. However, investing in wind inside of
DEP’s footprint may be challenging in the short term, primarily due to a lack of suitable sites,
permitting challenges, and more modest capital cost declines relative to other renewable
technologies like solar. Opportunities may exist to transmit wind energy into the Carolinas from out
of state regions where wind is more cost-effective.
Duke Energy Progress North Carolina Integrated Resource Plan
2018 Biennial Report PUBLIC
Page 27

Summary of Expected Renewable Resource Capacity Additions:
The 2018 IRP incorporates the Base Case renewable capacity forecast below. This case includes
renewable capacity components of the Transition MW of HB 589, such as capacity required for
compliance with NC REPS, PURPA purchases, the SC DER Program, and the additional three
components of HB 589 (competitive procurement, renewable energy procurement for large
customers, and community solar). This year’s Base Case also includes additional projected solar
growth beyond HB 589. While certain regions of DEP may become saturated with solar, it is the
Company’s belief that continued declines in the installation cost of solar and storage, will enable
solar and coupled “solar plus storage” systems to contribute to growing energy needs. The
Company also believes supportive policies for solar and solar plus storage will continue to exist in
NC and SC even beyond the HB 589 procurement horizon.
The Company anticipates a diverse portfolio including solar, biomass, hydro, wind, and other
resources. Actual results could vary substantially for the reasons discussed previously, as well as
other potential changes to legislative requirements, tax policies, technology costs, and other market
forces. The details of the forecasted capacity additions, including both nameplate and contribution
to winter and summer peaks are summarized in Table 5-A below.
While solar is not at its maximum output at the time of DEP’s expected peak load in the summer,
solar’s contribution to summer peak load is large enough that it may push the time of summer peak
to a later hour if solar penetration levels continue to increase. However, solar is unlikely to have a
similar impact on the morning winter peak due to little solar output in the morning hours. Solar
capacity contribution to summer and winter peak demands is discussed more fully in Chapter 9.
Duke Energy Progress North Carolina Integrated Resource Plan
2018 Biennial Report PUBLIC
Page 28

Table 5-A: DEP Base Case Total Renewables
Given the significant volume and uncertainty around solar penetration, high and low solar portfolios
were compared to the Base Case described above. The portfolios do not envision a specific market
condition, but rather the potential combined effect of a number of factors. For example, the high
sensitivity could occur given events such as high carbon prices, lower solar capital costs,
economical solar plus storage, continuation of renewable subsidies, and/or stronger renewable
energy mandates. On the other hand, the low sensitivity may occur given events such as lower fuel
prices for more traditional generation technologies, higher solar installation and interconnection
costs, and/or high ancillary costs which may drive down the economic viability of future
incremental solar additions. These events may cause solar projections to fall short of the Base Case
if the CPRE, renewable energy procurement for large customers, and/or the community solar
programs of HB 589 do not materialize or are delayed. Tables 5-B and 5-C below provide the high
and low solar nameplate capacity summaries, as well as, their corresponding expected contributions
to summer and winter peaks.
Solar
Biomass/
Hydro Total Solar
Biomass/
Hydro Total Solar
Biomass/
Hydro Total
2019 2758 266 3024 965 266 1231 2019 28 266 293
2020 3061 266 3327 1071 266 1337 2020 31 266 296
2021 3341 120 3461 1157 120 1278 2021 33 120 154
2022 3588 115 3703 1231 115 1346 2022 36 115 151
2023 3760 103 3862 1271 103 1374 2023 38 103 140
2024 3938 102 4041 1289 102 1391 2024 39 102 142
2025 4019 73 4092 1297 73 1370 2025 40 73 113
2026 4053 73 4125 1300 73 1373 2026 41 73 113
2027 4086 67 4153 1304 67 1371 2027 41 67 108
2028 4120 14 4134 1307 14 1321 2028 41 14 55
2029 4153 3 4156 1310 3 1313 2029 42 3 44
2030 4187 2 4188 1314 2 1315 2030 42 2 43
2031 4191 2 4192 1314 2 1316 2031 42 2 44
2032 4195 0 4195 1314 0 1314 2032 42 0 42
2033 4199 0 4199 1315 0 1315 2033 42 0 42
* Solar includes 0.5% per year degradation
** Capacity listed excludes REC-Only contracts
MW Nameplate
DEP Base Renewables - Compliance + Non-Compliance
MW Contribution to Winter PeakMW Contribution to Summer Peak
Duke Energy Progress North Carolina Integrated Resource Plan
2018 Biennial Report PUBLIC
Page 29

Table 5-B: DEP High Case Total Renewables
Table 5-C: DEP Low Case Total Renewables
Solar
Biomass/
Hydro Total Solar
Biomass/
Hydro Total Solar
Biomass/
Hydro Total
2019 2774 266 3040 971 266 1237 2019 28 266 294
2020 3114 266 3380 1089 266 1355 2020 31 266 297
2021 3489 120 3610 1202 120 1322 2021 35 120 155
2022 3728 115 3843 1268 115 1383 2022 37 115 152
2023 3900 103 4003 1285 103 1388 2023 39 103 142
2024 4076 102 4178 1303 102 1405 2024 41 102 143
2025 4205 73 4278 1316 73 1389 2025 42 73 115
2026 4259 73 4332 1321 73 1394 2026 43 73 115
2027 4313 67 4380 1326 67 1393 2027 43 67 110
2028 4366 14 4380 1332 14 1345 2028 44 14 57
2029 4419 3 4422 1337 3 1340 2029 44 3 47
2030 4472 2 4474 1342 2 1344 2030 45 2 46
2031 4485 2 4487 1344 2 1345 2031 45 2 46
2032 4498 0 4498 1345 0 1345 2032 45 0 45
2033 4510 0 4510 1346 0 1346 2033 45 0 45
* Solar includes 0.5% per year degradation
** Capacity listed excludes REC-Only contracts
MW Nameplate
DEP High Renewables - Compliance + Non-Compliance
MW Contribution to Summer Peak MW Contribution to Winter Peak
Solar
Biomass/
Hydro Total Solar
Biomass/
Hydro Total Solar
Biomass/
Hydro Total
2019 2647 266 2913 926 266 1192 2019 26 266 292
2020 2976 266 3242 1042 266 1307 2020 30 266 296
2021 3255 120 3375 1131 120 1252 2021 33 120 153
2022 3397 115 3512 1174 115 1289 2022 34 115 149
2023 3463 103 3566 1194 103 1297 2023 35 103 137
2024 3516 102 3618 1210 102 1312 2024 35 102 138
2025 3536 73 3609 1216 73 1289 2025 35 73 109
2026 3572 73 3645 1227 73 1299 2026 36 73 108
2027 3608 67 3675 1238 67 1304 2027 36 67 103
2028 3644 14 3658 1248 14 1262 2028 36 14 50
2029 3680 3 3683 1259 3 1262 2029 37 3 39
2030 3716 2 3717 1267 2 1268 2030 37 2 39
2031 3712 2 3714 1266 2 1268 2031 37 2 39
2032 3709 0 3709 1266 0 1266 2032 37 0 37
2033 3705 0 3705 1266 0 1266 2033 37 0 37
* Solar includes 0.5% per year degradation
** Capacity listed excludes REC-Only contracts
DEP Low Renewables - Compliance + Non-Compliance
MW Nameplate MW Contribution to Summer Peak MW Contribution to Winter Peak
Duke Energy Progress North Carolina Integrated Resource Plan
2018 Biennial Report PUBLIC
Page 30

6. INTEGRATED SYSTEMS AND OPERATIONS PLANNING (ISOP) AND
BATTERY STORAGE
The Industry is Rapidly Changing:
In recent years, the electric utility industry has undergone extraordinary transformation that has
directly resulted in an increasingly dynamic environment for which the Company must plan and
operate. This transformation is driven by several key trends including rapidly changing
technologies, evolving customer expectations and the progression towards a smarter grid. New
technologies are being developed at an exponential rate, creating a multitude of new possibilities of
assets to serve customers. Many Duke Energy customers have come to realize the benefits that
technology can provide and are no longer inactive recipients of a simple commodity at the least
possible cost. These customers are now expecting more choices and services to control their energy
use and desire active interaction with their energy choices. Duke Energy Progress is committed to
serving its customers in new and improved ways that recognize the increasing differences between
its customers. To do so will make planning more complex. For example, the Company will need
much better data on how our customers want to be served, and that data will not be easy to obtain.
Providing safe, reliable, cleaner and affordable power, however, will always be at the heart of Duke
Energy’s foundation. Furthermore, the commitment to provide transparency to both customers and
other stakeholders is of utmost importance, due to the belief that taking advantage of the collective
knowledge of the parties will ultimately benefit all customers.
Implications for the IRP:
The Company, as well as others in the electric utility industry, are recognizing that the traditional
methods of utility resource planning must be enhanced to keep pace with changes occurring in
the industry. As a result, beginning this year, Duke Energy Progress will begin to adapt its IRP to
adjust to this changed world, recognizing that this process will continue to evolve. The planning
tools that have been used in the past are limited in their ability to value some aspects of the
newer technologies. Historically, the Company has not been able to identify the locational value
of distributed generation sources and are now developing models to do so, as well as more
tightly link our distribution plans to the bulk power (generation and transmission) plans. DEP
also recognizes the sub-hourly operational impacts of intermittency of some supply resources
and is developing modeling capabilities needed to quantify these operational impacts. As the
single entity responsible for the reliable operations of the system, DEP is required to address
what it will take to operate its system under a wider variety of futures, which will directly result
Duke Energy Progress North Carolina Integrated Resource Plan
2018 Biennial Report PUBLIC
Page 31

in the consideration of more scenarios. Also, with the accelerated pace of change, the Company
must place a higher value on the flexibility of the resource plan to adapt to changing
circumstances.
Changes reflected in this year’s IRP:
Based on recent developments, the amount of renewables on the DEP system has increased to
reflect HB 589 requirements and the expected renewable adoption is now forecasted to exceed
the legislatively mandated limits. As a result, the need for real-time system regulation and
balancing increases over time as more intermittent renewables are integrated into the system.
While the models are not yet perfected, DEP can now make reasonable estimates for these real-
time system impacts and those estimates have been included in the long-term planning models
for the first time. DEP has also assumed the deployment of more grid-connected battery storage
within the next few years which if deployed appropriately have the potential to provide benefits
to the transmission and distribution system as well as the bulk power system.
Changes to be Included in Future IRPs:
Duke Energy is further addressing these shifting trends through our Integrated System and
Operations Planning (ISOP) effort. ISOP envisions the creation of a broader process by which all
energy resources are evaluated fully and fairly valued on functional capability, irrespective of the
resource location on the grid. ISOP strives to identify the appropriate tools and examine the
performance of different asset portfolios across a variety of potential futures. ISOP has completed
evaluations of the current planning practices and has identified future enhancements to be addressed
in a systematic, disciplined manner to realize this future vision.
One key goal of ISOP is for the planning models to reasonably mimic the future operational realities
to allow DEP to serve its customers with newer technologies. The introduction of balancing and
regulating reserve requirements with respect to growing renewable generation in this IRP is an
indication of this effort. Additionally, ISOP has a number of other workstreams addressing the
identified future enhancements to the modeling tools, the need for granularity in location and time,
as well as, the approach for stacking functional benefits across the system. These future
enhancements in planning are expected to be addressed over the next several years, as soon as the
modeling tools, processes and data development will allow.
Duke Energy Progress North Carolina Integrated Resource Plan
2018 Biennial Report PUBLIC
Page 32

Duke Energy recognizes the substantial effort it will take to continue down this integrated planning
path for years to come, and is committed to the development and delivery of these new methods.
There are considerable risks and learning curves with a number of these new workstreams as many
of the modeling tools and functionalities are currently in developmental stages throughout the
industry. Given that some of the most promising emerging resource solutions, such as battery
storage and leading-edge intelligent grid controls, are still in the early stages, Duke Energy is
committed to understanding and capturing these capabilities. There will also be a heightened need to
address data challenges such as the increased levels of granularity associated with automated
systems and data storage requirements. Duke Energy is committed to addressing these and other
potential risks. The Company recognizes that it is proceeding with the first few steps of an
evolutionary journey. DEP looks forward to public feedback as the IRP process evolves, and is
committed to openly considering all viewpoints and new data that will improve the ability to plan
for and meet the needs of its customers
Battery Storage:
As introduced in the ISOP discussion, the Company is assessing the integration of battery storage
technology into its portfolio of assets. Battery storage costs are expected to continue to decline
which may make this resource a viable option for grid support services, including frequency
regulation, solar smoothing during periods with high incidences of intermittency, as well as, the
potential to provide overall energy and capacity value. Energy Storage can also provide value to the
transmission and distribution (T&D) system by deferring or eliminating traditional upgrades and
can be used to improve reliability and power quality to locations on the Company’s distribution
system. This approach results in stacked benefits which couples value streams from the
Transmission, Distribution, and Generation systems. This unique evaluation process falls outside of
the Company’s traditional IRP process which focuses primarily on meeting future generation needs
reliably and at the lowest possible cost. This new approach to evaluating technologies that have
generation, transmission and distribution value is being addressed through the ISOP enhancements,
discussed above.
The Company will begin investing in multiple grid-connected storage systems dispersed throughout
its North and South Carolina service territories that will be located on property owned by the
Company or leased from its customers. These deployments will allow for a more complete
evaluation of potential benefits to the distribution, transmission and generation system while also
providing actual operations and maintenance cost impacts of batteries deployed at a significant
scale. This will allow the Company to explore the nature of new offerings desired by customers and
Duke Energy Progress North Carolina Integrated Resource Plan
2018 Biennial Report PUBLIC
Page 33
fill knowledge gaps, such as how the Company can best integrate battery storage into its daily
operations. The Company will work with Generation, Transmission and Distribution departments in
this evaluation process, utilizing the ISOP framework. The goal is to optimize the location to couple
localized T&D system benefits with bulk system benefits, and to minimize cost and maximize
benefits for its customers. The Company believes such investments are consistent with the direction
of state policy in both NC and SC under the NC HB 589 and SC DER Program, respectively.
Additionally, the Company continues to participate in an energy storage study to assess the
economic potential for NC customers, mandated by HB 589. Results of the study are expected in
December 2018.
As stated in DEP’s most recent Western Carolinas Modernization Project (WCMP) Annual
Progress Report (Docket No. E-2, Sub 1089), DEP has identified multiple opportunities to deploy
energy storage in the form of batteries throughout the region, specifically to meet the Commission’s
order to deploy at least 5 MW of energy storage in the DEP-West region and support the avoidance
or deferral of the contingent natural gas-fired Combustion Turbine. For example, DEP is pursuing a
grid-connected microgrid (solar and battery) to serve the Town of Hot Springs, should their radial
feed experience an outage.
Duke Energy Progress North Carolina Integrated Resource Plan
2018 Biennial Report PUBLIC
Page 34
7. SCREENING OF GENERATION ALTERNATIVES
As previously discussed, the Company develops the load forecast and adjusts for the impacts of EE
programs that have been pre-screened for cost-effectiveness. The growth in this adjusted load
forecast and associated reserve requirements, along with existing unit retirements or purchased
power contract expirations, creates a need for future generation. This need is partially met with
DSM resources and the renewable resources required for compliance with NC REPS, HB 589 and
SC Act 236. The remainder of the future generation needs can be met with a variety of potential
supply side technologies.
For purposes of the 2018 IRP, the Company considered a diverse range of technology choices
utilizing a variety of different fuels, including ultra-supercritical pulverized coal (USCPC) units
with carbon capture and sequestration (CCS), integrated gasification combined cycle (IGCC) with
CCS, CTs, CCs with duct firing, Combined Heat and Power (CHP), reciprocating engines, and
nuclear units. In addition, Duke Energy Progress considered renewable technologies such as Wind,
Solar PV, Landfill Gas and storage options such as Pumped Storage Hydro (PSH) and Lithium Ion
Batteries in the screening analysis. Hybrids of the above technologies were also considered (i.e.
solar steam augmentation and solar PV plus battery).
For the 2018 IRP screening analysis, the Company screened technology types within their own
respective general categories of baseload, peaking/intermediate, renewable, and storage, with the
goal of screening to pass the best alternatives from each of these four categories to the integration
process. As in past years, the reason for the initial screening analysis is to determine the most viable
and cost-effective resources for further evaluation on the DEP system. This initial screening
evaluation is necessary to narrow down options to be further evaluated in the quantitative analysis
process as discussed in Appendix A.
The results of these screening processes determine a smaller, more manageable subset of
technologies for detailed analysis in the expansion planning model. The following list details the
technologies that were evaluated in the screening analysis phase of the IRP process. The technical
and economic screening is discussed in detail in Appendix F.
Duke Energy Progress North Carolina Integrated Resource Plan
2018 Biennial Report PUBLIC
Page 35

Dispatchable (Winter Ratings)
• Base load – 782 MW Ultra-Supercritical Pulverized Coal with CCS
• Base load – 557 MW 2x1 IGCC with CCS
• Base load – 2 x 1,117 MW Nuclear Units (AP1000)
• Base load – 667 MW – 1x1x1 Advanced Combined Cycle (No Inlet Chiller and Fired)
• Base load – 1,339 MW – 2x2x1 Advanced Combined Cycle (No Inlet Chiller and Fired)
• Base load – 22 MW – Combined Heat & Power (Combustion Turbine)
• Base load – 9 MW – Combined Heat & Power (Reciprocating Engine)
• Base load – 600 MW – Small Modular Reactor (SMR)
• Peaking/Intermediate – 196 MW 4 x LM6000 Combustion Turbines (CTs)
• Peaking/Intermediate – 202 MW, 12 x Reciprocating Engine Plant
• Peaking/Intermediate – 574 MW 2 x G/H-Class Combustion Turbines (CTs)
• Peaking/Intermediate – 754 MW 2 x J-Class Combustion Turbines (CTs)
• Peaking/Intermediate – 919 MW 4 x 7FA.05 Combustion Turbines (CTs)
• Storage – 5 MW / 5 MWh Li-ion Battery
• Storage – 20 MW / 80 MWh Li-ion Battery
• Storage – 1,400 MW Pumped Storage Hydro (PSH)
• Renewable – 75 MW Wood Bubbling Fluidized Bed (BFB, biomass)
• Renewable – 5 MW Landfill Gas
Non-Dispatchable (Nameplate)
• Renewable – 150 MW Wind - On-Shore
• Renewable – 50 MW Solar PV, Fixed-tilt (FT)
• Renewable – 50 MW Solar PV, Single Axis Tracking (SAT)
Duke Energy Progress North Carolina Integrated Resource Plan
2018 Biennial Report PUBLIC
Page 36

8. RESOURCE ADEQUACY
Background:
Resource adequacy refers to the ability of the electric system to supply the aggregate electrical
demand and energy requirements of the end-use customers at all times, taking into account
scheduled and reasonably expected unscheduled outages of system elements. Utilities require a
margin of reserve generating capacity in order to provide reliable service. Periodic scheduled
outages are required to perform maintenance, inspections of generating plant equipment, and to
refuel nuclear plants. Unanticipated mechanical failures may occur at any given time, which may
require shutdown of equipment to repair failed components. Adequate reserve capacity must be
available to accommodate these unplanned outages and to compensate for higher than projected
peak demand due to forecast uncertainty and weather extremes. The Company utilizes a reserve
margin target in its IRP process to ensure resource adequacy. Reserve margin is defined as total
resources minus peak demand, divided by peak demand. The reserve margin target is established
based on probabilistic assessments as described below.
2016 Resource Adequacy Study:
The Company retained Astrapé Consulting in 2016 to conduct an updated resource adequacy
study.4 The updated study was warranted to account for the extreme weather experienced in the
service territory in recent winter periods, and the significant amount of solar capacity that has been
added to the system and in the interconnection queue. Solar resources provide meaningful capacity
benefits in the summer since peak demand typically occurs in afternoon hours when the sun is
shining and solar resources are available. However, solar resources contribute very little capacity
value to help meet winter peak demands that typically occur in early morning hours.
Methodology:
The 2016 resource adequacy study incorporated the uncertainty of weather, economic load growth,
unit availability, and the availability of transmission and generation capacity for emergency
assistance. Astrapé analyzed the optimal planning reserve margin based on providing an acceptable
4 Astrapé Consulting is an energy consulting firm with expertise in resource adequacy and integrated resource
planning. Astrapé also conducted resource adequacy studies for DEC and DEP in 2012.
Duke Energy Progress North Carolina Integrated Resource Plan
2018 Biennial Report PUBLIC
Page 37
level of physical reliability and minimizing economic costs to customers. The most common
physical reliability metric used in the industry is to target a system reserve margin that satisfies the
one day in 10 years Loss of Load Expectation (LOLE) standard. This standard is interpreted as one
firm load shed event every 10 years due to a shortage of generating capacity. From an economic
perspective, as planning reserve margin increases, the total cost of reserves increases while the costs
related to reliability events decline. Similarly, as planning reserve margin decreases, the cost of
reserves decreases while the costs related to reliability events increase, including the costs to
customers for loss of power. Thus, there is an economic optimum point where the cost of additional
reserves plus the cost of reliability events to customers is minimized.
Winter Capacity Planning:
In the past, loss of load risk was typically concentrated during the summer months and a summer
reserve margin target provided adequate reserves in both the summer and winter periods. However,
the incorporation of recent winter load data and the significant amount of solar penetration included
in the 2016 study, shows that the majority of loss of load risk is now heavily concentrated during the
winter period. The shift in seasonal LOLE is the result of greater winter load volatility, as well as
the high penetration of solar resources and the associated capacity contribution to summer reserves
compared to winter reserves. The seasonal shift of LOLE to the winter period also increases as
greater amounts of solar capacity are added to the system. Thus, increasing solar penetrations shift
the planning process to a winter focus. Winter load and resources now drive the timing need for
new capacity additions and a winter planning reserve margin target is now needed to ensure that
adequate resources are available throughout the year to meet customer demand.
Results:
Based on results of the 2016 resource adequacy assessment, the Company adopted a 17% minimum
winter reserve margin target for scheduling new resource additions and incorporated this planning
criterion beginning with the 2016 IRP.
Adequacy of Projected Reserves:
DEP’s resource plan reflects winter reserve margins ranging from approximately 17% to 25%.
Reserves projected in DEP’s IRP meet the minimum planning reserve margin target and thus
satisfy the one day in 10 years LOLE criterion. Projected reserve margins often exceed the
minimum 17% winter target by 3% or more in years immediately following new resource
additions. Reserve margins are projected to exceed the minimum 17% winter target by 3% or more
Duke Energy Progress North Carolina Integrated Resource Plan
2018 Biennial Report PUBLIC
Page 38

in 2025 and 2027 due to the combined cycle capacity additions in those years. The projected
reserve margin also exceeds the minimum target by about 3% in 2029 due to the addition of a block
of CT capacity.
The IRP provides general guidance in the type and timing of resource additions. As previously
noted, projected reserve margins will often be somewhat higher than the minimum target in years
immediately following new generation additions since capacity is generally added in large blocks to
take advantage of economies of scale. Large resource additions are deemed economic only if
they have a lower Present Value Revenue Requirement (PVRR) over the life of the asset as
compared to smaller resources that better fit the short-term reserve margin need. Reserves
projected in the Company’s IRP are appropriate for providing an economic and reliable power
supply.
NC Regulatory Procedural History:
The NCUC’s June 27, 2017 Order Accepting Integrated Resource Plans and Accepting REPS
Compliance Plans in Docket No. E-100, Sub 147 concluded that the reserve margins included in the
DEP and DEC IRPs are reasonable for planning purposes. However, the Commission also directed
DEP and DEC to work with the Public Staff to address outstanding concerns raised by the Public
Staff and SACE consultant Wilson. The Commission further directed the Companies and the
Public Staff to file a Joint Report summarizing their review and conclusions within 150 days of the
filing of Duke’s 2017 IRP updates.
Per the Commission’s Sub 147 order, the Companies worked with the Public Staff in efforts to
resolve outstanding concerns related to the 2016 Resource Adequacy studies and filed the Joint
Report on April 2, 2018. As noted in the report, the discussions between the Public Staff and the
Companies were helpful; however, the parties did not reach consensus on all of the issues. In
particular, the parties did not reach agreement regarding the methodology used to incorporate
economic load forecast uncertainty. Ultimately, the Public Staff recommended that DEP and
DEC utilize a 16% reserve margin in their 2018 IRPs and until such time that a new resource
adequacy study is conducted. Duke recommended a minimum 17% winter reserve margin for
planning purposes until such time that a new resource adequacy study is conducted. The Public
Staff and Duke jointly recommended that a new resource adequacy study be conducted no later
than the 2020 biennial IRP filings to reflect updated inputs and planning assumptions.
The NCUC’s April 16, 2018 Order Accepting Filing of 2017 Update Reports and Accepting 2017
REPS Compliance Plans in Docket No. E-100, Sub 147, accepted the parties’ Joint Report and
Duke Energy Progress North Carolina Integrated Resource Plan
2018 Biennial Report PUBLIC
Page 39

concluded that DEP and DEC may continue to utilize the minimum 17% winter reserve margin for
planning purposes in their 2018 IRPs. In addition, the Commission ordered DEP and DEC to
further address the economic load forecast uncertainty issue in their 2018 IRPs. The Commission
also required the Companies to present a sensitivity analysis in their 2018 IRPs that illustrates the
impact of a 16% winter reserve margin, including the specific risk impact (LOLE) of using a 16%
minimum reserve margin versus a 17% minimum reserve margin. Further discussion of the
economic load forecast uncertainty and results of the 16% reserve margin sensitivity are presented
below.
Economic Load Forecast Uncertainty:
As described in the Joint Report, the Public Staff and Duke do not dispute the appropriateness of
modeling to include the economic load forecast uncertainty. However, the parties disagree on the
methodology and assumptions used to incorporate the uncertainty. As directed by the NCUC, Duke
and Astrapé further reviewed the economic load forecast uncertainty issue and the assumptions
previously provided by the Public Staff.
Table 8-A below shows the reserve margins that achieve 0.1 days/year LOLE using the Company's
load forecast error (LFE) assumptions and the Public Staff's LFE assumptions. The Company has
added a third column which completely removed the impact of the load forecast uncertainty. As
shown in the table, assuming the Company has perfect knowledge of its 50/50 weather normal
forecast, completely removing the LFE results in a 15.8% reserve margin. The Public Staff’s
recommended 16.08% reserve margin, which includes the Public Staff’s assumptions for load
uncertainty, is only 0.28% greater than the reserve margin needed with perfect forecasting
knowledge. Thus, the Public Staff’s LFE assumptions produce a reserve margin that only allows a
0.28% increase in the reserve margin to account for load uncertainty. The Company believes there
is meaningful load growth uncertainty over a two to four-year period and that reserves of greater
than 0.28% of load are required to manage that risk.
Duke Energy Progress North Carolina Integrated Resource Plan
2018 Biennial Report PUBLIC
Page 40

Table 8-A: Reserve Margin Needed to Satisfy 0.1 Days/Year LOLE
Original NC Public
Staff Scenario Assumes No LFE
Base Case 2-year LFE + Remove
cold weather outages
DEC 16.7% 15.85% (PS-S2) 15.5
DEP 17.5% 16.30% (PS-S2) 16.1
Average 17.1% 16.08% (PS-S2) 15.8
Further, to reiterate concerns noted in the Joint Report, the Company is not comfortable with the
over forecast bias that is assumed in the Public Staff's LFE assumptions. As shown in Table 8-B
below, the Public Staff shows that load will only be under forecast 17.3% of the time compared to
an over forecast probability of 48.4%. The Company’s projected annual growth rates for peak
demand and energy have averaged about 1.6% based on historical forecasts. However, these
forecasts have been trending downward and the Company’s 2018 IRP projects an average annual
growth rate of less than 1.0% for summer and winter peak demands, and 0.5% for energy. With
lower projected load growth, the likelihood of under-forecasting load growth is greater. The
Company has taken this historical load growth into account in its projections to align with its
objectives of producing a 50/50 load forecast. That is, 50% of the time load growth is expected to
be higher than projected and 50% of the time it is expected to be lower than projected.
Table 8-B: Public Staff Load Forecast Error Assumptions
Load Forecast Error Levels
-6% -3% 0% 3% 6%
Load Forecast Error Probabilities
2 years 15.4% 33.0% 34.2% 14.6% 2.7%
Finally, as stated in the 150 Day Joint Report, the Company believes there are other assumptions in
the study that could be aggressive (meaning reserve margins are too low) that will need to be
revisited in the future. These include unit outage rate modeling and market assistance assumptions
among others that would be revisited in the next study. The Company believes it is prudent to
maintain a minimum 17% winter reserve margin to provide adequate reliability and satisfy the
target of less than 1 firm load shed event every 10 years.
Duke Energy Progress North Carolina Integrated Resource Plan
2018 Biennial Report PUBLIC
Page 41

16% Winter Reserve Margin Sensitivity:
Compliant with the NCUC’s April 16, 2018 Sub 147 order, Table 8-C below shows a
comparison of DEP’s base case resource additions using a 17% winter reserve margin compared
to a scenario using a 16% winter reserve margin. As illustrated in the table, use of a 16% reserve
margin would result in lesser short-term purchase quantities, as well as deferral of some of the
undesignated future resources. For example, a portion of the CT block in 2029 for the 17%
reserve margin base case could be deferred two years to 2031. Also, the 460 MW CT block in
2032 of the base case could be deferred two years to 2034 (one year beyond the planning period).
The reserve margins resulting from these changes are depicted in the table.
The 2016 resource adequacy study recommendation used a consensus of the DEP and DEC study
results to establish a minimum 17% winter reserve margin target for the two companies. This
minimum reserve margin target is needed to maintain an LOLE of one day in ten years (0.1
days/year). Based on results from the 2016 study, allowing the DEP reserve margin to decline to
16% for a given year would increase the loss of load expectation to approximately 0.13 days/year
for DEP, which equates to one expected firm load shed event approximately every 7.7 years.
Duke Energy Progress North Carolina Integrated Resource Plan
2018 Biennial Report PUBLIC
Page 42

Table 8-C: 16% Reserve Margin Sensitivity
Page 43
Duke Energy Progress North Carolina Integrated Resource Plan
2018 Biennial Report PUBLIC
Page 43

9. CAPACITY VALUE OF SOLAR / EFFECTIVE LOAD CARRYING CAPABILITY
Solar Capacity Value Study Summary:
As DEP and DEC continue to add solar to their systems, understanding the reliability contribution
of solar resources is critical for generation planning and projecting capacity needs as part of the
Integration Resource Plan. Conventional thermal resources are typically counted as 100% of net
capability in reserve margin calculations for future generation planning since these resources are
fully dispatchable resources when not on forced outage or planned maintenance. Due to the diurnal
pattern and intermittent nature of solar resources, it is not reasonable to assume that these resources
provide the same capacity value as a fully dispatchable resource. Peak loads for DEP and DEC in
the winter occur in the early morning and late evening when the solar output is low, while peak
loads in the summer occur across the afternoon and early evening which is more coincident with
solar output. Solar output shapes and the timing of peak demand periods must be considered to
determine the capacity value or reliability contribution of a solar resource compared to a fully
dispatchable resource such as a combustion turbine.
Astrapé performed this solar capacity value study for the Companies using the Strategic Energy
Risk Valuation Model (SERVM) which was the same model utilized for the 2016 Resource
Adequacy Studies. Extensive work went into the development of fixed-tilt and single-axis-tracking
solar profiles across a 13-location grid in North Carolina and South Carolina.
Astrapé calculated the incremental capacity value of solar across five solar penetration levels for
each company. The table below shows the different penetration levels of renewable solar generation
for both DEP and DEC. These levels are consistent with the Companies’ estimates of penetration at
the time of this analysis. Consistent with NC House Bill 589, solar additions were divided up into
the categories of Existing Plus Transition and then an additional four tranches of solar that are
expected over the next few years. However, note that the tranches discussed in this study reflect the
Companies’ total expected solar procurement which includes all utility scale requirements under NC
HB 589 (CPRE, large customer programs and community solar). While the exact timing and
amounts of transition and incremental solar additions may change over time, it is reasonable to
assume the levels provided in the table below given the current procurement targets of the
Companies.
Duke Energy Progress North Carolina Integrated Resource Plan
2018 Biennial Report PUBLIC
Page 44
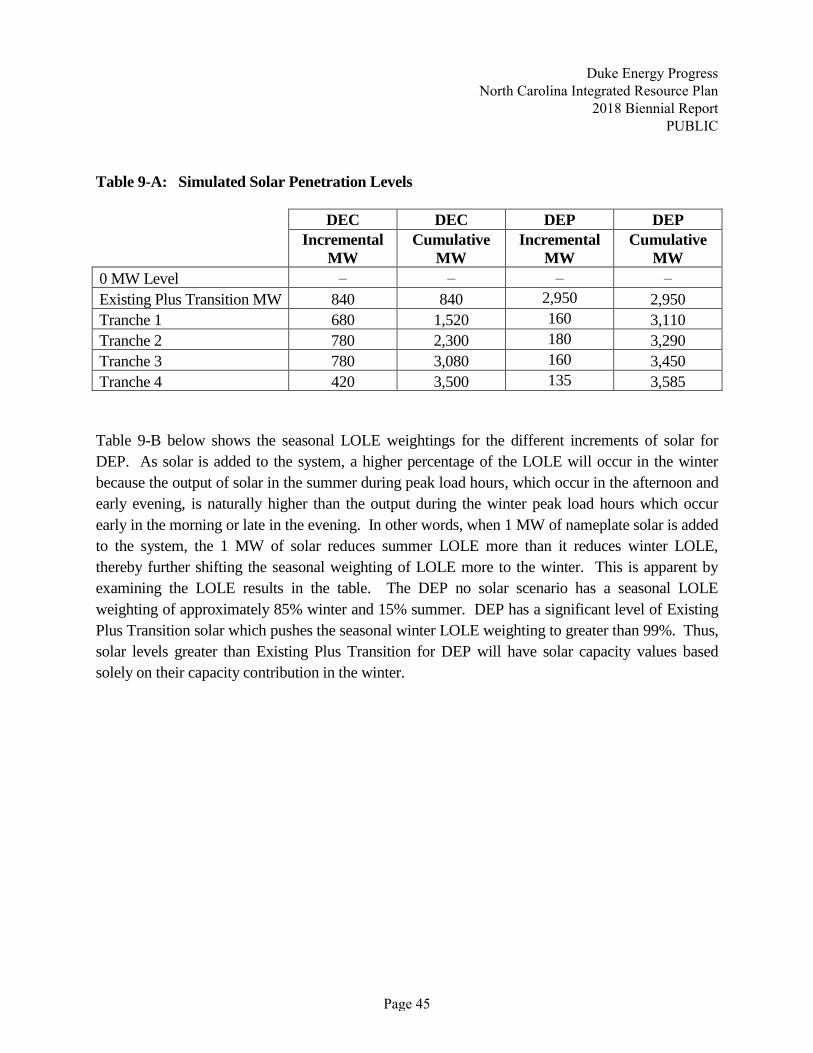
Table 9-A: Simulated Solar Penetration Levels
DEC DEC DEP DEP
Incremental
MW
Cumulative
MW
Incremental
MW
Cumulative
MW
0 MW Level – – – –
Existing Plus Transition MW 840 840 2,950 2,950
Tranche 1 680 1,520 160 3,110
Tranche 2 780 2,300 180 3,290
Tranche 3 780 3,080 160 3,450
Tranche 4 420 3,500 135 3,585
Table 9-B below shows the seasonal LOLE weightings for the different increments of solar for
DEP. As solar is added to the system, a higher percentage of the LOLE will occur in the winter
because the output of solar in the summer during peak load hours, which occur in the afternoon and
early evening, is naturally higher than the output during the winter peak load hours which occur
early in the morning or late in the evening. In other words, when 1 MW of nameplate solar is added
to the system, the 1 MW of solar reduces summer LOLE more than it reduces winter LOLE,
thereby further shifting the seasonal weighting of LOLE more to the winter. This is apparent by
examining the LOLE results in the table. The DEP no solar scenario has a seasonal LOLE
weighting of approximately 85% winter and 15% summer. DEP has a significant level of Existing
Plus Transition solar which pushes the seasonal winter LOLE weighting to greater than 99%. Thus,
solar levels greater than Existing Plus Transition for DEP will have solar capacity values based
solely on their capacity contribution in the winter.
Duke Energy Progress North Carolina Integrated Resource Plan
2018 Biennial Report PUBLIC
Page 45

Table 9-B: DEP Seasonal LOLE Percentage
DEP
Incrementa
l Solar
MW
DEP
Cumulative
Solar
MW
DEP
LOLE
Summer %
DEP LOLE
Winter
%
0 MW Level - - 14.7% 85.3%
Existing Plus
Transition MW 2,950 2,950 0.6% 99.4%
Tranche 1 160 3,110 0.5% 99.5%
Tranche 2 180 3,290 0.4% 99.6%
Tranche 3 160 3,450 0.3% 99.7%
Tranche 4 135 3,585 0.3% 99.7%
Table 9-C shows the solar capacity value results for DEP. The table illustrates the declining
capacity value of solar as greater amounts of solar resources are added to the system. The first MW
of solar in DEP provides only a 7% annual capacity value because of the high winter season LOLE
weighting.5 The Existing Plus Transition solar has an annual capacity value of less than 1%. The
table also shows slightly greater capacity values for tracking versus fixed solar arrays.
5 Capacity values represent the incremental capacity value of the next MW given the referenced solar penetration.
The average capacity contribution for an entire block of solar resources can be estimated by averaging the
incremental value for the first MW of the block and the incremental value for the first MW of the next block.
Duke Energy Progress North Carolina Integrated Resource Plan
2018 Biennial Report PUBLIC
Page 46

Table 9-C: DEP Capacity Value Results by Solar Penetration
Solar Capacity
at Each
Penetration
Level
(Incremental
MW)
Solar Capacity
at Each
Penetration
Level
(Cumulative
MW)
Penetration Level Winter Summer Annual
0 0 DEP - 0 Solar 1.2% 35.4% 7.2%
2,950 2,950
DEP - 2950 Existing +
Transition 0.6% 12.4% 0.6%
160 3,110 DEP - Tranche 1 – Fixed 0.3% 12.2% 0.3%
180 3,290 DEP - Tranche 2 – Fixed 0.3% 11.6% 0.3%
160 3,450 DEP - Tranche 3 – Fixed 0.2% 8.8% 0.3%
135 3,585 DEP - Tranche 4 – Fixed 0.2% 8.2% 0.3%
160 3,110 DEP - Tranche 1–Tracking 3.2% 22.3% 3.2%
180 3,290 DEP - Tranche 2–Tracking 3.1% 20.6% 3.1%
160 3,450 DEP - Tranche 3–Tracking 2.8% 16.2% 2.9%
135 3,585 DEP – Tranche 4–Tracking 2.7% 15.3% 2.8%
In summary, the winter LOLE to summer LOLE ratio drives the annual solar equivalent capacity
values. Because the company has higher winter LOLE values in hours when solar is not available,
the resulting equivalent annual solar capacity values are significantly reduced. As solar penetration
increases, the capacity values decrease further since the firm load shed events are shifted even
further into hours when there is less solar output. However, single-axis-tracking resources do bring
some additional capacity value compared to fixed-tilt resources due to more output in morning and
evening hours.
Duke Energy Progress North Carolina Integrated Resource Plan
2018 Biennial Report PUBLIC
Page 47

10. NUCLEAR AND SUBSEQUENT LICENSE RENEWAL (SLR)
Nuclear Assumptions in the 2018 IRP:
With respect to nuclear generation overall, the Company will continue to monitor and analyze
key developments on factors impacting the potential need for, and viability of, future new
baseload nuclear generation. Such factors include further developments on the Vogtle project
and other new reactor projects worldwide, progress on existing unit relicensing efforts, nuclear
technology developments, and changes in fuel prices and carbon policy.
Subsequent License Renewal (SLR) for Nuclear Power Plants:
DEP and DEC, collectively, provide approximately one half of all energy served in their NC and
SC service territories from clean carbon-free nuclear generation. This highly reliable source of
generation provides power around the clock every day of the year. While nuclear unit outages
are needed for maintenance and refueling, outages are generally relatively short in duration and
are spread across the nuclear fleet in months of lower power demand. In total, the fleet has a
capacity factor, or utilization rate, of well over 90% with some units achieving 100% annual
availability depending on refueling schedules. Nuclear generation is foundational to Duke’s
commitment to providing affordable, reliable electricity while also reducing the carbon footprint
of its resource mix. Currently, all units within the fleet have operating licenses from the Nuclear
Regulatory Commission (NRC) that allow the units to run 60 years from their original
license date.
License Renewal is governed by Title 10 of the Code of Federal Regulations (10 CFR) Part 54,
Requirements for Renewal of Operating Licenses for Nuclear Power Plants. Currently NRC has
approved applications to extend licenses to up to 60 years for 89 nuclear units across the country,
with applications for four nuclear units currently under review.
SLR would cover a second license renewal period, for a total of as much as 80 years. The NRC
has issued regulatory guidance documents, NUREG-2191 [Generic Aging Lessons Learned for
Subsequent License Renewal (GALL-SLR) Report] and NUREG-2192 [Standard Review Plan
for the Review of Subsequent License Renewal (SRP-SLR) Applications for Nuclear Power
Plants], establishing formal regulatory guidance for SLR.
NextEra submitted the industry’s first SLR application to the NRC on January 31, 2018 for its
Turkey Point station. The SLR application was accepted by NRC as sufficient for review
Duke Energy Progress North Carolina Integrated Resource Plan
2018 Biennial Report PUBLIC
Page 48

allowing the NRC to begin their comprehensive review of the application. The NRC review is
expected to take 18 months not including the time needed to perform the sufficiency review.
On July 10, 2018, Exelon Corporation submitted an SLR application for its Peach Bottom plant.
The NRC is currently performing the sufficiency review of the Peach Bottom SLR application
with a decision expected 3Q2018. Dominion Energy announced it would pursue SLR for its
Surry and North Anna plants targeting an SLR application submittal to the NRC in early-2019
for Surry and 2020 for North Anna.
Based on recent industry progress in SLR including published NRC guidance, the NextEra and
Exelon Corporation application submittals, and announcements from Dominion Energy, the
Company’s Base Cases assume SLR for existing nuclear generation to 80 years for planning
purposes in this year’s IRP. The Company will continue to monitor industry and NRC
developments related to SLR.
The Company views all its existing nuclear fleet as excellent candidates for SLR based on current
conditions and expected operating expenditures, regardless of future carbon constraints. Duke
Energy intends to pursue SLR for all its nuclear plants that show benefit for the customer. Work
continues on development of the Oconee Nuclear Station SLR.
Duke Energy Progress North Carolina Integrated Resource Plan
2018 Biennial Report PUBLIC
Page 49

11. COMBINED HEAT AND POWER
Combined Heat and Power (CHP) systems, also known as cogeneration, generate electricity and
useful thermal energy in a single, integrated system. CHP is not a new technology, but an approach
to applying existing technologies. Heat that is normally wasted in conventional power generation is
recovered as useful energy, which avoids the losses that would otherwise be incurred from separate
generation of heat and power. CHP incorporating a gas-fired combustion turbine (CT) and heat
recovery steam generator (HRSG) is more efficient than the conventional method of producing
power and usable heat separately with a CT/generator and a stand-alone steam boiler.
Duke Energy is exploring and working with potential customers with continuous large thermal
loads on a regulated CHP offer. The CHP asset is included as part of Duke Energy’s IRP as a
placeholder for future projects as described below. The steam sales revenue would be credited back
to the revenue requirement of the projects to reduce the total cost of this resource. Along with the
potential to be a cost-competitive generation resource, CHP would result in CO2 emission
reductions, and is an economic development opportunity for the state. In DEP, discussions with a
potential steam host are currently underway.
Projections for CHP have been included in the following quantities in this IRP:
2021: 22 MW (winter)
As CHP development continues, future IRPs will incorporate additional CHP, as appropriate.
Additional technologies evaluated as part of this IRP are discussed in Chapter 7 and Appendix F.
Duke Energy Progress North Carolina Integrated Resource Plan
2018 Biennial Report PUBLIC
Page 50

12. WESTERN CAROLINAS MODERNIZATION PLAN (WCMP)
Through community collaboration in DEP-West, specifically Buncombe County, the contingent
CT has been pushed out beyond the horizon of this 15-year planning analysis.
2018 has been a pivotal year for the work of the Energy Innovation Task Force. Since the
beginning of the year, the group’s 18-months of planning and analysis is being put into action.
The Energy Innovation Task Force is a diverse group of community leaders who have launched a
movement to: transition DEP-West to a smarter, cleaner and affordable energy future AND avoid
or delay the construction of the planned contingent CT.
The co-conveners (City of Asheville, Buncombe County and Duke Energy Progress) engaged
Rocky Mountain Institute as a key partner early in the process to provide analytical support.
Because of their participation and expertise, the Company now knows more about how
customers in DEP-West use electricity than ever before. Their work also narrowed the focus on
areas for the group to focus – primarily heating system efficiency.
The research of Rocky Mountain Institute identified the current lack of automated-metering
infrastructure (AMI) in the region as a barrier to the effort’s overall success. AMI deployment is
now underway in DEP-West.
A critical milestone for the Energy Innovation Task Force was the launch of the Blue Horizons
Project. This brand was created through community conversations facilitated by the Knoxville-
based Sustainability marketing firm – The Shelton Group.
The Blue Horizons Project is the brand associated with the community movement around energy
efficiency, demand-side management, renewables and low-income weatherization locally. The
primary gateway for customers to interact with Blue Horizons Project is a user-friendly website
that directs customers to Duke Energy programs, local governmental initiatives and/or non-profit
energy efficiency and weatherization opportunities. 6
Through tabling at local events to neighborhood-level outreach and education, the Blue Horizons
Project is engaging customers and driving more energy-efficient behaviors. The movement is
being managed by the Greenbuilt Alliance, a local non-profit organization that specializes in the
Greenbuilt environment, funded and supported by Duke Energy Progress, City of Asheville and
6 https://www.bluehorizonsproject.com
Duke Energy Progress North Carolina Integrated Resource Plan
2018 Biennial Report PUBLIC
Page 51

Buncombe County. This full-time position was created to implement and advance the goals and
efforts initiated by the Rocky Mountain Institute.
Although the movement was only launched in March 2018, they have had a presence at more
than 25 public events and are seeing strong engagement from communities in the Asheville area.
This work, along with canvassing by Duke Energy, is supporting continued success in the DSM
program, EnergyWiseSM. In 2016, when the Energy Innovation Task Force was formed, 7,183
DEP-West customers were enrolled in the program. As of August 13, 2018, 11,329 customers
are enrolled in winter EnergyWiseSM programs. Customer participation in this goal specifically
addresses reductions in peak demand.
On the public engagement front, the Blue Horizons Project is soaring high and even stronger
success is expected as outreach and marketing efforts continue.
Additionally, work to make deliberate investments in advanced and evolving technologies
continues to be a strong focus of the group. The Technology Working Group, a subcommittee of
the Energy Innovation Task Force, has been meeting monthly for nearly two years to look for
cost-effective options for deployment of solar, battery storage, AMI, cold-climate heat pumps
and other technologies. Their work has resulted in efforts to:
• Create DEP-West’s first ever microgrid (solar and battery) on Mt. Sterling in the Great
Smoky Mountains National Park.
• Commit to a grid connected microgrid (solar and battery) to serve the Town of Hot
Springs, should their radial feed go out.
• Commit to at least 19 MW of battery storage in the region.
o Duke Energy has determined that the potential for approximately 50 MW of
energy storage in the region is feasible. The Technology Working Group has
challenged Duke Energy Progress to push for 100 MW of energy storage.
• Develop a pilot for cold-climate heat pump. This technology would operate more
efficiently in the DEP-West region than other heat pump technologies.
• Advance the work to site, design and build a large solar farm at the retired Buncombe
County Landfill.
Duke Energy Progress North Carolina Integrated Resource Plan
2018 Biennial Report PUBLIC
Page 52

Although the focus of the Blue Horizons Project is to increase participation in existing and
approved residential and commercial EE/DSM programs, there is also a focus on using this
organized partnership to pilot new products and services. Specifically, a low-income energy
efficiency pay-for-performance weatherization program.
Both the City of Asheville and Buncombe County have made sizable investments to advance the
work of the Blue Horizons Project for building audits, staff support and other direct investments
in low-income weatherization.
This community-centered approach to increasing participation in EE/DSM and making
deliberate and strategic investments in technology is helping create a collaborative environment
for infrastructure investments too. Working together with the local community has helped DEP-
West make infrastructure investments to its local transmission system to increase capacity by
rebuilding existing facilities and/or siting new substations to serve customers.
Although collaboration with the DEP-West community has yielded strong results, efforts to
transition the region to a smarter, cleaner and affordable energy future for customers continues.
Duke Energy Progress North Carolina Integrated Resource Plan
2018 Biennial Report PUBLIC
Page 53

13. EVALUATION AND DEVELOPMENT OF THE RESOURCE PLAN
As described in Chapter 8, DEP continues to plan to winter planning reserve margin criteria in the
IRP process. To meet the future needs of DEP’s customers, it is necessary for the Company to
adequately understand the load and resource balance. For each year of the planning horizon, DEP
develops a load forecast of cumulative energy sales and hourly peak demand. To determine total
resources needed, the Company considers the peak demand load obligation plus a 17% minimum
planning winter reserve margin. The projected capability of existing resources, including generating
units, EE and DSM, renewable resources and purchased power contracts is measured against the
total resource need. Any deficit in future years will be met by a mix of additional resources that
reliably and cost-effectively meet the load obligation and planning reserve margin while complying
with all environmental and regulatory requirements. It should be noted that DEP considers the non-
firm energy purchases and sales associated with the Joint Dispatch Agreement (JDA) with DEC in
the development of its independent Base Cases and five alternative portfolios as discussed later in
this chapter and in Appendix A.
Three Pillars of the IRP:
The IRP process has evolved as the energy industry has changed. While the intent of the IRP
remains to develop a 15-year plan that is reliable and economical to meet future customer demand,
other factors also must be considered when selecting a plan.
Figure 13-A: Three Pillars of the IRP
Duke Energy Progress North Carolina Integrated Resource Plan
2018 Biennial Report PUBLIC
Page 54

There are three pillars which determine the primary planning objectives in the IRP. These pillars are
as follows:
• Regulatory/Legislative
• Financial (Affordability)
• Physical (Reliability)
The Regulatory and Legislative pillar of the IRP process takes into consideration various policies set
by state and federal entities. Such entities include NCUC, PSCSC, FERC, NERC, SERC, NRC, and
EPA, along with various other state and federal regulatory entities. Each of these entities develop
policies that have a direct bearing on the inputs, analysis and results of the IRP process. Examples
of such policies include NC HB 589 and SC DER program that set targets for the addition of
renewable resources. Environmental legislation at the state and federal level can impact the cost
and operations of existing resources as well as future assets. In addition, reliability and operational
requirements imposed on the system also influence the IRP process.
The Financial, or Affordability, pillar is another basic criterion for the IRP. The plan that is selected
must be cost-effective for the customers of the Company. DEP’s service territory, located in the
southern United States, has climate conditions that require more combined electric heating and
cooling per customer than any other region in the country. As such, DEP’s customers require more
electricity than customers from other regions, highlighting the need for affordable power. Changing
customer preferences and usage patterns will continue to influence the load forecast incorporated in
the Company’s IRPs. Furthermore, as new technologies are developed and continue to evolve, the
costs of these technologies are projected to decline. These downward impacts are contemplated in
the planning process and changes to those projections will be closely monitored and captured in
future IRPs.
Finally, Physical Reliability is the third pillar of the IRP process. Reliability of the system is vitally
important to meeting the needs of today’s customers as well as the future needs that comes with
substantial customer growth projected in the region. DEP’s customers expect energy to be provided
to them when they need it both today and into the future. As discussed previously, the addition of
new types of generation has impacted the operation of the system. As such, different ways of
managing the system operations to ensure the Company reliably meets customer demand have been
incorporated. The Company continues to plan to a reasonable 17% reserve margin, which helps to
ensure that the reliability of the system is maintained.
Duke Energy Progress North Carolina Integrated Resource Plan
2018 Biennial Report PUBLIC
Page 55

Each of these pillars must be evaluated and balanced in the IRP in order to meet the intent of the
process. The Company has adhered to the principles of these pillars in the development of this IRP
and the portfolios evaluated as part of the IRP process.
Figure 13-B below graphically represents examples of how issues from each of the pillars may
impact the IRP modeling process and subsequent portfolio development.
Figure 13-B: Impacts of Three Pillars on the IRP Modeling Process
IRP Analysis Process:
The following section summarizes the Data Input, Generation Alternative Screening, Portfolio
Development and Detailed Analysis steps in the IRP process. A more detailed discussion of the IRP
Process and development of the Base Cases and additional portfolios is provided in Appendix A.
Data Inputs:
Refreshing input data is the initial step in the IRP development process. For the 2018 IRP, data
inputs such as load forecast, EE and DSM projections, fuel prices, projected CO2 prices, individual
Duke Energy Progress North Carolina Integrated Resource Plan
2018 Biennial Report PUBLIC
Page 56

plant operating and cost information, and future resource information were updated with the most
current data. These data inputs were developed and provided by Company subject matter experts
and/or based upon vendor studies, where available. Furthermore, DEP and DEC continue to benefit
from the combined experience of both utilities’ subject matter experts utilizing best practices from
each utility in the development of their respective IRP inputs. Where appropriate, common data
inputs were utilized.
As expected, certain data elements and issues have a larger impact on the IRP than others. Any
changes in these elements may result in a noticeable impact to the plan, and as such, these elements
are closely monitored. Some of the most consequential data elements are listed below. A detailed
discussion of each of these data elements has been presented throughout this document and are
examined in more detail in the appendices.
• Load Forecast for Customer Demand
• EE/DSM Forecast
• Renewable Resources and Cost Projections
• Fuel Costs Forecasts
• Technology Costs and Operating Characteristics
• Environmental Legislation and Regulation
Generation Alternative Screening:
DEP reviews generation resource alternatives on a technical and economic basis. Resources must
also be demonstrated to be commercially available for utility scale operations. The resources that
are found to be both technically and economically viable are then passed to the detailed analysis
process for further analysis.
Portfolio Development and Detailed Analysis:
The following figure provides an overview of the process for the portfolio development and detailed
analysis phase of the IRP.
Duke Energy Progress North Carolina Integrated Resource Plan
2018 Biennial Report PUBLIC
Page 57

Figure 13-C: Overview of Portfolio Development and Detailed Analysis Phase
The Sensitivity Analysis and Portfolio Development phases rely upon the updated data inputs and
results of the generation alternative screening process to derive resource portfolios or resource
plans. The Sensitivity Analysis and Portfolio Development phases utilize an expansion planning
model, System Optimizer (SO), to determine the best mix of capacity additions for the Company’s
short- and long-term resource needs with an objective of selecting a robust plan that meets
reliability targets and minimizes the PVRR to customers and is environmentally sound by
complying with or exceeding, all State and Federal regulations.
Sensitivity analysis of input variables such as load forecast, fuel costs, renewable energy, EE, and
capital costs are considered as part of the quantitative analysis within the resource planning process.
Utilizing the results of these sensitivities, possible expansion plan options for the DEP system are
developed. These expansion plans are reviewed to determine if any overarching trends are present
across the plans, and based on this analysis, specific portfolios are developed to represent these
trends. Finally, the portfolios are analyzed using a capital cost model and an hourly production cost
model (PROSYM) under various fuel price, capital cost and carbon scenarios to evaluate the
robustness and economic value of each portfolio under varying input assumptions. After this
comprehensive analysis is completed, the Base Case portfolios are selected.
In addition to evaluating these portfolios solely within the DEP system, the potential benefits of
sharing capacity within DEP and DEC are examined in a common Joint Planning Case. A detailed
discussion of these portfolios is provided in Appendix A.
Duke Energy Progress North Carolina Integrated Resource Plan
2018 Biennial Report PUBLIC
Page 58

Selected Portfolios:
For the 2018 IRP, seven representative portfolios were identified through the Sensitivity Analysis
and Portfolio Development steps. As described below, the portfolios range from diverse portfolios
with varying fuel sources such as nuclear, solar, natural gas, and coal, to more technology
concentrated resources such as CT Centric and CC Centric resources. Additionally, some portfolios
increase the amount and adoption rate of renewables, EE, and energy storage.
Portfolio 1 (Base CO2 Future)
This portfolio represents a balanced generation portfolio with CCs and CTs making up the
generation mix with incremental solar additions just beyond the 15-year window. While CCs
are the preferred initial generating options in both DEP and DEC, CTs make up the vast
majority of additional resources at the end of the 15-year planning horizon. This portfolio
also includes base EE and renewable assumptions, along with 1,000 MW of economically
selected solar just beyond the planning horizon. Additionally, 140 MW of nameplate battery
storage placeholders are included. These placeholders represent a limited amount of grid
connected battery storage projects that have the potential to provide solutions for the
transmission and distribution systems with the possibility of simultaneously providing
benefits to the generation resource portfolio.
Portfolio 2 (Base No CO2 Future)
Within the 15-year planning horizon, this portfolio is the same as Portfolio 1. Beyond the
planning window, CT technology generally takes precedent over CC technology. No
additional solar was selected in this portfolio. The Base No CO2 portfolio also includes base
EE and renewable assumptions, along with 140 MW of nameplate battery storage
placeholders.
Portfolio 3 (CT Centric)
This portfolio is similar to Portfolio 2. However, the 2027 CC need is replaced with CT
technology to increase the concentration of CTs in this portfolio. Like Portfolio 2, this
portfolio includes base EE and renewable assumptions, and no additionally selected solar.
The portfolio includes 140 MW of nameplate storage placeholders.
Portfolio 4 (CC Centric – No Nuclear Future)
This portfolio represents a future where all existing nuclear assets are retired at the end of
their current extended license period, and those nuclear assets are primarily replaced with
CCs rather than new nuclear generation. The CC Centric Portfolio converts the entire 2029
Duke Energy Progress North Carolina Integrated Resource Plan
2018 Biennial Report PUBLIC
Page 59

CT block to CC technology. This portfolio also includes base EE and renewable
assumptions, along with 1,000 MW of economically selected solar just beyond the planning
horizon. Additionally, 140 MW of nameplate battery storage placeholders are included.
Portfolio 5 (High EE / High Renewables)
This portfolio includes the High EE and High Renewable assumptions in DEP. Solar
nameplate capacity increases at a more rapid pace, and the total MW of solar is 310 MW
greater in the High Renewable case by 2033. This portfolio includes an additional 124 MW
of EE by the end of the planning horizon. Finally, this case also includes 140 MW of
nameplate battery storage placeholders.
Portfolio 6 (CT Centric / High Renewables)
Like Portfolio 3, Portfolio 6 includes a high concentration of CT generation in the 15-year
planning horizon. However, this portfolio includes the High Renewable assumption which
accelerates solar additions in DEP while increasing the total amount of solar by
approximately 300 MW. Portfolio 6 includes Base EE assumptions along with a placeholder
of 140 MW of nameplate battery storage. This portfolio is especially illustrative when
evaluating additional energy storage added in Portfolio 7.
Portfolio 7 (CT Centric with Battery Storage and High Renewables)
This portfolio converts the first 460 MW block of CTs in Portfolio 6 to 575 MW (nameplate)
of 4-hour Lithium-ion battery storage in 2029. The additional 575 MW of battery storage is
assumed to only provide generation and energy transfer capability that is 100% controlled by
the Company. As such, the battery storage installation is assumed to provide 460 MW of
winter peak capacity. The total amount of nameplate battery storage in DEP in this case is
715 MW by 2029.
Portfolio Analysis & Base Case Selection:
The seven portfolios identified in the screening analysis were evaluated in more detail with an
hourly production cost model under a matrix of nine carbon and fuel cost scenarios. Additionally,
each of the portfolios were further studied under high and low capital cost scenarios to determine
how changing capital costs impacted their relative value under the varying fuel and carbon
scenarios. Table 13-A shows the matrix that each of the scenarios were tested under.
Duke Energy Progress North Carolina Integrated Resource Plan
2018 Biennial Report PUBLIC
Page 60

Table 13-A Scenarios for Portfolio Analysis
No CO2 Base CO2 High CO2
Low Fuel
Base Fuel
High Fuel
Table 13-B details the results of the PVRR analysis under the varying carbon and fuel scenarios
while Tables 13-C and 13-D provide the same results but under low capital cost and high capital
cost futures respectively.
Table 13-B: Lowest PVRR (thru 2068) Portfolios Under Each Scenario (2018 dollars in
Millions)
PVRR thru 2068
(2018 $M) No CO2 Base CO2 High CO2
Low Fuel Portfolio 2
(-$132 M vs Port 3)
Portfolio 1
(-$84 M vs Port 2)
Portfolio 1
(-$409 M vs Port 2)
Base Fuel Portfolio 2
(-$17 M vs Port 1)
Portfolio 1
(-$231 M vs Port 2)
Portfolio 1
(-$536 M vs Port 5)
High Fuel Portfolio 1
(-$257 M vs Port 2)
Portfolio 1
(-$493 M vs Port 2)
Portfolio 1
(-$533 M vs Port 5)
Table 13-C: Lowest PVRR (thru 2068) Portfolios Under Each Scenario –
Low Capital Cost Sensitivity (2018 dollars in Millions)
PVRR thru 2068
(2018 $M) No CO2 Base CO2 High CO2
Low Fuel Portfolio 2
(-$6 M vs Port 1)
Portfolio 1
(-$260 M vs Port 2)
Portfolio 1
(-$586 M vs Port 5)
Base Fuel Portfolio 1
(-$60 M vs Port 2)
Portfolio 1
(-$408 M vs Port 2)
Portfolio 1
(-$579 M vs Port 5)
High Fuel Portfolio 1
(-$351 M vs Port 7)
Portfolio 1
(-$551 M vs Port 5)
Portfolio 1
(-$552 M vs Port 5)
Duke Energy Progress North Carolina Integrated Resource Plan
2018 Biennial Report PUBLIC
Page 61
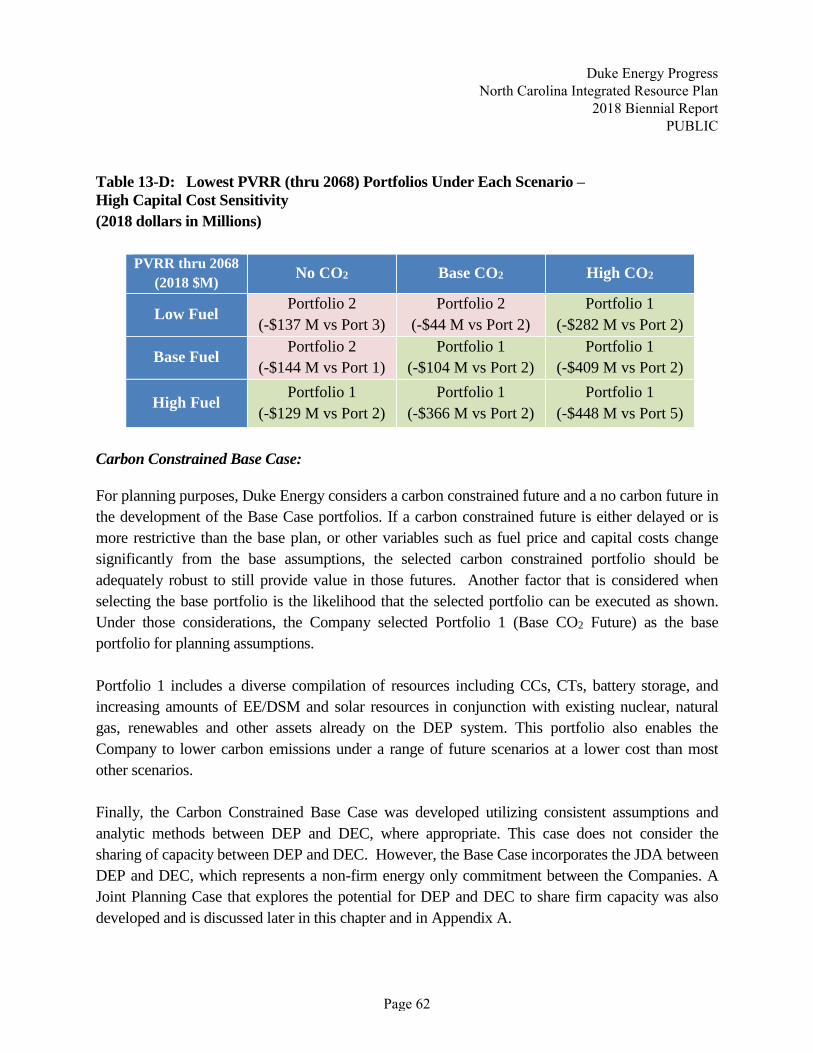
Table 13-D: Lowest PVRR (thru 2068) Portfolios Under Each Scenario –
High Capital Cost Sensitivity
(2018 dollars in Millions)
PVRR thru 2068
(2018 $M) No CO2 Base CO2 High CO2
Low Fuel Portfolio 2
(-$137 M vs Port 3)
Portfolio 2
(-$44 M vs Port 2)
Portfolio 1
(-$282 M vs Port 2)
Base Fuel Portfolio 2
(-$144 M vs Port 1)
Portfolio 1
(-$104 M vs Port 2)
Portfolio 1
(-$409 M vs Port 2)
High Fuel Portfolio 1
(-$129 M vs Port 2)
Portfolio 1
(-$366 M vs Port 2)
Portfolio 1
(-$448 M vs Port 5)
Carbon Constrained Base Case:
For planning purposes, Duke Energy considers a carbon constrained future and a no carbon future in
the development of the Base Case portfolios. If a carbon constrained future is either delayed or is
more restrictive than the base plan, or other variables such as fuel price and capital costs change
significantly from the base assumptions, the selected carbon constrained portfolio should be
adequately robust to still provide value in those futures. Another factor that is considered when
selecting the base portfolio is the likelihood that the selected portfolio can be executed as shown.
Under those considerations, the Company selected Portfolio 1 (Base CO2 Future) as the base
portfolio for planning assumptions.
Portfolio 1 includes a diverse compilation of resources including CCs, CTs, battery storage, and
increasing amounts of EE/DSM and solar resources in conjunction with existing nuclear, natural
gas, renewables and other assets already on the DEP system. This portfolio also enables the
Company to lower carbon emissions under a range of future scenarios at a lower cost than most
other scenarios.
Finally, the Carbon Constrained Base Case was developed utilizing consistent assumptions and
analytic methods between DEP and DEC, where appropriate. This case does not consider the
sharing of capacity between DEP and DEC. However, the Base Case incorporates the JDA between
DEP and DEC, which represents a non-firm energy only commitment between the Companies. A
Joint Planning Case that explores the potential for DEP and DEC to share firm capacity was also
developed and is discussed later in this chapter and in Appendix A.
Duke Energy Progress North Carolina Integrated Resource Plan
2018 Biennial Report PUBLIC
Page 62

The Load and Resource Balance shown in Figure 13-D illustrates the resource needs that are
required for DEP to meet its load obligation inclusive of a required reserve margin. The existing
generating resources, designated resource additions and EE resources do not meet the required load
and reserve margin beginning in 2020. As a result, the resource plan analyses described above have
determined the most robust plan to meet this resource gap.
Figure 13-D: DEP Carbon Constrained Base Case Load Resource Balance (Winter)
Cumulative Resource Additions to Meet Winter Load Obligation and Reserve Margin (MW)
Tables 13-E and 13-F present the Load, Capacity and Reserves (LCR) tables for the Carbon
Constrained Base Case analysis that was completed for DEP’s 2018 IRP.
Year 2019 2020 2021 2022 2023 2024 2025 2026
Resource Need 0 28 621 1,205 1,641 2,068 2,258 2,417
Year 2027 2028 2029 2030 2031 2032 2033
Resource Need 2,587 2,855 4,066 4,207 4,375 4,572 5,115
Duke Energy Progress North Carolina Integrated Resource Plan
2018 Biennial Report PUBLIC
Page 63

Table 13-E: Carbon Constrained Load, Capacity and Reserves Table -Winter
2019 2020 2021 2022 2023 2024 2025 2026 2027 2028 2029 2030 2031 2032 2033
Load Forecast
1 DEP System Winter Peak 14,036 14,060 14,062 14,168 14,243 14,429 14,553 14,724 14,886 15,090 15,232 15,367 15,524 15,704 15,811
2 Firm Sale 150 150 150 150 150 150 0 0 0 0 0 0 0 0 0
3 Cumulative New EE Programs (26) (44) (62) (79) (104) (120) (138) (155) (173) (187) (200) (211) (221) (229) (236)
4 Adjusted Duke System Peak 14,161 14,166 14,151 14,239 14,289 14,458 14,415 14,568 14,713 14,903 15,032 15,155 15,303 15,475 15,575
Existing and Designated Resources
5 Generating Capacity 13,912 13,942 14,124 13,614 13,620 13,620 13,626 13,394 13,394 13,394 13,398 12,345 12,345 12,345 12,345
6 Designated Additions / Uprates 30 566 4 6 0 6 0 0 0 4 0 0 0 0 0
7 Retirements / Derates 0 (384) (514) 0 0 0 (232) 0 0 0 (1,053) 0 0 0 0
8 Cumulative Generating Capacity 13,942 14,124 13,614 13,620 13,620 13,626 13,394 13,394 13,394 13,398 12,345 12,345 12,345 12,345 12,345
Purchase Contracts
9 Cumulative Purchase Contracts 2,013 1,703 1,646 1,140 738 480 480 479 476 470 466 465 465 463 35
Non-Compliance Renewable Purchases 99 102 48 49 38 40 39 39 36 33 29 28 27 26 26
Non-Renewables Purchases 1,914 1,601 1,599 1,091 700 440 440 440 440 437 437 437 437 437 9
Undesignated Future Resources
10 Nuclear
11 Combined Cycle 1,338 1,338
12 Combustion Turbine 1,840 460 460
13 Short-Term Market Purchases 30 590 590 430 430 (30) (590) (590) (430) (430)
14 Solar
Renewables
15 Cumulative Renewables Capacity 194 194 106 102 102 102 74 74 72 22 15 16 16 16 16
16 Combined Heat & Power 0 0 22 0 0 0 0 0 0 0 0 0 0 0 0
17 Energy Storage 12 12 12 14 14 16 16 16 0 0 0 0 0 0 0
18 Cumulative Production Capacity 16,161 16,075 16,045 16,144 16,187 16,381 17,445 16,870 17,613 17,131 17,477 17,477 17,477 17,935 17,967
Demand Side Management (DSM)
19 Cumulative DSM Capacity 490 501 511 521 530 537 541 546 550 557 560 564 569 574 578
20 Cumulative Capacity w/ DSM 16,651 16,576 16,555 16,665 16,718 16,918 17,985 17,416 18,163 17,687 18,038 18,041 18,046 18,509 18,544
Reserves w/ DSM
21 Generating Reserves 2,491 2,410 2,405 2,426 2,428 2,460 3,571 2,848 3,450 2,784 3,006 2,886 2,743 3,034 2,969
22 % Reserve Margin 17.6% 17.0% 17.0% 17.0% 17.0% 17.0% 24.8% 19.5% 23.4% 18.7% 20.0% 19.0% 17.9% 19.6% 19.1%
Winter Projections of Load, Capacity, and Reserves
for Duke Energy Progress 2018 Annual Plan
Page 64
Duke Energy Progress North Carolina Integrated Resource Plan
2018 Biennial Report PUBLIC
Page 64

Table 13-F: Carbon Constrained Load, Capacity and Reserves Table -Summer
2019 2020 2021 2022 2023 2024 2025 2026 2027 2028 2029 2030 2031 2032 2033
Load Forecast
1 DEP System Summer Peak 13,374 13,409 13,439 13,557 13,676 13,850 14,018 14,264 14,398 14,642 14,804 14,959 15,137 15,333 15,463
2 Firm Sale 150 150 150 150 150 150 0 0 0 0 0 0 0 0 0
3 Cumulative New EE Programs (58) (87) (115) (141) (166) (193) (222) (250) (280) (306) (332) (354) (375) (392) (409)
4 Adjusted Duke System Peak 13,467 13,472 13,474 13,566 13,660 13,808 13,796 14,014 14,118 14,336 14,473 14,605 14,762 14,941 15,054
Existing and Designated Resources
5 Generating Capacity 12,728 12,732 12,852 12,477 12,477 12,481 12,481 12,305 12,305 12,307 12,307 11,260 11,260 11,260 11,260
6 Designated Additions / Uprates 4 498 4 0 4 0 0 0 2 0 0 0 0 0 0
7 Retirements / Derates 0 (378) (379) 0 0 0 (176) 0 0 0 (1,047) 0 0 0 0
8 Cumulative Generating Capacity 12,732 12,852 12,477 12,477 12,481 12,481 12,305 12,305 12,307 12,307 11,260 11,260 11,260 11,260 11,260
Purchase Contracts
9 Cumulative Purchase Contracts 2,207 2,170 1,705 1,445 1,461 1,262 1,278 1,268 1,256 1,242 1,229 1,219 1,215 1,208 809
Non-Compliance Renewable Purchases 611 719 741 818 835 856 871 862 850 838 825 816 811 805 800
Non-Renewables Purchases 1,596 1,451 964 626 626 406 406 406 406 403 403 403 403 403 9
Undesignated Future Resources
10 Nuclear
11 Combined Cycle 1,198 1,198
12 Combustion Turbine 1,704 426 426
13 Short Term Market Purchases 30 590 590 430 430 (30) (590) (590) (430) (430)
14 Solar
Renewables
15 Cumulative Renewables Capacity 620 618 537 528 539 535 499 511 521 482 488 499 504 509 514
16 Combined Heat & Power 0 0 16 0 0 0 0 0 0 0 0 0 0 0 0
17 Energy Storage 12 12 12 14 14 16 16 16 0 0 0 0 0 0 0
18 Cumulative Production Capacity 15,571 15,694 15,391 15,726 16,202 16,445 17,432 16,861 17,469 16,986 17,205 17,207 17,208 17,633 17,665
Demand Side Management (DSM)
19 Cumulative DSM Capacity 923 958 984 1,007 1,019 1,024 1,027 1,032 1,035 1,041 1,044 1,047 1,051 1,055 1,058
20 Cumulative Capacity w/ DSM 16,494 16,652 16,375 16,733 17,221 17,469 18,459 17,893 18,504 18,026 18,249 18,254 18,259 18,688 18,723
Reserves w/ DSM
21 Generating Reserves 3,027 3,180 2,901 3,167 3,561 3,662 4,663 3,879 4,385 3,690 3,776 3,650 3,496 3,747 3,669
22 % Reserve Margin 22.5% 23.6% 21.5% 23.3% 26.1% 26.5% 33.8% 27.7% 31.1% 25.7% 26.1% 25.0% 23.7% 25.1% 24.4%
Summer Projections of Load, Capacity, and Reserves
for Duke Energy Progress 2018 Annual Plan
Page 65
Duke Energy Progress North Carolina Integrated Resource Plan
2018 Biennial Report PUBLIC
Page 65

DEP - Assumptions of Load, Capacity, and Reserves Table
The following notes are numbered to match the line numbers on the Winter Projections of Load,
Capacity, and Reserves table. All values are MW (winter ratings) except where shown as a percent.
1. Planning is done for the peak demand for the Duke Energy Progress System.
2. Firm sale of 150 MW through 2024.
3. Cumulative new energy efficiency and conservation programs (does not include demand
response programs).
4. Peak load adjusted for firm sales and cumulative energy efficiency.
5. Existing generating capacity reflecting designated additions, planned uprates, retirements
and derates as of July 1, 2018.
6. Designated Capacity Additions include:
Planned nuclear uprates totaling 56 MW in the 2019 - 2028 timeframe.
560 MW Asheville combined cycle addition in November 2019.
7. Planned Retirements include:
384 MW Asheville Coal Units 1-2 in November 2019.
514 MW Darlington CT Units 1-4, 6-8, 10 by December 2020.
232 MW Blewett CT Units 1-4 and Weatherspoon CT units 1-4 in December 2024.
1,053 MW Roxboro Units 1-2 in December 2028.
Planning assumptions for nuclear stations assume subsequent license renewal at the end of
the current license. 797 MW Robinson 2 is assumed to be relicensed to 2050 (current
license expires in 2030).
All retirement dates are subject to review on an ongoing basis. Dates used in the 2018 IRP
are for planning purposes only, unless already planned for retirement.
Duke Energy Progress North Carolina Integrated Resource Plan
2018 Biennial Report PUBLIC
Page 66

DEP - Assumptions of Load, Capacity, and Reserves Table (cont.)
8. Sum of lines 5 through 7.
9. Cumulative Purchase Contracts have several components:
Purchased capacity from PURPA Qualifying Facilities, Anson and Hamlet CT tolling,
Butler Warner purchase, Southern CC purchase, and Broad River CT purchase.
Additional line items are shown under the total line item to show the amounts of renewable
and traditional QF purchases.
10. New nuclear resources selected to meet load and minimum planning reserve margin
Capacity must be on-line by June 1 to be included in available capacity for the summer peak
of that year and by December 1 to be included in available capacity for the winter peak of
the following year.
No new nuclear resources were selected in the Base Case in the 15-year study period.
11. New combined cycle resources economically selected to meet load and minimum planning
reserve margin.
Capacity must be on-line by June 1 to be included in available capacity for the summer peak
of that year and by December 1 to be included in available capacity for the winter peak of
the next year.
Addition of 1,338 MW of combined cycle capacity online December 2024
Addition of 1,338 MW of combined cycle capacity online December 2026.
12. New combustion turbine resources economically selected to meet load and minimum
planning reserve margin.
Capacity must be on-line by June 1 to be included in available capacity for the summer peak
of that year and by December 1 to be included in available capacity for the winter peak of
the next year.
Addition of 1,840 MW of combustion turbine capacity online December 2028.
Addition of 460 MW of combustion turbine capacity online December 2031.
Duke Energy Progress North Carolina Integrated Resource Plan
2018 Biennial Report PUBLIC
Page 67

DEP - Assumptions of Load, Capacity, and Reserves Table (cont.)
Addition of 460 MW of combustion turbine capacity online December 2032.
13. Short-term market purchases needed to meet load and minimum planning reserve margin.
14. New solar resources economically selected to meet load and minimum planning reserve
margin above the forecast in Section 5.
No solar resources were economically selected in the Base Case.
15. Resources to comply with NC REPS, HB 589 and SC DERS. These resources include
solar, landfill gas, poultry and swine resources. Solar resources reflect percentage of
nameplate capacity contribution at the time of the winter and summer peak demands.
16. New 22 MW combined heat and power capacity included in 2021.
17. Addition of 113 MW of energy storage placeholders over the years 2019 through 2026
based on 80% contribution to peak assumption.
18. Sum of lines 8 through 17.
19. Cumulative Demand-Side Management programs including load control and DSDR.
20. Sum of lines 18 and 19.
21. The difference between lines 20 and 4.
19. Reserve Margin = (Cumulative Capacity-System Peak Demand)/System Peak Demand
Line 21 divided by Line 4.
Minimum target planning reserve margin is 17%.
Duke Energy Progress North Carolina Integrated Resource Plan
2018 Biennial Report PUBLIC
Page 68

A tabular presentation of the Carbon Constrained Base Case resource plan represented in the above
LCR table is shown below:
Table 13-G: DEP Carbon Constrained Base Case
Additionally, a summary of the above table is represented below in Table 13-H.
Table 13-H: Summary of DEP Carbon Constrained Base Case Winter Resources
Year
2019 Energy Storage 30 190
2020 Asheville CC Solar Energy Storage 6 560 303 12
2021 CHP Solar Energy Storage 4 22 280 12
2022 Energy Storage 6 247
2023 Energy Storage
2024 Solar 6 16
2025 Solar 1,338 16
2026 Solar
2027 Solar
2028 Solar
2029 Solar
2030
2031
2032 Solar
2033 Solar
Notes: (1) Table includes both designated and undesignated capacity additions
(2) Incremental solar additions represent nameplate ratings
(3) Future additions of other renewables, EE and DSM not included
(4) Table does not include short term PPA purchases in 2020 through 2024
4
172 14
16 34
1,338 34
4 34
1,840
33
4
179
460
460
New CC
Nuclear Uprates
New CT
New CT
Solar
Solar
Duke Energy Progress Resource Plan (1)
Base Case - Winter
MWResource
New CT
Energy Storage 80
Energy Storage
33
4
Nuclear Uprates Energy Storage
New CC
14
Nuclear Uprates Solar
Solar
12
Nuclear Uprates
Nuclear Uprates
Nuclear Uprates Solar
56
1,631
3,236
2,760
22
113
7,817
DEP Base Case Resources
Cumulative Winter Totals - 2019 - 2033
Nuclear
Solar
CC
CT
CHP
Energy Storage
Total
Duke Energy Progress North Carolina Integrated Resource Plan
2018 Biennial Report PUBLIC
Page 69

The following figures illustrate both the current and forecasted capacity for the DEP system, as
projected by the Carbon Constrained Base Case. As demonstrated in Figure 13-E, the capacity mix
for the DEP system changes with the passage of time. In 2033, the Carbon Constrained Base Case
projects that DEP will have a smaller reliance on coal, nuclear and external purchases and a higher
reliance on gas-fired resources, renewable resources and EE as compared to the current state. It
should be noted that the Company’s Carbon Constrained Base Case resources depicted in Figure
13-E below reflect a significant amount of solar capacity with nameplate solar growing from 2,758
MW in 2019 to 4,199 MW by 2033. However, given that solar resources only contribute 1% or less
of nameplate capacity at the time of the Company’s winter peak, solar capacity contribution to
winter peak only grows from 28 MW in 2019 to 42 MW by 2033.
Figure 13-E: Duke Energy Progress Capacity Over 15 Year Study Period –
Carbon Constrained Base Case 7
Figure 13-F represents the energy of both the DEP and DEC Carbon Constrained Base Cases over
time. Due to the joint dispatch agreement (JDA), it is prudent to combine the energy of both utilities
to develop a meaningful Carbon Constrained Base Case energy figure. From 2019 to 2033, the
figure shows that nuclear resources will continue to serve almost half of DEC and DEP energy
needs, a reduction in the energy served by coal, and an increase in energy served by natural gas,
renewables and EE.
7 Capacity based on winter ratings (renewables based on nameplate).
Duke Energy Progress North Carolina Integrated Resource Plan
2018 Biennial Report PUBLIC
Page 70

Figure 13-F: DEP and DEC Energy Over 15 Year Study Period –
Carbon Constrained Base Case
A detailed discussion of the assumptions, inputs and analytics used in the development of the Base
Cases are contained in Appendix A. As previously noted, the further out in time planned additions
or retirements are within the 2018 IRP the greater the opportunity for input assumptions to change.
Thus, resource allocation decisions at the end of the planning horizon have a greater possibility for
change as compared to those earlier in the planning horizon.
No Carbon Base Case:
While Duke Energy presents a base resource plan that was developed under a carbon constrained
future, the Company also provides a No Carbon (or No CO2) Base Case expansion plan that reflects
a future without CO2 constraints. In DEP, this expansion plan is represented by Portfolio 2 (Base
No CO2 Future). As shown in Tables 13-I and 13-J below, there is no difference between the
Carbon Constrained Base Case and the No Carbon Base Case over the 15-year planning horizon.
However, beyond the 15-year window, CT technology generally takes precedent over CC
technology. Because of the trend towards CT technology and the absence of incremental solar in
the years just after the planning window, Portfolio 2 has a lower capital cost and a slightly lower
PVRR than Portfolio 1 in the Base Fuel / No CO2 scenario.
The tables below depict a tabular form of the resources required in the No Carbon Base Case.
Duke Energy Progress North Carolina Integrated Resource Plan
2018 Biennial Report PUBLIC
Page 71
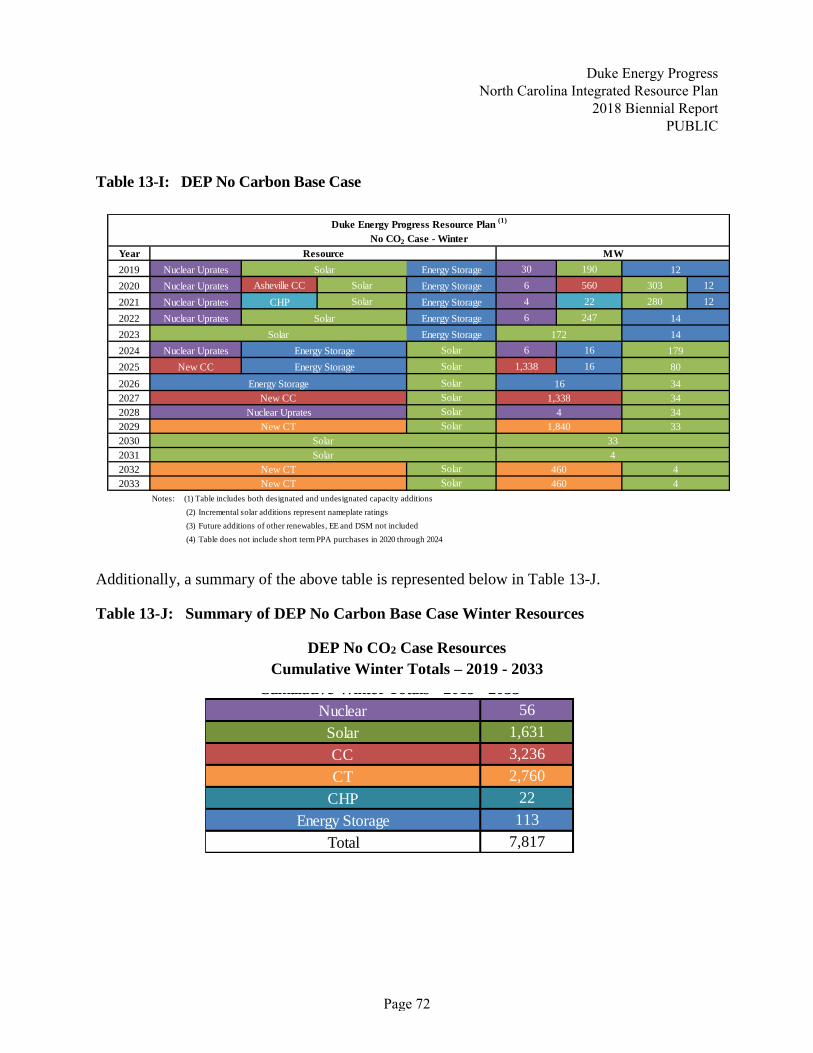
Table 13-I: DEP No Carbon Base Case
Additionally, a summary of the above table is represented below in Table 13-J.
Table 13-J: Summary of DEP No Carbon Base Case Winter Resources
DEP No CO2 Case Resources
Cumulative Winter Totals – 2019 - 2033
Year
2019 Energy Storage 30 190
2020 Asheville CC Solar Energy Storage 6 560 303 12
2021 CHP Solar Energy Storage 4 22 280 12
2022 Energy Storage 6 247
2023 Energy Storage
2024 Solar 6 16
2025 Solar 1,338 16
2026 Solar
2027 Solar
2028 Solar
2029 Solar
2030
2031
2032 Solar
2033 Solar
Notes: (1) Table includes both designated and undesignated capacity additions
(2) Incremental solar additions represent nameplate ratings
(3) Future additions of other renewables, EE and DSM not included
(4) Table does not include short term PPA purchases in 2020 through 2024
New CT
New CT
1,840
Nuclear Uprates Solar 12
Nuclear Uprates
Nuclear Uprates
Nuclear Uprates Solar
Duke Energy Progress Resource Plan (1)
No CO2 Case - Winter
Resource MW
14
Solar 172 14
Nuclear Uprates Energy Storage 179
New CC Energy Storage 80
Energy Storage 16 34
New CC 1,338 34
Nuclear Uprates 4 34
33
Solar 33
Solar 4
New CT 460 4
460 4
56
1,631
3,236
2,760
22
113
7,817Total
DEP No CO2 Case Resources
Cumulative Winter Totals - 2019 - 2033
Nuclear
Solar
CC
CT
CHP
Energy Storage
Duke Energy Progress North Carolina Integrated Resource Plan
2018 Biennial Report PUBLIC
Page 72

Joint Planning Case:
A Joint Planning Case that explores the potential for DEP and DEC to share firm capacity
between the Companies was also developed. The focus of this case is to illustrate the potential
for the Utilities to collectively defer generation investment by utilizing each other’s capacity
when available and by jointly owning or purchasing new capacity additions. This case does not
address the specific implementation methods or issues required to implement shared capacity.
Rather, this case illustrates the benefits of joint planning between DEP and DEC with the
understanding that the actual execution of capacity sharing would require separate regulatory
proceedings and approvals.
Table 13-K below represents the annual non-renewable incremental additions reflected in the
combined DEP and DEC winter Base Cases as compared to the Joint Planning Case. The plan
contains the undesignated additions for DEP and DEC over the planning horizon. As presented in
Table 13-K, the Joint Planning Case allows for the delay of a CC resource and several blocks of CT
resources through the 15-year study period. Though not shown below, the ability to share capacity
between DEP and DEC would also limit the amount of undesignated short-term market purchases
identified in the 2020 to 2024 timeframe in the DEP IRP.
Table 13-K: DEP and DEC Joint Planning Case
A comparison of both the DEP and DEC Combined Base Case and Joint Planning Base Case by
resource type is represented below in Table 13-L.
Year Year
2019 2019
2020 2020
2021 2021
2022 2022
2023 2023
2024 2024
2025 2025
2026 2026
2027 2027
2028 2028
2029 2029 New CC New CT 1,338 1,380
2030 2030
2031 2031
2032 2032
2033 2033
Notes: (1) Table only includes undesignated conventional capacity additions.
1,380
New CC
New CC 1,338
New CT
New CT
New CT
New CT 1,840
460
920
New CC 1,338
1,338New CC 1,338
New CC 1,338
DEC and DEP Combined Resource Plan (1)
Base Case - Winter
Resource MW
New CC 1,338 1,338
DEC and DEP Joint Planning Resource Plan (1)
MW
Base Case - Winter
Resource
New CC
Delay 460 MW Beyond Study
Period
Delay
Delay460 MW
Delay 460 MW
Duke Energy Progress North Carolina Integrated Resource Plan
2018 Biennial Report PUBLIC
Page 73

Table 13-L: DEP and DEP Base Case and Joint Planning Case Comparison by Resource
Type
DEC and DEP Combined Base Case
Resources
DEC and DEP Joint Base Case
Resources
Nuclear 0 Nuclear 0
CC 5,352 CC 5,352
CT 3,220 CT 2,760
Total 8,572 Total 8,112
Cumulative Winter Totals - 2019 - 2033
DEC and DEP Joint Base Case Resources
Cumulative Winter Totals - 2019 - 2033
DEC and DEP Combined Base Case Resources
Duke Energy Progress North Carolina Integrated Resource Plan
2018 Biennial Report PUBLIC
Page 74

14. SHORT-TERM ACTION PLAN
The Company’s Short-Term Action Plan, which identifies accomplishments in the past year and
actions to be taken over the next five years, is summarized below:
Continued Reliance on EE and DSM Resources:
The Company is committed to continuing to grow the amount of EE and DSM resources utilized to
meet customer growth. The following are the ways in which DEP will increase these resources:
• Continue to execute the Company’s EE and DSM plan, which includes a diverse portfolio
of EE and DSM programs spanning the residential, commercial, and industrial classes.
• Continue on-going collaborative work to develop and implement additional cost-effective
EE and DSM products and services, such as: (1) adding new or expanding existing
programs to include additional measures, (2) program modifications to account for
changing market conditions and new measurement and verification (M&V) results and
(3) other EE research & development pilots.
• Continue to seek additional DSM programs that will specifically benefit during winter
peak situations.
Continued Focus on Renewable Energy Resources:
DEP is committed to the addition of significant renewable generation into its resource portfolio.
Over the next five years, DEP is projecting to grow its renewable portfolio from 3,024 MW to 4,199
MW. Supporting policy such as NC REPS, NC HB 589 and SC DER have all contributed to DEP’s
aggressive plans to grow its renewable resources. DEP is committed to complying with NC REPS,
meeting its targets for the SC DER Program, and under HB 589, DEP and DEC are responsible for
procuring renewable energy and capacity through a competitive procurement program. These
activities will be done in a manner that allows the Companies to continue to reliably and cost-
effectively serve customers’ future energy needs. The Companies, under the competitive
procurement program, are required to procure energy and capacity from renewable energy facilities
in the aggregate amount of 2,660 MW through request for proposals. DEP and DEC plan to jointly
implement the CPRE Program across the NC and SC service territories.
For further details, refer to Chapter 5, as well as, Attachments I and II.
Duke Energy Progress North Carolina Integrated Resource Plan
2018 Biennial Report PUBLIC
Page 75

Integration of Battery Storage:
The Company will begin investing in multiple grid connected storage systems dispersed throughout
its North and South Carolina service territories that will be located on property owned by the
Company or leased from its customers. These deployments will allow for a more complete
evaluation of potential benefits to the distribution, transmission and generation system, while also
providing actual operation and maintenance cost impacts of batteries deployed at a significant scale.
Additionally, the Company continues to participate in an energy storage study to assess the
economic potential for NC customers, mandated by HB 589. Results of the study are expected in
December 2018.
Continue to Find Opportunities to Enhance Existing Clean Resources:
DEP is committed to continually looking for opportunities to improve and enhance its existing
resources. DEP is expecting capacity uprates to its existing nuclear units, Brunswick and Harris, due
to upcoming projects at those sites. The uprates total 56 MW from 2019 to 2028.
Duke Energy Progress North Carolina Integrated Resource Plan
2018 Biennial Report PUBLIC
Page 76

Addition of Clean Natural Gas Resources: 8
• The Company continues to consider advanced technology combined cycle units as
excellent options to meet future demand. The improving efficiency and reliability of CCs
coupled with the continued trend of lower natural gas prices make this resource very
attractive. As older units on the DEP system are retired, CC units continue to play an
important role in the Company’s future diverse portfolio.
➢ A combined cycle unit (560 MW) is being constructed at the Asheville site and
has an expected commercial operation date (COD) of November 2019.
➢ Two Sutton LM6000 CT units (98 MW) were brought online in July of 2017.
➢ One 22 MW block of Combined Heat and Power is considered in the 2018 IRP
and included as a resource for meeting future generation needs. While no
contracts have yet been signed for DEP, discussions with a potential steam host
are currently underway. Future IRP processes will incorporate additional CHP as
appropriate.
➢ Take actions to ensure the CC need in the winter of 2025 (expected COD in
December 2024) is met. The 2016, 2017 and 2018 IRPs have indicated that this
first need is best met with a combined cycle.
A summarization of the capacity resource changes for the Base Plans in the 2018 IRP is shown in
Table 14-A below. Capacity retirements and resource additions are presented in the table as
incremental values in the year in which the change impacts the winter peak. The values shown for
renewable resources, EE and DSM represent cumulative totals.
8 Capacities represent winter ratings.
Duke Energy Progress North Carolina Integrated Resource Plan
2018 Biennial Report PUBLIC
Page 77

Table 14-A DEP Short-Term Action Plan
Year Retirements Additions (5)
Solar (3)
Biomass/Hydro EE DSM (4)
2019
30 MW Nuc Uprate
12 MW Energy Storage 2758 266 26 490
2020 384 MW Asheville 1-2
560 MW Asheville CC
6 MW Nuc Uprate
12 MW Energy Storage
30 MW Short-Term PPA 3061 266 44 501
2021 514 MW Darlington CT
4 MW Nuc Uprate
22 MW CHP
12 MW Energy Storage
590 MW Short-Term PPA 3341 120 62 511
2022
6 MW Nuc Uprate
14 MW Energy Storage
590 MW Short-Term PPA 3588 115 79 521
2023
14 MW Energy Storage
430 MW Short-Term PPA 3760 103 104 530
Notes:
(1) Capacities shown in winter ratings unless otherwise noted.
(2) Dates represent when the project impacts the winter peak.
(3) Capacity is shown in nameplate ratings.
(4) Includes impacts of grid modernization.
(5) Energy Storage capacity represents 80% of nameplate.
Compliance Renewable Resources
(Cumulative Nameplate MW)
Duke Energy Progress Short-Term Action Plan (1) (2)
Page 78
Duke Energy Progress North Carolina Integrated Resource Plan
2018 Biennial Report PUBLIC
Page 78
Continue with Plan for Subsequent License Renewal of Existing Nuclear Units:
As discussed in Chapter 10, Duke Energy will continue to evaluate SLR for all its nuclear plants
and is actively working on DEC’s Oconee Nuclear Station SLR application to extend the licenses
to 80 years. The remaining nuclear sites will do likewise where the cost/benefit balance proves
acceptable.
Continued Development and Implementation of Capacity Value of Solar:
Conventional thermal resources are typically counted as 100% of net capability in reserve margin
calculations for future generation planning since these resources are fully dispatchable resources
when not on forced outage or planned maintenance. Due to the diurnal pattern and intermittent
nature of solar energy resources, it is not reasonable to assume that these resources provide the same
capacity credit as a fully dispatchable resource. An outside consultant calculated the capacity value
of incremental solar additions for DEC and DEP for use in the resource planning process.
Continued Transition Toward Integrated Systems and Operations Planning:
As explained in Chapter 6, the traditional methods of utility resource planning are continuing to
evolve. DEP is committed to moving toward an integrated planning process to meet the changing
needs of planning in the future. The traditional methods of utility resource planning must be
enhanced to address shifting trends through an Integrated System and Operations Planning (ISOP)
effort.
In the 2018 IRP, DEP has begun to adapt its IRP to adjust to this changed world, recognizing that
this process will continue to evolve. One key goal of ISOP is for the planning models to reasonably
mimic the future operational realities to allow DEP to serve its customers with newer technologies.
These enhancements in planning are expected to be addressed over the next several years, as soon as
the modeling tools, processes and data development will allow.
Continued Focus on Environmental Compliance:
• Retire older coal generation.
➢ As of December 2013, all of DEP’s older, un-scrubbed coal units have been
retired.
➢ DEP has retired approximately 1,700 MW of older coal units in total since 2011.
➢ Asheville Units 1 and 2 (384 MW) are expected to retire in November of 2019.
Duke Energy Progress North Carolina Integrated Resource Plan
2018 Biennial Report PUBLIC
Page 79

• Retire older CT generation.
➢ As of May 2018, DEP has retired approximately 520 MW of older CT generation.
The most recent retirements include:
i. Sutton Units 1, 2A and 2B (76 MW) were retired in March and July of
2017.
ii. Darlington Unit 9 (65 MW) was retired in June of 2017 and Darlington
Unit 5 (66 MW) was retired in May of 2018.
➢ The Company continues to evaluate the condition and economic viability of the
older CTs, resulting in expected future retirements.
i. Darlington Units 1-4, 6-8 and 10 (514 MW) are expected to retire by
December 2020.
• Continue to investigate the future environmental control requirements and resulting
operational impacts associated with existing and potential environmental regulations such
as EPA’s Clean Power Plan (Section 111d of Clean Air Act regulating CO2 from existing
power plants), Mercury Air Toxics Standard (MATS), the Coal Combustion Residuals
(CCR) rule, the Cross-State Air Pollution Rule (CSAPR).
Wholesale:
• Continue to pursue existing and potential opportunities for wholesale power sales
agreements within the Duke Energy balancing authority area.
• Over the next five years, DEP has approximately 1,200 MW of purchased power
contracts that expire under the current contract terms. The Company plans to engage the
marketplace to determine the feasibility of extending existing contracts or replacing them
with other purchased power arrangements to economically meet customer demand.
Regulatory:
• Continue to monitor energy-related statutory and regulatory activities.
• Continue to examine the benefits of joint capacity planning and pursue appropriate
regulatory actions.
Duke Energy Progress North Carolina Integrated Resource Plan
2018 Biennial Report PUBLIC
Page 80

DEP Request for Proposal (RFP) Activity:
Duke Energy Progress Capacity and Energy Market Solicitation
DEP has identified a near term need for approximately 2,000 MW of firm dispatchable
peaking/intermediate capacity and energy resources resulting from existing traditional purchase
power contract expirations. To meet this need, DEP is seeking proposal extensions from existing
purchase power contract suppliers and new capacity proposals from similar operationally capable
existing generation facilities or systems with firm transmission deliverability into DEP. Successfully
selected proposals are expected to be multi-year peaking/intermediate negotiated contracts with
terms up to five years in duration beginning in year 2020 that meet industry standards for
commercial availability and dispatchability requirements. The capacity and energy market
solicitation was released on August 27, 2018.
Duke Energy Carolinas/Progress Swine Waste Fueled RFP – North Carolina
DEP and DEC released a Request for Proposals soliciting proposals for swine waste fueled biogas,
the supply of electric power fueled by swine waste, or swine RECs (renewable energy
certificates). Swine biogas projects must be sited in the state of North Carolina, Renewable Energy
Facility proposals must be from swine projects sited within the NC/SC Duke Energy
retail/wholesale service territory, and North Carolina qualifying in-state and out-of-state REC-Only
proposals (electric swine RECs). This RFP solicited up to 750,000 MMBtu (million British thermal
units), or the equivalent in MWh (megawatt hours) which is approximately 110,000 MWh from
project developers. RECs secured under this RFP will be used for compliance with the swine waste
set aside under REPS. Proposal structure allowed for this RFP was for Renewable Natural Gas
Contracts or Purchase Power Agreements with terms of up to 20 years. RFP released December 15,
2017 and closed on January 29, 2018. Seven responses were received to the RFP, proposals have
been evaluated, and have executed contracts with two of the projects. In addition, DEP/DEC is
working with three other bids from the RFP while the respondents further develop their
projects before moving forward.
Competitive Procurement of Renewable Energy (CPRE)
Pursuant to N.C. Gen. Stat. § 62-110.8, DEP has initiated the first RFP solicitation under the
Competitive Procurement of Renewable Energy Program. This initial RFP solicitation was released
on July 10, 2018 and is currently open. Details concerning the CPRE program can be found in the
annual CPRE Plan filing, which is Attachment II to this document.
Duke Energy Progress North Carolina Integrated Resource Plan
2018 Biennial Report PUBLIC
Page 81

LOGO
APPENDICES
Page 82

APPENDICES:
APPENDIX A: QUANTITATIVE ANALYSIS ............................................................................... 84
APPENDIX B: DUKE ENERGY PROGRESS OWNED GENERATION ................................. 111
APPENDIX C: ELECTRIC LOAD FORECAST ......................................................................... 119
APPENDIX D: ENERGY EFFICIENCY AND DEMAND-SIDE MANAGEMENT ................ 133
APPENDIX E: FUEL SUPPLY ...................................................................................................... 160
APPENDIX F: SCREENING OF GENERATION ALTERNATIVES ....................................... 167
APPENDIX G: ENVIRONMENTAL COMPLIANCE ................................................................ 189
APPENDIX H: NON-UTILITY GENERATION AND WHOLESALE ..................................... 197
APPENDIX I: DEP QF INTERCONNECTION QUEUE ........................................................... 202
APPENDIX J: TRANSMISSION PLANNED OR UNDER CONSTRUCTION ...................... 203
APPENDIX K: ECONOMIC DEVELOPMENT .......................................................................... 210
APPENDIX L: CROSS-REFERENCE OF IRP REQUIREMENTS AND
SUBSEQUENT ORDERS .................................................................................... 211
ATTACHMENT I: NC REPS COMPLIANCE PLAN .................................................................... 216
ATTACHMENT II: COMPETITIVE PROCUREMENT OF RENEWABLE
ENERGY PLAN .................................................................................................. 248
Duke Energy Progress North Carolina Integrated Resource Plan
2018 Biennial Report PUBLIC
Page 83

This appendix provides an overview of the Company’s quantitative analysis of the resource options
available to meet customers’ future energy needs. Sensitivities on major inputs resulted in multiple
portfolios that were then evaluated under several scenarios that varied fuel prices, capital costs, and
CO2 constraints. These portfolios were analyzed using a least cost analysis to determine the Base
Cases for the 2018 IRP. The selection of these plans considers takes into account the cost to
customers, resource diversity, reliability and the long-term carbon intensity of the system.
The future resource needs were optimized for DEP and DEC independently. However, an
additional case representative of jointly planning future capacity on a DEP/DEC combined system
basis using the Base Case assumptions was also analyzed to demonstrate potential customer
savings, if this option was available in the future.
A. Overview of Analytical Process
The analytical process consists of four steps:
1. Assess resource needs
2. Identify and screen resource options for further consideration
3. Develop portfolio configurations
4. Perform portfolio analysis over various scenarios
1. Assess Resource Needs
The required load and generation resource balance needed to meet future customer demands was
assessed as outlined below:
• Customer peak demand and energy load forecast – identified future customer aggregate
demands to determine system peak demands and developed the corresponding energy
load shape.
• Existing supply-side resources – summarized each existing generation resource’s
operating characteristics including unit capability, potential operational constraints and
life expectancy.
• Operating parameters – determined operational requirements including target planning
reserve margins and other regulatory considerations.
APPENDIX A: QUANTITATIVE ANALYSIS
Duke Energy Progress North Carolina Integrated Resource Plan
2018 Biennial Report PUBLIC
Page 84

Customer load growth, the expiration of purchased power contracts and additional asset retirements
result in resource needs to meet energy and peak demands in the future. The following assumptions
impacted the 2018 resource plan:
➢ Peak Demand and Energy Growth - The growth in winter customer peak demand after the
impact of energy efficiency averaged 0.6% from 2019 through 2033.9 The forecasted
compound annual growth rate for energy is 0.5% after the impacts of energy efficiency
programs are included.
➢ Generation / Purchase Power
o Undesignated short-term purchased power agreements (PPAs) totaling 2,070
MW from December 2019 through December 2023 aid in meeting reserve
requirements over that time period. These PPAs were assumed to have 5-year
contract lives, and therefore, the initial PPAs begin rolling off in December
2024.
o Completion of the 560 MW Asheville CC in November 2019
o Nuclear uprates totaling 52 MW between 2019 and 2024 at Brunswick and
Harris Nuclear plants
➢ Retirements
o Retirement of 384 MW of coal generation at Asheville Steam Station in
November 2019
o Retirement of 514 MW of CT generation (Units 1-4, 6-8, 10) at the Darlington
Plant in December 2020
o Retirement of 232 MW of CT generation at the Weatherspoon and Blewett
Plants in December 2024
o Retirement of 1,053 MW of coal generation at the Roxboro Steam Plant (Units
1&2) in December 2028
➢ Purchase Power Contract Expirations
o Nearly 1,500 MW of purchase power contracts expire between January 2019 and
January 2024
➢ Reserve Margin - A 17% minimum winter planning reserve margin for the planning horizon
9 This growth rate does not match the growth provided in the load forecasting sections. This number includes a 150
MW firm sale through 2024.
Duke Energy Progress North Carolina Integrated Resource Plan
2018 Biennial Report PUBLIC
Page 85

2. Identify and Screen Resource Options for Further Consideration
The IRP process evaluated EE, DSM and traditional and non-traditional supply-side options to
meet customer energy and capacity needs. The Company developed EE and DSM projections
based on existing EE/DSM program experience, the most recent market potential study, input
from its EE/DSM collaborative and cost-effectiveness screening for use in the IRP. Supply-side
options reflect a diverse mix of technologies and fuel sources (gas, nuclear, renewable, and
energy storage). Supply-side options were initially screened based on the following attributes:
• Technical feasibility and commercial availability in the marketplace
• Compliance with all Federal and State requirements
• Long-run reliability
• Reasonableness of cost parameters
The Company compared the capacity size options and operational capabilities of each technology,
with the most cost-effective options of each being selected for inclusion in the portfolio analysis
phase. An overview of resources screened on technical basis and a levelized economic basis is
discussed in Appendix F.
Resource Options:
Supply-Side:
Based on the results of the screening analysis, the following technologies were included in the
quantitative analysis as potential supply-side resource options to meet future capacity needs:
• Base load – 600 MW – Small Modular Reactor (SMR)
• Base load – 1,339 MW – 2x2x1 Advanced Combined Cycle (No Inlet Chiller and Fired)
• Base load – 22 MW – Combined Heat & Power (Combustion Turbine)
• Peaking/Intermediate – 460 MW – 2 x 7FA.05 CTs
o (Based upon the cost to construct 4 units, available for brownfield sites only)
• Peaking/Intermediate – 919 MW 4 x 7FA.05 Combustion Turbines (CTs)
• Renewable – 50 MW Solar PV, Fixed-tilt (FT)
• Renewable – 50 MW Solar PV, Single Axis Tracking (SAT)
• Storage – Grid Tied 20 MW / 80 MWh Li-ion Battery
Duke Energy Progress North Carolina Integrated Resource Plan
2018 Biennial Report PUBLIC
Page 86

Energy Efficiency and Demand-Side Management:
EE and DSM programs continue to be an important part of Duke Energy Progress’ system mix.
The Company considered both EE and DSM programs in the IRP analysis. As described in
Appendix D, EE and DSM measures are compared to generation alternatives to identify
cost-effective EE and DSM programs.
In the Base Case, the Company modeled the program costs associated with EE and DSM based on a
combination of both internal company expectations and projections based on information from the
2016 market potential study. In the DEP and DEC Merger Settlement Agreement, the Company
agreed to aspire to a more aggressive implementation of EE throughout the planning horizon. The
impacts of this goal were incorporated in one of the portfolios evaluated. The program costs used
for this analysis leveraged the Company’s internal projections for the first five years and in the
longer term, utilized the updated market potential study data incorporating the impacts of customer
participation rates over the range of potential programs.
3. Develop Portfolio Configurations
Once the load and generation balance was assessed, and resource options were screened, the
portfolios and scenarios were developed, and the preferred base case was selected, based on the
following simplified diagram.
Duke Energy Progress North Carolina Integrated Resource Plan
2018 Biennial Report PUBLIC
Page 87

Figure A-1: Simplified Process Flow Diagram for Development and Selection of Base Case
The Company conducted a sensitivity analysis of various drivers using the simulation modeling
software, System Optimizer (SO). The expansion plans produced by SO were compared and
seven portfolios that encompass the impact of the range of input sensitivities were identified.
The seven portfolios were then analyzed in multiple scenarios in the hourly production cost
model, PROSYM, to determine the optimum base case. An overview of the base planning
assumptions and sensitivities considered in both SO and PROSYM are outlined below:
• Impact of potential carbon constraints
➢ In the current legislative / regulatory environment, predicting future carbon
constraints is becoming increasingly difficult. In October 2017, the EPA began
the formal process to change EPA rules and repeal the previous administration’s
Clean Power Plan (CPP). With the CPP likely repealed in the next year to two
years, the Company developed an internal CO2 allowance price, or “Base CO2
Price,” which would lead to a 40% CO2 reduction from a 2005 baseline by 2030,
a 50% reduction by 2040, and a 60% reduction by 2050 for the Company’s
regulated utilities (Duke Energy Indiana (DEI), Duke Energy Kentucky (DEK),
Duke Energy Florida (DEF), DEP, and DEC). The “Base CO2 Price” falls
between the expected CPP price on the low end, and the previously proposed
Waxman/Markey legislation on the high end. Additionally, the Company
Duke Energy Progress North Carolina Integrated Resource Plan
2018 Biennial Report PUBLIC
Page 88

developed a “High CO2 Price” that was based on the Waxman-Markey legislation
and the recently proposed “Conservative Plan”. The “High CO2 Price” 10 would
support a CO2 reduction of 80% by 2050. Figure A-2 presents a view of the
carbon prices used in the analysis, along with the Conservative Plan and
Waxman-Markey legislation prices.
▪ Base CO2 Price – Incorporated an intrastate CO2 tax starting at $5/ton in
2025 and escalating at $3/ton annually that was applied to all carbon
emissions.
▪ High CO2 Price – Incorporated an intrastate CO2 tax starting at $5/ton in
2025 and escalating at $7/ton annually that was applied to all carbon
emissions.
Figure A-2: Comparison of CO2 Prices and Other CO2 Reference Prices
2018 CO2 Price Development
10 https://www.clcouncil.org/media/TheConservativeCaseforCarbonDividends.pdf
Duke Energy Progress North Carolina Integrated Resource Plan
2018 Biennial Report PUBLIC
Page 89

• Retirements:
➢ Coal assets – For this IRP, the depreciation book life was used as a placeholder for
future retirement dates for coal assets. Based on this assumption, 1,053 MW of coal
generation were retired at the Roxboro Steam Plant (Units 1&2) in December 2028.
Additionally, per the Mountain Energy Act (NC Senate Bill 716) 384 MW of coal
generation at Asheville Steam Station are required to retire by January 31, 2020.
However, for planning purposes, the Asheville Steam Station is assumed retired when
the Asheville CC enters service in November 2019.
➢ CT assets - For this IRP, the depreciation book life was used as a placeholder for
future retirement dates for CT assets. Based on this assumption, 514 MW of CT
generation (Units 1-4, 6-8, 10) at the Darlington Plant were retired in December 2020.
Additionally, 164 MW of CT generation at the Weatherspoon Plant and 68 MW of CT
generation at the Blewett Plant were assumed retired in December 2024.
• Nuclear assets:
➢ Robinson Nuclear Plant is the oldest DEP nuclear power reactor. Its current
operating license has been extended to 60 years and expires in 2030. NextEra’s
Turkey Point Station and Exelon Corporation’s Peach Bottom plant have each
submitted a Subsequent License Renewal (SLR) application to the Nuclear
Regulatory Commission (NRC). Additionally, Dominion Energy has announced
its intention to pursue SLRs for its Surry and North Anna plants. The Company
views all of its existing nuclear fleet as excellent candidates for license extensions
based on current condition and expected operation expenditures regardless of
future carbon constraints. Based on recent NRC guidance for SLR, the NextEra
and Exelon Corporation application submittals, and the announcement from
Dominion Energy, the Company’s base case assumes SLR for all existing nuclear
generation, including Robinson Nuclear Station, from 60 to 80 years for planning
purposes in this year’s IRP.
▪ A sensitivity was performed assuming SLRs were not pursued for any of
the Company’s nuclear assets.
➢ SMR technology was “screened out” in the Technology Screening phase of the
analysis as discussed in Appendix F. However, given the severity of the “High
Duke Energy Progress North Carolina Integrated Resource Plan
2018 Biennial Report PUBLIC
Page 90

CO2 Price” sensitivity, and the need for zero-emitting, load following resources
(ZELFRs), additional nuclear generation in the form of SMRs was allowed to be
selected.
• Coal and natural gas fuel prices:
➢ Short-term pricing:
▪ Natural Gas based on market prices from 2018 through 2028 transitioning
to 100% fundamental by 2033.
▪ Coal based on market observations through 2022 transitioning to 100%
fundamental by 2028.
➢ Long-term pricing: Based on the Company’s fundamental fuel price projections.
▪ High Fuel Price Sensitivity – A high fuel price sensitivity was developed
where the short-term, or market, natural gas price was increased based on
statistical analysis that produced a +1 Standard Deviation (Std) from the
base market price. The average cumulative probability of the +1 Std was
90% (i.e. in 90% of the cases, the average price will be lower than this
scenario). The long-term pricing component was increased based on the
U.S. Energy Information Administration’s (EIA) Annual Energy Outlook
(AEO) 2018 report which provided a “Low Resource and Technology”
curve.
▪ Low Fuel Price Sensitivity - A low fuel price sensitivity was developed
where the short-term, or market, natural gas price was decreased based on
statistical analysis that produced a -1 Std from the base market price. The
average cumulative probability of the -1 Std was 6.7% (i.e. in 6.7% of the
cases, the average price will be lower than this scenario). The long-term
pricing component was increased based on the U.S. Energy Information
Administration’s (EIA) Annual Energy Outlook (AEO) 2018 report which
provided a “High Resource and Technology” curve.
Duke Energy Progress North Carolina Integrated Resource Plan
2018 Biennial Report PUBLIC
Page 91

• Capital Cost Sensitivities:
➢ As discussed in Appendix F, most technologies include specific Technology
Forecast Factors which were sourced from the Energy Information Administration
(EIA) Annual Energy Outlook (AEO) 2017 which provides costs projections for
various technologies through the planning period as an input to the National Energy
Modeling System (NEMS) utilized by the EIA for the AEO. More nascent
technologies, such as battery storage and, to a lesser extent, PV solar, have relatively
steep projected cost declines over time compared to more established technologies
such as CCs and CTs. The capital cost sensitivities conducted were as follows:
▪ Low Capital Cost – Technology forecast factors were doubled thereby
increasing the cost declines of all technologies over time.
▪ High Capital Cost – Technology forecast factors were reduced by half,
thereby decreasing the rate of cost decline of all technologies over time.
➢ Solar – The base case includes renewable capacity components of the Transition
MW of HB 589 such as capacity required for compliance with NC REPS, PURPA
renewable purchases, the SC DER Program, legacy Green Source Rider program,
and the additional three components of HB 589 (competitive procurement,
renewable energy procurement for large customers, and community solar). The base
case also includes additional projected solar growth beyond HB 589. Below is an
overview of the solar base planning assumptions and the sensitivities performed:
▪ Base – Solar facility costs continue to decrease over the next decade with
a 30% Federal Investment Tax Credit (ITC) through 2019, 26% ITC in
2020, 22% ITC in 2021 and 10% ITC thereafter. Additional solar beyond
compliance was allowed to be selected if economical.
▪ Low Cost - To determine if a lower cost would impact the economic
selection of additional solar resources, a capital cost sensitivity was
performed where solar prices were reduced by 10%.
▪ Higher Solar Penetration – Given the significant volume uncertainty
around solar penetration, a high solar penetration scenario was performed
to account for a number of potential factors that could increase solar
additions over the planning horizon. These factors include events such as
Duke Energy Progress North Carolina Integrated Resource Plan
2018 Biennial Report PUBLIC
Page 92

high carbon prices, lower solar capital costs, economical solar plus storage,
continuation of renewable subsidies, and/or stronger renewable energy
mandates.
• EE and Renewables – Two different options were evaluated with regards to the amount
of EE and Renewables.
➢ Base EE and Base Renewables
▪ Base EE corresponds to the Company’s current projections for achievable
cost-effective EE program acceptance.
▪ Base renewables correspond to the resources needed to meet components
of the Transition MW of HB 589 such as capacity required for compliance
with NC REPS, PURPA renewable purchases, the SC DER Program, legacy
Green Source Rider program, and the additional three components of HB
589 (competitive procurement, renewable energy procurement for large
customers, and community solar). Base renewables also includes additional
projected solar growth beyond HB 589.
➢ High EE and High Renewables
▪ Evaluated to assess the impact of additional EE and renewables on the
expansion plan.
▪ High EE – Established as part of the Progress Energy-Duke Energy
Carolinas Merger Settlement Agreement. The cumulative EE
achievements since 2009 are counted toward the cumulative settlement
agreement impacts. By 2033, the high EE case accounts for an additional
124 MW of winter peak demand reduction versus the base EE case.
▪ High Renewables –Added 1,103 MW of additional solar to the base NC
and SC renewable planning assumptions by 2033 versus the base
renewable case.
➢ While not explicitly evaluated, the impacts of a Low EE future on the expansion,
are similar to the impacts of the “high load” sensitivity that was evaluated in SO
and that is discussed later in this section.
Duke Energy Progress North Carolina Integrated Resource Plan
2018 Biennial Report PUBLIC
Page 93

• Energy Storage:
➢ 140 MW of 4-hour Lithium ion batteries are included in the base case as
placeholders for future assets to provide operational experience on the DEP
system. These placeholders represent a limited amount of grid connected battery
storage projects that have the potential to provide solutions for the transmission
and distribution systems with the possibility of simultaneously providing benefits
to the generation portfolio. As discussed in various sections throughout this
document, the extent to which 4-hour battery storage can provide generation
deferral benefits is still being evaluated, particularly when a single battery
storage installment is expected provide multiple services in addition to
generation and energy benefits. Additionally, the benefits of battery storage are
most realized when the asset is grid-tied and the Company has real-time control
of when the battery storage is dispatched to, or charged from, the system.
The deployment of utility scale battery storage over the next decade will provide
valuable real-world experience for optimizing and assessing the benefits of
battery storage. Given the uncertainties in future battery deployments and the
ability to fully contribute to generation deferral, the Base Case assumes that the
140 MW of placeholder battery storage provides 112 MW (or 80% of nameplate
capacity)11 towards meeting winter peak demand. These assumptions are likely to
change as the Company gains experience operating utility-scale battery storage
technologies. An additional battery storage sensitivity was also considered:
▪ A battery storage sensitivity was also included in which a 575 MW 4-hour
Lithium ion battery replaced a 460 MW CT block in a high renewable
future.
• High and Low Load – The annual average load growth rate before impacts of EE from
2020 through 2033 was increased from 0.8% to 1.5% in the high load sensitivity and the
annual average growth rate was reduced from 0.8% to 0.2% in the low load sensitivity.
11 EPRI’s “Technical Update: Evaluating the Capacity Value of Energy Storage (E. Lannoye & E. Ela, December
2017)” provides several methodologies for calculating capacity value of Energy Storage. The results range from
~40% to 100% of nameplate capacity as potential capacity value. For the purposes of the 2018 IRP, 80% was
selected for planning purposes.
Duke Energy Progress North Carolina Integrated Resource Plan
2018 Biennial Report PUBLIC
Page 94

• A sensitivity was performed assuming joint planning with DEP and DEC to demonstrate
the benefits of shared resources and how new generation could be delayed.
Sensitivity Analysis Results:
A review of the results from the sensitivity analysis conducted in SO yielded some common
themes.
Initial Resource Needs – The first resource need after executing on the 2,070 MW of
undesignated short-term power purchases, occurs in December of 2024 in all cases. The high
EE and low load sensitivities would have the impact of reducing the undesignated short-term
power purchase requirements, but the first need for new generation would still occur in
December 2024. The type of resource selected is consistently a CC regardless of fuel and
carbon assumptions.
• Joint Planning Case - The first three resource needs are CCs, two in DEP, in
2024/2025 and 2026/2027, and one in DEC in 2027/2028. When joint capacity
planning, the DEP CCs are not delayed, but the DEC CC is delayed one year to
2028/2029.
Renewable Generation – The timing of incremental solar beyond the capacity included in the
base case was dependent on the CO2 and fuel price assumptions as shown in Table A-1 below.
It must be noted that incremental solar additions in DEP are only credited with a maximum of
1% contribution to winter peak capacity, and therefore, these incremental solar additions are
only providing energy value and essentially no capacity value.
Table A-1: First Year of Incremental Solar Additions in DEP
No CO2 Base CO2 High CO2
Low Fuel Not Selected 2052 2035
Base Fuel Not Selected 2038 2031
High Fuel 2034 2030 2028
Additionally, in the case where solar prices were reduced by 10%, the first year of incremental
solar additions accelerated from 2038 to 2035 in the Base CO2 / Base Fuel case.
Duke Energy Progress North Carolina Integrated Resource Plan
2018 Biennial Report PUBLIC
Page 95

New Nuclear Selection – New nuclear additions, in the form of SMRs, were selected in the
SO analysis in all High CO2 cases, as well as, in the Base CO2 / High Fuel case. As shown in
Table A-2 below, the timing of new nuclear selection in the High CO2 cases is dependent on
the fuel price assumptions.
Table A-2: First Year of New Nuclear Additions
No CO2 Base CO2 High CO2
Low Fuel Not Selected Not Selected 2051
Base Fuel Not Selected Not Selected 2040
High Fuel Not Selected 2040 2033
In the No SLR scenario for existing nuclear units, the timing for new nuclear generation
accelerated from 2040 to 2036 in the High CO2 / Base Fuel case. As continues to be the
case, in order to meet potentially stringent CO2 emission regulations, new nuclear generation
will likely be needed. The timing of new nuclear generation is highly dependent on fuel
price projections, as well as, subsequent license renewal of the existing nuclear generation
fleet.
High EE and High Renewables – Within the 15-year planning horizon, the impact from High
EE, in combination with High Renewables, was to delay the need for CT generation in 2029
and 2032 by one year each due to the reduction in winter peak demand net of EE impacts.
Gas Firing Technology Options – The number of CCs selected over the planning horizon
varied with the fuel and CO2 assumptions as shown in Table A-3 below, but in all cases,
other than the CT Centric portfolio, the first two generation needs in 2025 and 2027 are met
by CC technology.
Table A-3: Number of CCs Selected in 15-Year Planning Horizon
No CO2 Base CO2 High CO2
Low Fuel 2 2 2
Base Fuel 2 2 3
High Fuel 2 3 3
Duke Energy Progress North Carolina Integrated Resource Plan
2018 Biennial Report PUBLIC
Page 96

Portfolio Development:
Using insights gleaned from the sensitivity analysis, seven portfolios were developed. These
portfolios were developed to assess the relative value of various generating technologies
including CCs, CTs, Renewables, and Nuclear, as well as, energy storage under multiple
scenarios. A description of the seven portfolios follows:
Portfolio 1 (Base CO2 Future)
This portfolio represents a balanced generation portfolio with CCs and CTs making up the
generation mix with incremental solar additions just beyond the 15-year window. While CCs
are the preferred initial generating options in both DEP and DEC, CTs make up the vast
majority of additional resources at the end of the 15-year planning horizon. This portfolio
also includes base EE and renewable assumptions, along with 1,000 MW of economically
selected solar just beyond the planning horizon. Additionally, 140 MW of nameplate battery
storage placeholders are included. These placeholders represent a limited amount of grid
connected battery storage projects that have the potential to provide solutions for the
transmission and distribution systems with the possibility of simultaneously providing
benefits to the generation resource portfolio.
Portfolio 2 (Base No CO2 Future)
Within the 15-year planning horizon, this portfolio is the same as Portfolio 1. Beyond the
planning window, CT technology generally takes precedent over CC technology. No
additional solar was selected in this portfolio. The Base No CO2 portfolio also includes base
EE and renewable assumptions, along with 140 MW of nameplate battery storage
placeholders.
Portfolio 3 (CT Centric)
This portfolio is similar to Portfolio 2. However, the 2027 CC need is replaced with CT
technology to increase the concentration of CTs in this portfolio. Like Portfolio 2, this
portfolio includes base EE and renewable assumptions, and no additionally selected solar.
The portfolio includes 140 MW of nameplate storage placeholders.
Portfolio 4 (CC Centric – No Nuclear Future)
This portfolio represents a future where all existing nuclear assets are retired at the end of
their current extended license period, and those nuclear assets are primarily replaced with
CCs rather than new nuclear generation. The CC Centric Portfolio converts the entire 2029
CT block to CC technology. This portfolio also includes base EE and renewable
Duke Energy Progress North Carolina Integrated Resource Plan
2018 Biennial Report PUBLIC
Page 97

assumptions, along with 1,000 MW of economically selected solar just beyond the planning
horizon. Additionally, 140 MW of nameplate battery storage placeholders are included.
Portfolio 5 (High EE / High Renewables)
This portfolio includes the High EE and High Renewable assumptions in DEP. Solar
nameplate capacity increases at a more rapid pace, and the total MW of solar is 310 MW
greater in the High Renewable case by 2033. This portfolio includes an additional 124 MW
of EE by the end of the planning horizon. Finally, this case also includes 140 MW of
nameplate battery storage placeholders.
Portfolio 6 (CT Centric / High Renewables)
Like Portfolio 3, Portfolio 6 includes a high concentration of CT generation in the 15-year
planning horizon. However, this portfolio includes the High Renewable assumption which
accelerates solar additions in DEP while increasing the total amount of solar by
approximately 300 MW. Portfolio 6 includes Base EE assumptions along with 140 MW of
nameplate battery storage. This portfolio is especially illustrative when evaluating additional
energy storage added in Portfolio 7.
Portfolio 7 (CT Centric with Battery Storage and High Renewables)
This portfolio converts the first 460 MW block of CTs in Portfolio 6 to 575 MW (nameplate)
of 4-hour Lithium-ion battery storage in 2029. The additional 575 MW of battery storage is
assumed to only provide generation and energy transfer capability that is 100% controlled by
the Company. As such, the battery storage installation is assumed to provide 460 MW of
winter peak capacity. The total amount of nameplate battery storage in DEP in this case is
715 MW by 2029.
An overview of the resource needs of each portfolio are shown in Table A-4 below.
Duke Energy Progress North Carolina Integrated Resource Plan
2018 Biennial Report PUBLIC
Page 98

Table A-4: Portfolio Summary for Duke Energy Progress1,2
1 EE represents the cumulative new energy efficiency additions each year. 2 Solar does not include 0.5% annual degradation.
Portfolio 1 (Base CO2 Future)
Portfolio 2 (No CO2 Future)
Portfolio 3 (CT Centric)
Portfolio 4 (CC Centric)
Portfolio 5
(High EE / High
Renewables)
Portfolio 6
(CT Centric / High
Renewables)
Portfolio 7
(CT Centric / High Renewables w/
Battery Storage)
2024
Total Solar = 4061 Total Storage = 101
EE = 120
Total Solar = 4061 Total Storage = 101
EE = 120
Total Solar = 4061 Total Storage = 101
EE = 120
Total Solar = 4061 Total Storage = 101
EE = 120
Total Solar = 4187 Total Storage = 101
EE = 191
Total Solar = 4187 Total Storage = 101
EE = 120
Total Solar = 4187 Total Storage = 101
EE = 120
2025
CC = 1338
Total Solar = 4161
Total Storage = 121 EE = 138
CC = 1338
Total Solar = 4161
Total Storage = 121 EE = 138
CC = 1338
Total Solar = 4161
Total Storage = 121 EE = 138
CC = 1338
Total Solar = 4161
Total Storage = 121 EE = 138
CC = 1338
Total Solar = 4337
Total Storage = 121 EE = 220
CC = 1338
Total Solar = 4337
Total Storage = 121 EE = 138
CC = 1338
Total Solar = 4337
Total Storage = 121 EE = 138
2026
Total Solar = 4215
Total Storage = 141
EE = 155
Total Solar = 4215
Total Storage = 141
EE = 155
Total Solar = 4215
Total Storage = 141
EE = 155
Total Solar = 4215
Total Storage = 141
EE = 155
Total Solar = 4412
Total Storage = 141
EE = 246
Total Solar = 4412
Total Storage = 141
EE = 155
Total Solar = 4412
Total Storage = 141
EE = 155
2027
CC = 1338 Total Solar = 4269
Total Storage = 141
EE = 173
CC = 1338 Total Solar = 4269
Total Storage = 141
EE = 173
CT = 1380 Total Solar = 4269
Total Storage = 141
EE = 173
CC = 1338 Total Solar = 4269
Total Storage = 141
EE = 173
CC = 1338 Total Solar = 4487
Total Storage = 141
EE = 269
CT = 1380 Total Solar = 4487
Total Storage = 141
EE = 173
CT = 1380 Total Solar = 4487
Total Storage = 141
EE = 173
2028
Total Solar = 4323
Total Storage = 141 EE = 187
Total Solar = 4323
Total Storage = 141 EE = 187
Total Solar = 4323
Total Storage = 141 EE = 187
Total Solar = 4323
Total Storage = 141 EE = 187
Total Solar = 4562
Total Storage = 141 EE = 288
Total Solar = 4562
Total Storage = 141 EE = 187
Total Solar = 4562
Total Storage = 141 EE = 187
2029
CT = 1840 Total Solar = 4377
Total Storage = 141
EE = 200
CT = 1840 Total Solar = 4377
Total Storage = 141
EE = 200
CT = 1840 Total Solar = 4377
Total Storage = 141
EE = 200
CC = 1338 CT = 460
Total Solar = 4377
Total Storage = 141 EE = 200
CT = 1380 Total Solar = 4637
Total Storage = 141
EE = 307
CT = 1840 Total Solar = 4637
Total Storage = 141
EE = 200
CT = 1380 Total Solar = 4637
Total Storage = 716
EE = 200
2030
Total Solar = 4431
Total Storage = 141 EE = 211
Total Solar = 4431
Total Storage = 141 EE = 211
Total Solar = 4431
Total Storage = 141 EE = 211
Total Solar = 4431
Total Storage = 141 EE = 211
CT = 460
Total Solar = 4712 Total Storage = 141
EE = 323
Total Solar = 4712
Total Storage = 141 EE = 211
Total Solar = 4712
Total Storage = 716 EE = 211
2031
Total Solar = 4456 Total Storage = 141
EE = 221
Total Solar = 4456 Total Storage = 141
EE = 221
Total Solar = 4456 Total Storage = 141
EE = 221
CT = 920 Total Solar = 4456
Total Storage = 141
EE = 221
Total Solar = 4747 Total Storage = 141
EE = 336
Total Solar = 4747 Total Storage = 141
EE = 221
Total Solar = 4747 Total Storage = 716
EE = 221
2032
CT = 460
Total Solar = 4481
Total Storage = 141 EE = 229
CT = 460
Total Solar = 4481
Total Storage = 141 EE = 229
CT = 460
Total Solar = 4481
Total Storage = 141 EE = 229
CT = 460
Total Solar = 4481
Total Storage = 141 EE = 229
Total Solar = 4782
Total Storage = 141
EE = 349
CT = 460
Total Solar = 4782
Total Storage = 141 EE = 229
CT = 460
Total Solar = 4782
Total Storage = 716 EE = 229
2033
CT = 460
Total Solar = 4506
Total Storage = 141 EE = 236
CT = 460
Total Solar = 4506
Total Storage = 141 EE = 236
CT = 460
Total Solar = 4506
Total Storage = 141 EE = 236
CT = 460
Total Solar = 4506
Total Storage = 141 EE = 236
CT = 920
Total Solar = 4817
Total Storage = 141 EE = 360
CT = 460
Total Solar = 4817
Total Storage = 141 EE = 236
CT = 460
Total Solar = 4817
Total Storage = 716 EE = 236
Total
CC = 2676
CT = 2760
Total Solar = 4506 Total Storage = 141
EE = 236
CC = 2676
CT = 2760
Total Solar = 4506 Total Storage = 141
EE = 236
CC = 1338
CT = 4140
Total Solar = 4506 Total Storage = 141
EE = 236
CC = 4014
CT = 2300
Total Solar = 4506 Total Storage = 141
EE = 236
CC = 2676
CT = 2760
Total Solar = 4817 Total Storage = 141
EE = 360
CC = 1338
CT = 4140
Total Solar = 4817 Total Storage = 141
EE = 236
CC = 1338
CT = 3680
Total Solar = 4817 Total Storage = 716
EE = 236
Duke Energy Progress North Carolina Integrated Resource Plan
2018 Biennial Report PUBLIC
Page 99

4. Perform Portfolio Analysis
Each of the seven portfolios identified in the screening analysis were evaluated in more detail with
an hourly production cost model (PROSYM) under future fuel price and CO2 scenarios to determine
the robustness of each portfolio under varying fuel and carbon futures. The run matrix for the nine
scenarios is summarized in Table A-5 below.
Table A-5: PROSYM Run Matrix for Portfolio Analysis
No CO2 Base CO2 High CO2
Low Fuel
Base Fuel
High Fuel
The PROSYM model provided the system production costs for each portfolio under the scenarios
shown above. The model included DEP’s non-firm energy purchases and sales associated with the
Joint Dispatch Agreement (JDA) with DEC, and as such, the model optimized both DEP and DEC
and provided total system (DEP + DEC) production costs. The PROSYM results were separated to
reflect system production costs that were solely attributed to DEP to account for the impacts of the
JDA. The DEP specific system production costs were then added to the DEP specific capital costs
for each portfolio to develop the total Present Value of Revenue Requirements (PVRR) for each
portfolio under the given fuel price and CO2 conditions.
The seven portfolios were ranked in each of the nine fuel and carbon scenarios, and the portfolio
with the lowest PVRR in each of the nine scenarios was identified.
Additionally, high and low capital cost sensitivities were conducted to determine if varying future
price projections for each technology would impact the results of the scenario analysis.
PVRR Results:
Table A-6 below reflects the portfolio that performed best (i.e. lowest PVRR) under each scenario,
as well as, the delta PVRR to the next lowest portfolio (“Port”).
Duke Energy Progress North Carolina Integrated Resource Plan
2018 Biennial Report PUBLIC
Page 100

Table A-6: Lowest PVRR (thru 2068) Portfolios Under Each Scenario
(2018 dollars in Millions)
PVRR thru 2068
(2018 $M) No CO2 Base CO2 High CO2
Low Fuel Portfolio 2
(-$132 M vs Port 3)
Portfolio 1
(-$84 M vs Port 2)
Portfolio 1
(-$409 M vs Port 2)
Base Fuel Portfolio 2
(-$17 M vs Port 1)
Portfolio 1
(-$231 M vs Port 2)
Portfolio 1
(-$536 M vs Port 2)
High Fuel Portfolio 1
(-$257 M vs Port 2)
Portfolio 1
(-$493 M vs Port 2)
Portfolio 1
(-$533 M vs Port 5)
The following table summarizes the total PVRR for each portfolio in the scenarios above versus
Portfolio 1.
Table A-7: Total PVRR (thru 2068) Comparison of All Portfolios vs Portfolio 1 (2018 dollars
in Millions)
Portfolio 2
(Base No
CO2 Future)
Portfolio 3
(CT Centric)
Portfolio 4
(CC Centric)
Portfolio 5
(High EE /
High Renew)
Portfolio 6
(CT Centric /
High Renew)
Portfolio 7
(CT Centric /
High Renew
w/ Batt
Storage)
Base Fuel /
Base CO2 $231 $798 $8,116 $565 $1,119 $702
Base Fuel /
High CO2 $536 $1,486 $10,839 $560 $1,682 $1,060
Base Fuel /
No CO2 ($17) $264 $5,784 $583 $667 $483
High Fuel /
BaseCO2 $493 $1,226 $10,871 $532 $1,427 $847
High Fuel /
High CO2 $759 $1,885 $13,602 $533 $1,977 $1,143
High Fuel /
No CO2 $257 $667 $8,586 $553 $979 $606
Low Fuel /
Base CO2 $84 $503 $6,515 $598 $876 $656
Low Fuel /
High CO2 $409 $1,177 $9,301 $574 $1,430 $984
Low Fuel /
No CO2 ($183) ($51) $4,182 $595 $447 $384
Duke Energy Progress North Carolina Integrated Resource Plan
2018 Biennial Report PUBLIC
Page 101

In addition to the sensitivities conducted above, capital cost sensitivities were also conducted. In the
low capital cost sensitivity, technology specific forecast factors were decreased (i.e. greater cost
declines in technology costs over time). In the high capital cost sensitivity, technology specific
forecast factors were increased (i.e. lower cost declines in technology costs over time). One
example of the impact of these cost sensitivities, is the impact on project costs of 4-hour Lithium ion
battery storage. In the base case, battery storage costs are projected to drop by nearly 40% by 2025
in real terms. In the low and high capital cost sensitivities, battery storage costs are projected to
drop by slightly over 60% and slightly over 20% respectively, by 2025. The results on the lowest
PVRR portfolios due to these capital costs sensitivities are shown in Tables A-8 and A-9.
Table A-8: Lowest PVRR (thru 2068) Portfolios Under Each Scenario –
Low Capital Cost Sensitivity (2018 dollars in Millions)
PVRR thru 2068
(2018 $M) No CO2 Base CO2 High CO2
Low Fuel Portfolio 2
(-$6 M vs Port 1)
Portfolio 1
(-$260 M vs Port 2)
Portfolio 1
(-$586 M vs Port 5)
Base Fuel Portfolio 1
(-$60 M vs Port 2)
Portfolio 1
(-$408 M vs Port 2)
Portfolio 1
(-$579 M vs Port 5)
High Fuel Portfolio 1
(-$351 M vs Port 7)
Portfolio 1
(-$551 M vs Port 5)
Portfolio 1
(-$552 M vs Port 5)
Duke Energy Progress North Carolina Integrated Resource Plan
2018 Biennial Report PUBLIC
Page 102

Table A-9: Lowest PVRR (thru 2068) Portfolios Under Each Scenario –
High Capital Cost Sensitivity (2018 dollars in Millions)
PVRR thru 2068
(2018 $M) No CO2 Base CO2 High CO2
Low Fuel Portfolio 2
(-$137 M vs Port 3)
Portfolio 2
(-$44 M vs Port 2)
Portfolio 1
(-$282 M vs Port 2)
Base Fuel Portfolio 2
(-$144 M vs Port 1)
Portfolio 1
(-$104 M vs Port 2)
Portfolio 1
(-$409 M vs Port 2)
High Fuel Portfolio 1
(-$129 M vs Port 2)
Portfolio 1
(-$366 M vs Port 2)
Portfolio 1
(-$448 M vs Port 5)
CO2 Emissions:
Over the next 15 years, and beyond, Portfolio 1 provides significant CO2 emission reductions as
shown in Figure A-3 below. Only Portfolio 5 (High EE / High Renewables) provides similar or
increased carbon reductions over the life of the plan. Additionally, if existing nuclear generation
was not extended in DEP, or was not replaced with new nuclear generation, CO2 emissions would
rise significantly as each nuclear plant was retired as shown in Portfolio 4 (Yellow).
Duke Energy Progress North Carolina Integrated Resource Plan
2018 Biennial Report PUBLIC
Page 103

Figure A-3: DEP + DEC Carbon Emissions Summary – All Portfolios
Conclusions:
Base CO2 Portfolio Selection:
For planning purposes, Duke Energy considers both a carbon constrained future and a non-carbon
constrained future in the development of the base case portfolios. As the base planning assumption.
If a carbon constrained future is either delayed or is more restrictive than the base plan, or other
variables such as fuel price and capital costs change significantly from the base assumptions, the
selected carbon constrained portfolio should be adequately robust to still provide value in those
futures. Another factor that is considered when selecting the base portfolio is the likelihood that the
selected portfolio can be executed as shown. Under those considerations, the Company selected
Portfolio 1 (Base CO2 Future) as the base portfolio for planning assumptions.
Portfolio 1 includes a diverse compilation of resources including CCs, CTs, battery storage, and
increasing amounts of EE/DSM and solar resources in conjunction with existing nuclear, natural
gas, renewables and other assets already on the DEP system. This portfolio also enables the
Duke Energy Progress North Carolina Integrated Resource Plan
2018 Biennial Report PUBLIC
Page 104

Company to lower carbon emissions under a range of future scenarios at a lower cost than most
other scenarios.
Finally, the Carbon Constrained Base Case was developed utilizing consistent assumptions and
analytic methods between DEP and DEC, where appropriate. This case does not consider the
sharing of capacity between DEP and DEC. However, the Base Case incorporates the JDA between
DEP and DEC, which represents a non-firm energy only commitment between the Companies. A
Joint Planning Case that explores the potential for DEP and DEC to share firm capacity was also
developed and is discussed later in this chapter and in Appendix A.
No CO2 Portfolio Selection:
While Duke Energy presents a base resource plan that was developed under a carbon constrained
future, the Company also provides a No Carbon Base Case expansion plan that reflects a future
without CO2 constraints. In DEP, this expansion plan is represented by Portfolio 2 (Base No CO2
Future). There is no difference between the Carbon Constrained Base Case and the No Carbon
Base Case over the 15-year planning horizon. However, beyond the 15-year window, CT
technology generally takes precedent over CC technology. Because of the trend towards CT
technology and the absence of incremental solar in the years just after the planning window,
Portfolio 2 has a lower capital cost and a slightly lower PVRR than Portfolio 1 in the Base Fuel / No
CO2 scenario.
Other Findings:
Based on the analysis discussed above, other observations regarding the future of nuclear, solar and
battery storage assets on the system can be made.
• Existing nuclear assets
o Portfolio 4 (CC Centric) represents a future where licenses for existing
nuclear assets are allowed to expire and those nuclear assets are mainly
replaced with CC technology. This portfolio increases capital costs versus
the base portfolio as nuclear assets are retired and replaced with CCs, and,
the system production cost penalty of replacing nuclear assets that provide
nearly 50% of the Company’s energy at almost zero fuel cost and zero
CO2 emissions, with CC technology is severe. While retiring existing
nuclear assets may provide more value if new nuclear technology such as
Duke Energy Progress North Carolina Integrated Resource Plan
2018 Biennial Report PUBLIC
Page 105

SMRs become more established at lower costs, current projections show
that maintaining the option to continue operating the Company’s existing
nuclear fleet provides value for the Company and its customers.
• Renewables
o The level of solar generation in DEP is significant and increasing.
Increasing solar generation on the DEP system is likely to cause additional
operational issues and costs as more conventional generating assets are
required to provide additional ancillary services to manage the
intermittency of solar generation. The addition of incremental solar and
EE in Portfolio 5 caused a PVRR increase of at least $500M in all cases.
Even in a CT Centric future, where there is a greater concentration of
energy limited resources, the addition of solar led to an increase in PVRR
in all scenarios.
• Battery Storage
o Portfolio 7 (CT Centric / High Renewables / Battery Storage) was
developed off Portfolio 6 (CT Centric / High Renewables). In Portfolio
7, a 460 MW block of CT generation in the winter of 2028/2029 was
converted to 575 MW of battery storage. While the total cost of Portfolio
7 was significantly higher than Portfolio 1, the addition of battery storage
improved the PVRR versus Portfolio 6 by as much as $800M in a high
fuel / high CO2 scenario. While this case shows potential cost savings
associated with battery storage, it is important to consider several factors
including:
• Based on the provided cost curves, battery storage costs are
projected to decline 50% by 2028.
• The value shown in this scenario is for incremental battery
storage added to a portfolio that already includes 140 MW of
4-hour battery storage in DEP. As with all assets, whether
CCs, CTs, solar, or nuclear, there is a point of diminishing
returns as more storage is added to the system. It is unclear
from this analysis, where battery storage falls on that value
curve. As a point of reference, a similar analysis was conducted
Duke Energy Progress North Carolina Integrated Resource Plan
2018 Biennial Report PUBLIC
Page 106

in the DEC IRP, and in that case, adding battery storage to the
system created a cost increase. At least wo potential reasons
for this difference are 1) DEC already includes 2,400 MW of
storage in the form of pumped hydro storage, and 2) DEC has
overall less MW of solar which could be limiting the benefits
of additional storage in DEC.
• The battery storage in this case is a grid tied asset that can be
charged with system energy. It is likely that the battery’s value
would diminish if it were only allowed to charge with solar
energy. In that case, the battery would lose the value of being
charged with off-peak energy that is generated when solar is
not available.
• The model assumes the Company has real-time control of the
battery to maximize the battery’s value. Without real-time
control, the value of the battery on the DEP system is limited.
• While these results suggest that battery storage may have value
as a generation deferral and energy arbitrage asset, it is
possible that the value of battery storage may be even greater
under other applications such as distribution or transmission
asset deferral. Additionally, and as discussed elsewhere in this
document, the value of battery storage for generation deferral,
energy arbitrage, and/or ancillary services may be diminished
if the battery is also providing support for voltage control,
distribution asset deferral, or emergency back-up power as part
of other use cases.
To better understand the true value of battery storage in DEP, it is important
for the Company to operate utility storage on its system to properly evaluate
the abilities and value of battery storage.
Value of Joint Planning:
To demonstrate the value of sharing capacity with DEC, a Joint Planning Case was developed to
examine the impact of joint capacity planning on the resource plans. The impacts were determined
by comparing how the combined Base Cases of DEP and DEC would change if a 17% minimum
Duke Energy Progress North Carolina Integrated Resource Plan
2018 Biennial Report PUBLIC
Page 107

winter planning reserve margin was applied at the combined system level, rather than the individual
company level.
An evaluation was performed comparing the optimally selected Portfolio 1 for DEP and DEC to a
combined Joint Planning Case in which existing and future capacity resources could be shared
between DEP and DEC to meet the 17% minimum winter planning reserve margin. Table A-10
shows the base expansion plans (Portfolio 1 for both DEP and DEC) through 2033, if separately
planned, compared to the Joint Planning Case. The total of the two combined resource requirements
is then compared to the amount of resources needed if DEP and DEC could jointly plan for
capacity. Years where the Joint Planning Case differs from the individual Utility cases are
highlighted.
Duke Energy Progress North Carolina Integrated Resource Plan
2018 Biennial Report PUBLIC
Page 108
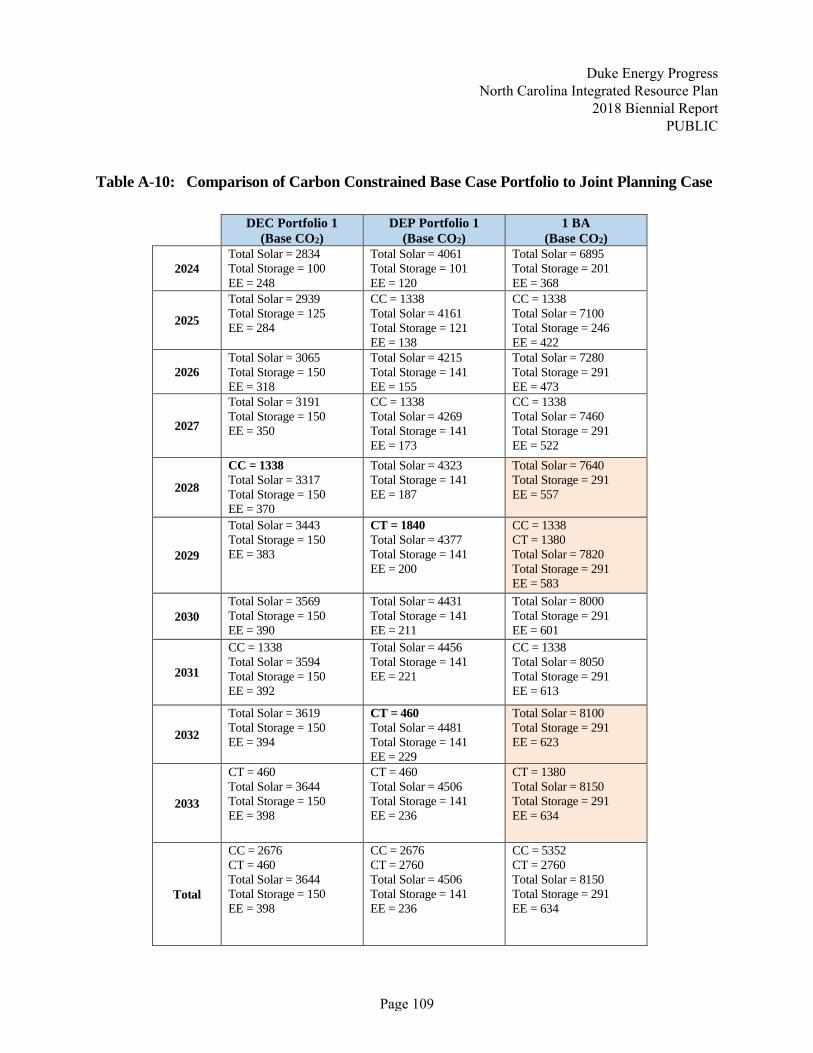
Table A-10: Comparison of Carbon Constrained Base Case Portfolio to Joint Planning Case
DEC Portfolio 1
(Base CO2)
DEP Portfolio 1
(Base CO2)
1 BA
(Base CO2)
2024
Total Solar = 2834
Total Storage = 100
EE = 248
Total Solar = 4061
Total Storage = 101
EE = 120
Total Solar = 6895
Total Storage = 201
EE = 368
2025
Total Solar = 2939
Total Storage = 125
EE = 284
CC = 1338
Total Solar = 4161
Total Storage = 121
EE = 138
CC = 1338
Total Solar = 7100
Total Storage = 246
EE = 422
2026
Total Solar = 3065
Total Storage = 150
EE = 318
Total Solar = 4215
Total Storage = 141
EE = 155
Total Solar = 7280
Total Storage = 291
EE = 473
2027
Total Solar = 3191
Total Storage = 150
EE = 350
CC = 1338
Total Solar = 4269
Total Storage = 141
EE = 173
CC = 1338
Total Solar = 7460
Total Storage = 291
EE = 522
2028
CC = 1338
Total Solar = 3317
Total Storage = 150
EE = 370
Total Solar = 4323
Total Storage = 141
EE = 187
Total Solar = 7640
Total Storage = 291
EE = 557
2029
Total Solar = 3443
Total Storage = 150
EE = 383
CT = 1840
Total Solar = 4377
Total Storage = 141
EE = 200
CC = 1338
CT = 1380
Total Solar = 7820
Total Storage = 291
EE = 583
2030
Total Solar = 3569
Total Storage = 150
EE = 390
Total Solar = 4431
Total Storage = 141
EE = 211
Total Solar = 8000
Total Storage = 291
EE = 601
2031
CC = 1338
Total Solar = 3594
Total Storage = 150
EE = 392
Total Solar = 4456
Total Storage = 141
EE = 221
CC = 1338
Total Solar = 8050
Total Storage = 291
EE = 613
2032
Total Solar = 3619
Total Storage = 150
EE = 394
CT = 460
Total Solar = 4481
Total Storage = 141
EE = 229
Total Solar = 8100
Total Storage = 291
EE = 623
2033
CT = 460
Total Solar = 3644
Total Storage = 150
EE = 398
CT = 460
Total Solar = 4506
Total Storage = 141
EE = 236
CT = 1380
Total Solar = 8150
Total Storage = 291
EE = 634
Total
CC = 2676
CT = 460
Total Solar = 3644
Total Storage = 150
EE = 398
CC = 2676
CT = 2760
Total Solar = 4506
Total Storage = 141
EE = 236
CC = 5352
CT = 2760
Total Solar = 8150
Total Storage = 291
EE = 634
Duke Energy Progress North Carolina Integrated Resource Plan
2018 Biennial Report PUBLIC
Page 109

A comparison of the DEP and DEC Combined Base Case resource requirements to the Joint
Planning Scenario requirements illustrates the ability to defer a CC and CT resource in the late
2020s. Consequently, the Joint Planning Case also results in a lower overall reserve margin. This is
confirmed by a review of the reserve margins for the Combined Base Case as compared to the Joint
Planning Case, which averaged 20.3% and 19.5%, respectively, from the first resource need in 2020
through 2033. The lower reserve margin in the Joint Planning Case indicates that DEC and DEP
more efficiently and economically meet capacity needs when planning for capacity jointly. This is
reflected in a capital PVRR savings of $250 million for the Joint Planning Case as compared to the
Combined Base Case. Though not included in the Joint Planning Case analysis, the ability to share
capacity between DEP and DEC would also limit the amount of undesignated short-term market
purchases identified in the 2020 to 2024 timeframe in DEP.
B. Quantitative Analysis Summary
The quantitative analysis resulted in several key takeaways that are important for near-term
decision-making, as well as in planning for the longer term.
1. Following procurement of the undesignated short-term market purchases in 2020 through
the winter of 2023/2024, the first undesignated resource need is in December of 2024 to
meet the minimum reserve margin requirement in the winter of 2024/2025. The results
of this analysis show that this need is best met with CC generation.
2. The ability to jointly plan capacity with DEC provides customer savings by allowing for
the deferral of new generation resources over the 15-year planning horizon.
3. Nuclear generation, whether relicensing or new build, is essential for continuing to lower
CO2 emissions on the system.
Battery storage may provide value in DEP as intermittent energy resources increase on the
system. However, since the value is highly dependent on continued steep cost declines of the
technology, and the specific use case of the battery, it is prudent to continue monitoring battery
storage costs while testing their capabilities on the DEP system.
Duke Energy Progress North Carolina Integrated Resource Plan
2018 Biennial Report PUBLIC
Page 110

APPENDIX B: DUKE ENERGY PROGRESS OWNED GENERATION
Duke Energy Progress’ generation portfolio includes a balanced mix of resources with different
operating and fuel characteristics. This mix is designed to provide energy at the lowest
reasonable cost to meet the Company’s obligation to serve its customers. Duke Energy Progress-
owned generation, as well as purchased power, is evaluated on a real-time basis in order to select
and dispatch the lowest-cost resources to meet system load requirements.
The tables below list the Duke Energy Progress’ plants in service in North Carolina (NC) and
South Carolina (SC) with plant statistics, and the system’s total generating capability.
Existing Generating Units and Ratings 1, 3
All Generating Unit Ratings are as of July 1, 2018 unless otherwise noted.
Coal
Unit Winter
(MW)
Summer
(MW) Location Fuel Type
Resource
Type
Asheville 1 192 189 Arden, NC Coal Intermediate
Asheville 2 192 189 Arden, NC Coal Intermediate
Mayo 2 1 746 727 Roxboro, NC Coal Intermediate
Roxboro 1 380 379 Semora, NC Coal Intermediate
Roxboro 2 673 668 Semora, NC Coal Intermediate
Roxboro 3 698 694 Semora, NC Coal Intermediate
Roxboro 2 4 711 698 Semora, NC Coal Intermediate
Total Coal 3,592 3,544
Duke Energy Progress North Carolina Integrated Resource Plan
2018 Biennial Report PUBLIC
Page 111

Combustion Turbines
Unit Winter
(MW)
Summer
(MW) Location Fuel Type
Resource
Type
Asheville 3 185 160 Arden, NC Natural Gas/Oil Peaking
Asheville 4 185 160 Arden, NC Natural Gas/Oil Peaking
Blewett 1 17 13 Lilesville, NC Oil Peaking
Blewett 2 17 13 Lilesville, NC Oil Peaking
Blewett 3 17 13 Lilesville, NC Oil Peaking
Blewett 4 17 13 Lilesville, NC Oil Peaking
Darlington 1 63 50 Hartsville, SC Natural Gas/Oil Peaking
Darlington 2 64 48 Hartsville, SC Oil Peaking
Darlington 3 63 50 Hartsville, SC Natural Gas/Oil Peaking
Darlington 4 66 48 Hartsville, SC Oil Peaking
Darlington 6 62 43 Hartsville, SC Oil Peaking
Darlington 7 65 47 Hartsville, SC Natural Gas/Oil Peaking
Darlington 8 66 44 Hartsville, SC Oil Peaking
Darlington 10 65 49 Hartsville, SC Oil Peaking
Darlington 12 133 118 Hartsville, SC Natural Gas/Oil Peaking
Darlington 13 133 116 Hartsville, SC Natural Gas/Oil Peaking
Smith 4 1 189 157 Hamlet, NC Natural Gas/Oil Peaking
Smith 4 2 187 156 Hamlet, NC Natural Gas/Oil Peaking
Smith 4 3 185 155 Hamlet, NC Natural Gas/Oil Peaking
Smith 4 4 186 159 Hamlet, NC Natural Gas/Oil Peaking
Smith 4 6 187 145 Hamlet, NC Natural Gas/Oil Peaking
Sutton 4 49 39 Wilmington, NC Natural Gas/Oil Peaking
Sutton 5 49 39 Wilmington, NC Natural Gas/Oil Peaking
Wayne 1/10 192 177 Goldsboro, NC Oil/Natural Gas Peaking
Wayne 2/11 192 174 Goldsboro, NC Oil/Natural Gas Peaking
Wayne 3/12 193 173 Goldsboro, NC Oil/Natural Gas Peaking
Wayne 4/13 191 170 Goldsboro, NC Oil/Natural Gas Peaking
Wayne 5/14 195 163 Goldsboro, NC Oil/Natural Gas Peaking
Weatherspoon 1 41 31 Lumberton, NC Natural Gas/Oil Peaking
Weatherspoon 2 41 31 Lumberton, NC Natural Gas/Oil Peaking
Weatherspoon 3 41 32 Lumberton, NC Natural Gas/Oil Peaking
Weatherspoon 4 41 30 Lumberton, NC Natural Gas/Oil Peaking
Total NC 2,597 2,203
Total SC 780 613
Total CT 3,377 2,816
Duke Energy Progress North Carolina Integrated Resource Plan
2018 Biennial Report PUBLIC
Page 112

Combined Cycle
Unit Winter
(MW)
Summer
(MW) Location Fuel Type
Resource
Type
Lee CT1A 225 170 Goldsboro, NC Natural Gas/Oil Base
Lee CT1B 227 170 Goldsboro, NC Natural Gas/Oil Base
Lee CT1C 228 170 Goldsboro, NC Natural Gas/Oil Base
Lee ST1 379 378 Goldsboro, NC Natural Gas/Oil Base
Smith 4 CT7 189 154 Hamlet, NC Natural Gas/Oil Base
Smith 4 CT8 189 153 Hamlet, NC Natural Gas/Oil Base
Smith 4 ST4 175 169 Hamlet, NC Natural Gas/Oil Base
Smith 4 CT9 216 174 Hamlet, NC Natural Gas/Oil Base
Smith 4 CT10 216 175 Hamlet, NC Natural Gas/Oil Base
Smith 4 ST5 248 248 Hamlet, NC Natural Gas/Oil Base
Sutton
Sutton
Sutton
CT1A
CT1B
ST1
224
224
271
170
171
266
Wilmington, NC
Wilmington, NC
Wilmington, NC
Natural Gas/Oil
Natural Gas/Oil
Natural Gas/Oil
Base
Base
Base
Total CC 3,011 2,568
Hydro
Unit Winter
(MW)
Summer
(MW) Location Fuel Type
Resource
Type
Blewett 1 4 4 Lilesville, NC Water Intermediate
Blewett 2 4 4 Lilesville, NC Water Intermediate
Blewett 3 4 4 Lilesville, NC Water Intermediate
Blewett 4 5 5 Lilesville, NC Water Intermediate
Blewett 5 5 5 Lilesville, NC Water Intermediate
Blewett 6 5 5 Lilesville, NC Water Intermediate
Marshall 1 2 2 Marshall, NC Water Intermediate
Marshall 2 2 2 Marshall, NC Water Intermediate
Tillery 1 21 21 Mt. Gilead, NC Water Intermediate
Tillery 2 18 18 Mt. Gilead, NC Water Intermediate
Tillery 3 21 21 Mt. Gilead, NC Water Intermediate
Tillery 4 24 24 Mt. Gilead, NC Water Intermediate
Walters 1 36 36 Waterville, NC Water Intermediate
Walters 2 40 40 Waterville, NC Water Intermediate
Walters 3 36 36 Waterville, NC Water Intermediate
Total Hydro 227 227
Duke Energy Progress North Carolina Integrated Resource Plan
2018 Biennial Report PUBLIC
Page 113

Nuclear
Unit Winter
(MW)
Summer
(MW) Location Fuel Type
Resource
Type
Brunswick 2 1 975 938 Southport, NC Uranium Base
Brunswick2 2 953 932 Southport, NC Uranium Base
Harris 2 1 980 932 New Hill, NC Uranium Base
Robinson 2 797 741 Hartsville, SC Uranium Base
Total NC 2,908 2,802
Total SC 797 741
Total Nuclear 3,705 3,543
Solar
Unit Winter
(MW)
Summer
(MW) Location Fuel Type
Resource
Type
NC Solar 7.1 62.0 NC Solar Intermittent
Total Generation Capability
Winter Capacity (MW) Summer Capacity (MW)
TOTAL DEP SYSTEM - N.C. 12,342 11,406
TOTAL DEP SYSTEM - S.C. 1,577 1,354
TOTAL DEP SYSTEM 13,919 12,760
Note 1: Ratings reflect compliance with NERC reliability standards.
Note 2: Duke Energy Progress completed the purchase from NCEMC of jointly owned Roxboro 4, Mayo 1,
Brunswick 1 & 2 and Harris 1units effective 7/31/2015.
Note 3: Resource type based on NERC capacity factor classifications which may alternate over the forecast
period.
Note 4: Richmond County Plant renamed to Sherwood H. Smith Jr. Energy Complex.
Note 5: Solar capacity ratings reflect contribution to winter and summer peak values.
Duke Energy Progress North Carolina Integrated Resource Plan
2018 Biennial Report PUBLIC
Page 114

Note 1: Capacity not reflected in Existing Generating Units and Ratings section.
Planned Uprates
Unit Completion Date Winter
MW
Summer
MW
Brunswick 1 1 Spring 2020 4 2
Brunswick 2 1 Spring 2019 6 4
Brunswick 2 1 Spring 2023 6 4
Brunswick 2 1 Spring 2027 4 2
Brunswick 2 1 Spring 2021 6 4
Harris 11 Spring 2018 30 30
Duke Energy Progress North Carolina Integrated Resource Plan
2018 Biennial Report PUBLIC
Page 115

Retirements
Unit & Plant
Name Location
Capacity (MW)
Winter / Summer
Fuel
Type
Retirement
Date
Cape Fear 5 Moncure, NC 148 144 Coal 10/1/12
Cape Fear 6 Moncure, NC 175 172 Coal 10/1/12
Cape Fear 1A Moncure, NC 14 11 Combustion Turbine 3/31/13
Cape Fear 1B Moncure, NC 14 12 Combustion Turbine 3/31/13
Cape Fear 2A Moncure, NC 15 12 Combustion Turbine 3/31/13
Cape Fear 2B Moncure, NC 14 11 Combustion Turbine 10/1/12
Cape Fear 1 Moncure, NC 12 11 Steam Turbine 3/31/11
Cape Fear 2 Moncure, NC 12 7 Steam Turbine 3/31/11
Darlington 5 Hartsville, SC 66 51 Combustion Turbine 5/31/2018
Darlington 9 Hartsville, SC 65 50 Combustion Turbine 6/30/17
Darlington 11 Hartsville, SC 67 52 Combustion Turbine 11/8/15
Lee 1 Goldsboro, NC 80 74 Coal 9/15/12
Lee 2 Goldsboro, NC 80 68 Coal 9/15/12
Lee 3 Goldsboro, NC 252 240 Coal 9/15/12
Lee 1 Goldsboro, NC 15 12 Combustion Turbine 10/1/12
Lee 2 Goldsboro, NC 27 21 Combustion Turbine 10/1/12
Lee 3 Goldsboro, NC 27 21 Combustion Turbine 10/1/12
Lee 4 Goldsboro, NC 27 21 Combustion Turbine 10/1/12
Morehead 1 Morehead City, NC 15 12 Combustion Turbine 10/1/12
Robinson 1 Hartsville, SC 179 177 Coal 10/1/12
Robinson 1 Hartsville, SC 15 11 Combustion Turbine 3/31/13
Weatherspoon 1 Lumberton, NC 49 48 Coal 9/30/11
Weatherspoon 2 Lumberton, NC 49 48 Coal 9/30/11
Weatherspoon 3 Lumberton, NC 79 74 Coal 9/30/11
Sutton 1 Wilmington, NC 98 97 Coal 11/27/13
Sutton 2 Wilmington, NC 95 90 Coal 11/27/13
Sutton 3 Wilmington, NC 389 366 Coal 11/4/13
Sutton GT1 Wilmington, NC 12 11 Combustion Turbine 3/1/2017
Darlington 9 Hartsville, SC 65 50 Combustion Turbine 6/30/2017
Sutton GTA Wilmington, NC 31 23 Combustion Turbine 7/8/2017
Sutton GTB Wilmington, NC 33 25 Combustion Turbine 7/8/2017
Total 2,219 MW 2,022 MW
Duke Energy Progress North Carolina Integrated Resource Plan
2018 Biennial Report PUBLIC
Page 116

Planning Assumptions – Unit Retirements a, b
Unit & Plant
Name Location
Winter
Capacity
(MW)
Summer
Capacity
(MW)
Fuel Type Expected
Retirement
Asheville 1 Arden, N.C. 192 189 Coal 11/2019
Asheville 2 Arden, N.C. 192 189 Coal 11/2019
Mayo 1 Roxboro, N.C. 746 727 Coal 12/2035
Roxboro 1 Semora, N.C. 380 379 Coal 12/2028
Roxboro 2 Semora, N.C. 673 665 Coal 12/2028
Roxboro 3 Semora, N.C. 698 691 Coal 12/2033
Roxboro 4 Semora, N.C. 711 698 Coal 12/2033
Darlington 1 Hartsville, S.C. 63 52 Natural Gas/Oil 12/2020
Darlington 2 Hartsville, S.C. 64 48 Oil 12/2020
Darlington 3 Hartsville, S.C. 63 52 Natural Gas/Oil 12/2020
Darlington 4 Hartsville, S.C. 66 50 Oil 12/2020
Darlington 6 Hartsville, S.C. 62 45 Oil 12/2020
Darlington 7 Hartsville, S.C. 65 51 Natural Gas/Oil 12/2020
Darlington 8 Hartsville, S.C. 66 48 Oil 12/2020
Darlington 10 Hartsville, S.C. 65 51 Oil 12/2020
Blewett 1 Lilesville, N.C. 17 13 Oil 12/2024
Blewett 2 Lilesville, N.C. 17 13 Oil 12/2024
Blewett 3 Lilesville, N.C. 65 13 Oil 12/2024
Blewett 4 Lilesville, N.C. 66 13 Oil 12/2024
Weatherspoon 1 Lumberton, N.C. 41 32 Natural Gas/Oil 12/2024
Weatherspoon 2 Lumberton, N.C. 41 32 Natural Gas/Oil 12/2024
Weatherspoon 3 Lumberton, N.C. 41 33 Natural Gas/Oil 12/2024
Weatherspoon 4 Lumberton, N.C. 41 31 Natural Gas/Oil 12/2024
Total 4,435 4,115
Note a: Retirement assumptions are for planning purposes only; retirement dates are based on the depreciation study
approved as part of the most recent DEP rate case.
Note b: For planning purposes, the 2018 IRP Base Case assumes subsequent license renewal for existing nuclear
facilities beginning at end of current operating licenses.
Duke Energy Progress North Carolina Integrated Resource Plan
2018 Biennial Report PUBLIC
Page 117

Planning Assumptions – Unit Additions
Unit & Plant
Name Location
Winter
Capacity
(MW)
Summer
Capacity
(MW) Fuel Type
Expected
Commercial
Date
Asheville CC Arden, N.C. 560 495 Natural Gas 11/2019
Operating License Renewal
Planned Operating License Renewal
Unit &
Plant Name Location
Original
Operating
License
Expiration
Date of
Approval
Extended Operating
License Expiration
Blewett #1-6 1 Lilesville, NC 04/30/08 April 2015 2055
Tillery #1-4 1 Mr. Gilead, NC 04/30/08 April 2015 2055
Robinson #2 Hartsville, SC 07/31/10 04/19/2004 07/31/2030
Brunswick #2 Southport, NC 12/27/14 06/26/2006 12/27/2034
Brunswick #1 Southport, NC 09/08/16 06/26/2006 09/08/2036
Harris #1 New Hill, NC 10/24/26 12/12/2008 10/24/2046
Note 1: The license renewal for the Blewett and Tillery Plants was received in April 2015. The license extension was
granted for 40 years.
Duke Energy Progress North Carolina Integrated Resource Plan
2018 Biennial Report PUBLIC
Page 118
APPENDIX C: ELECTRIC LOAD FORECAST
Methodology:
The Duke Energy Progress spring 2018 forecast provides projections of the energy and peak
demand needs for its service area. The forecast covers the time period of 2019 – 2033 and
represents the needs of the following customer classes:
• Residential
• Commercial
• Industrial
• Other Retail
• Wholesale
Energy projections are developed with econometric models using key economic factors such as
income, electricity prices, industrial production indices, along with weather, appliance efficiency
trends, rooftop solar trends, and electric vehicle trends. Population is also used in the residential
customer model.
The economic projections used in the Spring 2018 Forecast are obtained from Moody’s Analytics, a
nationally recognized economic forecasting firm, and include economic forecasts for the states of
North and South Carolina.
Moody’s Analytics supplies the Company with economic and demographic projections, which are
used in the energy and demand models. Preliminary analysis of Moody’s historical projections
versus actuals resulted in smaller variances and minimum bias during normal economic
periods. However, the likelihood of greater forecast variance and forecast bias increases during
unique disruptive economic periods like the Great Recession. The Load Forecasting team will
continue to monitor Moody’s forecast error going forward.
The retail forecast consists of the three major classes: Residential, Commercial and Industrial.
The Residential class sales forecast is comprised of two projections. The first is the number of
residential customers, which is driven by population. The second is energy usage per customer,
which is driven by weather, regional economic and demographic trends, electricity prices and
appliance efficiencies.
The usage per customer forecast was derived using a Statistical Adjusted End-Use Model. This is a
regression based framework that uses projected appliance saturation and efficiency trends developed
Duke Energy Progress North Carolina Integrated Resource Plan
2018 Biennial Report PUBLIC
Page 119

by Itron using EIA data. It incorporates naturally occurring efficiency trends and government
mandates more explicitly than other models. The outlook for usage per customer is essentially flat
through much of the forecast horizon, so most of the growth is primarily due to customer increases.
The average annual growth rate of residential in the Spring 2018 forecast, including the impacts of
Utility Energy Efficiency programs (UEE), rooftop solar and electric vehicles from 2019-2033 is
1.1%.
The Commercial forecast also uses an SAE model in an effort to reflect naturally occurring as well
as government mandated efficiency changes. The three largest sectors in the commercial class are
offices, education and retail. Commercial energy sales are expected to grow 0.6% per year over the
forecast horizon.
The Industrial class is forecasted by a standard econometric model, with drivers such as total
manufacturing output, textile output, and the price of electricity. Overall, Industrial sales are
expected to grow 0.2% per year over the forecast horizon.
Weather impacts are incorporated into the models by using Heating Degree Days with a base
temperature of 59 and Cooling Degree Days with a base temperature of 65. The forecast of degree
days is based on a 30-year average, which is updated every year.
The appliance saturation and efficiency trends are developed by Itron using data from the EIA.
Itron is a recognized firm providing forecasting services to the electric utility industry. These
appliance trends are used in the residential and commercial sales models.
Peak demands were projected using the SAE approach. The peak forecast was developed using a
monthly SAE model, similar to the sales SAE models, which includes monthly appliance
saturations and efficiencies, interacted with weather and the fraction of each appliance type that is in
use at the time of monthly peak.
Forecast Enhancements:
In 2013, The Company began using the statistically adjusted end use (SAE) projections to forecast
sales and peaks. The end use models provide a better platform to recognize trends in equipment
/appliance saturation and changes to efficiencies, and how those trends interact with heating,
cooling, and “other” or non-weather-related sales. The appliance saturation and efficiency trends are
developed by ITRON using data from EIA. ITRON is a recognized firm providing forecasting
services to the electric utility industry. These appliance trends are used in the residential and
commercial sales models. In conjunction with peer utilities and ITRON, the company continually
Duke Energy Progress North Carolina Integrated Resource Plan
2018 Biennial Report PUBLIC
Page 120

looks for refinements to its modeling procedures to make better use of the forecasting tools, and
develop more reliable forecasts.
Each time the forecast is updated, the most currently available historical and projected data is used.
The current 2018 forecast utilizes:
• Moody’s Analytics January 2018 base and consensus economic projections.
• End use equipment and appliance indexes reflect the 2017 update of ITRON’s end-use data,
which is consistent with the Energy Information Administration’s 2017 Annual Energy Outlook
• A calculation of normal weather using the period 1987-2016
As instructed by the North Carolina Utilities Commission after review of the 2016 IRP, the
company continues to research the weather sensitivity of summer and winter peaks, hourly shaping
of sales and load research data. As a result of the study, several improvements were identified and
incorporated into the current forecast, as follows:
• Retail Peak Weather Normalization
o The peak weather Rank/Sort process was updated using the ITRON forecasting software
rank/sort functionality. For purposes of projecting peaks, a seasonal rank/sort approach
was used to capture historical weather patterns that may have occurred outside of the
normal peak month.
o The peak model was updated to capture the actual historical average daily temperature on
the day of peak. Previous models selected the coldest average daily temperature during
the month of peak.
• Load History – Conducted a detailed review of historical loads, and the definitions of the loads
in order to better align historical results with future projections.
• Wholesale Assumptions - The wholesale forecast process was better integrated with the retail
forecast process. Additional reporting detail was provided for wholesale history and wholesale
customer classes, resulting in an improved load shape.
After completing the study, it was determined that historical winter peaks were coming in well
above forecasted peaks. Several process improvements above addressed that issue, raising the
winter peaks in the 2018 Spring Forecast compared to the 2017 Spring Forecast.
Duke Energy Progress North Carolina Integrated Resource Plan
2018 Biennial Report PUBLIC
Page 121

Assumptions:
Below are the projected average annual growth rates of several key drivers from DEP’s Spring 2018
Forecast.
2019-2033
Real Income 2.3%
Manufacturing Industrial Production Index (IPI) 1.1%
Population 1.3%
In addition to economic, demographic, and efficiency trends, the forecast also incorporates the
expected impacts of UEE, as well as projected effects of electric vehicles and behind the meter solar
technology.
Utility Energy Efficiency:
Utility Energy Efficiency Programs (UEE) continue to have a large impact in the acceleration of the
adoption of energy efficiency. When including the impacts of UEE on energy and peaks, careful
attention must be paid to avoid the double counting of UEE efficiencies with the naturally occurring
efficiencies included in the SAE modeling approach. To ensure there is not a double counting of
these efficiencies, the forecast “rolls off” the UEE savings at the conclusion of its measure life. For
example, if the accelerated benefit of a residential UEE program is expected to have occurred seven
years before the energy reduction program would have been otherwise adopted, then the UEE
effects after year seven are subtracted (“rolled off”) from the total cumulative UEE. With the SAE
model’s framework, the naturally occurring appliance efficiency trends replace the rolled off UEE
benefits serving to continue to reduce the forecasted load resulting from energy efficiency adoption.
The table below illustrates this process on sales:
Duke Energy Progress North Carolina Integrated Resource Plan
2018 Biennial Report PUBLIC
Page 122

Table C-1: UEE Program Life Process (MWh)
Wholesale:
For a description of the Wholesale forecast, please see Appendix H.
Customer Growth:
Tables C-2 and C-3 show the history and projections for DEP customers.
Duke Energy Progress North Carolina Integrated Resource Plan
2018 Biennial Report PUBLIC
Page 123

Table C-2: Retail customers (annual average in thousands)
Table C-3: Retail customers (annual average in thousands)
Duke Energy Progress North Carolina Integrated Resource Plan
2018 Biennial Report PUBLIC
Page 124
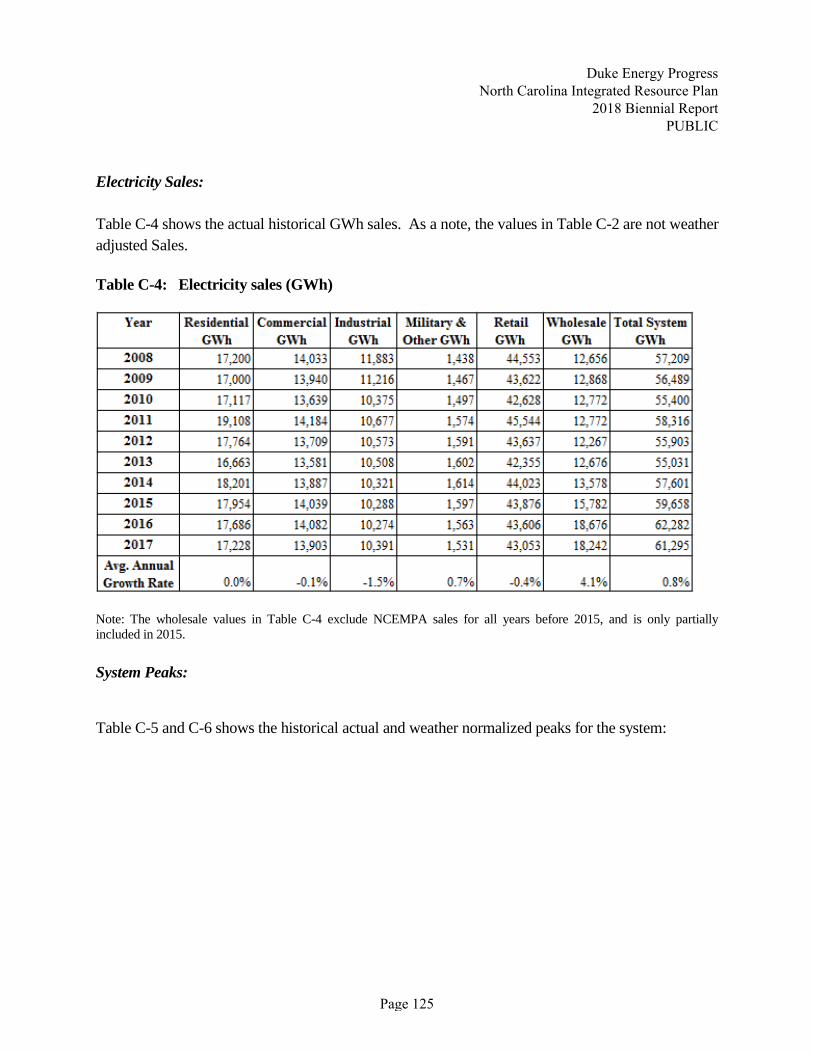
Electricity Sales:
Table C-4 shows the actual historical GWh sales. As a note, the values in Table C-2 are not weather
adjusted Sales.
Table C-4: Electricity sales (GWh)
Note: The wholesale values in Table C-4 exclude NCEMPA sales for all years before 2015, and is only partially
included in 2015.
System Peaks:
Table C-5 and C-6 shows the historical actual and weather normalized peaks for the system:
Duke Energy Progress North Carolina Integrated Resource Plan
2018 Biennial Report PUBLIC
Page 125

Table C-5: Winter Peaks
Table C-6: Summer Peaks
Duke Energy Progress North Carolina Integrated Resource Plan
2018 Biennial Report PUBLIC
Page 126
Forecast Results:
A tabulation of the utility’s sales and peak forecasts are shown as tables below:
• Table C-7: Forecasted energy sales by class (Including the impacts of UEE, rooftop solar,
and electric vehicles)
• Table C-8: Summary of the load forecast without UEE programs and excluding any
impacts from demand reduction programs
• Table C-9: Summary of the load forecast with UEE programs and excluding any impacts
from demand reduction programs
These projections are at generation and include Wholesale.
Load duration curves, with and without UEE programs are shown as Figures C-1 and C-2.
The values in these tables reflect the loads that Duke Energy Progress is contractually obligated to
provide and cover the period from 2019 to 2033.
As a note, all of the loads and energy in the tables and figures below are at generation, except for the
class sales forecast, which is at the meter.
Duke Energy Progress North Carolina Integrated Resource Plan
2018 Biennial Report PUBLIC
Page 127

Table C-7: Forecasted energy sales by class
Note: Values are at meter
Duke Energy Progress North Carolina Integrated Resource Plan
2018 Biennial Report PUBLIC
Page 128

Table C-8: Summary of the load forecast without UEE programs and excluding any impacts
from demand reduction programs
YEAR SUMMER
(MW)
WINTER
(MW)
ENERGY
(GWH)
2019 13,374 14,036 64,386
2020 13,409 14,060 64,212
2021 13,439 14,062 64,340
2022 13,557 14,168 64,297
2023 13,676 14,243 64,884
2024 13,850 14,429 65,868
2025 14,018 14,553 66,594
2026 14,264 14,724 66,725
2027 14,398 14,886 67,468
2028 14,642 15,090 68,473
2029 14,804 15,232 69,081
2030 14,959 15,367 69,657
2031 15,137 15,524 70,309
2032 15,333 15,704 71,069
2033 15,463 15,811 71,470 Avg. Annual
Growth Rate 1.0% 0.8% 0.7% Note: Values are at generation level
Duke Energy Progress North Carolina Integrated Resource Plan
2018 Biennial Report PUBLIC
Page 129

Figure C-1: Load Duration Curve without Energy Efficiency Programs and Before Demand Response Programs
Page 130
Duke Energy Progress North Carolina Integrated Resource Plan
2018 Biennial Report PUBLIC
Page 130

Table C-9: Summary of the load forecast with UEE programs and excluding any impacts
from demand reduction programs
YEAR SUMMER
(MW)
WINTER
(MW)
ENERGY
(GWH)
2019 13,317 14,011 64,038
2020 13,322 14,016 63,669
2021 13,324 14,001 63,613
2022 13,416 14,089 63,393
2023 13,510 14,139 63,809
2024 13,658 14,308 64,622
2025 13,796 14,415 65,178
2026 14,014 14,568 65,145
2027 14,118 14,713 65,726
2028 14,336 14,903 66,593
2029 14,473 15,032 67,080
2030 14,605 15,155 67,548
2031 14,762 15,303 68,108
2032 14,941 15,475 68,787
2033 15,054 15,575 69,125 Avg. Annual
Growth Rate 0.8% 0.7% 0.5%
Note: Values are at generation level
Duke Energy Progress North Carolina Integrated Resource Plan
2018 Biennial Report PUBLIC
Page 131

Figure C-2: Load Duration Curve with Energy Efficiency Programs & Before Demand
Response Programs
Duke Energy Progress North Carolina Integrated Resource Plan
2018 Biennial Report PUBLIC
Page 132
APPENDIX D: ENERGY EFFICIENCY AND DEMAND-SIDE MANAGEMENT
Demand-Side Management and Energy Efficiency Programs:
DEP continues to pursue a long-term, balanced capacity and energy strategy to meet the future
electricity needs of its customers. This balanced strategy includes a strong commitment to demand-
side management (DSM) and energy efficiency (EE) programs, investments in renewable and
emerging energy technologies, and state-of-the art power plants and delivery systems.
DEP uses EE and DSM programs in its IRP to efficiently and cost-effectively alter customer
demands and reduce the long-run supply costs for energy and peak demand. These programs can
vary greatly in their dispatch characteristics, size and duration of load response, certainty of load
response, and level and frequency of customer participation. In general, programs are offered in
two primary categories: EE programs that reduce energy consumption and DSM programs that
reduce peak demand (demand-side management or demand response programs and certain rate
structure programs).
Following are the EE and DSM programs currently available through DEP.
Residential EE Programs:
• Energy Efficiency Education
• Multi-Family Energy Efficiency
• My Home Energy Report
• Neighborhood Energy Saver (Low-Income)
• Residential Energy Assessments
• Residential New Construction
• Residential Smart $aver® Energy Efficiency
• Save Energy and Water Kit
Non-Residential EE Programs:
• Non-Residential Smart $aver® Energy Efficiency Products and Assessment
• Non-Residential Smart $aver® Performance Incentive
• Small Business Energy Saver
Duke Energy Progress North Carolina Integrated Resource Plan
2018 Biennial Report PUBLIC
Page 133

Combined Residential/Non-Residential EE Programs:
• Energy Efficient Lighting
• Distribution System Demand Response (DSDR)
Residential DSM Programs:
• EnergyWiseSM Home
Non-Residential DSM Programs:
• CIG Demand Response Automation
• EnergyWiseSM for Business
Energy Efficiency Programs:
Energy Efficiency programs are typically non-dispatchable education or incentive-based programs.
Energy and capacity savings are achieved by changing customer behavior or through the installation
of more energy-efficient equipment or structures. All cumulative effects (gross of Free Riders, at
the Plant12) since the inception of these existing programs through the end of 2017 are summarized
below. Please note that the cumulative impacts listed below include the impact of any Measurement
and Verification performed since program inception and also note that a “Participant” in the
information included below is based on the unit of measure for the specific energy efficiency
measure (e.g. number of bulbs, kWh of savings, tons of refrigeration, etc.), and may not be the same
as the number of customers that actually participate in these programs. The following provides
more detail on DEP’s existing EE programs.
Residential EE Programs:
Energy Efficiency Education Program:
The Energy Efficiency Education Program is an energy efficiency program available to students in
grades K-12 enrolled in public and private schools who reside in households served by Duke
Energy Progress. The Program provides principals and teachers with an innovative curriculum that
educates students about energy, resources, how energy and resources are related, ways energy is
wasted and how to be more energy efficient. The centerpiece of the current curriculum is a live
12 “Gross of Free Riders” means that the impacts associated with the EE programs have not been reduced for the
impact of Free Riders. “At the Plant” means that the impacts associated with the EE programs have been increased
to include line losses.
Duke Energy Progress North Carolina Integrated Resource Plan
2018 Biennial Report PUBLIC
Page 134

theatrical production focused on concepts such as energy, renewable fuels and energy efficiency
performed by two professional actors.
Following the performance, students are encouraged to complete a home energy survey with their
family to receive an Energy Efficiency Starter Kit. The kit contains specific energy efficiency
measures to reduce home energy consumption and is available at no cost to student households at
participating schools. Teachers receive supportive educational material for classroom and student
take home assignments. The workbooks, assignments and activities meet state curriculum
requirements.
Energy Efficiency Education
Number of Gross Savings (at plant)
Cumulative as of: Participants MWh Energy Peak kW
December 31, 2017 29,049 8,439 3,572
Multi-Family Energy Efficiency Program:
The Multi-Family Energy Efficiency Program provides energy efficient lighting and water measures
to reduce energy usage in eligible multi-family properties. The Program allows Duke Energy
Progress to target multi-family apartment complexes with an alternative delivery channel. The
measures are installed in permanent fixtures by the program administrator or the property
management staff. The program offers LEDs including A-Line, Globes and Candelabra bulbs and
energy efficient water measures such as bath and kitchen faucet aerators, water saving showerheads
and pipe wrap.
Multi-Family Energy Efficiency
Number of Gross Savings (at plant)
Cumulative as of: Participants MWh Energy Peak kW
December 31, 2017 885,774 48,814 6,042
My Home Energy Report Program:
The My Home Energy Report (MyHER) Program provides residential customers with a
comparative usage report that engages and motivates customers by comparing energy use to similar
residences in the same geographical area based upon the age, size and heating source of the home.
The report also empowers customers to become more efficient by providing them with specific
Duke Energy Progress North Carolina Integrated Resource Plan
2018 Biennial Report PUBLIC
Page 135

energy saving recommendations to improve the efficiency of their homes. The actionable energy
savings tips, as well as measure-specific coupons, rebates or other Company program offers that
may be included in a customer’s report are based on that specific customer’s energy profile.
The program includes an interactive online portal that allows customers to further engage and learn
more about their energy use and opportunities to reduce usage. Electronic versions of the My Home
Energy Report are sent to customers enrolled on the portal. In addition, all MyHER customers with
an email address on file with the Company receive an electronic version of their report monthly.
My Home Energy Report
Number of Gross Savings (at plant)
Capability as of: Participants MWh Energy Peak kW
December 31, 2017 795,734 117,852 19,964
Neighborhood Energy Saver (Low-Income) Program:
DEP’s Neighborhood Energy Saver Program reduces energy usage through the direct installation of
energy efficiency measures within the households of income qualifying residential customers. The
Program utilizes a Company-selected vendor to: (1) provide an on-site energy assessment of the
residence to identify appropriate energy conservation measures, (2) install a comprehensive package
of energy conservation measures at no cost to the customer, and (3) provide one-on-one energy
education. Program measures address end-uses in lighting, refrigeration, air infiltration and HVAC
applications.
Program participants receive a free energy assessment of their home followed by a recommendation
of energy efficiency measures to be installed at no cost to the resident. A team of energy technicians
will install applicable measures and provide one-on-one energy education about each measure
emphasizing the benefit of each and recommending behavior changes to reduce and control energy
usage.
Neighborhood Energy Saver
Number of Gross Savings (at plant)
Cumulative as of: Participants MWh Energy Peak kW
December 31, 2017 37,278 18,479 2,648
Duke Energy Progress North Carolina Integrated Resource Plan
2018 Biennial Report PUBLIC
Page 136

Residential Energy Assessments Program:
The Residential Energy Assessments Program provides eligible customers with a free in-home
energy assessment, performed by a Building Performance Institute (BPI) certified energy specialist
and designed to help customers reduce energy usage and save money. The BPI certified energy
specialist completes a 60 to 90-minute walk through assessment of a customer’s home and analyzes
energy usage to identify energy savings opportunities. The energy specialist discusses behavioral
and equipment modifications that can save energy and money with the customer. The customer
also receives a customized report that identifies actions the customer can take to increase their
home’s efficiency.
In addition to a customized report, customers receive an energy efficiency starter kit with a variety
of measures that can be directly installed by the energy specialist. The kit includes measures such as
energy efficiency lighting, low flow shower head, low flow faucet aerators, outlet/switch gaskets,
weather stripping and an energy saving tips booklet.
Residential Energy Assessments
Number of Gross Savings (at plant)
Cumulative as of: Participants MWh Energy Peak kW
December 31, 2017 65,704 9,590 1,602
Residential New Construction Program:
The Residential New Construction Program provides incentives for new single family and multi-
family residential dwellings (projects of three stories and less) that fall within the 2012 North
Carolina Residential Building Code to meet or exceed the 2012 North Carolina Energy
Conservation Code High Efficiency Residential Option (“HERO”). If a builder or developer
constructing to the HERO standard elects to participate, the Program offers the homebuyer an
incentive guaranteeing the heating and cooling consumption of the dwelling’s total annual energy
costs. Additionally, the Program incents the installation of high-efficiency heating ventilating and
air conditioning (“HVAC”) and heat pump water heating (“HPWH”) equipment in new single
family, manufactured, and multi-family residential housing units.
New construction represents a unique opportunity for capturing cost effective EE savings by
encouraging the investment in energy efficiency features that would otherwise be impractical or
costlier to install at a later time.
Duke Energy Progress North Carolina Integrated Resource Plan
2018 Biennial Report PUBLIC
Page 137

Residential New Construction
Number of Gross Savings (at plant)
Cumulative as of: Participants MWh Energy Peak kW
December 31, 2017 15,498,975 42,889 17,187
Note: The participants and impacts are from both the Residential New Construction program and
the previous Home Advantage program.
Residential Smart $aver® EE Program (formerly known as the Home Energy Improvement
Program):
The Residential Smart $aver® EE Program offers DEP customers a variety of energy
conservation measures designed to increase energy efficiency in existing residential dwellings.
The Program utilizes a network of participating contractors to encourage the installation of: (1) high
efficiency central air conditioning (AC) and heat pump systems with optional add on measures such
as Quality Installation and Smart Thermostats, (2) attic insulation and sealing, (3) heat pump water
heaters, and (4) high efficiency variable speed pool pumps.
The prescriptive menu of energy efficiency measures provided by the program allows customers the
opportunity to participate based on the needs and characteristics of their individual homes. A
referral channel provides free, trusted referrals to customers seeking reliable, qualified
contractors for their energy saving home improvement needs.
This program previously offered HVAC Audits and Room AC’s, however, those measures were
removed due to no longer being cost-effective.
The tables below show actual program performance for all current and past program measures.
Residential Smart $aver® EE
Number of Gross Savings (at plant)
Cumulative as of: Participants MWh Energy Peak kW
December 31, 2017 160,600 67,315 39,696
Save Energy and Water Kit Program:
The Save Energy and Water Kit is designed to increase the energy efficiency within single family
homes by offering low flow water fixtures and insulated pipe tape to residential customers with
electric water heaters. Participants receive a free kit that includes installation instructions and
Duke Energy Progress North Carolina Integrated Resource Plan
2018 Biennial Report PUBLIC
Page 138

varying numbers (based on the number of full bathrooms in their home) of bath aerators, shower
heads, kitchen aerators and pipe insulation tape. The program has a website in place that customers
can access to learn more about the program or watch videos produced to aid in the installation of the
kit measures.
Save Energy and Water Kit
Number of Gross Savings (at plant)
Cumulative as of: Participants MWh Energy Peak kW
December 31, 2017 789,000 45,710 15,301
Non-Residential EE Programs:
Non-Residential Smart $aver Energy Efficient Products and Assessment Program (formerly
known as the Energy Efficiency for Business Program)
The Non-Residential Smart $aver Energy Efficient Products and Assessment Program provides
incentives to DEP commercial and industrial customers to install high efficiency equipment in
applications involving new construction and retrofits and to replace failed equipment.
Commercial and industrial customers can have significant energy consumption but may lack
knowledge and understanding of the benefits of high efficiency alternatives. The Program provides
financial incentives to help reduce the cost differential between standard and high efficiency
equipment, offer a quicker return on investment, save money on customers’ utility bills that can be
reinvested in their business, and foster a cleaner environment. In addition, the Program encourages
dealers and distributors (or market providers) to stock and provide these high efficiency alternatives
to meet increased demand for the products.
The program provides incentives through prescriptive measures, custom measures and technical
assistance.
• Prescriptive Measures: Customers receive incentive payments after the installation of
certain high efficiency equipment found on the list of pre-defined prescriptive measures,
including lighting; heating, ventilating and air conditioning equipment; and refrigeration
measures and equipment.
• Custom Measures: Custom measures are designed for customers with electrical energy
saving projects involving more complicated or alternative technologies, whole-building
projects, or those measures not included in the Prescriptive measure list. The intent of the
Duke Energy Progress North Carolina Integrated Resource Plan
2018 Biennial Report PUBLIC
Page 139

Program is to encourage the implementation of energy efficiency projects that would not
otherwise be completed without the Company’s technical or financial assistance. Unlike
the Prescriptive portion of the program, all Custom measure incentives require pre-
approval prior to the project implementation.
• Energy Assessments and Design Assistance: Incentives are available to assist customers
with energy studies such as energy audits, retro commissioning, and system-specific
energy audits for existing buildings and with design assistance such as energy modeling
for new construction. Customers may use a contracted Duke Energy vendor to perform
the work or they may select their own vendor. Additionally, the Program assists
customers who identify measures that may qualify for Smart $aver Incentives with their
applications. Pre-approval is required.
Non-Residential Smart $aver® Energy Efficient Products and
Assessment
Number of Gross Savings (at plant)
Cumulative as of: Participants* MWh Energy Peak kW
December 31, 2017 73,365,213 569,826 102,244 * Note: Participants have different units of measure.
Non-Residential Smart $aver Performance Incentive Program:
The Non-Residential Smart $aver® Performance Incentive Program offers financial assistance to
qualifying commercial, industrial and institutional customers to enhance their ability to adopt
and install cost-effective electrical energy efficiency projects. The Program encourages the
installation of new high efficiency equipment in new and existing nonresidential establishments
as well as efficiency-related repair activities designed to maintain or enhance efficiency levels in
currently installed equipment. Incentive payments are provided to offset a portion of the higher
cost of energy efficient installations that are not eligible under the Smart $aver® EE Products
and Assessment program. The Program requires pre-approval prior to project initiation.
The types of projects covered by the Program include projects with some combination of unknown
building conditions or system constraints, or uncertain operating, occupancy, or production
schedules. The intent of the Program is to broaden participation in non-residential efficiency
programs by being able to provide incentives for projects that previously were deemed too
unpredictable to calculate an acceptably accurate savings amount, and therefore ineligible for
incentives. This Program provides a platform to understand new technologies better. Only projects
Duke Energy Progress North Carolina Integrated Resource Plan
2018 Biennial Report PUBLIC
Page 140

that demonstrate that they clearly reduce electrical consumption and/or demand are eligible for
incentives.
The key difference between this program and the custom component of the Non-Residential Smart
$aver Energy® Efficient Products and Assessment program is that Performance Incentive
participants get paid based on actual measure performance, and involves the following two step
process.
• Incentive #1: For the portion of savings that are expected to be achieved with a high
degree of confidence, an initial incentive is paid once the installation is complete.
• Incentive #2: After actual performance is measured and verified, the performance-based
part of the incentive is paid. The amount of the payout is tied directly to the savings
achieved by the measures.
Non-Residential Smart $aver® Performance Incentive
Number of Gross Savings (at plant)
Cumulative as of: Participants* MWh Energy Peak kW
December 31, 2017 1 440 59
Small Business Energy Saver Program
The Small Business Energy Saver Program reduces energy usage through the direct installation of
energy efficiency measures within qualifying non-residential customer facilities. Program measures
address major end-uses in lighting, refrigeration, and HVAC applications. The program is available
to existing non-residential customers that are not opted-out of the Company’s EE/DSM Rider and
have an average annual demand of 180 kW or less per active account.
Program participants receive a free, no-obligation energy assessment of their facility followed by a
recommendation of energy efficiency measures to be installed in their facility along with the
projected energy savings, costs of all materials and installation, and up-front incentive amount from
Duke Energy Progress. The customer makes the final determination of which measures will be
installed after receiving the results of the energy assessment. The Company-authorized vendor
schedules the installation of the energy efficiency measures at a convenient time for the customer,
and electrical subcontractors perform the work.
Duke Energy Progress North Carolina Integrated Resource Plan
2018 Biennial Report PUBLIC
Page 141

Small Business Energy Saver
Number of Gross Savings (at plant)
Cumulative as of: Participants MWh Energy Peak kW
December 31, 2017 126,301,579 191,477 37,247
Note: Participants have different units of measure.
Combined Residential/Non-Residential Customer:
Energy Efficient Lighting Program:
The Energy Efficient Lighting Program partners with lighting manufacturers and retailers across
North and South Carolina to provide marked-down prices at the register to DEP customers
purchasing energy efficient lighting products. Starting in 2017, the Program removed CFLs and
only offers LEDs and energy-efficient fixtures.
As the program enters its eighth year, the DEP Energy Efficient Lighting Program will continue to
encourage customers to adopt energy efficient lighting through incentives on a wide range of energy
efficient lighting products. Customer education is imperative to ensure customers are purchasing
the right bulb for the application in order to obtain high satisfaction with lighting products and
subsequent purchases.
Energy Efficient Lighting
Number of Gross Savings (at plant)
Cumulative as of: Participants MWh Energy Peak kW
December 31, 2017 29,776,479 1,636,739 255,409
Distribution System Demand Response Program (DSDR):
Duke Energy Progress’ Distribution System Demand Response (DSDR) program manages the
application and operation of voltage regulators (the Volt) and capacitors (the VAR) on the Duke
Energy Progress distribution system. In general, the program tends to optimize the operation of
these devices, resulting in a "flattening" of the voltage profile across an entire circuit, starting at the
substation and continuing out to the farthest endpoint on that circuit. This flattening of the voltage
profile is accomplished by automating the substation level voltage regulation and capacitors, line
capacitors and line voltage regulators while integrating them into a single control system. This
control system continuously monitors and operates the voltage regulators and capacitors to maintain
Duke Energy Progress North Carolina Integrated Resource Plan
2018 Biennial Report PUBLIC
Page 142

the desired "flat" voltage profile. Once the system is operating with a relatively flat voltage profile
across an entire circuit, the resulting circuit voltage at the substation can then be operated at a lower
overall level. Lowering the circuit voltage at the substation, results in an immediate reduction of
system loading during peak conditions.
Distribution System Demand Response
Gross Savings (at plant)
Cumulative as of: Number of
Participants MWh Energy
Summer MW
Capability
December 31, 2017 NA 35,519 212
Since DEP’s last biennial resource plan was filed on September 2, 2016, there have been 35
voltage control activations through June 30, 2018. The following table shows the date, starting
and ending time, and duration for all voltage control activations from July 2016 through June
2018.
Voltage Control Activations
Date Start Time End Time Duration
(H:MM)
7/5/2016 14:00 14:13 0:13
7/26/2016 15:30 19:11 3:41
7/27/2016 15:30 19:15 3:45
7/28/2016 15:30 19:00 3:30
8/19/2016 17:53 18:01 0:08
8/24/2016 13:42 14:00 0:18
11/22/2016 6:00 8:30 2:30
12/21/2016 9:00 10:00 1:00
1/8/2017 6:30 9:46 3:16
1/9/2017 6:30 9:37 3:07
3/16/2017 6:00 8:30 2:30
5/4/2017 13:00 14:30 1:30
5/12/2017 13:00 14:00 1:00
8/18/2017 16:00 19:00 3:00
10/9/2017 16:30 19:30 3:00
10/11/2017 16:00 20:00 4:00
Duke Energy Progress North Carolina Integrated Resource Plan
2018 Biennial Report PUBLIC
Page 143

Voltage Control Activations
Date Start Time End Time Duration
(H:MM)
10/12/2017 16:00 20:00 4:00
10/23/2017 18:00 21:00 3:00
1/1/2018 19:00 22:00 3:00
1/2/2018 5:00 10:30 5:30
1/2/2018 19:00 22:00 3:00
1/3/2018 5:00 9:00 4:00
1/3/2018 19:00 22:00 3:00
1/4/2018 5:00 9:00 4:00
1/4/2018 19:00 22:00 3:00
1/5/2018 5:00 10:00 5:00
1/5/2018 19:00 22:00 3:00
1/6/2018 5:00 10:00 5:00
1/7/2018 5:00 10:00 5:00
1/14/2018 6:00 10:00 4:00
1/15/2018 5:00 9:00 4:00
1/16/2018 5:00 9:00 4:00
1/17/2018 18:00 22:00 4:00
1/18/2018 5:00 9:00 4:00
3/9/2018 5:30 8:30 3:00
3/13/2018 6:00 8:30 2:30
3/15/2018 6:00 8:30 2:30
3/22/2018 6:00 8:20 2:20
6/18/2018 16:30 20:00 3:30
6/19/2018 16:30 20:00 3:30
6/20/2018 16:30 20:00 3:30
Demand-Side Management Programs:
Residential EnergyWiseSM Home Program:
The Residential EnergyWiseSM Home Program allows DEP to install load control switches at the
customer’s premise to remotely control the following residential appliances:
• Central air conditioning or electric heat pumps
Duke Energy Progress North Carolina Integrated Resource Plan
2018 Biennial Report PUBLIC
Page 144
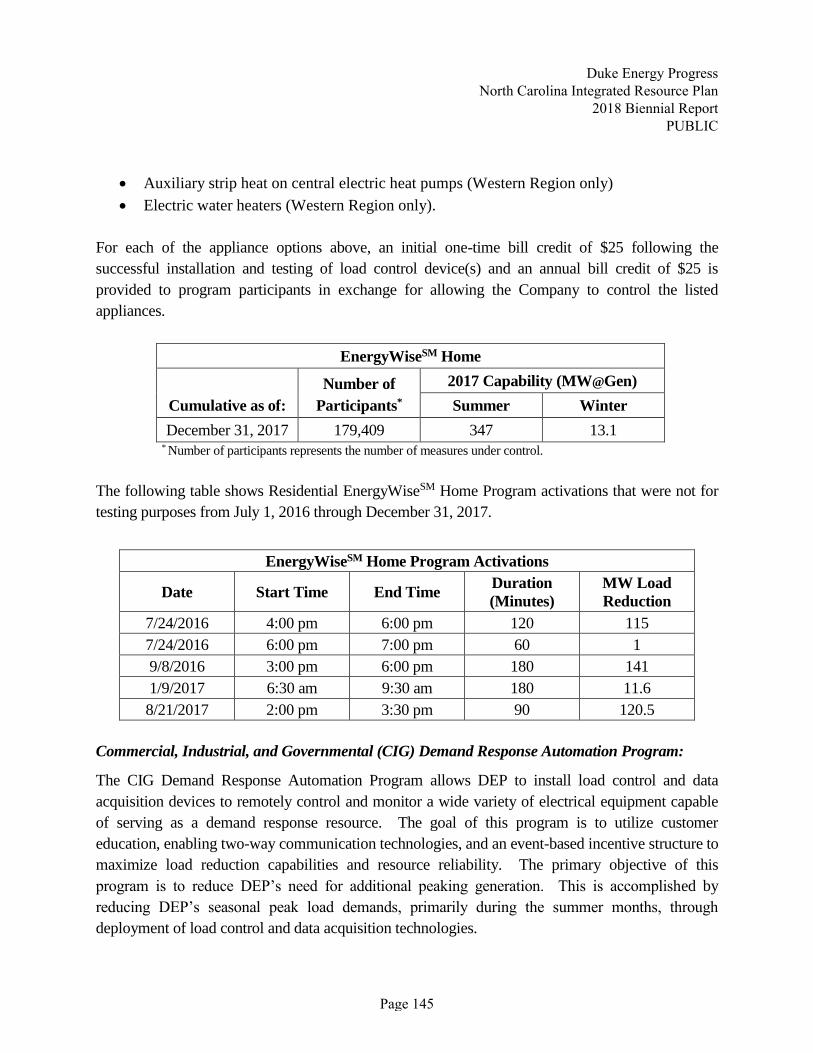
• Auxiliary strip heat on central electric heat pumps (Western Region only)
• Electric water heaters (Western Region only).
For each of the appliance options above, an initial one-time bill credit of $25 following the
successful installation and testing of load control device(s) and an annual bill credit of $25 is
provided to program participants in exchange for allowing the Company to control the listed
appliances.
EnergyWiseSM Home
Number of 2017 Capability (MW@Gen)
Cumulative as of: Participants* Summer Winter
December 31, 2017 179,409 347 13.1 * Number of participants represents the number of measures under control.
The following table shows Residential EnergyWiseSM Home Program activations that were not for
testing purposes from July 1, 2016 through December 31, 2017.
EnergyWiseSM Home Program Activations
Date Start Time End Time Duration
(Minutes)
MW Load
Reduction
7/24/2016 4:00 pm 6:00 pm 120 115
7/24/2016 6:00 pm 7:00 pm 60 1
9/8/2016 3:00 pm 6:00 pm 180 141
1/9/2017 6:30 am 9:30 am 180 11.6
8/21/2017 2:00 pm 3:30 pm 90 120.5
Commercial, Industrial, and Governmental (CIG) Demand Response Automation Program:
The CIG Demand Response Automation Program allows DEP to install load control and data
acquisition devices to remotely control and monitor a wide variety of electrical equipment capable
of serving as a demand response resource. The goal of this program is to utilize customer
education, enabling two-way communication technologies, and an event-based incentive structure to
maximize load reduction capabilities and resource reliability. The primary objective of this
program is to reduce DEP’s need for additional peaking generation. This is accomplished by
reducing DEP’s seasonal peak load demands, primarily during the summer months, through
deployment of load control and data acquisition technologies.
Duke Energy Progress North Carolina Integrated Resource Plan
2018 Biennial Report PUBLIC
Page 145

CIG Demand Response Automation Statistics
Number of MW Capability
Cumulative as of: Participants Summer Winter
December 31, 2017 71 22.8 13.2
The table below shows information for each CIG Demand Response Automation Program non-test
control event from July 1, 2016 through December 31, 2017.
CIG Demand Response Automation – Curtailable Option
Date Start Time End Time Duration
(Minutes)
MW Load
Reduction
7/8/2016 1:00 pm 7:00 pm 360 21.6
7/26/2016 1:00 pm 7:00 pm 360 17.5
7/13/2017 1:00 pm 7:00 pm 360 18.9
7/21/2017 1:00 pm 7:00 pm 360 21.1
8/18/2017 1:00 pm 7:00 pm 360 23.4
EnergyWiseSM for Business Program:
EnergyWiseSM for Business is both an energy efficiency and demand response program for non-
residential customers that allows DEP to reduce the operation of participants’ air conditioning units
to mitigate system capacity constraints and improve reliability of the power grid.
Program participants can choose between a Wi-Fi thermostat or load control switch that will be
professionally installed for free on each air conditioning or heat pump unit. In addition to
equipment choice, participants can also select the cycling level they prefer (i.e., a 30%, 50% or 75%
reduction of the normal on/off cycle of the unit). During a conservation period, DEP will send a
signal to the thermostat or switch to reduce the on time of the unit by the cycling percentage
selected by the participant. Participating customers will receive a $50 annual bill credit for each
unit at the 30% cycling level, $85 for 50% cycling, or $135 for 75% cycling. Participants that have
a heat pump unit with electric resistance emergency/back up heat and choose the thermostat can also
participate in a winter option that allows control of the emergency/back up heat at 100% cycling for
an additional $25 annual bill credit. Participants will also be allowed to override two conservation
periods per year.
Duke Energy Progress North Carolina Integrated Resource Plan
2018 Biennial Report PUBLIC
Page 146

Participants choosing the thermostat will be given access to a portal that will allow them to set
schedules, adjust the temperature set points, and receive energy conservation tips and
communications from DEP anywhere they have internet access. In addition to the portal access,
participants will also receive conservation period notifications, so they can make adjustments to
their schedules or notify their employees of upcoming conservation periods.
EnergyWiseSM for Business
MW Capability MWh Energy
Savings (at plant) Cumulative as of: Participants* Summer Winter
December 31, 2017 2,302 3.4 0.6 1,400 * Number of participants represents the number of measures under control.
The following table shows EnergyWiseSM for Business program activations that were not for testing
purposes from July 1, 2016 through December 31, 2017.
EnergyWiseSM for Business Program Activations
Date Start Time End Time Duration
(Minutes)
MW Load
Reduction
7/8/2016 3:30 pm 6:00 pm 150 0.3
7/14/2016 3:00 pm 6:00 pm 180 0.3
7/27/2016 3:00 pm 6:00 pm 180 0.3
6/14/2017 3:00 pm 6:00 pm 180 2.6
7/13/2017 3:00 pm 6:00 pm 180 2.6
7/21/2017 3:00 pm 6:00 pm 180 2.6
8/17/2017 3:30 pm 6:00 pm 150 2.6
8/22/2017 3:00 pm 6:00 pm 180 2.6
Discontinued Demand-Side Management and Energy Efficiency Programs:
Since the last biennial Resource Plan filing, the following DEP DSM/EE programs have been
discontinued.
• Appliance Recycling – The Appliance Recycling Program promoted the removal and
responsible disposal of operating refrigerators and freezers from DEP residential
customers. The Program recycled approximately 95% of the material from the harvested
appliances.
Duke Energy Progress North Carolina Integrated Resource Plan
2018 Biennial Report PUBLIC
Page 147

The implementation vendor for this program abruptly discontinued operations in
November 2015 and the program was subsequently closed. The table below presents the
final actual program accomplishments.
Residential Appliance Recycling
Number of Gross Savings (at plant)
Cumulative as of: Participants MWh Energy Peak kW
December 31, 2017 48,022 51,127 6,098
• Business Energy Report Pilot – The Business Energy Report Pilot consisted of a
periodic comparative usage report that compares a customer’s energy use to their peer
groups. Comparative groups were identified based on the customer’s energy use, type of
business, operating hours, square footage, geographic location, weather data and
heating/cooling sources. Pilot participants received targeted energy efficiency tips in
their report informing them of actionable ideas to reduce their energy consumption.
With the cost effectiveness of the program declining below the allowable threshold, the
program was terminated in 2017. Due to the program having a one-year measures life, there
are no ongoing savings associated with the program.
• CIG Demand Response Automation – Generator Option – In response to EPA
regulations finalized January 2013, a new Emergency Generator Option was
implemented effective January 1, 2014, to allow customers with emergency generators to
continue participation in demand response programs. To comply with the new rule,
dispatch of the Emergency Generator Option was limited to NERC Level II (EEA2)
except for an annual readiness test. On May 1, 2016, the DC Circuit Court of Appeals
mandated vacatur of the provision that included demand response participation in the
rule’s 100-hour allowance. The vacatur resulted in the inability of existing Emergency
Generator Option participants to continue participation as of May 1, 2016, and led DEP
to close the program option and revise the rider to include only the incentive structure
associated with the former Curtailable Option. The NCUC approved terminating this
program measure effective September 2016, in response to the changes in EPA
regulations.
Duke Energy Progress North Carolina Integrated Resource Plan
2018 Biennial Report PUBLIC
Page 148

DSM/EE Programs Prior to NC Senate Bill 3:
Prior to the passage of North Carolina Senate Bill 3 in 2007, DEP had a number of DSM/EE
programs in place. These programs are available in both North and South Carolina and include
the following:
Energy Efficient Home Program
Program Type: Energy Efficiency
In the early 1980s, DEP introduced an Energy Efficient Home program that provides
residential customers with a 5% discount of the energy and demand portions of their
electricity bills when their homes met certain thermal efficiency standards that were
significantly above the existing building codes and standards. Homes that pass an ENERGY
STAR® test receive a certificate as well as a 5% discount on the energy and demand portions
of their electricity bills.
Curtailable Rates
Program Type: Demand Response
DEP began offering its curtailable rate options in the late 1970s, whereby industrial and
commercial customers receive credits for DEP’s ability to curtail system load during times of
high energy costs and/or capacity constrained periods. There were no curtailable rate
activations during the period from July 1, 2016 through December 31, 2017.
Time-of-Use Rates
Program Type: Demand Response
DEP has offered voluntary Time-of-Use (TOU) rates to all customers since 1981. These
rates provide incentives to customers to shift consumption of electricity to lower-cost off-
peak periods and lower their electric bill.
Thermal Energy Storage Rates
Program Type: Demand Response
DEP began offering thermal energy storage rates in 1979. The present General Service
(Thermal Energy Storage) rate schedule uses two-period pricing with seasonal demand and
energy rates applicable to thermal storage space conditioning equipment. Summer on-peak
hours are noon to 8 p.m. and non-summer hours of 6 a.m. to 1 p.m. weekdays.
Duke Energy Progress North Carolina Integrated Resource Plan
2018 Biennial Report PUBLIC
Page 149

Real-Time Pricing
Program Type: Demand Response
DEP’s Large General Service (Experimental) Real Time Pricing tariff was implemented in
1998. This tariff uses a two-part real-time pricing rate design with baseline load
representative of historic usage. Hourly rates are provided on the prior business day. A
minimum of 1 MW load is required. This rate schedule is presently fully subscribed.
The following table provides current information available at the time of this report on DEP’s
pre-Senate Bill 3 DSM/EE programs (i.e., those programs that were in effect prior to January 1,
2008). This information, where applicable, includes program type, capacity, energy, and number
of customers enrolled in the program as of the end of 2017, as well as load control activations
since those enumerated in DEP’s last biennial resource plan. The energy savings impacts of these
existing programs are embedded within DEP’s load and energy forecasts.
Program Description Type
Summer
Capacity
(MW)
Winter
Capacity
(MW)
Annual
Energy
(MWH)
Participants
Activations
Since Last
Biennial
Report
Energy Efficiency Programs13 EE 466 N/A NA NA NA
Real Time Pricing (RTP) DSM 53 62 NA 105 NA
Commercial & Industrial TOU DSM 10.9 10.9 NA 30,749 NA
Residential TOU DSM 6.2 6.2 NA 28,011 NA
Curtailable Rates DSM 284 241 NA 61 2
Future EE and DSM Programs:
DEP is continually seeking to enhance its DSM/EE portfolio by: (1) adding new or expanding
existing programs to include additional measures, (2) program modifications to account for
changing market conditions and new measurement and verification (M&V) results, and (3) other EE
pilots.
Potential new programs and/or measures will be reviewed with the DSM Collaborative then
submitted to the Public Utility Commissions as required for approval.
13 Impacts from these existing programs are embedded within the load and energy forecast.
Duke Energy Progress North Carolina Integrated Resource Plan
2018 Biennial Report PUBLIC
Page 150

EE and DSM Program Screening:
The Company evaluates the costs and benefits of DSM and EE programs and measures by using the
same data for both generation planning and DSM/EE program planning to ensure that demand-side
resources are compared to supply side resources on a level playing field.
The analysis of energy efficiency and demand-side management cost-effectiveness has traditionally
focused primarily on the calculation of specific metrics, often referred to as the California Standard
tests: Utility Cost Test, Rate Impact Measure Test, Total Resource Cost Test, and Participant Test
(PCT).
• The UCT compares utility benefits (avoided costs) to the costs incurred by the utility to
implement the program, and does not consider other benefits such as participant savings or
societal impacts. This test compares the cost (to the utility) to implement the measures with
the savings or avoided costs (to the utility) resulting from the change in magnitude and/or
the pattern of electricity consumption caused by implementation of the program. Avoided
costs are considered in the evaluation of cost-effectiveness based on the projected cost of
power, including the projected cost of the utility’s environmental compliance for known
regulatory requirements. The cost-effectiveness analyses also incorporate avoided
transmission and distribution costs, and load (line) losses.
• The RIM Test, or non-participants test, indicates if rates increase or decrease over the long-
run as a result of implementing the program.
• The TRC Test compares the total benefits to the utility and to participants relative to the
costs to the utility to implement the program along with the costs to the participant. The
benefits to the utility are the same as those computed under the UCT. The benefits to the
participant are the same as those computed under the Participant Test, however, customer
incentives are considered to be a pass-through benefit to customers. As such, customer
incentives or rebates are not included in the TRC.
• The Participant Test evaluates programs from the perspective of the program’s participants.
The benefits include reductions in utility bills, incentives paid by the utility and any State,
Federal or local tax benefits received.
The use of multiple tests can ensure the development of a reasonable set of cost-effective DSM and
EE programs and indicate the likelihood that customers will participate.
Duke Energy Progress North Carolina Integrated Resource Plan
2018 Biennial Report PUBLIC
Page 151

Energy Efficiency and Demand-Side Management Program Forecasts:
Forecast Methodology:
In 2016, DEP commissioned a new EE market potential study to obtain new estimates of the
technical, economic and achievable potential for EE savings within the DEP service area. The final
reports (one for North Carolina and one for South Carolina) were prepared by Nexant Inc. and
issued on December 19, 2016.
The Nexant study results are suitable for IRP purposes and for use in long-range system planning
models. This study also helps to inform utility program planners regarding the extent of EE
opportunities and to provide broadly defined approaches for acquiring savings. This study did not,
however, attempt to closely forecast EE achievements in the short-term or from year to year. Such
an annual accounting is highly sensitive to the nature of programs adopted as well as the timing of
the introduction of those programs. As a result, it was not designed to provide detailed
specifications and work plans required for program implementation. The study provides part of the
picture for planning EE programs. Fully implementable EE program plans are best developed
considering this study along with the experience gained from currently running programs, input
from DEP program managers and EE planners, feedback from the DSM Collaborative and with the
possible assistance of implementation contractors.
The Nexant market potential study (MPS) included projections of energy efficiency impacts over a
25-year period for a Base and Enhanced Scenario, which were used in conjunction with expected
EE savings from DEP’s five-year program plan to develop the Base Case and High Case EE savings
forecasts, respectively, for this IRP. The Base Case EE savings forecast represents a merging of the
projected near-term savings from DEP’s five-year plan (2018-2022) with the long-term savings
from the Nexant MPS (2028-onward). Savings during the five-year period (2023-2027) between
the two sets of projections represents a merging of the two forecasts to ensure a smooth transition.
The High Case EE savings forecast was developed by applying the difference between the Nexant
Enhanced and Base Scenarios for all years to the final DEP Base Case forecast. Additionally, the
cumulative savings projections for both the Base and High Case EE forecasts included an
assumption that when the EE measures included in the forecast reach the end of their useful lives,
the impacts associated with these measures are removed from the future projected EE impacts, a
process defined as “rolloff”.
The table below provides the projected MWh load impacts for both the Base Case and High Case
forecasts of all DEP EE programs implemented since 2008 on a Net of Free Riders basis. The
Duke Energy Progress North Carolina Integrated Resource Plan
2018 Biennial Report PUBLIC
Page 152

Company assumes total EE savings will continue to grow on an annual basis throughout the
planning, however, the components of future programs are uncertain at this time and will be
informed by the experience gained under the current plan. Please note that this table includes a
column that shows historical EE program savings since the inception of the EE programs in 2008
through the end of 2017, which accounts for approximately an additional 2,117 gigawatt-hour
(GWh) of net energy savings.
The following forecast is presented without the effects of “rolloff”:
The MWh totals included in the table above represent the annual year-end impacts associated with EE programs,
however, the MWh totals included in the load forecast portion of this document represent the sum of the expected hourly
impacts.
Including measures
added in 2018 and beyond
Including measures
added since 2008
2008-17 2,116,891
2018 230,996 2,347,887
2019 422,130 2,539,021
2020 605,468 2,722,359
2021 777,345 2,894,236
2022 945,787 3,062,678
2023 1,114,230 3,231,121
2024 1,282,674 3,399,565
2025 1,451,119 3,568,010
2026 1,619,565 3,736,456
2027 1,788,012 3,904,903
2028 1,956,460 4,073,351
2029 2,125,763 4,242,654
2030 2,295,309 4,412,200
2031 2,466,556 4,583,447
2032 2,639,409 4,756,301
2033 2,812,935 4,929,826
Projected MWh Impacts of EE Programs
Base Case
Year
Annual MWh Load Reduction - Net
Duke Energy Progress North Carolina Integrated Resource Plan
2018 Biennial Report PUBLIC
Page 153

The MWh totals included in the table above represent the annual
year-end impacts associated with EE programs, however, the MWh
totals included in the load forecast portion of this document represent
the sum of the expected hourly impacts.
The MW impacts from the EE programs are included in the Load Forecasting section of this IRP.
The table below provides the projected summer and winter peak MW load impacts of all current
and projected DEP DSM programs.
Duke Energy Progress North Carolina Integrated Resource Plan
2018 Biennial Report PUBLIC
Page 154
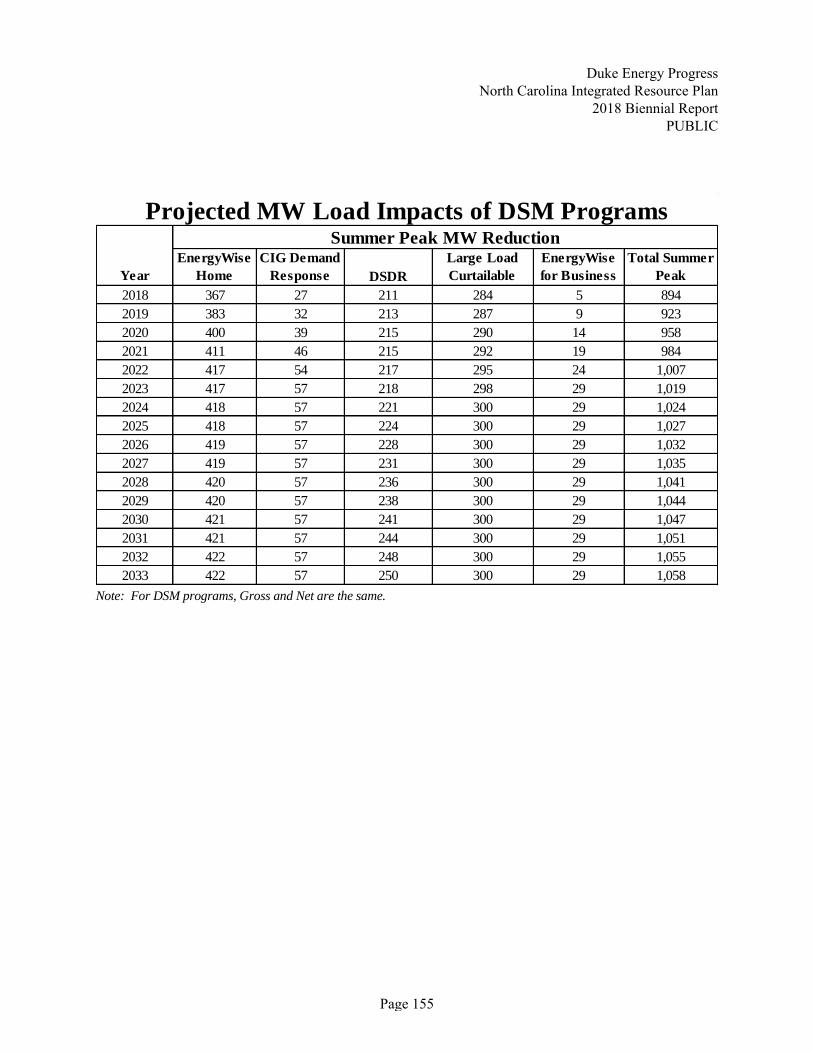
Note: For DSM programs, Gross and Net are the same.
EnergyWise
Home
CIG Demand
Response DSDR
Large Load
Curtailable
EnergyWise
for Business
Total Summer
Peak
2018 367 27 211 284 5 894
2019 383 32 213 287 9 923
2020 400 39 215 290 14 958
2021 411 46 215 292 19 984
2022 417 54 217 295 24 1,007
2023 417 57 218 298 29 1,019
2024 418 57 221 300 29 1,024
2025 418 57 224 300 29 1,027
2026 419 57 228 300 29 1,032
2027 419 57 231 300 29 1,035
2028 420 57 236 300 29 1,041
2029 420 57 238 300 29 1,044
2030 421 57 241 300 29 1,047
2031 421 57 244 300 29 1,051
2032 422 57 248 300 29 1,055
2033 422 57 250 300 29 1,058
Projected MW Load Impacts of DSM Programs
Year
Summer Peak MW Reduction
Duke Energy Progress North Carolina Integrated Resource Plan
2018 Biennial Report PUBLIC
Page 155

Note: For DSM programs, Gross and Net are the same.
Pursuing EE and DSM initiatives is not expected to meet the growing demand for electricity. DEP
still envisions the need to secure additional generation, as well as cost-effective renewable
generation, but the EE and DSM programs offered by DEP will address a significant portion of this
need if such programs perform as expected.
Programs Evaluated but Rejected:
Duke Energy Progress has not rejected any cost-effective programs as a result of its EE and DSM
program screening.
Current and Anticipated Consumer Education Programs:
In addition to the DSM/EE programs previously listed, DEP also has the following informational
and educational programs.
Duke Energy Progress North Carolina Integrated Resource Plan
2018 Biennial Report PUBLIC
Page 156

• On Line Account Access
• “Lower My Bill” Toolkit
• Online Energy Saving Tips
• Energy Resource Center
• Large Account Management
• eSMART Kids Website
• Community Events
On Line Account Access:
On Line Account Access provides energy analysis tools to assist customers in gaining a better
understanding of their energy usage patterns and identifying opportunities to reduce energy
consumption. The service allows customers to view their past 24 months of electric usage
including the date the bill was mailed; number of days in the billing cycle; and daily temperature
information. This program was initiated in 1999.
“Lower My Bill” Toolkit:
This tool, implemented in 2004, provides on-line tips and specific steps to help customers reduce
energy consumption and lower their utility bills. These range from relatively simple no-cost
steps to more extensive actions involving insulation and heating and cooling equipment.
Online Energy Saving Tips:
DEP has been providing tips on how to reduce home energy costs since approximately 1981.
DEP’s web site includes information on household energy wasters and how a few simple actions
can increase efficiency.
Energy Resource Center:
In 2000, DEP began offering its large commercial, industrial, and governmental customers a
wide array of tools and resources to use in managing their energy usage and reducing their
electrical demand and overall energy costs. Through its Energy Resource Center, located on the
DEP web site, DEP provides newsletters, online tools and information which cover a variety of
energy efficiency topics such as electric chiller operation, lighting system efficiency, compressed
air systems, motor management, variable speed drives and energy audits.
Large Account Management:
All DEP commercial, industrial, and governmental customers with an annual electric bill greater
than $250,000 are assigned to a DEP Account Executive (AE). The AEs are available to
Duke Energy Progress North Carolina Integrated Resource Plan
2018 Biennial Report PUBLIC
Page 157

personally assist customers in evaluating energy improvement opportunities and can bring in
other internal resources to provide detailed analyses of energy system upgrades. The AEs
provide their customers with a monthly electronic newsletter, which includes energy efficiency
topics and tips. They also offer numerous educational opportunities in group settings to provide
information about DEP’s new DSM and EE program offerings and to help ensure the customers
are aware of the latest energy improvement and system operational techniques.
e-SMART Kids Website:
DEP is offering an educational online resource for teachers and students in our service area
called e-SMART Kids. The web site educates students on energy efficiency, conservation, and
renewable energy and offers interactive activities in the classroom. It is available on the web at
http://www.e-smartonline.net/safeelectricity/.
Community Events:
DEP representatives participated in community events across the service territory to educate
customers about DEP’s energy efficiency programs and rebates and to share practical energy
saving tips. DEP energy experts attended events and forums to host informational tables and
displays, and distributed handout materials directly encouraging customers to learn more about
and sign up for approved DSM/EE energy saving programs.
Discontinued Consumer Education Programs:
DEP has not discontinued any consumer education programs since the last biennial Resource
Plan filing.
Looking to the Future - Grid Modernization (Smart Grid Impacts):
Duke Energy Progress’ Distribution System Demand Response (DSDR) program is an Integrated
Volt-Var Control (IVVC) program that better manages the application and operation of voltage
regulators (the Volt) and capacitors (the VAR) on the Duke Energy Progress distribution
system. In general, the project tends to optimize the operation of these devices, resulting in a
"flattening" of the voltage profile across an entire circuit, starting at the substation and
continuing out to the farthest endpoint on that circuit. This flattening of the voltage profile is
accomplished by automating the substation level voltage regulation and capacitors, line
capacitors and line voltage regulators while integrating them into a single control system. This
control system continuously monitors and operates the voltage regulators and capacitors to
maintain the desired "flat" voltage profile. Once the system is operating with a relatively flat
Duke Energy Progress North Carolina Integrated Resource Plan
2018 Biennial Report PUBLIC
Page 158

voltage profile across an entire circuit, the resulting circuit voltage at the substation can then be
operated at a lower overall level. Lowering the circuit voltage at the substation, results in an
immediate reduction of system loading during peak conditions.
Duke Energy Progress North Carolina Integrated Resource Plan
2018 Biennial Report PUBLIC
Page 159

APPENDIX E: FUEL SUPPLY
Duke Energy Progress’ current fuel usage consists of a mix of coal, natural gas and uranium. Oil is
used for peaking generation and natural gas continues to play an increasing role in the fuel mix due
to lower pricing and the addition of a significant amount of combined cycle generation. A brief
overview and issues pertaining to each fuel type are discussed below.
Natural Gas:
During 2017 NYMEX Henry Hub natural gas prices averaged approximately $3.10 per million
BTU (MMBtu) and U.S. lower-48 net dry production averaged approximately 73 billion cubic feet
per day (BCF/day). Natural gas spot prices at the Henry Hub averaged approximately $3.71 per
MMBtu in January 2018. Henry Hub spot pricing decreased throughout the remaining winter
months and averaged $2.65 per MMBtu at the end of March 2018 The lower short-term spot prices
in February and March 2018 were driven by both fundamental supply and demand factors.
Average daily U.S. net dry production levels of approximately 76.7 BCF/day in the first quarter of
2018 were 5.4BCF/day higher than the comparable period in 2017. Storage ended the winter
withdrawal season at approximately 1.4 trillion cubic feet (TCF) as of March 31, 2018. Lower-48
U.S. overall demand in the first quarter of 2018 was higher than normal due to the cold winter
weather which raised residential heating needs and resulted in gas storage withdrawals through late
April 2018.
Summer 2018 spot natural gas prices have decreased from the end of January 2018 prices that were
in the low $3.60’s per MMBtu. The Henry Hub spot price settled in a range between approximately
$2.74 to $2.90 per MMBtu in mid-July 2018. Working gas in storage remains below the 5-year
average and storage balances from a year ago, however, market prices have declined over the last
few months with expectations of continued record supply of dry gas production approaching 81.3
Bcf/d forecasted by the latest July 2018 EIA short term gas outlook. Observed average NYMEX
Henry Hub prices for the winter period November 2018 through March 2019 have decreased to
approximately $2.90 per MMBtu from the prices observed in late March 2018. Although predicting
actual storage balances at the end of the typical injection season is not possible, current projections
are roughly 3.4 to 3.5 TCF of working gas in storage at the end of the injection season.
Natural gas consumption is expected to remain strong through the remainder of 2018 increasing 2.4
Bcf/d from 2017 levels, due primarily to increases in electric power usage. Per the EIA’s short-term
energy outlook released on July 10, 2018, this year also reflects higher residential and commercial
Duke Energy Progress North Carolina Integrated Resource Plan
2018 Biennial Report PUBLIC
Page 160

demand because the first quarter of 2018 was colder than the first quarter of 2017. EIA expects the
share of U.S. total utility-scale electricity generation from natural gas-fired power plants to rise from
32% in 2017 to 34% in 2018 and 35% in 2019. As a result, coal’s forecast share of electricity
generation falls from 30% in 2017 to 28% in 2018 and to 27% in 2019. The EIA estimates that total
natural gas production will average 81.3Bcf/d in 2018, which will establish a new record. EIA also
expects natural gas production will rise an additional 3.1 Bcf/d in 2019 to 84.5 Bcf/d. With
advanced drilling techniques, producers appear able to adjust drilling programs in response to
changing market prices to shorten or extend the term of the producing well. According to Baker
Hughes, as of July 20, 2018, the U.S. Natural Gas rig count was at 187. This is flat from last year at
the same time and up from all time low rig count of 81 in August of 2016.
In addition to the trends in shorter term natural gas spot price levels for 2018, in late February 2018,
the observed forward market prices for the periods of 2019 through 2021 averaged approximately
$2.77 per MMBtu. During this period, the forward price curve is relatively flat reflecting an
expectation of balanced supply and demand fundamentals. Prices have decreased in the last few
months to approximately $2.64 per MMBtu as of late July 2018. This is illustrated in the figure
below.
Duke Energy Progress North Carolina Integrated Resource Plan
2018 Biennial Report PUBLIC
Page 161

Looking forward, the forward 5 and 10-year observable market curves are at $2.61 and $2.73 per
MMBtu, respectively, as of the July 20, 2018 close. In addition, as of the close of business on July
21, 2018, the one (1), three (3) and five (5) years strips were all approximately $2.63 per MMBtu.
As illustrated with these price levels and relationships, the forward NYMEX Henry Hub price curve
is extremely flat with the periods of 2020 and 2021 currently trading at discounts to 2019 prices.
The gas market is expected to remain relatively stable due to an improving economic picture which
may allow supply and demand to further come into balance. Demand for natural gas from the
power sector for 2018 is expected to be higher than coal generation due to coal retirements, which
are tied to the implementation of the EPA’s MATS rule covering mercury and acid gasses. This
increase is expected to be followed by new demand in the industrial and LNG export sectors, which
both ramp up through the 2020 timeframe. The long-term fundamental gas price outlook continues
to be little changed from the previous forecast even though it includes higher overall demand. The
North American gas resource picture is a story of unconventional gas production dominating the gas
industry. Shale gas now accounts for approximately 97% of net natural gas production today, which
has increased from approximately 38% in 2014. As noted earlier, per the Short-Term EIA outlook
dated July 10, 2018, the EIA expects dry gas production to average 81.3 Bcf/d by the end of 2018
and rise by an additional 3.1 Bcf/d in 2019 to 84.5 Bcf/d. The United States was a net exporter of
natural gas in the first quarter of 2018, with net exports averaging 0.5 Bcf/d. Rising LNG exports
and pipeline exports have contributed to a shift from being a net importer of natural gas to an
exporter. According to the EIA forecast, the US should have a total liquefaction capacity of 9.6
Bcf/d by the end of 2020.
The US power sector still represents the largest area of potential new gas demand, but increased
usage is expected to be somewhat volatile as generation dispatch is sensitive to price. Looking
forward, economic dispatch competition is expected to continue between gas and coal, although
forward natural gas prices have continued to decline and there has been permanent loss in overall
coal generation due to the number of coal unit retirements. Overall declines in energy consumption
tend to result from the adoption of more energy-efficient technologies and policies that promote
energy efficiency.
In order to ensure adequate natural gas supplies, transportation and storage, the company has gas
procurement strategies that include periodic RFPs, market solicitations, and short-term market
engagement activities to procure a reliable, flexible, diverse, and competitively priced natural gas
supply and transportation portfolio that supports DEP’s CC and CT facilities. With respect to
storage and transportation needs, the company has continued to add incremental firm pipeline
capacity and gas storage as it gas generation fleet as grown. The company will continue to evaluate
Duke Energy Progress North Carolina Integrated Resource Plan
2018 Biennial Report PUBLIC
Page 162

competitive options to meet its growing need for gas pipeline infrastructure as the gas generation
fleet grows.
Coal:
The main determinants for power sector coal demand are electricity demand growth and non-coal
electric generation, namely nuclear, gas, hydro and renewables. With electricity demand growth
remaining very low, continued steady nuclear and hydro generation, and increasing gas-fired and
renewable generation, coal-fired generation continues to be the marginal fuel experiencing declines.
According to the EIA, electric power sector demand has been steadily dropping and accounted for
665 million tons (86%) of total demand for coal in 2017. Additionally, projections show continued
strong supply and low prices for natural gas which continues to result in reduced, but more volatile,
coal burns. Increasing renewable generation, particularly in North Carolina, is also contributing to
increased volatility for coal generation.
Coal markets continue to be impacted by a number of factors, including: (1) uncertainty around
proposed, imposed, and stayed U.S. Environmental Protection Agency (“EPA”) regulations for
power plants; (2) continued abundant natural gas supply and storage resulting in lower natural gas
prices, which has reduced overall coal demand; (3) continued changes in global market demand for
both steam and metallurgical coal; (4) uncertainty surrounding regulations for mining operations;
and (5) tightening supply as bankruptcies, consolidations and company reorganizations have
allowed coal suppliers to restructure and settle into new, lower on-going production levels.
According to IHS Markit, future coal prices for the CAPP, NAPP and ILB coals are expected to be
in a steady downward trend until 2022 when they flatten and begin to modestly and steadily rise.
Future pricing for Western coals are expected to be steadily rising for the next 20 years.
Duke Energy Progress North Carolina Integrated Resource Plan
2018 Biennial Report PUBLIC
Page 163
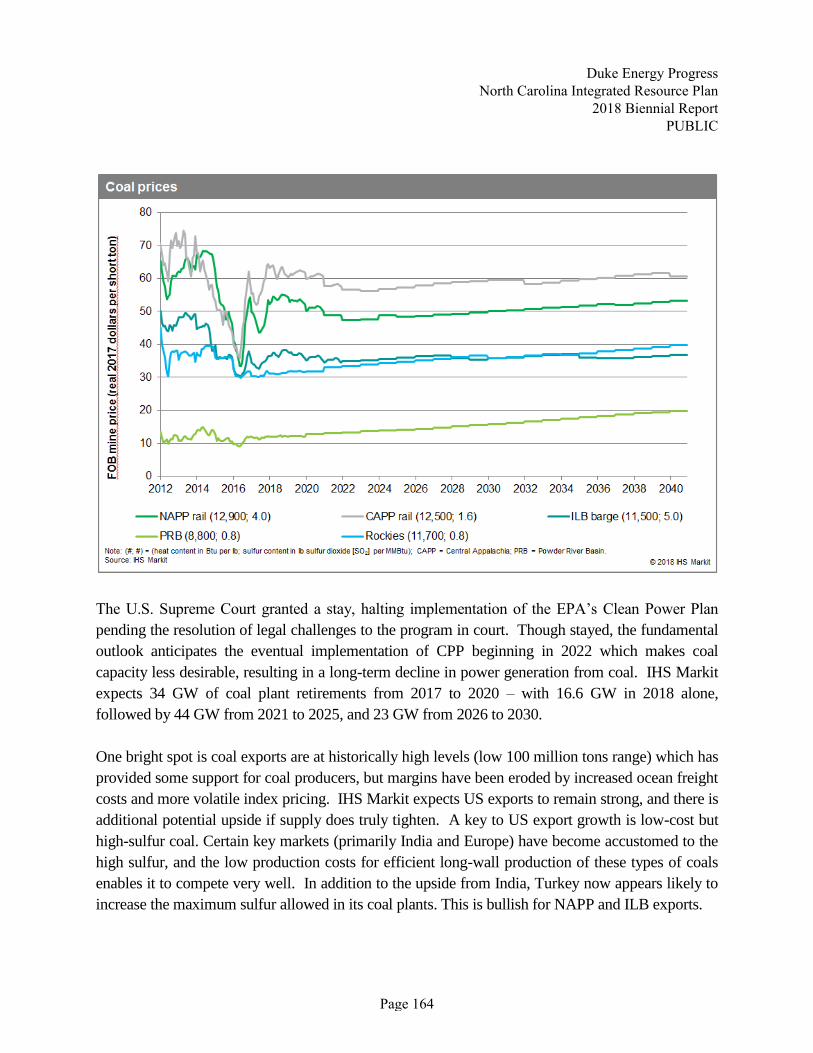
The U.S. Supreme Court granted a stay, halting implementation of the EPA’s Clean Power Plan
pending the resolution of legal challenges to the program in court. Though stayed, the fundamental
outlook anticipates the eventual implementation of CPP beginning in 2022 which makes coal
capacity less desirable, resulting in a long-term decline in power generation from coal. IHS Markit
expects 34 GW of coal plant retirements from 2017 to 2020 – with 16.6 GW in 2018 alone,
followed by 44 GW from 2021 to 2025, and 23 GW from 2026 to 2030.
One bright spot is coal exports are at historically high levels (low 100 million tons range) which has
provided some support for coal producers, but margins have been eroded by increased ocean freight
costs and more volatile index pricing. IHS Markit expects US exports to remain strong, and there is
additional potential upside if supply does truly tighten. A key to US export growth is low-cost but
high-sulfur coal. Certain key markets (primarily India and Europe) have become accustomed to the
high sulfur, and the low production costs for efficient long-wall production of these types of coals
enables it to compete very well. In addition to the upside from India, Turkey now appears likely to
increase the maximum sulfur allowed in its coal plants. This is bullish for NAPP and ILB exports.
Duke Energy Progress North Carolina Integrated Resource Plan
2018 Biennial Report PUBLIC
Page 164

The Company continues to maintain a comprehensive coal procurement strategy that has proven
successful over the years in limiting average annual fuel price changes while actively managing the
dynamic demands of its fossil fuel generation fleet in a reliable and cost-effective manner. Aspects
of this procurement strategy include having an appropriate mix of contract and spot purchases for
coal, staggering coal contract expirations which thereby limit exposure to market price changes,
diversifying coal sourcing as economics warrant, as well as working with coal suppliers to
incorporate additional flexibility into their supply contracts. In response to the unpredictable and
volatile nature of the demand for coal, the Company has implemented more frequent procurement
practices. However, coal inventory levels have dropped and recent experience has shown that
producers and transporters of coal are experiencing significant challenges with responding to
unexpected periods of increased demand.
Nuclear Fuel:
To provide fuel for Duke Energy’s nuclear fleet, the Company maintains a diversified portfolio
of natural uranium and downstream services supply contracts from around the world.
Requirements for uranium concentrates, conversion services and enrichment services are
primarily met through a portfolio of long-term supply contracts. The contracts are diversified by
supplier, country of origin and pricing. In addition, DEP staggers its contracting so that its
portfolio of long-term contracts covers the majority of fleet fuel requirements in the near-term
and decreasing portions of the fuel requirements over time thereafter. By staggering long-term
contracts over time, the Company’s purchase price for deliveries within a given year consists of a
blend of contract prices negotiated at many different periods in the markets, which has the effect
of smoothing out the Company’s exposure to price volatility. Diversifying fuel suppliers reduces
the Company’s exposure to possible disruptions from any single source of supply. Near-term
requirements not met by long-term supply contracts have been and are expected to be fulfilled
with spot market purchases.
Due to the technical complexities of changing suppliers of fuel fabrication services, DEP
generally sources these services to a single domestic supplier on a plant-by-plant basis using
multi-year contracts.
As fuel with a low cost basis is used and lower-priced legacy contracts are replaced with contracts at
higher market prices, nuclear fuel expense is expected to increase in the future. Although the costs
of certain components of nuclear fuel are expected to increase in future years, nuclear fuel costs are
Duke Energy Progress North Carolina Integrated Resource Plan
2018 Biennial Report PUBLIC
Page 165

expected to be competitive with alternate generation and customers will continue to benefit from the
Company’s diverse generation mix.
Duke Energy Progress North Carolina Integrated Resource Plan
2018 Biennial Report PUBLIC
Page 166
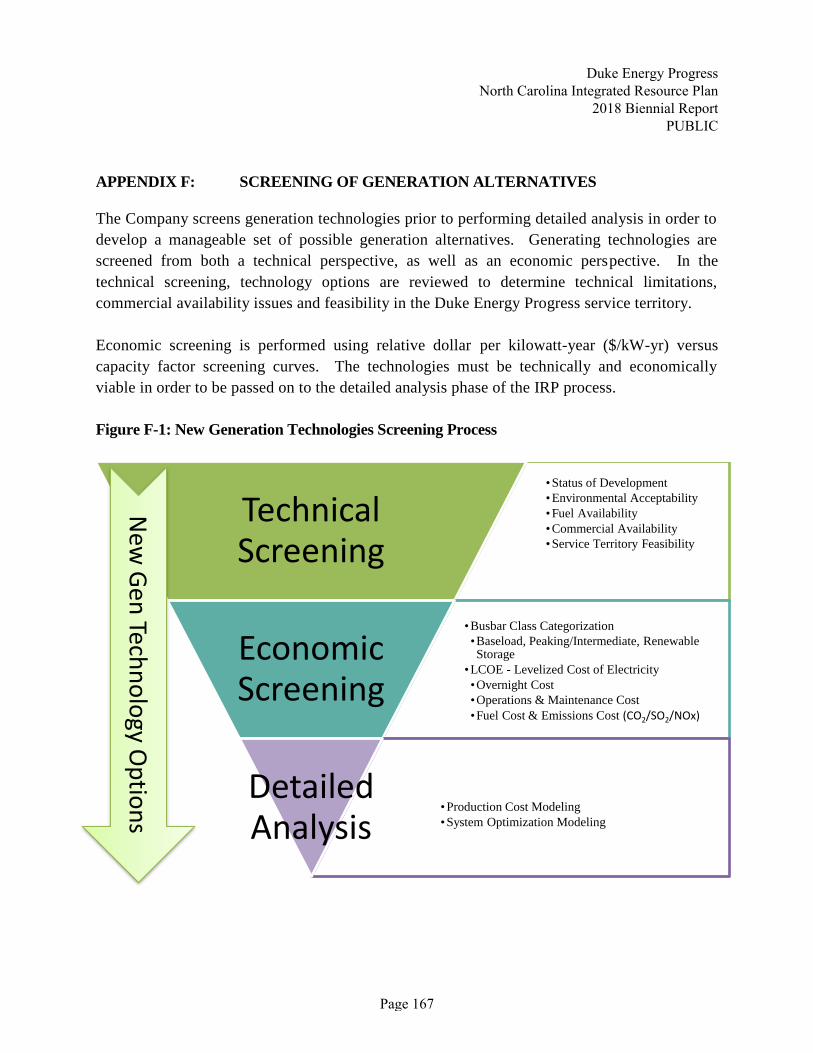
APPENDIX F: SCREENING OF GENERATION ALTERNATIVES
The Company screens generation technologies prior to performing detailed analysis in order to
develop a manageable set of possible generation alternatives. Generating technologies are
screened from both a technical perspective, as well as an economic perspective. In the
technical screening, technology options are reviewed to determine technical limitations,
commercial availability issues and feasibility in the Duke Energy Progress service territory.
Economic screening is performed using relative dollar per kilowatt-year ($/kW-yr) versus
capacity factor screening curves. The technologies must be technically and economically
viable in order to be passed on to the detailed analysis phase of the IRP process.
Figure F-1: New Generation Technologies Screening Process
• Status of Development
• Environmental Acceptability
• Fuel Availability
• Commercial Availability
• Service Territory Feasibility
Technical Screening
• Busbar Class Categorization
•Baseload, Peaking/Intermediate, Renewable Storage
• LCOE - Levelized Cost of Electricity
•Overnight Cost
•Operations & Maintenance Cost
•Fuel Cost & Emissions Cost (CO2/SO2/NOx)
Economic Screening
• Production Cost Modeling
• System Optimization Modeling
Detailed Analysis
New
Gen
Techn
olo
gy Op
tion
s
Duke Energy Progress North Carolina Integrated Resource Plan
2018 Biennial Report PUBLIC
Page 167
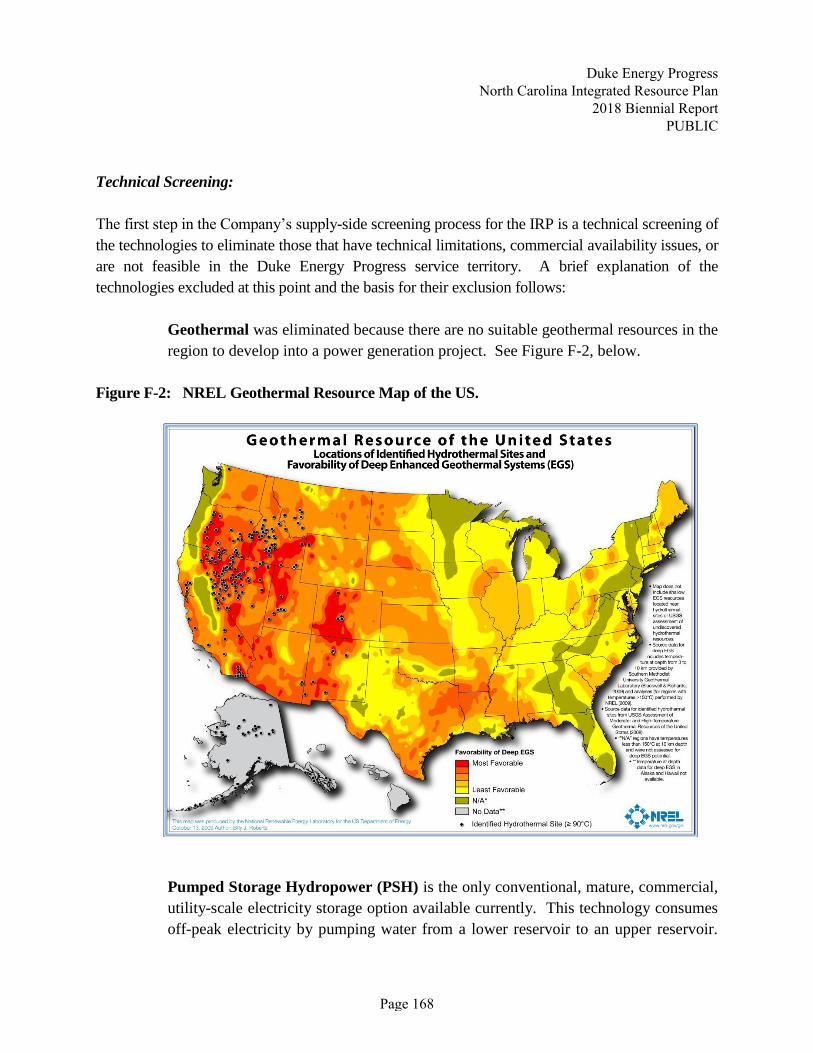
Technical Screening:
The first step in the Company’s supply-side screening process for the IRP is a technical screening of
the technologies to eliminate those that have technical limitations, commercial availability issues, or
are not feasible in the Duke Energy Progress service territory. A brief explanation of the
technologies excluded at this point and the basis for their exclusion follows:
Geothermal was eliminated because there are no suitable geothermal resources in the
region to develop into a power generation project. See Figure F-2, below.
Figure F-2: NREL Geothermal Resource Map of the US.
Pumped Storage Hydropower (PSH) is the only conventional, mature, commercial,
utility-scale electricity storage option available currently. This technology consumes
off-peak electricity by pumping water from a lower reservoir to an upper reservoir.
Duke Energy Progress North Carolina Integrated Resource Plan
2018 Biennial Report PUBLIC
Page 168

When the electric grid needs more electricity and when electricity prices are higher,
water is released from the upper reservoir. As the water flows from the upper
reservoir to the lower reservoir, it goes through a hydroelectric turbine to generate
electricity. Many operational pumped storage hydropower plants are providing
electric reliability and reserves for the electric grid in high demand situations. PSH
can provide a high amount of power because its only limitation is the capacity of the
upper reservoir. Typically, these plants can be as large as 4,000 MW, and have an
efficiency of 76% - 85% (EPRI, 2012). Therefore, this technology is effective at
meeting electric demand and transmission overload by shifting, storing, and
producing electricity. This is important because an increasing supply of intermittent
renewable energy generation such as solar will cause challenges to the electric grid.
PSH installations are greatly dependent on regional geography and face several
challenges including: environmental impact concerns, a long permitting process, and
a relatively high initial capital cost. Duke Energy currently has two PSH assets, Bad
Creek Reservoir and Jocassee Hydro with an approximate combined generating
capacity of 2,140 MW.
Compressed Air Energy Storage (CAES), although demonstrated on a utility scale
and generally commercially available, is not a widely applied technology and remains
relatively expensive. Traditional systems require a suitable storage site, commonly
underground where the compressed air is used to boost the output of a gas turbine.
The high capital requirements for these resources arise from the fact that suitable sites
that possess the proper geological formations and conditions necessary for the
compressed air storage reservoir are relatively scarce, especially in the Carolinas.
However, above-ground compressed air energy storage (AGCAES) technologies are
under development but at a much smaller scale, approximately 0.5 – 20 MW. Several
companies have attempted to develop cost effective CAES systems using above
ground storage tanks. Most attempts to date have not been commercially successful,
but their development is being monitored.
Duke Energy Progress North Carolina Integrated Resource Plan
2018 Biennial Report PUBLIC
Page 169

Figure F-3: Compressed Air Energy Storage (CAES) - Potential U.S. Salt Cavern Site
Depiction, NETL.
Liquid Air Energy Storage (LAES) uses electricity to cool air until it liquefies,
stores the liquid air in a tank, brings the liquid air back to a gaseous state (by
exposure to ambient air or with waste heat from an industrial process) and uses that
gas to turn a turbine and generate electricity. Although demonstrated through several
pilot projects, the scaling of this technology and the resultant economics is not yet
completely understood. As research and pilots continues with LAES, Duke Energy
will continue to monitor as the technology offers bulk energy storage without the
need for reservoir construction.
Small Modular Nuclear Reactors (SMR) are generally defined as having
capabilities of less than 300 MW per reactor. They typically have the capability of
grouping a number of reactors in the same location to achieve the desired power generating
capacity for a plant. In 2012, the U.S. Department of Energy (DOE) solicited bids for
companies to participate in a small modular reactor grant program with the intent to
“promote the accelerated commercialization of SMR technologies to help meet the
nation’s economic energy security and climate change objectives.” SMRs continue to
gain interest as they contribute no emissions to the atmosphere and, unlike their
Duke Energy Progress North Carolina Integrated Resource Plan
2018 Biennial Report PUBLIC
Page 170
predecessors, provide flexible operations capabilities, as well as, reduced footprints
coupled with inherently safer designs.
NuScale Power is the leader in SMR design and licensing in the US. They recently
announced that its small modular reactor will be able to generate 20% more power
than originally planned. The increase is from 50 MW to 60 MW for each module
(reactor) or 600 MW to 720 MW for a 12-module plant. The increase requires very
little additional capital cost so it lowers the projected cost of a 12-module facility by
approximately 16% per kilowatt. The approval date for the SMR Design Certification
Application (DCA) is September 2020. NuScale will need NRC approval of a revised
DCA before SMR customers will be able to take advantage of the additional power.
Other SMR designs under development domestically include the Holtec SMR-160, a
160 MW pressurized water reactor being developed for deployment both in the U.S.
and abroad. In addition, GE Hitachi (GEH) recently announced the development of a
new SMR, the BWRX300.
While SMRs were “screened out” in the Technical Screening phase of the technology
evaluations, they were allowed to be selected as a resource in the System Optimizer
(SO) model in order to allow the model to meet the high CO2 emission constraints in
the sensitivity analysis. As a result, SMRs have been depicted on the busbar
screening curves as an informative item. Duke Energy will be monitoring the
progress of the SMR projects for potential consideration and evaluation for future
resource plans as they provide an emission free source of fuel diverse, flexible
generation.
Advanced Reactors are typically defined as nuclear power reactors employing fuel
and/or coolant significantly different from that of current light water reactors (LWRs)
and offering advantages related to safety, cost, proliferation resistance, waste
management and/or fuel utilization. These reactors are characteristically typed by
coolant with the main groups including liquid metal cooled, gas cooled, and molten
salt fueled/cooled. There are approximately 25 domestic companies working on one
or multiple advanced reactor designs funded primarily by venture capital investment,
and even more designs are being considered at universities and national labs across
the country. There is also significant interest internationally, with at least as many
international companies pursuing their own advanced reactor designs in several
Duke Energy Progress North Carolina Integrated Resource Plan
2018 Biennial Report PUBLIC
Page 171

countries across the world.
Specifics of the reactor vary significantly by both coolant type and individual designs.
The reactors are projected to range in size from the single MW scale to over 1000
MW, with the majority of the designs proposing a modular approach that can scale
capacity based on demands. All designs are exploring a flexible deployment approach
which could scale power outputs to align with renewable/variable outputs. The first
commercially available advanced reactors are targeting the late 2020s for
deployment, although most designs are projected to be available in the 2030s.
Significant legislative efforts are currently being made to further the development of
advanced reactors in both the house and senate at the national level, and new bills
continue to be introduced.
Duke Energy has been part of an overall industry effort to further the development of
advanced reactors since joining the Nuclear Energy Institute Advanced Reactor
Working Group at its formation in early 2015. Additionally, Duke Energy participates
on two Advanced Reactor companies’ industry boards and has hosted several reactor
developers for early design discussions. Duke Energy has also participated in several
other industry efforts such as EPRI’s Owner-Operator Requirements Document,
which outlines requirements and recommendations for Advanced Reactor designs.
Duke Energy will continue to allot resources to follow the progress of the advanced
reactor community and will provide input to the proper internal constituents as
additional information becomes available.
Fuel Cells, although originally envisioned as being a competitor for combustion
turbines and central power plants, are now targeted to mostly distributed power
generation systems. The size of the distributed generation applications ranges from a
few kW to tens of MW in the long-term. Cost and performance issues have generally
limited their application to niche markets and/or subsidized installations. While a
medium level of research and development continues, this technology is not
commercially viable/available for utility-scale application.
Supercritical CO2 Brayton Cycle is of increasing interest; however, the technology
is not mature or ready for commercialization. Several pilots are underway and Duke
Energy will continue to monitor their development as a potential source of future
generation needs.
Duke Energy Progress North Carolina Integrated Resource Plan
2018 Biennial Report PUBLIC
Page 172

Poultry waste and swine waste digesters remain relatively expensive and are often
faced with operational and/or permitting challenges. Research, development, and
demonstration continue, but these technologies remain generally too expensive or
face obstacles that make them impractical energy choices outside of specific
mandates calling for use of these technologies. See Appendix D for more information
regarding current and planned Duke Energy poultry and swine waste projects.
Off-shore Wind, although demonstrated on a utility scale and commercially
available, is not a widely applied technology and not easily permitted in the United
States although that trend may be changing. This technology remains expensive even
with the five-year tax credit extension granted in December 2015. There are over
twenty-five projects in various phases of development in U.S. coastal waters and
more are anticipated as technology and construction advancements allow for
installation in deeper waters further offshore. The Block Island project developed by
Deepwater Wind is the first to reach commercial operation, and Duke Energy
Renewables is performing remote monitoring and control services for the project.
This 30 MW project is located about 3 miles off the coast of Rhode Island.
Duke Energy and NREL studied the potential for offshore integration off the coast of
the Carolinas in March 2013. In 2015, the U.S. Bureau of Ocean Energy Management
(BOEM) completed environmental assessments at three potential Outer Continental
Shelf (OCS) sites off the coast of North Carolina. In March 2017, BOEM
administered a competitive lease auction for wind energy in federal waters and
awarded Avangrid Renewables the rights to develop an area off the shores of Kitty
Hawk. Avangrid has plans for a project that may be as large as 1,500 MW.
Several coastal states including New York, New Jersey, Maryland, Massachusetts,
California, and Hawaii are facilitating industry growth. New York has an Offshore
Wind Master Plan aimed at 2,400 MW of offshore projects by 2030, and Statoil is
developing the 1,500 MW Empire Wind project near New York City, aiming for
completion in 2025.
The unique constraints of the industry and the increasingly competitive global market
are driving R&D improvements that allow wind farms to be sited further offshore.
Installation and siting require careful consideration to bathymetry and offshore
construction concerns, but siting is further complicated by shipping lanes, fishing
Duke Energy Progress North Carolina Integrated Resource Plan
2018 Biennial Report PUBLIC
Page 173

rights, wildlife migration patterns, military operations, and other environmental
concerns. Plus, coastal residents and tourists prefer an unobstructed ocean view, so
the larger turbines require longer distances to keep them out of sight.
Industry leaders are working to define equipment and installation standards and
codes. They are coordinating with the oil and gas industry to improve construction
processes and working with the telecommunications industry to advance submarine
cable technologies. Improved foundation designs are helping to reduce installation
time and costs, and floating designs are being tested for deployment in deep waters.
Figure F-4: NC Wind Energy Areas (WEAs) (developed in joint venture by Duke Energy
and NREL)
Duke Energy Progress North Carolina Integrated Resource Plan
2018 Biennial Report PUBLIC
Page 174

Solar Steam Augmentation systems utilize solar thermal energy to supplement a
Rankine steam cycle such as that in a fossil generating plant. The supplemental steam
could be integrated into the steam cycle and support additional MW generation
similar in concept to the purpose of duct firing a heat recovery steam generator. This
technology, although attractive has several hurdles yet to clear, including a clean
operating history and initial capital cost reductions. This technology is very site
specific and Duke Energy will continue to monitor developments in the area of steam
augmentation.
A brief explanation of the technology additions for 2018 and the basis for their inclusion follows:
Addition of Battery Storage Options to the IRP:
Energy storage solutions are becoming a viable tool in support of grid stability at peak demand
times and in support of energy shifting and smoothing from renewable sources. Energy Storage in
the form of battery storage is becoming more feasible with the advances in battery technology
(Tesla Lithium-ion battery technology) and the reduction in battery cost; however, their uses (even
within Duke Energy) have been concentrated on frequency regulation, solar smoothing, and/or
energy shifting from localized renewable energy sources with a high incidence of intermittency (i.e.
solar and wind applications). In order to generically evaluate the potential value of a generation-
connected battery storage system an unencumbered battery dedicated to capacity and energy
services will be utilized for screening purposes. Encumbrances to the battery are other uses which
may limit, or even eliminate the battery system's ability to provide capacity and energy storage
services. These encumbrances may include (but are not limited to) frequency response, asset
deferral, back-up power, black start, ancillary services, etc. Duke Energy recognizes the potential
benefits that battery connected systems can provide, especially at the Transmission & Distribution
level which resides outside the scope of this IRP. Evaluation of potential T&D benefits, along with
other uses that can be "stacked" with these T&D benefits, are being assessed on a case-by-case basis
at this time through pilot projects.
Duke Energy has several projects in operation since 2011, mainly in support of regulating output
voltages/frequencies from renewable energy sources to the grid. Each of these applications supports
frequency regulation, solar smoothing, or energy shifting from a local solar array. See Figure F-5,
below for a depiction of the existing, operational battery energy storage assets.
Duke Energy Progress North Carolina Integrated Resource Plan
2018 Biennial Report PUBLIC
Page 175

Figure F-5: Existing, Operational Duke Energy Battery Storage Assets
These examples are only a few in support of a growing trend of coupling Battery Storage with an
intermittent renewable energy source such as solar or wind in an effort to stabilize output and
increase a facility's (renewable plus storage) net capacity factor.
Battery Briefing:
Electrochemical energy storage systems utilize chemical reactions within a battery cell to facilitate
electron flow, converting electrical energy to chemical energy when charging and generating an
electric current when discharged. Electrochemical technology is continually developing as one of
the leading energy storage and load following technologies due to its modularity, ease of installation
and operation, and relative design maturity. Development of electrochemical batteries has shifted
into three categories, commonly termed “flow,” “conventional,” and “high temperature” battery
designs. Each battery type has unique features yielding specific advantages compared to one
another.
A conventional battery contains a cathodic and an anodic electrode and an electrolyte sealed
within a cell container than can be connected in series to increase overall facility storage and output.
During charging, the electrolyte is ionized such that when discharged, a reduction-oxidation
reaction occurs, which forces electrons to migrate from the anode to the cathode thereby generating
Duke Energy Progress North Carolina Integrated Resource Plan
2018 Biennial Report PUBLIC
Page 176

electric current. Batteries are designated by the electro-chemicals utilized within the cell; the most
popular conventional batteries are lead acid and lithium ion type batteries.
Lead acid batteries are the most mature and commercially accessible battery technology, as their
design has undergone considerable development since conceptualized in the late 1800s. The
Department of Energy (DOE) estimates there is approximately 110 MW of lead acid battery storage
currently installed worldwide. Although lead acid batteries require relatively low capital cost, this
technology also has inherently high maintenance costs and handling issues associated with toxicity,
as well as low energy density (yields higher land and civil work requirements). Lead acid batteries
also have a relatively short life cycle at 5 to 10 years, especially when used in high cycling
applications.
Lithium ion (Li-ion) batteries contain graphite and metal-oxide electrodes and lithium ions
dissolved within an organic electrolyte. The movement of lithium ions during cell charge and
discharge generates current. Li-ion technology has seen a resurgence of development in recent years
due to its high energy density, low self-discharge, and cycling tolerance. Many Li-ion
manufacturers currently offer 15-year warranties or performance guarantees. Consequently, Li- ion
has gained traction in several markets including the utility and automotive industries.
Li-ion battery prices are trending downward, and continued development and investment by
manufacturers are expected to further reduce production costs. While there is still a wide range of
project cost expectations due to market uncertainty, Li-ion batteries are anticipated to expand their
reach in the utility market sector. At present, Li-ion Battery Technology is the only battery
technology considered for the 2018 IRP.
Flow batteries utilize an electrode cell stack with externally stored electrolyte material. The flow
battery is comprised of positive and negative electrode cell stacks separated by a selectively
permeable ion exchange membrane, in which the charge-inducing chemical reaction occurs, and
liquid electrolyte storage tanks, which hold the stored energy until discharge is required. Various
control and pumped circulation systems complete the flow battery system in which the cells can be
stacked in series to achieve the desired voltage difference.
The battery is charged as the liquid electrolytes are pumped through the electrode cell stacks, which
serve only as a catalyst and transport medium to the ion-inducing chemical reaction. The excess
positive ions at the anode are allowed through the ion-selective membrane to maintain
electroneutrality at the cathode, which experiences a buildup of negative ions. The charged
Duke Energy Progress North Carolina Integrated Resource Plan
2018 Biennial Report PUBLIC
Page 177

electrolyte solution is circulated back to storage tanks until the process is allowed to repeat in
reverse for discharge as necessary.
In addition to external electrolyte storage, flow batteries differ from traditional batteries in that
energy conversion occurs as a direct result of the reduction-oxidation reactions occurring in the
electrolyte solution itself. The electrode is not a component of the electrochemical fuel and does not
participate in the chemical reaction. Therefore, the electrodes are not subject to the same
deterioration that depletes electrical performance of traditional batteries, resulting in high cycling
life of the flow battery. Flow batteries are also scalable such that energy storage capacity is
determined by the size of the electrolyte storage tanks, allowing the system to approach its
theoretical energy density. Flow batteries are typically less capital intensive than some conventional
batteries but require additional installation and operation costs associated with balance of plant
equipment.
High temperature batteries operate similarly to conventional batteries, but they utilize molten salt
electrodes and carry the added advantage that high temperature operation can yield heat for other
applications simultaneously. The technology is considered mature with ongoing commercial
development at the grid level. The most popular and technically developed high temperature option
is the Sodium Sulfur (NaS) battery. Japan-based NGK Insulators, the largest NaS battery
manufacturer, installed a 4 MW system in Presidio, Texas in 2010 following operation of systems
totaling more than 160 MW since the project’s inception in the 1980s.
The NaS battery is typically a hermetically sealed cell that consists of a molten sulfur electrolyte at
the cathode and molten sodium electrolyte at the anode, separated by a Beta-alumina ceramic
membrane and enclosed in an aluminum casing. The membrane is selectively permeable only to
positive sodium ions, which are created from the oxidation of sodium metal and pass through to
combine with sulfur resulting in the formation of sodium polysulfides. As power is supplied to the
battery in charging, the sodium ions are dissociated from the polysulfides and forced back through
the membrane to re-form elemental sodium. The melting points of sodium and sulfur are
approximately 98 oC and 113 oC, respectively. To maintain the electrolytes in liquid form and for
optimal performance, the NaS battery systems are typically operated and stored at around 300 oC,
which results in a higher self-discharge rate of 14 percent to 18 percent. For this reason, these
systems are usually designed for use in high-cycling applications and longer discharge durations.
Duke Energy Progress North Carolina Integrated Resource Plan
2018 Biennial Report PUBLIC
Page 178

NaS systems are expected to have an operable life of around 15 years and are one of the most
developed chemical energy storage technologies. However, unlike other battery types, costs of NaS
systems have historically held, making other options more commercially viable at present.
Generation Flexibility:
As more intermittent generation becomes associated with Duke’s system, the greater need there may
be for generation that has rapid load shifting and ancillary support capabilities. This generation
would need to be dispatchable, possess desirable capacity, and ramp at a desired rate. Some of the
technologies that have 'technically' screened in possess these qualities or may do so in the near
future. Effort is being made to value the characteristics of flexibility and quantify that value to the
system. As a result of the flexible generation need, some features of 'generic' plant's base designs
have been modified to reflect the change in cost and performance to accomplish a more desired
plant characteristic to diminish the impact of the intermittent generation additions.
Economic Screening:
The Company screens all technologies using relative dollar per kilowatt-year ($/kW-yr) versus
capacity factor screening curves, also referred to as busbar curves. The Busbar curve estimates the
revenue requirement (i.e. life-cycle cost) of power from a supply option at the "busbar," the point at
which electricity leaves the plant (i.e. the high side of the step-up transformer). Duke Energy
provides some additional evaluation of a generic transmission and/or interconnection cost adder
associated with each technology.
The screening within each general class of busbar (Baseload, Peaking/Intermediate, and
Renewables), as well as the final screening across the general classes uses a spreadsheet-based
screening curve model developed by Duke Energy. This model is considered proprietary,
confidential and competitive information by Duke Energy. For the 2018 IRP year, Duke Energy
has provided an additional busbar to represent Storage technology comparisons. As Storage
technologies are not traditional generating resource options, they should be compared independently
from generating resources. In addition, there has been no charging cost associated with the storage
busbar buildup. This charging cost is excluded as it is dependent upon what the next marginal unit
is in the dispatch stack as to what would be utilized to "charge" the storage resource. For resource
options inclusive of or coupled with storage, it is assumed that the storage resource is being directly
charged by the generating resource (i.e. Solar PV plus Battery Storage option).
Duke Energy Progress North Carolina Integrated Resource Plan
2018 Biennial Report PUBLIC
Page 179

This screening (busbar) curve analysis model includes the total costs associated with owning and
maintaining a technology type over its lifetime and computes a levelized $/kW-year value over a
range of capacity factors. The Company repeats this process for each supply technology to be
screened resulting in a family of lines (curves). The lower envelope along the curves represents the
least costly supply options for various capacity factors or unit utilizations. Some technologies have
screening curves limited to their expected operating range on the individual graphs. Lines that
never become part of the lower envelope, or those that become part of the lower envelope only at
capacity factors outside of their relevant operating ranges, have a very low probability of being part
of the least cost solution, and generally can be eliminated from further analysis.
The Company selected the technologies listed below for the screening curve analysis. While Clean
Power Plan (CPP) regulation may effectively preclude new coal-fired generation, Duke Energy
Progress has included ultra-supercritical pulverized coal (USCPC) with carbon capture
sequestration (CCS) and integrated gasification combined cycle (IGCC) technologies with CCS of
1400 pounds/net MWh capture rate as options for base load analysis consistent with the pending
version of the EPA Clean Power Plan for new coal plants. Additional detail on the expected
impacts from EPA regulations to new coal-fired options is included in Appendix G. 2018 additions
include Solar PV plus Battery Storage, additional Lithium ion Battery Storage options, and Pumped
Storage Hydro as a renewable technology.
Dispatchable (Winter Ratings)
• Base load – 782 MW Ultra-Supercritical Pulverized Coal with CCS
• Base load – 557 MW 2x1 IGCC with CCS
• Base load – 2 x 1,117 MW Nuclear Units (AP1000)
• Base load – 667 MW – 1x1x1 Advanced Combined Cycle (No Inlet Chiller and Fired)
• Base load – 1,339 MW – 2x2x1 Advanced Combined Cycle (No Inlet Chiller and Fired)
• Base load – 22 MW – Combined Heat & Power (Combustion Turbine)
• Base load – 9 MW – Combined Heat & Power (Reciprocating Engine)
• Base load – 600 MW – Small Modular Reactor (SMR)
• Peaking/Intermediate – 196 MW 4 x LM6000 Combustion Turbines (CTs)
• Peaking/Intermediate – 202 MW, 12 x Reciprocating Engine Plant
• Peaking/Intermediate – 574 MW 2 x G/H-Class Combustion Turbines (CTs)
• Peaking/Intermediate – 754 MW 2 x J-Class Combustion Turbines (CTs)
• Peaking/Intermediate – 919 MW 4 x 7FA.05 Combustion Turbines (CTs)
Duke Energy Progress North Carolina Integrated Resource Plan
2018 Biennial Report PUBLIC
Page 180
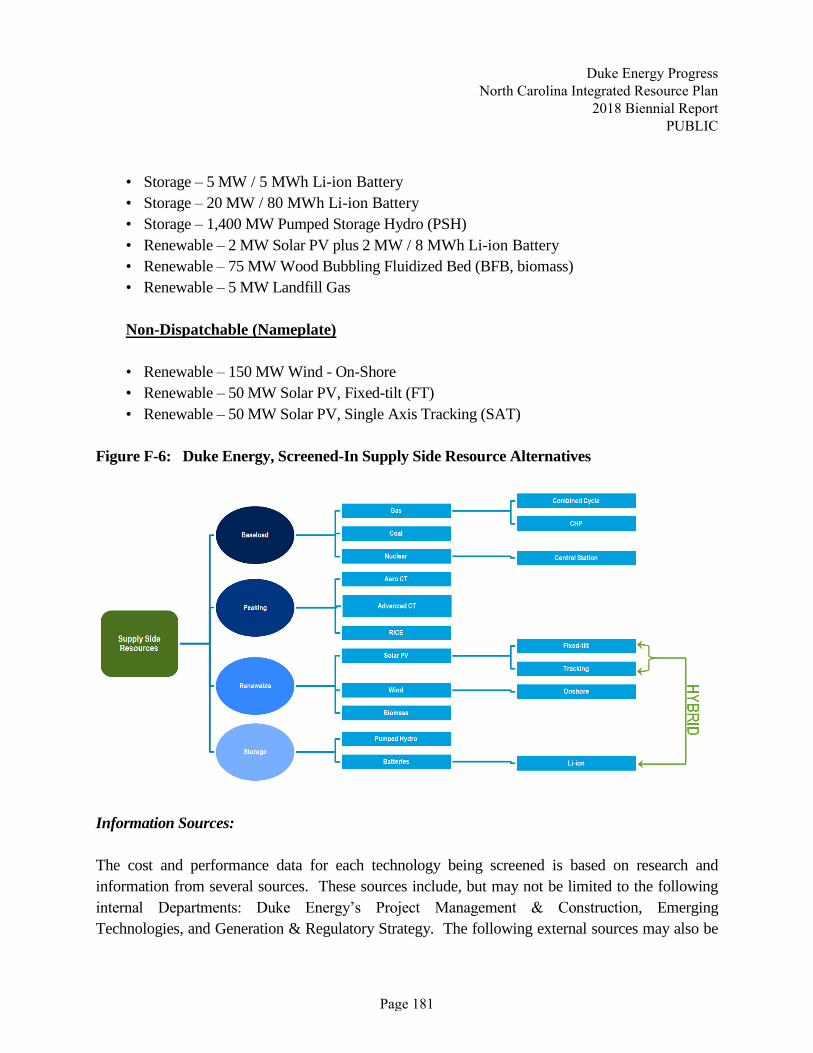
• Storage – 5 MW / 5 MWh Li-ion Battery
• Storage – 20 MW / 80 MWh Li-ion Battery
• Storage – 1,400 MW Pumped Storage Hydro (PSH)
• Renewable – 2 MW Solar PV plus 2 MW / 8 MWh Li-ion Battery
• Renewable – 75 MW Wood Bubbling Fluidized Bed (BFB, biomass)
• Renewable – 5 MW Landfill Gas
Non-Dispatchable (Nameplate)
• Renewable – 150 MW Wind - On-Shore
• Renewable – 50 MW Solar PV, Fixed-tilt (FT)
• Renewable – 50 MW Solar PV, Single Axis Tracking (SAT)
Figure F-6: Duke Energy, Screened-In Supply Side Resource Alternatives
Information Sources:
The cost and performance data for each technology being screened is based on research and
information from several sources. These sources include, but may not be limited to the following
internal Departments: Duke Energy’s Project Management & Construction, Emerging
Technologies, and Generation & Regulatory Strategy. The following external sources may also be
Duke Energy Progress North Carolina Integrated Resource Plan
2018 Biennial Report PUBLIC
Page 181

utilized: proprietary third-party engineering studies, the Electric Power Research Institute (EPRI)
Technical Assessment Guide (TAG®), and Energy Information Administration (EIA). In addition,
fuel and operating cost estimates are developed internally by Duke Energy, or from other sources
such as those mentioned above, or a combination of the two. EPRI information or other information
or estimates from external studies are not site-specific, but generally reflect the costs and operating
parameters for installation in the Carolinas. Finally, every effort is made to ensure that capital,
operating and maintenance costs (O&M), fuel costs and other parameters are current and include
similar scope across the technologies being screened. The supply-side screening analysis uses the
same fuel prices for coal and natural gas, and NOx, SO2, and CO2 allowance prices as those utilized
downstream in the detailed analysis (discussed in Appendix A). Screening curves were developed
for each technology to show the economics with and without carbon costs (i.e. No CO2, With CO2)
in the four major categories defined (Baseload, Peaking/Intermediate, Renewable, Storage).
Screening Results:
The results of the screening within each category are shown in the figures below. Results of the
baseload screening show that natural gas combined cycle generation is the least-cost base load
resource. With lower gas prices, larger capacities and increased efficiency, natural gas combined
cycle units have become more cost-effective at higher capacity factors in all carbon scenario
screening cases (i.e. No CO2, With CO2). Although CHP can be competitive with CC, it is site
specific, requiring a local steam and electrical load. The baseload curves also show that projected
SMR nuclear generation may be a cost-effective option at high capacity factors with CO2 costs
included. Carbon capture systems have been demonstrated to reduce coal-fired CO2 emissions to
levels similar to natural gas and will continue to be monitored as they mature; however, their current
cost and uncertainty of safe, reliable storage options has limited the technical viability of this
technology in Duke Energy territories.
The peaking technology screening included F-frame combustion turbines, fast start aero-derivative
combustion turbines, and fast start reciprocating engines. The screening curves show the F-frame
CTs to be the most economic peaking resource unless there is a special application that requires the
fast start capability of the aero-derivative CTs or reciprocating engines. Reciprocating engine
plants offer the lowest heat rates and fastest start times among simple cycle options. Simple
cycle aero-derivative gas turbines still remain in close contention with reciprocating engines.
Should a need be identified for one of these two types of resources, a more in-depth analysis
would be performed.
Duke Energy Progress North Carolina Integrated Resource Plan
2018 Biennial Report PUBLIC
Page 182

The renewable screening curves show solar is a more economical alternative than wind and landfill
gas generation. Solar and wind projects are technically constrained from achieving high capacity
factors making them unsuitable for intermediate or baseload duty cycles. Landfill gas and biomass
projects are limited based on site availability but are dispatchable. Solar projects, like wind, are not
dispatchable and therefore less suited to provide consistent peaking capacity/energy. Aside from
their technical limitations, solar and wind technologies are not currently economically competitive
generation technologies without State and Federal subsidies. These renewable resources do play an
important role in meeting the Company’s NC REPS requirements and sustainability initiatives.
Centralized generation, as depicted above, will remain the backbone of the grid for Duke Energy in
the near term; however, in addition it is likely that distributed generation and storage (see ISOP
discussions) will begin to share more and more grid responsibilities over time as technologies such
as energy storage increase our grid’s flexibility and tolerance for intermittent, distributed resources.
The screening curves are useful for comparing costs of resource types at various capacity factors but
cannot be solely utilized for determining a long-term resource plan because future units must be
optimized with an existing system containing various resource types. Results from the screening
curve analysis provide guidance for the technologies to be further considered in the more detailed
quantitative analysis phase of the planning process.
Capital Cost Forecast:
A capital cost forecast was developed with support from a third party to project not only
Renewables and Battery Storage capital costs, but the costs of all resource technologies technically
screened in. The Technology Forecast Factors were sourced from the Energy Information
Administration (EIA) Annual Energy Outlook (AEO) 2017 which provides costs projections for
various technologies through the planning period as an input to the National Energy Modeling
System (NEMS) utilized by the EIA for the AEO.
Using 2018 as a base year, an "annual forecast factor is calculated based on the macroeconomic
variable tracking the metals and metal products producer price index, thereby creating a link
between construction costs and commodity prices." (NEMS Model Documentation 2016, July
2017)
Duke Energy Progress North Carolina Integrated Resource Plan
2018 Biennial Report PUBLIC
Page 183

From NEMS Model Documentation 2016, July 2017:
"Uncertainty about investment costs for new technologies is captured in the Electric Capacity
Planning module of NEMS (ECP) using technological optimism and learning factors.
- The technological optimism factor reflects the inherent tendency to underestimate costs for
new technologies. The degree of technological optimism depends on the complexity of the
engineering design and the stage of development. As development proceeds and more data
become available, cost estimates become more accurate and the technological optimism
factor declines.
- Learning factors represent reductions in capital costs due to learning-by-doing. Learning
factors are calculated separately for each of the major design components of the technology.
For new technologies, cost reductions due to learning also account for international
experience in building generating capacity. Generally, overnight costs for new, untested
components are assumed to decrease by a technology specific percentage for each doubling
of capacity for the first three doublings, by 10% for each of the next five doublings of
capacity, and by 1% for each further doubling of capacity. For mature components or
conventional designs, costs decrease by 1% for each doubling of capacity."
The resulting Forecast Factor Table developed from the EIA technology maturity curves for each
corresponding technology screened is depicted in Table F-1. A third-party vendor assisted in the
alignment of the technologies screened to their representative forecast factors available from the
EIA for technologies not captured by the EIA. Examples of this include Reciprocating Internal
Combustion Engines (RICE), Battery Storage, and gas turbine technology configurations among
others.
Duke Energy Progress North Carolina Integrated Resource Plan
2018 Biennial Report PUBLIC
Page 184

Table F-1: Snip from Forecast Factor Table by Technology (EIA - AEO 2017)
These forecast factors were blended with additional third-party capital cost projections for more
rapidly developing technologies (i.e. Solar PV, Battery Storage) in order to provide a consistent
forecast through the planning period for all technologies evaluated.
Screening Curves:
The following pages contain the technology screening curves for baseload, peaking/intermediate,
renewable and storage technologies.
Year
Aero
CT
F Class Frame
CT
J Class Frame
CTRICE
Onshore
Wind
1x1 J Class
Combined
Cycle
2x1 J Class
Combined
Cycle
2018 1.000 1.000 1.000 1.000 1.000 1.000 1.000
2019 0.996 0.995 0.995 0.996 0.996 0.995 0.995
2020 0.993 0.990 0.990 0.993 0.993 0.991 0.990
2021 0.989 0.984 0.984 0.989 0.989 0.986 0.984
2022 0.983 0.978 0.978 0.983 0.983 0.980 0.978
2023 0.974 0.967 0.967 0.974 0.974 0.970 0.967
2024 0.965 0.957 0.957 0.965 0.965 0.960 0.957
2025 0.954 0.942 0.942 0.954 0.954 0.947 0.942
2026 0.941 0.920 0.920 0.941 0.941 0.928 0.920
2027 0.928 0.902 0.902 0.928 0.928 0.913 0.902
2028 0.918 0.877 0.877 0.918 0.918 0.894 0.877
2029 0.910 0.859 0.859 0.910 0.910 0.879 0.859
2030 0.901 0.840 0.840 0.901 0.901 0.864 0.840
2031 0.892 0.827 0.827 0.892 0.892 0.853 0.827
2032 0.884 0.815 0.815 0.884 0.884 0.842 0.815
Duke Energy Progress North Carolina Integrated Resource Plan
2018 Biennial Report PUBLIC
Page 185

Duke Energy Progress North Carolina Integrated Resource Plan
2018 Biennial Report PUBLIC
Page 186
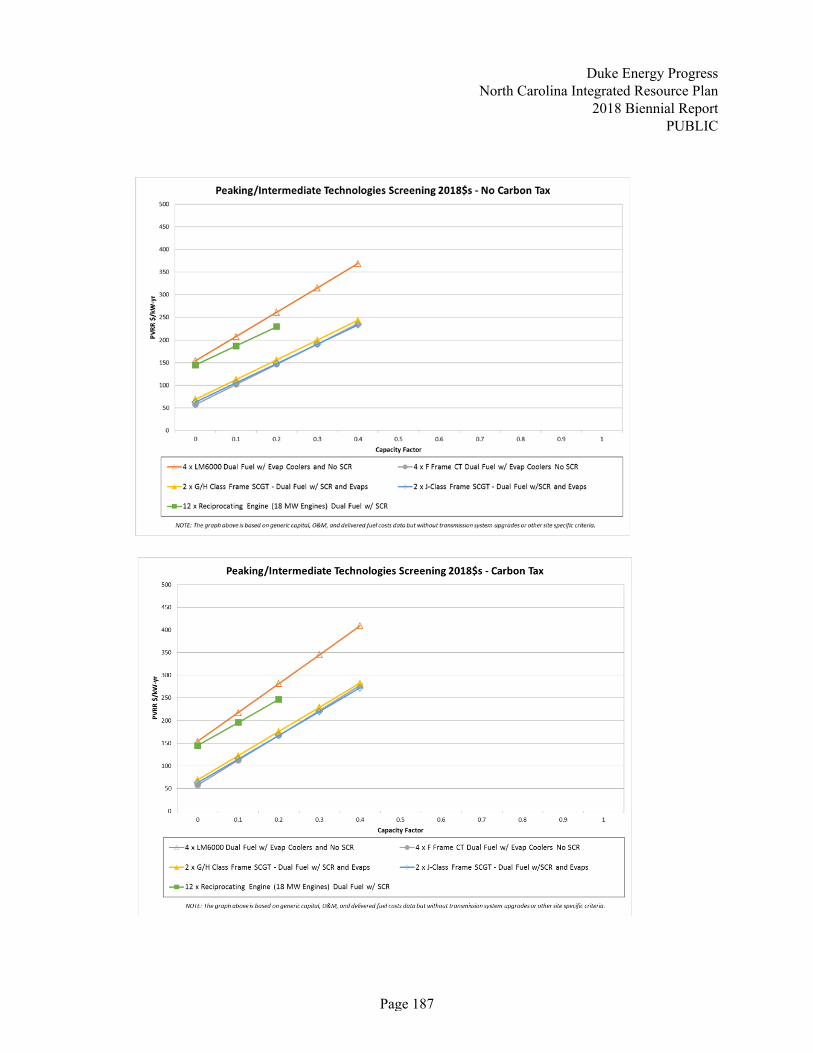
Duke Energy Progress North Carolina Integrated Resource Plan
2018 Biennial Report PUBLIC
Page 187

Duke Energy Progress North Carolina Integrated Resource Plan
2018 Biennial Report PUBLIC
Page 188

APPENDIX G: ENVIRONMENTAL COMPLIANCE
Legislative and Regulatory Issues:
Duke Energy Progress, which is subject to the jurisdiction of Federal agencies including the
Federal Energy Regulatory Commission, EPA, and the NRC, as well as State commissions and
agencies, is potentially impacted by State and Federal legislative and regulatory actions. This
section provides a high-level description of several issues Duke Energy Progress is actively
monitoring or engaged in that could potentially influence the Company’s existing generation
portfolio and choices for new generation resources.
Air Quality:
Duke Energy Progress is required to comply with numerous State and Federal air emission
regulations, including the Cross State Air Pollution Rule (CSAPR) NOx and SO2 cap-and-trade
program, the Mercury and Air Toxics Standards (MATS) rule, and the 2002 North Carolina
Clean Smokestacks Act (NC CSA).
As a result of complying with the NC CSA, Duke Energy Progress reduced its SO2 emissions by
approximately 97% from 2000 to 2017. The law also required additional reductions in NOX
emissions beyond Federal requirements, and Duke Energy Progress has achieved an overall
reduction of 94% from 1996 to 2017. This landmark legislation, which was passed by the North
Carolina General Assembly in June of 2002, calls for some of the lowest state-mandated
emission levels in the nation, and was passed with Duke Energy Progress’ input and support.
The following is a summary of the major air related federal regulatory programs that are currently
impacting or that could impact Duke Energy Progress operations in North Carolina.
Cross-State Air Pollution Rule (CSAPR):
In August 2011, EPA finalized the Cross-State Air Pollution Rule. The CSAPR established state-
level caps on annual SO2 and NOX emissions and ozone season NOX emissions from electric
generating units (EGUs) across the Eastern U.S., including North Carolina. The CSAPR was set up
as a two-phase program with Phase I taking effect in 2012 and Phase II taking effect in 2014. Legal
challenges to the rule resulted in Phase I implementation being delayed until 2015 and Phase II
implementation being delayed until 2017. Duke Energy Progress complied with Phase I of the
CSAPR and with the Phase II annual programs beginning in 2017.
Duke Energy Progress North Carolina Integrated Resource Plan
2018 Biennial Report PUBLIC
Page 189

The CSAPR ozone season NOX program was designed to address interstate transport for the 80
parts per billion (ppb) ozone standard that was established in 1997. In 2008 the EPA lowered the
ozone standard to 75 ppb. In September 2016, EPA published the CSAPR Update Rule to revise
Phase II of the CSAPR ozone season NOX program to address interstate transport for the 75 ppb
standard. EPA did not include North Carolina in the CSAPR Update rule, stating that the state is
not linked to any downwind nonattainment or maintenance receptors for the seasonal ozone
standard. Beginning in 2017, Duke Energy Progress plants are not subject to any CSAPR ozone
season NOx emission limitations.
Mercury and Air Toxics Standards (MATS) Rule:
In February 2012, EPA finalized the MATS rule to regulate emissions of mercury and other
hazardous air pollutants from coal-fired EGUs. The rule established unit-level emission limits for
mercury, acid gases, and non-mercury metals. Compliance with the emission limits was required by
April 16, 2015, or April 16, 2016 if the state permitting authority granted up to a 1-year compliance
extension. Duke Energy Progress is complying with all rule requirements.
National Ambient Air Quality Standards (NAAQS):
8-Hour Ozone NAAQS:
In October 2015, EPA finalized a revision to the 8-Hour Ozone NAAQS, lowering it from 75 to 70
ppb. EPA finalized area designations for the 2015 ozone standard in late 2017 and early 2018.
EPA did not designate any nonattainment areas in North Carolina.
The 70 ppb ozone standard is being challenged in court by numerous parties. Some are challenging
the standard as being too low, while others are challenging the standard as not being low enough.
Duke Energy Progress cannot predict the outcome of the litigation or assess the potential impact of
the lower standard on future operations in North Carolina at this time.
SO2 NAAQS:
On June 22, 2010, EPA finalized a rule establishing a 75 ppb 1-hour SO2 NAAQS. Since then,
EPA has completed two rounds of area designations, neither of which resulted in any areas in North
Carolina being designated nonattainment.
Duke Energy Progress North Carolina Integrated Resource Plan
2018 Biennial Report PUBLIC
Page 190
In August 2015, the EPA finalized its Data Requirements Rule which established requirements for
state air agencies to characterize SO2 air quality levels around certain EGUs using ambient air
quality monitoring or air quality modeling. The Data Requirements Rule also laid out the timeline
for state air agencies to complete air quality characterizations and submit the information to EPA,
and for EPA to finalize area designations.
The North Carolina Department of Environmental Quality provided air quality modeling to EPA to
characterize SO2 air quality around the Duke Energy Progress Mayo station, and has established air
quality monitoring sites around the Duke Energy Progress Asheville and Roxboro stations. Data
collected at these two sites between 2017 and 2019 will be used to demonstrate whether the areas
around those facilities meet attainment. In 2017, EPA issued a determination with respect to the
Mayo station modeling submittal. EPA classified the area surrounding the Mayo station as
“unclassifiable” because of the proximity to the Roxboro station, and will make an additional
determination after the air quality monitoring site near the Roxboro station has collected three years
of data.
On June 8, 2018, after the five-year review required under the Clean Air Act, EPA proposed to
retain the 2010 SO2 NAAQS.
Fine Particulate Matter (PM2.5) NAAQS:
On December 14, 2012, the EPA finalized a rule establishing a 12 microgram per cubic meter
annual PM2.5 NAAQS. The EPA finalized area designations for this standard in December 2014.
That designation process did not result in any areas in North Carolina being designated
nonattainment.
Greenhouse Gas Regulation:
On August 3, 2015, the EPA finalized a rule establishing CO2 new source performance standards
for coal and natural gas combined cycle EGUs that initiated or that initiates construction after
January 8, 2014. The EPA finalized emission standards of 1,400 lb CO2 per gross MWh of
electricity generation for coal units and 1,000 lb CO2 per gross MWh for NGCC units. The standard
for coal units can only be achieved with carbon capture and sequestration technology. Duke Energy
Progress views the EPA rule as barring the development of new coal-fired generation because CCS
is not a demonstrated and available technology for applying to coal units. Duke Energy Progress
considers the standard for NGCC units to be achievable. Numerous parties have filed petitions with
the U.S. Court of Appeals for the District of Columbia (D.C. Circuit) challenging the EPA’s final
Duke Energy Progress North Carolina Integrated Resource Plan
2018 Biennial Report PUBLIC
Page 191

emission standard for new coal units. On March 28, 2017, President Trump signed an executive
order directing EPA to review the rule and determine whether to suspend, revise or rescind it. On
the same day, the Department of Justice (DOJ) filed a motion with the D.C. Circuit Court requesting
that the court stay the litigation of the rule while it is reviewed by EPA. Subsequent to the DOJ
motion, the D.C. Circuit Court canceled oral argument in the case. On August 10, 2017, the court
ordered that the litigation be suspended indefinitely. The rule remains in effect pending the outcome
of litigation and EPA’s review. EPA has not announced a schedule for completing its review. Duke
Energy Progress cannot predict the outcome of these matters but does not expect the impacts of the
current final standards will be material to the company’s operations.
On October 23, 2015, the EPA published in the Federal Register the final Clean Power Plan (CPP)
rule to regulate CO2 emissions from existing fossil fuel-fired EGUs. The CPP established CO2
emission rates and mass cap goals that apply to existing fossil fuel-fired EGUs (existing EGUs are
units that commenced construction prior to January 8, 2014). Petitions challenging the rule were
filed by numerous groups and on February 9, 2016, the Supreme Court issued a stay of the final
CPP rule, halting implementation of the CPP until legal challenges are resolved. Oral arguments
before 10 of the 11 judges on the D.C. Circuit Court were heard on September 27, 2016. The court
has not issued its opinion in the case.
On March 28, 2017, President Trump signed an executive order directing EPA to review the CPP
and determine whether to suspend, revise or rescind the rule. On the same day, the Department of
Justice filed a motion with the D.C. Circuit Court requesting that the court stay the litigation of the
rule while it is reviewed by EPA. On April 28, 2017, the court issued an order to suspend the
litigation for 60 days. On August 8, 2017, the court, on its own motion, extended the suspension of
the litigation for an additional 60 days. On October 16, 2017, EPA issued a Notice of Proposed
Rulemaking (NPR) to repeal the CPP based on a change to EPA’s legal interpretation of the section
of the Clean Air Act on which the CPP was based. The comment period on EPA's NPR ended April
26, 2018. On December 28, 2017, EPA issued an Advance Notice of Proposed Rulemaking
(ANPRM) in which it sought public comment on various aspects of a potential CPP replacement
rule. The comment period on the ANPRM ended February 26, 2018. On July 9, 2018, EPA sent a
proposed CPP replacement rule to the Office of Management and Budget for review; after that
review is completed, EPA will issue its proposal for public comment. Litigation of the CPP remains
on hold in the D.C. Circuit Court and the February 2016 U.S. Supreme Court stay of the CPP
remains in effect. Duke Energy Progress cannot predict the outcome of these matters.
Duke Energy Progress North Carolina Integrated Resource Plan
2018 Biennial Report PUBLIC
Page 192

Water Quality and By-product Issues:
CWA 316(b) Cooling Water Intake Structures:
Federal regulations implementing §316(b) of the Clean Water Act (CWA) for existing facilities
were published in the Federal Register on August 15, 2014 with an effective date of October 14,
2014. The rule regulates cooling water intake structures at existing facilities to address
environmental impacts from fish being impinged (pinned against cooling water intake structures)
and entrainment (being drawn into cooling water systems and affected by heat, chemicals or
physical stress). The final rule establishes aquatic protection requirements at existing facilities and
new on-site generation that withdraw 2 million gallons per day (MGD) or greater from rivers,
streams, lakes, reservoirs, estuaries, oceans, or other waters of the United States. All DEP nuclear
fueled, coal-fired and combined cycle stations, in North and South Carolina are affected sources,
with the exception of Smith Energy14.
The rule establishes two standards, one for impingement and one for entrainment. To demonstrate
compliance with the impingement standard, facilities must choose and implement one of the
following options:
Closed cycle re-circulating cooling system; or
Demonstrate the maximum design through screen velocity is less than 0.5 feet per second
(fps) under all conditions; or
Demonstrate the actual through screen velocity, based on measurement, is less than 0.5
fps; or
Install modified traveling water screens and optimize performance through a two-year
study; or
Demonstrate a system of technologies, practices, and operational measures are optimized
to reduce impingement mortality; or
Demonstrate the impingement latent mortality is reduced to no more than 24% annually
based on monthly monitoring.
In addition to these options, the final rule allows the state permitting agency to establish less
stringent standards if the capacity utilization rate is less than 8% averaged over a 24-month
contiguous period. The rule, also, allows the state permitting agency to determine no further action
14 Richmond County supplies cooling water to Smith Energy; therefore the rule is not applicable.
Duke Energy Progress North Carolina Integrated Resource Plan
2018 Biennial Report PUBLIC
Page 193

warranted if impingement is considered de minimis. Compliance with the impingement standard is
not required until requirements for entrainment are established.
The entrainment standard does not mandate the installation of a technology but rather establishes a
process for the state permitting agency to determine necessary controls, if any, are required to
reduce entrainment mortality on a site-specific basis. Facilities that withdraw greater than 125
MGD are required to submit information to characterize the entrainment and assess the engineering
feasibility, costs, and benefits of closed-cycle cooling, fine mesh screens and other technological
and operational controls. The state permitting agency can determine no further action is required, or
require the installation of fine mesh screens, or conversion to closed-cycle cooling.
The rule requires facilities with a NPDES permit that expire after July 14, 2018 to submit all
necessary 316(b) reports with the renewal application. For facilities with a NPDES permit that
expire prior to July 14, 2018 or are in the renewal process, the state permitting agency is allowed to
establish an alternate submittal schedule. We expect submittals to be due in the 2019 to 2022
timeframe and intake modifications, if necessary to be required in the 2021 to 2025 timeframe,
depending on the NPDES permit renewal date and compliance schedule developed by the state
permitting agency.
Steam Electric Effluent Guidelines:
Federal regulations revising the Effluent Limitations Guidelines and Standards for the Steam
Electric Power Generating Point Source Category (ELG Rule) were published in the Federal
Register on November 3, 2015 with an effective date of January 4, 2016. While the ELG Rule is
applicable to all steam electric generating units, waste streams affected by these revisions are
generated at DEP’s coal-fired facilities. The revisions prohibit the discharge of bottom and fly ash
transport water, and flue gas mercury control wastewater, and establish technology based limits on
the discharge of wastewater generated by Flue Gas Desulfurization (FGD) systems, and leachate
from coal combustion residual landfills and impoundments. The rule, also, establishes technology
based limits on gasification wastewater, but this waste stream is not generated at any of the DEP
facilities. As originally written, the new limits must be incorporated into the applicable stations’
National Pollutant Discharge Elimination System permit based on a date determined by the
permitting authority that is as soon as possible beginning November 1, 2018, but no later than
December 31, 2023, except the limits for CCR leachate, which are effective upon issuance of the
permit after the effective date of the rule. For discharges to publicly owned treatment works
(POTW), the limits must be met by November 1, 2018, as originally written. Petitions challenging
Duke Energy Progress North Carolina Integrated Resource Plan
2018 Biennial Report PUBLIC
Page 194
the rule were filed by several groups and all challenges to the rule were consolidated in the Fifth
Circuit Court of Appeals. On August 22, 2017, the Fifth Circuit Court of Appeals granted EPA’s
Motion to Govern Further Proceedings, thereby severing and suspending the claims related to flue
gas desulfurization wastewater, bottom ash transport water and gasification wastewater.
Separate from the litigation, on August 11, 2017, EPA announced the decision to conduct a
rulemaking to potentially revise the new, more stringent BAT effluent limitations and pretreatment
standards for existing sources in the ELG rule that apply to bottom ash transport water and FGD
wastewater. Subsequently, EPA finalized a rule on September 18, 2017, postponing the earliest
applicability date for bottom ash transport water and FGD wastewater from Nov. 1, 2018 to Nov. 1,
2020 and retained the end applicability date of Dec. 31, 2023. Also, as part of the rule, EPA
reiterated its intent to conduct a new rulemaking to review the limitation guidelines for bottom ash
transport water and FGD wastewater. EPA projects that a new rule on these two issues will be
finalized by December 2019.
The extent to which the rule will affect a particular steam electric generating unit will depend on the
treatment technology currently installed at the station. A summary of the impacts are as follows:
Fly Ash Transport Water: All DEP coal-fired units either handling fly ash dry during normal
operation or are scheduled to be retired prior to the compliance date. However, to ensure fly ash
is handled dry without disruptions to generation, dry fly ash reliability projects are being
completed.
Bottom Ash Transport Water: All DEP coal-fired units, except for Asheville and Mayo Steam
Station, are installing a closed-loop bottom ash transport water recirculating system.
FGD Wastewater: All DEP coal-fired units, except for Asheville and Mayo Steam Station, are
upgrading or completely replacing the existing FGD wastewater treatment system.
CCR Leachate: The revised limits for CCR leachate from impoundments and landfills are the
same as the previous existing limits for low volume waste. Potential impacts are being evaluated
on a facility-specific basis.
Coal Combustion Residuals:
In January 2009, following Tennessee Valley Authority’s Kingston ash pond dike failure December
2008, Congress issued a mandate to EPA to develop federal regulations for the disposal of coal
combustion residuals. CCR includes fly ash, bottom ash, and flue gas desulfurization solids. As
part of that rulemaking, EPA conducted structural integrity inspections of surface impoundments
Duke Energy Progress North Carolina Integrated Resource Plan
2018 Biennial Report PUBLIC
Page 195

nationwide that were used for disposal of CCR. On April 17, 2015, EPA finalized the first federal
regulations for the disposal of CCR (“CCR rule”). The CCR rule regulates CCR as a nonhazardous
waste under Subtitle D of RCRA and allows for beneficial use of CCR with some restrictions. The
effective date of the rule was October 19, 2015.
The CCR rule applies to all new and existing landfills, new and existing surface impoundments still
receiving CCR and existing surface impoundments that are no longer receiving CCR but contain
liquid located at stations currently generating electricity (regardless of fuel source). The CCR rule
establishes national minimum criteria that includes location restrictions, design standards, structural
integrity criteria, groundwater monitoring and corrective action, closure requirements and post-
closure care, and recordkeeping, reporting and other operational procedures to ensure the safe
disposal and management of CCR.
On March 15, 2018, EPA proposed amendments to the CCR rule to reflect the rule’s
implementation through state or federal permit programs and to address issues that were remanded
back to the agency by the U.S. Court of Appeals for the D.C. Circuit following a settlement with
industry and environmental petitioners. On July 17, 2018, EPA finalized a set of changes to the
federal CCR rule (“Phase One, Part One rule”), revising the groundwater protection standards for
four constituents and revising the deadline to commence closure of unlined coal ash impoundments
that fail to meet groundwater protection standards or the aquifer separation location requirement.
EPA also finalized changes that apply only to states with approved CCR permit programs, or where
EPA is permitting authority. Currently, no Duke Energy states have approved permit programs.
EPA has stated it will address the other proposed revisions in a subsequent rulemaking.
Notably, the Phase One, Part One rule did not change any of the major compliance requirements in
the CCR rule, including design criteria, location restrictions, requirements for groundwater
monitoring, structural integrity standards, inspections and corrective action.
In addition to the requirements of the federal CCR regulation, CCR landfills and surface
impoundments will continue to be independently regulated by the state. On September 20, 2014,
the North Carolina Coal Ash Management Act of 2014 (CAMA) became law and was amended on
July 14, 2016.
CAMA establishes requirements regarding the beneficial use of CCR, the closure of existing CCR
surface impoundments, the disposal of CCR at active coal plants, and the handling of surface and
groundwater impacts from CCR surface impoundments. CAMA requires eight CCR surface
Duke Energy Progress North Carolina Integrated Resource Plan
2018 Biennial Report PUBLIC
Page 196

impoundments in North Carolina to be closed no later than December 31, 2019. It also requires
state regulators to provide risk ranking classifications to determine the method and timing for
closing the remaining CCR surface impoundments. Currently, North Carolina Department of
Environmental Quality (NCDEQ) has categorized all remaining CCR surface impoundments as
intermediate risk. CAMA also grants NCDEQ the authority to change an impoundment’s
classification based on completion of dam safety repairs and the establishment of permanent
replacement water supplies within a one-half-mile radius of CCR impoundments. The impact from
both state and federal CCR regulations to Duke Energy Progress is significant.
Duke Energy Progress North Carolina Integrated Resource Plan
2018 Biennial Report PUBLIC
Page 197

l Cl) -\C 00
APPENDIXH: NON-UTILITY GENERATION AND WHOLESALE
Duke Energy Progress North Carolina Integrated Resource Plan
2018 Biennial Report PUBLIC
This appendix contains wholesale sales contracts, firm wholesale purchased power contracts and non-utility generation contract.
Table H-1: Wholesale Sales Contracts [CONFIDENTIAL]
Page 198

'"d
~ -'° '°
Table H-2: Firm Wholesale Purchased Power Contracts [CONFIDEN'fTIAL]
Page 199
Duke Energy Progress North Caroiina integrated Resource Pian
2018 Biennial Report PUBLIC

NON-UTILITY GENERATION FACILITIES – NORTH CAROLINA AND SOUTH
CAROLINA
Please refer to the DEC and DEP Small Generator Interconnection Consolidated Annual Reports
filed on April 2, 2018 in NCUC Docket No. E-100, Sub 113B for details on the DEP North and
South Carolina NUGS. The DEP NUG facilities are comprised of 99% intermediate facilities while
the remaining 1% represents both baseload and peaking facilities. Currently, hydro is considered
baseload, diesel is considered peaking, solar and other renewables are considered intermediate.
Duke Energy Progress North Carolina Integrated Resource Plan
2018 Biennial Report PUBLIC
Page 200

NON-UTILITY GENERATION FACILITIES – SOUTH CAROLINA
Table H-3 contains non-utility generation contracts for facilities located in South Carolina.
Please refer to the attachment, Table H-3 DEC Non-Utility Generator Listing – South Carolina
Facilities.
Duke Energy Progress North Carolina Integrated Resource Plan
2018 Biennial Report PUBLIC
Page 201

APPENDIX I: QF INTERCONNECTION QUEUE
Qualified Facilities contribute to the current and future resource mix of the Company. QFs that are
under contract are captured as designated resources in the base resource plan. QFs that are not yet
under contract but in the interconnection queue may contribute to the undesignated additions
identified in the resource plans. It is not possible to precisely estimate how much of the
interconnection queue will come to fruition, however the current queue clearly supports solar
generation’s central role in DEP’s NC REPS compliance plan and HB 589.
Below is a summary of the interconnection queue as of June 30, 2018:
Table I-1: DEP QF Interconnection Queue
Note: (1) Above table includes all QF projects that are in various phases of the interconnection queue
and not yet generating energy.
(2) Table does not include net metering interconnection requests.
Utility
11.0
562.7
4,519.2
DEP
DEP
DEP Total
Other 1
Natural Gas 4
Solar 299
NC Total 307
SC Total 155
NC
Facility State Energy Source TypeNumber of Pending
ProjectsPending Capacity (MW AC)
1 4.2
Battery 2 13.8
Biomass
5,110.9
SCNo Data 5 10.0
Solar 150 2,464.8
2,474.8
462 7,585.6
Duke Energy Progress North Carolina Integrated Resource Plan
2018 Biennial Report PUBLIC
Page 202
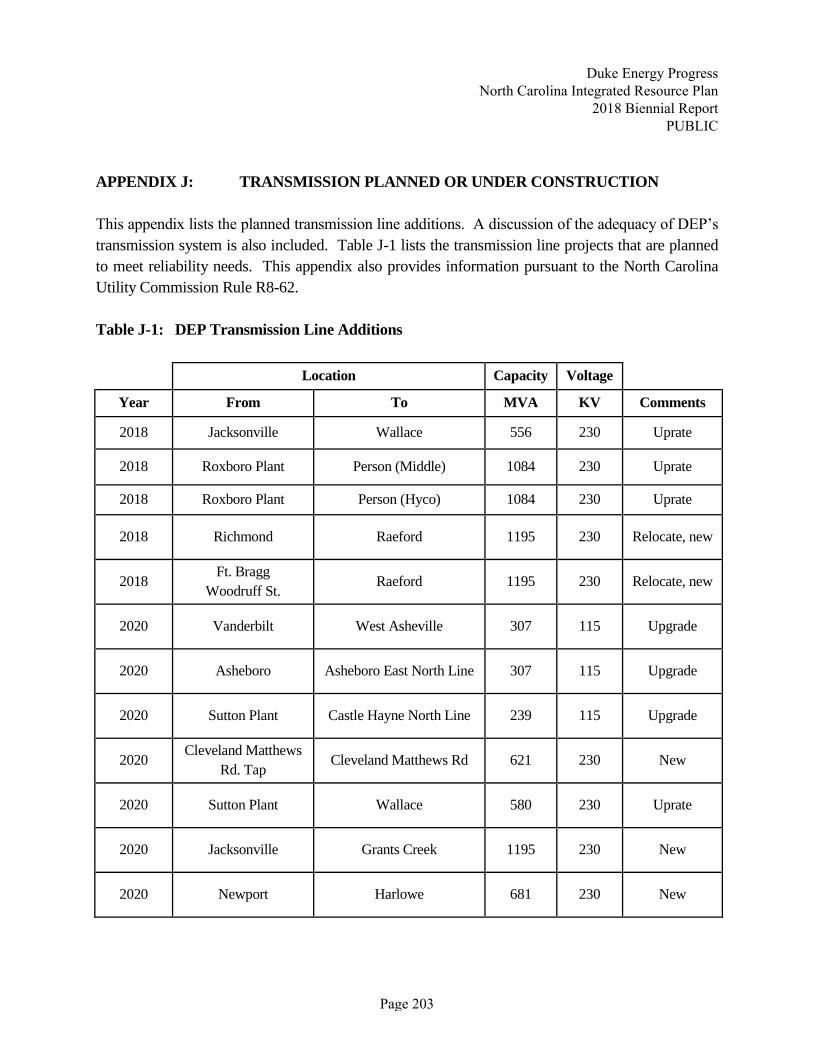
APPENDIX J: TRANSMISSION PLANNED OR UNDER CONSTRUCTION
This appendix lists the planned transmission line additions. A discussion of the adequacy of DEP’s
transmission system is also included. Table J-1 lists the transmission line projects that are planned
to meet reliability needs. This appendix also provides information pursuant to the North Carolina
Utility Commission Rule R8-62.
Table J-1: DEP Transmission Line Additions
Location Capacity Voltage
Year From To MVA KV Comments
2018 Jacksonville Wallace 556 230 Uprate
2018 Roxboro Plant Person (Middle) 1084 230 Uprate
2018 Roxboro Plant Person (Hyco) 1084 230 Uprate
2018 Richmond Raeford 1195 230 Relocate, new
2018 Ft. Bragg
Woodruff St. Raeford 1195 230 Relocate, new
2020 Vanderbilt West Asheville 307 115 Upgrade
2020 Asheboro Asheboro East North Line 307 115 Upgrade
2020 Sutton Plant Castle Hayne North Line 239 115 Upgrade
2020 Cleveland Matthews
Rd. Tap Cleveland Matthews Rd 621 230 New
2020 Sutton Plant Wallace 580 230 Uprate
2020 Jacksonville Grants Creek 1195 230 New
2020 Newport Harlowe 681 230 New
Duke Energy Progress North Carolina Integrated Resource Plan
2018 Biennial Report PUBLIC
Page 203

Rule R8-62: Certificates of environmental compatibility and public convenience and necessity for
the construction of electric transmission lines in North Carolina.
(p) Plans for the construction of transmission lines in North Carolina (161 kV and above) shall
be incorporated in filings made pursuant to Commission Rule R8-60. In addition, each
public utility or person covered by this rule shall provide the following information on an
annual basis no later than September 1:
(1) For existing lines, the information required on FERC Form 1, pages 422, 423, 424,
and 425, except that the information reported on pages 422 and 423 may be reported every
five years.
Please refer to the Company’s FERC Form No. 1 filed with NCUC in April 2018.
(p) Plans for the construction of transmission lines in North Carolina (161 kV and above)
shall be incorporated in filings made pursuant to Commission Rule R8-60. In addition,
each public utility or person covered by this rule shall provide the following
information on an annual basis no later than September 1:
(2) For lines under construction, the following:
a. Commission docket number;
b. Location of end point(s);
c. Length;
d. Range of right-of-way width;
e. Range of tower heights;
f. Number of circuits;
g. Operating voltage;
h. Design capacity;
i. Date construction started;
j. Projected in-service date;
Richmond – Raeford 230 kV Line loop-in:
Project Description: Loop-In the existing 230 kV transmission line from the Richmond 230 kV
Substation in Richmond County to the Ft. Bragg Woodruff St 230 kV Substation in Cumberland
County at Raeford 230 kV Substation in Hoke County.
Duke Energy Progress North Carolina Integrated Resource Plan
2018 Biennial Report PUBLIC
Page 204
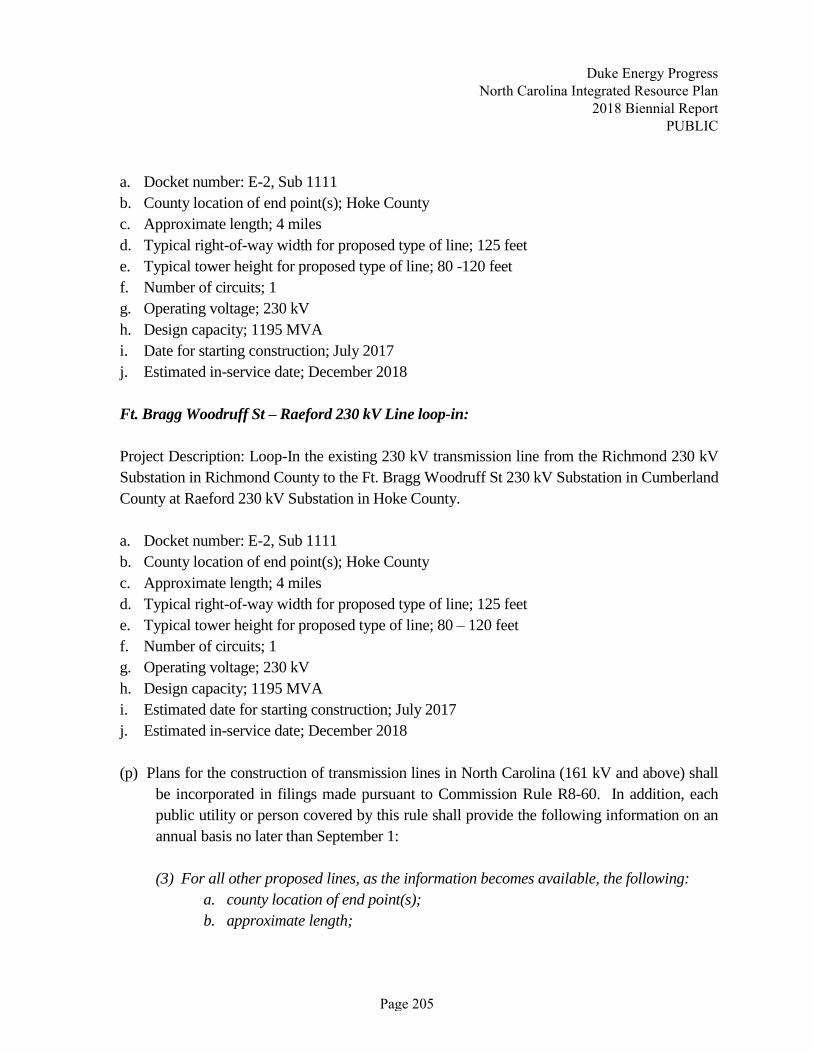
a. Docket number: E-2, Sub 1111
b. County location of end point(s); Hoke County
c. Approximate length; 4 miles
d. Typical right-of-way width for proposed type of line; 125 feet
e. Typical tower height for proposed type of line; 80 -120 feet
f. Number of circuits; 1
g. Operating voltage; 230 kV
h. Design capacity; 1195 MVA
i. Date for starting construction; July 2017
j. Estimated in-service date; December 2018
Ft. Bragg Woodruff St – Raeford 230 kV Line loop-in:
Project Description: Loop-In the existing 230 kV transmission line from the Richmond 230 kV
Substation in Richmond County to the Ft. Bragg Woodruff St 230 kV Substation in Cumberland
County at Raeford 230 kV Substation in Hoke County.
a. Docket number: E-2, Sub 1111
b. County location of end point(s); Hoke County
c. Approximate length; 4 miles
d. Typical right-of-way width for proposed type of line; 125 feet
e. Typical tower height for proposed type of line; 80 – 120 feet
f. Number of circuits; 1
g. Operating voltage; 230 kV
h. Design capacity; 1195 MVA
i. Estimated date for starting construction; July 2017
j. Estimated in-service date; December 2018
(p) Plans for the construction of transmission lines in North Carolina (161 kV and above) shall
be incorporated in filings made pursuant to Commission Rule R8-60. In addition, each
public utility or person covered by this rule shall provide the following information on an
annual basis no later than September 1:
(3) For all other proposed lines, as the information becomes available, the following:
a. county location of end point(s);
b. approximate length;
Duke Energy Progress North Carolina Integrated Resource Plan
2018 Biennial Report PUBLIC
Page 205

c. typical right-of-way width for proposed type of line;
d. typical tower height for proposed type of line;
e. number of circuits;
f. operating voltage;
g. design capacity;
h. estimated date for starting construction (if more than 6-month delay from last
report, explain); and
i. estimated in-service date (if more than 6-month delay from last report,
explain). (NCUC Docket No. E-100, Sub 62, 12/4/92; NCUC Docket No. E-
100, Sub 78A, 4/29/98.)
The following pages represent those projects in response to Rule R8-62 part (3).
Cleveland Matthews Road 230 kV Tap Line:
Project Description: Construct new 230 kV transmission line from the Erwin-Selma 230 kV Line
in Johnston County to the Cleveland Matthews Road 230 kV Substation in Johnston County.
a. County location of end point(s); Johnston County
b. Approximate length; 11.5 miles
c. Typical right-of-way width for proposed type of line; 125 feet
d. Typical tower height for proposed type of line; 80 – 120 feet
e. Number of circuits; 1
f. Operating voltage; 230 kV
g. Design capacity; 621 MVA
h. Estimated date for starting construction; October 2018
i. Estimated in-service date; June 2020
Duke Energy Progress North Carolina Integrated Resource Plan
2018 Biennial Report PUBLIC
Page 206

Jacksonville – Grants Creek 230 kV Line:
Project Description: Construct new 230 kV transmission line from the Jacksonville 230 kV
Substation in Onslow County to the Grants Creek 230 kV Substation in Onslow County.
j. County location of end point(s); Onslow County
k. Approximate length; 15 miles
l. Typical right-of-way width for proposed type of line; 125 feet
m. Typical tower height for proposed type of line; 80 – 120 feet
n. Number of circuits; 1
o. Operating voltage; 230 kV
p. Design capacity; 1195 MVA
q. Estimated date for starting construction; October 2018
r. Estimated in-service date; June 2020
Newport – Harlowe 230 kV Line:
Project Description: Construct new 230 kV transmission line from the Newport 230 kV
Substation in Carteret County to the Harlowe 230 kV Substation in Carteret County.
a. County location of end point(s); Carteret County
b. Approximate length; 8 miles
c. Typical right-of-way width for proposed type of line; 125 feet
d. Typical tower height for proposed type of line; 80 – 120 feet
e. Number of circuits; 1
f. Operating voltage; 230 kV
g. Design capacity; 681 MVA
h. Estimated date for starting construction; January 2019
i. Estimated in-service date; June 2020
Duke Energy Progress North Carolina Integrated Resource Plan
2018 Biennial Report PUBLIC
Page 207

DEP Transmission System Adequacy:
DEP monitors the adequacy and reliability of its transmission system and interconnections
through internal analysis and participation in regional reliability groups. Internal transmission
planning looks 10 years ahead at available generating resources and projected load to identify
transmission system upgrade and expansion requirements. Corrective actions are planned and
implemented in advance to ensure continued cost-effective and high-quality service. The DEP
transmission model is incorporated into models used by regional reliability groups in developing
plans to maintain interconnected transmission system reliability. DEP works with DEC, North
Carolina Electric Membership Corporation (NCEMC) and ElectriCities to develop an annual
NC Transmission Planning Collaborative (NCTPC) plan for the DEP and DEC systems in both
North and South Carolina. In addition, transmission planning is coordinated with neighboring
systems including South Carolina Electric & Gas (SCE&G) and Santee Cooper under a number
of mechanisms including legacy interchange agreements between SCE&G, Santee Cooper,
DEP, and DEC.
The Company monitors transmission system reliability by evaluating changes in load,
generating capacity, transactions and topography. A detailed annual screening ensures
compliance with DEP’s Transmission Planning Summary guidelines for voltage and thermal
loading. The annual screening uses methods that comply with SERC Reliability Corporation
(SERC) policy and North American Electric Reliability Corporation (NERC) Reliability
Standards and the screening results identify the need for future transmission system expansion
and upgrades. The transmission system is planned to ensure that no equipment overloads and
adequate voltage is maintained to provide reliable service. The most stressful scenario is
typically at projected peak load with certain equipment out of service. A thorough screening
process is used to analyze the impact of potential equipment failures or other disturbances. As
problems are identified, solutions are developed and evaluated.
Transmission planning and requests for transmission service and generator interconnection are
interrelated to the resource planning process. DEP currently evaluates all transmission
reservation requests for impact on transfer capability, as well as compliance with the
Company’s Transmission Planning Summary guidelines and the FERC Open Access
Transmission Tariff (OATT). The Company performs studies to ensure transfer capability is
acceptable to meet reliability needs and customers’ expected use of the transmission system.
Generator interconnection requests are studied in accordance with the Large and Small
Duke Energy Progress North Carolina Integrated Resource Plan
2018 Biennial Report PUBLIC
Page 208

Generator Interconnection Procedures in the OATT and the North Carolina and South Carolina
Interconnection Procedures.
SERC audits DEP every three years for compliance with NERC Reliability Standards.
Specifically, the audit requires DEP to demonstrate that its transmission planning practices meet
NERC standards and to provide data supporting the Company’s annual compliance filing
certifications. SERC conducted a NERC Reliability Standards compliance audit of DEP in
December 2016. DEP received “No Findings” from the audit team.
DEP participates in a number of regional reliability groups to coordinate analysis of regional,
sub-regional and inter-balancing authority area transfer capability and interconnection
reliability. Each reliability group’s purpose is to:
• Assess the interconnected system’s capability to handle large firm and non-firm
transactions for purposes of economic access to resources and system reliability;
• Ensure that planned future transmission system improvements do not adversely
affect neighboring systems; and
• Ensure interconnected system compliance with NERC Reliability Standards.
Regional reliability groups evaluate transfer capability and compliance with NERC Reliability
Standards for the upcoming peak season and five- and ten-year periods. The groups also
perform computer simulation tests for high transfer levels to verify satisfactory transfer
capability.
Application of the practices and procedures described above ensures that DEP’s transmission
system continues to provide reliable service to its native load and firm transmission customers.
Duke Energy Progress North Carolina Integrated Resource Plan
2018 Biennial Report PUBLIC
Page 209

APPENDIX K: ECONOMIC DEVELOPMENT
Customers Served Under Economic Development:
In the NCUC Order issued in Docket No. E-100, Sub 73 dated November 28, 1994, the NCUC
ordered North Carolina utilities to review the combined effects of existing economic
development rates within the approved IRP process and file the results in its short-term action
plan. The incremental load (demand) for which customers are receiving credits under economic
development rates and/or self-generation deferral rates (Rider EC), as well as economic
redevelopment rates (Rider ER) as of June 2018 is:
Rider EC:
25 MW for North Carolina
7 MW for South Carolina
Rider ER:
1.2 MW for North Carolina
0 MW for South Carolina
Duke Energy Progress North Carolina Integrated Resource Plan
2018 Biennial Report PUBLIC
Page 210
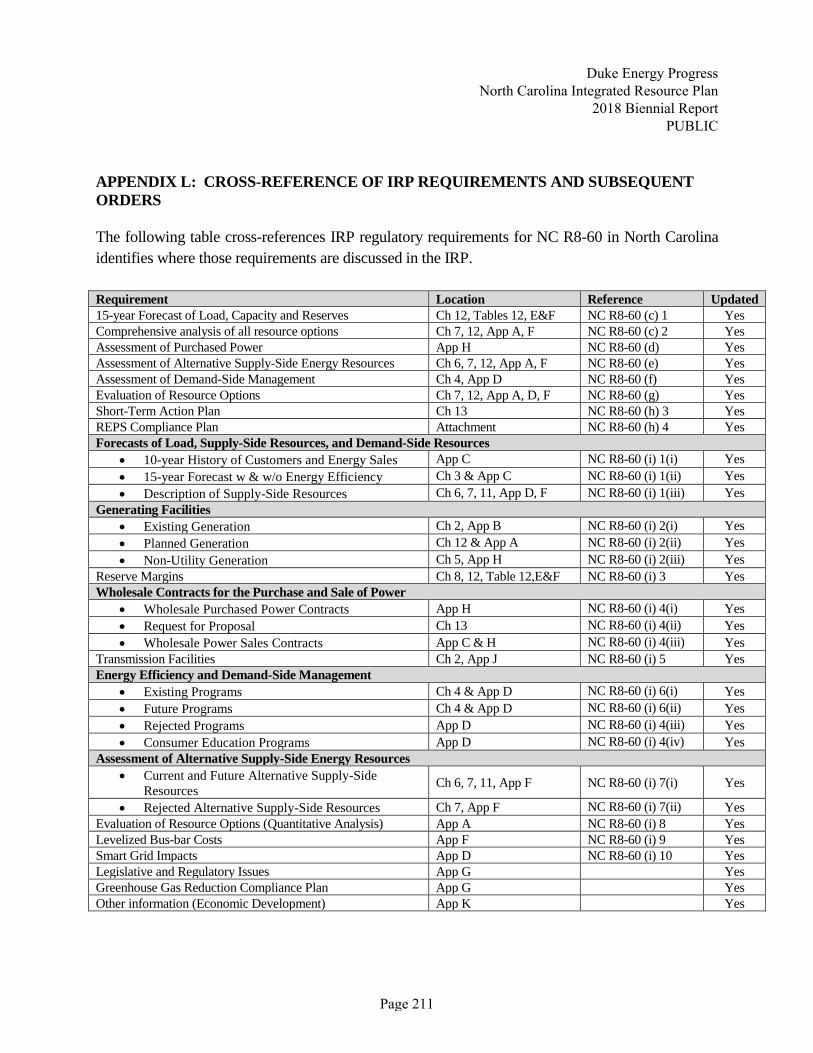
APPENDIX L: CROSS-REFERENCE OF IRP REQUIREMENTS AND SUBSEQUENT
ORDERS
The following table cross-references IRP regulatory requirements for NC R8-60 in North Carolina
identifies where those requirements are discussed in the IRP.
Requirement Location Reference Updated
15-year Forecast of Load, Capacity and Reserves Ch 12, Tables 12, E&F NC R8-60 (c) 1 Yes
Comprehensive analysis of all resource options Ch 7, 12, App A, F NC R8-60 (c) 2 Yes
Assessment of Purchased Power App H NC R8-60 (d) Yes
Assessment of Alternative Supply-Side Energy Resources Ch 6, 7, 12, App A, F NC R8-60 (e) Yes
Assessment of Demand-Side Management Ch 4, App D NC R8-60 (f) Yes
Evaluation of Resource Options Ch 7, 12, App A, D, F NC R8-60 (g) Yes
Short-Term Action Plan Ch 13 NC R8-60 (h) 3 Yes
REPS Compliance Plan Attachment NC R8-60 (h) 4 Yes
Forecasts of Load, Supply-Side Resources, and Demand-Side Resources
• 10-year History of Customers and Energy Sales App C NC R8-60 (i) 1(i) Yes
• 15-year Forecast w & w/o Energy Efficiency Ch 3 & App C NC R8-60 (i) 1(ii) Yes
• Description of Supply-Side Resources Ch 6, 7, 11, App D, F NC R8-60 (i) 1(iii) Yes
Generating Facilities
• Existing Generation Ch 2, App B NC R8-60 (i) 2(i) Yes
• Planned Generation Ch 12 & App A NC R8-60 (i) 2(ii) Yes
• Non-Utility Generation Ch 5, App H NC R8-60 (i) 2(iii) Yes
Reserve Margins Ch 8, 12, Table 12,E&F NC R8-60 (i) 3 Yes
Wholesale Contracts for the Purchase and Sale of Power
• Wholesale Purchased Power Contracts App H NC R8-60 (i) 4(i) Yes
• Request for Proposal Ch 13 NC R8-60 (i) 4(ii) Yes
• Wholesale Power Sales Contracts App C & H NC R8-60 (i) 4(iii) Yes
Transmission Facilities Ch 2, App J NC R8-60 (i) 5 Yes
Energy Efficiency and Demand-Side Management
• Existing Programs Ch 4 & App D NC R8-60 (i) 6(i) Yes
• Future Programs Ch 4 & App D NC R8-60 (i) 6(ii) Yes
• Rejected Programs App D NC R8-60 (i) 4(iii) Yes
• Consumer Education Programs App D NC R8-60 (i) 4(iv) Yes
Assessment of Alternative Supply-Side Energy Resources
• Current and Future Alternative Supply-Side
ResourcesCh 6, 7, 11, App F NC R8-60 (i) 7(i) Yes
• Rejected Alternative Supply-Side Resources Ch 7, App F NC R8-60 (i) 7(ii) Yes
Evaluation of Resource Options (Quantitative Analysis) App A NC R8-60 (i) 8 Yes
Levelized Bus-bar Costs App F NC R8-60 (i) 9 Yes
Smart Grid Impacts App D NC R8-60 (i) 10 Yes
Legislative and Regulatory Issues App G Yes
Greenhouse Gas Reduction Compliance Plan App G Yes
Other information (Economic Development) App K Yes
Duke Energy Progress North Carolina Integrated Resource Plan
2018 Biennial Report PUBLIC
Page 211

The following table cross-references Subsequent Orders for information that is required by the NCUC for
inclusion in future IRP documents.
Change Location Source (Docket and Order Date) Updated
IOUs should continue to monitor and report
any changes of more than 10% in the energy
and capacity savings derived from DSM and
EE between successive IRPs, and evaluate and
discuss any changes on a program-specific
basis. Any issues impacting program
deployment should be thoroughly explained
and quantified in future IRPs.
App D E-100, Sub 141, Order Approving
Integrated Resource Plans and
REPS Compliance Plans, dated
6/26/15, ordering paragraph 7
E-100, Sub 128, Order Approving
2011 Annual Updates to 2010
IRPs and 2011 REPS Compliance
Plans, dated 5/30/12, ordering
paragraph 8
N/A
Each IOU shall continue to include a
discussion of the status of EE market potential
studies or updates in their future IRPs.
App D E-100, Sub 141, Order Approving
Integrated Resource Plans and
REPS Compliance Plans, dated
6/26/15, ordering paragraph 8
E-100, Sub 128, Order Approving
2011 Annual Updates to 2010
IRPs and 2011 REPS Compliance
Plans, dated 5/30/12, ordering
paragraph 9
Yes
All IOUs shall include in future IRPs a full
discussion of the drivers of each class’ load
forecast, including new or changed demand of
a particular sector or sub-group.
Ch 3, App C E-100, Sub 141, Order Approving
Integrated Resource Plan Annual
Update Reports and REPS
Compliance Plans, dated 6/26/15,
ordering paragraph 9
E-100, Sub 137, Order Approving
Integrated Resource Plan Annual
Update Reports and REPS
Compliance Plans, dated 6/30/14,
ordering paragraph 9
E-100, Sub 133, Order Denying
Rulemaking Petition (Allocation
Methods), dated 10/30/12,
ordering paragraph 4
Yes
Duke Energy Progress North Carolina Integrated Resource Plan
2018 Biennial Report PUBLIC
Page 212

Change Location Source (Docket and Order Date) Updated
To the extent an IOU selects a preferred
resource scenario based on fuel diversity, the
IOU should provide additional support for its
decision based on the costs and benefits of
alternatives to achieve the same goals.
N/A E-100, Sub 141, Order Approving
Integrated Resource Plans and
REPS Compliance Plans, dated
6/26/15, ordering paragraph 13
E-100, Sub 137, Order Approving
Integrated Resource Plan Annual
Update Reports and REPS
Compliance Plans, dated 6/30/14,
ordering paragraph 13
E-100, Sub 137, Order Approving
Integrated Resource Plans and
REPS Compliance Plans, dated
10/14/13, ordering paragraph 16
N/A
Future IRP filings by DEP and DEC shall
continue to provide information on the
number, resource type and total capacity of the
facilities currently within the respective
utility’s interconnection queue as well as a
discussion of how the potential QF purchases
would affect the utility’s long-range energy
and capacity needs.
Ch 5
App A
App I
E-100, Sub 141, Order Approving
Integrated Resource Plans and
REPS Compliance Plans, dated
6/26/15, ordering paragraph 14
E-100, Sub 137, Order Approving
Integrated Resource Plan Annual
Update Reports and REPS
Compliance Plans, dated 6/30/14,
ordering paragraph 14
Yes
Consistent with the Commission’s May 7,
2013 Order in M-100, Sub 135, the IOUs shall
include with their 2014 IRP submittals verified
testimony addressing natural gas issues, as
detailed in the body of that Order.
N/A E-100, Sub 141, Order Approving
Integrated Resource Plans and
REPS Compliance Plans, dated
6/26/15, ordering paragraph 15
E-100, Sub 137, Order Approving
Integrated Resource Plan Annual
Update Reports and REPS
Compliance Plans, dated 6/30/14,
ordering paragraph 15
E-100, Sub 137, Order Approving
Integrated Resource Plans and
REPS Compliance Plans, dated
10/14/13, ordering paragraph 17
N/A
Duke Energy Progress North Carolina Integrated Resource Plan
2018 Biennial Report PUBLIC
Page 213
Change Location Source (Docket and Order Date) Updated
DEP and DNCP shall provide additional
details and discussion of projected alternative
supply side resources similar to the
information provided by DEC.
Ch 6, 7, 12,
App A, F
E-100, Sub 137, Order Approving
Integrated Resource Plans and
REPS Compliance Plans, dated
10/14/13, ordering paragraph 14
Yes
DEC and DEP should consider additional
resource scenarios that include larger amounts
of renewable energy resources similar to
DNCP’s Renewable Plan, and to the extent
those scenarios are not selected, discuss why
the scenario was not selected.
Ch 5, 12,
App A
E-100, Sub 137, Order Approving
Integrated Resource Plans and
REPS Compliance Plans, dated
10/14/13, ordering paragraph 15
Yes
DEP, DEC and DNCP shall annually review
their REPS compliance plans from four years
earlier and disclose any redacted information
that is no longer a trade secret.
[This is filed in the docket of the prior IRP
rather than the new IRP.]
Attached
NC REPS
Compliance
Plan
E-100, Sub 137, Order Granting in
Part and Denying in Part Motion
for Disclosure, dated 6/3/13,
ordering paragraph 3
Yes
[2013] Duke shall show the peak demand and
energy savings impacts of each
measure/option in the Program separately from
each other, and separately from the impacts of
its other existing PowerShare DSM program
options in its future IRP and DSM filings, and
in its evaluation, measurement, and
verification reports for each measure of the
Program.
[2011] Duke shall show the impacts of the
Program separately from the impacts of its
existing PowerShare DSM options in future
IRP and DSM filings, and Duke shall conduct
and present separate M&V of the Program’s
impacts.
App D E-7, Sub 953, Order Approving
Amended Program, dated 1/24/13,
ordering paragraph 4 (PowerShare
Call Option Nonresidential Load
and Curtailment Program)
E-7, Sub 953, Order Approving
Program, dated 3/31/11, ordering
paragraph 4
Yes
Duke Energy Progress North Carolina Integrated Resource Plan
2018 Biennial Report PUBLIC
Page 214

Change Location Source (Docket and Order Date Updated
DEP will incorporate into future IRPs
any demand and energy savings
resulting from the Energy Efficiency
Education Program, My Home Energy
Report Program, Multi-Family Energy
Efficiency Program, Small Business
Energy Saver Program, and
Residential New Construction
Program.
App D E-2, Sub 1060, Order Approving
Program, dated 12/18/14, p. 2
E-2, Sub 1059, Order Approving
Program, dated 12/18/14, p. 2
E-2, Sub 989, Order Approving
Program, dated 12/18/14, p. 3
E-2, Sub 1022, Order Approving
Program, dated 11/5/12, footnote 2
(Small Business Energy Saver)
E-2, Sub 1021, Order Approving
Program, dated 10/2/12, footnote 3
(Residential New Construction
Program)
Yes
Each utility shall include in each
biennial report potential impacts of
smart grid technology on resource
planning and load forecasting: a
present and five-year outlook – see
R8-60(i)(10).
App D E-100, Sub 126, Order Amending
Commission Rule R8-60 and
Adopting Commission Rule R8-
60.1, dated 4/11/12
Yes
DEP shall reflect plant retirements and
address its progress in retiring its
unscrubbed coal units by updates in its
annual IRP filings.
Exec Summ,
App B
E-2, Sub 960, Order Approving
Plan, dated 1/28/10, ordering
paragraph 2 (Wayne County CCs
CPCN)
Yes
Duke Energy Progress North Carolina Integrated Resource Plan
2018 Biennial Report PUBLIC
Page 215
LOGO
ATTACHMENT I: The Duke Energy Progress NC Renewable Energy &
Energy Efficiency Portfolio Standard (NC REPS)
Compliance Plan
Page 216

NC REPS COMPLIANCE PLAN CONTENTS:
I. INTRODUCTION .................................................................................................................... 218
II. REPS COMPLIANCE OBLIGATION .................................................................................. 219
III. REPS COMPLIANCE PLAN ................................................................................................. 220
A. SOLAR ENERGY RESOURCES .......................................................................... 220
B. SWINE WASTE-TO-ENERGY RESOURCES .................................................... 221
C. POULTRY WASTE-TO-ENERGY RESOURCES .............................................. 225
D. GENERAL REQUIREMENT RESOURCES ....................................................... 226
E. SUMMARY OF RENEWABLE RESOURCES ................................................... 229
IV. COST IMPLICATIONS OF REPS COMPLIANCE PLAN ............................................... 229
A. CURRENT AND PROJECTED AVOIDED COST RATES ............................... 229
B. PROJECTED TOTAL NC RETAIL AND WHOLESALE SALES
AND YEAR-END CUSTOMER ACCOUNTS BY CLASS ................................. 231
C. PROJECTED ANNUAL COST CAP COMPARISON OF TOTAL AND
INCREMENTAL COSTS, REPS RIDER AND FUEL COST IMPACT ........... 231
EXHIBIT A ............................................................................................................................................. 232
EXHIBIT B: ........................................................................................................................................... 240
Duke Energy Progress North Carolina Integrated Resource Plan
2018 Biennial Report PUBLIC
Page 217

I. INTRODUCTION
Duke Energy Progress, LLC (DEP or the Company) submits its annual Renewable Energy and
Energy Efficiency Portfolio Standard (NC REPS or REPS) Compliance Plan (Compliance Plan) in
accordance with NC Gen. Stat. § 62-133.8 and North Carolina Utilities Commission
(the Commission) Rule R8-67(b). This Compliance Plan, set forth in detail in Section II and Section
III, provides the required information and outlines the Company’s projected plans to comply with NC
REPS for the period 2018 to 2020 (the Planning Period). Section IV addresses the cost implications
of the Company’s REPS Compliance Plan.
In 2007, the North Carolina General Assembly enacted Session Law 2007-397 (Senate Bill 3),
codified in relevant part as NC Gen. Stat. § 62-133.8, in order to:
• Diversify the resources used to reliably meet the energy needs of consumers in the State;
• Provide greater energy security through the use of indigenous energy resources available
within the State;
• Encourage private investment in renewable energy and energy efficiency; and
• Provide improved air quality and other benefits to energy consumers and citizens of the
State.
As part of the broad policy initiatives listed above, Senate Bill 3 established the NC REPS, which
requires the investor-owned utilities, electric membership corporations or co-operatives, and
municipalities to procure or produce renewable energy, or achieve energy efficiency savings, in
amounts equivalent to specified percentages of their respective retail megawatt-hour (MWh) sales
from the prior calendar year.
Duke Energy Progress seeks to advance these State policies and comply with its REPS obligations
through a diverse portfolio of cost-effective renewable energy and energy efficiency resources.
Specifically, the key components of Duke Energy Progress’ 2018 Compliance Plan include: (1)
purchases of renewable energy certificates (RECs); (2) constructing and operating Company-owned
renewable facilities; (3) energy efficiency programs that will generate savings that can be counted
towards the Company’s REPS obligation; and (4) research studies to enhance the Company’s ability
to comply with its future REPS obligations. The Company believes that these actions yield a
diverse portfolio of qualifying resources and allow a flexible mechanism for compliance with
the requirements of NC Gen. Stat. § 62-133.8.
Duke Energy Progress North Carolina Integrated Resource Plan
2018 Biennial Report PUBLIC
Page 218

In addition, the Company has undertaken, and will continue to undertake, specific regulatory and
operational initiatives to support REPS compliance, including: (1) submission of regulatory
applications to pursue reasonable and appropriate renewable energy and energy efficiency initiatives
in support of the Company’s REPS compliance needs; (2) solicitation, review, and analysis of
proposals from renewable energy suppliers offering RECs and diligent pursuit of the most attractive
opportunities, as appropriate; and (3) development and implementation of administrative processes to
manage the Company’s REPS compliance operations, such as procuring and managing renewable
resource contracts, accounting for RECs, safely interconnecting renewable energy suppliers, reporting
renewable generation to the North Carolina Renewable Energy Tracking System (NC-RETS), and
forecasting renewable resource availability and cost in the future.
The Company believes these actions collectively constitute a thorough and prudent plan for
compliance with NC REPS and demonstrate the Company’s commitment to pursue its renewable
energy and energy efficiency strategies for the benefit of its customers.
II. REPS COMPLIANCE OBLIGATION
Duke Energy Progress calculates its NC REPS Compliance Obligations1 for 2018, 2019, and 2020
based on interpretation of the statute (NC Gen. Stat. § 62-133.8), the Commission’s rules
implementing Senate Bill 3 (Rule R8-67), and subsequent Commission orders, as applied to the
Company’s actual or forecasted retail sales in the Planning Period. The Company’s contracts with
wholesale customers for whom it supplied REPS compliance services terminated on December 31,
2017, therefore, this Compliance Plan only reflects REPS compliance services for DEP’s retail
customers. Table 1 below shows the Company’s retail customers’ REPS Compliance Obligation.
1 For the purposes of this Compliance Plan, Compliance Obligation is more specifically defined as Duke Energy Progress’ native load obligations for the Company’s retail sales. The Company’s contracts with the Town of Sharpsburg, the Town of Statonsburg, the Town of Lucama, the Town of Black Creek and the Town of Winterville terminated on December 31, 2017
Duke Energy Progress North Carolina Integrated Resource Plan
2018 Biennial Report PUBLIC
Page 219

Table 1: Duke Energy Progress’ NC REPS Compliance Obligation
As shown in Table 1, the Company’s requirements in the Planning Period include the solar energy
resource requirement (Solar Set-Aside), swine waste resource requirement (Swine Waste Set-Aside),
and poultry waste resource requirement (Poultry Waste Set-Aside). In addition, the Company must
also ensure that, in total, the RECs that it produces or procures, combined with energy efficiency
savings, is an amount equivalent to 10% of its prior-year retail sales in compliance years 2018, 2019
and 2020. The Company refers to this as its Total Obligation. For clarification, the Company refers
to its Total Obligation, net of the Solar, Swine Waste, and Poultry Waste Set-Aside requirements, as
its General Requirement.
III. REPS COMPLIANCE PLAN
In accordance with Commission Rule R8-67b(1)(i), the Company describes its planned actions to
comply with the Solar, Swine Waste, and Poultry Waste Set-Asides, as well as the General
Requirement below. The discussion first addresses the Company’s efforts to meet the Set-Aside
requirements and then outlines the Company’s efforts to meet its General Requirement in the Planning
Period.
A. SOLAR ENERGY RESOURCES
Pursuant to NC Gen. Stat. § 62-133.8(d), the Company must produce or procure solar RECs
equal to a minimum of 0.20% of the prior year’s total electric energy in megawatt-hours (MWh)
sold to retail customers in North Carolina in 2018, 2019 and 2020.
Based on the Company’s actual retail sales in 2017, the Solar Set-Aside is 73,660 RECs in 2018.
Based on forecasted retail sales, the Solar Set-Aside is projected to be approximately 75,042
RECs in 2019 and 75,372 RECs in 2020. The Company has fully satisfied and vastly exceeded
the minimum Solar Set-Aside requirements in the Planning Period through a combination of
Power Purchase Agreements and Company-owned solar facilities, including those listed below.
Compliance
Year
Previous
Year DEP
Retail Sales
(MWhs) (1)
Solar Set-Aside
(RECs)
Swine Set-
Aside
(RECs)
Poultry Set-
Aside
(RECs)
REPS
Requirement
(%)
Total REPS
Compliance
Obligation
(RECs)
2018 36,829,899 73,660 25,781 197,318 10% 3,682,990
2019 37,521,080 75,042 26,265 253,695 10% 3,752,108
2020 37,685,819 75,372 52,760 253,695 10% 3,768,582
(1) Annual compliance REC requirements are determined based on prior-year MWh sales. Retail sales figures
shown for compliance years 2019 and 2020 are estimates of 2018 and 2019 retail sales, respectively.
Duke Energy Progress North Carolina Integrated Resource Plan
2018 Biennial Report PUBLIC
Page 220

• Camp Lejeune Solar Facility – 13MW, located in Onslow County, placed in service in November
2015;
• Warsaw Solar Facility – 65MW, located in Duplin County, placed in service in December 2015;
• Fayetteville Solar Facility – 23MW, located in Bladen County, placed in service in December
2015; and
• Elm City Solar Facility – 40MW, located in Wilson County, placed in service in March 2016.
Additional details with respect to the REC purchase agreements are set forth in Exhibit A.
B. SWINE WASTE-TO-ENERGY RESOURCES
Pursuant to NC Gen. Stat. § 62-133.8(e), as amended by the North Carolina Utilities Commission
(NCUC) Order Modifying the Swine and Poultry Waste Set-Aside Requirement and Providing Other
Relief, Docket No. E-100, Sub 113 (October 2017), for compliance years 2018 and 2019, at least
0.07%, and in 2020, at least 0.14%, of prior-year total retail electric energy sold in aggregate by
utilities in North Carolina must be supplied by energy derived from swine waste. The Company’s
Swine Waste Set-Aside is estimated to be 25,781 RECs in 2018, 26,265 RECs in 2019, and
52,760 RECs in 2020.
Swine waste-to-energy compliance challenges have been numerous and varied. Three paths to
the creation of swine waste-to-energy RECs have been identified, although each face unique
challenges.
1. On-farm generation
Projects consisting of digestion and generation on a single farm or tight cluster of farms often
face gas production and feedstock agreement challenges, as well as interconnection difficulties.
The Company understands that many farms in NC are contract growers and have only limited
term agreements with the integrators. Accordingly, many contract growers are not in a position
to provide a firm supply of waste sufficient to support project financing. On July 27, 2017
Governor Cooper signed into law the “Competitive Energy Solutions for North Carolina” bill or
House Bill 589 (HB 589) (SL 2017-92), which includes establishing an expedited interconnection
review process for swine and poultry waste facilities that are two megawatts or less in size. This
provision should help overcome some of the interconnection difficulties projects have experienced in
the past.
Duke Energy Progress North Carolina Integrated Resource Plan
2018 Biennial Report PUBLIC
Page 221

2. Centralized digestion
This type of system would benefit farmers that cannot individually construct and operate an
anaerobic digester manure handling system on their own due to the capital expense or just don’t
have the number of animals required to operate a digester successfully or cost effectively. Farms
located close to each other could share the cost of the centrally located digester system. The
centralized digester operated by an individual or private company would carry out the operation
and maintenance of the digester and its mechanical systems. It would have the same advantages
as on-farm digesters of odor reduction, pathogen and weed seed destruction, biogas production
and a stable effluent ready to fertilize fields and crops. A downside with centralized digestion
exists if the liquid swine waste has to be transported to the central site. One project has overcome
this risk by co-locating the facility adjacent to a swine processing plant.
The Company recognizes that NIMBY (Not In My Back Yard) issues may scuttle some
developers' plans for overcoming fuel supply and interconnection problems faced by more rural,
on-farm projects.
3. Directed biogas
In theory, directed biogas2 reduces costs by using large, efficient, centralized generation in the
place of smaller, less-efficient reciprocating engines typical of other projects. Technological
advances in this field have helped drive pricing down to comparable levels of on-site generation
for swine projects. The Company has worked diligently with Piedmont Natural Gas and others
in the Alternative Gas stakeholder group to help develop alternative natural gas specif ications
and contracts that developers can utilize for interconnection. Continued challenges in this area
include pipeline interconnection, gas clean-up requirements prior to injection and the general
lack of physical proximity between clusters of farms and pipeline infrastructure.
The Company has entered into two contracts to purchase swine waste-derived directed biogas
from projects in North Carolina. One of these projects, Optima KV, successfully interconnected
with Piedmont Natural Gas in March 2018 and is sending biogas to DEP’s Smith Energy
Complex where swine RECs are being generated. The Company continues to explore
opportunities for additional directed biogas in North Carolina through discussions with
3 “Directed Biogas” is defined as pipeline quality methane, injected into the pipeline system, and nominated to Duke
Energy Progress generating facilities; this methane is biogenically derived from Swine Waste, Poultry Waste, and general
Biomass sources.
Duke Energy Progress North Carolina Integrated Resource Plan
2018 Biennial Report PUBLIC
Page 222

developers as well as participation in a collaborative group working to deploy renewable natural
gas in Eastern North Carolina.
On June 19, 2018, the NCUC issued an Order Approving Appendix F and Establishing Pilot Program
in Docket No. G-9, Sub 698. This Order introduces some uncertainty surrounding the future of swine
and poultry waste-derived directed biogas projects, as it establishes a three-year pilot program where
Piedmont Natural Gas (Piedmont) will provide information to the NCUC regarding the impact of
Alternative Gas3 on its system operations and its customers. Piedmont and other Alternative Gas
suppliers may apply to the Commission to participate in the pilot program; however, it must be
demonstrated to the Commission that such additions will be useful in gathering the information and
data sought by the Commission. At the end of the three-year period, the Commission will consider
additional modifications to Appendix F, which sets forth the terms and conditions under which
Piedmont will accept Alternative Gas into its system, based on the experience gained during the pilot
period. Therefore, since NCUC approval is now required for any new swine or poultry-derived biogas
project to be accepted into the pilot program, there’s an additional level of uncertainty surrounding
new swine and poultry-derived directed biogas projects coming online and the timing of these
projects. All of these factors have presented challenges to timely project development of these
resources as well as the relatively high cost that will likely be required to ultimately develop and
deliver RECs from swine and poultry waste fuel.
In an effort to meet compliance with the Swine Waste Set Aside, the Company (1) continues
direct negotiations for additional supplies of both in-state and out-of-state resources; (2) works
diligently to understand the technological, permitting, and operational risks associated with
various methods of producing qualifying swine RECs and to aid developers in overcoming those
risks; when those risks cannot be overcome, the Company works with developers via contract
amendments to adjust for outcomes that the developers believe are achievable based on new
experience; (3) explores modifications to current biomass and set-asides contracts by working
with developers to add swine waste to their fuel mix; (4) continues pursuit of swine-derived
directed biogas from North Carolina facilities to be directed to DEP’s combined cycle plants for
combustion and generation; (5) utilizes the broker market for out-of-state swine RECs available
in the market; (6) engages the North Carolina Pork Council (NCPC) in a project evaluation
collaboration effort that will allow the Company and the NCPC to discuss project viability, as
3 “Alternative Gas” is defined in Appendix F as gas capable of combustion in customer appliances or facilities
which is similar in heat content and chemical characteristics to natural gas produced from traditional underground
well sources and which is intended to act as a substitute or replacement for Natural Gas (as that term is defined in
Piedmont’s North Carolina Service Regulations). Alternative Gas shall include but not be limited to biogas,
biomethane, and landfill gas, as well as any other type of natural gas equivalent produced or manufactured from
sources other than traditional underground well sources.
Duke Energy Progress North Carolina Integrated Resource Plan
2018 Biennial Report PUBLIC
Page 223

appropriate with respect to the Company’s obligations to keep certain sensi tive commercial
information confidential; and (7) participates in the North Carolina Energy Policy Council
Biogas Working Group.
In addition, in December 2017, DEP, together with Duke Energy Carolinas (jointly, “The
Companies”), issued a Request for Proposals soliciting proposals for swine waste fueled biogas,
the supply of electric power fueled by swine waste, or swine RECs. This RFP solicited up to 750,000
MMBtu (million British thermal units), or the equivalent in MWh (megawatt hours) which is
approximately 110,000 MWh from project developers. The Companies received seven responses
to the RFP, have evaluated the proposals, and are in contract discussions with two of the projects.
In addition, the Companies are working with three other bids from the RFP while the respondents
further develop their projects before moving forward.
In spite of Duke Energy Progress’ active and diligent efforts to comply with its Swine Waste Set-
Aside requirements, the Company will not be able to procure sufficient volumes of RECs to meet the
requirements in 2018. DEP’s ability to meet the 2018 compliance requirement is dependent on the
performance of swine waste-to-energy developers under current contracts, many of which have
encountered difficulties in achieving the full REC output of their contracts due to issues including
local opposition to siting of the facilities, interconnection challenges, the inability to secure firm and
reliable sources of swine waste feedstock from waste producers in North Carolina, and technological
challenges encountered when ramping up production. In addition, two contracts for swine waste
RECs were terminated due to failure to perform. Due to its expected non-compliance in 2018, the
Company will submit a motion to the Commission for approval of a request to lower the 2018
compliance requirement to 0.02% of prior-year retail sales and delay all subsequent increases by one
year.
The Company’s ability to comply in 2019 and 2020 remains subject to multiple variables, particularly
related to counterparty achievement of projected delivery requirements and commercial operation
milestones. Additional details with respect to the Company’s compliance efforts and REC purchase
agreements are set forth in Exhibit A and the Company’s semiannual progress reports, filed
confidentially in Docket No. E-100 Sub113A. The Company remains actively engaged in seeking
additional resources and continues to make every reasonable effort to comply with the swine waste
set-aside requirements.
Duke Energy Progress North Carolina Integrated Resource Plan
2018 Biennial Report PUBLIC
Page 224

C. POULTRY WASTE-TO-ENERGY RESOURCES
Pursuant to NC Gen. Stat. § 62-133.8(f), as amended by NCUC Order Modifying the Swine and
Poultry Waste Set-Aside Requirements and Providing Other Relief, Docket No. E-100, Sub 113
(October 2017), for calendar year 2018, at least 700,000 MWhs, and for 2019 and 2020, at least
900,000 MWhs, or an equivalent amount of energy, shall be produced or procured each year from
poultry waste, as defined per the Statute and additional clarifying Orders. As the Company’s retail
sales share of the State’s total retail megawatt-hour sales is approximately 28%, the Company’s
Poultry Waste Set-Aside is estimated to be 197,318 RECs in 2018, 253,695 RECs in 2019, and
253,695 in 2020.
In an effort to meet compliance with the Poultry Waste Set-Aside, the Company (1) continues
direct negotiations for additional supplies of both in-state and out-of-state resources with
multiple counterparties; (2) works diligently to understand the technological, permitting, and
operational risks associated with various methods of producing qualifying poultry RECs and to
aid developers in overcoming those risks; when those risks cannot be overcome, the Company
works with developers via contract amendments to adjust for more realistic outcomes; (3)
explores leveraging current biomass contracts by working with developers to add poultry waste
to their fuel mix; (4) explores adding thermal capabilities to current poultry sites to bolster REC
production; (5) explores poultry-derived directed biogas at facilities located in North Carolina
and directing such biogas to combined cycle plants for combustion and electric generation; (6)
utilizes the broker market for out-of-state poultry RECs available in the market; and (7)
participates in the North Carolina Energy Policy Council Biogas Working Group.
Duke Energy Progress is in a position to comply with its Poultry Waste Set-Aside requirement in
2018, but the Company’s ability to procure sufficient volumes of RECs to meet its pro-rata share of
the increased Poultry Waste Set-Aside requirements in 2019 and 2020 remains uncertain and largely
subject to counterparty performance. One new poultry facility has come online in 2018 and another
is expected to come online in 2019. However, a third is undergoing an outage to perform repairs and
three contracts for out-of-state poultry waste RECs were terminated due to failure to perform or force
majeure issues. DEP’s ability to comply in 2019 and 2020 is dependent on facilities producing at their
contracted levels, and historical experience indicates that facilities usually experience some start-up
issues and take time to reach full expected production levels. Ramping up to meet the increased
compliance targets for 2019 - 2020 has been problematic because suppliers have either delayed
projects or lowered the volume of RECs to be produced. The Company is, nevertheless, encouraged
by the growing use of thermal poultry RECs and the proposals that it has recently received from
developers.
Duke Energy Progress North Carolina Integrated Resource Plan
2018 Biennial Report PUBLIC
Page 225

In order for all electric suppliers to be able to meet the state-wide poultry waste set-aside
requirement, the Company, along with the other North Carolina electric suppliers, will submit a
motion to the Commission for approval of a request to reduce the 2018 Poultry Waste Set-Aside
requirement to 300,000 MWh, and delay the subsequent increases to 700,000 MWh and 900,000
MWhs until 2019 and 2020, respectively.
The Company remains actively engaged in seeking additional resources and continues to make every
reasonable effort to comply with the Poultry Waste Set-Aside requirements. Additional details with
respect to the Company’s compliance efforts and REC purchase agreements are set forth in Exhibit
A and the Company’s semiannual progress reports, filed confidentially in Docket No. E-100
Sub113A.
D. GENERAL REQUIREMENT RESOURCES
Pursuant to NC Gen. Stat. § 62-133.8, DEP is required to comply with its Total Obligation in 2018,
2019 and 2020 by submitting for retirement a total volume of RECs equivalent to 10% of prior-year
retail sales in North Carolina. Based on the Company’s actual retail sales in 2017, the Total
Requirement is 3,682,990 RECs in 2018. Based on forecasted retail sales, the Total Requirement is
projected to be approximately 3,752,108 RECs in 2019, and 3,768,582 RECs in 2020. This
requirement net of the Solar, Swine Waste, and Poultry Waste Set-Aside requirements, referred to as
the General Requirement, is estimated to be 3,386,231 RECs in 2018, 3,397,106 RECs in 2019, and
3,386,755 RECs in 2020. The various resource options available to the Company to meet the
General Requirement are discussed below, as well as the Company’s plan to meet the General
Requirement with these resources. The Company has contracted for, or otherwise procured,
sufficient resources to meet its General Requirement in the Planning Period. The Company submits
that the actions and plans described herein represent a reasonable and prudent plan for meeting the
General Requirement.
1. Use of Solar Resources for General Requirement
Duke Energy Progress plans to meet a significant portion of the General Requirement with RECs
from solar facilities. Solar energy has emerged as a predominant renewable energy resource in the
Southeast, and the Company views the downward trend in solar equipment and installation costs over
the past several years as a positive development. As such, the Company is using solar resources to
contribute to our compliance efforts beyond the Solar Set-Aside minimum threshold for NC REPS,
and will continue to do so during the Planning Period.
Duke Energy Progress North Carolina Integrated Resource Plan
2018 Biennial Report PUBLIC
Page 226

i. Net Metering Facilities
Under the current Net Metering for Renewable Energy Facilities Rider offered by DEP (Rider NM-
4B), a customer receiving electric service under a schedule other than a time-of-use schedule with
demand rates shall provide any RECs to DEP at no cost. Per the NCUC’s June 2018 Order Approving
Rider and Granting Waiver Request, filed in Docket No. E-2, Sub 1106, since net metering generators
are not individually metered, DEP is permitted to estimate the RECs generated by these facilities
using the PVWatts Solar Calculator developed by the National Renewable Energy Laboratory. Thus,
DEP will follow the calculations approved by the NCUC to estimate the number of RECs generated
from net metering facilities and will use these RECs for REPS compliance.
ii. North Carolina Solar Rebate Program
North Carolina HB 589 introduced a solar rebate program, which offers incentives to residential and
nonresidential customers for the installation of small customer owned or leased solar energy facilities
participating in the Company’s net metering tariff. The incentive is limited to 10 kilowatts alternating
current (kW AC) for residential solar installations and 100 kW AC for nonresidential solar
installations. The program incentive shall be limited to 10,000 kW of installed capacity annually
starting January 1, 2018 and continuing until December 31, 2022. Since all customers participating
in the Solar Rebate Program must be participating in DEP’s net metering tariff, DEP retains the rights
to the RECs from these facilities, as described in the net metering section above. In addition, under
HB 589, DEP shall be authorized to recover all reasonable and prudent costs of incentives provided
to customers and program administrative costs through the REPS Rider.
2. Energy Efficiency
During the Planning Period, the Company plans to meet up to 25% of the Total Obligation with
Energy Efficiency (EE) savings, which is the maximum allowable amount under NC Gen. Stat. § 62-
133.7(b)(2)c. The Company continues to develop and offer its customers new and innovative EE
programs that will deliver savings and count towards its future NC REPS requirements. The Company
has attached a list of those EE measures that it plans to use toward REPS compliance, including
projected impacts and a description of the measure, as Exhibit B.
Duke Energy Progress North Carolina Integrated Resource Plan
2018 Biennial Report PUBLIC
Page 227

3. Biomass Resources
Duke Energy Progress plans to meet a portion of the General Requirement through a variety of
biomass resources, including landfill gas to energy, combined heat and power, and direct combustion
of biomass fuels. The Company is purchasing RECs from multiple biomass facilities in the Carolinas,
including landfill gas to energy facilities and biomass-fueled combined heat and power facilities, all
of which qualify as renewable energy facilities. Please see Exhibit A for more information on each of
these contracts.
Duke Energy Progress notes, however, that reliance on direct-combustion biomass remains limited in
long-term planning horizons, in part due to continued uncertainties around the developable potential
of such resources in the Carolinas and the projected availability of more cost-effective forms of
renewable resources.
4. Hydroelectric Power
Duke Energy Progress plans to use hydroelectric power from hydroelectric generation suppliers
whose facilities have received Qualifying Facility (QF or QF Hydro) status. RECs from QF Hydro
facilities will be used towards the General Requirements of Duke Energy Progress’ retail customers.
Please see Exhibit A for more information on these contracts.
5. Wind
Duke Energy Progress considers wind a potential viable option to support increased diversity of
the renewables portfolio and potentially long-term general compliance needs. While the Company
may rely upon wind resources for future REPS compliance, the extent and timing will depend on
deliverability, policy changes and market prices. Additional opportunities may exist to transmit
wind energy from out of state regions where wind is more prevalent into the Carolinas.
6. Competitive Procurement of Renewable Energy (CPRE)
North Carolina HB 589 introduced a competitive procurement process for adding 2,660 MW
(subject to adjustment) of additional renewable energy and capacity in the Carolinas, with
proposals issued over a 45-month period beginning on February 21, 2018, when the NCUC
approved the CPRE Program. The Tranche 1 CPRE RFP was issued on July 10, 2018 with
proposals due on October 9, 2018. Renewable energy facilities eligible to participate in the CPRE
solicitation(s) include those facilities that use renewable energy resources identified in G. S. § 62-
133.8(a)(8), the REPS statute. DEP plans to use the RECs acquired through the CPRE RFP
Duke Energy Progress North Carolina Integrated Resource Plan
2018 Biennial Report PUBLIC
Page 228

solicitations as needed for its future REPS compliance requirements and has therefore included the
planned MW allocation and timeline in its REPS compliance planning process. Please see the
CPRE Program Plan, which is included as Attachment II to this IRP, for
additional information.
E. SUMMARY OF RENEWABLE RESOURCES
The Company has evaluated, procured, and/or developed a variety of types of renewable energy and
energy efficiency resources to meet its NC REPS requirements within the compliance Planning
Period. As noted above, several risks and uncertainties exist across the various types of resources and
the associated parameters of the NC REPS requirements. The Company continues to carefully
monitor opportunities and unexpected developments across all facets of its compliance requirements.
Duke Energy Progress submits that it has crafted a prudent, reasonable plan with a diversified balance
of renewable resources that will allow the Company to comply with its NC REPS obligation over the
Planning Period.
IV. COST IMPLICATIONS OF REPS COMPLIANCE PLAN
A. CURRENT AND PROJECTED AVOIDED COST RATES
The Current Avoided Energy and Capacity costs included in the table below represent key data
elements used to determine the PP (NC) tariff rates filed for DEP in Docket No. E-100, Sub 148.
The “Energy” columns reflect the cost of fuel and variable O&M per kwh embedded in the filed tariff
energy rates. The “Capacity” column is based on the installed cost and capacity rating of a combustion
turbine unit as reflected in the filed capacity rates.
The Projected Avoided Energy Costs included below reflect updated estimates of the same data
elements provided with the current costs. The capacity cost shown is a placeholder based on the
current avoided cost filing.
The avoided costs contained herein are subject to change, including (but not limited to) fuel price
projections, variable O&M estimates, turbine costs and equipment capability.
Duke Energy Progress North Carolina Integrated Resource Plan
2018 Biennial Report PUBLIC
Page 229

Duke Energy Progress North Carolina Integrated Resource Plan
2018 Biennial Report PUBLIC
Table 2: Current and Projected Avoided Cost Rates Table
[BEGIN CONFIDENTIAL]
[END CONFIDENTIAL]
Page 230

B. PROJECTED TOTAL NORTH CAROLINA RETAIL AND WHOLESALE SALES AND YEAR-END NUMBER OF CUSTOMER ACCOUNTS BY CLASS
C. PROJECTED ANNUAL COST CAP COMPARISON OF TOTAL AND
INCREMENTAL COSTS, REPS RIDER AND FUEL COST IMPACT
Projected compliance costs for the Planning Period are presented in the cost tables below by calendar
year. The cost cap data is based on the number of accounts as reported above.
Table 5: Projected Annual Cost Caps and Fuel Related Cost Impact
Table 3: Retail Sales
2017 Actual 2018 Forecast 2019 Forecast 2020 Forecast
Retail MWh Sales 36,829,899 37,521,080 37,685,819 38,051,362
The MWh sales reported above are those applicable to REPS compliance years 2018-2021, and represent actual MWh
sales for 2017, and projected MWh sales for 2018-2020.
Table 4: Retail Year-end Number of Customer Accounts
2017
(Actual)
2018
(Projected)
2019
(Projected)
2020
(Projected)
Residential Accts 1,204,664 1,218,411 1,232,738 1,247,020
General Accts 196,549 198,899 201,023 203,179
Industrial Accts 1,866 1,851 1,834 1,816
The number of accounts reported above are those applicable to the cost caps for compliance years 2018–2021, and
represent the actual number of REPS accounts for year-end 2017, and the projected number of REPS accounts for year-
end 2018–2020.
2018 2019 2020
Total projected REPS compliance costs 251,128,943$ 258,001,476$ 267,507,096$
Recovered through the Fuel Rider 209,892,045$ 210,646,041$ 212,139,327$
Total incremental costs (REPS Rider) 41,236,898$ 47,355,435$ 55,367,769$
Total including Regulatory Fee 41,294,711$ 47,421,825$ 55,445,392$
Projected Annual Cost Caps (REPS Rider) 63,874,278$ 64,583,052$ 65,271,008$
Duke Energy Progress North Carolina Integrated Resource Plan
2018 Biennial Report PUBLIC
Page 231

EXHIBIT A
Duke Energy Progress North Carolina Integrated Resource Plan
2018 Biennial Report PUBLIC
Duke Energy Progress, LLC's 2018 REPS Compliance Plan Duke Energy Progress' Renewable Resource Procurement from 3rd Parties
(signed contracts as of June 30, 2018)
Page 232

Page 233
Duke Energy Progress North Carolina Integrated Resource Plan
2018 Biennial Report PUBLIC

Page 234
Duke Energy Progress North Carolina Integrated Resource Plan
2018 Biennial Report PUBLIC

Page 235
Duke Energy Progress North Carolina Integrated Resource Plan
2018 Biennial Report PUBLIC

Page 236
Duke Energy Progress North Carolina Integrated Resource Plan
2018 Biennial Report PUBLIC

Page 237
Duke Energy Progress North Carolina Integrated Resource Plan
2018 Biennial Report PUBLIC
Page 238
Duke Energy Progress North Carolina Integrated Resource Plan
2018 Biennial Report PUBLIC

Page 239
Duke Energy Progress North Carolina Integrated Resource Plan
2018 Biennial Report PUBLIC
[END CONFIDENTIAL]

EXHIBIT B
Duke Energy Progress, LLC’s 2018 REPS Compliance Plan
Duke Energy Progress, LLC's EE Programs and Projected REPS Impacts
Forecast of Annual Energy Efficiency Impacts for the REPS Compliance Planning
Period 2018-2020 (kWh)
Residential Programs 2018 2019 2020
Energy Education Program for Schools 1,706,838 1,558,153 1,184,239
Multi-Family Energy Efficiency 12,903,924 9,349,647 7,105,989
My Home Energy Report 36,275,384 0 0
Neighborhood Energy Saver 1,797,238 1,279,252 972,266
Residential Energy Assessments 2,018,551 1,536,956 1,168,129
Residential New Construction 1,246,449 8,358,761 6,352,889
Residential Smart $aver® EE 2,760,819 2,973,461 2,259,912
Save Energy and Water Kit 25,889,028 19,847,824 15,084,893
Sub Total 84,598,231 44,904,054 34,128,318
Non Residential Programs 2018 2019 2020
Non-Residential Smart $aver Products and
Assessment 64,844,522 66,508,038 72,134,894
Non-Residential Smart $aver Performance
Incentive 1,492,508 5,715,382 6,198,927
Small Business Energy Saver 44,276,963 38,433,483 41,685,116
EnergyWiseSM for Business 3,196,245 1,322,020 1,433,868
Sub Total 113,810,239 111,978,923 121,452,805
Combined Residential and Non-Residential
Programs 2018 2019 2020
Energy Efficient Lighting 57,338,634 47,190,199 35,865,851
Sub Total 57,338,634 47,190,199 35,865,851
Total 255,747,104 204,073,176 191,446,974
Duke Energy Progress North Carolina Integrated Resource Plan
2018 Biennial Report PUBLIC
Page 240

DEP ENERGY EFFICIENCY PROGRAMS
DEP uses the following energy efficiency (EE) programs in its IRP to efficiently and cost-effectively
alter customer demands and reduce the long-run supply costs for energy and peak demand.
Residential EE Programs
• Energy Efficiency Education
• Multi-Family Energy Efficiency
• My Home Energy Report
• Neighborhood Energy Saver (Low-Income)
• Residential Energy Assessments
• Residential New Construction
• Residential Smart $aver® EE
• Residential Smart $aver® Energy Efficiency
• Save Energy and Water Kit
Non-Residential EE Programs
• Non-Residential Smart $aver® Energy Efficiency Products and Assessment
• Non-Residential Smart $aver® Performance Incentive
• Small Business Energy Saver
• EnergyWiseSM for Business
Combined Residential/Non-Residential EE Programs
• Energy Efficient Lighting
Residential EE Programs
Energy Efficiency Education Program
The Energy Efficiency Education Program is an energy efficiency program available to students in
grades K-12 enrolled in public and private schools who reside in households served by Duke Energy
Progress. The Program provides principals and teachers with an innovative curriculum that educates
students about energy, resources, how energy and resources are related, ways energy is wasted and
how to be more energy efficient. The centerpiece of the current curriculum is a live theatrical
production focused on concepts such as energy, renewable fuels and energy efficiency performed by
two professional actors.
Duke Energy Progress North Carolina Integrated Resource Plan
2018 Biennial Report PUBLIC
Page 241

Following the performance, students are encouraged to complete a home energy survey with their
family to receive an Energy Efficiency Starter Kit. The kit contains specific energy efficiency
measures to reduce home energy consumption and is available at no cost to student households at
participating schools. Teachers receive supportive educational material for classroom and student
take home assignments. The workbooks, assignments and activities meet state curriculum
requirements.
Multi-Family Energy Efficiency Program
The Multi-family Energy Efficiency Program provides energy efficient lighting and water measures
to reduce energy usage in eligible multi-family properties. The Program allows Duke Energy
Progress to target multi-family apartment complexes with an alternative delivery channel. The
measures are installed in permanent fixtures by the program administrator or the property
management staff. The program offers LEDs including A-Line, Globes and Candelabra bulbs and
energy efficient water measures such as bath and kitchen faucet aerators, water saving showerheads
and pipe wrap.
My Home Energy Report Program
The My Home Energy Report (MyHER) Program provides residential customers with a comparative
usage report that engages and motivates customers by comparing energy use to similar residences in
the same geographical area based upon the age, size and heating source of the home. The report also
empowers customers to become more efficient by providing them with specific energy saving
recommendations to improve the efficiency of their homes. The actionable energy savings tips, as
well as measure-specific coupons, rebates or other Company program offers that may be included in
a customer’s report are based on that specific customer’s energy profile.
The program includes an interactive online portal that allows customers to further engage and learn
more about their energy use and opportunities to reduce usage. Electronic versions of the My Home
Energy Report are sent to customers enrolled on the portal. In addition, all MyHER customers with
an email address on file with the Company receive an electronic version of their report monthly.
Neighborhood Energy Saver (Low-Income) Program
DEP’s Neighborhood Energy Saver Program reduces energy usage through the direct installation of
energy efficiency measures within the households of income qualifying residential customers. The
Program utilizes a Company-selected vendor to: (1) provide an on-site energy assessment of the
residence to identify appropriate energy conservation measures, (2) install a comprehensive package
of energy conservation measures at no cost to the customer, and (3) provide one-on-one energy
Duke Energy Progress North Carolina Integrated Resource Plan
2018 Biennial Report PUBLIC
Page 242

education. Program measures address end-uses in lighting, refrigeration, air infiltration and HVAC
applications.
Program participants receive a free energy assessment of their home followed by a recommendation
of energy efficiency measures to be installed at no cost to the resident. A team of energy technicians
will install applicable measures and provide one-on-one energy education about each measure
emphasizing the benefit of each and recommending behavior changes to reduce and control energy
usage.
Residential Energy Assessments Program
The Residential Energy Assessments Program provides eligible customers with a free in-home energy
assessment, performed by a Building Performance Institute (BPI) certified energy specialist and
designed to help customers reduce energy usage and save money. The BPI certified energy specialist
completes a 60 to 90-minute walk through assessment of a customer’s home and analyzes energy
usage to identify energy savings opportunities. The energy specialist discusses behavioral and
equipment modifications that can save energy and money with the customer. The customer also
receives a customized report that identifies actions the customer can take to increase their home’s
efficiency.
In addition to a customized report, customers receive an energy efficiency starter kit with a variety of
measures that can be directly installed by the energy specialist. The kit includes measures such as
energy efficiency lighting, low flow shower head, low flow faucet aerators, outlet/switch gaskets,
weather stripping and an energy saving tips booklet.
Residential New Construction Program
The Residential New Construction Program provides incentives for new single family and multi-
family residential dwellings (projects of three stories and less) that fall within the 2012 North Carolina
Residential Building Code to meet or exceed the 2012 North Carolina Energy Conservation Code
High Efficiency Residential Option (HERO). If a builder or developer constructing to the HERO
standard elects to participate, the Program offers the homebuyer an incentive guaranteeing the heating
and cooling consumption of the dwelling’s total annual energy costs. Additionally, the Program
incents the installation of high-efficiency heating ventilating and air conditioning (HVAC) and heat
pump water heating (HPWH) equipment in new single family, manufactured, and multi-family
residential housing units.
New construction represents a unique opportunity for capturing cost effective EE savings by
encouraging the investment in energy efficiency features that would otherwise be impractical or more
costly to install at a later time.
Duke Energy Progress North Carolina Integrated Resource Plan
2018 Biennial Report PUBLIC
Page 243

Residential Smart $aver® Energy Efficiency Program
The Residential Smart $aver® Energy Efficiency Program offers DEP customers a variety of energy
conservation measures designed to increase energy efficiency in existing residential dwellings. The
Program utilizes a network of participating contractors to encourage the installation of: (1) high
efficiency central air conditioning (AC) and heat pump systems with optional add on measures such
as Quality Installation and Smart Thermostats, (2) attic insulation and sealing, (3) heat pump water
heaters, and (4) high efficiency variable speed pool pumps.
The prescriptive menu of energy efficiency measures provided by the program allows customers the
opportunity to participate based on the needs and characteristics of their individual homes. A referral
channel provides free, trusted referrals to customers seeking reliable, qualified contractors for their
energy saving home improvement needs.
Save Energy and Water Kit Program
The Save Energy and Water Kit is designed to increase the energy efficiency within single family
homes by offering low flow water fixtures and insulated pipe tape to residential customers with
electric water heaters. Participants receive a free kit that includes installation instructions and varying
numbers (based on the number of full bathrooms in their home) of bath aerators, shower heads,
kitchen aerators and pipe insulation tape. The program has a website in place that customers can
access to learn more about the program or watch video’s produced to aid in the installation of the kit
measures.
Non-Residential EE Programs
Non-Residential Smart $aver® Energy Efficient Products and Assessment Program
The Non-Residential Smart $aver® Energy Efficient Products and Assessment Program provides
incentives to DEP commercial and industrial customers to install high efficiency equipment in
applications involving new construction and retrofits and to replace failed equipment.
Commercial and industrial customers can have significant energy consumption but may lack
knowledge and understanding of the benefits of high efficiency alternatives. The Program provides
financial incentives to help reduce the cost differential between standard and high efficiency
equipment, offer a quicker return on investment, save money on customers’ utility bills that can be
reinvested in their business, and foster a cleaner environment. In addition, the Program encourages
dealers and distributors (or market providers) to stock and provide these high efficiency alternatives
to meet increased demand for the products.
The program provides incentives through prescriptive measures, custom measures and technical
assistance.
Duke Energy Progress North Carolina Integrated Resource Plan
2018 Biennial Report PUBLIC
Page 244

• Prescriptive Measures: Customers receive incentive payments after the installation of
certain high efficiency equipment found on the list of pre-defined prescriptive measures,
including lighting; heating, ventilating and air conditioning equipment; and refrigeration
measures and equipment.
• Custom Measures: Custom measures are designed for customers with electrical energy
saving projects involving more complicated or alternative technologies, whole-building
projects, or those measures not included in the Prescriptive measure list. The intent of the
Program is to encourage the implementation of energy efficiency projects that would not
otherwise be completed without the Company’s technical or financial assistance. Unlike
the Prescriptive portion of the program, all Custom measure incentives require pre-
approval prior to the project implementation.
• Energy Assessments and Design Assistance: Incentives are available to assist customers
with energy studies such as energy audits, retro commissioning, and system-specific energy
audits for existing buildings and with design assistance such as energy modeling for new
construction. Customers may use a contracted Duke Energy vendor to perform the work
or they may select their own vendor. Additionally, the Program assists customers who
identify measures that may qualify for Smart $aver Incentives with their applications. Pre-
approval is required.
Non-Residential Smart $aver® Performance Incentive Program
The Non-Residential Smart $aver® Performance Incentive Program offers financial assistance to
qualifying commercial, industrial and institutional customers to enhance their ability to adopt and
install cost-effective electrical energy efficiency projects. The Program encourages the installation of
new high efficiency equipment in new and existing nonresidential establishments as well as
efficiency-related repair activities designed to maintain or enhance efficiency levels in currently
installed equipment. Incentive payments are provided to offset a portion of the higher cost of energy
efficient installations that are not eligible under the Smart $aver® EE Products and Assessment
program. The Program requires pre-approval prior to project initiation.
The types of projects covered by the Program include projects with some combination of unknown
building conditions or system constraints, or uncertain operating, occupancy, or production schedules.
The intent of the Program is to broaden participation in non-residential efficiency programs by being
able to provide incentives for projects that previously were deemed too unpredictable to calculate an
acceptably accurate savings amount, and therefore ineligible for incentives. This Program provides
a platform to understand new technologies better. Only projects that demonstrate that they clearly
reduce electrical consumption and/or demand are eligible for incentives.
Duke Energy Progress North Carolina Integrated Resource Plan
2018 Biennial Report PUBLIC
Page 245

The key difference between this program and the custom component of the Non-Residential Smart
$aver® Energy Efficient Products and Assessment program is that Performance Incentive participants
get paid based on actual measure performance, and involves the following two step process.
• Incentive #1: For the portion of savings that are expected to be achieved with a high degree
of confidence, an initial incentive is paid once the installation is complete.
• Incentive #2: After actual performance is measured and verified, the performance-based
part of the incentive is paid. The amount of the payout is tied directly to the savings
achieved by the measures.
Small Business Energy Saver Program
The Small Business Energy Saver Program reduces energy usage through the direct installation of
energy efficiency measures within qualifying non-residential customer facilities. Program measures
address major end-uses in lighting, refrigeration, and HVAC applications. The program is available
to existing non-residential customers that are not opted-out of the Company’s EE/DSM rider and have
an average annual demand of 180 kW or less per active account.
Program participants receive a free, no-obligation energy assessment of their facility followed by a
recommendation of energy efficiency measures to be installed in their facility along with the projected
energy savings, costs of all materials and installation, and up-front incentive amount from Duke
Energy Progress. The customer makes the final determination of which measures will be installed
after receiving the results of the energy assessment. The Company-authorized vendor schedules the
installation of the energy efficiency measures at a convenient time for the customer, and electrical
subcontractors perform the work.
EnergyWiseSM for Business Program
EnergyWiseSM for Business is both an energy efficiency and demand response (DR) program for non-
residential customers. Program participants can choose between a Wi-Fi thermostat or load control
switch that will be professionally installed for free on each air conditioning or heat pump unit. The
WiFi thermostat option provides both EE and DR savings opportunities, while the load control switch
option only offers DR savings capability. Only the EE component of the program is assumed to
provide energy savings.
• EE Component
Participants choosing the thermostat will be given access to a portal that will allow them to set
schedules, adjust the temperature set points, and receive energy conservation tips and
Duke Energy Progress North Carolina Integrated Resource Plan
2018 Biennial Report PUBLIC
Page 246

communications from DEC. In addition to the portal access, participants will also receive
conservation period notifications, so they can make adjustments to their schedules or notify
their employees of the upcoming conservation periods.
• DR Component:
The DR portion of the program allows DEP to reduce the operation of participants’ air
conditioning units to mitigate system capacity constraints and improve reliability of the
power grid. In addition to equipment choice, participants can also select the cycling level
they prefer (i.e., a 30%, 50% or 75% reduction of the normal on/off cycle of the unit).
During a conservation period, DEP will send a signal to the thermostat or switch to reduce
the on time of the unit by the cycling percentage selected by the participant. Participating
customers will receive a $50 annual bill credit for each unit at the 30% cycling level, $85
for 50% cycling, or $135 for 75% cycling. Participants that have a heat pump unit with
electric resistance emergency/back up heat and choose the thermostat can also participate
in a winter option that allows control of the emergency/back up heat at 100% cycling for an
additional $25 annual bill credit. Participants will also be allowed to override two
conservation periods per year.
Combined Residential/Non-Residential Customer Programs
Energy Efficient Lighting Program
The Energy Efficient Lighting Program partners with lighting manufacturers and retailers across
North and South Carolina to provide marked-down prices at the register to DEP customers purchasing
energy efficient lighting products. Starting in 2017, the Program removed CFLs and only offers LEDs
and energy-efficient fixtures.
As the program enters its eighth year, the DEP Energy Efficient Lighting Program will continue to
encourage customers to adopt energy efficient lighting through incentives on a wide range of energy
efficient lighting products. Customer education is imperative to ensure customers are purchasing the
right bulb for the application in order to obtain high satisfaction with lighting products and subsequent
purchases.
Duke Energy Progress North Carolina Integrated Resource Plan
2018 Biennial Report PUBLIC
Page 247

LOGO
ATTACHMENT II: The Duke Energy Progress Competitive Procurement
of Renewable Energy (CPRE) Plan
Page 248

Duke Energy Carolinas, LLC’s & Duke Energy Progress, LLC’s Competitive Procurement
of Renewable Energy (CPRE) Program Plan Update September 1, 2018
Introduction:
In accordance with North Carolina Utilities Commission (“NCUC” or the “Commission”) Rule R8-
71(g), Duke Energy Carolinas, LLC (“DEC”), and Duke Energy Progress, LLC (“DEP” and together
with DEC, “Duke Energy” or “the Companies”) provide this update to the Program Plan for the
Companies’ Competitive Procurement of Renewable Energy (“CPRE”) Program (“Program”).
The CPRE Program is being implemented pursuant to N.C. Gen. Stat. § 62-110.8, as enacted by North
Carolina Session Law 2017-192 (“HB 589”). This updated Program Plan presents the Companies’
current plans for implementing the CPRE Program. The following provides a brief summary of
significant events since the initial Program Plan was filed on November 27, 2017, in Docket Nos. E-
2, Sub 1159 and E-7, Sub 1156, as part of the initial CPRE Program Petition filing.
On January 9, 2018, the NCUC approved Accion, Inc. to act as the independent administrator (“IA”)
of the CPRE Program by its Order Approving the Independent Administrator of the CPRE Program
in Docket No. E-100, Sub 151.
On February 21, 2018, the NCUC issued its Order Modifying and Approving Joint CPRE Program
(“Program Order”). The Program Order directed certain modifications to the initial Program
Guidelines, which were incorporated into the CPRE Tranche 1 RFP documents that served as the
Companies’ Guidelines for purposes of the Tranche 1 RFP.4
On June 8, 2018, Duke filed its Tranche 1 Pro Forma Power Purchase Agreement (“PPA”). On June
25, 2018, the NCUC issued its Order Denying Joint Motion, Approving Pro Forma PPA, and
Providing Other Relief approving the PPA for use in Tranche 1.
The Companies delivered the final RFP to the IA on July 5, 2018. On July 10, 2018, the IA issued
the final Tranche 1 RFP documents opening the RFP to bids. By its order dated August 10, 2018, the
Commission delayed the close of the Tranche 1 RFP window until October 9, 2018. The Companies
anticipate completing Tranche 1 by the end of May 2019.
4 As explained in the Companies’ letter filed on May 11, 2018, the Tranche 1 summary RFP document constituted the updated CPRE Program Guidelines as required under Rule R8-71(f)(1)(ii) and conformed with the requirement of the Commission’s Program Order to modify the initial CPRE Program Guidelines.
Duke Energy Progress North Carolina Integrated Resource Plan
2018 Biennial Report PUBLIC
Page 249

1. CPRE Compliance Plan
1.1. Implementation of Aggregate CPRE Program requirements
Under N.C. Gen. Stat. § 62-110.8(a), the Companies are responsible for procuring renewable energy
and capacity through a competitive procurement program in a manner that allows the Companies to
continue to reliably and cost-effectively serve customers’ future energy needs. The Companies are
required to procure energy and capacity from renewable energy facilities in the aggregate amount of
2,660 MW through requests for proposals (RFPs). The CPRE RFPs must be reasonably allocated
over a term of 45 months beginning with the Commission’s approval of the CPRE Program on
February 21, 2018.
Renewable energy facilities eligible to participate in the CPRE RFPs include those facilities that use
renewable energy resources identified in N.C. Gen. Stat. § 62-133.8(a)(8), have a nameplate capacity
rating of 80 MW or less, and are placed in service after the date of the electric public utility's initial
competitive procurement. The renewable energy facilities to be developed or acquired by the
Companies or procured from a third party through a power purchase agreement under the CPRE
Program must also deliver to the Companies all of the environmental and renewable attributes
associated with the power.
The Companies can satisfy the CPRE Program requirements through any of the following:
(i) Renewable energy facilities to be acquired from third parties and subsequently owned and
operated by the Companies;
(ii) Self-developed renewable energy facilities to be constructed, owned, and operated by the
Companies up to the 30% cap identified in N.C. Gen. Stat. § 62-110.8(b)(4)5; or
(iii) The purchase of renewable energy, capacity, and environmental and renewable attributes
from renewable energy facilities owned and operated by third parties that commit to allow the
Companies rights to dispatch, operate, and control the solicited renewable energy facilities in
the same manner as the Companies’ own generating resources.
Per N.C. Gen. Stat. § 62-110.8(b), electric public utilities may jointly or individually implement these
aggregate competitive procurement requirements. The Companies plan to continue to jointly issue
CPRE RFP solicitations to implement the CPRE Program while independently meeting their CPRE
5 The Companies voluntarily agreed to recognize both Self-developed Proposals, as well as third-party PPA Proposals offered by any Duke Energy affiliate bid into the CPRE RFP Solicitation(s), as being subject to the 30% cap.
Duke Energy Progress North Carolina Integrated Resource Plan
2018 Biennial Report PUBLIC
Page 250

planning, reporting, and cost recovery obligations. The Companies are jointly filing this updated
CPRE Program Plan for administrative efficiency.
1.2. Projected Uncontrolled Renewable Energy Generating Capacity
N.C. Gen. Stat. § 62-110.8(b)(1) provides that if prior to the end of the initial 45-month competitive
procurement period, the Companies have executed PPAs and interconnection agreements for
renewable energy capacity within their Balancing Authorities (BAs) that are not subject to economic
dispatch or curtailment and were not procured pursuant to N.C. Gen. Stat. § 62-159.2 (Transition MW
or Transition MW Projects) having an aggregate capacity in excess of 3,500 MW, the Commission
shall reduce the competitive procurement aggregate amount by the amount of such exceedance (such
adjusted targeted procurement amount, the CPRE Targeted Amount). If the aggregate capacity of
such Transition MW Projects is less than 3,500 MW at the end of the initial 45-month competitive
procurement period, the Commission shall require the Companies to conduct an additional
competitive procurement in the amount of such deficit.
As of May 31, 2018, approximately 3,370 MW of Transition MW Projects are installed or under
construction, leaving a deficit of approximately 130 MW, as seen in Figure 1. Note, at the time the
initial Program Plan was filed in November, 2017, approximately 2,900 MW of Transition MW
Projects were installed or under construction.
Figure 1. Status of Transition Renewable Energy Capacity by BA as of May 31, 2018
Duke Energy Progress North Carolina Integrated Resource Plan
2018 Biennial Report PUBLIC
Page 251
In addition to this 3,370 MW of Transition MW Projects that are installed/under construction as of
May 31, 2018, there are a substantial number of additional projects that have already obtained a PPA
or established a legally enforceable obligation (LEO) to sell to the Companies under the Commission-
approved Docket No. E-100, Sub 140 or Docket No. E-100, Sub 148 standard offer avoided cost
contracts or negotiated avoided cost contracts (Legacy PURPA Contracts), along with other pre-
existing renewable energy procurement programs and solicitations within North Carolina and South
Carolina. At this time, the Companies project that these additional projects will cause the 3,500 MW
cap on Transition MW Projects to be exceeded. In fact, the Transition MW Projects could grow to
as high as 4,700 MW (~1,100 DEC and ~3,600 DEP) by the end of the allotted CPRE procurement
period (i.e., 45 months from the date of Commission approval of the initial CPRE program plan)
(CPRE Procurement Period).
Figure 2 specifies additional projects that are “Pending Construction” but do not have both a signed
Interconnection Agreement and a signed PPA at this time. With the addition of the “Pending
Construction” projects alone, the 3,500 MW Transition threshold will be exceeded. In addition, the
“Potential Additional MW” line item shown in Figure 2 reflects the Companies’ projection of
additional MWs that may be added to the Transition MW. The number was derived based on applying
a materialization factor to the projects that have an established a LEO to sell to the Companies, plus
potential capacity under the South Carolina Distributed Energy Resource Program Act. This includes
a substantial number of MW of potential Transition MW Projects that are authorized to retain the
rights to previously established LEOs under Section 1.(c) of HB 589. This increase in the number of
Potential Additional MW is primarily attributable to a settlement agreement filed with the
Commission on January 31, 2018 in Docket No. E-100, Sub 101. As previously noted, a project must
have executed a PPA and an Interconnection Agreement prior to the end of the CPRE Procurement
Period in order to qualify as a Transition MW. Given the uncertainty about the number of projects
that will satisfy the statutory criteria, the Companies are currently projecting a range for total
Transition MW of between 4,200 to 4,700.
Duke Energy Progress North Carolina Integrated Resource Plan
2018 Biennial Report PUBLIC
Page 252

Figure 2. Potential Transition MW
As a result of this updated estimate for the Transition MW, the Companies now anticipate
procurement of less than the initial 2,660 MW targeted through CPRE. Note that the Companies’
projections have assumed that there will be no re-allocation of capacity to the CPRE program for
unsubscribed MW under G.S. 62-159.2 (Renewable Energy Procurement for Major Military
Installations, Public Universities and Other Large Customers).
1.3. Planned RFP Solicitations
The Companies issued the Tranche 1 CPRE RFP on July 10, 2018, which seeks to procure
approximately 680 MW of renewable energy capacity in the aggregate that meet the RFP criteria.
The due date for proposal submission into the Tranche 1 RFP was originally set to September 11,
2018 but was extended to October 9, 2018 by order of the Commission issued August 10, 2018, in
Docket No-100, Sub 101. All other Tranche 1 dates have been similarly extended. At this time, the
Companies cannot comment on RFP activity as this solicitation is still open.
In consideration of the further refinement of the RFP process through the development of the Tranche
1 process as well as the likely reduced overall CPRE procurement target (a total of 1,460 to 1,960
MW), the Companies now propose to conduct a total of three solicitations (i.e., two additional
solicitations after Tranche 1) according to the schedule set forth in Figure 3. Note, this is a change
from the initial Program Plan filing which assumed four solicitations. This schedule is subject to
change based on the actual number of Transition MWs, the results of previous Tranches and the
desired size (MW) of future solicitations.
*Includes projects with a signed PPA, but no Interconnection Agreement as well as projects with a LEO but no PPA.
The upper end of the range is based on the Companies’ estimates of materialization rates for these projects. The lower
end of the “Total” range is a more conservative assumed materialization rate.
Duke Energy Progress North Carolina Integrated Resource Plan
2018 Biennial Report PUBLIC
Page 253

Figure 3. Planned CPRE RFP Solicitation Schedule
1.4. Allocations of Resources
As prescribed by N.C. Gen. Stat. § 62-110.8(c), the Companies have the authority to determine the
location and allocated amount of each CPRE RFP to be procured within their respective service
territories taking into consideration:
(i) the State's desire to foster diversification of siting of renewable energy resources throughout the
State;
(ii) the efficiency and reliability impacts of siting of additional renewable energy facilities in each
public utility's service territory; and
(iii) the potential for increased delivered cost to a public utility's customers as a result of siting
additional renewable energy facilities in a public utility's service territory, including additional costs
of ancillary services that may be imposed due to the operational or locational characteristics of a
specific renewable energy resource technology, such as non-dispatchability, unreliability of
availability, and creation or exacerbation of system congestion that may increase redispatch costs.
The Companies are currently planning to allocate and procure the CPRE Program Total Obligation
through the Tranche 1-3 CPRE RFP Solicitations, discussed above, by soliciting the amounts of
renewable energy resource capacity shown in Figure 4.
Duke Energy Progress North Carolina Integrated Resource Plan
2018 Biennial Report PUBLIC
Page 254
Figure 4. Planned CPRE Solicitation Targets by Tranche
DEC
(Approximate MW)
DEP
(Maximum MW)
Tranche 1 – Issued 600 80
Tranche 2 400 to 600 80
Tranche 3 220 to 520 80
Total 1,220 to 1,720 240
This allocation reflects the same consideration that informed the Companies’ initial allocation of MW
as described in the Companies’ initial Program Plan. The Tranche 1 CPRE RFP results, as well as
the Companies’ system operational experience integrating additional renewable energy resource
capacity into the DEC and DEP BAs and distribution and transmission system operations, will inform
the manner in which future CPRE Program Plans propose to allocate the remaining CPRE Targeted
Amount between the DEC and DEP service territories. As a result, the planned CPRE solicitation
targets for DEC and DEP shown in Figure 4 are subject to change. The targeted MWs for DEP are
shown as the maximum potential MWs to procure in each solicitation. DEP may elect to procure
fewer than 80 MWs based on the nature and competitiveness of the bids.
The Companies took into consideration the following factors prescribed by N.C. Gen. Stat. § 62-
110.8(c) when establishing the allocation of MWs to DEC and DEP:
(i) Fostering Diversification of Siting of Additional Renewable Energy Resources 6
The Companies’ primary objective is to procure cost-effective renewable energy resource facilities
that allow DEC and DEP to reliably dispatch, operate, and control the facilities in the same manner
as utility-owned generating resources, while diversifying the siting of renewable energy facilities
across the Companies’ BAs. The CPRE Program recognizes the State’s desire to foster diversification
of additional renewable energy facilities and to more effectively integrate additional utility-scale solar
and other resources into the Companies’ system operations. The Companies have developed the
CPRE Program Plan allocations to meet the goals of diversifying the locations and avoiding
inefficient or unreliable over-concentration of additional renewable energy facilities, and improving
6 The Companies anticipate that a large percentage of the renewable energy facilities bidding proposals into the Tranche 1 CPRE RFP Solicitation will be utility-scale solar generating facilities, and have primarily analyzed the need for additional diversification of siting for utility-scale solar resources. The Companies may consider the need to analyze diversification of siting of other renewable energy resource technologies in future CPRE Program Plans, depending on interest from other technologies in the Tranche 1 CPRE RFP Solicitation.
Duke Energy Progress North Carolina Integrated Resource Plan
2018 Biennial Report PUBLIC
Page 255

planning for the siting of additional facilities across the Companies’ BAs and within their respective
service territories throughout North Carolina and South Carolina.
Adding CPRE Utility-Scale Solar in DEC will Foster Improved Diversification as Existing Utility-
Scale Solar is Concentrated in DEP
DEP is a smaller BA than DEC. In 2017, the DEC winter peak load was approximately 16,700 MW
in comparison to the DEP winter peak load of approximately 14,200 MW, as seen in Figure 5.
Figure 5. 2017 Peak Load by BA7
While DEP is a smaller BA, the Companies have experienced a significantly greater concentration of
utility-scale solar development in DEP compared to DEC. As of May 31, 2018, the Companies are
contractually obligated to purchase from third-party owners approximately 3,600 MW of solar under
REPS and Legacy PURPA Contracts in addition to 225 MW of utility-owned solar. As shown in
Figure 6, this utility-scale solar growth has been especially significant in DEP, where approximately
80% of the total MW installed and/or under contract are located.
7 Peak demand values shown in Figure 5 are for 2017 winter peak production demand allocators from the 2018 Cost of Service study.
Duke Energy Progress North Carolina Integrated Resource Plan
2018 Biennial Report PUBLIC
Page 256

Figure 6. Solar Capacity under Contract as of May 31, 2018
If the total solar energy capacity in DEC and DEP were to be spread across the service territories
based on each utility’s respective peak load, the DEC service territory should have approximately
60% of the solar energy capacity rather than its current ~20%.
To achieve the goals of diversifying the siting of renewable energy facilities throughout the
Companies’ service territories in a manner that promotes efficiency, reliability, and mitigates cost
impact on the Companies’ customers, the Companies’ Tranche 1 RFP, as well as the planned total
CPRE Program procurement allocation (provided in Figure 4), seeks proposals primarily in the DEC
service territory in North Carolina and South Carolina. If the Transition MW proceed as expected and
the CPRE targets are met with primarily or all solar capacity, the Companies’ plans will result in a
more balanced allocation of solar capacity between DEC and DEP, as shown in Figure 7. Note Figure
7 assumes DEP procurements in CPRE total the maximum 240 MWs shown in Figure 4. If DEP
reduces or eliminates this procurement amount in future CPRE Program Plans then this would cause
the DEC totals to be higher.
Duke Energy Progress North Carolina Integrated Resource Plan
2018 Biennial Report PUBLIC
Page 257

Figure 7. Projected Solar Capacity by BA Post-CPRE 8
(ii) System Operations and Reliability Impacts
In developing the proposed allocation of CPRE Program resources between the DEP and DEC service
territories, the Companies also considered the operational efficiency and reliability impacts of siting
additional renewable energy facilities within the DEC and DEP BAs. The highly concentrated levels
of uncontrolled Legacy PURPA Contract solar that are currently installed, under construction, and
under contract to be installed in the DEP BA has caused the Companies to primarily allocate the
planned CPRE Program procurement towards the larger DEC BA, where significantly less utility-
scale solar is installed today. The Companies’ planned CPRE Program allocation between the DEC
and DEP BAs is also supported by the growing levels of operationally excess energy and increasingly
steep ramping requirements in the DEP BA. These operational challenges recently required DEP
system operators to curtail QF solar resources in response to imminent system emergency conditions.
The Companies report system emergency curtailments to the Commission quarterly in Docket Nos.
E-2, Sub 1178 and E-7, Sub 1175.
8 The projected amounts in Figure 7Error! Reference source not found. assume the midpoint of the range of solicitation amounts in Figure 4. Figure 7 also assumes that all renewable energy procured through CPRE will be solar, though non-solar renewable energy procurements are possible through CPRE.
Duke Energy Progress North Carolina Integrated Resource Plan
2018 Biennial Report PUBLIC
Page 258

Independent BA System Operations Basics
DEP and DEC are each independent BAs responsible for maintaining compliance with North
American Electric Reliability Corporation (NERC) reliability standards to ensure reliable operations
on their systems, as well as managing power flows between their systems and other utility systems.
DEP and DEC must independently control their respective network resources to meet system loads
and maintain compliance with reliability regulations within their separate BAs. Each BA must
independently comply with NERC’s mandatory Reliability Standards on a unified basis across the
entire BA that encompasses territory in both North Carolina and South Carolina.
DEP’s and DEC’s system operators independently plan and operate each BA’s generating resources
to reliably meet increasing and decreasing intra-day and day-ahead system loads within reliability and
generating unit availability and operating limits. These reliability requirements place the burden on
the DEP and DEC BAs to balance generation resources (including new dispatchable CPRE renewable
energy facilities), unscheduled energy injections (existing QF and renewable energy contracts), and
load demand in real-time, all of which is essential to providing reliable firm native load service. To
meet this objective, DEP and DEC must independently plan for and maintain a “Security Constrained
Unit Commitment” of baseload and load-following assets, regulation resources, operating reserves,
and spinning reserves, working together to ensure real-time frequency support and balancing.
The Companies’ baseload9 and must-run regulation units10 represent the foundational resources
necessary to meet load requirements, provide reliability, and meet mandatory NERC Reliability
Standards. In the aggregate, the operationally constrained minimum reliable output of these generators
represents the Lowest Reliability Operating Level (LROL) of the BA’s Security Constrained Unit
Commitment. These essential generating resources cannot be de-committed in real time nor on an
intra-day basis, because they must run within specified engineering levels and provide essential
frequency and regulation support to the BA, and because they are needed to meet upcoming peak
demands, such as the evening peak demands and next day peak demands. The LROL represents the
level on the BA at which continued energy injections into the BA above the BA’s load causes the BA
to have operationally excess energy.11
9 The Companies’ baseload units are firm native load generating resources such as nuclear, coal, and large natural gas combined cycle units that form the foundation of reliable service to meet the core system demand. 10 Must-run regulation and regulation reserves resources are generating resources that must run to provide load balancing regulation and frequency regulation support to maintain reliability by supporting system frequency to the required target of 60 Hz in compliance with mandatory NERC Reliability Standards. 11 The Companies testified to the importance of managing system operations to maintain the LROL of the BA’s Security Constrained Unit Commitment in the 2016 avoided cost proceeding. See In the Matter of Biennial Determination of Avoided Cost Rates for Electric Utility Purchases from Qualifying Facilities – 2016, Pre-filed Direct Testimony of John S. Holeman, III, at 7-8, 12-13 Docket No E-100, Sub 148 (filed February 21, 2017).
Duke Energy Progress North Carolina Integrated Resource Plan
2018 Biennial Report PUBLIC
Page 259

As has been discussed in recent avoided cost and IRP filings and in the initial CPRE Program Plan
filed in November, 2017 integration of additional solar is increasingly causing operationally excess
energy and extreme ramping events in DEP. Further increases of solar generation in the DEP BA
will continue to increase the risk of future potential NERC noncompliance and associated reliability
risks, unless DEP has adequate dispatch control rights to proactively plan and dispatch generation
resources on its system. Continued addition of solar generation in the DEP BA will exacerbate
existing reliability challenges and increase the potential future risks of NERC noncompliance. The
DEP BA’s growing experience managing operationally excess energy and increasingly steep ramping
requirements as additional unscheduled and uncontrolled solar generation comes online will also
increase the likelihood of emergency curtailment in DEP. DEC currently is better positioned to
accommodate additional solar resources without creating routine instances of operationally excess
energy. However, DEC will also eventually face similar issues with operationally excess energy and
ramping as additional solar generation is added to the system. This further emphasizes the importance
of the additional contractual curtailment rights available to DEC and DEP for the CPRE facilities.
(iii) Potential for Increased Delivered Cost; Ancillary Services
The Companies have evolved and will continue to evolve the modeling necessary to quantify the
increased delivered costs and additional ancillary services needed to maintain NERC Balancing
Authority compliance due to siting additional renewable energy facilities in DEC or DEP. Through
evaluation of the prior two factors discussed, the Companies have allocated the vast majority of MWs
to be procured through CPRE to DEC and did not specifically evaluate the potential for increased
delivered cost and additional ancillary services in determine the planned allocations set forth above.
However, this third factor may influence future decisions to further adjust this allocation in future
plans.
Allocation of Resources
In summary, the growing concentration of legacy PURPA solar facilities installed in the DEP BA,
associated operational challenges and reliability risks on the DEP system and growing risks of
uncompensated system emergency curtailments in DEP, as well as projections of each BA’s
respective ability to reliably accommodate additional solar energy have informed the Companies’
decision to allocate CPRE development primarily in the DEC service territory. The Companies
anticipate that the designated allocation of CPRE Program capacity may continue to evolve over the
CPRE Procurement Period, and the Companies intend to meet the CPRE Program requirements in a
manner that ensures continued reliable electric service to customers while procuring cost-effective
renewable energy resource capacity located within the DEC and DEP service territories. The
Duke Energy Progress North Carolina Integrated Resource Plan
2018 Biennial Report PUBLIC
Page 260

Companies will update the planned allocation, if it is determined that changes are appropriate, through
subsequent CPRE Program Plan filings.
1.5. Locational Designation
For purposes of the Tranche 1 CPRE RFP Solicitation, the Companies published Grid Locational
Guidance information to the Independent Administrator’s website on May 10, 2018 and also held a
webinar open to all registrants to review and discuss these materials and answer questions from
potential market participants and other interested parties. This guidance was intended to provide
market participants with information on areas that have known transmission and distribution
limitations as a result of the amount of existing or approved renewable energy facilities in the area.
The goal of providing this grid locational guidance was to minimize the need for costly network
upgrades to integrate CPRE renewable energy facilities and to provide information to market
participants for use when planning development activities for the proposals to be submitted into the
Tranche 1 CPRE RFP. The grid locational guidance information was in the form of a map and a table
of circuits and substations that have known or increasing constraints.
The Companies continue to evaluate how to provide similar guidance in future Tranches and will
provide this guidance when pre-solicitation documents for Tranche 2 are published, or potentially
earlier, to provide potential participants in CPRE as much information as possible to enable the most
cost-effective proposals to be bid into the RFP.
2. CPRE Tranche 1 RFP Document and Pro Forma PPA
The Companies’ final Tranche 1 RFP document and pro-forma PPA are available on the Independent
Administrator’s website.12 The Tranche 1 RFP constitutes the Companies’ Program Guidelines for
the current solicitation.
Comments on stakeholder engagement regarding the Pro forma PPA
Consistent with the directive in the NCUC’s order approving the CPRE Program in February 2018 in
Docket Nos. E-2, Sub 1159 and E-7, Sub 1156, the Companies have modified a number of PPA terms
and conditions based upon feedback received through two formal comment periods and continued to
engage with stakeholders to determine if consensus can be reached on additional revisions to the PPA.
More specifically, based on comments filed by stakeholders in Docket Nos. E-2, Sub 1159 and E-7,
Sub 1156, the Companies made significant revisions to the November 2017 version of the Pro forma
PPA before publishing the updated Pro-Forma PPA on May 11 as a pre-solicitation document for
12 https://decprerfp2018.accionpower.com/
Duke Energy Progress North Carolina Integrated Resource Plan
2018 Biennial Report PUBLIC
Page 261

Tranche 1 of the RFP. Market Participants and other interested parties then had a second opportunity
to review the Pro Forma PPA (along with other draft solicitation documents). These comments were
provided via the IA website. The Companies and the IA evaluated all of the comments received on
the draft documents, including the Pro Forma PPA and proceeded to make further, significant
revisions to the Pro Forma PPA before publishing the final PPA to be used in the Tranche 1
solicitation on June 8, 2018. The IA detailed the results of the comment period in their report which
was completed on June 20, 2018 and posted to the website on June 21, 2018. In this report, the IA
concluded that the Companies gave full consideration to each observation and the IA agreed with the
changes that the Companies elected to make to the PPA. On June 25, 2018 the Commission approved
the final Pro forma PPA for use in Tranche 1 of the CPRE program.
The Companies held an additional stakeholder meeting regarding the PPA on August 7, 2018 via
webinar. Approximately 50 participants called in to the webinar. The Companies presented a
summary of the process that led to the Commission approval of the Tranche 1 PPA and summarized
key changes made during the course of this process in response to comments and suggestions made
by stakeholders. The Companies then opened the floor to questions from the webinar participants.
Several of these questions were unrelated to the PPA and these individuals were directed to use the
message board and Q&A process on the IA website. The comments on the PPA itself were very
limited. The Companies provided responses to these comments on the call and reiterated the
commitment to take these comments into consideration during the drafting of the Tranche 2 PPA
document. Pursuant to the Commission’s CPRE rules, the pre-solicitation process for Tranche 2 will
allow for an additional comment opportunity that will also be supervised by the Independent
Administrator.
3. Other Program Plan Updates
Energy Storage
Recognizing the improving cost effectiveness of energy storage technologies, planned future adoption
by the Companies and consideration by other utilities in recent competitive generation procurements,
the Companies’ made the determination that Renewable plus Storage Proposals—if thoughtfully
integrated into the Companies’ system operations—should be accepted for consideration in the
Tranche 1 CPRE RFP. For this reason, the Companies’ Tranche 1 RFP and pro forma Tranche 1
PPA enable market participants the option to offer Renewable plus Storage Proposals as part of the
Tranche 1 RFP.
To facilitate equitable consideration in the RFP, as well as to ensure effective integration of energy
storage with the Companies’ system operations under the CPRE Program framework, the Companies
Duke Energy Progress North Carolina Integrated Resource Plan
2018 Biennial Report PUBLIC
Page 262
incorporated into the Pro Forma PPA a limited number of modifications, including a two-page
“Storage Operating Protocol” in Exhibit 10.
The Companies intend to continue to evaluate energy storage technologies and to pursue the most
effective means to deploy these resources. This ongoing work coupled with the results of the Tranche
1 solicitation will inform the Companies approach to energy storage subsequent Tranches in CPRE.
Impacts to the Transmission System from Distribution Connected Projects
North Carolina is unique in terms of the significant, and growing, levels of uncontrolled third-party
owned utility-scale solar connected to the Distribution system. The Companies continue to monitor
the growing impact to Transmission system operations of solar projects connected at the Distribution
level. As the cumulative number of MW in this category grows, these projects are increasingly
affecting the Transmission system upgrades required to accommodate new generation. Currently,
DEP has approximately 1,400 MWs of Distribution -connected solar capacity while DEC has
approximately 400 MWs. With additional Distribution connected projects in the queue in both DEP
and DEC, this will continue to have a growing impact on the Transmission system.
Interconnection Evaluation of CPRE Proposals
To be considered an eligible participant to bid into the Tranche 1 CPRE RFP, a developer sponsoring
a proposal will be required to submit an Interconnection Request under the applicable interconnection
procedures on or before the CPRE RFP proposal due date, and otherwise comply with the CPRE
Program Guidelines.
In order to improve the efficiency of the Interconnection system impact evaluation process, and to
accommodate the requirements of CPRE, DEC and DEP have requested Commission approval to
utilize a system impact grouping study process to more efficiently evaluate CPRE Proposals within
the current serial study process. The Companies anticipate potentially hundreds of projects bidding
thousands of megawatts of new renewable energy capacity into the CPRE RFPs. Continuing to utilize
the serial queueing and study process under the current state interconnection procedures would not
allow DEC and DEP to efficiently identify the most cost effective portfolio of resources that are bid
into each CPRE RFP to satisfy the capacity solicited through that RFP. The serial queuing process
requires assignment of priority rights to available transmission capacity on a first-come, first served
basis, and does not contemplate a scenario like the CPRE RFP process in which market participants
voluntarily bid into the solicitation with an expectation of possibly being selected among numerous
winning suppliers who have offered to supply capacity at the minimum price offered.
Duke Energy Progress North Carolina Integrated Resource Plan
2018 Biennial Report PUBLIC
Page 263

For each Tranche in CPRE, a Queue Position is assigned based on a “CPRE Queue Number” for all
Solar Generator Interconnection Customers that elect to submit proposals into those solicitations and
thereby voluntarily agree to be “grouped” and competitively ranked for study with all other
Interconnection Customers that elect to submit Proposals.
The Companies will also permit projects to be designated and accepted by the IA into the Companies’
CPRE Tranches RFP as “Late Stage Proposals”, which will be evaluated based upon system upgrades
preliminarily determined through a previously-completed System Impact Study or finally determined
under a previously-issued Interconnection Agreement. Projects designated as Late Stage Proposals
will be considered as part of the baseline study for the CPRE evaluation and will not be evaluated as
part of the grouping study. Importantly, the bid prices for Late Stage Proposals must include any
Upgrades needed to interconnect the generating facility while “earlier-stage” projects participating in
the CPRE Queue Number and grouping study are not required to include potential Upgrades in their
Proposal price.
In addition to seeking Commission approval of this System Impact Grouping Study process for
purpose of the Tranche 2 RFP, the Companies are also evaluating whether implementing a System
Impact Grouping Study in parallel with the serial study queue is sustainable for future CPRE RFP
tranches. The Companies are now managing nearly 13,000 MW of solar interconnection requests in
the queues across North Carolina and South Carolina. This volume will likely continue to grow as
additional CPRE tranches are planned. In order to manage the growing challenges and complexities
of the interconnection queuing and study process, the Companies are evaluating new interconnection
queue management best practices, including fully transitioning to employing temporal cluster studies
for all projects requesting interconnection, including projects requesting to bid into future CPRE RFP
tranches.
4. Additional Information to be Provided in Future Year Plan Filings
The Commission’s February 21, 2018 order in Docket Nos. E-2, Sub 1159 and E-7, Sub 1156
imposed additional reporting requirements in addition to those specified in Rule R8-71(g). However,
the additional reporting requirements relate to information that will not be available until completion
of the Tranche 1 RFP. The additional reporting requirements are as follows:
• Summary of facilities procured through CPRE that count towards the 30% limit established
under N.C. Gen. Stat. § 62-110.8.
Duke Energy Progress North Carolina Integrated Resource Plan
2018 Biennial Report PUBLIC
Page 264

• Reports on the curtailment of CPRE Program facilities as part of its reporting, including a
comparison with the curtailment of Duke’s own facilities.13
The Companies will provide the required information in subsequent CPRE Program Plan. Note, in
addition to these, Duke will provide details on grid upgrades required and estimated costs of such
upgrades associated with each Tranche/ Solicitation in its annual compliance filings (due in March
each year for DEC and June each year for DEP).
13 The Companies will identify any emergency conditions or force majeure curtailments of CPRE facilities in the quarterly reporting filed in quarterly in Docket Nos. E-2, Sub 1178 and E-7, Sub 1175.
Duke Energy Progress North Carolina Integrated Resource Plan
2018 Biennial Report PUBLIC
Page 265

Page 266