North American Investor Relations Forum Boston August 14, 2008
157
North American Investor Relations Forum Boston August 14, 2008
Transcript of North American Investor Relations Forum Boston August 14, 2008

0
North American Investor Relations ForumBoston
August 14, 2008

1
Safe Harbor Statement
This presentation contains forward looking statements. Such statements are based on our current expectations and are subject to certain risks and uncertainties that could negatively affect our business. Please read our earnings reports and our most recent annual report for a better understanding of these risks and uncertainties.

The New MediaCom WorldAn Industry Outlook
Torbjörn Nilsson Senior Advisor
to Ericsson CEO and Group

New worrying signs in the economyWorld, ICE, Crude Oil Index, USD
99 00 01 02 03 04 05 06 07 08
USD/
B arr e
l
10
20
30
40
50
60
70
80
90
100
110
120
130
140
Inflation
United States, CPIEuro Zone, CPI
China, CPI
99 00 01 02 03 04 05 06 07 08
Per
cent
-3
-2
-1
0
1
2
3
4
5
6
7
8
9
Record oil prices
Increasing inflation
Weakened US economy
Falling house prices
Source: Reuters EcoWin

Global trends
Strong growth in mobile and broadbandMore than 6b mobile and 3b broadband subscriptions
The Internet and TV revolutionGoing mobile, new opportunities
SustainabilityHigh on all agenda
Asia – economic center of gravityOne billion more middle-class consumers

Source: Comscore (Oct 2007) Wikipedia (Oct 2007), ,
Power of usersChanging behaviour with time, place and device shifts
66 billiononline searches conducted worldwide in December 2007.Google about 2/3.
Over 8.6 millionarticles and over 5.7 million registered contributors on Wikipedia globally
45%of US and European workers are away from their desks more than 20% of their time -85% of digital natives never leave home without their mobile
Over 4 billion songs,125 million TV episodes and 7 million movies have been purchased and downloaded from iTunes. Video game sector is growing
Social and personal networking
More than 100 millionblogs –1.6 million new every day
More than 100 millionvideo views are generated on YouTube but also YouKu (China) every day

MusicFree to listen
Advertising is the business model Searches, free content and communication are the bait
TVFree to watch

TV as we know it is changing
Two-way 3G Unicast
Dedicated broadcast (DVB-H...)One-way
One-way 3G Broadcast (MBMS)combined
From Prime Time to My TimeTwo-way IPTV & Web TV
Passive & analogue
Traditional scheduled TV
Chatting
Interactive & digital
Personalization
Advertising
SharingPodcast TV
On Demand
MobilityVoting

Ex. Broadband access (TV/Internet)
TV/IPTV/WebTV
NOW
Needed
TV TV TV TV TV
Mobile Copper Fiber CATV Satellite Terrestrial
TV
Internet/IP
Holistic regulation is necessary
Take away silo regulation (competition vs. monopolies)Service regulation, not technology regulationSame type of services should be seen as a common market(I.e. TV/Internet above) – technology neutralCommon/converged regulator in all countries
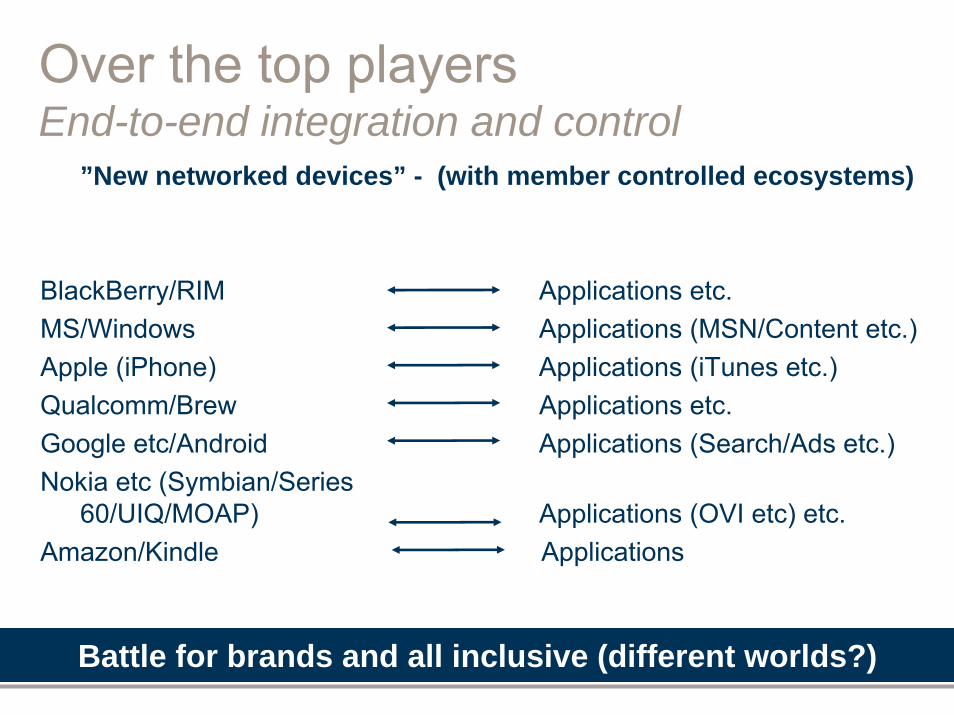
Over the top playersEnd-to-end integration and control
BlackBerry/RIM Applications etc.MS/Windows Applications (MSN/Content etc.)Apple (iPhone) Applications (iTunes etc.)Qualcomm/Brew Applications etc.Google etc/Android Applications (Search/Ads etc.)Nokia etc (Symbian/Series
60/UIQ/MOAP) Applications (OVI etc) etc.Amazon/Kindle Applications
Battle for brands and all inclusive (different worlds?)
”New networked devices” - (with member controlled ecosystems)

Key industry trends
Economies of Scale & Scope
Growth & Innovation
Next GenerationNetworks
Megaplayers/consolidation
Convergence
Cost reduction/operationalexcellence
Emerging markets
Triple- and quad-play bundlingSegmentation/changing behaviors
Trusted services – End-to-End
Multimedia broadband/regulation
IP everywhereService convergence (Web 2.0/Telco2.0) - UGC
New business models

Operator CAPEX growth
Developed Markets
Emerging Markets
Developed Markets
Emerging Markets
Emerging markets, double digit growth, driven by wireless
Wireline CAPEX somewhat higher than wirelessSource: Credit Suisse
2004
≈ 193 BUSD
2007
≈ 261 BUSD

Next generation networks and services
All IP, mobile andbroadband
Digital content, HDTVand advertising
Search, sharing and self-expression

Internet traffic is highly interactiveVideo drives volume
Sources: CacheLogic, Ellacoya, Ipoques
2007 YouTube (HTTP) is about 10% of all Internet traffic5% generates 45% of traffic
Video streaming(real-time ~ 1/3-1/2)
Video files ~ 2/3
HTTP
P2POther
FTP

Operators CE vendors Network vendors Set-top box Other
Open IPTV Forum: 37 members
Driving connected home and remote access (fiber/wireless)
Driving convergence and a converged architecture
Rapid growth of IPTV and quad-play market
Multi AccessEdge
Metro Transport
Broadband Access
IMS
IPTV Service Layer
The digital home

Internet & TV experience going mobile- Targeting the mobile volume market- New types of devices
Communities Communication
VoiceSMS

LTE-A
LTE the global broadband choiceStandard harmonization and spectrum are key to success
LTE(FDD/TDD)
WiMAX 802.16e
HSPA
IMT-Advanced4G
802.16m
GSM
CDMA2000TD-SCDMA

Rapid broadband growth
Broadband subscription forecast
Source: Internal EricssonFixed broadband includes: DSL, FTTx, Cable modem, Enterprise leased lines
Mobile Broadband includes: CDMA2000 EV-DO, HSPA, LTE, Mobile WiMAX & Other
0
500
1000
1500
2000
2500
3000
2006 2007 2008 2009 2010 2011 2012 2013
Subs
crip
tions
(mill
ion)
Fixed Mobile
▪ More higher-speed access connections
▪ Triple-play/video driver
▪ More than 207 HSPA networks
▪ 724 HSPA devices (50% phone, 50% PC)
▪ Approaching 150 million smart phones/year

0
2
4
6
8
10
2006 2007 2008 2009 2010 2011 2012 2013
Yea
rly E
xaby
tes
Subscriber traffic in mobile access networks
Mobile Voice
Mobile PC
Mobile handheld
The Exabyte EraTenfold traffic growth in access networks
IPTV and Internet drive access trafficConnected home and enterpriseFlat rate experience
Internet goes mobileMobile broadband complement/substitute classic ADSL
Source: Ericsson, IPTV 140 Millions subs 2013
Subscriber traffic in fixed access networks
Voice will be noise

Spectrum sub 1Ghz and wider channels
Importance of spectrumNetwork cost is a function of frequency
100 MHz20 MHz10 MHz5 MHz1.25 MHz
Spectrum sub 1Ghz-
Important for cost
effective rural and
indoor coverage.
Channels are getting
wider to support
higher bit rates.

Sustainable innovation
Ericsson Tower TubeLower operation cost
Up to 40% less energy/CO2Lower manufacturing cost
About 30% less energy/CO2
Solar village chargerPrototype for use in Millennium VillagesCharges up to 20 phones overnight
Green Site SolutionsComplete portfolio: Solar, biofuel, hybrid, fuelcell, wind
Source: Ericsson

Summary
The power base is shifting• Consumers and content owners• Media and internet business models
Regulation key to success• Holistic regulation• Right spectrum allocation• Green requirements
Next-generation network requirements• Trusted interactive services• Bandwidth for HDTV/Video• Mobile Internet

Market and Industry Trends: The User and Business Perspctive
Johan BergendahlVice President
and Chief Marketing Officer

Ericsson’s next growth opportunityWe personalized communication
We are personalizing broadband
We will personalize television-based communication

All-communicating world
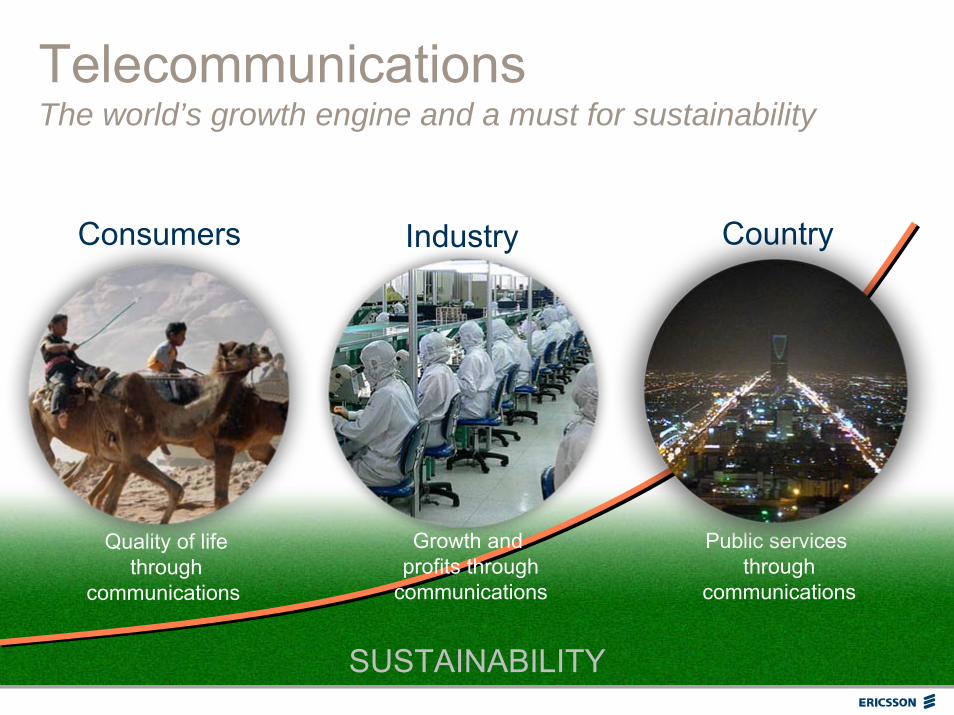
Telecommunications - The world’s growth engine
Media anywhereanytime
Televisionaryin everyday life
Sustainability
Everything connected
World’s creativity
Tool
SUSTAINABILITY
TelecommunicationsThe world’s growth engine and a must for sustainability
Quality of lifethrough
communications
Industry
Growth and profits through
communications
Public services through
communications
Consumers Country

Broadband subscriptionsFixed and mobile, 06-13
Broadband subscription forecast
Source: Internal EricssonFixed broadband includes: DSL, FTTx, Cable modem, Enterprise leased lines
Mobile Broadband includes: CDMA2000 EV-DO, HSPA, LTE, Mobile WiMAX & Other
0
500
1000
1500
2000
2500
3000
2006 2007 2008 2009 2010 2011 2012 2013
Subs
crip
tions
(mill
ion)
Fixed Mobile

Fixed IPTV subscriptionsManaged by operators, 06-13
Source: Internal Ericsson
This slide contains forward looking statements
0
20
40
60
80
100
120
140
160
2006 2007 2008 2009 2010 2011 2012 2013
Subs
crip
tions
(mill
ion)

Operators are in pole positionBut forget business as usual
Applications and content
Connectivity
In the home, in the officeand on the move

This is what it will takeKey performance indicators
InnovationMastering ”ecosystem”
StabilityOpenness
Hype factorUpgradeability

Ericsson’s proposition
Consumer multimediaEnterprise multimedia
Consumer multimediaEnterprise multimedia
Full Service BroadbandCommunications Expander
Prim
e Integrator & M
anaged Service

Full Service Broadband - RecapPersonal (Mobile) Internet Broadband
PersonalTV Broadband
Familycentric
Broadband& TV
Redefining broadband
Complete offer and referencesClosing the gaps
Target architecture

Redback business update Q208
Customers– Added 35 new customers (APAC 15, EMEA 13, Americas 7) – Revenue from 15 of top 20 wireline carriers
AT&T, China Telecom, China Mobile, China Unicom, DT, FT, KT, CHT
Products and solutions– SM 480 Carrier Ethernet Switch launched to unify fixed and
mobile networks– Integration of SmartEdge into Ericsson end-to-end solutions
MPBN, IPTV, Backhaul/PRAN, SASN
Redback expansion– Ericsson continues investment in IP and Silicon Valley campus
Redback Deployed BaseEricsson/Redback Deployed Base
Joint customer wins - 125 carriers in 60 countries

Ericsson Silicon Valley campus
Ericsson executive assignments
New PAPN focusfixed and mobile
Ericsson + Redback +Tandberg + Entrisphere
Ericsson ResearchSilicon Valley

Grow with revenuesFocused Full Service Broadband solutions
IPTVResidential
InternetMobile
TVMobile
broadbandMultimediatelephony
EnterpriseInternet & VPN

Secure continued leadership in mobility
RAN
LTE
HSPA
GSM
Voice
Data
CircuitCore
PacketCore
Transport
Leading evolution to high-performing optimized common network

DevicesSony EricssonDevice platformsEnablersNetworked media & msgService delivery platformsIMSRevenue managementEnterprise applicationsServicesBrokeringBusiness consultingPartneringSystems IntegrationConsumer LabMobility WorldHosting
User
Devices
Enablers
Services
Ericsson multimedia capabilities

Operators’ challenge:Network complexity multiplies
Project
Engage Sell
DeliverDevelop
Prime IntegratorManage e2e complexity Reduce riskIntegrate Ericsson products/solutionsFront various third parties
Ericsson as Prime Integrator

Consulting
PrimeIntegrator
ManagedServices
Commitment. Technology. Services. Our end-to-end proposition

Ericsson’s next growth opportunityWe personalized communication
We are personalizing broadband
We will personalize television-based communication

Mobile Technologies
Håkan ErikssonChief Technology Officer

HSPA is mobile broadband
228 WCDMA operators in 94 countries, of which207 HSPA operators in 89 countries240 million WCDMA/HSPA subscribers724 HSPA devices by 115 suppliers

Reported mobile subscriptions By system standard, 2006-2013
Source: Internal Ericsson
0
1000
2000
3000
4000
5000
6000
7000
2006 2007 2008 2009 2010 2011 2012 2013
Rep
orte
d Su
bscr
iptio
ns (m
illio
n)
Other CDMA Mobile WiMAXGSM/GPRS/EDGE WCDMA HSPALTE
incl. TD-SCDMA
3GPP family
GSM, WCDMA/HSPA and LTE dominance gives economy of scale
Mobile WiMAX

Traffic growth – All markets
Source: NetQB

Average traffic in Western Europe
Source: NetQB

Average traffic in Asia-Pacific
Source: NetQB

Mobile broadband positioned for take off
All major notebook manufacturers ready for embedded HSPA

Mobile broadband FAQ
”Why doesn’t the data increase show up in Base Station sales?”
orHow does the increase in data traffic affect the need for radio resources?
”Does going from 3 Mbps to 300 Mbps lead to a 100-fold increase in data capacity?”
orHow does data rate (Mbps) relate to data capacity (Bits/Hz)?

Data taking off
In Western Europe, 130 RNC in 13 markets were measured by NetQB during Feb
Source: NetQB
Average traffic in Western Europe
Total traffic Sum of Packet Packet HSSpeech Packet DCH
Average traffic in Western EuropeTraffic growth - Simplified
Voice
Data
Total
Traffic growth - simplified

Big difference between voice and data
Voice capacity in one carrier of 5 MHz60-70 simultaneous users8 kbps per userGives about 500 kbps = 0.5 Mbps
Data capacity in one carrier of 5 MHzEfficiency of 1 bit / Hz due to HSPAGives about 5 Mbps
HSPA makes data bits 10 times lighter in the air

Data growth and radio resources
Traffic growth - Simplified
Voice
Data
Total
Traffic growth -simplified
Total
Data
Voice
Data growth initially absorbed by HSPA efficiency
Perceived growth in air interface
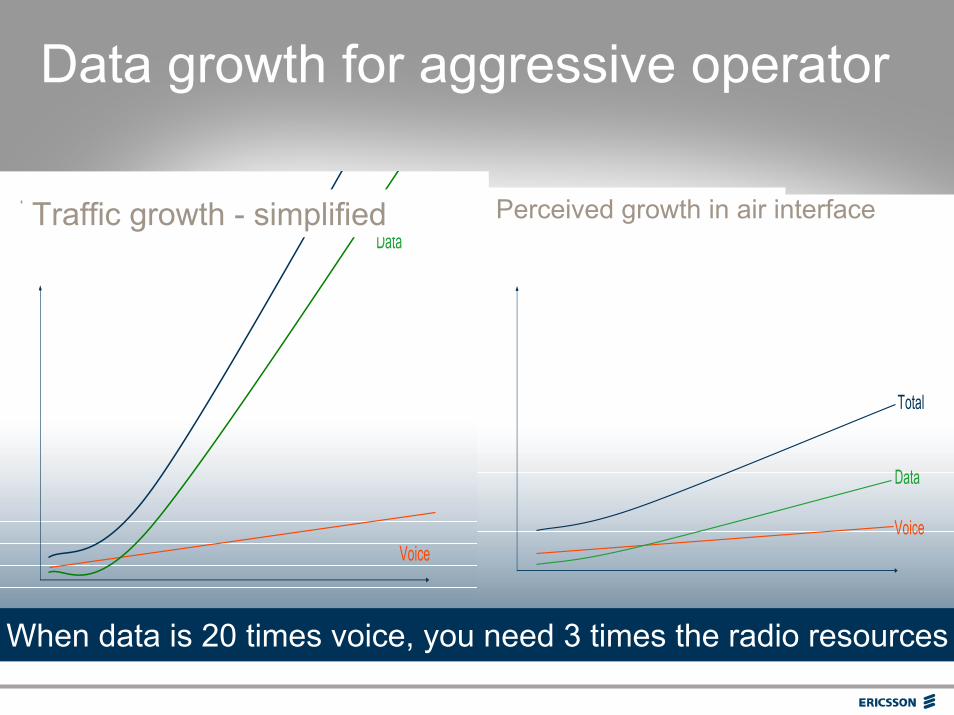
Data growth for aggressive operator
Traffic growth - Simplified
Voice
Data
TotalTraffic growth - simplified Perceived growth in air interface
Total
Data
Voice
When data is 20 times voice, you need 3 times the radio resources
Perceived growth in air interface

HSPA speed evolution
Uplink
0.4 Mbps
1.4 Mbps
6 Mbps
12 Mbps
20 Mbps
2 ms TTI
16QAM
Downlink
3.6 Mbps
14 Mbps
21 Mbps 28 Mbps
42 Mbps
80Mbps +
15 codes
2x2 MIMO64QAM
Both
Multi Carrier Multi Carrier
HSPAon the uplink

Coverage
Bitrate
Coverage vs. bitrates
Tenfold peak rate does not correspond to tenfold capacity
1.8 Mbps
7.2 Mbps
14.2 Mbps

Twice the capacity with HSPA evolution and LTE
HSPA R6GRAKE/Eq.
HSPA R6GRAKE/Eq.Rx Diversity
HSPA R72x2 MIMO
HSPA & LTE R864QAM&MIMO
2006
Downlink spectrum efficiency
2007 2008 2009
HSPA and LTE capacity evolution
0
1
2
Bit/
Hz
Simulated under normal radio conditions

Mobile broadband FAQ
Q: ”Why doesn’t the data increase show up in Base Station sales?”
A: HSPA is 10 times more efficient than WCDMA. This temporarily absorbs the current data increase. Over time more data capacity is needed.
Q: ”Does going from 3 Mbps to 300 Mbps lead to a 100-fold increase in data capacity?”
A: No. The increase in peak rate will result in a twofold capacity increase.

Common LTE evolutionAlignment for WCDMA/HSPA, TD-SCDMA (China) and CDMA
GSM WCDMA HSPA
TD-SCDMALTE
FDD and TDD
CDMA Track (3GPP2)
GSM Track (3GPP)
CDMA One EVDO Rev A
WiMax Track (IEEE)(Fixed WiMAX) Mobile WiMAX
DoCoMoVodafoneAT&TTelstraChina MobileTeliaSoneraNGMNOthers....
Verizon
Clearwire
2001 2005 2008 2010
LTE the global standard for next generation (4G)
China Telecom /”Unicom”KDDI (?)
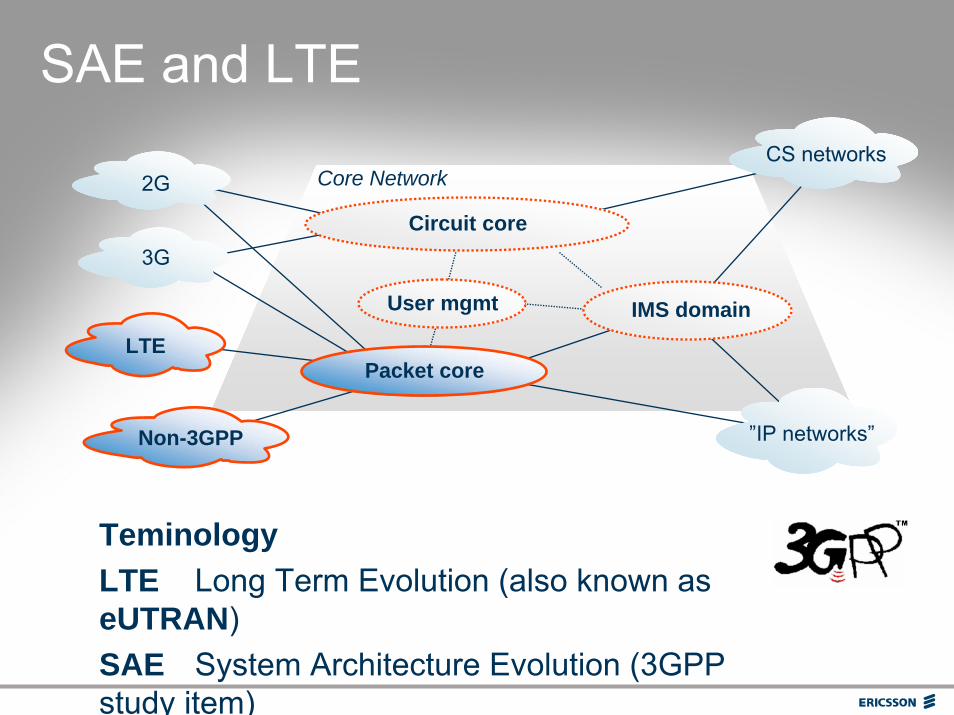
Core Network
SAE and LTE
TeminologyLTE Long Term Evolution (also known as eUTRAN)SAE System Architecture Evolution (3GPP study item)
Non-3GPP
CS networks
”IP networks”
3G
2G
Circuit core
IMS domain
Packet coreLTE
User mgmt

Core Network
SAE and LTE
TeminologyLTE Long Term Evolution (also known as eUTRAN)SAE System Architecture Evolution (3GPP study item)
EVDO
CS networks
”IP networks”
HSPA
GSM
Circuit core
IMS domain
Packet coreLTE
User mgmt
WCDMAHSPA
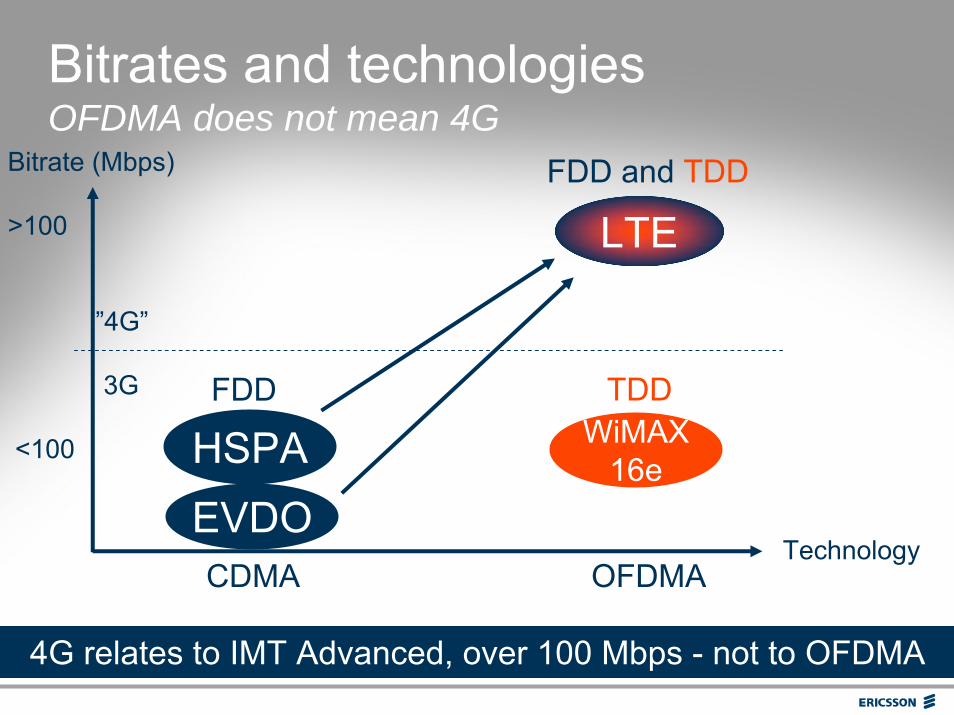
Bitrates and technologiesOFDMA does not mean 4G
Technology
Bitrate (Mbps)
>100
”4G”
3G
<100 HSPA WiMAX16e
FDD TDD
LTEFDD and TDD
CDMA OFDMA
4G relates to IMT Advanced, over 100 Mbps - not to OFDMA
EVDO

FDD
HSPA and WiMAX uplink coverage
2.6 GHz2.1 GHz
2-3 dB HSPAgain from lowerspectrum band
2.6 GHz2.1 GHz
TDD 3-6 dB HSPA advantage from FDD, vs. TDD with 50-25% uplink transmission
1 dB HSPA advantage from higher output power(24dBm vs. 23dBm for WiMAX)
WiMAX
HSPA
For realistic deployment, WiMAX needs a factor ~3 more sites

Research, standardization and patents
Standardization
Patent
Research
Everybody needs a license on a patent in a standard

Research
Contributions - essentiality
Standard Contributions
Establishedstandard
Patents Granted
Ericsson essential patents on the standard
Patents filed

FRAND framework for LTE/SAE IPR
Alcatel-Lucent, Ericsson, NEC, NextWave Wireless, Nokia, Nokia Siemens Networks and Sony Ericsson Fair: Proportional share of all standard essential IPRReasonable: Reasonable maximum aggregate royalty rates
– Single-digit percentage of the sales price for handsets
– Single-digit dollar amount for notebooks with embedded LTE capabilities

0.001
0.01
0.1
1
10
100
1,000
10,000
10 years between each generation – but faster uptake each time
20132011200920072005200320011999199719951993199119891987198519831981
1G
2G
3G
Subscription forecast
Mill
ions
4G
Mobile generations

Telecom, ICT and CO2
2007 Share of globalCO2 emissions
Mobile telecom(3.3 billion subscriptions) 0.2%
Other ICT (PCs, data centers, fixedtelecom) ~ 1.8%
TOTAL ICT: 2%
Total ICT sector only contributes 2% of total CO2 emission

CO2 per subscriber, Ericsson networks
1985 1990 1995 2000 2005 2010
100
50
150
25
200
Annual CO2 /subscriber [kg]
AMPS
GSMWCDMA
Year
Mobile subscription now 25 kg CO2 per year – Same as driving car for 1h

Telecom’s potential in CO2 reductionFrom problems to solutions
ICT's effect on CO2
-48,37
4,73
-60
-50
-40
-30
-20
-10
0
10m
illion
tonn
es C
O2
possible CO2 replacement
ICT's impact in CO2Source: WWF, ETNO
10 times payback in CO2 reduction

SummaryHSPA is mobile broadband todayLTE is the global choice for next generation (4G)Mobile broadband important tool for:
– Efficiency and fun across people and industries
– Bridging the digital divide– Reducing global warming
We did mobile telephony – Now we do mobile broadband

Mobile Broadband
Magnus Ewerbring Ph. D. Director, Product Line WCDMA RAN

Impressive broadband growthMobile broadband overtakes fixed
Mobile Broadband includes: CDMA2000 EV-DO, HSPA, LTE, Mobile WiMAX, OtherFixed broadband includes: DSL, FTTx, Cable modem, Enterprise leased lines and Wireless Broadband Source: Internal Ericsson
The Internet goes mobile
0
500
1000
1500
2000
2500
3000
2006 2007 2008 2009 2010 2011 2012 2013
Subs
crip
tions
(mill
ion)
Fixed Mobile

207 commercial HSPA networks
Commercial HSPA networks
HSPA network launch commitments
Source: GSA – Global mobile Suppliers Association: May, 2008

Five times more devices, three times more suppliers in one year
More than 300 HSPA phones, media players, cameras
More than 100 PC data cards/modules
More than 100 notebooks
More than 50 wireless routers
More than 600 HSPA devices 150 percent annual growth
(GSMA Apr.’08)

Strong mobile broadband growth
PortugalMobile Access Fixed Access
Subscribers 1.7 million 1.6 million
Q108 growth +18% -2.5%
Sweden437,000 mobile broadband subscribers added 2007
More than 1 million forecast by end of 2008
Higher growth rate than fixed (DSL: 231,000 in 2007)
Source: ANACOM
Internet access in Portugal, fixed and mobile
Mobile broadband access is larger than fixed in Portugal
Q101 Q108

Excellent speed, HSPA benchmarkAverage speed tests, Sweden
Operator 1[Mbps]
Operator 2 [Mbps]
Stockholm70 spots, inner city & suburbs
3.9 1.4
Gothenburg50 spots, inner city & suburbs
3.8 1.9
Malmö40 spots, inner city & suburbs
3.8 1.3
http://www.aftonbladet.se/pryl/tele/article2252094.ab
Higher speed and better coverage with Ericsson
Vendor A

Ericsson MBB modules in the fieldStockholm 2008
Fast Internet access anywhere
Result
Uplink 1.13 Mbps
Downlink 5.84 Mbps
Response time 68 msDevice peak capability: 7.2/1.4 Mbps

Complete coverage (99% pop.)HSPA 14/1.4 Mbps, up to 125 mile range
Telstra Investor Day, Nov. 1 ’07
Strong uptake with superior coverage and speed

$34 per month3.6 Mbps 3 GBMaxis Malaysia
Attractive HSPA pricingOn par with fixed broadband
$32 per month7.2 Mbps unlimited3 Sweden
$31 per month
7.2/1.4 Mbps 3 GBMobikom Austria
$56 per month7.2 Mbps Notebook includedThe Phonehouse Sweden
Rapid uptake in consumer segment

Operator opportunityMobile BroadbandMobile Media
Fixed BroadbandMobile Voice
Add new revenue streams; less OPEX and CAPEX
Any serviceanywhere
One networkone investment
Source: Telecompaper
Source: SoftBank
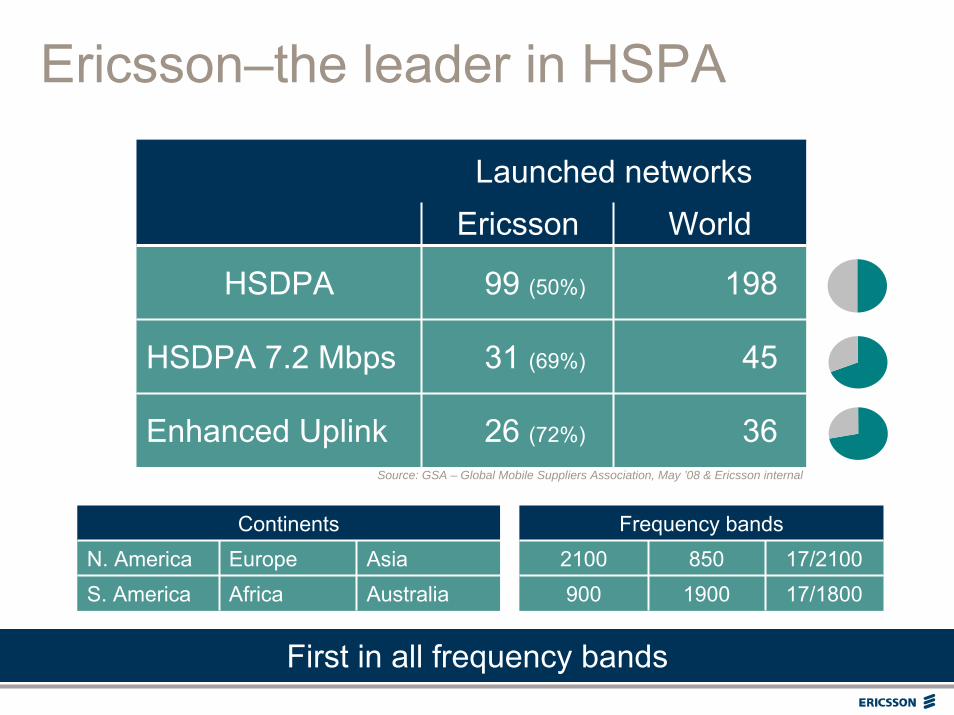
Ericsson–the leader in HSPA
Launched networksEricsson World
HSDPA 99 (50%) 198
HSDPA 7.2 Mbps 31 (69%) 45
Enhanced Uplink 26 (72%) 36
Continents Frequency bandsN. America Europe Asia 2100 850 17/2100S. America Africa Australia 900 1900 17/1800
First in all frequency bands
Source: GSA – Global Mobile Suppliers Association, May ’08 & Ericsson internal
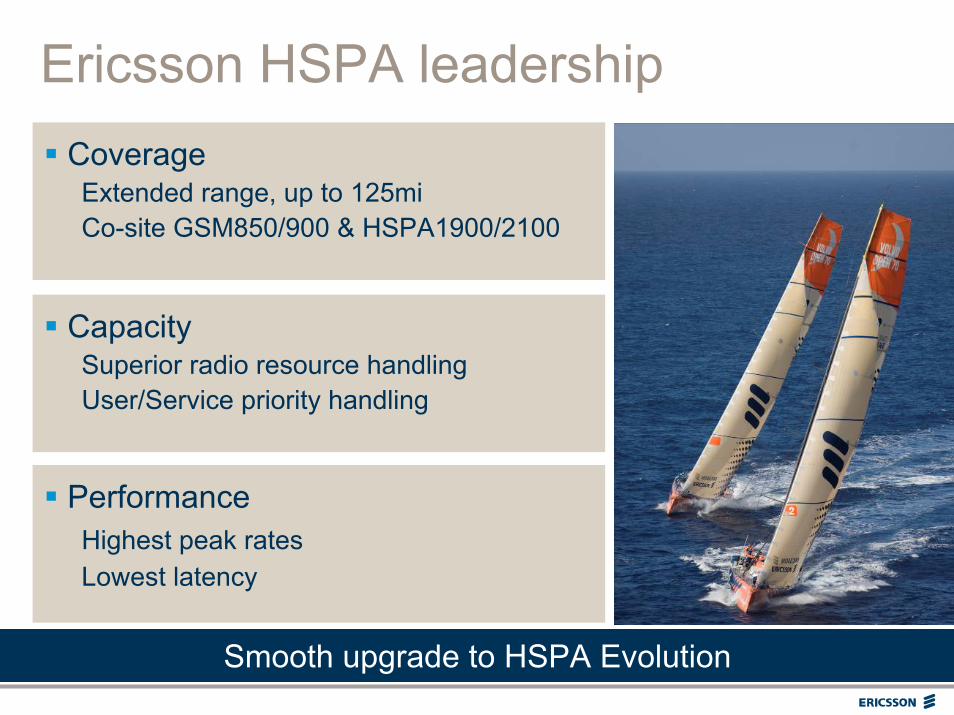
Ericsson HSPA leadershipCoverageExtended range, up to 125miCo-site GSM850/900 & HSPA1900/2100
CapacitySuperior radio resource handlingUser/Service priority handling
PerformanceHighest peak ratesLowest latency
Smooth upgrade to HSPA Evolution

HSPA evolutionUplink
20-40 Mbps
12 Mbps
6 Mbps
1.4 Mbps
0.4 Mbps
2 ms TTI
16QAM
Downlink
3.6 Mbps
14 Mbps
21 Mbps 28 Mbps
42 Mbps
80-160 Mbps
15 codes
2x2 MIMO64QAM
Both
Multi CarrierHigher ModulationCombinations
Multi Carrier
>100× speed, 10× capacity, HSPA compared to WCDMA Rel.99

Radio evolution path
3GPP technologies
GSM GPRS EDGE EDGEevolved
WCDMA HSPA HSPAEvolution
LTE
Strongest evolution path

Multi-standard RBS siteGSM/WCDMA/LTE
Quarter size
Double capacity
Integrated site power
Integrated transmission
Example, 1 cabinet:3×6 GSM6×4 WCDMA3×4 LTE
Higher efficiency, lower OPEX

Summary
HSPA in wide commercial use
Fast growth of mobile broadband
Excellent Internet experience with HSPA
Ericsson leads HSPA evolution
Ericsson multi-standard products provide smooth evolution

Creating a Mass Marketfor Mobile Broadband
Magnus KristerssonHead of Product Management
Mobile Broadband Modules

We embed things
The market
What Ericsson is doing
Agenda

Bundled offerings with notebook and mobile broadband
Consumer electronics is going mobile Three waves of embedding mobile broadband
2008 is the tipping point between niche and mass market
1 2 3Netbook/consumer notebook
Navigation, car entertainment, gaming, cameras, MIDs

Notebook – (R)evolution
Thinner, lighter, connected

Notebooks
The notebook is the primary device to consume data and drive trafficHalf of all PCs purchased are notebooks
Notebooks sold
0
50
100
150
200
250
2008 2009 2010 2011
Mill
ions
Notebooks
50% with inbuilt mobile broadband by 2011
Ericsson target
Source: IDC

Mobile Internet devices
0
10
20
30
40
50
60
70
80
2008 2009 2010 2011 2012
Year
Mill
ions
Green Fields
Tablets, Handhelds,Vertical DevicesPortable Navigation
Portable Video
MP3 Players
Portable Gaming
Source ABI

The mobile broadband devices
From 8 kbps to 7 MbpsFrom large modems to embedded modulesFrom expensive units to cost-efficient chipsets

Ericsson Mobile Broadband Modules
Objectives: – Being a catalyst in creating the mobile broadband
ecosystem with high-performing products at competitive prices.
– More than half of notebooks shipped in 2011 will have mobile broadband modules. Ericsson will be the market leader.
The product, available now:– Form Factor:PCI Express Mini Card
Smaller form factor for CE devices in 2009
– Modes: HSPA/WCDMA/EDGELTE module in 2010
– Bands: WCDMA triple band GSM/EDGE quad band
– HSPA speeds: D/L 7.2 Mbps, U/L 2.0 MbpsVision: Mobile broadband in all notebooks and other connected devices
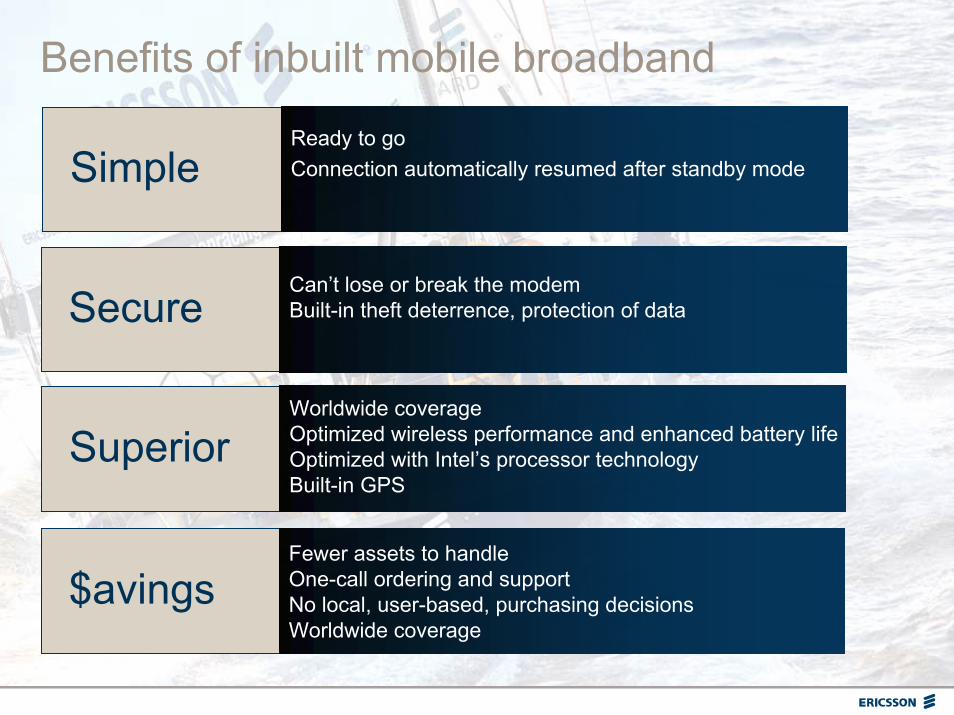
Benefits of inbuilt mobile broadband
Ready to goConnection automatically resumed after standby modeSimple
Fewer assets to handleOne-call ordering and supportNo local, user-based, purchasing decisionsWorldwide coverage
$avings
Worldwide coverage Optimized wireless performance and enhanced battery lifeOptimized with Intel’s processor technologyBuilt-in GPS
Superior
Can’t lose or break the modemBuilt-in theft deterrence, protection of dataSecure

Expanding businessFaster to market
Established relationships with operators worldwideLong experience in radio testingSimple business model and strong IPR positionOptimized with Intel’s notebook platforms

3 of the top 5 PC brands are Ericsson customers

| © 2006 LenovoLenovo Confidential
The Result - Wireless Innovation and Leadership
• 3G WMobile Broadband in every ThinkPad– Mobile Broadband availability for targeted markets– System price with Mobile Broadband ~ to ThinkPad without Mobile Broadband– Leveraging common global standard (HSPA)
• Game changing business model– 3G the default wireless alternative– Enables carrier and channels to harvest subscribers– Live out of box connectivity with 30 day trial
• Strategic Alliances with industry leaders to drive business model change– Ericsson– Service providers
• Catalyst for change– Changes the way Mobile Broadband
goes to market

SummaryMobile broadband is here nowEmbedded will be the normEmbedded will be part of devices of many form factorsEricsson has a complete ecosystem and is driving the market development2008 is a tipping point between niche market and mass market

Built-in mobile broadband
Simple
$avingsSuperior
Secure

Television powered by Full Service Broadband
The individual TV experience
Arpit JoshipuraHead of IP Solutions
Ericsson Sales and Marketing
Eugene SarmientoHead of Sales Development, IPTV
Ericsson Multimedia
Peter LinderDirector, End to End Network Solutions
Ericsson Networks

Ericsson Confidential 2008-06-19100
Topics
Ericsson TV – Vision, Differentiators & Leadership
Ericsson TV Solution – Service Layer
Ericsson TV Solution – Network Layer

Ericsson Confidential 2008-06-19101
Fixed Facts - Why TV ?IPTV Subscribers to grow from 12M in 2007 to 140M in 2013
IPTV - The only “Efficient” way to get:• Interactivity, Integrated Communications and On Demand for Video/TV• HDTV/Video Ready differentiated Network offering using NextGen Fixed Network
Defensive Strategy for Telcos against Cable and Satellite Operators• Get a $90 ARPU customer without loosing $30 Voice & $25 Data Customer
Offensive/Complementary Strategy for Telcos with Internet Players
Mobile TV Subscribers to grow from 20M in 2007 to 460M in 2012
0
500
2006 2007 2008 2009 2010 2011 2012
400
300
200
100
0
20
40
60
80
100
120
140
2006 2007 2008 2009 2010 2011 2012 2013

Ericsson Confidential 2008-06-19102
TV that connects me to everythingTV that connects me to everything TV that is personalTV that is personal
TV has to be High QualityTV has to be High Quality TV that is worth the moneyTV that is worth the money
The Individual TV Experience

Ericsson Confidential 2008-06-19103
Towards a converged world The Individual TV Roadmap
Tomorrow
Yesterday
InteractiveCommunications
Convergence
Sharing
TodayMedia Anywhere

Ericsson Confidential 2008-06-19104
Ericsson Entry into TV Acquisitions in 2007, now integrated into end to end solution
Ericsson IPTV Network Infrastructure
Ericsson IPTV Multimedia
Eric
sson
IPTV
e2e
offe
ring
Home Network

Ericsson Confidential 2008-06-19105
Perception established in 2007
Overall Rankings
Vendor Ranking Score (Max of 80)
Cisco 1 73.5
Ericsson 2 65.8
Alcatel-Lucent 3 57.8
Nokia-Siemens 4 45.9
Juniper 5 44.2
Overall Rankings
Vendor Ranking Score (Max of 10.0)
Cisco 1 6.8
Ericsson 2 6.1
Alcatel-Lucent 3 5.9
Motorola 4 5.5
Juniper 5 5.4
Fixed and Mobile TV(Multi-Platform Video) IPTV and CableTV

Ericsson Confidential 2008-06-19106
Perception Continues into 2008
Overall Rankings
Vendor Ranking Score (%)
Microsoft 1 50%
Ericsson 2 30%
Cisco 3 20%
Alcatel-Lucent 4 10%
Nokia-Siemens 5 10%
Overall Rankings
Vendor Ranking Score
Cisco 1
Ericsson 2 30%
Alcatel-Lucent 3 20%
Motorola 4 10%
Nokia-Siemens 5 10%
IPTV and VideoPerception Survey, Service layer
IPTV Solution6 Selection Criteria

Ericsson Confidential 2008-06-19107
The only true converged solution in the world for Mobile TV & IPTV evolving existing Fixed and Mobile Networks
Ericsson TV Strategic Differentiators
Converged TVAny Platform Any Device™
Proven in 15 of Top 20 carriers and over 200+ carriers worldwide. 2-4X the scale/capacity (**End to End) Up to 90% TCO savings (Open applications development)
Driving the world’s first open ecosystem for TVthat allow operators to create amass market for multiplemillions of Televisionary users.
TV From Niche to Masses
Ericsson TVThe numbers

Ericsson Confidential 2008-06-19108
Leading Scale & Capacity(eg GPON is 4X Capacity and 4X #of Digital Video channels)
Packet Optical Transport QoS per service
Ericsson TV Solution in a nutshell
2X Scale for TV against competition & Savings of 58% TCOSingle platform for different types of TV/Video (IPTV, MobileTV, NetTV, P2PTV, Business)
First Service Blended offering 90% Cost Savings on NewApplication Deployments
Set Top Box Interop, Open Ecosystem for 3 screens with Integrated Mobile Broadband in Laptops & Mobile Devices
World Leader in HeadEnd (31% Market Share, 16K IPTV channels deployed)Leading VOD and HDTV deployments(90% NA VOD is managed by Ericsson
Leading Architecture & Prime Integrator
World Leader in Mobile Broadband/TVCommon access with guaranteed evolution
(quality, peak rates, broadcast capabilities)

Ericsson Confidential 2008-06-19109
85% of the US cable operators use Openstream VoD Backoffice225+ Head End Contracts with 15K+ IPTV channels12+ End-2-End IPTV Contracts
Ericsson TV - deployment Proof
15 of Top 20 IPTV & Over 200 Operators use Ericsson for TV
60+ Mobile TV End to End>48 Use Ericsson Access
4 Top Tier 1 Telcos with Ericsson GPON/VDSL2 Access
5 of 10 largest IPTV deployments use Ericsson IP
Optical Platform for IPTV

Ericsson Confidential 2008-06-19110
Ericsson TV offeringWell-positioned against the competition
Partner
Video Head-End
System Integration
In-house
IMSMulti Access Edge
Broadband Access
Nokia Siemens
Huawei
Home Environment
Alcatel-Lucent
Cisco
Microsoft
MiddlewareSystems
VOD& Content Distribution
Mgmt
Motorola
The only complete, open and converged TV offering

Ericsson Confidential 2008-06-19111
Ericsson TV OfferingIntegrated and Tested End to End
IMS
Redback SmartEdge
EDA Family (xDSL, GPON)
Advanced Compression VoD Advertising
BSS, OSS
Transport Family – Optical and Carrier Ethernet
Middleware
Tandberg Television Products

Ericsson Confidential 2008-06-19112
Ericsson as Business partner
29,500 employees in over 140 countries
– 22,000 close to customers– 7,500 in Global Services
Delivery Centers
Additionally ~16,000 resources from partners
Consulting
PrimeIntegrator
ManagedServices
Global best practices - tools, methods and processes
Managed operation and hostingSystems integrationBusiness and technology consulting
Network rolloutNetwork design
EducationCustomer support

Ericsson Confidential 2008-06-19113
Topics
Ericsson TV – Vision, Differentiators & Leadership
Ericsson TV Solution – Service Layer
Ericsson TV Solution – Network Layer
Ericsson Confidential 2008-06-19114
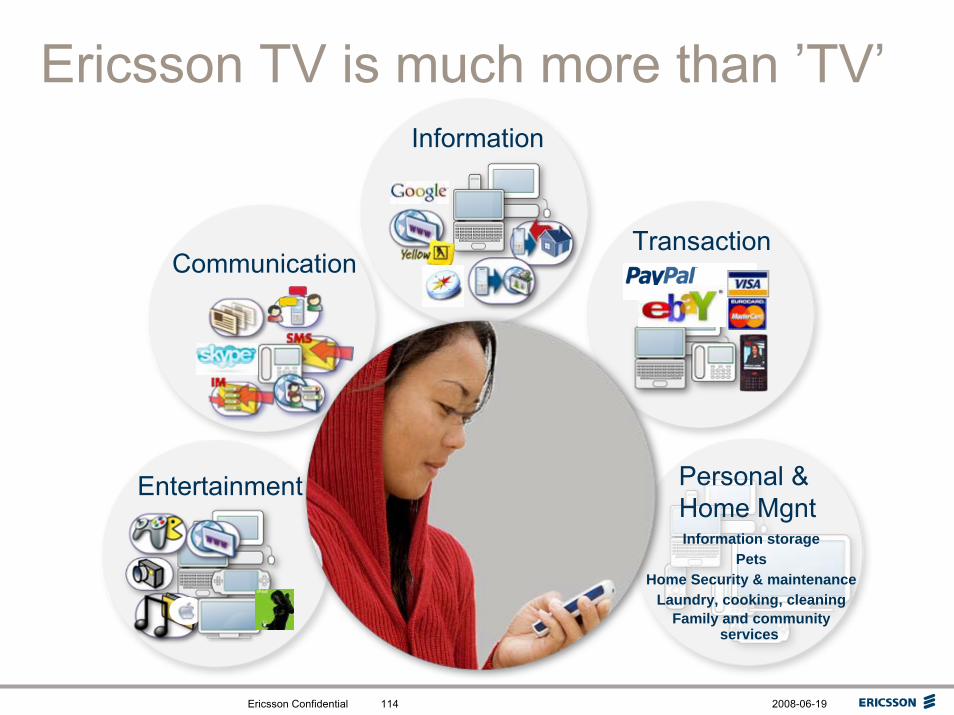
Ericsson TV is much more than ’TV’
Communication
Entertainment
Information
Transaction
Personal & Home MgntInformation storage
PetsHome Security & maintenance
Laundry, cooking, cleaningFamily and community
services

Ericsson Confidential 2008-06-19115
TV Featuresfrom Niche to Mass Market
Advertising
User Generated
Content
Interactive TV
Integration with
Conversationalservices
User Profiling
Service Continuity
ServicePortability
User centric & user
experience
Linear TV& VOD
Home Networking
TV Ecosystem with standards interfaces

Ericsson Confidential 2008-06-19116
The Ericsson TV Offering
Electronic Program Guide (EPG)
Network andlocal Personal
Video Recording
Broadcast TV
Charging
Video on Demand
Other services e.g.games, advertising etc.
Systems integration
QoS monitoring
Time shift TV HDTV
Feature Rich and Open, 250+ Multi-Media Use Cases

Ericsson Confidential 2008-06-19117
Features Roadmap for Television
- DVR Functionality- VoD – Movies & TV- Simple communications
(Caller ID on the TV)- Search and Navigation- Set-top-to-PC links- Widgets (traffic, weather, news)
- Casual games (casino, word, strategy, kids, sports)
Near termopportunities
Mid termopportunities
Longer termopportunities
Source: Parks and Associates
Ericsson TV Unique Features (Sample)- Cross Platform/Contextual/Dynamic Targeted Advertising- TV Centric Social Networks through Presence and Messaging- Automated ingest/workflow support for content catalog handling & publishing.- SDK for blended service development.
- Blending of locally generated video content
- Web video blending- Limited Internet-like features- remote access and place-
shifting content- Targeted advertising- Social networking
enhancements- Additional storage
- Motion sensing remotes- Video calling- Entertainment and communications blending (i.e. Voice services for gaming)
- T-commerce- Home and health- Community features

Ericsson Confidential 2008-06-19118
Topics
Ericsson TV – Vision, Differentiators & Leadership
Ericsson TV Solution – Service Layer
Ericsson TV Solution – Network Layer

Ericsson Confidential 2008-06-19119
Ericsson TV networkThe network layer brought to market in three distinct steps
EdgeMetroAccess
IPTV Service
EdgeMetroAccess
IMS
IPTV Service
EdgeMetroAccess
IMS
Mobile TV + IPTV Convergence
Convergence of MobileTV & IPTVIMS Service
DifferentiationaddedIPTV capable
Broadband
Tomorrow
Yesterday
Today

Ericsson Confidential 2008-06-19120
TVShaping fixed and mobile networks
IPTV Service
Mobile TV Service

Ericsson Confidential 2008-06-19121
Two different standard worlds
Marry fragmented Fixed Broadband standards with a holistic 3GPP architecture
Fixed Broadband NetworksMany standards – No Architecture
Mobile NetworksOne Global architecture – Annual Revisions

Ericsson Confidential 2008-06-19122
The standardization issue…
Multiple Standards required by IPTV …most already exist
IPTV solutions also include Proprietary technology
Integration requirements lead to limited interoperability and economics of scale
Open IPTV Forum works towards an interoperable IPTV solution
IPTV
CPE - Home Devices
IMS - Control Layere2e
Service Layer
Transport
Standardization - a success factor for IPTV mass market

Ericsson Confidential 2008-06-19123
Operators CE vendors Network vendors Set-top box Middle Ware/other
37 strong members today, more to come, (including Access Systems Europe)Please observe, some are active in more than one ”box” below

Ericsson Confidential 2008-06-19124
UNI
API NBINNI
Custom designSystem integration
Full Service Broadband Architecture
Standardservices
& applications
Interface betweenterminal and
Network
Interface betweenOperator 1 and
Operator 2

Ericsson Confidential 2008-06-19125
IMS and communication enablers
Multi Access Edge
Fixed access Mobile access
Service network
Connected Digital HomePowered by IMS and DLNA
HomeGateway
HomeGateway
Transport network
Ericsson Confidential 2008-06-19126
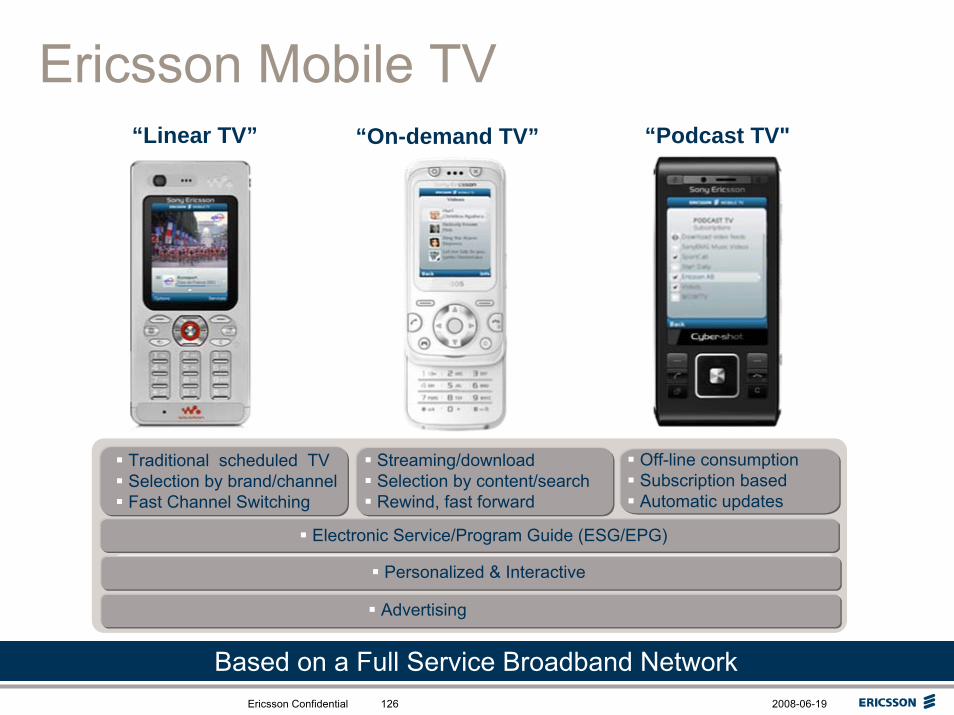
“On-demand TV” “Podcast TV"“Linear TV”
Personalized & Interactive
Electronic Service/Program Guide (ESG/EPG)
Off-line consumptionSubscription basedAutomatic updates
Streaming/downloadSelection by content/searchRewind, fast forward
Traditional scheduled TVSelection by brand/channelFast Channel Switching
Personalized & Interactive
Advertising
Ericsson Mobile TV
Based on a Full Service Broadband Network

Ericsson Confidential 2008-06-19127
Service Blending IMS Introduction Sending to the Network Broadband
TV Convergence IP ConvergenceMulti-Stream/HD/Unicast Deep Fiber Access
+ Transport Capacity
The network as a TV differentiatorFour clear opportunities where capabilities varies between networks

Ericsson Confidential 2008-06-19128
Full Service Broadband TransformationStep by Step towards the Individual TV experience
Mobile TV
GSM-EDGE/ WCDMA
Full ServiceBroadband
optimal architecture
Individual TVExperience
IPTV ADSL
Internet Access
Basic Mobile TV
InteractiveRich Media
Mobile TV & Video solution with client High end
Quality Media
HSPA QoSBearers
BroadcastedMedia
MBMS
Service Blending
ADSL2+IPTV Service
layer
Multi ServiceEdge Transport
upgrades
Deep Fiber access
IMS Introduction
IPTV launch/Triple Play
Multi streamin HD quality
Subscriber growth
Ericsson Confidential 2008-06-19129
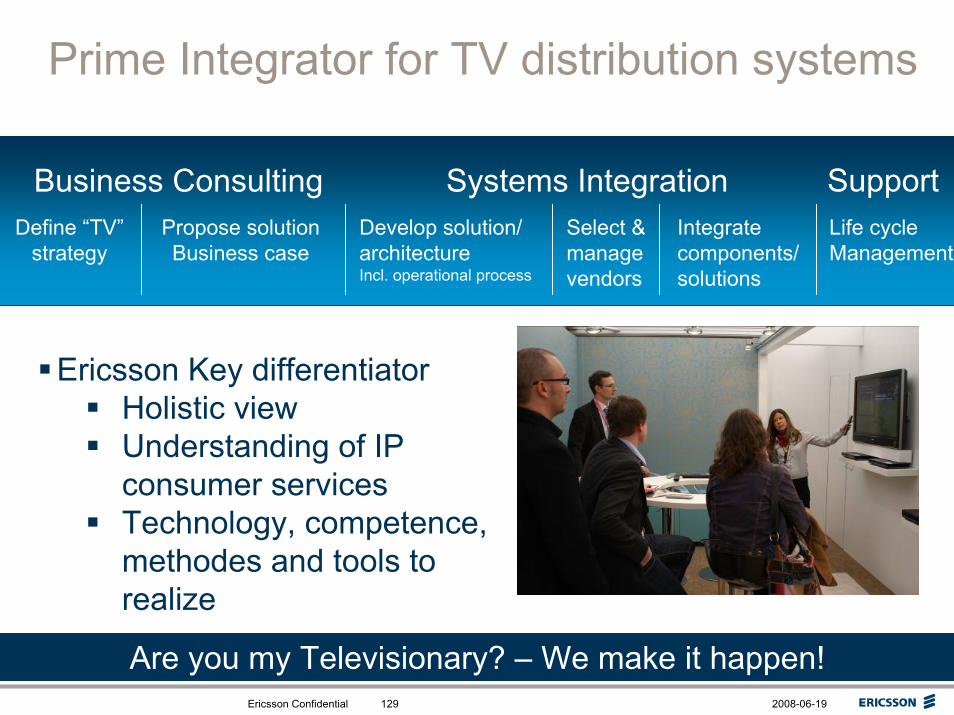
Prime Integrator for TV distribution systems
Define “TV”strategy
Propose solutionBusiness case
Develop solution/architectureIncl. operational process
Select &manage vendors
Integratecomponents/solutions
Life cycleManagement
Business Consulting Systems Integration Support
Ericsson Key differentiatorHolistic viewUnderstanding of IP consumer servicesTechnology, competence, methodes and tools to realize
Are you my Televisionary? – We make it happen!

Ericsson TV Executive Summary
Strategic Differentiators– First Open Solution – enables Niche to mass market
transition – Only Converged TV solution – Any Platform Any
Device™ leveraging existing fixed and mobile networks– Scale/Capacity of 2-4X, TCO Advantages up to 90%
Customer Proof Points– Deployed in 15 of Top 20 IPTV Operators– Solution Elements proven in 225+ Operators
Competitive Proof Points– Ericsson TV Ranked #2 by Analysts Survey of Operators– The Leading End-to-End Offering

Ericsson Confidential 2008-06-19131
Full Service BroadbandPowering the Individual TV Experience
Our converged, open, end-to-end proposition for TV
MultimediaEnergizing the Individual TV Experience
Prime IntegratorBringing it all together

Services and Telecom
Peter LaurinVP Multimedia, System Integration
& Hosting, North America

Global Services strategy
Grow services in Ericsson mobile, fixed and multimedia solutions
Expand services business
Managed servicesSystems IntegrationConsulting
EducationCustomer SupportNetwork Roll-out
Global Services
Multimedia
Networks

~$48 b.
Telecom services market 2008
Operator internalservices spending
Network roll-out services
Professionalservices
2006
~$144-148 b.
2008 est.
~$154-158 b.
~$59-61 b.
~$20-22 b.
Current addressable market
Systems integration
Education
Network rollout
Support services
Consulting
Managed services
2007 est.
~$150-154 b.
~$53-55 b.
~$19 b.
Source: Ericsson, April 2008 and Ernst & Young Market Study 2007Continued good growth in Professional Services
This slide contains forward-looking statements. Actual result may be materially different.
~$18 b.
Lower growth
Higher growth
~$48 b.
~$18 b.
~$144-148 b.
~$48 b.
~$18 b.

The leader in telecom servicesManaged Services
~210 million subscribers – hosting growing rapidly
Customer Support 24/7 support of networks – 1 billion subscribers
Network Rollout>1,200 network build, expansions or migration projects in the past year
Systems Integration>1,000 integration projects in multi-vendor and multi-technology environments
Network Design and Optimization, Consulting>300 projects in network design, tuning, strategy consulting and security
Education300,000 student days yearly
29,500 employees + 16,000 sourced = 45,500 resources

# 1 in operator top-of-mind perception Telecom Services
“Which company is the overall market leader in telecom services, such as consulting, deployment, integration, support and managed services?”
Source: BPRI Study 2007
29%
14%
10%
23%
13% 14%
2%
9%
3%
11%
20072006
Ericsson Competitor Competitor Competitor Competitor

“Which company is the overall market leader intelecom-related managed services?”
23%
11%
9%
15%
12%
9%
1%
9%
4%
8%
20072006
Ericsson Competitor Competitor Competitor Competitor
Source: BPRI Study 2007
#1 in operator top-of-mind perception Managed Services

Trends in the telecom services market
1. Managed services a growing business opportunity– ”Growth”-driven in high-growth markets – ”Cost”-driven in mature markets
2. Accelerating demand for telecom systems integration– Network complexity– Multimedia services
Operators want business partners to build competitive edge

Managed Services
Operating networks with more than 210 million subscribers
Slide title
Bullets level 2
>70 new consumer services
• Multi-year contract in place for prepaid services
• Supporting AT&T’s GoPhone Service with
- Around the clock operations
- Systems Integration- Feature development- Life Cycle Management
Hosted Prepaid Services

Prime Integrator
Taking a broader responsibility
• Ericsson is prime integrator of multi-vendor IMS solution– More than 15 different vendors and equipment providers
• Push-to-talk infrastructure integration enabling a unified end-user experience across different technologies
Bullets level 2
Sprint - IMSMobile broadband replacement projectSoftbank, Japan
• 4000 competitor nodes replaced – Prime Integrator responsibility
• High capacity network – complex swap of high traffic urban sites
• Up to 200 nodes replaced per week –project mgmt key
• Replaced equipment - Ericsson Ecology Management Policy
Sprint - IMS

Operator needsDeliver customer valueSecure technology transitionsDrive operational excellenceManage risks
Expectations on suppliers to take a broader responsibility
Deliver end-to-end solution and competencesMitigate risks in multi-vendor environment and in technology transitionsManage complexity and reduce operational costsOrchestrate multiple suppliers
Demand for end-to-end responsibility
Prime Integrator

Summary
Ericsson is the #1 telecom service vendor, with >10% market share
Services market opportunity is large and growing
Higher growth in managed services and system integration

Telecom contributions to
energy and climate change
Elaine Weidman GrunewaldDirector, Corporate
Responsibility

Overview
Our approach to energy and climate changeEnergy, total cost of ownership and CO2
Innovative solutions and servicesMobile broadband and sustainability
Our competitive advantage

Climate change - sphere of influence
OptimizedNetwork design
Telecom contribution to carbon lean economy
Energy optimization
Products & features
Total site concept

Ericsson life-cycle carbon footprint
Product energy consumption is priority - 80% by end 2008
End of lifeUse phaseEricssonSupply
chain

Optimizing on network and site level and introducing
alternative energy sources impacts
the Total Cost of OwnershipSustainable energy solutions give a competitive advantage

Innovative solutionsThree-step process for energy efficient communication
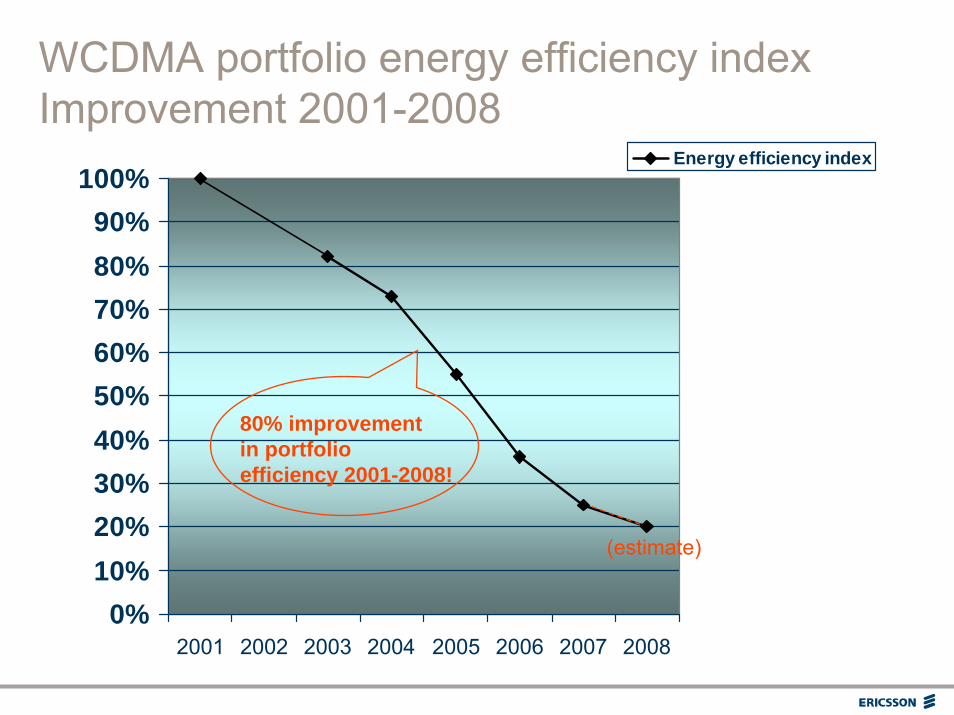
WCDMA portfolio energy efficiency index Improvement 2001-2008
0%10%20%30%40%50%60%70%80%90%
100%
2001 2002 2003 2004 2005 2006 2007 2008
Energy efficiency index
(estimate)
80% improvement in portfolio efficiency 2001-2008!

Energy-efficient products and featuresOur power-savings solution
0
200
400
600
800
1000
1200
1400
12 14 16 18 20 22 24 2 4 6 8 10 12 14 16 18 20 22
36 hours operation
Wat
t (po
wer
)
0
100
200
Normal RBSpowerconsumption
With BTSPower Savingsswitched on
Traffic loadvariation (% ofdim.) City site
2% GoSdimensioningline
Potential reduction: 7.300.000 kW per year
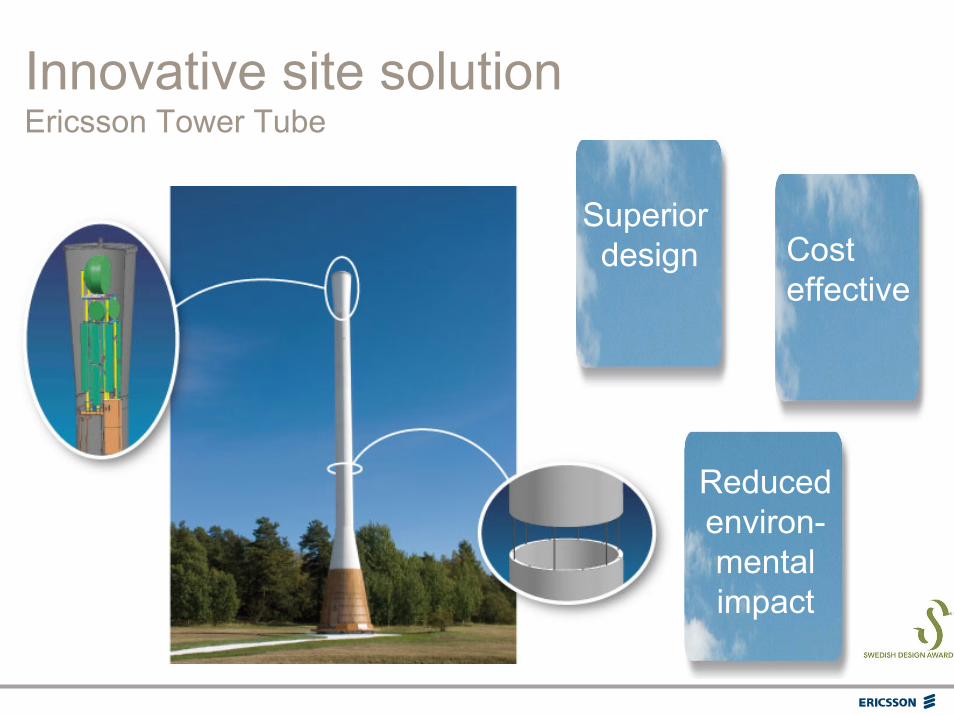
Cost effective
Reduced environ-mental impact
Superior design
Innovative site solution Ericsson Tower Tube

Alternative energy sources
Solar powerFuel cellsHybrid solutions (solar/wind/diesel)Wind powerBiofuels
… are growing in importance

Services for all energy aspects
Optimal network designEnergy consultancy services
EngineeringOptimization of energy sources and power using equipment and cooling
Civil works designStructural design for energy optimisation
Managed ServicesPower supply operations

Mobile broadband and sustainability The Telstra experience
Next G™ network is delivering voice and broadband services to 99% of the populationSurvey with 26 companies across 15 industries currently using the network Main environmental benefits from the use of Next G™
– reduced travel; on average 5-10%, as high as 17%

Understanding the relationship between energy, OPEX and CO2
– Enables us to develop efficient products and innovative sustainable energy solutions
Energy-lean solutions create competitive advantageOur technology can provide solutions to address climate change
– More energy-efficient telecom growth– Travel replacement– Dematerialization
Conclusions
Our competitive advantage