Norms for the AQoL-6D and AQoL-8D multi attribute utility ...
45
Research Paper 2016 (94) Norms for the AQoL-6D and AQoL-8D multi attribute utility instruments Aimee Maxwell Centre for Health Economics Monash Business School, Monash University Mehmet Özmen Department of Econometrics and Business Statistics Monash Business School, Monash University Angelo Iezzi Centre for Health Economics Monash Business School, Monash University Professor Jeff Richardson Foundation Director, Centre for Health Economics Monash Business School, Monash University July 2016 Centre for Health Economics ISSN 1833-1173 ISBN ..........................
Transcript of Norms for the AQoL-6D and AQoL-8D multi attribute utility ...
Research Paper 2016 (94)
Norms for the AQoL-6D and AQoL-8D multi attribute utility instruments
Aimee Maxwell
Centre for Health Economics Monash Business School, Monash University
Mehmet Özmen
Department of Econometrics and Business Statistics Monash Business School, Monash University
Angelo Iezzi Centre for Health Economics
Monash Business School, Monash University
Professor Jeff Richardson
Foundation Director, Centre for Health Economics Monash Business School, Monash University
July 2016
Centre for Health Economics
ISSN 1833-1173
ISBN ..........................

Norms for the AQoL-6D and AQoL-8D multi attribute utility instruments
Correspondence:
Professor Jeff Richardson
Centre for Health Economics
Monash Business School
Monash University Vic 3800
Australia
Ph: +61 3 9905 0733 Fax: +61 3 9905 8344
Email address: [email protected]
Norms for the AQoL-6D and AQoL-8D multi attribute utility instruments
PREFACE
A subsequent version of this paper has been published in Quality of Life Research, July 2016.
DOI: 10.1007/s11136-016-1337-z. The final publication is available at link.springer.com,
Norms for the AQoL-6D and AQoL-8D were estimated using data from an online survey. The
chief challenge in the study was to overcome the effect of self-selection: participants were all
individuals who had chosen to enrol with a panel company. The method used to offset the
resulting bias was based upon the simultaneous administration of the AQoL-4D instrument.
Norms for the AQoL-4D have been constructed using results from a large national survey
conducted by the Australian Bureau of Statistics (ABS). For each demographic cohort web-based
results were matched with the results from the ABS survey and a set of weights constructed to
correct web-based results. These were applied to web-based norms for AQoL-6D, 8D and each
of the constituent dimensions.
Unlike norms for other instruments the age profile of both the AQoL-6D and AQoL-8D are U-
shaped. The result is attributable to the very large psycho-social component of both instruments.
Psycho-social dimension scores improve significantly amongst the elderly. Scores for the
dimensions of physical health declined almost monotonically.
ABSTRACT

Norms for the AQoL-6D and AQoL-8D multi attribute utility instruments
TABLE OF CONTENTS
1 Introduction ............................................................................................................................... 1
2 Methods .................................................................................................................................... 3
3 Results ..................................................................................................................................... 4
4 Discussion ................................................................................................................................ 6
5 Conclusion ................................................................................................................................ 6
References ................................................................................................................................ 29
Tables
Table 1 Items per dimension: AQoL and other MAU instruments ................................................. 7
Table 2 Number and percent of respondents by age and gender after editing .............................. 8
Table 3 Population norms by age and gender(1)
........................................................................... 9
Table 4 Population norms by gender and education(1)
................................................................ 10
Table 5 Dimension norms by age and gender ............................................................................ 11
Table 6 Unweighted AQoL-6D population norms by age and gender ......................................... 14
Table 7 Unweighted AQoL-8D population norms by age and gender ......................................... 15
Table 8 Unweighted AQoL-8D Population norms: Independent Living ....................................... 16
Table 9 Unweighted AQoL-8D Population norms: Happiness..................................................... 17
Table 10 Unweighted AQoL-8D Population norms: Mental Health.............................................. 18
Table 11 Unweighted AQoL-8D Population norms: Coping ........................................................ 19
Table 12 Unweighted AQoL-8D Population norms: Relationships .............................................. 20
Table 13 Unweighted AQoL-8D Population norms: Self-Worth ................................................... 21
Table 14 Unweighted AQoL-8D Population norms: Pain ............................................................ 22
Table 15 Unweighted AQoL-8D Population norms: Senses ....................................................... 23
Table 16 Unweighted AQoL-8D Population norms: Mental Super Dimension (MSD) .................. 24
Table 17 Unweighted AQoL-8D Population norms: Physical Super Dimension (PSD) ................ 25
Appendix 1 Editing .................................................................................................................. 31
Table A1.1 Cases deleted by criterion ........................................................................................ 32
Table A1.2 Cell count by retained and deleted responses .......................................................... 33
Appendix 2 Relationship between AQoL-4D, AQoL-6D and AQoL-8D.................................. 34
Table A2.1 Pearson correlation coefficients ............................................................................... 34
Table A2.2 GMS Regressions (n=6,848) .................................................................................... 34
Table A2.3 Regression upon AQoL-8D dimensions* (n=6,848) Beta coefficients ....................... 34
Appendix 3 Bar charts for dimension norms ......................................................................... 35
Figure A3 1(a) Psycho-social Super Dimension ......................................................................... 35
Figure A3 1(b) Mental Health ..................................................................................................... 35
Figure A3 1(c) Happiness .......................................................................................................... 36
Figure A3 1(d) Self Worth .......................................................................................................... 36
Figure A3 1(e) Coping ............................................................................................................... 36
Figure A3 1(f) Relationships....................................................................................................... 38
Figure A3 1(g) Physical Super Dimension .................................................................................. 38
Figure A3 1(h) Independent Living ............................................................................................. 38
Figure A3 1(i) Pain ..................................................................................................................... 40
Figure A3 1(j) Senses ................................................................................................................ 40

Norms for the AQoL-6D and AQoL-8D multi attribute utility instruments

Norms for the AQoL-6D and AQoL-8D multi attribute utility instruments 1
Norms for the AQoL-6D and AQoL-8D multi attribute utility instruments
1 Introduction
Five AQoL instruments exist. AQoL-4D, AQoL-6D and AQoL-8D were the result of independent
research projects which recreated the descriptive systems and utility algorithms. Items in the
descriptive systems represent 4, 6 and 8 psychometrically independent dimensions of the quality
of life. An additional non-utility instrument, the VisQoL, was constructed for use with visually
impaired patients. It was combined with AQoL-6D to form the AQoL-7D. Utility weights were
calculated for the new instrument in a dedicated survey and analysis. AQoL 8 is a ‘brief’ version
of AQoL-4D in which a single item from each dimension was removed and its value estimated by
interpolation from the remaining two items so that the AQoL-4D algorithm could be used to derive
utility weights.
The instruments are summarised in Box 1. Their relationship to each other is shown in Figure 1
and the linear relationship between the instruments given in Box 2. The content of AQoL-4D is
largely subsumed by AQoL-6D and AQoL-8D. However wording and items differ. In contrast,
AQoL-6D items and dimensions are reproduced identically in AQoL-8D. However dimension
scores and utilities differ as they were independently calculated from independent surveys as
described below. AQoL-6D is similarly subsumed by AQoL-7D but utilities were also assessed
independently. The AQoL-7D utility survey included equal number of visually impaired and
randomly selected Australians.
[Figure 1 about here]
[Box 1 about here]
[Box 2 about here]
Table 1 classifies the AQoL items by dimensions of the quality of life (QoL). The classification of
dimensions was drawn eclectically from the MAU literature to facilitate the comparison of
instruments.
The AQoL instruments are all available for use without charge on the AQoL website [1] (or
Google ‘AQoL’). The website includes user instructions, notes on the instruments, on cost utility
analysis, and access to the online self-completion version of the AQoL-8D which may also be
accessed by the CHE website (see Box 3).
[Table 1 about here]
[Box 3 about here]
Norms for the AQoL-6D and AQoL-8D multi attribute utility instruments 2
To assist with the interpretation of the numbers produced by instruments it is common practice to
provide ‘population norms’: estimates of the average instrument values for different age-gender
cohorts. Population norms are generally estimated from the results of a large and reputable
national or area based survey which achieves a sufficiently high response rate to give confidence
in the representativeness of the results. Norms were published for AQoL-4D in 2013 using data
from the 2007 National Survey of Mental Health and Wellbeing (NSMHWB) [2, 3]. No such
national survey has included the AQoL-6D or AQoL-8D.
The objective of the present paper is threefold. First, it illustrates a general method for estimating
population norms for an instrument using web-based data when suitable auxiliary variables are
available. In this case, AQoL-4D scores, age and gender are employed as the auxiliary variables.
Secondly, it presents the resulting norms for the AQoL-6D and AQoL-8D instruments and for their
constituent dimensions.
A third objective is to present a second set of norms for AQoL-6D, 8D and for each of the
dimensions based upon results which have not been weighted for the relative importance of items
and dimensions but have been adjusted to allow for self-selection as described below. The
reason for the duplication is that the universal practice in economics of attaching importance
weights to social data is rejected by many psychologists whose instruments (including all
subjective wellbeing instruments) remain unweighted.
. In a landmark article, Dawes [4] argued that complex statistical algorithms add little to the
predictive power of simple scoring methods, a view which has been subsequently defended
theoretically and empirically [5, 6]. The theoretical arguments have drawn upon Locke’s [7, 8]
‘Range of Affect’ hypothesis. This maintains that the response to satisfaction questions will reflect
the importance of the subject to the individual even when there is no explicit reference to its
importance in the question: people will take importance into account psychologically and give
more extreme responses when the subject matter is of importance. Empirical evidence for the
hypothesis has been found by Dana and Dawes [9], Wu and Yao [10, 11] and Wu et al. [12].
A second theoretical explanation for Dawes’ conclusion is that utility weights derived from
regression analysis may be non-optimal. Regression coefficients are unbiased but can be
inefficient. Coefficients from a sub-sample of the total population may ‘over-fit’ the data by
adjusting to best fit a specific sample. As a result there will be ‘shrinkage’ (a reduction in R2)
when results are applied to the full population or another sample [13]. For related reasons it has
been argued that regression coefficients may not be the most efficient for achieving predictive
validity [9, 14]. Parameters obtained from any weighting methodology may not correctly represent
the preferences of a subset of patients in a particular study. Summarising psychological research,
Kahneman [15] reports that ‘formulas that assign equal weights to all the predictors are often
superior because they are not affected by accidents of sampling’ (p226). It is further suggested
that for specific purposes – which, in the present context is the measurement of utility – a simple
adjustment to the unweighted, global score may achieve equal or better results than the use of
variable weights [13].
In sum, there are theoretical reasons for the use of health state specific utility weights rather than
a simple adjustment to the global score obtained from the use of equal weights. However there
are also counter arguments and evidence for doubting the advantage of this approach.
To test these conflicting hypotheses unweighted scores were calculated for all of the instruments
in the multi instrument comparison (MIC) survey [16] and differences in utility compared with
differences in scores (n=8019). Linear scale effects accounted for 30.3 percent of the average
Norms for the AQoL-6D and AQoL-8D multi attribute utility instruments 3
difference; content – unweighted scores – for 66 percent and the ‘micro utility effect’ – the
unexplained difference attributable to weighting, accounted for 3.7 percent [17]. These results fail
to disconfirm the arguments in the psychologists’ literature and therefore justify publication of
norms with and without importance weights.
2 Methods
A web-based survey was conducted which administered the AQoL-4D, AQoL-6D, and AQoL-8D
to members of the public enrolled with the panel company, CINT Pty Ltd. The survey was
administered by a speaking avatar. After an initial introduction participants were asked to
complete the AQoL-4D.
Utility scores were calculated and the respondent was assigned to the relevant demographic
cohort. The interview continued if the quota for that cohort was not full. The order of the AQoL-8D
questions, which followed, were randomised to offset bias from an ordering effect. Education and
economic status were obtained at the end of the survey. The survey was approved by the
Monash University Human Research Ethics Committee Approval ID: CF15/2829 – 2015001164.
Analysis: Four criteria were applied to edit the data. These are discussed in Appendix 1.
While the reasons behind self-selection and non-response bias are complex, post-stratification
survey weights can mathematically align the survey to the population along a small number of
dimensions, to reduce many of these complex biases.
In the present study age, gender and AQoL-4D utility were selected as post-stratification
auxiliaries to adjust results for the bias arising from the self-selection of survey participants. Age
and gender were obtained from the Australian Bureau of Statistics (ABS) census [3]. Estimates
for the cohort specific distribution of the AQoL-4D distribution were obtained from another ABS
survey. The 2007 National Survey of Mental Health and Wellbeing (NSMHWB) was a nationally
representative cross sectional household survey.
For each age (i) and gender (j) cohort the NSMHWB provides the distribution of AQoL-4D utilities
across k categories, where each category is defined by a range of utility scores [ -0.04 to <0.2;
0.2 to <0.4; 0.4 to < 0.6; 0.6 to <0.8; 0.8 to <1 and 1]. Age and gender cohort counts available
from the National Census data (Nij) were further split into AQoL-4D categories in the same
proportion as occurred in the NSMHWB data to produce counts by age, gender and AQoL-4D
categories (Nijk).
The population in each cell 𝑁𝑖𝑗𝑘 was converted to a proportion, 𝑝𝑖𝑗𝑘, of the total Australia
population, N aged 15 to 74. Therefore, 𝑝𝑖𝑗𝑘 = 𝑁𝑖𝑗𝑘/𝑁. Similarly 𝑝𝑖𝑗𝑘∗ was calculated as 𝑝𝑖𝑗𝑘
∗ =
𝑛𝑖𝑗𝑘/𝑛 where n is the total number of valid web-based survey respondents and 𝑛𝑖𝑗𝑘 the
respondent numbers in cell ijk. Consequently 𝑝𝑖𝑗𝑘∗ is the proportion of web-based survey
respondents in the cell ijk. These proportions were used to calculate the proportional weights
w𝑖𝑗𝑘 = 𝑝𝑖𝑗𝑘 𝑝𝑖𝑗𝑘∗⁄ and cohort specific population weights 𝑊𝑖𝑗𝑘 = 𝑤𝑖𝑗𝑘 × 𝑁/𝑛 = 𝑁𝑖𝑗𝑘/𝑛𝑖𝑗𝑘. The sum
of the weights W ijk equals the population size within each post-stratum and were used to estimate
stratum means and standard errors.
Standard errors were estimated using a ‘design based’ method that makes no assumptions about
the model that is generating the data, but instead uses available sample information. The
population weight, W ijk, scales cohort counts to the correct population level while maintaining
Norms for the AQoL-6D and AQoL-8D multi attribute utility instruments 4
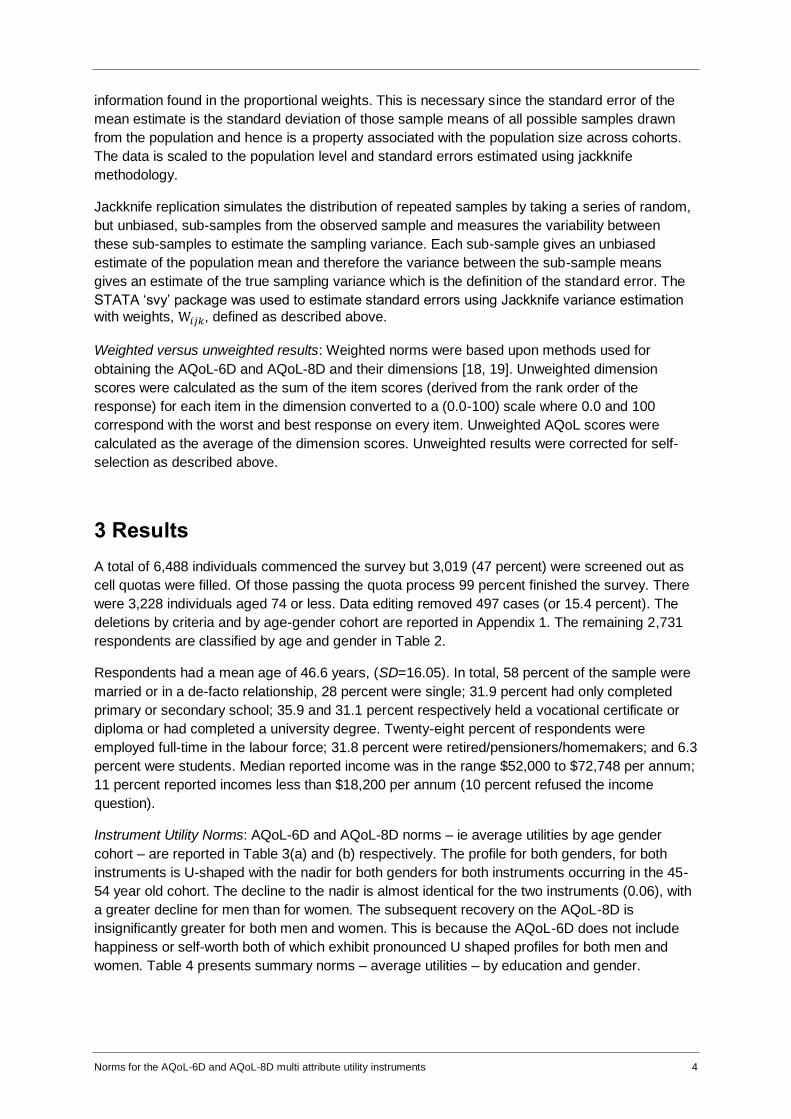
information found in the proportional weights. This is necessary since the standard error of the
mean estimate is the standard deviation of those sample means of all possible samples drawn
from the population and hence is a property associated with the population size across cohorts.
The data is scaled to the population level and standard errors estimated using jackknife
methodology.
Jackknife replication simulates the distribution of repeated samples by taking a series of random,
but unbiased, sub-samples from the observed sample and measures the variability between
these sub-samples to estimate the sampling variance. Each sub-sample gives an unbiased
estimate of the population mean and therefore the variance between the sub-sample means
gives an estimate of the true sampling variance which is the definition of the standard error. The
STATA ‘svy’ package was used to estimate standard errors using Jackknife variance estimation
with weights, W𝑖𝑗𝑘, defined as described above.
Weighted versus unweighted results: Weighted norms were based upon methods used for
obtaining the AQoL-6D and AQoL-8D and their dimensions [18, 19]. Unweighted dimension
scores were calculated as the sum of the item scores (derived from the rank order of the
response) for each item in the dimension converted to a (0.0-100) scale where 0.0 and 100
correspond with the worst and best response on every item. Unweighted AQoL scores were
calculated as the average of the dimension scores. Unweighted results were corrected for self-
selection as described above.
3 Results
A total of 6,488 individuals commenced the survey but 3,019 (47 percent) were screened out as
cell quotas were filled. Of those passing the quota process 99 percent finished the survey. There
were 3,228 individuals aged 74 or less. Data editing removed 497 cases (or 15.4 percent). The
deletions by criteria and by age-gender cohort are reported in Appendix 1. The remaining 2,731
respondents are classified by age and gender in Table 2.
Respondents had a mean age of 46.6 years, (SD=16.05). In total, 58 percent of the sample were
married or in a de-facto relationship, 28 percent were single; 31.9 percent had only completed
primary or secondary school; 35.9 and 31.1 percent respectively held a vocational certificate or
diploma or had completed a university degree. Twenty-eight percent of respondents were
employed full-time in the labour force; 31.8 percent were retired/pensioners/homemakers; and 6.3
percent were students. Median reported income was in the range $52,000 to $72,748 per annum;
11 percent reported incomes less than $18,200 per annum (10 percent refused the income
question).
Instrument Utility Norms: AQoL-6D and AQoL-8D norms – ie average utilities by age gender
cohort – are reported in Table 3(a) and (b) respectively. The profile for both genders, for both
instruments is U-shaped with the nadir for both genders for both instruments occurring in the 45-
54 year old cohort. The decline to the nadir is almost identical for the two instruments (0.06), with
a greater decline for men than for women. The subsequent recovery on the AQoL-8D is
insignificantly greater for both men and women. This is because the AQoL-6D does not include
happiness or self-worth both of which exhibit pronounced U shaped profiles for both men and
women. Table 4 presents summary norms – average utilities – by education and gender.
Norms for the AQoL-6D and AQoL-8D multi attribute utility instruments 5
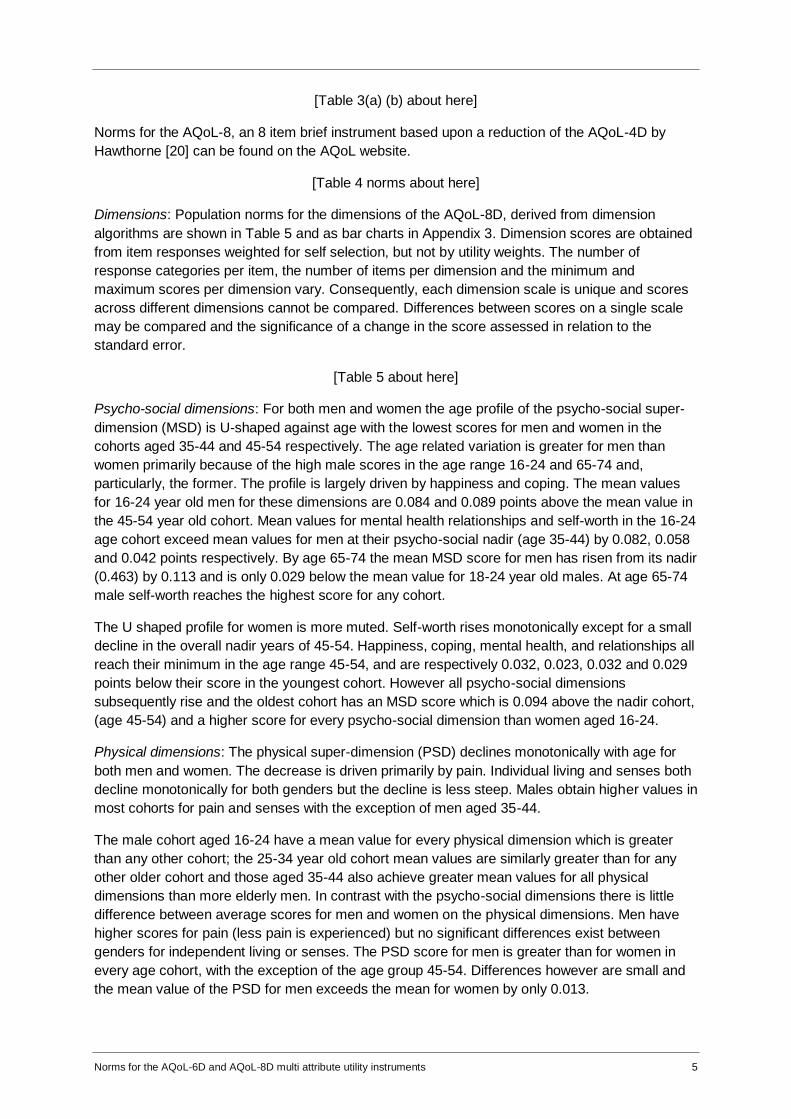
[Table 3(a) (b) about here]
Norms for the AQoL-8, an 8 item brief instrument based upon a reduction of the AQoL-4D by
Hawthorne [20] can be found on the AQoL website.
[Table 4 norms about here]
Dimensions: Population norms for the dimensions of the AQoL-8D, derived from dimension
algorithms are shown in Table 5 and as bar charts in Appendix 3. Dimension scores are obtained
from item responses weighted for self selection, but not by utility weights. The number of
response categories per item, the number of items per dimension and the minimum and
maximum scores per dimension vary. Consequently, each dimension scale is unique and scores
across different dimensions cannot be compared. Differences between scores on a single scale
may be compared and the significance of a change in the score assessed in relation to the
standard error.
[Table 5 about here]
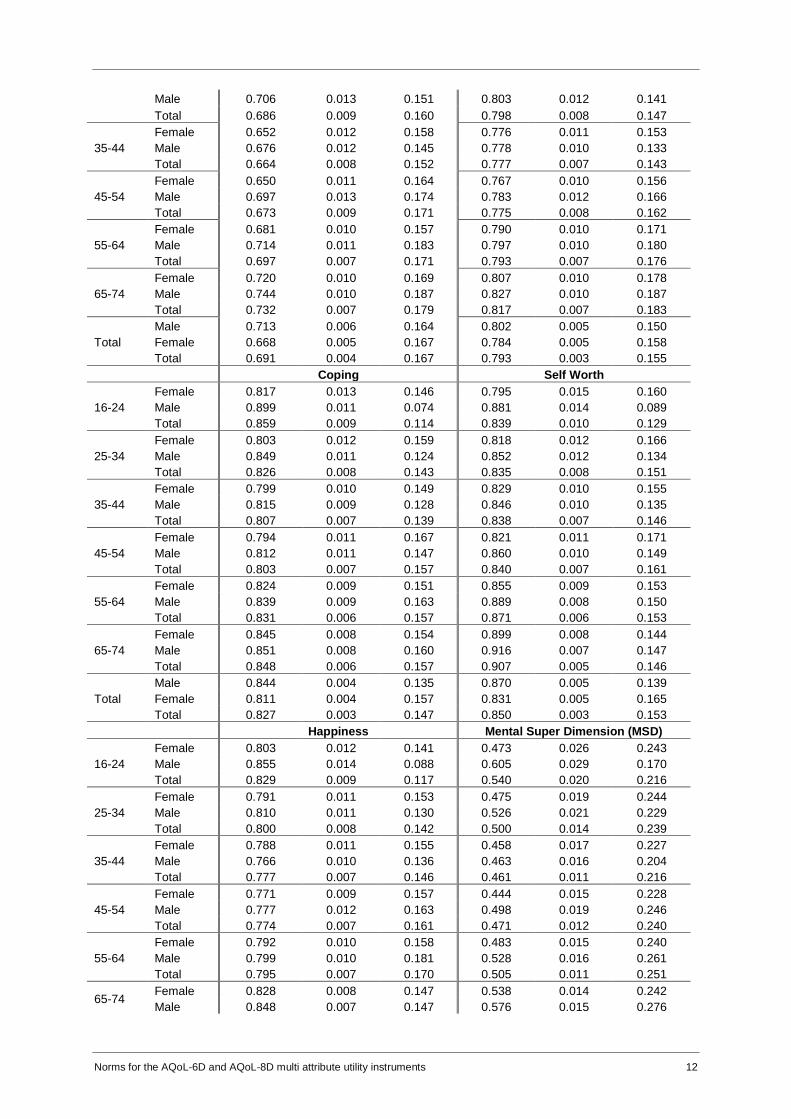
Psycho-social dimensions: For both men and women the age profile of the psycho-social super-
dimension (MSD) is U-shaped against age with the lowest scores for men and women in the
cohorts aged 35-44 and 45-54 respectively. The age related variation is greater for men than
women primarily because of the high male scores in the age range 16-24 and 65-74 and,
particularly, the former. The profile is largely driven by happiness and coping. The mean values
for 16-24 year old men for these dimensions are 0.084 and 0.089 points above the mean value in
the 45-54 year old cohort. Mean values for mental health relationships and self-worth in the 16-24
age cohort exceed mean values for men at their psycho-social nadir (age 35-44) by 0.082, 0.058
and 0.042 points respectively. By age 65-74 the mean MSD score for men has risen from its nadir
(0.463) by 0.113 and is only 0.029 below the mean value for 18-24 year old males. At age 65-74
male self-worth reaches the highest score for any cohort.
The U shaped profile for women is more muted. Self-worth rises monotonically except for a small
decline in the overall nadir years of 45-54. Happiness, coping, mental health, and relationships all
reach their minimum in the age range 45-54, and are respectively 0.032, 0.023, 0.032 and 0.029
points below their score in the youngest cohort. However all psycho-social dimensions
subsequently rise and the oldest cohort has an MSD score which is 0.094 above the nadir cohort,
(age 45-54) and a higher score for every psycho-social dimension than women aged 16-24.
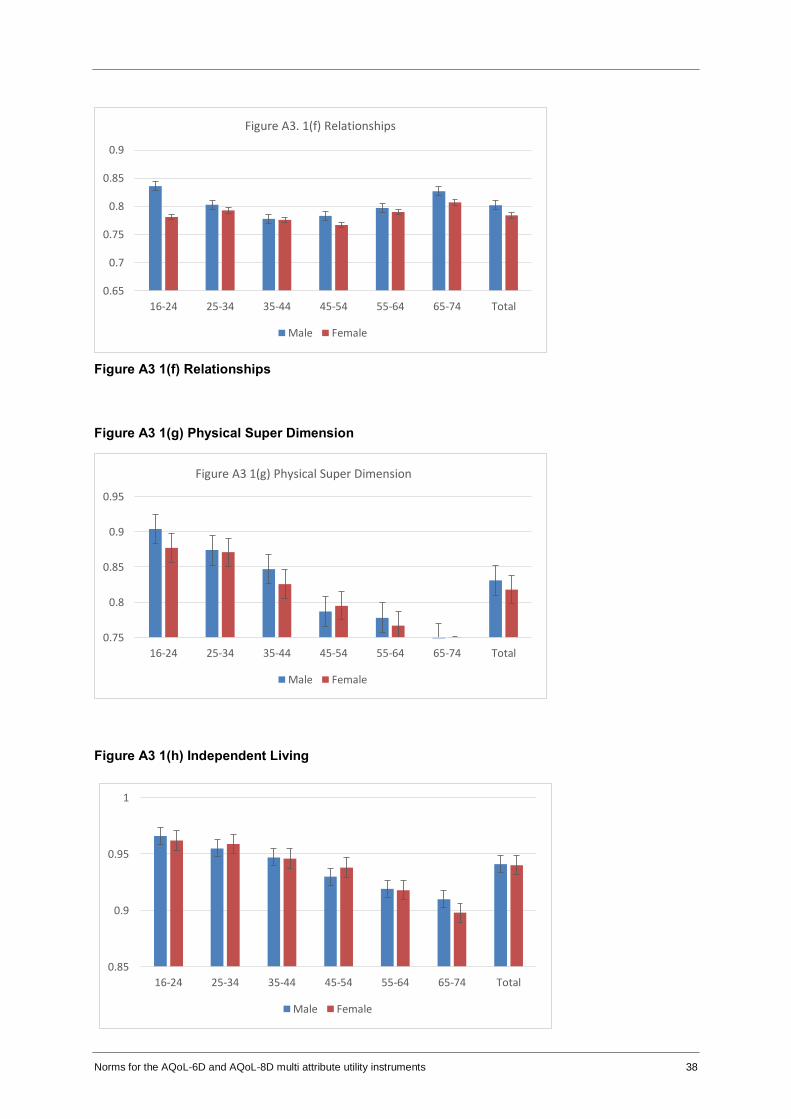
Physical dimensions: The physical super-dimension (PSD) declines monotonically with age for
both men and women. The decrease is driven primarily by pain. Individual living and senses both
decline monotonically for both genders but the decline is less steep. Males obtain higher values in
most cohorts for pain and senses with the exception of men aged 35-44.
The male cohort aged 16-24 have a mean value for every physical dimension which is greater
than any other cohort; the 25-34 year old cohort mean values are similarly greater than for any
other older cohort and those aged 35-44 also achieve greater mean values for all physical
dimensions than more elderly men. In contrast with the psycho-social dimensions there is little
difference between average scores for men and women on the physical dimensions. Men have
higher scores for pain (less pain is experienced) but no significant differences exist between
genders for independent living or senses. The PSD score for men is greater than for women in
every age cohort, with the exception of the age group 45-54. Differences however are small and
the mean value of the PSD for men exceeds the mean for women by only 0.013.

Norms for the AQoL-6D and AQoL-8D multi attribute utility instruments 6
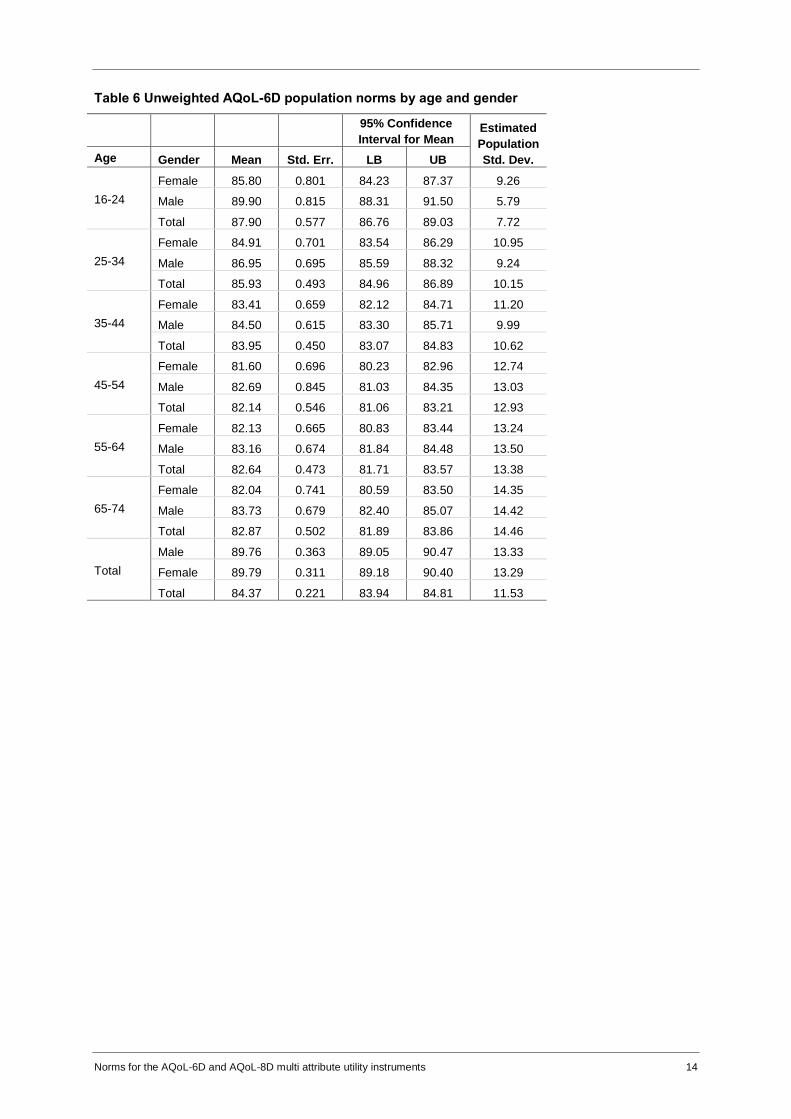
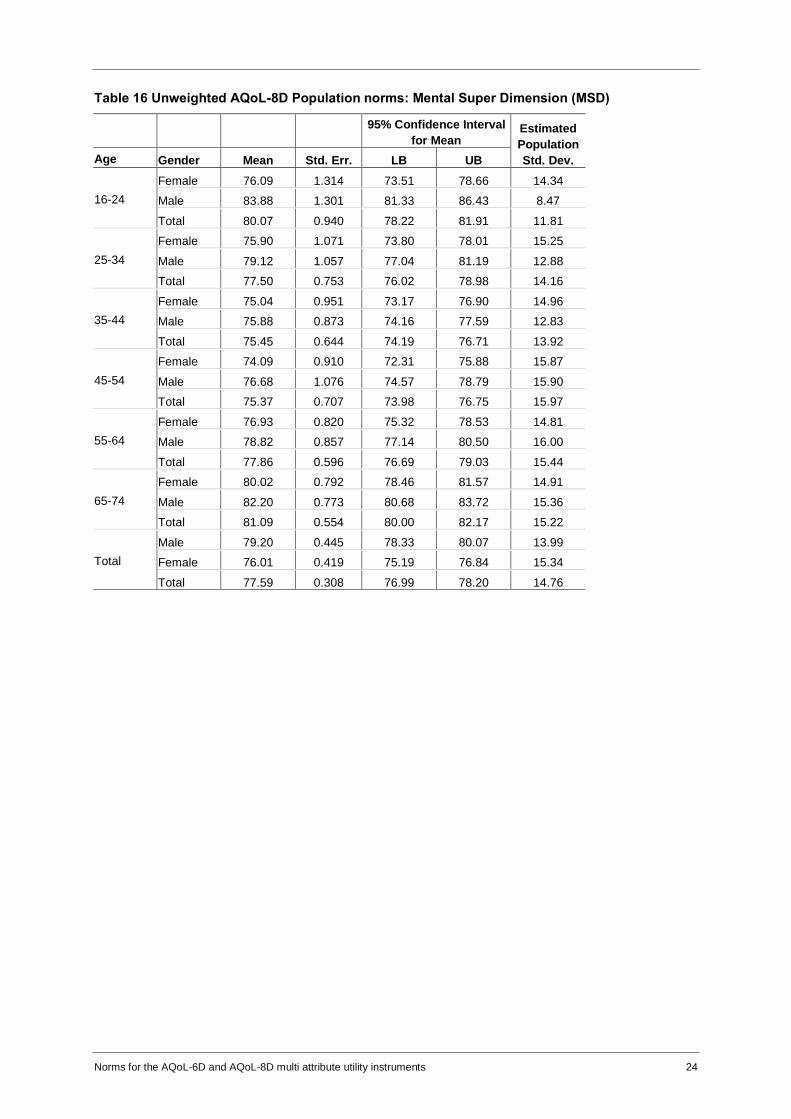
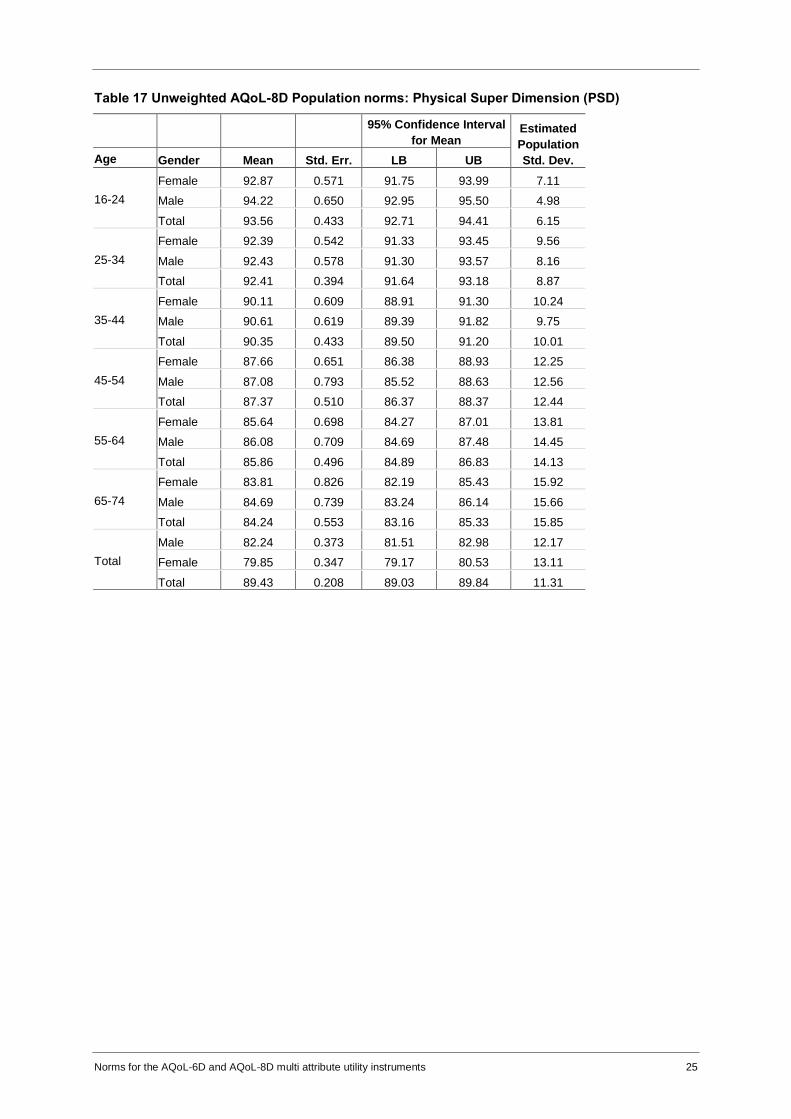
Unweighted population norms: Tables 6 and 7 present the unweighted norms for AQoL-6D and
AQoL-8D by age and gender. Tables 8-15 present the unweighted dimension norms and Tables
16 and 17 norms for the ‘physical super dimension’ (PSD) and the (psycho-social) ‘mental super
dimension’ (MSD).
4 Discussion
The methods described in this paper illustrate how the problem of self-selection by web-based
respondents may be overcome or significantly ameliorated. The analytical basis of this method is
theoretically plausible. To the extent that the ABS profile of the age-gender distribution, and the
profile of AQoL-4D utilities reflect the true profiles in the Australian population and to the extent
that AQoL-4D utilities reflect the relevant attributes of the AQoL-6D and AQoL-8D then adjusting
our sample to replicate the ABS profile ensures a valid set of AQoL-6D and AQoL-8D norms.
ABS age-gender distributions were derived from the national census. AQoL-4D norms were
derived from an ABS survey which employed best available survey techniques. [3].
However, as outlined in Appendix 2 the content of AQoL-4D, AQoL-6D and AQoL-8D differ. The
differences are not random. Both AQoL-6D and AQoL-8D increased the psycho-social content of
the construct measured. Consequently, individuals with the same AQoL-4D score may have
dissimilar but compensating physical and psycho-social scores.
The existence or extent of residual bias in the present norms cannot be determined as there is no
gold standard against which to validate results. Norms for the two new AQoL instruments differ
significantly from those obtained from other MAU instruments. This reflects the greater psycho-
social content of the instruments and the improvement in these dimensions which occurs beyond
a certain age. The difference implies that they have a comparative advantage for the
measurement of health states where psycho-social health is of importance.
In practice all instruments which purport to measure utility give numerical values which differ
significantly. The largest six instrument comparative study to date found, on average, absolute
differences between utilities predicted for individuals of 0.11. The discrepancy was attributable to
differences in questions in the descriptive system and to differences in the measurement scale
which compressed or inflated responses differently [17]. The AQoL instruments are subject to the
same caveats. Their properties have been compared and documented [21]. A statistical
transformation exists on the AQoL website which aligns the scales [22]. Likewise, transformations
have been published between both AQoL-6D and AQoL-8D and each of the major MAU
instruments: EQ-5D-5L, SF-6D, HUI 3, 15D, QWB [23]. Transformations align instrument scales
but largely preserve the sensitivity of the original instrument.
5 Conclusion
This paper has demonstrated the use of post-stratification weights to mitigate the effects of self-
selection in a web-based survey to obtain population norms. Both the AQoL-6D and AQoL-8D
instruments give U-shaped age profiles reflecting the positive effect of ageing upon the psycho-
social dimensions which are heavily represented in these instruments.

Norms for the AQoL-6D and AQoL-8D multi attribute utility instruments 7
Table 1 Items per dimension: AQoL and other MAU instruments
Dimensions AQoL instruments Other MAUI
8 4D 6D 7D 8D EQ-5D-5L SF-6D HUI 3 15D
Dimensions of physical health
Physical ability/mobility/vitality/coping/control 1 1 3 6 4 1 1 2 2
Bodily functions/self care 2 2 1 1 1 1 3
Risk of pain/discomfort 1 1 3 3 3 1 1 1 1
Senses 2 2 3 3 3 2 2
Usual activities/work/role 1 2 1 1 1 1
Communication 1 1 1 1 1 1 1
Dimensions of psycho-social health
Depression/anxiety/anger/harm 1 1 1 2 5 1 1 1 3
Vitality 2 2 2 1
Sleeping 1 1 1 1
General satisfaction/contentment 5
Self esteem/confidence 1 3
Cognition/memory ability 1
Social functioning/relationships 3 3 1 2 3 1
(Family role) Intimacy/sexual relationships 1 1 4 1
Total number of items 12 12 20 26 35 5 6 8 15

Norms for the AQoL-6D and AQoL-8D multi attribute utility instruments 8
Table 2 Number and percent of respondents by age and gender after editing
n % 16-24 25-34 35-44 45-54 55-64 65-74 Total
Males 1,258 46.1 8.4 15.5 17.7 18.2 21.5 18.7 100
Females 1,473 53.9 14.1 17.0 17.6 18.3 18.5 14.5 100
Total 2,731 100 11.5 16.3 17.7 18.2 19.9 16.4 100

Norms for the AQoL-6D and AQoL-8D multi attribute utility instruments 9
Table 3 Population norms by age and gender(1)
3(a) AQoL-6D
Gender Age
group
Mean Std Err Est Pop
SD
Gender Age
group
Mean Std Err Est Pop
SD
Gender Age
group
Mean Std Err Est Pop
SD
Male
16-24 0.904 0.010 0.076
Female
16-24 0.840 0.012 0.147
All
16-24 0.873 0.008 0.114
25-34 0.865 0.010 0.134 25-34 0.834 0.011 0.166 25-34 0.849 0.007 0.151
35-44 0.846 0.009 0.145 35-44 0.819 0.010 0.165 35-44 0.832 0.007 0.156
45-54 0.824 0.012 0.182 45-54 0.803 0.011 0.188 45-54 0.813 0.008 0.185
55-64 0.851 0.010 0.187 55-64 0.837 0.009 0.184 55-64 0.844 0.007 0.186
65-74 0.869 0.009 0.186 65-74 0.850 0.010 0.191 65-74 0.859 0.007 0.189
Total 0.859 0.004 0.152 Total 0.828 0.004 0.174 Total 0.844 0.003 0.164
3(b) AQoL-8D
Gender Age
group
Mean Std Err Est Pop
SD
Gender Age
group
Mean Std Err Est Pop
SD
Gender Age
group
Mean Std Err Est Pop
SD
Male
16-24 0.869 0.013 0.093
Female
16-24 0.786 0.014 0.167
All
16-24 0.828 0.010 0.133
25-34 0.807 0.012 0.218 25-34 0.789 0.013 0.191 25-34 0.805 0.009 0.173
35-44 0.820 0.012 0.154 35-44 0.777 0.012 0.187 35-44 0.784 0.008 0.174
45-54 0.791 0.011 0.161 45-54 0.757 0.012 0.204 45-54 0.769 0.009 0.202
55-64 0.780 0.013 0.198 55-64 0.785 0.011 0.203 55-64 0.796 0.008 0.211
65-74 0.836 0.010 0.217 65-74 0.814 0.011 0.213 65-74 0.825 0.007 0.216
Total 0.816 0.005 0.173 Total 0.782 0.005 0.194 Total 0.799 0.004 0.185
(1) Weights derived from AQoL-4D ABS age and gender census data applies to web data.

Norms for the AQoL-6D and AQoL-8D multi attribute utility instruments 10
Table 4 Population norms by gender and education(1)
AQoL Measure Gender Level of Education Mean Std. Err. Std. Dev.
AQoL-6D
Male
High School 0.840 0.010 0.180
TAFE/Diploma/Trade qualifications 0.855 0.007 0.165
Graduate/postgraduate 0.876 0.006 0.118
Female
High School 0.814 0.008 0.192
TAFE/Diploma/Trade qualifications 0.818 0.008 0.196
Graduate/postgraduate 0.851 0.007 0.133
AQoL-8D
Male
High School 0.793 0.012 0.203
TAFE/Diploma/Trade qualifications 0.815 0.009 0.188
Graduate/postgraduate 0.833 0.007 0.137
Female
High School 0.770 0.010 0.219
TAFE/Diploma/Trade qualifications 0.767 0.009 0.213
Graduate/postgraduate 0.807 0.008 0.152
(1) Weights derived from AQoL-4D ABS age and gender census data applies to web data.

Norms for the AQoL-6D and AQoL-8D multi attribute utility instruments 11
Table 5 Dimension norms by age and gender
Weighted only to correct for self-selection: ie unweighted by utilities
Physical Dimensions
Age Gender Independent Living Senses
Mean Std. Err. Std. Dev. Mean Std. Err. Std. Dev.
16-24
Female 0.962 0.005 0.066 0.935 0.007 0.087
Male 0.966 0.006 0.050 0.947 0.008 0.055
Total 0.964 0.004 0.059 0.941 0.005 0.072
25-34
Female 0.959 0.005 0.090 0.935 0.006 0.084
Male 0.955 0.005 0.080 0.938 0.006 0.085
Total 0.957 0.004 0.085 0.937 0.004 0.085
35-44
Female 0.946 0.005 0.100 0.922 0.006 0.085
Male 0.947 0.005 0.092 0.924 0.006 0.092
Total 0.946 0.004 0.096 0.923 0.004 0.089
45-54
Female 0.938 0.006 0.117 0.885 0.006 0.095
Male 0.930 0.007 0.124 0.880 0.008 0.107
Total 0.934 0.005 0.121 0.883 0.005 0.101
55-64
Female 0.918 0.007 0.143 0.894 0.005 0.092
Male 0.919 0.007 0.149 0.880 0.006 0.113
Total 0.918 0.005 0.146 0.887 0.004 0.103
65-74
Female 0.898 0.009 0.177 0.886 0.006 0.110
Male 0.910 0.008 0.169 0.871 0.007 0.130
Total 0.904 0.006 0.174 0.878 0.005 0.120
Total
Male 0.941 0.003 0.106 0.911 0.003 0.099
Female 0.940 0.002 0.113 0.912 0.003 0.094
Total 0.941 0.002 0.110 0.911 0.002 0.097
Pain Physical Super Dimension (PSD)
16-24
Female 0.912 0.010 0.127 0.877 0.010 0.126
Male 0.937 0.011 0.080 0.904 0.011 0.082
Total 0.925 0.008 0.104 0.891 0.008 0.105
25-34
Female 0.900 0.010 0.166 0.871 0.010 0.156
Male 0.906 0.010 0.133 0.874 0.010 0.134
Total 0.903 0.007 0.149 0.872 0.007 0.145
35-44
Female 0.856 0.013 0.199 0.826 0.011 0.173
Male 0.882 0.011 0.160 0.847 0.011 0.158
Total 0.869 0.008 0.181 0.836 0.008 0.166
45-54
Female 0.841 0.012 0.220 0.795 0.011 0.194
Male 0.836 0.014 0.208 0.787 0.013 0.195
Total 0.839 0.009 0.214 0.791 0.008 0.195
55-64
Female 0.806 0.014 0.243 0.767 0.012 0.218
Male 0.833 0.013 0.249 0.778 0.012 0.224
Total 0.819 0.010 0.247 0.772 0.008 0.221
65-74
Female 0.771 0.015 0.274 0.732 0.013 0.243
Male 0.805 0.014 0.264 0.749 0.012 0.245
Total 0.788 0.010 0.271 0.740 0.009 0.245
Total
Male 0.873 0.005 0.180 0.831 0.005 0.174
Female 0.854 0.005 0.206 0.818 0.005 0.187
Total 0.864 0.004 0.193 0.825 0.004 0.181
Psycho-social Dimensions
Age Gender Mental health Relationships
Mean Std. Err. Std. Dev. Mean Std. Err. Std. Dev.
16-24
Female 0.665 0.017 0.168 0.781 0.014 0.141
Male 0.758 0.020 0.116 0.836 0.015 0.094
Total 0.713 0.013 0.148 0.809 0.010 0.120
25-34 Female 0.667 0.013 0.166 0.793 0.012 0.153
Norms for the AQoL-6D and AQoL-8D multi attribute utility instruments 12
Male 0.706 0.013 0.151 0.803 0.012 0.141
Total 0.686 0.009 0.160 0.798 0.008 0.147
35-44
Female 0.652 0.012 0.158 0.776 0.011 0.153
Male 0.676 0.012 0.145 0.778 0.010 0.133
Total 0.664 0.008 0.152 0.777 0.007 0.143
45-54
Female 0.650 0.011 0.164 0.767 0.010 0.156
Male 0.697 0.013 0.174 0.783 0.012 0.166
Total 0.673 0.009 0.171 0.775 0.008 0.162
55-64
Female 0.681 0.010 0.157 0.790 0.010 0.171
Male 0.714 0.011 0.183 0.797 0.010 0.180
Total 0.697 0.007 0.171 0.793 0.007 0.176
65-74
Female 0.720 0.010 0.169 0.807 0.010 0.178
Male 0.744 0.010 0.187 0.827 0.010 0.187
Total 0.732 0.007 0.179 0.817 0.007 0.183
Total
Male 0.713 0.006 0.164 0.802 0.005 0.150
Female 0.668 0.005 0.167 0.784 0.005 0.158
Total 0.691 0.004 0.167 0.793 0.003 0.155
Coping Self Worth
16-24
Female 0.817 0.013 0.146 0.795 0.015 0.160
Male 0.899 0.011 0.074 0.881 0.014 0.089
Total 0.859 0.009 0.114 0.839 0.010 0.129
25-34
Female 0.803 0.012 0.159 0.818 0.012 0.166
Male 0.849 0.011 0.124 0.852 0.012 0.134
Total 0.826 0.008 0.143 0.835 0.008 0.151
35-44
Female 0.799 0.010 0.149 0.829 0.010 0.155
Male 0.815 0.009 0.128 0.846 0.010 0.135
Total 0.807 0.007 0.139 0.838 0.007 0.146
45-54
Female 0.794 0.011 0.167 0.821 0.011 0.171
Male 0.812 0.011 0.147 0.860 0.010 0.149
Total 0.803 0.007 0.157 0.840 0.007 0.161
55-64
Female 0.824 0.009 0.151 0.855 0.009 0.153
Male 0.839 0.009 0.163 0.889 0.008 0.150
Total 0.831 0.006 0.157 0.871 0.006 0.153
65-74
Female 0.845 0.008 0.154 0.899 0.008 0.144
Male 0.851 0.008 0.160 0.916 0.007 0.147
Total 0.848 0.006 0.157 0.907 0.005 0.146
Total
Male 0.844 0.004 0.135 0.870 0.005 0.139
Female 0.811 0.004 0.157 0.831 0.005 0.165
Total 0.827 0.003 0.147 0.850 0.003 0.153
Happiness Mental Super Dimension (MSD)
16-24
Female 0.803 0.012 0.141 0.473 0.026 0.243
Male 0.855 0.014 0.088 0.605 0.029 0.170
Total 0.829 0.009 0.117 0.540 0.020 0.216
25-34
Female 0.791 0.011 0.153 0.475 0.019 0.244
Male 0.810 0.011 0.130 0.526 0.021 0.229
Total 0.800 0.008 0.142 0.500 0.014 0.239
35-44
Female 0.788 0.011 0.155 0.458 0.017 0.227
Male 0.766 0.010 0.136 0.463 0.016 0.204
Total 0.777 0.007 0.146 0.461 0.011 0.216
45-54
Female 0.771 0.009 0.157 0.444 0.015 0.228
Male 0.777 0.012 0.163 0.498 0.019 0.246
Total 0.774 0.007 0.161 0.471 0.012 0.240
55-64
Female 0.792 0.010 0.158 0.483 0.015 0.240
Male 0.799 0.010 0.181 0.528 0.016 0.261
Total 0.795 0.007 0.170 0.505 0.011 0.251
65-74 Female 0.828 0.008 0.147 0.538 0.014 0.242
Male 0.848 0.007 0.147 0.576 0.015 0.276

Norms for the AQoL-6D and AQoL-8D multi attribute utility instruments 13
Total 0.838 0.005 0.148 0.556 0.010 0.260
Total
Male 0.806 0.005 0.147 0.529 0.009 0.239
Female 0.793 0.004 0.155 0.473 0.008 0.241
Total 0.799 0.003 0.151 0.501 0.006 0.242
Norms for the AQoL-6D and AQoL-8D multi attribute utility instruments 14
Table 6 Unweighted AQoL-6D population norms by age and gender
95% Confidence
Interval for Mean Estimated
Population
Std. Dev. Age Gender Mean Std. Err. LB UB
16-24
Female 85.80 0.801 84.23 87.37 9.26
Male 89.90 0.815 88.31 91.50 5.79
Total 87.90 0.577 86.76 89.03 7.72
25-34
Female 84.91 0.701 83.54 86.29 10.95
Male 86.95 0.695 85.59 88.32 9.24
Total 85.93 0.493 84.96 86.89 10.15
35-44
Female 83.41 0.659 82.12 84.71 11.20
Male 84.50 0.615 83.30 85.71 9.99
Total 83.95 0.450 83.07 84.83 10.62
45-54
Female 81.60 0.696 80.23 82.96 12.74
Male 82.69 0.845 81.03 84.35 13.03
Total 82.14 0.546 81.06 83.21 12.93
55-64
Female 82.13 0.665 80.83 83.44 13.24
Male 83.16 0.674 81.84 84.48 13.50
Total 82.64 0.473 81.71 83.57 13.38
65-74
Female 82.04 0.741 80.59 83.50 14.35
Male 83.73 0.679 82.40 85.07 14.42
Total 82.87 0.502 81.89 83.86 14.46
Total
Male 89.76 0.363 89.05 90.47 13.33
Female 89.79 0.311 89.18 90.40 13.29
Total 84.37 0.221 83.94 84.81 11.53

Norms for the AQoL-6D and AQoL-8D multi attribute utility instruments 15
Table 7 Unweighted AQoL-8D population norms by age and gender
95% Confidence Interval
for Mean Estimated
Population
Std. Dev. Age Gender Mean Std. Err. LB UB
16-24
Female 80.97 1.037 78.93 83.00 11.46
Male 86.89 1.049 84.83 88.95 7.04
Total 83.99 0.749 82.52 85.46 9.57
25-34
Female 80.70 0.869 78.99 82.40 12.82
Male 82.99 0.858 81.31 84.67 10.83
Total 81.84 0.610 80.64 83.03 11.89
35-44
Female 79.42 0.783 77.88 80.95 12.77
Male 80.16 0.720 78.75 81.57 11.05
Total 79.78 0.531 78.74 80.82 11.93
45-54
Female 78.04 0.766 76.53 79.54 13.78
Male 79.70 0.938 77.86 81.54 14.09
Total 78.86 0.606 77.67 80.04 13.99
55-64
Female 79.46 0.700 78.09 80.83 13.44
Male 80.93 0.734 79.49 82.37 14.31
Total 80.19 0.509 79.19 81.18 13.90
65-74
Female 81.12 0.731 79.69 82.56 13.99
Male 82.92 0.688 81.58 84.27 14.30
Total 82.01 0.501 81.02 82.99 14.21
Total
Male 82.24 0.373 81.51 82.98 12.17
Female 79.85 0.347 79.17 80.53 13.11
Total 81.04 0.257 80.53 81.54 12.71

Norms for the AQoL-6D and AQoL-8D multi attribute utility instruments 16
Table 8 Unweighted AQoL-8D Population norms: Independent Living
95% Confidence Interval for Mean
Estimated Population Std. Dev. Age Gender Mean Std. Err. LB UB
16-24
Female 95.04 0.572 93.92 96.16 7.49
Male 95.83 0.685 94.48 97.17 5.49
Total 95.44 0.447 94.56 96.32 6.62
25-34
Female 94.91 0.552 93.83 95.99 9.99
Male 94.34 0.638 93.09 95.59 8.68
Total 94.63 0.421 93.80 95.45 9.35
35-44
Female 93.02 0.639 91.76 94.27 11.43
Male 93.11 0.654 91.83 94.39 10.61
Total 93.06 0.456 92.17 93.95 11.03
45-54
Female 92.10 0.686 90.75 93.44 13.52
Male 91.38 0.832 89.75 93.01 13.97
Total 91.74 0.536 90.69 92.79 13.79
55-64
Female 89.43 0.817 87.82 91.03 16.61
Male 89.86 0.833 88.22 91.49 17.05
Total 89.64 0.582 88.50 90.78 16.83
65-74
Female 87.68 1.034 85.65 89.71 20.16
Male 88.62 0.925 86.81 90.44 19.10
Total 88.14 0.692 86.79 89.50 19.75
Total
Male 92.56 0.317 91.94 93.19 12.07
Female 92.43 0.292 91.86 93.00 12.96
Total 92.50 0.215 92.08 92.92 12.53
Norms for the AQoL-6D and AQoL-8D multi attribute utility instruments 17
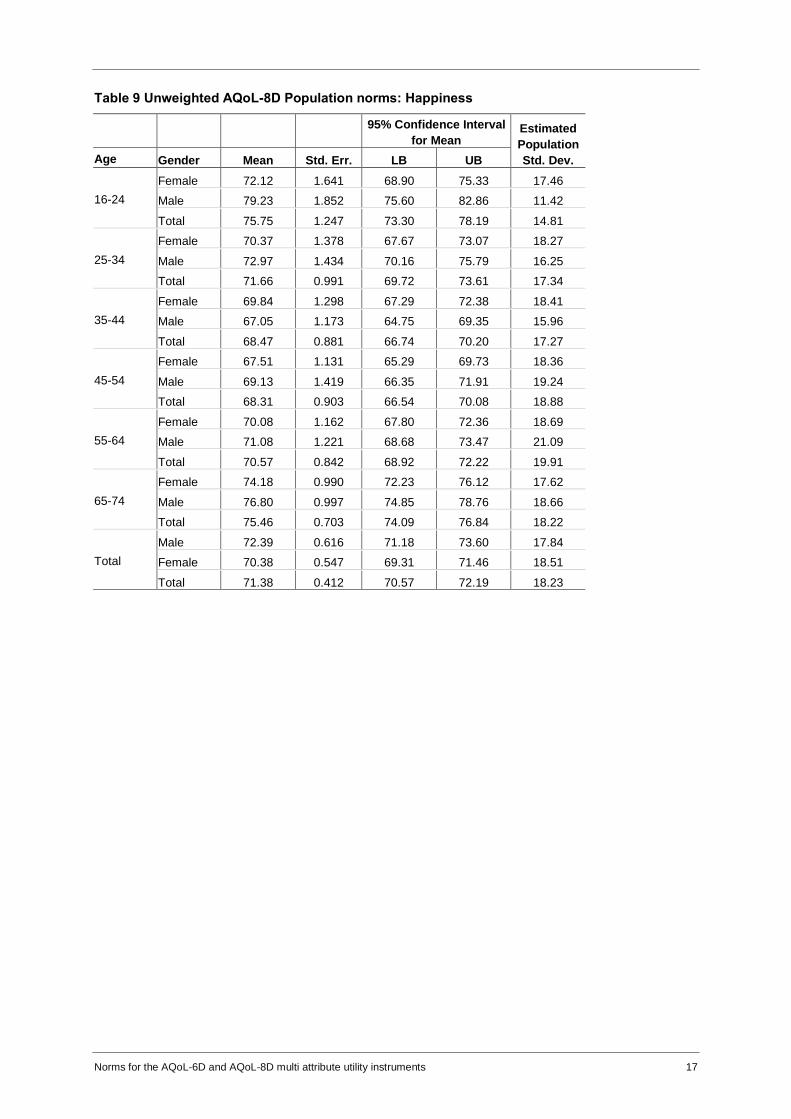
Table 9 Unweighted AQoL-8D Population norms: Happiness
95% Confidence Interval
for Mean Estimated
Population
Std. Dev. Age Gender Mean Std. Err. LB UB
16-24
Female 72.12 1.641 68.90 75.33 17.46
Male 79.23 1.852 75.60 82.86 11.42
Total 75.75 1.247 73.30 78.19 14.81
25-34
Female 70.37 1.378 67.67 73.07 18.27
Male 72.97 1.434 70.16 75.79 16.25
Total 71.66 0.991 69.72 73.61 17.34
35-44
Female 69.84 1.298 67.29 72.38 18.41
Male 67.05 1.173 64.75 69.35 15.96
Total 68.47 0.881 66.74 70.20 17.27
45-54
Female 67.51 1.131 65.29 69.73 18.36
Male 69.13 1.419 66.35 71.91 19.24
Total 68.31 0.903 66.54 70.08 18.88
55-64
Female 70.08 1.162 67.80 72.36 18.69
Male 71.08 1.221 68.68 73.47 21.09
Total 70.57 0.842 68.92 72.22 19.91
65-74
Female 74.18 0.990 72.23 76.12 17.62
Male 76.80 0.997 74.85 78.76 18.66
Total 75.46 0.703 74.09 76.84 18.22
Total
Male 72.39 0.616 71.18 73.60 17.84
Female 70.38 0.547 69.31 71.46 18.51
Total 71.38 0.412 70.57 72.19 18.23
Norms for the AQoL-6D and AQoL-8D multi attribute utility instruments 18
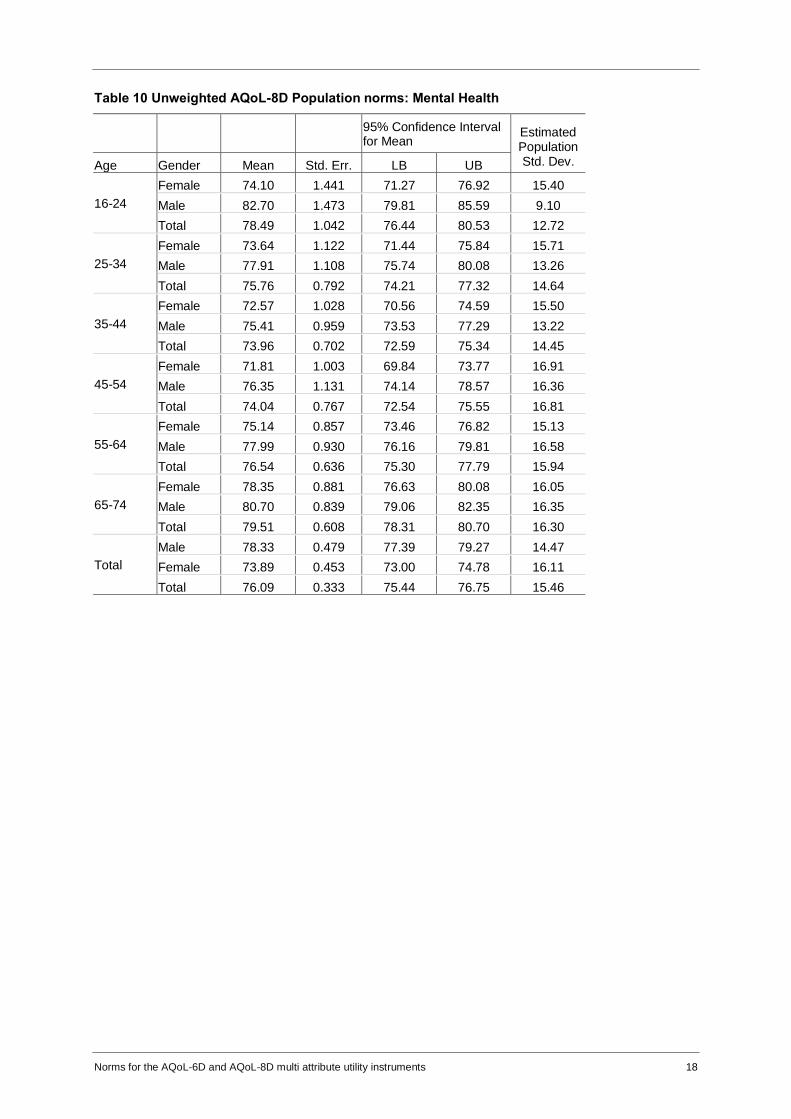
Table 10 Unweighted AQoL-8D Population norms: Mental Health
95% Confidence Interval for Mean
Estimated Population Std. Dev. Age Gender Mean Std. Err. LB UB
16-24
Female 74.10 1.441 71.27 76.92 15.40
Male 82.70 1.473 79.81 85.59 9.10
Total 78.49 1.042 76.44 80.53 12.72
25-34
Female 73.64 1.122 71.44 75.84 15.71
Male 77.91 1.108 75.74 80.08 13.26
Total 75.76 0.792 74.21 77.32 14.64
35-44
Female 72.57 1.028 70.56 74.59 15.50
Male 75.41 0.959 73.53 77.29 13.22
Total 73.96 0.702 72.59 75.34 14.45
45-54
Female 71.81 1.003 69.84 73.77 16.91
Male 76.35 1.131 74.14 78.57 16.36
Total 74.04 0.767 72.54 75.55 16.81
55-64
Female 75.14 0.857 73.46 76.82 15.13
Male 77.99 0.930 76.16 79.81 16.58
Total 76.54 0.636 75.30 77.79 15.94
65-74
Female 78.35 0.881 76.63 80.08 16.05
Male 80.70 0.839 79.06 82.35 16.35
Total 79.51 0.608 78.31 80.70 16.30
Total
Male 78.33 0.479 77.39 79.27 14.47
Female 73.89 0.453 73.00 74.78 16.11
Total 76.09 0.333 75.44 76.75 15.46
Norms for the AQoL-6D and AQoL-8D multi attribute utility instruments 19
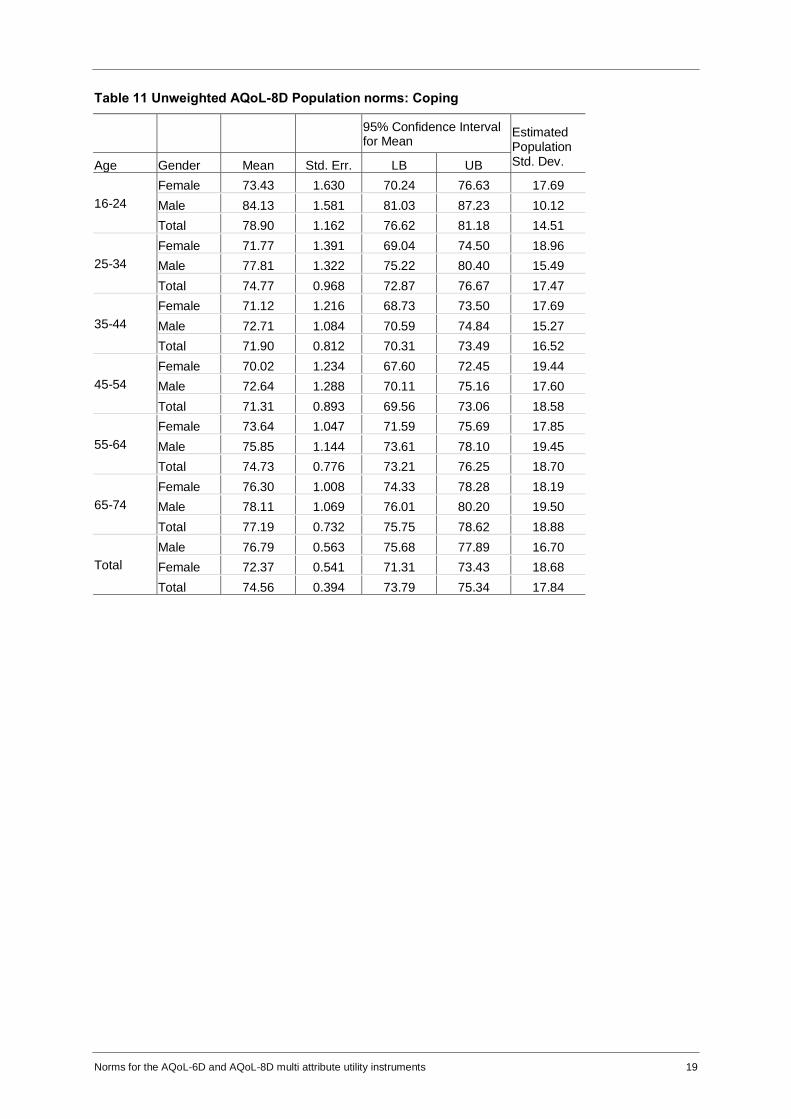
Table 11 Unweighted AQoL-8D Population norms: Coping
95% Confidence Interval for Mean
Estimated Population Std. Dev. Age Gender Mean Std. Err. LB UB
16-24
Female 73.43 1.630 70.24 76.63 17.69
Male 84.13 1.581 81.03 87.23 10.12
Total 78.90 1.162 76.62 81.18 14.51
25-34
Female 71.77 1.391 69.04 74.50 18.96
Male 77.81 1.322 75.22 80.40 15.49
Total 74.77 0.968 72.87 76.67 17.47
35-44
Female 71.12 1.216 68.73 73.50 17.69
Male 72.71 1.084 70.59 74.84 15.27
Total 71.90 0.812 70.31 73.49 16.52
45-54
Female 70.02 1.234 67.60 72.45 19.44
Male 72.64 1.288 70.11 75.16 17.60
Total 71.31 0.893 69.56 73.06 18.58
55-64
Female 73.64 1.047 71.59 75.69 17.85
Male 75.85 1.144 73.61 78.10 19.45
Total 74.73 0.776 73.21 76.25 18.70
65-74
Female 76.30 1.008 74.33 78.28 18.19
Male 78.11 1.069 76.01 80.20 19.50
Total 77.19 0.732 75.75 78.62 18.88
Total
Male 76.79 0.563 75.68 77.89 16.70
Female 72.37 0.541 71.31 73.43 18.68
Total 74.56 0.394 73.79 75.34 17.84

Norms for the AQoL-6D and AQoL-8D multi attribute utility instruments 20
Table 12 Unweighted AQoL-8D Population norms: Relationships
95% Confidence Interval
for Mean Estimated
Population
Std. Dev. Age Gender Mean Std. Err. LB UB
16-24
Female 83.66 1.045 81.61 85.71 12.11
Male 88.00 1.106 85.83 90.17 7.62
Total 85.88 0.767 84.37 87.38 10.05
25-34
Female 84.19 0.922 82.39 86.00 13.55
Male 84.64 0.996 82.69 86.60 12.41
Total 84.42 0.676 83.09 85.74 13.02
35-44
Female 82.15 0.881 80.42 83.88 14.46
Male 82.20 0.823 80.59 83.82 12.87
Total 82.18 0.602 81.00 83.36 13.68
45-54
Female 81.85 0.827 80.22 83.47 15.22
Male 81.68 1.105 79.51 83.84 16.78
Total 81.76 0.685 80.42 83.11 16.09
55-64
Female 83.47 0.840 81.83 85.12 15.33
Male 83.59 0.864 81.89 85.28 16.85
Total 83.53 0.601 82.35 84.71 16.09
65-74
Female 84.96 0.842 83.31 86.61 15.86
Male 86.73 0.776 85.21 88.25 15.59
Total 85.83 0.573 84.70 86.95 15.82
Total
Male 84.30 0.413 83.49 85.11 13.92
Female 83.23 0.373 82.50 83.96 14.43
Total 83.76 0.278 83.22 84.31 14.21
Norms for the AQoL-6D and AQoL-8D multi attribute utility instruments 21
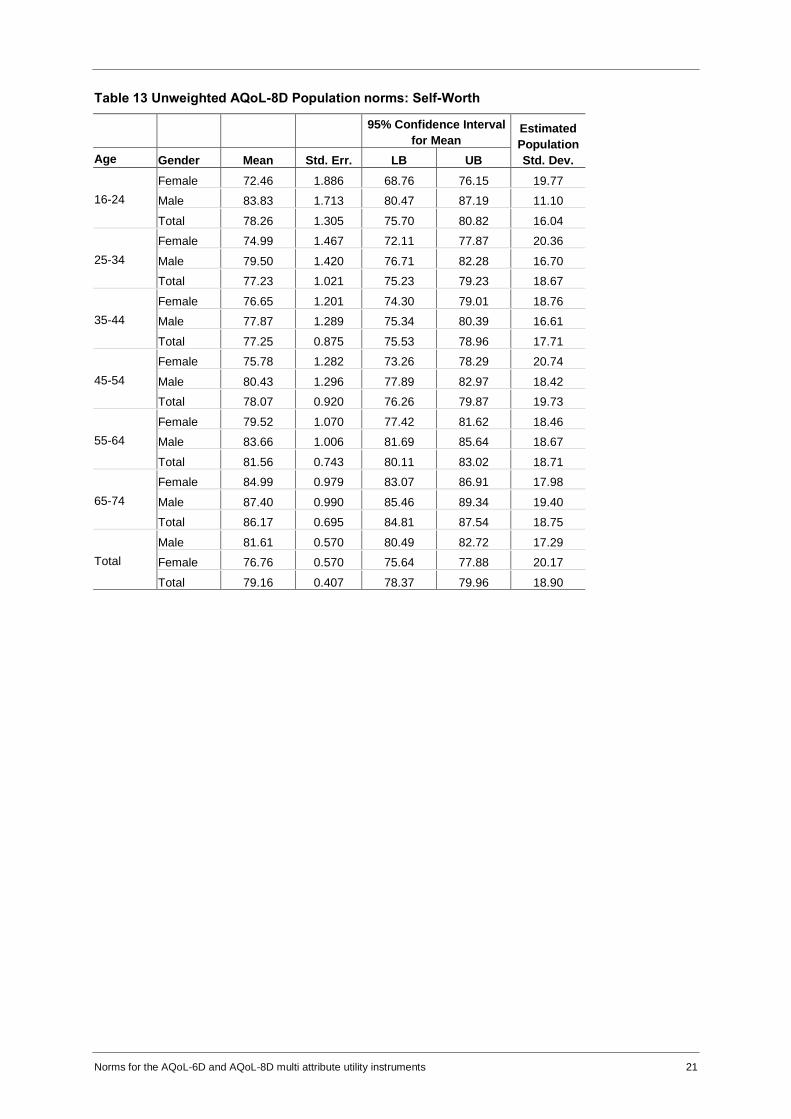
Table 13 Unweighted AQoL-8D Population norms: Self-Worth
95% Confidence Interval
for Mean Estimated
Population
Std. Dev. Age Gender Mean Std. Err. LB UB
16-24
Female 72.46 1.886 68.76 76.15 19.77
Male 83.83 1.713 80.47 87.19 11.10
Total 78.26 1.305 75.70 80.82 16.04
25-34
Female 74.99 1.467 72.11 77.87 20.36
Male 79.50 1.420 76.71 82.28 16.70
Total 77.23 1.021 75.23 79.23 18.67
35-44
Female 76.65 1.201 74.30 79.01 18.76
Male 77.87 1.289 75.34 80.39 16.61
Total 77.25 0.875 75.53 78.96 17.71
45-54
Female 75.78 1.282 73.26 78.29 20.74
Male 80.43 1.296 77.89 82.97 18.42
Total 78.07 0.920 76.26 79.87 19.73
55-64
Female 79.52 1.070 77.42 81.62 18.46
Male 83.66 1.006 81.69 85.64 18.67
Total 81.56 0.743 80.11 83.02 18.71
65-74
Female 84.99 0.979 83.07 86.91 17.98
Male 87.40 0.990 85.46 89.34 19.40
Total 86.17 0.695 84.81 87.54 18.75
Total
Male 81.61 0.570 80.49 82.72 17.29
Female 76.76 0.570 75.64 77.88 20.17
Total 79.16 0.407 78.37 79.96 18.90

Norms for the AQoL-6D and AQoL-8D multi attribute utility instruments 22
Table 14 Unweighted AQoL-8D Population norms: Pain
95% Confidence Interval
for Mean Estimated
Population
Std. Dev. Age Gender Mean Std. Err. LB UB
16-24
Female 90.62 1.060 88.54 92.70 12.79
Male 92.38 1.235 89.96 94.81 8.49
Total 91.52 0.813 89.92 93.11 10.75
25-34
Female 89.07 1.056 86.99 91.14 17.18
Male 89.71 1.070 87.61 91.81 13.52
Total 89.39 0.748 87.92 90.85 15.37
35-44
Female 85.07 1.274 82.57 87.56 19.94
Male 86.82 1.117 84.63 89.01 16.10
Total 85.93 0.846 84.27 87.58 18.10
45-54
Female 82.97 1.222 80.57 85.36 22.41
Male 82.49 1.376 79.79 85.18 21.13
Total 82.73 0.915 80.94 84.52 21.80
55-64
Female 79.71 1.407 76.95 82.47 24.49
Male 82.15 1.322 79.56 84.74 25.44
Total 80.91 0.965 79.02 82.81 24.99
65-74
Female 76.34 1.513 73.37 79.30 27.47
Male 79.93 1.355 77.28 82.59 26.38
Total 78.10 1.016 76.11 80.09 27.14
Total
Male 86.17 0.529 85.13 87.21 18.25
Female 84.64 0.531 83.60 85.68 20.82
Total 85.40 0.375 84.66 86.13 19.56

Norms for the AQoL-6D and AQoL-8D multi attribute utility instruments 23
Table 15 Unweighted AQoL-8D Population norms: Senses
95% Confidence Interval
for Mean Estimated
Population
Std. Dev. Age Gender Mean Std. Err. LB UB
16-24
Female 91.59 0.814 89.99 93.18 9.40
Male 93.42 0.826 91.80 95.04 5.46
Total 92.52 0.577 91.39 93.65 7.45
25-34
Female 91.46 0.720 90.05 92.87 9.32
Male 91.89 0.765 90.39 93.39 9.32
Total 91.67 0.523 90.65 92.70 9.39
35-44
Female 89.96 0.703 88.58 91.34 9.43
Male 90.06 0.710 88.67 91.45 9.61
Total 90.01 0.498 89.03 90.98 9.54
45-54
Female 85.12 0.688 83.77 86.47 10.41
Male 84.66 0.865 82.96 86.36 11.31
Total 84.89 0.549 83.82 85.97 10.92
55-64
Female 84.96 0.588 83.80 86.11 9.84
Male 83.89 0.712 82.49 85.29 11.95
Total 84.43 0.459 83.53 85.33 10.94
65-74
Female 84.20 0.665 82.90 85.51 11.23
Male 82.90 0.741 81.45 84.35 13.67
Total 83.56 0.498 82.59 84.54 12.46
Total
Male 88.35 0.359 87.64 89.05 10.74
Female 88.24 0.317 87.62 88.86 10.42
Total 88.29 0.239 87.82 88.76 10.62
Norms for the AQoL-6D and AQoL-8D multi attribute utility instruments 24
Table 16 Unweighted AQoL-8D Population norms: Mental Super Dimension (MSD)
95% Confidence Interval
for Mean Estimated
Population
Std. Dev. Age Gender Mean Std. Err. LB UB
16-24
Female 76.09 1.314 73.51 78.66 14.34
Male 83.88 1.301 81.33 86.43 8.47
Total 80.07 0.940 78.22 81.91 11.81
25-34
Female 75.90 1.071 73.80 78.01 15.25
Male 79.12 1.057 77.04 81.19 12.88
Total 77.50 0.753 76.02 78.98 14.16
35-44
Female 75.04 0.951 73.17 76.90 14.96
Male 75.88 0.873 74.16 77.59 12.83
Total 75.45 0.644 74.19 76.71 13.92
45-54
Female 74.09 0.910 72.31 75.88 15.87
Male 76.68 1.076 74.57 78.79 15.90
Total 75.37 0.707 73.98 76.75 15.97
55-64
Female 76.93 0.820 75.32 78.53 14.81
Male 78.82 0.857 77.14 80.50 16.00
Total 77.86 0.596 76.69 79.03 15.44
65-74
Female 80.02 0.792 78.46 81.57 14.91
Male 82.20 0.773 80.68 83.72 15.36
Total 81.09 0.554 80.00 82.17 15.22
Total
Male 79.20 0.445 78.33 80.07 13.99
Female 76.01 0.419 75.19 76.84 15.34
Total 77.59 0.308 76.99 78.20 14.76
Norms for the AQoL-6D and AQoL-8D multi attribute utility instruments 25
Table 17 Unweighted AQoL-8D Population norms: Physical Super Dimension (PSD)
95% Confidence Interval
for Mean Estimated
Population
Std. Dev. Age Gender Mean Std. Err. LB UB
16-24
Female 92.87 0.571 91.75 93.99 7.11
Male 94.22 0.650 92.95 95.50 4.98
Total 93.56 0.433 92.71 94.41 6.15
25-34
Female 92.39 0.542 91.33 93.45 9.56
Male 92.43 0.578 91.30 93.57 8.16
Total 92.41 0.394 91.64 93.18 8.87
35-44
Female 90.11 0.609 88.91 91.30 10.24
Male 90.61 0.619 89.39 91.82 9.75
Total 90.35 0.433 89.50 91.20 10.01
45-54
Female 87.66 0.651 86.38 88.93 12.25
Male 87.08 0.793 85.52 88.63 12.56
Total 87.37 0.510 86.37 88.37 12.44
55-64
Female 85.64 0.698 84.27 87.01 13.81
Male 86.08 0.709 84.69 87.48 14.45
Total 85.86 0.496 84.89 86.83 14.13
65-74
Female 83.81 0.826 82.19 85.43 15.92
Male 84.69 0.739 83.24 86.14 15.66
Total 84.24 0.553 83.16 85.33 15.85
Total
Male 82.24 0.373 81.51 82.98 12.17
Female 79.85 0.347 79.17 80.53 13.11
Total 89.43 0.208 89.03 89.84 11.31

Norms for the AQoL-6D and AQoL-8D multi attribute utility instruments 26
Box 1 AQoL instruments
AQoL-4D Originally called ‘AQoL’. Initially a 5 dimension 15 item instrument. Dimensions were
illness, independent living, social relationships, physical senses, psychological wellbeing. Illness
was subsequently deleted from the utility algorithm. Utilities were created from a multi level model
using multiplicative models to combine items into dimensions and an overall multiplicative model
to combine dimension scores into a single AQoL utility score [24].
AQoL 8: An 8 item ‘Brief’ instrument observed by removing one item from each AQoL-4D
dimension [20].
AQoL-6D: A 6 dimensional 20 item instrument. Pain and coping were added to AQoL-4D as
separate dimensions. Mental health and Independent Living items were increased from 3 to 4
items. Utility weights were constructed as for AQoL-4D but with an econometric adjustment to the
final algorithm [18].
AQoL-7D: A 7 dimension 26 item instrument which adds an explicit dimension for vision (VisQoL)
to the AQoL-6D [25]. Scaling was carried out as for AQoL-6D [26].
AQoL-8D: An 8 dimensional 35 item instrument which adds explicit dimensions for self worth and
happiness and expands the items in mental health. Utility weights were constructed as for AQoL-
6D but with an econometric correction to each dimension before their combination to create
AQoL-8D [27, 28].
Box 2 GMS Linear regression equations(1)
n=8,022
AQoL-4D = -0.27 + 1.23 AQoL-6D R2 = 0.69
AQoL-4D = 0.16 + 1.18 AQoL-8D R2 = 0.72
AQoL-6D = 0.07 + 0.95 AQoL-8D R2 = 0.95
(1) GMS (Geometric Mean Squares) regressions give results which
are not affected by the choice of dependent and independent
variable. Therefore the first result above could be re-written as AQoL-
6D = [0.27 + AQoL-4D]/1.23
Norms for the AQoL-6D and AQoL-8D multi attribute utility instruments 27
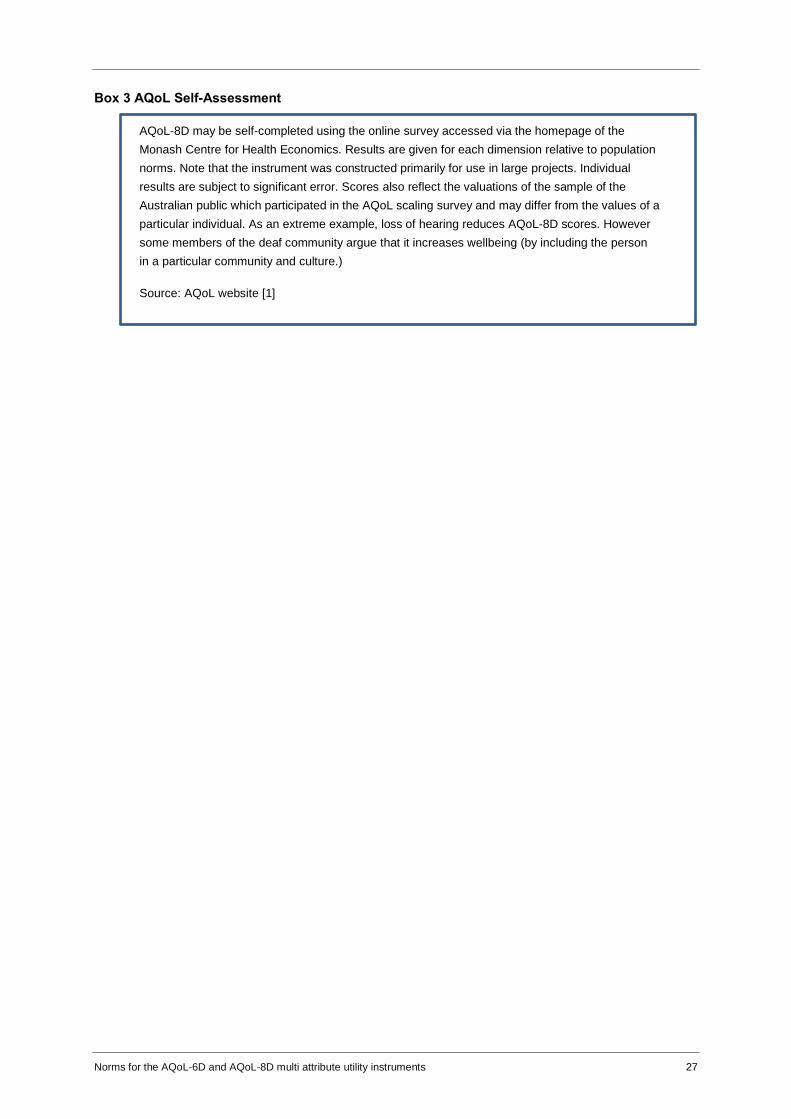
Box 3 AQoL Self-Assessment
AQoL-8D may be self-completed using the online survey accessed via the homepage of the
Monash Centre for Health Economics. Results are given for each dimension relative to population
norms. Note that the instrument was constructed primarily for use in large projects. Individual
results are subject to significant error. Scores also reflect the valuations of the sample of the
Australian public which participated in the AQoL scaling survey and may differ from the values of a
particular individual. As an extreme example, loss of hearing reduces AQoL-8D scores. However
some members of the deaf community argue that it increases wellbeing (by including the person
in a particular community and culture.)
Source: AQoL website [1]

Norms for the AQoL-6D and AQoL-8D multi attribute utility instruments 28
Figure 1 AQoL-8D and AQoL-6D instruments*
AQoL-8D
AQoL-6D
AQoL-7D
Physical
Psycho-social (mental)
Super dimensions
Dimensions Items
Independent Living
Pain
Senses
Mental Health
Happiness
Coping
Relationships
Self worth
Vision Related
Household tasksGetting aroundMobilitySelf care
Frequency of painDegree of painPain interference
VisionHearingCommunication
DepressionSleep AngerSelf-harm
DespairWorrySadnessCalm
ContentmentEnthusiasmHappinessPleasure
Energy levelControlCoping
Enjoy close relsClose rels familySocial isolationSocial exclusion
IntimacyFamily roleCommunity role
Feeling a burdenFeeling worthlessconfidence
VisQoL vision related
InjuryCopingFriendshipAssistance RoleActivities
*AQoL-6D is shown in (yellow) shaded items and dimensions. It does not map into psychometrically valid ‘super dimensions’ shown for AQoL-8D.
AQoL-4D

Norms for the AQoL-6D and AQoL-8D multi attribute utility instruments 29
References
[1] Richardson J, AQoL Team. http://www.aqol.com.au/index.php/aqoluserinfo. 2016 [cited 2016 20 November]
[2] Hawthorne G, Korn S, Richardson J. Population norms for the AQoL derived from the 2007 Australian National Survey of Mental Health and Wellbeing. Australian and New Zealand Journal of Public Health. 2013; 37(1):17-23. DOI: 10.111/1753-6405.12004.
[3] ABS. Australian Demographic Statistics, Population by Age and Sex, Cat 3201.0. Canberra: Australian Bureau of Statistics http://www.abs.gov.au/AUSSTATS/[email protected]/DetailsPage/3201.0Jun%202010?OpenDocument [accessed 12 August 2013] 2013.
[4] Dawes R. The robust beauty of improper linear models in decision making. American Psychologist. 1979; 34(7):571-82.
[5] Wu C. Examining the appropriateness of importance weighting in satisfaction score from range-of-affect hypothesis: hierarchical linear modeling for within-subject data. Social Indicators Research. 2008; 86:101-11.
[6] Trauer T, Mackinnon A. Why are we weighting? The role of importance ratings in a quality of life measurement. Quality of Life Research. 2001; 10:579-85.
[7] Locke E. What is job satisfaction? Organizational Behavior and Human Performance. 1969; 4:309-36.
[8] Locke E. The nature and causes of job satisfaction. In: Dunnett MD, ed. Handbook of Industrial and Organizational Psychology. Chicago: Rand McNally 1976.
[9] Dana J, Dawes R. The superiority of simple alternatives to regression for social science predictions. Journal of Educational and Behavioral Statistics. 2004; 29(3):317-31.
[10] Wu C, Yao G. Importance has been considered in satisfaction evaluation: an experimental examination of Locke's Range-of-Affect Hypothesis. Social Indicators Research. 2006; 81:521-41.
[11] Wu C, Yao G. Do we need weight item satisfaction by item importance? A perspective from Lock's Range-of-Affect hypothesis. Social Indicators Research. 2006; 79:485-502.
[12] Wu C, Chen LH, Tsai Y. Investigating importance weighting of satisfaction scores from a formative model with partial least squares analysis. Social Indicators Research. 2009; 90:351-63.
[13] Guion RM. Personnel Testing. New York: McGraw-Hill 1965.
[14] Gigerenzer G, Todd PM. Simple Heuristics that Make us Smart. London: Oxford University Press 1999.
[15] Kahneman D. Thinking Fast and Slow. New York: Farrar Straus & Giroux 2011.
[16] Richardson J, Khan MA, Iezzi A, Maxwell A. Cross-national comparison of twelve quality of life instruments: MIC Paper 1: Background, questions, instruments, Research Paper 76. Melbourne: Centre for Health Economics, Monash University

Norms for the AQoL-6D and AQoL-8D multi attribute utility instruments 30
http://www.buseco.monash.edu.au/centres/che/pubs/researchpaper76.pdf [accessed 29 July 2013] 2012.
[17] Richardson J, Iezzi A, Khan MA. Why do multi attribute utility instruments produce different utilities: The relative importance of the descriptive systems, scale and ‘micro utility’ effects. Quality of Life Research. 2015; 24(8):2045-53 DOI 10.1007/s11136-015-0926-6.
[18] Richardson J, Day NA, Peacock S, Iezzi A. Measurement of the quality of life for economic evaluation and the Assessment of Quality of Life (AQoL) Mark 2 Instrument. Australian Economic Review. 2004; 37(1):62-88. DOI:10.1111/j.467-8462.2004.00308.x.
[19] Richardson J, Sinha K, Iezzi A, Khan MA. Modelling utility weights for the Assessment of Quality of Life (AQoL) 8D. Quality of Life Research. 2014; 23(8):2395-404. 10.1007/s11136-014-0686-8.
[20] Hawthorne G. Assessing utility where short measures are required: Development of the Short Assessment of Quality of Life-8 (AQoL-8) instrument. Value in Health. 2009; 12(6):948-57.
[21] Iezzi A, Richardson J. A comparison of AQoL-4D, AQoL-6D, AQoL-7D and AQoL-8D multi attribute utility instruments, Research Paper 93. Melbourne: Centre for Health Economics, Monash University 2016.
[22] AQoL. Assessment of Quality of Life (AQoL). 2016 [cited 2016 28 May]
[23] Chen G, Khan MA, Iezzi A, Ratcliffe J, Richardson J. Mapping between 6 multi attribute utility instruments Medical Decsion Making. 2016; 36(2):160-75.
[24] Hawthorne G, Richardson J, Osborne R. The Assessment of Quality of Life (AQoL) instrument: A psychometric measure of health related quality of life. Quality of Life Research. 1999; 8(3):209-24. DOI: 10.1023/A:1008815005736.
[25] Richardson J, Iezzi A, Peacock S, Sinha K, Misajon R, Keeffe J. Utility weights for the Vision Related Assessment of Quality of Life (AQoL) 7D instrument. Ophthalmic Epidemiology. 2012; 19(3):172-82.
[26] Richardson J, Iezzi A, Peacock S, Sinha K, Misajon R, Keeffe J. Utility weights for the Vision Related Assessment of Quality of Life (AQoL) 7D instrument, Research Paper 67. Melbourne: Centre for Health Economics 2011.
[27] Richardson J, Elsworth G, Iezzi A, Khan MA, Mihalopoulos C, Schweitzer I, et al. Increasing the Sensitivity of the AQoL Inventory for Evaluation of Interventions Affecting Mental Health, Research Paper 61. Melbourne: Centre for Health Economics, Monash University 2011.
[28] Richardson J, Sinha K, Iezzi A, Khan M. Modelling the Utility of Health States with the Assessment of Quality of Life (AQoL) 8D Instrument: Overview and Utility Scoring Algorithm, Research Paper 63. Melbourne: Centre for Health Economics, Monash University 2011.
[29] Meade AW, Craig BS. Identifying careless responses in survey data. Psychological Methods. 2012; 17(3):437-55.
[30] Trewin D. Australian Standard Classification of Education (ASCED). Canberra: Australian Bureau of Statistics 2001.
Norms for the AQoL-6D and AQoL-8D multi attribute utility instruments 31
Appendix 1 Editing
Screening responses for quality data from online surveys is best done using a mixture of methods
[29]. The first exclusion criterion was that the answers provided to any of the three questions
differed by more than one level on the four response level scale. This criterion was used as
consistency of response to duplicate questions is an accepted indicator of respondent veracity. A
one level difference in responses was deemed to be acceptable as the questions asked in
between duplicates may have altered a person’s perception (a ‘priming’ effect).
People whose utility scores differed by more than 0.5 on the two instruments were also excluded.
Both instruments were calibrated using the time trade off (TTO) method. A reduction in the TTO
of 0.5 is therefore equivalent to a preference to sacrifice 50 percent of life. If a person varies the
evaluation of themselves by this amount the probable explanation is the unreliability of the
response, not the difference in the instruments which correlate highly (see Appendix 4).
Respondents claiming an educational attainment of ‘part primary school’ were also excluded. This
response category was included as an addendum to the ASCED levels used by the Australian
Bureau of Statistics [30]. Putting an illegitimate response category in a survey is an accepted
technique for identifying poor quality data [29].
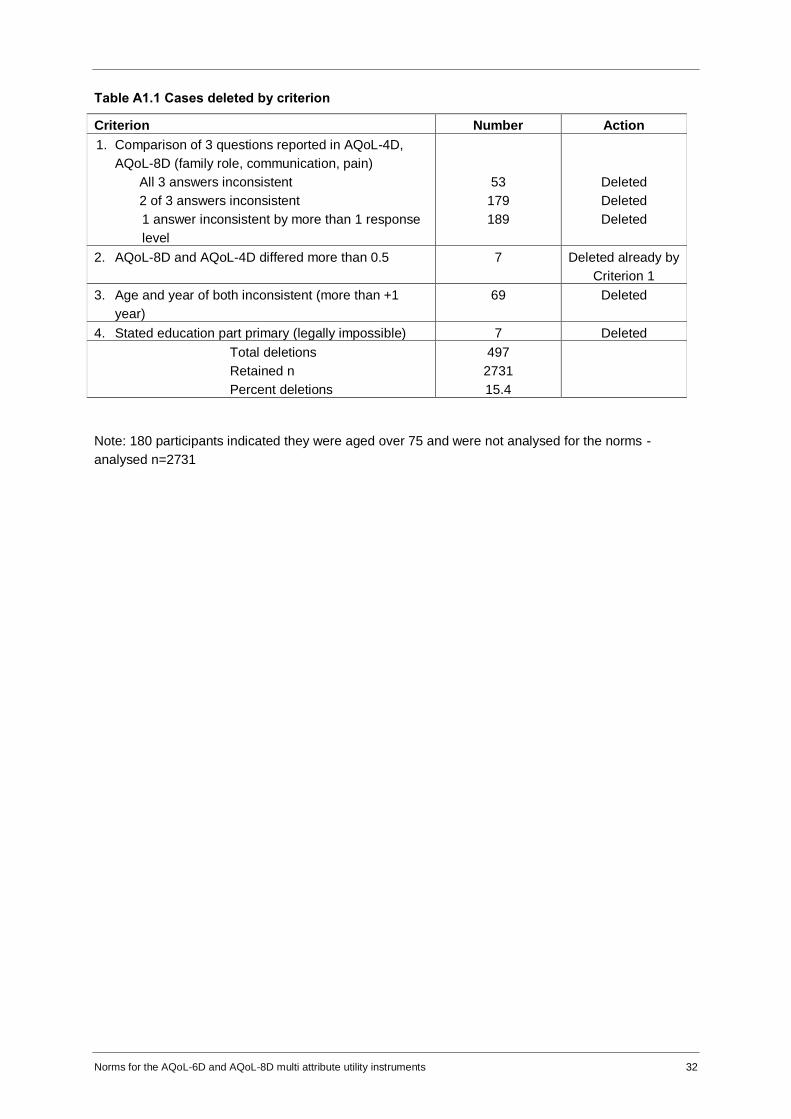
Table A1.1 reports the number of cases deleted by criterion. Table A1.2 reports the total number
of respondents by demographic and AQoL-4D cell and the distribution of the deletions, which are
shown in brackets.
Norms for the AQoL-6D and AQoL-8D multi attribute utility instruments 32
Table A1.1 Cases deleted by criterion
Criterion Number Action
1. Comparison of 3 questions reported in AQoL-4D,
AQoL-8D (family role, communication, pain)
All 3 answers inconsistent
2 of 3 answers inconsistent
1 answer inconsistent by more than 1 response
level
53
179
189
Deleted
Deleted
Deleted
2. AQoL-8D and AQoL-4D differed more than 0.5 7 Deleted already by
Criterion 1
3. Age and year of both inconsistent (more than +1
year)
69 Deleted
4. Stated education part primary (legally impossible) 7 Deleted
Total deletions
Retained n
Percent deletions
497
2731
15.4
Note: 180 participants indicated they were aged over 75 and were not analysed for the norms -
analysed n=2731

Norms for the AQoL-6D and AQoL-8D multi attribute utility instruments 33
Table A1.2 Cell count by retained and deleted responses
Aqol4D score Range
-0.04 thru
<0.2
0.2 thru
<0.4
0.4 thru
< 0.6
0.6 thru
<0.8
0.8 thru
<1 1
Male
<18 1 (1) 2 (3) 4 3 (1) 2 4 (2)
18-24 6 (16) 6 (6) 11 (7) 15 (12) 31 (6) 20 (6)
25-34 10 (17) 32 (19) 22 (17) 41 (9) 45 (6) 45 (5)
35-44 24 (7) 37 (8) 27 (9) 41 (9) 48 (3) 45 (5)
45-54 35 (15) 27 (10) 41 (9) 43 (7) 48 (2) 35 (2)
55-64 42 (8) 46 (4) 41 (9) 45 (5) 50 47 (3)
65-74 19 (17) 35 (9) 40 (10) 45 (5) 48 (2) 49
Female
<18 3 4 (1) 1 17 11 1
18-24 16 (5) 15 (3) 36 (8) 43 (7) 46 (6) 15 (3)
25-34 33 (15) 37 (13) 42 (9) 50 46 (4) 42 (8)
35-44 29 (10) 46 (4) 44 (6) 46 (4) 47 (3) 48 (2)
45-54 40 (9) 45 (5) 40 (10) 47 (3) 49 (1) 48 (2)
55-64 41 (9) 46 (5) 47 (4) 46 (3) 48 45 (1)
65-74 12 (4) 33 (2) 46 (4) 47 (3) 50 25 (1)
Note: numbers in brackets are deleted cases
Norms for the AQoL-6D and AQoL-8D multi attribute utility instruments 34
Appendix 2 Relationship between AQoL-4D, 6D and 8D
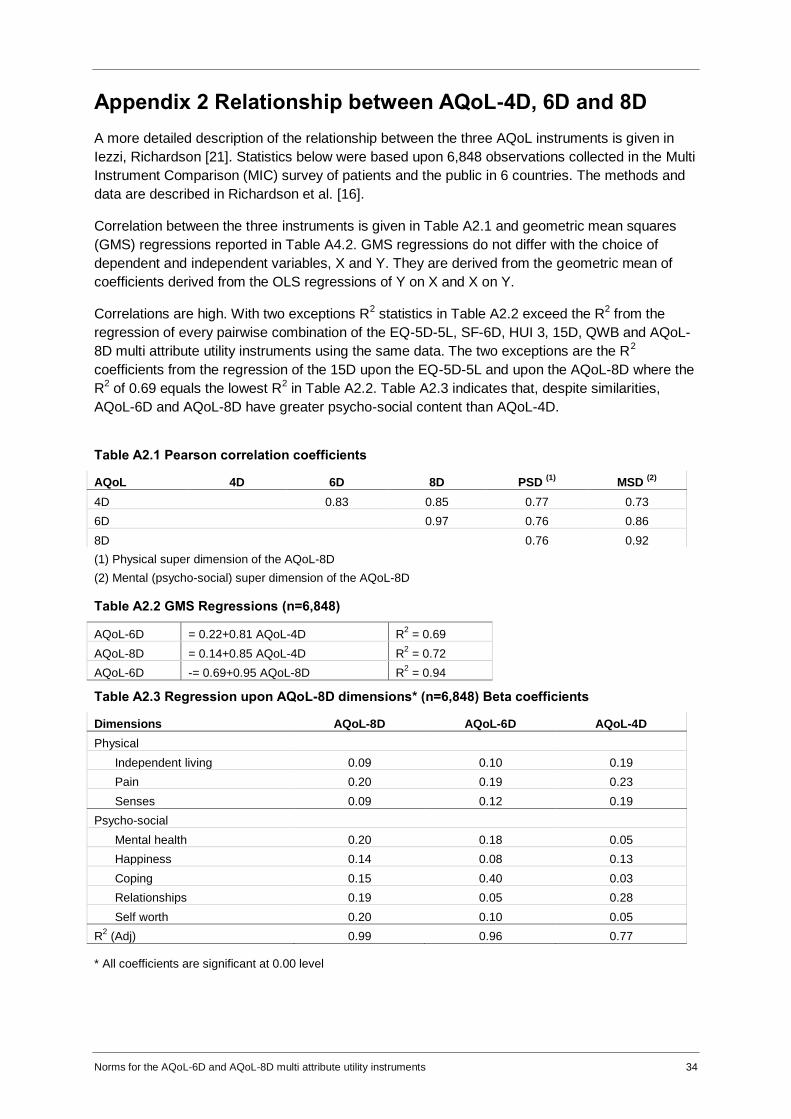
A more detailed description of the relationship between the three AQoL instruments is given in
Iezzi, Richardson [21]. Statistics below were based upon 6,848 observations collected in the Multi
Instrument Comparison (MIC) survey of patients and the public in 6 countries. The methods and
data are described in Richardson et al. [16].
Correlation between the three instruments is given in Table A2.1 and geometric mean squares
(GMS) regressions reported in Table A4.2. GMS regressions do not differ with the choice of
dependent and independent variables, X and Y. They are derived from the geometric mean of
coefficients derived from the OLS regressions of Y on X and X on Y.
Correlations are high. With two exceptions R2 statistics in Table A2.2 exceed the R
2 from the
regression of every pairwise combination of the EQ-5D-5L, SF-6D, HUI 3, 15D, QWB and AQoL-
8D multi attribute utility instruments using the same data. The two exceptions are the R2
coefficients from the regression of the 15D upon the EQ-5D-5L and upon the AQoL-8D where the
R2 of 0.69 equals the lowest R
2 in Table A2.2. Table A2.3 indicates that, despite similarities,
AQoL-6D and AQoL-8D have greater psycho-social content than AQoL-4D.
Table A2.1 Pearson correlation coefficients
AQoL 4D 6D 8D PSD (1)
MSD (2)
4D 0.83 0.85 0.77 0.73
6D 0.97 0.76 0.86
8D 0.76 0.92
(1) Physical super dimension of the AQoL-8D
(2) Mental (psycho-social) super dimension of the AQoL-8D
Table A2.2 GMS Regressions (n=6,848)
AQoL-6D = 0.22+0.81 AQoL-4D R2 = 0.69
AQoL-8D = 0.14+0.85 AQoL-4D R2 = 0.72
AQoL-6D -= 0.69+0.95 AQoL-8D R2 = 0.94
Table A2.3 Regression upon AQoL-8D dimensions* (n=6,848) Beta coefficients
Dimensions AQoL-8D AQoL-6D AQoL-4D
Physical
Independent living 0.09 0.10 0.19
Pain 0.20 0.19 0.23
Senses 0.09 0.12 0.19
Psycho-social
Mental health 0.20 0.18 0.05
Happiness 0.14 0.08 0.13
Coping 0.15 0.40 0.03
Relationships 0.19 0.05 0.28
Self worth 0.20 0.10 0.05
R2 (Adj) 0.99 0.96 0.77
* All coefficients are significant at 0.00 level

Norms for the AQoL-6D and AQoL-8D multi attribute utility instruments 35
Appendix 3 Bar charts for dimension norms
Figure A3 1(a) Psycho-social Super Dimension
Figure A3 1(b) Mental Health
0.4
0.45
0.5
0.55
0.6
0.65
16-24 25-34 35-44 45-54 55-64 65-74 Total
Male Female
0.55
0.6
0.65
0.7
0.75
0.8
16-24 25-34 35-44 45-54 55-64 65-74 Total
Male Female

Norms for the AQoL-6D and AQoL-8D multi attribute utility instruments 36
Figure A3 1(c) Happiness
Figure A3 1(d) Self Worth
Figure A3 1(e) Coping
0.75
0.8
0.85
0.9
0.95
16-24 25-34 35-44 45-54 55-64 65-74 Total
Male Female
0.75
0.8
0.85
0.9
0.95
16-24 25-34 35-44 45-54 55-64 65-74 Total
Male Female
0.75
0.79
0.83
0.87
16-24 25-34 35-44 45-54 55-64 65-74 Total
Male Female

Norms for the AQoL-6D and AQoL-8D multi attribute utility instruments 37
Norms for the AQoL-6D and AQoL-8D multi attribute utility instruments 38
Figure A3 1(f) Relationships
Figure A3 1(g) Physical Super Dimension
Figure A3 1(h) Independent Living
0.75
0.8
0.85
0.9
0.95
16-24 25-34 35-44 45-54 55-64 65-74 Total
Figure A3 1(g) Physical Super Dimension
Male Female
0.85
0.9
0.95
1
16-24 25-34 35-44 45-54 55-64 65-74 Total
Male Female
0.65
0.7
0.75
0.8
0.85
0.9
16-24 25-34 35-44 45-54 55-64 65-74 Total
Figure A3. 1(f) Relationships
Male Female

Norms for the AQoL-6D and AQoL-8D multi attribute utility instruments 39

Norms for the AQoL-6D and AQoL-8D multi attribute utility instruments 40
Figure A3 1(i) Pain
Figure A3 1(j) Senses
0.8
0.85
0.9
0.95
1
16-24 25-34 35-44 45-54 55-64 65-74 Total
Male Female
0.75
0.8
0.85
0.9
0.95
16-24 25-34 35-44 45-54 55-64 65-74 Total
Male Female