New 1 2 59 22 · 2016. 1. 15. · 1 2 59 22 . Created Date: 1/15/2016 3:25:41 PM

0
Nordic Region
P7S1 Group Capital Markets Day
Munich, October 5, 2011

1
P7S1 Nordics is a leading pan-Nordic TV and radio operator
Source: P7S1 Nordics
Radio
14
FTA
75Revenues
rec. EBITDA
Region
104
398
EUR millions, 2010
1 Adjusted external financials
DENMARK SWEDEN FINLANDNORWAY
FINLANDNORWAY
SWEDENDENMARK
rec. EBITDA- margin
90
323
28% 18% 26%
2
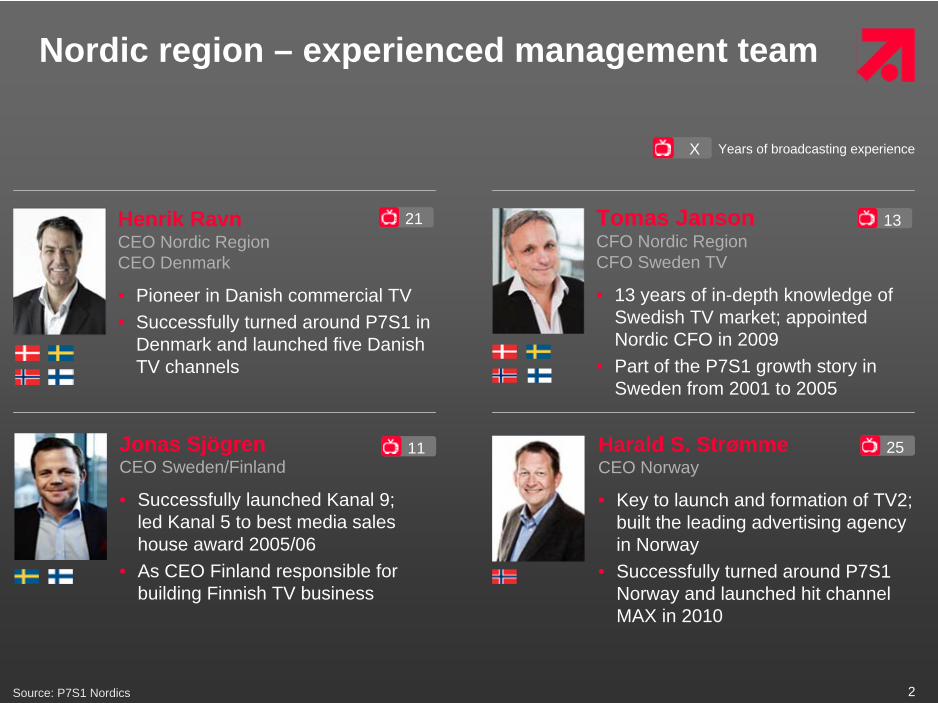
Nordic region – experienced management team
Tomas JansonCFO Nordic RegionCFO Sweden TV
• 13 years of in-depth knowledge of Swedish TV market; appointed Nordic CFO in 2009
• Part of the P7S1 growth story in Sweden from 2001 to 2005
1321Henrik RavnCEO Nordic RegionCEO Denmark
• Pioneer in Danish commercial TV• Successfully turned around P7S1 in
Denmark and launched five Danish TV channels
Jonas SjögrenCEO Sweden/Finland
• Successfully launched Kanal 9; led Kanal 5 to best media sales house award 2005/06
• As CEO Finland responsible for building Finnish TV business
11 Harald S. StrømmeCEO Norway
• Key to launch and formation of TV2; built the leading advertising agency in Norway
• Successfully turned around P7S1 Norway and launched hit channel MAX in 2010
25
Source: P7S1 Nordics
Years of broadcasting experienceX

3
The Nordic Region investment highlights
24The partner of choice in a highly
competitive distribution landscape 3
The challenger with superior growth and profitability1Highly attractive
growth markets
Clear path towards additional value creation
Source: P7S1 Nordics
4
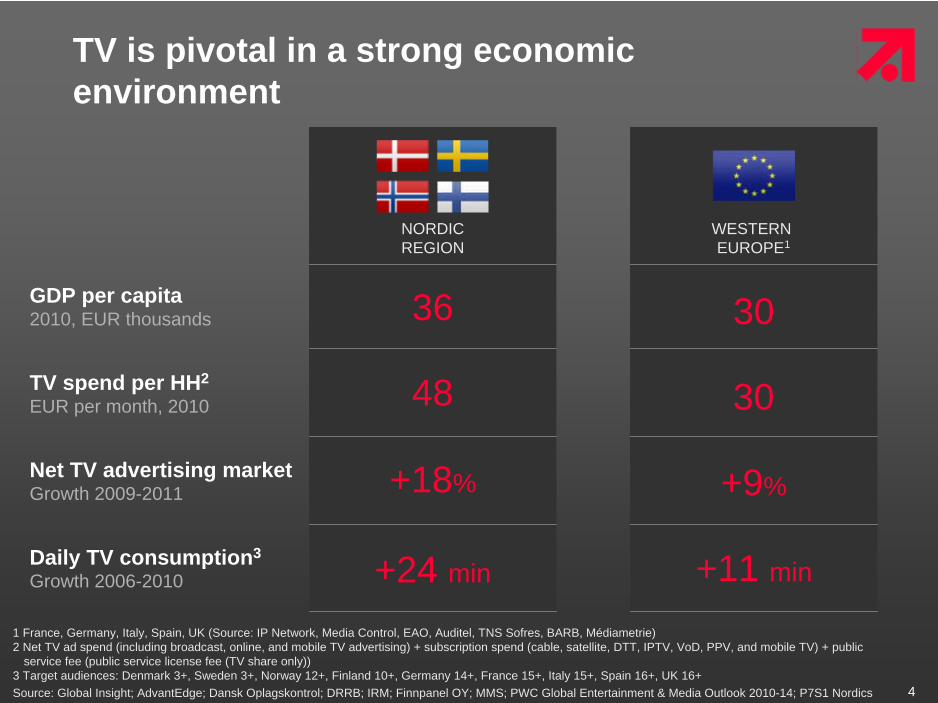
TV is pivotal in a strong economic environment
+9%+18%
+11 min+24 min
3048
3036GDP per capita 2010, EUR thousands
Net TV advertising market Growth 2009-2011
TV spend per HH2
EUR per month, 2010
Daily TV consumption3
Growth 2006-2010
WESTERN EUROPE1
NORDIC REGION
Source: Global Insight; AdvantEdge; Dansk Oplagskontrol; DRRB; IRM; Finnpanel OY; MMS; PWC Global Entertainment & Media Outlook 2010-14; P7S1 Nordics
1 France, Germany, Italy, Spain, UK (Source: IP Network, Media Control, EAO, Auditel, TNS Sofres, BARB, Médiametrie)2 Net TV ad spend (including broadcast, online, and mobile TV advertising) + subscription spend (cable, satellite, DTT, IPTV, VoD, PPV, and mobile TV) + public
service fee (public service license fee (TV share only))3 Target audiences: Denmark 3+, Sweden 3+, Norway 12+, Finland 10+, Germany 14+, France 15+, Italy 15+, Spain 16+, UK 16+

5
3
4
3
2
5
3
3
2
Advertising is shifting from print to broadcasting
Source: AdvantEdge; Dansk Oplagskontrol; DRRB; IRM; Finnpanel OY; P7S1 Nordics
Share of media in net advertising market Percent
Print TV
20112008
17
24
17
22
24
19
23
1851
47
61
52
49
57
42
42
Radio
FINLAND
NORWAY
SWEDEN
DENMARK

6
Strong growth in all Nordic TV markets Expectations Nordic TV ad markets 2011
2010 YTD Rest of 2011 2011 ESweden (MSEK) 5.198 2.430 3.417 5.847Index 118 116 110 113Denmark (MDKK) 2.256 1.317 1.330 2.707Index 110 122 118 120Norway (MNOK) 3.061 2.036 1.369 3.405Index 110 114 107 111Finland (M€) 266 149 144 293Index 112 114 106 110Source: MediAid (Group M). YTD: DK & Nor: Jan‐July, Fin: Jan‐Jun, Swe: Jan‐May

7
Strong growth in all Nordic radio markets Expectations Nordic radio ad markets 2011
2010 YTD Rest of 2011 2011 ESweden (MSEK) 688 308 450 758Index 110 117 106 110Denmark (MDKK) 232 197 116 313Index 107 149 117 135Norway (MNOK) 563 368 232 600Index 112 109 105 107Finland (M€) 52 30 32 62Index 104 117 122 120Source: MediAid (Group M). YTD: DK & Nor: Jan‐July, Fin: Jan‐Jun, Swe: Jan‐May

8
Synergies – Strong pan-Nordic radio portfolio complements TV challenger position
1 Based on advertising shares 2010
Position in radio market1
Source: P7S1 Nordics
DENMARK SWEDEN FINLANDNORWAY

9
Audience – Strong growth trajectory
Source: Advantedge; Finnpanel OY; MMS/AGB Nielsen; P7S1 Nordics
FINLAND
NORWAY
SWEDEN
DENMARK
1 Full day, commercial shares; Denmark: 15-50 years, Sweden and Finland: 15-59 years, Norway: 12-44 years
P7S1 audience share1
30.0%22.5%
6.5%2.3%
21.0%21.7%
17.0%14.3%
2008 2011E

10
Monetization – P7S1 Nordics is turning audience shares into advertising revenues
Source: Advantedge; Finnpanel OY; MMS/AGB Nielsen; P7S1 Nordics
FINLAND
NORWAY
SWEDEN
DENMARK
P7S1 Nordics net TV advertising market share
19.1%
N/A
17.7%
10.8%
24.3%
2.6%
16.5%
15.3%
2008 2011E

11
Carriage revenues – Partner of choice in highly competitive distribution landscape
Source: P7S1 Nordics
~20% p.a.
Cable
DTT
Satellite (DTH)
IPTV & others
Increase in P7S1 carriage revenues 2008 – 2011E
P7S1 distribution partners SWEDENDENMARK NORWAY

12Source: Advantedge; Finnpanel OY; MMS/AGB Nielsen; P7S1 Nordics
1 Full day, commercial shares; Denmark: 15-50 years, Sweden: 15-59 years, Norway: 12-44 years, Finland: 15-59 years 2 Share for Q3 20113 Combined audience share with The Voice TV
Jan 2009Launch date
Target audience
2.94.0
6.236.1
5.12
Feb 2007 Sep 2008Nov 2010 Sep 2007
Distribution – 5 successful channel launches in 4 years
Audience share1
2010, percent
15-50 30-59 15-4412-4412-44
DENMARK SWEDEN FINLANDNORWAY

13
Carriage Denmark – Channel positioning favored by distributors and advertisers
Note: Bubble size = audience share 1 TV2 is still in public hands but treated like a commercial stationSource: TNS-Gallup; Advantedge; P7S1 Nordics
Target group structure and audience sharesNational universe, 15 - 50 years, Mon-Sun, all day, full year 2010
TV3 dk
TV3+
TV3 PULS
DR 2 TV 2 Zulu
TV 2 NEWS
TV 2 Sport
TV 2 Charlie
TV 2 FILM
TV 2DR 1
MTV dk
Discovery dk
DENMARK
Commercial
PSB
P7S1
MTG
Other
DR
TV21
Fe- male
Male
YoungOld

14
Nordics: Carriage fees drive strong revenue growth
FTA carriageand other
FTAadvertising
Radio69
75
2010
398
69
210
2009
335
170
113
2008
355
197
9791
RevenuesEUR millions
2008-2010 CAGR
4.2%
2.0%
13.5%
Source: P7S1 Nordics

15
0 20 40 60
30
20
10
0
P7S1 Nordics carriage fee share of total FTA revenues 2010
Percent
Norway
Sweden
Denmark
P7S1 Nordics EBITDA margins Percent - 2010
40
Distribution model earns high margins and stable revenues
• Predictable carriage revenues with significant future growth potential
• Carriage revenues allow for very strong EBITDA margins
• Danish "mini-pay" model successful through partnership with cable and DTH platforms
Source: P7S1 Nordics
Bubble size represents EUR 10 million of carriage revenue contribution; No carriage fees in Finland

16
Growth through transfer of Danish model across the Nordics
1
3
4
Source: P7S1 Nordics
2
1 Estimate based on total EBITDA development Norway (2008-2011B)
+150%
Realized EBITDA growth in Norway through transfer of Danish model1
• 4 channels • Dedicated target audiences
(young F, young M, general)• Football on• Strategic alliances with
distributors ("partner of choice")
DENMARK
• 4 channels • Dedicated target audiences
(young F, young M, general)• Football on• Increase in EBITDA margin
NORWAY

17
18
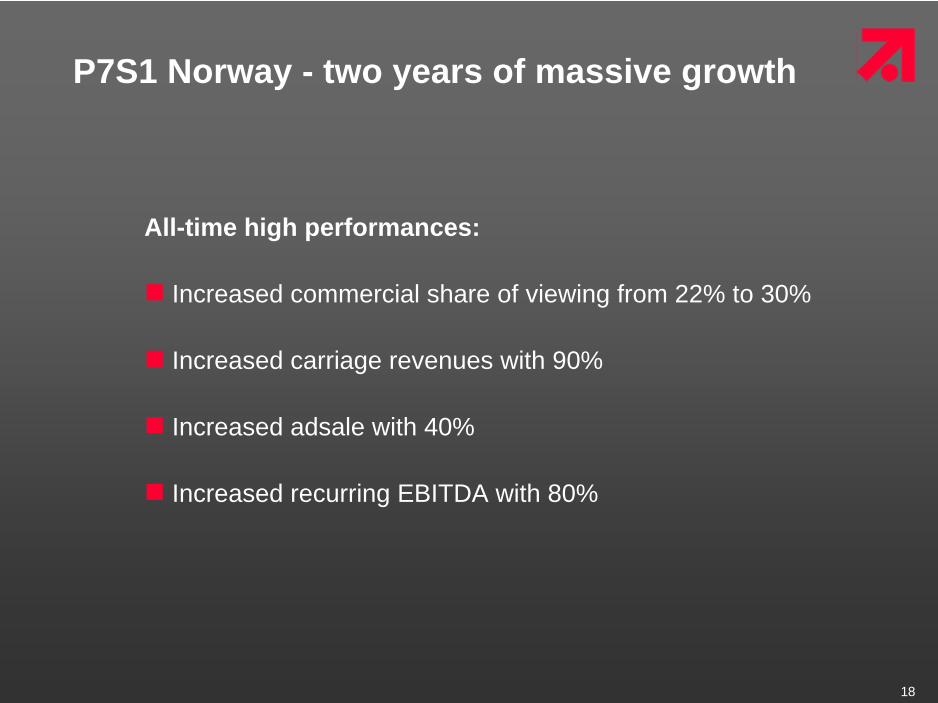
P7S1 Norway - two years of massive growth
All-time high performances:
Increased commercial share of viewing from 22% to 30%
Increased carriage revenues with 90%
Increased adsale with 40%
Increased recurring EBITDA with 80%

19
Key success factors
Optimized channel portfolio• Repositioning of TVNorge to broad entertainment• Consolidation of female channel FEM• Launch of male channel MAX on November 1st, 2010
Win-win approach to carriage revenues• Danish model of dual revenue streams• Telenor partnership
99% hitrate on local productions• Strong pipeline and production skills• Timeslot analysis• Flexibility in scheduling

20
Norway – competitive landscape
Source: TNS-Gallup; Advantedge; P7S1 NordicsNote: Bubble size = audience share
Fe- male
Male
YoungOld
Viasat 4
TV3 no
TV 2 no
NRK1
NRK3
TV 2 Zebra
Target group structure and audience sharesNational universe, 12 - 44 years, Mon-Sun, all day, full year 2010
Commercial
PSB
P7S1
MTG
NRK
Egmont

21
Channel portfolio - Norway
0.0% 0.0% 0.0% 0.0% 0.1% 0.3% 0.3% 0.2% 0.3% 0.3% 0.1% 0.0%
0.0% 0.0% 0.0% 0.0% 0.2% 0.6% 0.4% 0.3% 0.4% 0.4% 0.1% 0.0%
0.0% 0.0% 0.0% 0.0% 0.4% 0.9% 0.7% 0.7% 0.8% 0.5% 0.1% 0.0%
0.0% 0.0% 0.0% 0.0% 0.3% 1.2% 1.5% 2.1% 1.6% 0.6% 0.1% 0.0%
0.0% 0.0% 0.0% 0.0% 0.3% 2.6% 6.1% 4.6% 1.9% 0.8% 0.1% 0.0%
0.0% 0.0% 0.0% 0.0% 0.4% 2.8% 10.7% 7.5% 1.9% 0.7% 0.1% 0.0%
0.0% 0.0% 0.0% 0.0% 0.6% 2.7% 7.8% 3.5% 1.8% 0.5% 0.2% 0.1%
0.0% 0.0% 0.0% 0.0% 0.4% 1.7% 2.5% 1.3% 1.0% 0.4% 0.2% 0.1%
0.0% 0.0% 0.0% 0.0% 0.1% 1.1% 2.5% 0.7% 0.6% 0.3% 0.2% 0.1%
0.0% 0.0% 0.0% 0.0% 0.0% 1.0% 2.1% 0.6% 0.3% 0.2% 0.2% 0.1%
0.0% 0.0% 0.0% 0.0% 0.0% 0.4% 1.3% 0.5% 0.2% 0.2% 0.2% 0.1%
0.0% 0.0% 0.0% 0.0% 0.0% 0.2% 0.5% 0.4% 0.2% 0.1% 0.1% 0.1%
0.0% 0.0% 0.0% 0.0% 0.0% 0.0% 0.1% 0.1% 0.1% 0.1% 0.1% 0.1%
0.0% 0.0% 0.0% 0.0% 0.0% 0.0% 0.0% 0.1% 0.1% 0.1% 0.1% 0.0%
Gross spend per demographic Percent
Source: CIM/GfK Audimetrie; P7S1 Nordics
~1% ~2% ~3% ~4% ~5% ~6%<0.5%
Age
% female
85
80
75
70
40
35
30
25
20
15
65
60
55
50
45
YoungOld
Advertisers' sweet spot
71%29%
36%64%
58%42%

22
P7S1 Norway Share of Viewing (SoV)C
omm
erci
al s
hare
of v
iew
ing
(in p
erce
nt),
12-4
4
Source: P7S1 Nordics

23
P7S1 Norway Share of Viewing (SoV)C
omm
erci
al s
hare
of v
iew
ing
(in p
erce
nt),
12-4
4
P7S1 vs. MTG
Source: P7S1 NordicsNote: Adjusted for terror attack in Norway

24
MAX - key programming highlights
Heavily male programming and some famous light-house brands Norwegian elite series football, one match a week Very strict programming grid
25
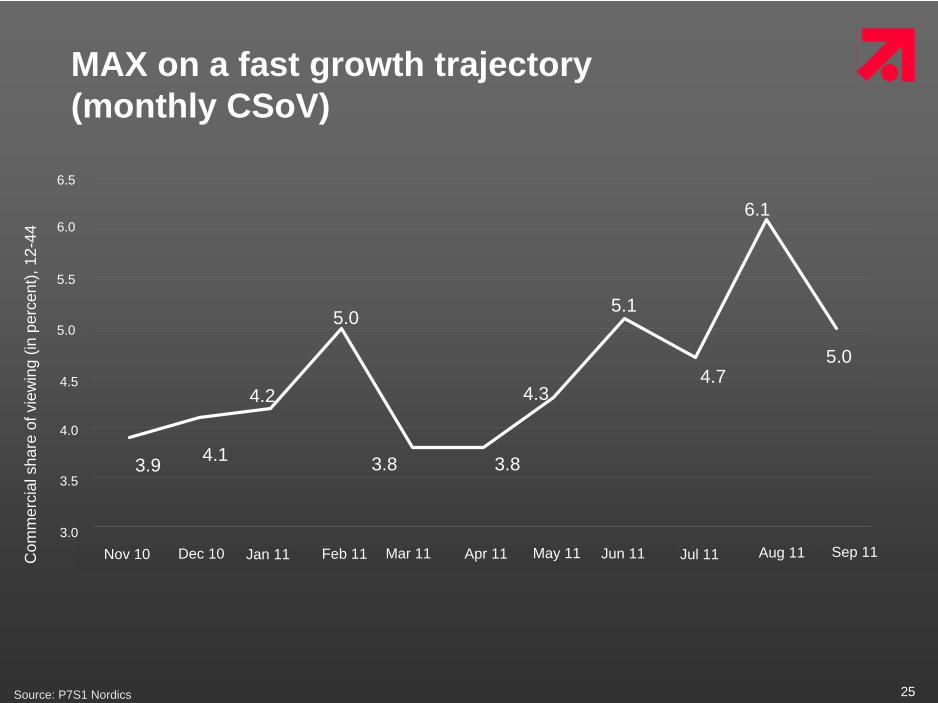
Nov 10 dec.10 Jan 11 Feb 11 Mrz 11 Apr 11 may.11 Jun 11 Jul 11 Aug 11 Sep 11
MAX on a fast growth trajectory (monthly CSoV)
Com
mer
cial
sha
re o
f vie
win
g (in
per
cent
), 12
-44
Source: P7S1 Nordics
3.9 4.1
4.2
5.0
3.8 3.8
4.3
5.1
4.7
6.1
5.0
3.0
3.5
4.0
4.5
5.0
5.5
6.0
6.5
Nov 10 Dec 10 Jan 11 Feb 11 Mar 11 Apr 11 May 11 Jun 11 Jul 11 Aug 11 Sep 11

26
6.1
4.14.1
3.1
0,0
1,0
2,0
3,0
4,0
5,0
6,0
7,0
Viasat 4 Discovery TV 2 Zebra MAX
Com
mer
cial
sha
re o
f vie
win
g (in
per
cent
), 12
-44
MAX already #2 among male channels Digital universe, men 12-44 years
Source: P7S1 Nordics
7.0
6.0
5.0
4.0
3.0
2.0
1.0
0.0

27
MAX – fastest new launch in years
4.0
2.5
1.5
4.3
3.3
2.3
4.4
3.02.8
5.1
4.4 4.4
0.0
1.0
2.0
3.0
4.0
5.0
6.0Q4 2010 Q1 2011 Q2 2011 Q3 2011
Com
mer
cial
sha
re o
f vie
win
g, 1
2-44
Source: P7S1 Nordics
MAX TV2 Bliss EM (2007/-08)

28
Carriage revenues: The Telenor
example
Five year partnership, and a new win-win approach
Telenor wins:• DTH exclusivity for MAX• A distinctive offering to male subscribers, with football• A key content partner to a new VOD/WEB-TV platform
P7S1 wins:• Increased carriage revenues for channel portfolio• Secured penetration and PVR-position for MAX• Muscle to acquire premier Norwegian football rights• Increased negotiating power towards rest of distribution market• A strong VOD/WEB-TV partnership with strong marketing presence
Source: P7S1 Nordics

29
Carriage revenues (NOK m)
Source: P7S1 Nordics

30
Nordic region: High growth potential going forward
TV/radio
Cost synergies
Source: P7S1 Nordics
Ad sale & distribution
Online & diversification
• Well established challenger position secures high potential to grow share of viewing and share of money
• Potential to grow regional sales in Sweden• Export Danish distribution model to rest of region and
cooperate with main distributors
• Build pan Nordic online and diversification strategy to take advantage of high growth markets
• Implement radio in TV organisations in each country to secure cost synergies and more efficient sales and back office organisations
• Secure more pan Nordic synergies within playout, programming, online and diversification
Nordic revenue growth potential of high mid single digit CAGR until 2015

31
This presentation contains "forward looking statements" regarding ProSiebenSat.1 Media AG ("ProSiebenSat.1 AG"), its subsidiaries/affiliates and/or ProSiebenSat.1 Group as a whole (all hereinafter collectively referred to as “P7S1 Group”), including opinions, estimates and projections regarding P7S1 Group's financial position, business strategy, plans and objectives of management and future operations and including opinions, estimates and projections regarding the markets in which it presently operates or in which it expects to operate in the future. Such forward looking statements involve known and unknown risks, uncertainties and other important factors that could cause the actual results, performance or achievements of P7S1 Group to be materially different from future results, performance or achievements expressed or implied by such forward looking statements. These forward looking statements speak only as of the date of this presentation and are based on numerous assumptions which may or may not prove to be correct.
No representation or warranty, express or implied, is made by ProSiebenSat.1, its subsidiaries/affiliates or P7S1 Group as a whole with respect to the fairness, completeness, correctness, reasonableness or accuracy of any information and opinions contained herein. The information in this presentation is subject to change without notice, it may be incomplete or condensed, and it may not contain all material information concerning P7S1 Group. ProSiebenSat.1 and its subsidiaries/affiliates undertake no obligation to publicly update or revise any forward looking statements or other information stated herein, whether as a result of new information, future events or otherwise.
Disclaimer