Nonrepresentative Representatives: An Experimental Study ...
20
American Political Science Review (2018) 112, 2, 302–321 doi: 10.1017/S0003055417000569 © American Political Science Association 2017 Nonrepresentative Representatives: An Experimental Study of the Decision Making of Elected Politicians LIOR SHEFFER University of Toronto PETER JOHN LOEWEN University of Toronto STUART SOROKA University of Michigan STEFAAN WALGRAVE University of Antwerp TAMIR SHEAFER Hebrew University A considerable body of work in political science is built upon the assumption that politicians are more purposive, strategic decision makers than the citizens who elect them. At the same time, other work suggests that the personality profiles of office seekers and the environment they operate in systematically amplifies certain choice anomalies. These contrasting perspectives persist absent direct evidence on the reasoning characteristics of representatives. We address this gap by administering exper- imental decision tasks to incumbents in Belgium, Canada, and Israel. We demonstrate that politicians are as or more subject to common choice anomalies when compared to nonpoliticians: they exhibit a stronger tendency to escalate commitment when facing sunk costs, they adhere more to policy choices that are presented as the status-quo, their risk calculus is strongly subject to framing effects, and they exhibit distinct future time discounting preferences. This has obvious implications for our understanding of decision making by elected politicians. I ndividuals differ systematically in how they make decisions. In recent decades, studies in psychology and economics have demonstrated that the degree to which individuals use certain decision heuristics, or are subject to various choice anomalies, is predicted by factors such as age, gender, personality traits, educa- tion, cultural background, social environment, and do- Lior Sheffer is a PhD Candidate, Department of Political Science, University of Toronto, Sidney Smith Hall, 100 St. George Street, Toronto, ON M5S 3G3, Canada ([email protected].) Peter John Loewen is the Director of the School of Public Pol- icy and Governance and an Associate Professor of Political Science, University of Toronto, 14 Queen’s Park Cres. West, Toronto, ON M5S 3K9, Canada ([email protected]). Stuart Soroka is the Michael W.Traugott Collegiate Professor of Communication Studies and Political Science, University of Michi- gan, 5370 North Quad, 105 South State Street, Ann Arbor, Michigan, 48109-1285, USA ([email protected].) Stefaan Walgrave is a Professor of Political Science, University of Antwerp, Stadscampus, Sint - Jacobstraat 2 - 4, S.LN55.012, 2000 Antwerp, Belgium ([email protected].) Tamir Sheafer is the Dean of the Social Science Fac- ulty and Professor of Political Science and Communication, Hebrew University, Mount Scopus, Jerusalem 91905, Israel ([email protected]). We wish to thank Eran Amsalem, Matthew Ayling, Yves De- jaeghere, Lynn Epping, Jeroen Joly, Yogev Karasenty, Julie Seve- nans, Tal Shahaf, Kirsten Van Camp, Debby Vos, and Alon Zoizner for their work on this project; the editor and three anonymous re- viewers for their thorough and helpful feedback; participants of the 2014 Yale ISPS Conference on Experimental Studies of Elite Be- havior, the 2014 International Society of Political Psychology As- sociation conference, the 2016 American Political Science Associa- tion and Southern Political Science Association conferences, and the 2016 New York Area Political Psychology Meeting for their invalu- able discussion and comments. An earlier version of this article was awarded the CQ Press Award for Best Legislative Studies Section Presented at the 2016 APSA Meeting. This work was supported by the European Research Council [Advanced Grant INFOPOL, No. 295735] and the Research Fund of the University of Antwerp [Grant No. 26827]. Received: July 11, 2016; revised: May 14, 2017; accepted: November 8, 2017. First published online: December 28, 2017. main expertise (Gilovich, Griffin, and Kahneman 2002; Kahneman 2011; List 2003). In political science, these insights on individual-level decision making are fre- quently used to explain heterogeneity in opinion for- mation, vote choice, and turnout, as well as receptiv- ity to political messaging (e.g., Druckman 2004; Gerber et al. 2011; Green, Palmquist, and Schickler 2004; Zaller 1992). We know that individual differences in reason- ing matter for citizens’ political decisions, and for voter behavior in particular. We also know that citizens’ po- litical choices reflect well-documented choice anoma- lies, such as negativity bias, loss aversion, preference for the status-quo, discounting of future outcomes, rep- resentativeness, and overconfidence. Voter behavior, it appears, is often more closely in line with spontaneous, “System I” thinking than with a complete and purpo- sive deliberation of choices and actions (Druckman and Lupia 2000; Kahneman 2011; Mercer 2005; Soroka 2014). On this backdrop, it is remarkable how little we know about the biases and anomalies that character- ize decision making by elected politicians—those who have the greatest impact on most policy outcomes. Until recently, research on elite behavior with data collected directly from politicians consisted mostly of small-n individual case studies and qualitative inves- tigations (e.g., DiRenzo 1967; Greenstein 2004; King- don 1989; Putnam 1976). Psychological case studies of leader behavior have also been the focus of an ex- tensive literature in international relations. (See Levy 2013 for a comprehensive review.) However, large- scale, directly collected empirical evidence on the ba- sic choice characteristics of politicians is almost com- pletely absent. 1 Many studies of elected politicians’ 1 Relatedly, several notable large-n studies have collected data on the personality profiles of elected politicians. These studies did not use experiments or random allocation (Aberbach, Putnam, and 302 Downloaded from https://www.cambridge.org/core . University of Antwerp , on 16 Nov 2018 at 14:48:12, subject to the Cambridge Core terms of use, available at https://www.cambridge.org/core/terms . https://doi.org/10.1017/S0003055417000569
Transcript of Nonrepresentative Representatives: An Experimental Study ...

American Political Science Review (2018) 112, 2, 302–321
doi:10.1017/S0003055417000569 © American Political Science Association 2017
Nonrepresentative Representatives: An Experimental Study of theDecision Making of Elected PoliticiansLIOR SHEFFER University of TorontoPETER JOHN LOEWEN University of TorontoSTUART SOROKA University of MichiganSTEFAAN WALGRAVE University of AntwerpTAMIR SHEAFER Hebrew University
A considerable body of work in political science is built upon the assumption that politicians aremore purposive, strategic decisionmakers than the citizens who elect them.At the same time,otherwork suggests that the personality profiles of office seekers and the environment they operate
in systematically amplifies certain choice anomalies. These contrasting perspectives persist absent directevidence on the reasoning characteristics of representatives. We address this gap by administering exper-imental decision tasks to incumbents in Belgium, Canada, and Israel. We demonstrate that politiciansare as or more subject to common choice anomalies when compared to nonpoliticians: they exhibit astronger tendency to escalate commitment when facing sunk costs, they adhere more to policy choicesthat are presented as the status-quo, their risk calculus is strongly subject to framing effects, and theyexhibit distinct future time discounting preferences. This has obvious implications for our understandingof decision making by elected politicians.
Individuals differ systematically in how they makedecisions. In recent decades, studies in psychologyand economics have demonstrated that the degree
to which individuals use certain decision heuristics, orare subject to various choice anomalies, is predicted byfactors such as age, gender, personality traits, educa-tion, cultural background, social environment, and do-
Lior Sheffer is a PhD Candidate, Department of Political Science,University of Toronto, Sidney Smith Hall, 100 St. George Street,Toronto, ON M5S 3G3, Canada ([email protected].)Peter John Loewen is the Director of the School of Public Pol-
icy and Governance and an Associate Professor of Political Science,University of Toronto, 14Queen’s Park Cres.West,Toronto,ONM5S3K9, Canada ([email protected]).Stuart Soroka is the Michael W. Traugott Collegiate Professor of
Communication Studies and Political Science, University of Michi-gan, 5370 North Quad, 105 South State Street,AnnArbor,Michigan,48109-1285, USA ([email protected].)Stefaan Walgrave is a Professor of Political Science, University
of Antwerp, Stadscampus, Sint - Jacobstraat 2 - 4, S.LN55.012, 2000Antwerp, Belgium ([email protected].)Tamir Sheafer is the Dean of the Social Science Fac-
ulty and Professor of Political Science and Communication,Hebrew University, Mount Scopus, Jerusalem 91905, Israel([email protected]).We wish to thank Eran Amsalem, Matthew Ayling, Yves De-
jaeghere, Lynn Epping, Jeroen Joly, Yogev Karasenty, Julie Seve-nans, Tal Shahaf, Kirsten Van Camp, Debby Vos, and Alon Zoiznerfor their work on this project; the editor and three anonymous re-viewers for their thorough and helpful feedback; participants of the2014 Yale ISPS Conference on Experimental Studies of Elite Be-havior, the 2014 International Society of Political Psychology As-sociation conference, the 2016 American Political Science Associa-tion and Southern Political Science Association conferences, and the2016 New York Area Political Psychology Meeting for their invalu-able discussion and comments. An earlier version of this article wasawarded the CQ Press Award for Best Legislative Studies SectionPresented at the 2016 APSA Meeting. This work was supported bythe European Research Council [Advanced Grant INFOPOL, No.295735] and the Research Fund of the University of Antwerp [GrantNo. 26827].
Received: July 11, 2016; revised: May 14, 2017; accepted: November8, 2017. First published online: December 28, 2017.
main expertise (Gilovich,Griffin, and Kahneman 2002;Kahneman 2011; List 2003). In political science, theseinsights on individual-level decision making are fre-quently used to explain heterogeneity in opinion for-mation, vote choice, and turnout, as well as receptiv-ity to political messaging (e.g.,Druckman 2004;Gerberet al.2011;Green,Palmquist,and Schickler 2004;Zaller1992). We know that individual differences in reason-ing matter for citizens’ political decisions, and for voterbehavior in particular. We also know that citizens’ po-litical choices reflect well-documented choice anoma-lies, such as negativity bias, loss aversion, preferencefor the status-quo, discounting of future outcomes, rep-resentativeness, and overconfidence. Voter behavior, itappears, is often more closely in line with spontaneous,“System I” thinking than with a complete and purpo-sive deliberation of choices and actions (Druckmanand Lupia 2000;Kahneman 2011;Mercer 2005; Soroka2014).On this backdrop, it is remarkable how little we
know about the biases and anomalies that character-ize decision making by elected politicians—those whohave the greatest impact on most policy outcomes.Until recently, research on elite behavior with datacollected directly from politicians consisted mostly ofsmall-n individual case studies and qualitative inves-tigations (e.g., DiRenzo 1967; Greenstein 2004; King-don 1989; Putnam 1976). Psychological case studies ofleader behavior have also been the focus of an ex-tensive literature in international relations. (See Levy2013 for a comprehensive review.) However, large-scale, directly collected empirical evidence on the ba-sic choice characteristics of politicians is almost com-pletely absent.1 Many studies of elected politicians’
1 Relatedly, several notable large-n studies have collected data onthe personality profiles of elected politicians. These studies didnot use experiments or random allocation (Aberbach, Putnam, and
302
Dow
nloa
ded
from
htt
ps://
ww
w.c
ambr
idge
.org
/cor
e. U
nive
rsity
of A
ntw
erp,
on
16 N
ov 2
018
at 1
4:48
:12,
sub
ject
to th
e Ca
mbr
idge
Cor
e te
rms
of u
se, a
vaila
ble
at h
ttps
://w
ww
.cam
brid
ge.o
rg/c
ore/
term
s. h
ttps
://do
i.org
/10.
1017
/S00
0305
5417
0005
69

Nonrepresentative Representatives
decision making ascribe to them known choice anoma-lies, to be sure—but this is often done by adoptingterminology and insights obtained from studies con-ducted with nonelite samples, and whether what isknown on the effects of such traits and biases simi-larly applies to elected politicians is by and large notaddressed (for example, Jervis 2015; Jones and Baum-gartner 2005a; Kanwisher 1989; see Miler 2009 for areview). Equally important, there is still a considerablebody of work in political science that describes high-level elected politicians as strategic, cool-headed, pur-posive utility maximizers with full knowledge, stableand transitive preferences, and with close-to-unlimitedtime and attention resources when making decisions.(The literature is vast,but see,e.g.,Axelrod 2015;Baronand Ferejohn 1989; Bueno de Mesquita 2013; De-wan and Spirling 2011; Dunleavy 2014; Fearon 1999.)Such accounts make an assumption—implicitly orexplicitly—that politicians operate in an environmentthat motivates “better,” higher-quality decision mak-ing, compared to how they would operate elsewhere,or compared to nonpoliticians. In political science,the evidence for such claims is mostly circumstantial.2Outside of political science, studies in economicsand psychology provide some evidence that domain-specific expertise can improve decision quality (List2003), but whether we should expect this to apply topolitical expertise depends on whether politics is anenvironment that allows for accurate feedback cali-bration by decision makers, which is an open ques-tion (Butler and Dynes 2016; Hogarth 2002; Mellerset al. 2015; List and Mason 2011; Tyszka and Zielonka2002).This state of affairs, we argue, is theoretically un-
justified and empirically unsupported. Several disjointstrands of the political science literature highlight adifferent theoretical landscape, suggesting that electedrepresentatives, as a group, may be subject to simi-lar biases and heuristics in their decision making. In-deed, there are several reasons to expect that the choiceanomalies that characterize citizens’ decision makingmay even be enhanced amongst representatives.First, studies on the personality determinants of po-
litical ambition and motivation, and especially thosethat examine the personalities of incumbent politicians,find that individuals who decide to run for office (letalone those who win it) have systematically differentpersonality profiles when compared to those who stayout of politics. Several unique features are found inelected officials across countries and levels of govern-ment, such as being more extraverted and open to ex-perience, and these features are associated with ex-hibiting higher levels of decision traits such as lossaversion, choice overconfidence, and escalating com-
Rockman 1981; Caprara et al. 2003; Feldman 1996; Heß et al. 2013;Wiegele and Oots 1990).2 For example, voters with higher levels of political sophisticationhave been found to be more immune to framing effects (Druckman2001), so, by extension, politicians should be the least susceptible tothem.
mitment (Best 2011; Caprara et al. 2010; Dietrich et al.2012).3
Second, the literature on motivated reasoning bypoliticians in the face of retrospective voting (and pub-lic opinion in general) documents behaviors suggest-ing that politicians are incentivized to adopt particu-lar heuristics and cognitive shortcuts when perform-ing specific tasks, whether as a result of learning or,more generally, through acquired experience (Arnold1992; Bueno de Mesquita and Siverson 1995; HealyandMalhotra 2013;March and Olsen 1995;Miler 2009;Weaver 1986). Closely related is the literature on po-litical accountability, which documents the behavioralimplications of operating in an environment where de-cisions are open to public scrutiny and sanction, andwhere those making them are dependent on publicapproval when seeking re-election (Ashworth 2012;Downs andRocke 1994;Lerner and Tetlock 1999;Prze-worski, Stokes, and Manin 1999). In these accounts, thebasic premise is that having to stand for re-election andto operate in public view alters preferences and moti-vates the adoption of predictable decision-making pat-terns, such as heavily discounting future events, or pre-ferring risk taking in face of potential electoral losses.There are thus good reasons to expect that at
least some of the choice anomalies readily apparentamongst citizens will be evident in the behavior ofelected politicians as well. Efforts to systematicallyidentify and assess such traits in politicians are, how-ever, still nascent. (See Hafner-Burton, Hughes, andVictor 2013 for an extensive discussion.) So too areefforts to directly compare choice anomalies in bothcitizens and their representatives. What accounts forthis critical gap in the literature? We suspect that it islargely the result of two factors—one ontological andthe other methodological.First, when explaining policy outcomes, political sci-
entists have traditionally ascribed a relatively smallrole to individual-level elite preferences relative to in-stitutional and structural factors. This is especially truein work on international conflict, political economy,party politics, and public policymaking (Hall and Tay-lor 1996; McDermott 2004; Pierson 2000). Of course,domains that involve mass participation, such as elec-toral behavior or mobilization, lend themselves morereadily to individual-level-based explanations (and di-rect empirical investigation), which perhaps explainswhy more realistic assumptions about (and testingof) human reasoning are common in these subfields(Druckman and Lupia 2012). Nevertheless, influentialstudies in international affairs,party and parliamentarydynamics,and public policymaking often conceptualizeelite decision makers as more simple utility maximiz-ers, operating under constraints that are determinedby higher-order conditions (Jones 2003; McDermott,Fowler, and Smirnov 2008; Tsebelis 2002).
3 Closely related is the extensive literature on political sophistica-tion and how it impacts different political behaviors and attitudes, al-though the focus of this literature is on nonelites. SeeMcGraw (2000,817-8) for one review.
303
Dow
nloa
ded
from
htt
ps://
ww
w.c
ambr
idge
.org
/cor
e. U
nive
rsity
of A
ntw
erp,
on
16 N
ov 2
018
at 1
4:48
:12,
sub
ject
to th
e Ca
mbr
idge
Cor
e te
rms
of u
se, a
vaila
ble
at h
ttps
://w
ww
.cam
brid
ge.o
rg/c
ore/
term
s. h
ttps
://do
i.org
/10.
1017
/S00
0305
5417
0005
69

Lior Sheffer et al.
Second, finding out whether politicians operate dif-ferently from the general population requires studyingthe decision making of both groups in a controlled andcomparable manner, ideally in an experimental settingin which large numbers of participants from bothgroups perform the same tasks (Druckman et al. 2006;Fréchette 2011;Mintz,Redd, and Vedlitz 2006;Mortonand Williams 2010). This remains a difficult undertak-ing despite the recent proliferation of experiments inpolitical science, mainly due to the difficulty of recruit-ing a sufficiently large number of incumbent politicians.And external validity is lost when using conveniencesamples for the reasons noted above. As Druckmanand Lupia (2012, 1178) explain, “typical experimentalsubjects often lack the experience needed to act ‘as if’they were professional legislators; yet, legislators them-selves are often reluctant to participate in experimentsas subjects.” Indeed, aside from a few notable examples(Broockman and Butler 2017; Butler and Dynes 2016;Enemark et al. 2016; Miler 2009),4 most experimentalstudies that involve politicians as subjects usually doso using indirect methods, such as observing variationin communications received from politicians’ offices inresponse to different kinds of stimuli, or tracing leg-islative behavior (see, for example, Kalla and Broock-man 2016; Butler, Karpowitz, and Pope 2012; Grose,Malhotra, and Parks Van Houweling 2015; Loewenand MacKenzie 2017). In fact, the only two studies ofelected politicians that we are aware of that attemptedto asses one of the traits we examine here (stability ofrisk preferences) were conducted with underpoweredsamples ofN= 32 (Fatas, Neugebauer, and Tamborero2007) and N = 46 (Linde and Vis 2017), making validstatistical inference from their findings difficult.5
These ontological and methodological constraintsare surmountable.We begin a systematic investigationhere, focusing on four well-documented choice anoma-lies that are fundamental in political decision mak-ing, and prominently featured in theories of elite poli-tics and policy-related reasoning. First, future time dis-counting is elemental in numerous studies of politicalspending decisions, specific policy choices (especiallyon environmental policies), public opinion, and elec-toral behavior of both elites and constituents (Jacobs2011; Loewenstein and Elster 1992; Nordhaus 1975;Streich and Levy 2007). Second, risk management, andin particular, how risk preferences change in face ofdifferent issue and choice frames, are crucial in polit-ical decision making, where risk underlies almost any
4 These studies look at reciprocity and cooperative behavior, learn-ing from peers, and constituent perceptions. They are unique in thatthey use elected politicians as participants. Some related efforts toexplore how behavioral traits and personality styles impact elite po-litical decisionmakingwere conductedwithmilitary officials,bureau-crats, and political advisers as participants.Those include studies thatassess to what degree elites have different levels of power motiva-tion (Renshon 2015), stress (Sherman et al. 2012), overconfidence(Johnson et al. 2006), self-interest and capacity for strategic inference(LeVeck et al. 2014), and expressions of competence and dominance(van Vugt and Ronay 2014).5 Morever, the Fatas et al. sample missed some key features of ourown. First, most subjects had been appointed rather than elected tooffice. Second, most officials had left office at the time of the study.
action, and indeed have been shown to dominate pub-lic opinion formation and, subsequently, the decisionmaking of policy actors (Arceneaux 2012; Druckmanand McDermott 2008; Levy 2003; Slovic 2000). Third,the status-quo bias is strongly connected to phenom-ena such as the incumbency advantage, to political in-action, and to individual choices that result in institu-tional entrenchment processes and legislative gridlock,among others (Pierson 2000; Quattrone and Tversky1988; Samuelson and Zeckhauser 1988). Finally, the es-calation of commitment in face of sunk costs is seenas the central behavioral disposition accounting forprolonged armed conflict and for decisions to extendspending on failed programs and policies (Dur 2001;Heath 1995; Sleesman et al. 2012).While far from being the only commonly observed
choice anomalies, we regard these four as most centralto the kinds of decisions that politicians must make.We explore each through vignette experiments withseveral hundred incumbent members of the nationaland regional parliaments of Belgium, Canada, and Is-rael (max N = 382). Moreover, and central to our in-terest in comparing politicians with citizens, we com-pare politicians’ performance on these tasks to that ofvoting-age citizens in each country, using representa-tive samples of the general population. Our design hasseveral advantages. First, we obtain direct measures ofelite choice preferences by collecting responses frompoliticians in person, rather than by email or by phone;we consequently know that any differences betweenpoliticians and nonpoliticians are the result of the deci-sions of our elite subjects and not of their staff /advisers.Second, our sample is large enough to allow for well-powered statistical inference in the modules we em-ploy. It also represents a sizable proportion of the entirepopulation ofMembers of Parliament (MPs) in the par-liaments we study.Third,becausewe collect data on cit-izen performance on the exact same tasks, we are ableto measure elite–nonelite differences directly, withouthaving to rely on convenience samples or on perfor-mance in different tasks. Finally, our three-country de-sign allows us to examine whether the patterns we seein MPs are sustained across different institutional set-tings. Indeed, an important feature of our results is thatmost of the patterns we observe obtain similarly forpoliticians across three different electoral systems andparty systems, despite the presence of distinct institu-tional incentives.
EMPIRICAL APPROACH
This study was conducted as part of an ongoing projectin which incumbent politicians were extensively inter-viewed with the purpose of studying the determinantsof their information processing and actions.6 The coredata collected in this project were obtained in tworounds, in 2014 and 2015. In both rounds,we conductedhour-long, in-person interviews with members of na-tional and regional parliaments in Belgium, Canada,and Israel.
6 For more details, see: http://www.infopol-project.org/.
304
Dow
nloa
ded
from
htt
ps://
ww
w.c
ambr
idge
.org
/cor
e. U
nive
rsity
of A
ntw
erp,
on
16 N
ov 2
018
at 1
4:48
:12,
sub
ject
to th
e Ca
mbr
idge
Cor
e te
rms
of u
se, a
vaila
ble
at h
ttps
://w
ww
.cam
brid
ge.o
rg/c
ore/
term
s. h
ttps
://do
i.org
/10.
1017
/S00
0305
5417
0005
69

Nonrepresentative Representatives
TABLE 1. Elected politicians participating in the study, by parliament
N
Parliament Sample Contact Population Response Rate
Round I (2014)
Chamber of Representatives, Belgium 85 100 100∗ 85%House of Commons, Canada 43 153 308 14%The Knesset, Israel 36 120 120 30%
Round II (2015)
Chamber of Representatives, Belgium 103+10 150+21 150+21∗∗ 66%Flemish Parliament, Belgium 103+3 124+9 124+9∗∗ 80%Waloon Parliament, Belgium 50 97+12 97+12∗∗ 46%House of Commons, Canada 45 131 308 15%Ontario Legislative Assembly, Canada 31 107 107 29%The Knesset, Israel 44 120 120 37%The Knesset (exiting members)∗∗∗ 18 39 39 46%
Sample N—number of participating MPs. The effective N for each module is slightly lower than the overall participation N perround as some respondents skipped modules for various reasons. (Effective N per module is reported in the paper.) Contact N—overall number of MPs targeted. Where not all MPs were contacted, the contact list was randomly drawn. Population N—overallMPs in parliament at the time of interviews. Response rate— SampleN
Populat ionN . Some MPs were interviewed in both rounds. ∗—theBelgian Chamber of Representatives has 150 members, but only members of Flemish parties were targeted in the first round,resulting in a population N of 100. ∗∗—in Belgium, sampling included all members of parliament plus government ministers andstate secretaries who are not part of parliament by definition. We also sampled leaders of parties represented in parliament whothemselves were not MPs at the time of the interview. ∗∗∗—in addition to incumbent Members of the Knesset (MKs), MKs whowere not re-elected in the May 2015 Israeli general election were also targeted.
We are focusing in this project on established par-liamentary democracies, where elected representativesplay a central role in policymaking, budgeting, and gov-ernment control (let alone being part of governments),and where many of them can and do become careerpoliticians. The scope of the project mandated a focuson a small number of parliament cases.Within the con-text of parliamentary democracies, we chose countrycases that had substantial variation in terms of federal-ism (federal–unitary), electoral systems (majoritarian–proportional), and the political importance of geo-graphic dispersion. While obviously not a perfect orentirely generalizable design—for example, we are notstudying elected politicians in newer democracies norin competitive authoritarian regimes—we believe thatour case selection strategymakes the study designwell-positioned to make inferences on elite-citizen differ-ences in the choice anomalies we study.We emphasizethat this design, while well-suited for documenting theexistence (or absence) of such differences, does not at-tempt to answer causal questions on their origin. Wefurther address this point in the Conclusion.In Canada, we interviewed members of the Fed-
eral House of Commons and the Legislative Assem-bly of Ontario. In Belgium, we interviewed mem-bers of the Federal Chamber of Representatives, andalso members of the regional parliaments (Walloonand Flanders). In Israel, we interviewed members ofthe Knesset, Israel’s national (and only) parliament.Participating politicians answered open-ended ques-tions and completed a survey on tablet computers thatcontained closed questions and several experimental
protocols.7 Details on sample sizes and response ratesfor the MP surveys are included in Table 1. [See Sup-plementary Material (SM) for full breakdowns byparty.] Similar information for the accompanying cit-izen surveys is included in Table 2.8 In both rounds,the surveys and questions presented to MPs in allthree countries were direct translations to the local lan-guage(s) of the samemodules (originally written in En-glish). Question phrasing remained identical, barringminor adjustments such as referring to monetary sumsusing the local currency.As outlined above,we focus on four behavioral traits
that are fundamental to elite political decision mak-ing: risk preference, escalating commitment in face ofsunk costs, future time discounting, and a biased prefer-ence for the status-quo. Risk preferences are assessedusing the classic “Asian disease” experiment (Tverskyand Kahneman 1981), which was administered to MPsparticipating in the first round of interviews (N= 154).The other three traits were assessed using modules
7 We note that the other experiments we conducted were not relatedto decision-making anomalies. Accordingly, we do not present themhere. The experiments presented below represent the complete setof decision-making experiments we conducted. Thus, no relevant re-sults are excluded.8 The general population samples were collected using online sur-veys. The content presented was identical to the one administered topoliticians in person.We attempted to minimize risks inherent to on-line surveys, such as respondents being inattentive to the questions,by following standard quality monitoring and eliminating, at the datacollection stage, respondents who did not complete the survey, spedthrough it, or skipped many items.
305
Dow
nloa
ded
from
htt
ps://
ww
w.c
ambr
idge
.org
/cor
e. U
nive
rsity
of A
ntw
erp,
on
16 N
ov 2
018
at 1
4:48
:12,
sub
ject
to th
e Ca
mbr
idge
Cor
e te
rms
of u
se, a
vaila
ble
at h
ttps
://w
ww
.cam
brid
ge.o
rg/c
ore/
term
s. h
ttps
://do
i.org
/10.
1017
/S00
0305
5417
0005
69

Lior Sheffer et al.
TABLE 2. Citizen samples, by country
Sample N
Round I (2014)Belgium 537Canada 515Israel 505
Round II (2015)
Belgium 2791Canada 623Israel 1005
Samples are nationally representative in terms of ageand gender distributions, and also geographically in Bel-gium and Canada. In Canada, the Round II sample con-sists of a nationally representative sample of ∼400 andan Ontario representative sample of ∼200, to provide forvalid comparisons to both the House of Commons andthe Ontario Legislative Assembly.
administered during the second round (N varies, seebelow). In all cases, MP interviews were accompaniedby survey experiments with representative samples ofthe voting-age populations of each country, where thesamemoduleswere administered.The largemajority ofMPs completed all three modules in the second waveof interviews, with completion rates ranging between82% to 93%. The Asian disease module was adminis-tered separately in the first round; the completion ratefor thatmodule was 97%of participatingMPs. (See SMfor full figures.)Vignette experiments administered to politicians are
inevitably an exercise in hypotheticals, and becausepoliticians face a big stakes incentive environment,replicating it in a controlled fashion is inherently diffi-cult.Nevertheless,we believe that themodules we useddid motivate politicians to engage with them seriously,and that their recorded reactions provide valid mea-sures of our constructs of interests. First, choices ob-served in similar vignette experiments are correlatedwith consequential real-world behaviors (e.g.,Barbosa,Gerhardt, and Kickul 2007; Ghadim, Pannell, and Bur-ton 2005 on risk-taking; Caprara et al. 2008;Meier andSprenger 2012 on time discounting), which supportsthe external validity of these tests. Second, the anoma-lies we study are similarly observed in studies with andwithout incentives, further substantiating the expecta-tion that politicians think about such choices as theywould had there been tangible material incentives inplay (Camerer et al. 1999). Finally, we used very well-known designs that have been administered dozens oftimes. There is a very large body of empirical find-ings that substantiate the validity of results obtainedfrom such modules, and we know that people’s behav-ior changes in predicted ways in response to them.9
9 Relatedly, to capture as many comparable responses as possible,and to maintain between-countries comparability in our design, wehad to abstract away from unique politician-level scenarios (such as
Wenote that this design is vulnerable to the potentialproblem of confounding in survey experiments, iden-tified by Dafoe and colleagues (Dafoe 2011; Dafoe,Zhang and Caughey 2016). In short, this is the concernthat experimental manipulations contain informationthat can serve to change beliefs about background fea-tures of the scenario, beyond the belief of interest thatis intended to be manipulated, thus possibly confound-ing one’s ability to make inferences about that belief’seffect. This is a design concern in survey experimentsmore broadly, and we believe that themajority of treat-ments we introduce here are less susceptible to poten-tial confounding, although this is potentially an issuefor accountability treatments.10 In our view, this con-cern still represents a reasonable cost given the benefitsof the modules we used, but this feature underscoresthe importance of future replications of the findingspresented here.The sections that follow introduce experiments and
review results for each of our four common choiceanomalies in turn.
STUDY 1: RISK PREFERENCE AND FRAMES
In this first module, we are interested in whetherelected politicians exhibit higher or lower levels ofrisk-seeking as nonpoliticians on the same tasks, andwhether their risk preferences are more (or less) sta-ble in face of choice frames. The classic rational choiceexpectations are that (a) individuals are risk-neutral,in that they are indifferent between certain and risky
introducing a bill) or country- and time-specific ones (such as votingon a specific, real bill in a given week). Construct validity is reducedwhen this strategy is adopted, but it is unclear that true random allo-cation would be tenable in a politician-tailored design, which wouldmean losing on one of the main advantages of having politiciansparticipate in established experimental protocols. In addition, even ascenario that is closely tied to a real-world situation would still be alow-stakes, hypothetical response, and so this design challenge wouldremain unresolved.We believe that the reduced construct validity ofuniformity in vignettes is offset by the benefits of having a large sam-ple of incumbent politicians inmultiple countries being evaluated us-ing the same measures, and particularly when the vignettes used stillapproximate common decision-making dilemmas frequently facedby most politicians.10 We believe that most of our manipulations consist of frames thatdo not provide information that is likely to result in spillover acti-vation of other determinants, which is the principal concern of con-founding: the gain/loss frames in the risk-seeking module retain thesubstantive content of the choices,and so do the status quo plan treat-ments in that module, since both options are presented in all cases.Arguably,whether 3% growth + 3% deficit or 5% + 5% is the statusquo can create a confound about what kind of economy the countryis in, but that is exactly what we were interested in priming to see ifparticipants respond to the content in any meaningful way beyondits description as being the status quo. In the sunk cost experiment,the size of the sunk cost could very well convey information aboutthe program itself, but here too this is not a confound but rather thecore of what the sunk cost is assumed to convey in such modules.One can suppose that respondents would update their beliefs aboutgovernment programs in general beyond that specific case in a waythat affects their response, but it is far more likely that whateverprior they have on government spending is highly stable given thatthey are career politicianswith a solidified perception of government.We additionally discuss this concern with further detail in the time-discounting study, to which we believe it applies more directly.
306
Dow
nloa
ded
from
htt
ps://
ww
w.c
ambr
idge
.org
/cor
e. U
nive
rsity
of A
ntw
erp,
on
16 N
ov 2
018
at 1
4:48
:12,
sub
ject
to th
e Ca
mbr
idge
Cor
e te
rms
of u
se, a
vaila
ble
at h
ttps
://w
ww
.cam
brid
ge.o
rg/c
ore/
term
s. h
ttps
://do
i.org
/10.
1017
/S00
0305
5417
0005
69

Nonrepresentative Representatives
choices with the same expected utility, and that (b)this risk-neutrality is invariant (Levy 2003; Shepsle andBonchek 1997). As has been demonstrated countlesstimes, this does not hold empirically, with the mostpersistent deviation being that people tend to be risk-seeking when they believe they are facing potentiallosses, and risk-averse when they believe they are fac-ing potential gains, even if the choices themselves re-main the same (Tversky and Kahneman 1992; see Küh-berger 1998 for an extensive review). This is an inher-ent part of prospect theory, and has been originallydemonstrated using the Asian disease framing exper-iment (Tversky and Kahneman 1981).
Despite the now-dominant place this perspectivetakes in the study of human psychology, its integrationinto models of political choice has been more gradual,and whether it applies to elected politicians is still amatter of debate: some accounts make the argumentthat politicians should be expected to respond stronglyto gain/loss frames, either because their susceptibilityto cognitive biases is similar to the general population(Boettcher 2004; Druckman 2004; Levy 1997; McDer-mott, Fowler, and Smirnov 2008), or because havingto stand for re-election makes their risk preferenceserratic (Jervis 1992, 190-1). Other accounts imply thatelected politicians are more resistant to framing ef-fects, particularly because elected representatives op-erate in an environment in which they are constantlyfacing attempts to frame the issues they deal with.Theyare in continuous interaction with the news media, in-terest groups, businesses, and lobbyists—all of whomare involved in attempts to “sell” a frame that benefitstheir interests to political decision makers (Baumgart-ner and Jones 1993;Edwards andWood 1999). Further,politicians are themselves strategic and purposive in-stigators of issue frames (Chong and Druckman 2007),and so should be able to put their reactions to them incheck.Of special importance in representative democ-racy is the ability of actors to frame actions and issuesas potential losses or gains, given the substantial im-pact that these features have on opinion formation—and thus on politicians’ public standing and re-electionprospects (Druckman 2004). Such constant exposureto and involvement in framing attempts implies thatpoliticians may be less susceptible to them.
Method
We use a modified version of the Asian disease exper-iment, which captures both within-group average risk-seeking preferences, and examines how they changein response to different task frames. In this protocol,subjects are presented with a hypothetical scenario inwhich an exotic disease is expected to kill 600 people.Two proposals for combating this epidemic are pre-sented. Choice A, the riskless option, has the certainresult of 400 people dying and the remaining 200 peo-ple being saved. Choice B involves risk: there is a 1/3chance of no one dying, and a 2/3 chance of everyonedying. In the experiment, following directly on Tverskyand Kahneman’s (1981) work, the framing of the two
choices is manipulated such that half of subjects arepresented options framed as potential gains (“200 peo-ple will be saved”) and the other half are presentedwith the same options, framed as potential losses (“400people will die.”). We note the explicitly political na-ture of this question, namely that decisions about pub-lic and not private matters are being made. Subjectswere randomized to one condition.We further include a second treatment: we ran-
domly vary the scenario’s level of political account-ability by changing the hypothetical location of thedisease threat, and thus the personal importance ofthe decision that the subjects are asked to make. Inthe low accountability condition, the disease was saidto be threatening a country geographically removedfrom the politician’s country (Germany in the Cana-dian case, and the United States in the Belgian and Is-raeli cases), and the politician was asked what she/hewould do. In the high accountability condition, thepolitician was told the disease was in their country, andthat they were on the health committee making a fi-nal vote over the two options. This manipulation pro-duces one variant in which the likelihood of electoralsanction is low (that is, when there are no direct conse-quences of the decision for the politician’s electorate),and another in which the likelihood of electoral sanc-tion is much more likely. Subjects were randomized toone condition, independent of their assignment to gain-loss frames, thus resulting in a 2 x 2 between-subjectsexperimental design.
Results
We report two quantities.11 First, by observing the av-erage response of subjects across conditions,we can re-cover the stability of risk choices by politicians in theface of gains versus loss frames.12 We can also com-pare this stability of risk preferences on this task tothose recovered from the general population samplesusing the same module. Second, by observing differ-ences across our political accountability conditions, wecan estimate whether politicians make different deci-sions when their choices plausibly involve more tangi-ble consequences for them and for their constituents. Ifwe find that politicians are less risk-seeking overall, orare less susceptible to frames when considering a (hy-pothetical) situation forwhich they could face sanction,that is, their vote on a health committee, then this pro-vides evidence that the task environment plays a rolein accounting for decision-making differences betweenpoliticians and nonpoliticians.
11 Full estimation results and regression models for all four studiesare available in the SM.12 This method provides a direct observation of risk-seeking rates bypoliticians as a group, conditional on the distribution of treatmentconditions.We calculate the overall mean per group by setting treat-ment likelihoods to 0.5, using Clarify (Tomz, Wittenberg, and King2003). To obtain a statistical measure of confidence in the mean, wederive predicted probabilities for our quantities of interest after es-timating logit models, also using Clarify.We use these predictions toreport 95% confidence intervals for risk-seeking means.
307
Dow
nloa
ded
from
htt
ps://
ww
w.c
ambr
idge
.org
/cor
e. U
nive
rsity
of A
ntw
erp,
on
16 N
ov 2
018
at 1
4:48
:12,
sub
ject
to th
e Ca
mbr
idge
Cor
e te
rms
of u
se, a
vaila
ble
at h
ttps
://w
ww
.cam
brid
ge.o
rg/c
ore/
term
s. h
ttps
://do
i.org
/10.
1017
/S00
0305
5417
0005
69

Lior Sheffer et al.
FIGURE 1. Proportion of risky choices madeby politicians and citizens in the Asiandisease experiment, in Belgium, Canada, andIsrael.
.3.4
.5.6
.7.8
Ris
k−S
eeki
ng P
ropo
rtio
ns (
Pre
dict
ed P
roba
bilit
ies)
All Belgium Canada Israel
Notes: Circles denote politicians; diamonds, citizens. Valuesare predicted probabilities, obtained using Clarify. (See SM forfull results.) Bars are 95% confidence intervals. citizens andpoliticians N: Belgium—515, 82; Canada—515, 43; Israel—505, 29.
We begin with some basic descriptives. The overallthree-country risk-seeking rate by MPs is 62.5%, com-pared with 53.8% for nonpoliticians—a substantivelylarge difference that nears conventional levels of sta-tistical significance (two-sided t-test p= 0.07). Figure 1presents overall rates of risk-seeking in this task byMPs and citizens across the sample and in each country.Our results suggest that the overall risk-seeking ratesof politicians do not vary substantially across the threecases (Belgium = 63.8% (95% ci 50, 76), Canada =58.7% (95%ci 42,75), Israel= 61.3% (95%ci 43,79). Inall cases, politicians consistently demonstrate a greaterpreference for risk than citizens, but these differencesare never statistically significant within each country(two-sided t-tests: Belgium p = 0.12, Canada p = 0.68,Israel p = 0.37).Figure 2 shows the rates of risk-seeking across fram-
ing conditions forMPs and citizens.Overall and in eachcountry, a loss frame induces more risk-seeking. Thepercent change in risk-seeking preference when mov-ing from the gains frame to the losses frame is +38percentage points for MPs (one-sided t-test p = 0.00)and +35 percentage points for citizens (p = 0.00). Theframing effect for Israeli MPs does not reach conven-tional levels of statistical significance, and is substan-tively small: the change in preference for risk-takingwhen moving from gains to losses is +42 percentagepoints in Belgium (p= 0.00),+45 in Canada (p= 0.00),but only +16 in Israel (p = 0.20). However, a logistic
regression model with country dummy variables sug-gests that Israeli MPs’ reactions do not differ signif-icantly from the effects seen in Belgium and Canada(see SM).Figure 3 illustrates the impact of low and high ac-
countability levels on risk-taking.Accountability levelshave a variable effect onMPs’ choices across our cases:in Belgium, high levels of political accountability leadto reduced risk-seeking byMPs (-20 percentage points,two-sided t-test p = 0.06); increased political account-ability is associated with more risk-seeking in Canada(+16 percentage points, p = 0.30); and accountabilitylevels are unrelated to Israeli MPs’ risk preferences(change <0.5 percentage points, p = 0.98). Resultsamong citizens confirm no systematic effect for the ac-countability treatment (see SM). We revisit these andrelated findings in a concluding section. For the timebeing, we note that while the impact of accountabilityis complex, the results above suggest that elected offi-cials exhibit framing-induced preference reversal at thesame rate—and, if anything, slightly more—than citi-zens in each country, on the task we evaluate.
STUDY 2: ESCALATING COMMITMENT INFACE OF SUNK COSTS
Escalating commitment as a result of sunk costs is ananomaly that has been studied extensively in multi-ple disciplines (see Sleesman et al. 2012 for a com-prehensive review). Its implications are especially con-sequential in high-level decision making on spendingprograms and projects, and susceptibility to it is oftenseen as having a relationship with being held account-able to a decision (McAfee, Mialon, and Mialon 2010;Simonson and Nye 1992; Teger 1980). However, polit-ical science and economics theories make contrastingarguments on whether heightened accountability re-sults in an escalation of commitment in face of a failedcourse of action or, conversely, in de-escalation and anattenuated susceptibility to sunk cost bias (Dur 2001;Heath 1995; Lerner and Tetlock 1999). Direct empir-ical evidence of politicians’ tendency to exhibit thistendency is absent—it is unclear whether politiciansare better than nonpoliticians at ignoring sunk costs,in line with the rational choice approach to elite deci-sion making, or if they are subject to escalating com-mitment just as nonpoliticians are. An extensive polit-ical science literature has documented policy patternsthat conform with elites exhibiting escalating commit-ment, such as continued spending on failed or finan-cially overrun projects, and cases of prolonged armedconflict. In addition to such indirect evidence, otherstudies have investigated sunk cost effects in the con-text of politics through experiments with nonelite con-venience samples (Boettcher and Cobb 2009; DownsandRocke 1994;Fearon 1997;Simonson and Staw 1992;Taliaferro 2004). It remains unclear what the balance isbetween the individual tendencies of elites and institu-tional incentives towards escalation in accounting forthese policy patterns.
308
Dow
nloa
ded
from
htt
ps://
ww
w.c
ambr
idge
.org
/cor
e. U
nive
rsity
of A
ntw
erp,
on
16 N
ov 2
018
at 1
4:48
:12,
sub
ject
to th
e Ca
mbr
idge
Cor
e te
rms
of u
se, a
vaila
ble
at h
ttps
://w
ww
.cam
brid
ge.o
rg/c
ore/
term
s. h
ttps
://do
i.org
/10.
1017
/S00
0305
5417
0005
69

Nonrepresentative Representatives
FIGURE 2. Proportion of risky choices made by politicians and citizens in the Asian diseaseexperiment, by gains/losses frames, in Belgium, Canada, and Israel.
0.1
.2.3
.4.5
.6.7
.8.9
1
Ris
k−S
eeki
ng P
ropo
rtio
ns (
Pre
dict
ed P
roba
bilit
ies)
Gains LossesAll
Gains LossesBelgium
Gains LossesCanada
Gains LossesIsrael
Notes: Circles denote politicians; diamonds, citizens. Values are predicted probabilities, obtained using Clarify. (See SM for full results.)Bars are 95% confidence intervals. citizens and politicians N: Belgium—515, 82; Canada—515, 43; Israel—505, 29.
FIGURE 3. Proportion of risky choices made by politicians and by citizens in the Asian diseaseexperiment, by low/high accountability treatments, in Belgium, Canada, and Israel.
0.1
.2.3
.4.5
.6.7
.8.9
1
Ris
k−S
eeki
ng P
ropo
rtio
ns (
Pre
dict
ed P
roba
bilit
ies)
Low Ac.High Ac.All
Low Ac. High Ac.Belgium
Low Ac. High Ac.Canada
Low Ac. High Ac.Israel
Notes: Circles denote politicians; diamonds, citizens. Ac.—accountability treatment. Values are predicted probabilities, obtained usingClarify. (See SM for full results.) Bars are 95% confidence intervals. citizens and politicians N: Belgium—515, 82; Canada—515, 43;Israel–505, 29.
309
Dow
nloa
ded
from
htt
ps://
ww
w.c
ambr
idge
.org
/cor
e. U
nive
rsity
of A
ntw
erp,
on
16 N
ov 2
018
at 1
4:48
:12,
sub
ject
to th
e Ca
mbr
idge
Cor
e te
rms
of u
se, a
vaila
ble
at h
ttps
://w
ww
.cam
brid
ge.o
rg/c
ore/
term
s. h
ttps
://do
i.org
/10.
1017
/S00
0305
5417
0005
69

Lior Sheffer et al.
Method
We follow classic work on the subject (Arkes andBlumer 1985; Thaler 1980) by presenting a typicalsunk-cost decision scenario, adapted for a parliamen-tary environment. (See SM for full instrument texts.)Respondents were required to decide on whether tosupport a (hypothetical) one-year extension of a five-year-long small business government loans plan thatwas supposed to return its original $500 million invest-ment, but by the end of its approved period has fallenshort of covering these costs. Extending the program isprojected to cost another $100million,and the relevantgovernment bureaucrats in charge of the program areprojecting that, by the end of the extension, the entireinvestment plus the extra $100 million will be recov-ered. We manipulate the amount of money lost in theoriginal investment ($200/$50 million). We also sepa-rately manipulate the implied level of accountability ofthe decision, either presenting the question as a hypo-thetical,or informing the respondents that the situationis happening a month before the upcoming electionand that the media is interested in their position. Theoutcome of interest is whether respondents decided tosupport the proposed extension of the program or not.This module was implemented in the second round
of MP interviews, in 2015 (N = 382, Belgium—254;Canada—75; Israel—54). It was also administered togeneral population samples from each country in anonline survey. (N= 2791,619,1005 in Belgium,Canada,and Israel, respectively.)
Results
We report three quantities.First, by observing the over-all rate of extension approval amongMPs and compar-ing it to the population base rate, we can determineto what degree MPs exhibit higher escalating com-mitment in this scenario. Second, by looking at varia-tion across the two sunk-cost conditions (the programfalling short of full returns by either $200/$50 million)we can observe to what degree politicians’ reasoningis conditioned by the scale of the sunk cost. Third, bylooking at variation in rates of escalating commitmentby each accountability treatment,we obtain a direct es-timate of the effect of heightened accountability on thelikelihood of committing to the failed financial courseof action we presented.Figure 4 presents a comparison of overall rates of
escalating commitment by both MPs and citizens. Re-sults are predicted probabilities obtained using Clarify,and reported separately for each country and as an ag-gregate figure. Escalating commitment is measured bywhether respondents chose to support the extension ofthe small business loan program. Overall, MPs exhibita substantively very high tendency to support the ex-tension of the program—significantly more so relativeto citizens, across all conditions (83.7% and 71.1%, re-spectively, two-sided t-test p = 0.00). This obtains alsowithin Belgium (84.7% for MPs vs. 69% for citizens,p = 0.00) and Canada (75.2% vs. 59.9%, p = 0.01). In
FIGURE 4. Proportion of politicians andcitizens voting to extend a small loan programin the sunk cost experiment.
.3.4
.5.6
.7.8
.91
Pro
port
ion
Vot
ing
to E
xten
d (P
redi
cted
Pro
babi
litie
s)
All Belgium Canada Israel
Notes: Circles denote politicians, diamonds—citizens. Valuesare predicted probabilities, obtained using Clarify. Bars are95% confidence intervals. Citizens and politicians N: Belgium—2791, 254; Canada—619, 75; Israel—1005, 53.
Israel, the difference is not statistically signifi-cant(89.8% vs. 83.6%, p = 0.22).Manipulating the size of the sunk cost—that is,
changing the investment that has still not beenreturned—results in noticeable, albeit nonsignificantdifferences: MPs’ support for the extension is 85.9%when the return has fallen short by $50 million, andit drops to 80.6% when the shortfall is $200 million.For citizens, there is a much smaller drop, from 71.5%to 70.4%. Neither difference is statistically significant.The left panel in Figure 5 illustrates these results usingpredicted probabilities. In line withHeath (1995), thesefindings suggest a de-escalation of commitment in faceof higher sunk costs among politicians in this scenario.Finally, the right panel in Figure 5 demonstrates the
effect of the accountability treatment on MPs and citi-zens.MPs exhibit a lower willingness to extend the pro-gramwhen accountability is primed—81.1% comparedto 85.7% in the low accountability treatment—but thiseffect does not meet conventional levels of statisticalsignificance (two-sided t-test, p = 0.21). This is simi-lar to the effect observed in citizens, where the sametrend holds, although the percentage point change issmaller—69.6% compared to 72.4% in the low ac-countability condition. This smaller difference, how-ever, is statistically significant (p= 0.03). The impact ofheightened accountability on escalating commitmentby MPs is negative in Belgium (7.5 percentage pointsdecrease) and in Canada (4.5 percentage points), but isreversed in Israel (6.5 percentage points increase).13
13 A potential concern in this task is that politicians who have diver-gent preexisting preferences on government spending might exhibit
310
Dow
nloa
ded
from
htt
ps://
ww
w.c
ambr
idge
.org
/cor
e. U
nive
rsity
of A
ntw
erp,
on
16 N
ov 2
018
at 1
4:48
:12,
sub
ject
to th
e Ca
mbr
idge
Cor
e te
rms
of u
se, a
vaila
ble
at h
ttps
://w
ww
.cam
brid
ge.o
rg/c
ore/
term
s. h
ttps
://do
i.org
/10.
1017
/S00
0305
5417
0005
69

Nonrepresentative Representatives
FIGURE 5. Proportion of politicians and citizens voting to extend a small loan program in the sunkcost experiment, by experimental treatment.
.4.5
.6.7
.8.9
1
Pro
port
ion
Pre
ferr
ing
SQ
(P
redi
cted
Pro
babi
litie
s)
SQ Plan 3+3 SQ Plan 5+5
.4.5
.6.7
.8.9
1
Pro
port
ion
Pre
ferr
ing
SQ
(P
redi
cted
Pro
babi
litie
s)
Low Acc. High Acc.
Notes: Left panel displays results by size of sunk cost. Low sunk cost—investment is short $50 million. High sunk cost—$200 million.Right panel displays results by low or high accountability condition. Circles denote politicians; diamonds, citizens. Values are predictedprobabilities, obtained using Clarify. Bars are 95% confidence intervals. Citizens N = 4415, politicians N = 382.
Overall, MPs exhibit very high levels of escalat-ing commitment in face of (hypothetical) sunk costs,with only weak evidence for responsiveness to themagnitude of the sunk cost. This tendency to “throwgood money after bad” is significantly higher than thatof nonpoliticians faced with the same scenario, andis consistent across all three countries in our sam-ple. Priming accountability moderates the escalationof commitment by politicians in this task, but not toa degree that meets conventional levels of statisticalsignificance.
STUDY 3: FUTURE TIME DISCOUNTING
Our third experiment is focused on the degree towhich elected politicians discount future benefitsrelative to those available to them immediately. Apositive discount rate in the general population—that is, a devaluation of future payoffs relative topresent payoffs—is the overwhelming empirical con-sensus in the literature. Nevertheless, actual discountrates vary greatly by study: in an extensive meta-
opposite responses to the experimental treatments. We are able toevaluate this by leveraging an indicator of self-reported support forgovernment intervention that our MPs responded to in the survey.(See SM for full results.). This analysis does not find any interactionbetween the treatments andMPs’ preferences on government spend-ing. We note that MPs who oppose government intervention in theeconomy are less likely to extend the program described in the sunk-cost module relative to their pro-intervention peers, across the exper-imental treatments. Nevertheless, both groups of politicians exhibitsubstantially higher levels of agreement to extend the program inface of sunk costs relative to nonpoliticians.
analysis on time preference, Frederick, Loewensteinand O’Donoghue (2002) list results that place an-nual discount rates of individuals at anywhere between−6% to 55,700%. This variation is due in part to dif-ferent measures and designs, but it highlights the diffi-culty in obtaining valid baselines for comparison withpoliticians.In the context of policy-related decision making, it
is unclear where politicians are found on this spec-trum. Extant studies that deal with designing long-term policy or with political business cycles usually as-sume an arbitrary level of future time discounting bypoliticians—often increasing in face of elections—butthat rate is rarely specified, and is never directly as-sessed (famously,Alesina 1987;Nordhaus 1975; see alsoDrazen 2000; Jacobs 2008; Levy 2013). In essence, wehave no direct evidence on the relationship elite deci-sion makers have with time-dependent policy choice:Do they discount the future, on average, equally asmuch as nonpoliticians do? Or are they subject to per-sonality or situational effects that makes them valuethe future differently? And if so, as is often assumed,then to what degree? The potential long-term pol-icy implications of having present- or future-orientedpoliticians are profound, especially because we knowvoters substantially discount the future and are impa-tient about postponed outcomes. As Galle (2012, 6)points out, “if both voters and officials are impatient,then there are few obvious market-clearing mecha-nisms bywhich present-biased officials would be drivenfrom office.”Such a future discounting profile by politi-cians, in turn, increases the likelihood of myopic pol-icymaking and suboptimal resource allocation acrosstime.
311
Dow
nloa
ded
from
htt
ps://
ww
w.c
ambr
idge
.org
/cor
e. U
nive
rsity
of A
ntw
erp,
on
16 N
ov 2
018
at 1
4:48
:12,
sub
ject
to th
e Ca
mbr
idge
Cor
e te
rms
of u
se, a
vaila
ble
at h
ttps
://w
ww
.cam
brid
ge.o
rg/c
ore/
term
s. h
ttps
://do
i.org
/10.
1017
/S00
0305
5417
0005
69

Lior Sheffer et al.
One factor that is suspected of contributing to timediscounting by politicians is the future uncertainty in-troduced by having to stand for re-election (and, moregenerally, having to solidify one’s political survival).This is a central motivating factor in many theories thatconsider temporal factors in economic policymaking(Brender and Drazen 2008; Drazen 2000; Franzese Jr.2002; Geddes 1996). In this context, elections are par-ticularly consequential for whether long-term policiesare adopted, especially when political competition isstrong (Garrett 1993; Kayser 2005). We are interestedhere in directly assessing the impact that the presenceor absence of elections has on politicians’ time prefer-ence given a specific choice task.
Method
We employ a “choice game” vignette, commonly usedin economics (Harrison, Lau, and Williams 2002; Har-rison et al. 2005), administered as part of the sec-ond wave of our MP interviews during 2015 (overallmodule N = 300). We also presented the same mod-ule to citizens across the three country cases (moduleN = 3083). In a time discounting choice task, partici-pants are presented with a series of choices betweena proximate-time payoff X and a higher payoff X + C(C > 0), to be received at a predetermined time fur-ther in the future—two years, in the current study. Ineach subsequent choice in the vignette the future pay-off is greater—that is, the value of C increases in eachline. The policy scenario we use revolves around allo-cating funds to build a community centre in the MP’slocality—either a fixed sum that will result in the com-munity centre being opened within six months, or wait-ing two years in promise of a higher investment thatwill result in more facilities and programs offered bythe centre.The choices in this kind of module reveal the degree
to which subjects are willing to wait for future benefits,and therefore offer an estimate of how much they dis-count future payoffs given such a scenario, in a way thatdoes not require introspection or self-report (Fowlerand Kam 2006, 114). If a participant prefers the presentpayoff over some future payoffX+Cl,but in the subse-quent decision prefers the higher future payoffX +Cl ′ ,thenwe infer that the value this individual places on thepresent over waiting two years is contained within thesegment [Cl,Cl ′ ].According to the formulation of hyperbolic dis-
counting used by Thaler (1981), if the “break point”is exactly at Cl, then the annual discount rate for thatindividual i is given by the value of di that solves X =(X +Cl ) × (e−t∗di ), where t is the time horizon. For ex-ample, if for a given individual the value above whichshe will pass on $100 today and agree to wait two yearsis $120,we solve 100 = 120 × (e2di ) and infer an annualdiscount rate of di = 2.4%.
Below is the full text of the instrument used. Werandomly assign participants to either an election or ano-election treatment. The square brackets contain thedifferent texts of the two treatments: the no-election
prime is the text to the left of the “/” sign; the electionprime is the text to the right of the sign:
“Suppose there is a need in your community for a newcommunity building, which will include various recre-ational facilities, like a swimming pool and gymnasium,andservices for families, such as a day care, art classes, and af-ter school programs. There are two options for buildingthe community centre. The first is to build a $10 millioncentre, which would be opened in 6 months. The other op-tion is [to wait for 2 years/to wait for 2 years, until afterthe next election], and dedicate more money to the facility.[Within these 2 years, no election will take place./(empty)]The more money that is dedicated to the facility, the largerthe facilities and the more programming it will be able tooffer.For each of the scenarios below, please tell us whether
you would support building the community centre to openin 6 months, or [in 2 years/in 2 years, after the elections].”
Alternative A Alternative B
$10 million centreopening in 6 months
$10.5 million centre opening[in 2 years/after the next
election].$10 million centre
opening in 6 months$11 million centre opening[in 2 years/after the next
election].$10 million centre
opening in 6 months$12 million centre opening[in 2 years/after the next
election].$10 million centre
opening in 6 months$14 million centre opening[in 2 years/after the next
election].$10 million centre
opening in 6 months$17 million centre opening[in 2 years/after the next
election].$10 million centre
opening in 6 months$20 million centre opening[in 2 years/after the next
election].$10 million centre
opening in 6 months$25 million centre opening[in 2 years/after the next
election].
Results
Our main quantity of interest is the future value forwhich respondents decide to (theoretically) wait twoyears rather than build the (smaller scale) centre toopen in six months.We report how politicians and non-politicians differ on it.14In this task, the mean amount for which MPs de-
cide to wait two years over receiving $10 million in
14 This kind of analysis relies on the assumption that individualshave consistent preferences regarding the future—that is, that oncethey decided to prefer a future payoff, they will continue to do sofor any future payoff higher than that figure. This is not an obviousassumption—see Frederick, Loewenstein, and O’Donoghue (2002)for a discussion—and we indeed observe preference inconsistenciesin both MPs and citizens: 29.6% of MPs (89 out of 300) indicatedpayoff-inconsistent preferences, and so did 50.1% of citizens. Theresults reported here exclude inconsistent respondents, but the pat-terns we observe are generally robust to their inclusion (see SM forcomparison).
312
Dow
nloa
ded
from
htt
ps://
ww
w.c
ambr
idge
.org
/cor
e. U
nive
rsity
of A
ntw
erp,
on
16 N
ov 2
018
at 1
4:48
:12,
sub
ject
to th
e Ca
mbr
idge
Cor
e te
rms
of u
se, a
vaila
ble
at h
ttps
://w
ww
.cam
brid
ge.o
rg/c
ore/
term
s. h
ttps
://do
i.org
/10.
1017
/S00
0305
5417
0005
69

Nonrepresentative Representatives
FIGURE 6. Time-Discounting Module:Proportion of politicians and citizenschoosing to wait two years for added fundingfor a community centre, by the two-yearguaranteed investment, split by electiontreatment.
1020
3040
5060
7080
Pro
port
ion
Cho
osin
g to
Wai
t Tw
o Y
ears
11 12 14 17 20 25Guaranteed Funding After Two Years, in $ million.
Notes: Diamonds, citizens. Circles, politicians. Solid lines rep-resent the no election condition. Dashed lines, election condi-tion. Citizens N = 1, 538, politicians N = 211.
funding at present is $14.3 million. This is similar toa mean value of $14.63 observed in the general popu-lation, and the difference is not statistically significant(two-sided t-test p= 0.20). The resultant annual futurediscount rates are 18% for MPs and 19% for citizens.However, the distribution of tipping points in the pop-ulation of MPs is markedly different from that of citi-zens. Figure 6 plots the proportion of respondents who,in this task, choose to wait two years, by the promisedtwo-year investment size and by the election treatmentconditions.The overall proportion ofMPs who at somepoint opt to switch and “wait” two years, across treat-ments, is 75.18%, while the same figure for citizens is53.95%.This difference is remarkably large, suggestingthat there is a larger proportion of citizens for whomthe two-year present-equivalent value is higher than$25 million, or, put differently, who have an annual fu-ture discount rate higher than 45% when faced withthis decision. This puts the similarity in mean breakvalues between politicians and nonpoliticians into per-spective: it is strongly conditional on the set of optionsavailable to participants.The dissimilarity between politicians and nonpoliti-
cians is further borne out when examining the patternof discounting more closely: a large proportion of MPsdecide to switch at or close to the $14M mean, acrossboth treatment conditions:moving from a future payoffof $12M to $17M, the overall proportion ofMPs choos-ing the future payoff increases from 26.1% to 67.7%—a41.6 percentage point increase. For citizens, the equiv-alent increase is only 25.4 percentage points, and theoverall shift is much more gradual. This illustrates thatwhile MPs and citizens on average have similar future
FIGURE 7. Time-Discounting Module: Meanvalue of the guaranteed future investment onwhich respondents opt to wait two years, byelection treatment, country and sample type.
1015
20
Mea
n S
witc
h V
alue
(P
redi
cted
Pro
babi
litie
s)
N/E
All
E N/E
Belgium
E N/E
Canada
E N/E
Israel
E
Notes: Diamonds, citizens; circles, politicians. N/E is the noelection condition; E, election condition. Values are predictedprobabilities, obtained using Clarify. Bars are 95% confidenceintervals. Citizens N = 1, 538, politicians N = 211.
discount rates in this task, discount rates in the generalpopulation are distributed more uniformly, while MPs’discount rates are closer to being normally distributedaround the $14M mean. A possible interpretation ofthis result is that politicians conform more closely toa specific “type” of future time preference, while non-politicians have more heterogeneous preferences. Thedistributions of the minimal future-switching valuesare indeed substantially different, with a Kolmogorov-Smirnov equality of distributions test returning a valueof p = 0.06, suggesting that the time discounting pat-terns exhibited by politicians and nonpoliticians—atleast, on this specific task—differ significantly (MasseyJr. 1951).
Figure 7 presents the effect of the election treat-ment on the mean amount for which politicians andcitizens indicate that they would wait two years.15 For
15 We reiterate that a manipulation that primes the presence of elec-tions (as opposed to their absence) carries the concern that the treat-ment effect is confounded by changes in other beliefs as a result ofthe manipulation (Dafoe, Zhang, and Caughey 2016): in this case,in the election condition, respondents could be more likely to judgethe described project as part of an electoral business cycle or anattempt to help them buy votes, above and beyond thinking aboutthe same problem as occurring in temporal proximity to elections.One way to preempt such a confound would have been to engagein “abstract encouragement,’ as Dafoe and his colleagues note. Inthe context of studying political elites, however, we are faced with atradeoff: abstracting the task away to that degree loses on our abilityto motivate MPs to think about problems seriously, which is alreadya concern given that we are running vignette experiments instead oflooking at “real life” behavior. Other solutions, such as relying oncomplex vignettes that simulate as if natural experiment conditionsfor respondents were unrealistic to apply given the time constraintselite interviews pose. In light of these considerations, we believe that
313
Dow
nloa
ded
from
htt
ps://
ww
w.c
ambr
idge
.org
/cor
e. U
nive
rsity
of A
ntw
erp,
on
16 N
ov 2
018
at 1
4:48
:12,
sub
ject
to th
e Ca
mbr
idge
Cor
e te
rms
of u
se, a
vaila
ble
at h
ttps
://w
ww
.cam
brid
ge.o
rg/c
ore/
term
s. h
ttps
://do
i.org
/10.
1017
/S00
0305
5417
0005
69

Lior Sheffer et al.
FIGURE 8. Time-Discounting Module: Proportion of politicians and citizens choosing to wait twoyears for added funding for a community center, by the two-year guaranteed investment, acrosscountry cases and election treatment conditions.
1020
3040
5060
7080
9010
0
Pro
port
ion
Cho
osin
g to
Wai
t Tw
o Y
ears
1112 14 17 20 25
Belgium11 12 14 17 20 25
Canada11 12 14 17 20 25
Israel
Guaranteed Funding After Two Years, in $ million.
Notes: Diamonds, citizens. Circles, politicians. Solid lines represent the no election condition. Dashed lines, election condition. Citizensand politicians N: Belgium—899, 130, Canada—231, 52, Israel—408, 29.
politicians, priming election increases the mean valuefrom $14 million to $14.64 million (one-sided t-test p=0.07). Put differently, and as Figure 6 illustrates, intro-ducing an election between present and future choicesresults in a reduced willingness by politicians to waittwo years for the same future payoffs, regardless of thepayoff. The imputed annual discount rate exhibited bypoliticians increases from 16.8% to 19% when elec-tions are primed, serving as a preliminary quantifica-tion of the effect that election-related uncertainty hason politicians’ future discount rates. A similar, albeitmuch smaller, effect obtains for nonpoliticians, wherethe election treatment increases the mean value from$14.52 to $14.74 million, also losing statistical signifi-cance (one-sided t-test p = 0.14). Importantly, for bothMPs and citizens, in both a stripped-down model andone with controls for gender, age, and country fixed ef-fects, the election treatment effect does not meet con-ventional levels of statistical significance (see full re-gression results in the SM). Essentially, we find that,in this specific task, elections have a smaller impacton future discount rates by politicians than is com-monly assumed. This experiment uses a hypotheticaltask and so its external validity–and, in particular, ourability to make a broader claim regarding elections anddiscount rates—is limited, as is characteristic of othertime-discounting measures. Nevertheless, as this is afirst direct investigation of this trait with elected politi-cians who actually engage in elections, and because we
the benefits of engaging in our chosen vignette design outweigh thesepotential concerns.
did observe an effect for this treatment, these resultshighlight the value of further testing how elections alterintertemporal preferences by representatives.Finally, there is substantial variation across our coun-
try cases in politicians’ mean discount rates: meansrange from $13.8M in Canada and $14.02M in Belgiumto $16.63M in Israel. The overall observed distribu-tion pattern of discount rates among politicians (andnonpoliticians) remains similar across country cases, asdemonstrated in Figure 8. The effect of the electionframe on politicians is similar in direction across coun-try cases: mean switch values increase by +$0.43M inBelgium, +$0.64M in Canada, and +$0.36M in Israel.Neither effect is statistically significant.Overall, these results demonstrate that politicians
steeply discount the future—as measured by their will-ingness to wait two years for more funding—but do somuch less than nonpoliticians. These discount rates in-crease when there is a (hypothetical) election betweenthe present and the time of the future outcome,but thisincrease in future devaluation is substantively small onthis specific task,and far inmagnitude fromwhatwouldbe expected if politicians were solely vote-maximizingwith short time horizons.16
16 Note that this difference between politicians and nonpoliticiansmight obtain if politicians perceive 10 million dollars as a relativelysmall amount, but citizens do not; citizens might thus see the commu-nity centre as well-funded either way, and so opt to build it sooner.This would require that citizens do not think about the proportionalgains of waiting, of course, and we are unsure about whether that isaccurate. But we note this as a possibility nonetheless, and suggest itas one area for further study.
314
Dow
nloa
ded
from
htt
ps://
ww
w.c
ambr
idge
.org
/cor
e. U
nive
rsity
of A
ntw
erp,
on
16 N
ov 2
018
at 1
4:48
:12,
sub
ject
to th
e Ca
mbr
idge
Cor
e te
rms
of u
se, a
vaila
ble
at h
ttps
://w
ww
.cam
brid
ge.o
rg/c
ore/
term
s. h
ttps
://do
i.org
/10.
1017
/S00
0305
5417
0005
69
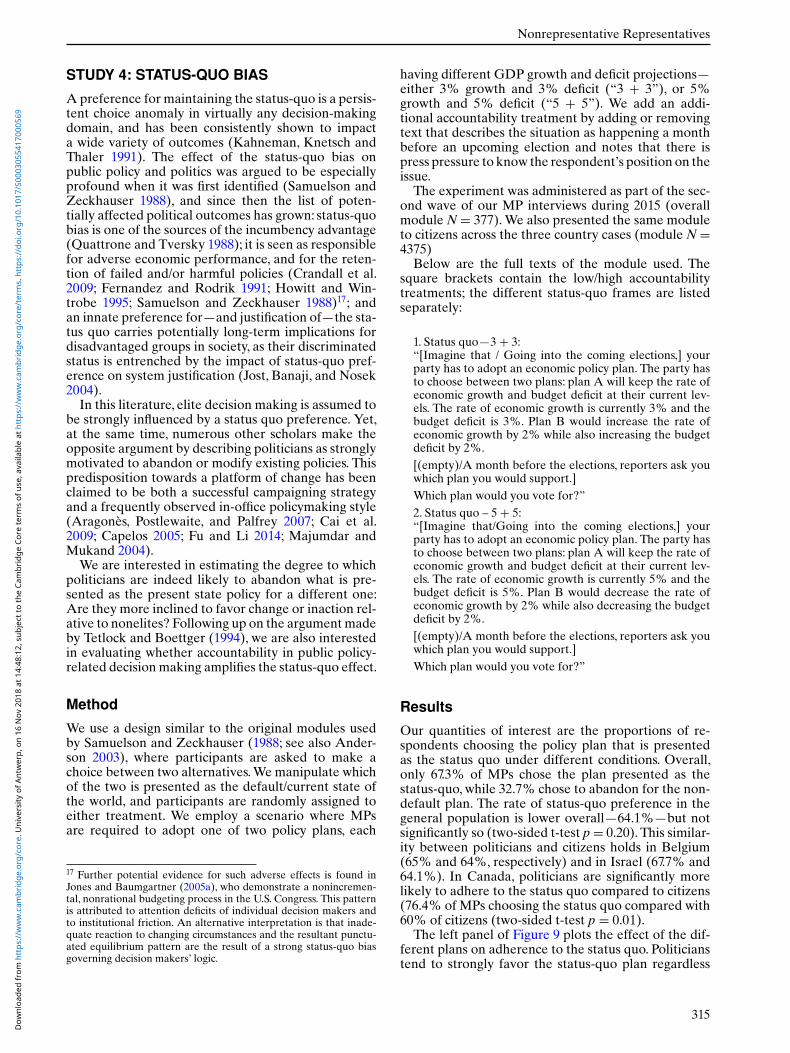
Nonrepresentative Representatives
STUDY 4: STATUS-QUO BIAS
Apreference for maintaining the status-quo is a persis-tent choice anomaly in virtually any decision-makingdomain, and has been consistently shown to impacta wide variety of outcomes (Kahneman, Knetsch andThaler 1991). The effect of the status-quo bias onpublic policy and politics was argued to be especiallyprofound when it was first identified (Samuelson andZeckhauser 1988), and since then the list of poten-tially affected political outcomes has grown: status-quobias is one of the sources of the incumbency advantage(Quattrone and Tversky 1988); it is seen as responsiblefor adverse economic performance, and for the reten-tion of failed and/or harmful policies (Crandall et al.2009; Fernandez and Rodrik 1991; Howitt and Win-trobe 1995; Samuelson and Zeckhauser 1988)17; andan innate preference for—and justification of—the sta-tus quo carries potentially long-term implications fordisadvantaged groups in society, as their discriminatedstatus is entrenched by the impact of status-quo pref-erence on system justification (Jost, Banaji, and Nosek2004).In this literature, elite decision making is assumed to
be strongly influenced by a status quo preference. Yet,at the same time, numerous other scholars make theopposite argument by describing politicians as stronglymotivated to abandon or modify existing policies. Thispredisposition towards a platform of change has beenclaimed to be both a successful campaigning strategyand a frequently observed in-office policymaking style(Aragonès, Postlewaite, and Palfrey 2007; Cai et al.2009; Capelos 2005; Fu and Li 2014; Majumdar andMukand 2004).We are interested in estimating the degree to which
politicians are indeed likely to abandon what is pre-sented as the present state policy for a different one:Are they more inclined to favor change or inaction rel-ative to nonelites? Following up on the argument madeby Tetlock and Boettger (1994), we are also interestedin evaluating whether accountability in public policy-related decisionmaking amplifies the status-quo effect.
Method
We use a design similar to the original modules usedby Samuelson and Zeckhauser (1988; see also Ander-son 2003), where participants are asked to make achoice between two alternatives.We manipulate whichof the two is presented as the default/current state ofthe world, and participants are randomly assigned toeither treatment. We employ a scenario where MPsare required to adopt one of two policy plans, each
17 Further potential evidence for such adverse effects is found inJones and Baumgartner (2005a), who demonstrate a nonincremen-tal, nonrational budgeting process in the U.S. Congress. This patternis attributed to attention deficits of individual decision makers andto institutional friction. An alternative interpretation is that inade-quate reaction to changing circumstances and the resultant punctu-ated equilibrium pattern are the result of a strong status-quo biasgoverning decision makers’ logic.
having different GDP growth and deficit projections—either 3% growth and 3% deficit (“3 + 3”), or 5%growth and 5% deficit (“5 + 5”). We add an addi-tional accountability treatment by adding or removingtext that describes the situation as happening a monthbefore an upcoming election and notes that there ispress pressure to know the respondent’s position on theissue.The experiment was administered as part of the sec-
ond wave of our MP interviews during 2015 (overallmodule N = 377).We also presented the same moduleto citizens across the three country cases (module N =4375)Below are the full texts of the module used. The
square brackets contain the low/high accountabilitytreatments; the different status-quo frames are listedseparately:
1. Status quo—3 + 3:“[Imagine that / Going into the coming elections,] yourparty has to adopt an economic policy plan. The party hasto choose between two plans: plan A will keep the rate ofeconomic growth and budget deficit at their current lev-els. The rate of economic growth is currently 3% and thebudget deficit is 3%. Plan B would increase the rate ofeconomic growth by 2% while also increasing the budgetdeficit by 2%.[(empty)/A month before the elections, reporters ask youwhich plan you would support.]Which plan would you vote for?”2. Status quo – 5 + 5:“[Imagine that/Going into the coming elections,] yourparty has to adopt an economic policy plan. The party hasto choose between two plans: plan A will keep the rate ofeconomic growth and budget deficit at their current lev-els. The rate of economic growth is currently 5% and thebudget deficit is 5%. Plan B would decrease the rate ofeconomic growth by 2% while also decreasing the budgetdeficit by 2%.[(empty)/A month before the elections, reporters ask youwhich plan you would support.]Which plan would you vote for?”
Results
Our quantities of interest are the proportions of re-spondents choosing the policy plan that is presentedas the status quo under different conditions. Overall,only 67.3% of MPs chose the plan presented as thestatus-quo, while 32.7% chose to abandon for the non-default plan. The rate of status-quo preference in thegeneral population is lower overall—64.1%—but notsignificantly so (two-sided t-test p= 0.20). This similar-ity between politicians and citizens holds in Belgium(65% and 64%, respectively) and in Israel (67.7% and64.1%). In Canada, politicians are significantly morelikely to adhere to the status quo compared to citizens(76.4% of MPs choosing the status quo compared with60% of citizens (two-sided t-test p = 0.01).
The left panel of Figure 9 plots the effect of the dif-ferent plans on adherence to the status quo. Politicianstend to strongly favor the status-quo plan regardless
315
Dow
nloa
ded
from
htt
ps://
ww
w.c
ambr
idge
.org
/cor
e. U
nive
rsity
of A
ntw
erp,
on
16 N
ov 2
018
at 1
4:48
:12,
sub
ject
to th
e Ca
mbr
idge
Cor
e te
rms
of u
se, a
vaila
ble
at h
ttps
://w
ww
.cam
brid
ge.o
rg/c
ore/
term
s. h
ttps
://do
i.org
/10.
1017
/S00
0305
5417
0005
69
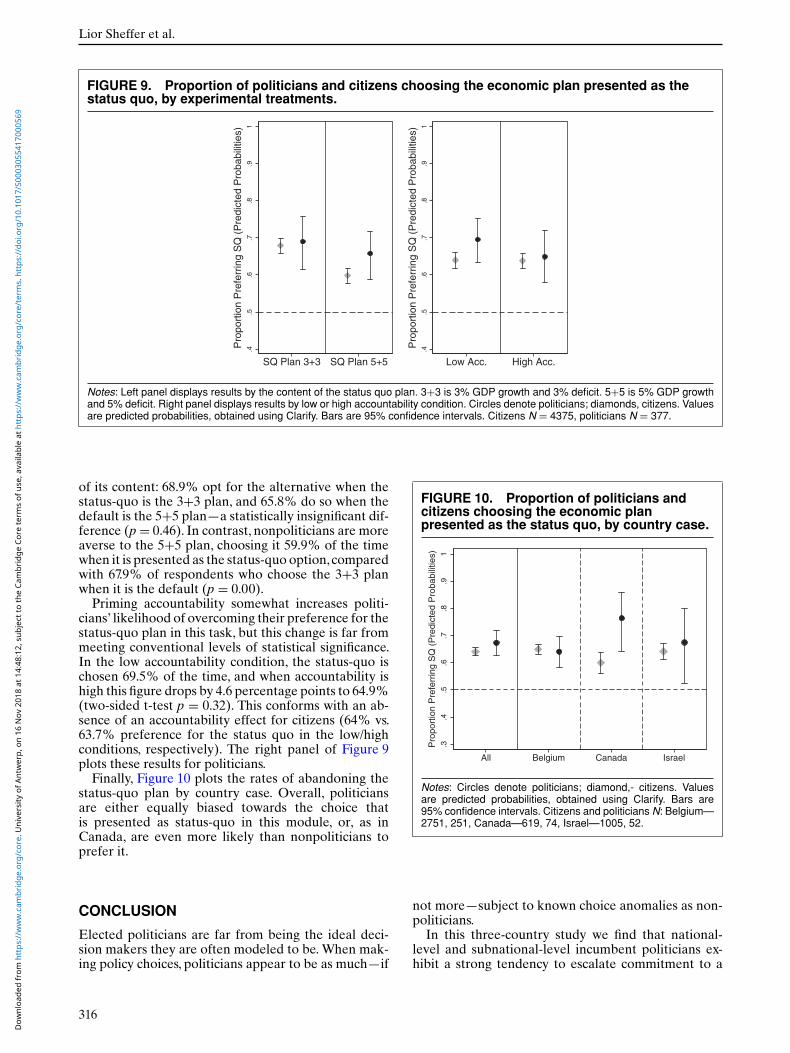
Lior Sheffer et al.
FIGURE 9. Proportion of politicians and citizens choosing the economic plan presented as thestatus quo, by experimental treatments.
.4.5
.6.7
.8.9
1
Pro
port
ion
Pre
ferr
ing
SQ
(P
redi
cted
Pro
babi
litie
s)
SQ Plan 3+3 SQ Plan 5+5
.4.5
.6.7
.8.9
1
Pro
port
ion
Pre
ferr
ing
SQ
(P
redi
cted
Pro
babi
litie
s)
Low Acc. High Acc.
Notes: Left panel displays results by the content of the status quo plan. 3+3 is 3% GDP growth and 3% deficit. 5+5 is 5% GDP growthand 5% deficit. Right panel displays results by low or high accountability condition. Circles denote politicians; diamonds, citizens. Valuesare predicted probabilities, obtained using Clarify. Bars are 95% confidence intervals. Citizens N = 4375, politicians N = 377.
of its content: 68.9% opt for the alternative when thestatus-quo is the 3+3 plan, and 65.8% do so when thedefault is the 5+5 plan—a statistically insignificant dif-ference (p= 0.46). In contrast, nonpoliticians are moreaverse to the 5+5 plan, choosing it 59.9% of the timewhen it is presented as the status-quo option,comparedwith 67.9% of respondents who choose the 3+3 planwhen it is the default (p = 0.00).Priming accountability somewhat increases politi-
cians’ likelihood of overcoming their preference for thestatus-quo plan in this task, but this change is far frommeeting conventional levels of statistical significance.In the low accountability condition, the status-quo ischosen 69.5% of the time, and when accountability ishigh this figure drops by 4.6 percentage points to 64.9%(two-sided t-test p = 0.32). This conforms with an ab-sence of an accountability effect for citizens (64% vs.63.7% preference for the status quo in the low/highconditions, respectively). The right panel of Figure 9plots these results for politicians.Finally, Figure 10 plots the rates of abandoning the
status-quo plan by country case. Overall, politiciansare either equally biased towards the choice thatis presented as status-quo in this module, or, as inCanada, are even more likely than nonpoliticians toprefer it.
CONCLUSION
Elected politicians are far from being the ideal deci-sion makers they are often modeled to be.When mak-ing policy choices, politicians appear to be as much—if
FIGURE 10. Proportion of politicians andcitizens choosing the economic planpresented as the status quo, by country case.
.3.4
.5.6
.7.8
.91
Pro
port
ion
Pre
ferr
ing
SQ
(P
redi
cted
Pro
babi
litie
s)
All Belgium Canada Israel
Notes: Circles denote politicians; diamond,- citizens. Valuesare predicted probabilities, obtained using Clarify. Bars are95% confidence intervals. Citizens and politicians N: Belgium—2751, 251, Canada—619, 74, Israel—1005, 52.
not more—subject to known choice anomalies as non-politicians.In this three-country study we find that national-
level and subnational-level incumbent politicians ex-hibit a strong tendency to escalate commitment to a
316
Dow
nloa
ded
from
htt
ps://
ww
w.c
ambr
idge
.org
/cor
e. U
nive
rsity
of A
ntw
erp,
on
16 N
ov 2
018
at 1
4:48
:12,
sub
ject
to th
e Ca
mbr
idge
Cor
e te
rms
of u
se, a
vaila
ble
at h
ttps
://w
ww
.cam
brid
ge.o
rg/c
ore/
term
s. h
ttps
://do
i.org
/10.
1017
/S00
0305
5417
0005
69

Nonrepresentative Representatives
failed course of action in the face of hypothetical sunkcosts—significantly more so than nonpoliticians—andthat priming accountability only marginally reducesthis tendency. These politicians also adhere verystrongly to policy choices in vignettes where theyare presented as the status quo, above and beyondthe substantive content of the policy. We further findthat politicians favor risk-seeking when faced withpolicy choices with varying levels of uncertainty—consistently more so than the citizens who elect themacross our country cases. We also observe that, likenonpoliticians, politicians’ risk calculus when makingsuch choices is strongly subject to framing effects. Fi-nally, these elected politicians exhibit a distinct futuretime-discounting preference when faced with a sce-nario that involves present–future spending tradeoffs.This preference is surprisingly similar across the threecountry cases examined in this paper, and it consis-tently distinguishes politicians from the general pop-ulations that elect them. The patterns we observe alsohold when we limit our citizen comparison group to in-dividuals who were propensity-matched to MPs basedon age and gender (see full analysis in the SM), suggest-ing that demographic-based selection effects do notalone account for these results.Do our results point to contexts in which we
should expect politicians’ decision-making to reflectfewer choice anomalies or more classically “rational”decision-making?Wehave explored at least one poten-tial source of variation in politicians’ incentives here;namely, accountability. The impact of accountability isin each case inconclusive, however. In the scenarios weevaluated, accountability decreases only slightly thestatus-quo bias; it appears to matter little for futuretime discounting or for sunken costs; and while itreduces risk-seeking among Belgian MPs, it increasesrisk-seeking among Canadian MPs, and has no impacton Israeli MPs. We have captured accountability inonly one way in each instance, of course, and futuretests may well yield more powerful evidence of theimpact of accountability on the prevalence of choiceanomalies.For the time being, there are few indicationshere of conditions that might augment or diminish theimpact of these choice anomalies on elected officials’decision making.The impact of accountability is just one of many ar-
eas in which future work is warranted. We have ex-plored each of four choice anomalies through just fourmodules, after all.We have varied policy domains fromone task to the next, but we still cannot be sure thatour results for each choice anomaly will hold for allpossible policy domains. Nor can we be fully confi-dent that our results do not vary across different po-litical/electoral systems.We see some between-countrydifferences here, but they are, for the most part, small;and, in any case, while our use of three countries al-lows for some claims about the generalizability of ourfindings, it does not provide the leverage necessary toexplore the impact that political institutions may haveon choice anomalies.Do proportional systems in whichincumbent politiciansmay have longer political careersencourage politicians to have lower time-discounting
rates? We cannot answer this, nor many related ques-tions, here.We have nevertheless demonstrated the potential
significance of choice anomalies to understanding po-litical decision making. Our results provide a first di-rect comparison of common choice anomalies betweenpoliticians and nonpoliticians. In so doing, they high-light potential inadequacies in political science theo-ries that do not take into account such patterns—eitherby assuming that elite decision makers are optimallystrategic and rational as their starting point (influentialexamples include Dewan and Dowding 2005; Downsand Rocke 1994; Fearon 1995, 1997; Putnam 1988; Ro-goff 1990; Tsebelis 1990, 2002) or by ascribing to thembehavioral patterns observed in convenience sampleswithout accounting for potential systematic differencesbetween them and the politicians under study (Jonesand Baumgartner 2005b; Jervis 1992; Jones 2001; Mc-Dermott 2001).Updating such assumptions can be par-ticularly useful to our understanding of the causes ofimportant political outcomes. If politicians do not havestable risk preferences, then the likelihood of engag-ing in international armed conflict, or of escalating do-mestic crises, is probably more complex to predict andshould involve a closer inspection of decision framesand reference points than what is present in severalcurrent accounts. If politicians discount the future lessthan some models assume, then phenomena that arenormally explained by relying on this tendency, suchas electoral business cycles, may warrant an exami-nation of additional causes. And if politicians have astrong status-quo preference—even stronger than thatof citizens—then models of the policy process that seeelites as indifferent to, or even eager for, change (likethe arguments for public responsiveness and dynamicrepresentations) should revisit the motivation for theirexpectations and the factors that produce them in lightof these findings.Looking forward, our understanding of elite behav-
ior would benefit from several extensions: there is stilla long list of behaviors for which we might expect dif-ferences between politicians and nonpoliticians, andthat would therefore benefit from direct measurementwith elites, such as levels of other-regarding think-ing, choice overconfidence, and cooperative behavior(Hafner-Burton, Hughes, and Victor 2013); and thereis much to learn by expanding the scope of this kindof research to different institutional environments—whether in different countries or other levels of gov-ernment. In undertaking this challenge, future studieswould benefit from addressing concerns regarding con-founding in survey experiments with elites, as much aspossible.Importantly, there is much to explore in terms of un-
derstanding the determinants of the patterns we ob-serve. The extant literature fleshes out three categoriesof factors that feed into the uniqueways inwhich politi-cians employ heuristics and are subject to decision bi-ases. First, how politicians conduct themselves in officemay be the result of selection effects that increase thelikelihood of specific types of people winning office andsubsequently exhibiting more (or less) of a certain bias
317
Dow
nloa
ded
from
htt
ps://
ww
w.c
ambr
idge
.org
/cor
e. U
nive
rsity
of A
ntw
erp,
on
16 N
ov 2
018
at 1
4:48
:12,
sub
ject
to th
e Ca
mbr
idge
Cor
e te
rms
of u
se, a
vaila
ble
at h
ttps
://w
ww
.cam
brid
ge.o
rg/c
ore/
term
s. h
ttps
://do
i.org
/10.
1017
/S00
0305
5417
0005
69

Lior Sheffer et al.
or heuristic in their decision making. This is importantnot only in the context of differences in fundamentalpersonality profiles, but also when looking at socioeco-nomic and demographic determinants of selection intooffice that are known to affect the behavior of electedpoliticians, such as gender (Swers 2002; Wängnerud2009), race, education, socialization, and economic at-tainment (Broockman 2014;Grose 2011;Lawless 2012;Norris and Lovenduski 1995)—some of which are sig-nificant predictors of the outcomes we report here.Thiskind of subgroup analysis is an important and natu-ral extension of our line of research. Second, learningand expertise that is accumulated while in office canalter representatives’ behavior in systematic and pre-dictable ways. This experience-based differentiation istoo an important predictor of differences in decision-making preferences within the population of electedpoliticians, and its discussion is beyond the scope ofthis paper. Third, causes related to the unique envi-ronment politicians operate in—and specifically the id-iosyncratic effect of being held publicly accountableas a political office holder—can incentivize the adop-tion of some of the behaviors we observe. Pinning theexact causal weight of each of these three categorieson behaviors that politicians engage in while in officecan contribute greatly to our understanding of decisionmaking by incumbents. Subsequently, these findingscan and should inform ongoing efforts to reshape in-stitutions to improve decision-making quality, respon-siveness, and accountability.
SUPPLEMENTARY MATERIAL
To view supplementary material for this article, pleasevisit https://doi.org/10.1017/S0003055417000569.Replication materials can be found on Dataverse at
https://doi.org/10.7910/DVN/E7OQEY.
REFERENCES
Aberbach, Joel D., Robert D. Putnam, and Bert A. Rockman. 1981.Bureaucrats and Politicians in Western Democracies. Cambridge,MA:Harvard University Press.
Alesina, Alberto. 1987. “Macroeconomic Policy in a Two-Party Sys-tem as a Repeated Game.” The Quarterly Journal of Economics102 (3): 651–78.
Anderson, Christopher J. 2003. “The Psychology of Doing Nothing:Forms of Decision Avoidance Result from Reason and Emotion.”Psychological Bulletin 129 (1): 139.
Aragonès, Enriqueta, Andrew Postlewaite, and Thomas Palfrey.2007. “Political Reputations and Campaign Promises.” Journal ofthe European Economic Association 5 (4): 846–84.
Arceneaux, Kevin. 2012. “Cognitive Biases and the Strength of Po-litical Arguments.” American Journal of Political Science 56 (2):271–85.
Arkes,Hal R., and Catherine Blumer. 1985.“The Psychology of SunkCost.”Organizational Behavior andHumanDecision Processes 35(1): 124–40.
Arnold, R. Douglas. 1992. The Logic of Congressional Action. NewHaven, CT: Yale University Press.
Ashworth,Scott.2012.“ElectoralAccountability:Recent Theoreticaland Empirical Work.”Annual Review of Political Science 15: 183–201.
Axelrod, Robert. 2015. Structure of Decision: The Cognitive Maps ofPolitical Elites. Princeton, NJ: Princeton University Press.
Barbosa,Saulo Dubard,MeganW.Gerhardt,and Jill RichardKickul.2007. “The Role of Cognitive Style and Risk Preference on En-trepreneurial Self-Efficacy and Entrepreneurial Intentions.” Jour-nal of Leadership & Organizational Studies 13 (4): 86–104.
Baron, David P., and John A. Ferejohn. 1989. “Bargaining in Legisla-tures.”American Political Science Review 83 (04): 1181–206.
Baumgartner, Frank R., and Bryan D. Jones. 1993. Agendas and In-stability in American Politics. Chicago, IL: University of ChicagoPress.
Best, Heinrich. 2011. “Does Personality Matter in Politics? Person-ality Factors as Determinants of Parliamentary Recruitment andPolicy Preferences.”Comparative Sociology 10 (6): 928–48.
Boettcher,William A. 2004. “The Prospects for Prospect Theory:AnEmpirical Evaluation of International Relations Applications ofFraming and Loss Aversion.”Political Psychology 25 (3): 331–62.
Boettcher,William A., and Michael D.Cobb. 2009. “Don’t Let ThemDie in Vain Casualty Frames and Public Tolerance for EscalatingCommitment in Iraq.”Journal of Conflict Resolution 53 (5):677–97.
Brender, Adi, and Allan Drazen. 2008. “How do Budget Deficitsand Economic Growth Affect Reelection Prospects? Evidencefrom aLarge Panel of Countries.”TheAmericanEconomic Review98 (5): 2203–20.
Broockman,David E. 2014. “Mobilizing Candidates: Political ActorsStrategically Shape the Candidate Pool with Personal Appeals.”Journal of Experimental Political Science 1 (02): 104–19.
Broockman, David E., and Daniel M. Butler. 2017. “The Causal Ef-fects of Elite Position-Taking on Voter Attitudes: Field Experi-ments with Elite Communication.” American Journal of PoliticalScience 61 (1): 208–21.
Bueno de Mesquita, Bruce. 2013.Principles of International Politics.Thousand Oaks, CA: Sage.
Bueno de Mesquita, Bruce, and Randolph M. Siverson. 1995. “Warand the Survival of Political Leaders: A Comparative Study ofRegime Types and Political Accountability.” American PoliticalScience Review 89 (04): 841–55.
Butler, Daniel M., and Adam M.Dynes. 2016. “How Politicians Dis-count the Opinions of Constituents with Whom They Disagree.”American Journal of Political Science 60 (4): 975–89.
Butler, Daniel M., Christopher F. Karpowitz, and Jeremy C. Pope.2012. “A Field Experiment on Legislators Home Styles: Serviceversus Policy.”The Journal of Politics 74 (02): 474–86.
Cai, Hongbin and Daniel Treisman 2009. “Political Decentralizationand Policy Experimentation.” Quarterly Journal of Political Sci-ence 4 (1): 35–58.
Camerer,Colin F.,RobinM.Hogarth,David V.Budescu, and Cather-ine Eckel. 1999. The Effects of Financial Incentives in Experi-ments: A Review and Capital-Labor-Production Framework. InElicitation of Preferences. New York, NY: Springer, 7–48.
Capelos, Tereza. 2005. Shield or Stinger: The Role of Party Bondsand Competence Evaluations in Political Predicaments. TechnicalReport, University of Surrey.
Caprara, Gian Vittorio, Claudio Barbaranelli, Chiara Consiglio,Laura Picconi, and Philip G. Zimbardo. 2003. “Personalities ofPoliticians and Voters: Unique and Synergistic Relationships.”Journal of Personality and Social Psychology 84 (4): 849.
Caprara, Gianvittorio, Donata Francescato, Minou Mebane,Roberta Sorace, and Michele Vecchione. 2010. “PersonalityFoundations of Ideological Divide: A Comparison of WomenMembers of Parliament and Women Voters in Italy.” PoliticalPsychology 31 (5): 739–62.
Chabris, Christopher F., David Laibson, Carrie L. Morris, JonathonP. Schuldt, and Dmitry Taubinsky. 2008. “Individual Laboratory-MeasuredDiscount Rates Predict Field Behavior.” Journal of Riskand Uncertainty 37 (2-3): 237.
Chong, Dennis, and James N. Druckman. 2007. “Framing Theory.”Annu. Rev. Polit. Sci. 10: 103–26.
Crandall, Christian S., Scott Eidelman, Linda J. Skitka, and G.Scott Morgan. 2009. “Status Quo Framing Increases Support forTorture.” Social Influence 4 (1): 1–10.
Dafoe, Allan. 2011. “Statistical Critiques of the Democratic Peace:Caveat Emptor.”American Journal of Political Science 55 (2): 247–62.
Dafoe, Allan, Baobao Zhang, and Devin Caughey. 2016. “Con-founding in Survey Experiments: Diagnostics and Solutions.”Manuscript. http://www.allandafoe.com/confounding.
318
Dow
nloa
ded
from
htt
ps://
ww
w.c
ambr
idge
.org
/cor
e. U
nive
rsity
of A
ntw
erp,
on
16 N
ov 2
018
at 1
4:48
:12,
sub
ject
to th
e Ca
mbr
idge
Cor
e te
rms
of u
se, a
vaila
ble
at h
ttps
://w
ww
.cam
brid
ge.o
rg/c
ore/
term
s. h
ttps
://do
i.org
/10.
1017
/S00
0305
5417
0005
69

Nonrepresentative Representatives
Dewan, Torun, and Keith Dowding. 2005. “The Corrective Effect ofMinisterial Resignations on Government Popularity.” AmericanJournal of Political Science 49 (1): 46–56.
Dewan, Torun, and Arthur Spirling. 2011. “Strategic Opposition andGovernment Cohesion in Westminster Democracies.” AmericanPolitical Science Review 105 (02): 337–58.
Dietrich,Bryce J.,Scott Lasley, Jeffery J.Mondak,MeganL.Remmel,and Joel Turner. 2012. “Personality and Legislative Politics: TheBig Five Trait Dimensions among U.S. State Legislators.”PoliticalPsychology 33 (2): 195–210.
DiRenzo, Gordon J. 1967. “Professional Politicians and PersonalityStructures.”American Journal of Sociology 73 (2): 217–25.
Downs, George W., and David M. Rocke. 1994. “Conflict, Agency,and Gambling for Resurrection: The Principal-Agent Problemgoes to War.” American Journal of Political Science 38 (2): 362–80.
Drazen, Allan. 2000. “The Political Business Cycle after 25 Years.”NBERMacroeconomics Annual 15: 75–117.
Druckman, James N. 2001. “The Implications of Framing Effects forCitizen Competence.”Political Behavior 23 (3): 225–56.
Druckman, James N. 2004. “Political Preference Formation: Com-petition, Deliberation, and the (Ir)relevance of Framing Effects.”American Political Science Review 98 (04): 671–86.
Druckman, James N., Donald P. Green, James H. Kuklinski, andArthur Lupia. 2006. “The Growth and Development of Experi-mental Research in Political Science.” American Political ScienceReview 100 (04): 627–35.
Druckman, James N., and Arthur Lupia. 2000. “Preference Forma-tion.”Annual Review of Political Science 3 (1): 1–24.
Druckman, James N., and Arthur Lupia. 2012. “Experimenting withPolitics.” Science 335 (6073): 1177–9.
Druckman, James N., and Rose McDermott. 2008. “Emotion andthe Framing of Risky Choice.” Political Behavior 30 (3): 297–321.
Dunleavy,Patrick. 2014.Democracy,Bureaucracy and Public Choice:Economic Approaches in Political Science. New York, NY: Rout-ledge.
Dur, Robert A. J. 2001. “Why do Policy Makers Stick to InefficientDecisions?”Public Choice 107 (3-4): 221–34.
Edwards, George C., and B. Dan Wood. 1999. “Who InfluencesWhom? The President, Congress, and the Media.” American Po-litical Science Review 93 (02): 327–44.
Enemark, Daniel, Clark C. Gibson, Mathew D. McCubbins, andBrigitte Seim. 2016. “Effect of Holding Office on the Behavior ofPoliticians.” Proceedings of the National Academy of Sciences 113(48): 13690–5.
Fatas, Enrique, Tibor Neugebauer, and Pilar Tamborero. 2007. “HowPoliticians Make Decisions:A Political Choice Experiment.” Jour-nal of Economics 92 (2): 167–96.
Fearon, James D. 1995. “Rationalist Explanations for War.” Interna-tional Organization 49 (03): 379–414.
Fearon, James D. 1997. “Signaling Foreign Policy Interests TyingHands versus Sinking Costs.” Journal of Conflict Resolution 41 (1):68–90.
Fearon, James D. 1999. “Electoral Accountability and the Control ofPoliticians: Selecting Good Types versus Sanctioning Poor Perfor-mance.”Democracy, Accountability, and Representation 55: 61.
Feldman, Ofer. 1996. “The Political Personality of Japan: An Inquiryinto the Belief Systems of Diet Members.” Political Psychology17 (4): 657–82.
Fernandez, Raquel, and Dani Rodrik. 1991. “Resistance to Reform:Status Quo Bias in the Presence of Individual-Specific Uncer-tainty.”The American Economic Review, 1146–55.
Fowler, James H., and Cindy D. Kam. 2006. “Patience as a PoliticalVirtue: Delayed Gratification and Turnout.” Political Behavior 28(2): 113–28.
Franzese Jr, Robert J. 2002. “Electoral and Partisan Cycles in Eco-nomic Policies and Outcomes.”Annual Review of Political Science5 (1): 369–421.
Fréchette, Guillaume R. 2011. “Laboratory Experiments: Profes-sionals versus Students.’ Available at SSRN: https://ssrn.com/abstract=1939219 or https://doi.org/10.2139/ssrn.1939219.
Frederick, Shane,George Loewenstein, and Ted O’Donoghue. 2002.“TimeDiscounting and Time Preference:ACritical Review.” Jour-nal of Economic Literature 40 (2): 351–401.
Fu,Qiang,andMing Li. 2014. “Reputation-Concerned PolicyMakersand Institutional Status Quo Bias.” Journal of Public Economics110: 15–25.
Galle, Brian D. 2012. “Myopia, Fiscal Federalism, and Unemploy-ment Insurance: Time to Reform UI Financing.” Boston CollegeLaw School Legal Studies Research Paper (265).
Garrett, Geoffrey. 1993. “The Politics of Structural Change SwedishSocial Democracy and Thatcherism in Comparative Perspective.”Comparative Political Studies 25 (4): 521–47.
Geddes,Barbara. 1996.Politician’s Dilemma:Building State Capacityin Latin America. Vol. 25, Berkeley, CA: University of CaliforniaPress.
Gerber, Alan S., Gregory A. Huber, David Doherty, and ConorM.Dowling. 2011. “The Big Five Personality Traits in the PoliticalArena.”Annual Review of Political Science 14: 265–87.
Ghadim, Amir K. Abadi, David J. Pannell, and Michael P. Burton.2005. “Risk, Uncertainty, and Learning in Adoption of a Crop In-novation.”Agricultural Economics 33 (1): 1–9.
Gilovich,Thomas,DaleGriffin,andDaniel Kahneman.2002.Heuris-tics and Biases: The Psychology of Intuitive Judgment. New York,NY: Cambridge University Press.
Green,Donald P., Bradley Palmquist, and Eric Schickler. 2004.Parti-san Hearts and Minds: Political Parties and the Social Identities ofVoters. New Haven, CT: Yale University Press.
Greenstein, Fred I. 2004. The Presidential Difference: LeadershipStyle from FDR to George W. Bush. Princeton, NJ: Princeton Uni-versity Press.
Grose, Christian R. 2011. Congress in Black and White: Race andRepresentation in Washington and at Home. New York, NY: Cam-bridge University Press.
Grose, Christian R., Neil Malhotra, and Robert Parks Van Houwel-ing. 2015. “Explaining Explanations: How Legislators Explaintheir Policy Positions and How Citizens React.”American Journalof Political Science 59 (3): 724–43.
Hafner-Burton, Emilie M., D. Alex Hughes, and David G. Victor.2013. “The Cognitive Revolution and the Political Psychologyof Elite Decision Making.” Perspectives on Politics 11 (02): 368–86.
Hall, Peter A., and Rosemary C. R. Taylor. 1996. “Political Scienceand the Three New Institutionalisms.”Political Studies 44 (5): 936–57.
Harrison, Glenn W., Morten I. Lau, E. Elisabet Rutström, and Mel-onie B. Sullivan. 2005. “Eliciting Risk and Time Preferences Us-ing Field Experiments: SomeMethodological Issues.”Field Exper-iments in Economics 10: 125–218.
Harrison, Glenn W., Morten I. Lau, and Melonie B. Williams. 2002.“Estimating Individual Discount Rates in Denmark: A Field Ex-periment.”The American Economic Review 92 (5): 1606–17.
Healy,Andrew, and Neil Malhotra. 2013. “Retrospective Voting Re-considered.”Annual Review of Political Science 16: 285–306.
Heath, Chip. 1995. “Escalation and De-escalation of Commitmentin Response to Sunk Costs: The Role of Budgeting in MentalAccounting.”Organizational Behavior and Human Decision Pro-cesses 62 (1): 38–54.
Heß, Moritz, Christian von Scheve, Jürgen Schupp, and Gert Wag-ner. 2013. “Members of German Federal Parliament More Risk-Loving Than General Population.’ SOEP Paper No. 546.Availableat SSRN: https://ssrn.com/abstract=2253836 or https://doi.org/10.2139/ssrn.2253836.
Hogarth, Robin M. 2002. “Deciding Analytically or Trusting YourIntuition? The Advantages and Disadvantages of Analytic andIntuitive Thought.’ UPF Economics and Business Working PaperNo. 654. Available at SSRN: https://ssrn.com/abstract=394920 orhttps://doi.org/10.2139/ssrn.394920.
Howitt, Peter, and Ronald Wintrobe. 1995. “The Political Economyof Inaction.” Journal of Public Economics 56 (3): 329–53.
Jacobs, Alan M. 2008. “The Politics of When: Redistribution, Invest-ment and Policy Making for the Long Term.” British Journal ofPolitical Science 38 (02): 193–220.
Jacobs,Alan M. 2011.Governing for the Long Term:Democracy andthe Politics of Investment.Cambridge:CambridgeUniversity Press.
Jervis, Robert. 1992. “Political Implications of Loss Aversion.” Polit-ical Psychology 13 (2): 187–204.
Jervis, Robert. 2015. Perception and Misperception in InternationalPolitics. Princeton, NJ: Princeton University Press.
319
Dow
nloa
ded
from
htt
ps://
ww
w.c
ambr
idge
.org
/cor
e. U
nive
rsity
of A
ntw
erp,
on
16 N
ov 2
018
at 1
4:48
:12,
sub
ject
to th
e Ca
mbr
idge
Cor
e te
rms
of u
se, a
vaila
ble
at h
ttps
://w
ww
.cam
brid
ge.o
rg/c
ore/
term
s. h
ttps
://do
i.org
/10.
1017
/S00
0305
5417
0005
69

Lior Sheffer et al.
Johnson, Dominic D. P., Rose McDermott, Emily S. Barrett,Jonathan Cowden, Richard Wrangham, Matthew H. McIntyre,and Stephen Peter Rosen. 2006. “Overconfidence in Wargames:Experimental Evidence on Expectations, Aggression, Genderand Testosterone.” Proceedings of the Royal Society B: BiologicalSciences 273 (1600): 2513–20.
Jones, Bryan D. 2001. Politics and the Architecture of Choice:Bounded Rationality and Governance. Chicago, IL: University ofChicago Press.
Jones, Bryan D. 2003. “Bounded Rationality and Political Science:Lessons from Public Administration and Public Policy.” Jour-nal of Public Administration Research and Theory 13 (4): 395–412.
Jones, Bryan D. and Frank R. Baumgartner. 2005a. “A Model ofChoice for Public Policy.” Journal of Public Administration Re-search and Theory 15 (3): 325–51.
Jones, Bryan D., and Frank R. Baumgartner. 2005b. The Politics ofAttention: How Government Prioritizes Problems. Chicago, IL:University of Chicago Press.
Jost, John T., Mahzarin R. Banaji, and Brian A. Nosek. 2004. “ADecade of System Justification Theory: Accumulated Evidence ofConscious and Unconscious Bolstering of the Status Quo.”Politi-cal Psychology 25 (6): 881–919.
Kahneman, Daniel. 2011. Thinking, Fast and Slow. New York, NY:Farrar, Straus and Giroux.
Kahneman, Daniel, Jack L. Knetsch, and Richard H. Thaler. 1991.“Anomalies: The Endowment Effect, Loss Aversion, and StatusQuo Bias.”The Journal of Economic Perspectives 5 (1): 193–206.
Kalla, Joshua L., and David E.Broockman. 2016. “Campaign Contri-butions Facilitate Access to Congressional Officials: A Random-ized Field Experiment.” American Journal of Political Science 60(3): 545–58.
Kanwisher, Nancy. 1989. “Cognitive Heuristics and American Secu-rity Policy.” Journal of Conflict Resolution 33 (4): 652–75.
Kayser, Mark Andreas. 2005. “Who Surfs, Who Manipulates? TheDeterminants of Opportunistic Election Timing and ElectorallyMotivated Economic Intervention.” American Political ScienceReview 99 (01): 17–27.
Kingdon,John W.1989.Congressmen’s VotingDecisions.AnnArbor,MI: University of Michigan Press.
Kühberger, Anton. 1998. “The Influence of Framing on Risky De-cisions: A Meta-Analysis.” Organizational Behavior and HumanDecision Processes 75 (1): 23–55.
Lawless, Jennifer L. 2012.Becoming a Candidate: Political Ambitionand theDecision to Run forOffice.NewYork,NY:CambridgeUni-versity Press.
Lerner, Jennifer S., and Philip E. Tetlock. 1999. “Accounting for theEffects of Accountability.”Psychological Bulletin 125 (2): 255.
LeVeck, Brad L., D. Alex Hughes, James H. Fowler, Emilie Hafner-Burton, and David G. Victor. 2014. “The Role of Self-Interest inElite Bargaining.” Proceedings of the National Academy of Sci-ences 111 (52): 18536–41.
Levy, Jack S. 1997. “Prospect Theory, Rational Choice, and Interna-tional Relations.” International Studies Quarterly 41 (1): 87–112.
Levy, Jack S. 2003. “Applications of Prospect Theory to Political Sci-ence.” Synthese 135 (2): 215–41.
Levy, Jack S. 2013. “Psychology and Foreign Policy Decision-Making.”The Oxford Handbook of Political Psychology, 314–6.
Linde, Jona, and Barbara Vis. 2017. “Do Politicians Take Risks Likethe Rest of Us? An Experimental Test of Prospect Theory underMPs.”Political Psychology 38 (1): 101–17.
List, John A. 2003. “Does Market Experience Eliminate MarketAnomalies?”The Quarterly Journal of Economics 118 (1): 41–71.
List, John A., and Charles F.Mason.2011.“Are CEOsExpectedUtil-ity Maximizers?” Journal of Econometrics 162 (1): 114–23.
Loewen,Peter, andMichael MacKenzie. Forthcoming. “Service Rep-resentation in a Federal System: A Field Experiment.” Journal ofExperimental Political Science.
Loewenstein, George, and Jon Elster. 1992.Choice Over Time. NewYork, NY: Russell Sage Foundation.
Majumdar, Sumon, and SharunW.Mukand. 2004. “Policy Gambles.”The American Economic Review 94 (4): 1207–22.
March, James G., and Johan P. Olsen. 1995.Democratic Governance.New York, NY: Free Press.
Massey Jr, Frank J. 1951. “The Kolmogorov-Smirnov Test for Good-ness of Fit.” Journal of the American Statistical Association 46(253): 68–78.
McAfee,R. Preston,Hugo M.Mialon, and Sue H.Mialon. 2010. “DoSunk Costs Matter?”Economic Inquiry 48 (2): 323–36.
McDermott, Rose. 2001. Risk-Taking in International Politics:Prospect Theory in American Foreign Policy.AnnArbor,MI:Uni-versity of Michigan Press.
McDermott, Rose. 2004. Political Psychology in International Rela-tions. Ann Arbor, MI: University of Michigan Press.
McDermott, Rose, James H. Fowler, and Oleg Smirnov. 2008. “Onthe Evolutionary Origin of Prospect Theory Preferences.” TheJournal of Politics 70 (02): 335–50.
McGraw, Kathleen M. 2000. “Contributions of the Cognitive Ap-proach to Political Psychology.” Political Psychology 21 (4): 805–32.
Meier, Stephan, and Charles D. Sprenger. 2012. “Time Discount-ing Predicts Creditworthiness.” Psychological Science 23 (1):56–8.
Mellers, Barbara, Eric Stone, Pavel Atanasov, Nick Rohrbaugh, S.Emlen Metz, Lyle Ungar, Michael M. Bishop, Michael Horowitz,Ed Merkle, and Philip Tetlock. 2015. “The Psychology of Intelli-gence Analysis: Drivers of Prediction Accuracy in World Politics.”Journal of Experimental Psychology: Applied 21 (1): 1.
Mercer, Jonathan. 2005. “Prospect Theory and Political Science.”An-nual Review of Political Science 8: 1–21.
Miler, Kristina C. 2009. “The Limitations of Heuristics for PoliticalElites.”Political Psychology 30 (6): 863–94.
Mintz, Alex, Steven B. Redd, and Arnold Vedlitz. 2006. “Can WeGeneralize from Student Experiments to the Real World in Politi-cal Science,MilitaryAffairs, and International Relations?”Journalof Conflict Resolution 50 (5): 757–76.
Morton, Rebecca B., and Kenneth C. Williams. 2010. ExperimentalPolitical Science and the Study of Causality: From Nature to theLab. New York, NY: Cambridge University Press.
Nordhaus, William D. 1975. “The Political Business Cycle.” The Re-view of Economic Studies 42 (2): 169–90.
Norris, Pippa, and Joni Lovenduski. 1995.Political Recruitment:Gen-der,Race andClass in theBritish Parliament.Cambridge,UK:Cam-bridge University Press.
Pierson, Paul. 2000. “Increasing Returns, Path Dependence, and theStudy of Politics.” American Political Science Review 94 (2): 251–67.
Przeworski, Adam, Susan C. Stokes, and Bernard Manin. 1999.Democracy,Accountability, and Representation.Vol. 2,Cambridge,UK: Cambridge University Press.
Putnam,Robert. 1976.The Comparative Study of Political Elites. En-glewood Cliffs, NJ: Prentice-Hall.
Putnam, Robert D. 1988. “Diplomacy and Domestic Politics: TheLogic of Two-Level Games.” International Organization 42 (03):427–60.
Quattrone, George A., and Amos Tversky. 1988. “Contrasting Ra-tional and Psychological Analyses of Political Choice.”AmericanPolitical Science Review 82 (03): 719–36.
Renshon, Jonathan. 2015. “Losing Face and Sinking Costs: Experi-mental Evidence on the Judgment of Political and Military Lead-ers.” International Organization 69 (3): 659–95.
Rogoff, Kenneth. 1990. “Equilibrium Political Budget Cycles.” TheAmerican Economic Review, 21–36.
Samuelson, William, and Richard Zeckhauser. 1988. “Status quobias in Decision Making.” Journal of Risk and Uncertainty 1 (1):7–59.
Shepsle, Kenneth A., and Mark S. Bonchek. 1997.Analyzing Politics:Rationality, Behavior and Institutions. New York, NY: W.W. Nor-ton.
Sherman, Gary D., Jooa J. Lee, Amy J. C. Cuddy, Jonathan Renshon,Christopher Oveis, James J. Gross, and Jennifer S. Lerner. 2012.“Leadership is Associated with Lower Levels of Stress.” Proceed-ings of the National Academy of Sciences 109 (44): 17903–7.
Simonson, Itamar, and Peter Nye. 1992. “The Effect of Accountabil-ity on Susceptibility to Decision Errors.”Organizational Behaviorand Human Decision Processes 51 (3): 416–46.
Simonson, Itamar, and Barry M. Staw. 1992. “Deescalation Strate-gies: A Comparison of Techniques for Reducing Commitment to
320
Dow
nloa
ded
from
htt
ps://
ww
w.c
ambr
idge
.org
/cor
e. U
nive
rsity
of A
ntw
erp,
on
16 N
ov 2
018
at 1
4:48
:12,
sub
ject
to th
e Ca
mbr
idge
Cor
e te
rms
of u
se, a
vaila
ble
at h
ttps
://w
ww
.cam
brid
ge.o
rg/c
ore/
term
s. h
ttps
://do
i.org
/10.
1017
/S00
0305
5417
0005
69
Nonrepresentative Representatives
Losing Courses of Action.” Journal of Applied Psychology 77 (4):419.
Sleesman, Dustin J., Donald E. Conlon, Gerry McNamara, andJonathan E. Miles. 2012. “Cleaning up the Big Muddy: A Meta-Analytic Review of the Determinants of Escalation of Commit-ment.”Academy of Management Journal 55 (3): 541–62.
Slovic, Paul Ed. 2000. The Perception of Risk. London, UK: Earth-scan Publications.
Soroka, Stuart N. 2014.Negativity in Democratic Politics: Causes andConsequences. New York, NY: Cambridge University Press.
Streich, Philip, and Jack S. Levy. 2007. “Time Horizons, Discounting,and Intertemporal Choice.” Journal of Conflict Resolution 51 (2):199–226.
Swers,Michele L. 2002.TheDifferenceWomenMake:The Policy Im-pact of Women in Congress. Chicago, IL: University of ChicagoPress.
Taliaferro, Jeffrey W. 2004. “Power Politics and the Balance of Risk:Hypotheses on Great Power Intervention in the Periphery.”Polit-ical Psychology 25 (2): 177–211.
Teger, A. 1980.Too Much Invested to Quit. New York: Pergamon.Tetlock, Philip E., and Richard Boettger. 1994. “Accountability Am-
plifies the Status QuoEffectWhen Change Creates Victims.” Jour-nal of Behavioral Decision Making 7 (1): 1–23.
Thaler, Richard. 1980. “Toward a Positive Theory of ConsumerChoice.” Journal of Economic Behavior & Organization 1 (1): 39–60.
Thaler, Richard. 1981. “Some Empirical Evidence on Dynamic In-consistency.”Economics Letters 8 (3): 201–7.
Tomz,Michael, Jason Wittenberg, and Gary King. 2003. “CLARIFY:Software for Interpreting and Presenting Statistical Results.” Jour-nal of Statistical Software 8 (1): 1–30.
Tsebelis, George. 1990.Nested Games: Rational Choice in Compara-tive Politics, Vol. 18. Berkeley, CA:Univ of California Press.
Tsebelis,George. 2002.Veto Players:How Political InstitutionsWork.Princeton, NJ: Princeton University Press.
Tversky, Amos, and Daniel Kahneman. 1981. “The Framing ofDecisions and the Psychology of Choice.” Science 211 (4481):453–8.
Tversky,Amos, and Daniel Kahneman. 1992. “Advances in ProspectTheory: Cumulative Representation of Uncertainty.” Journal ofRisk and Uncertainty 5 (4): 297–323.
Tyszka, Tadeusz, and Piotr Zielonka. 2002. “Expert Judgments: Fi-nancial Analysts versus Weather Forecasters.”The Journal of Psy-chology and Financial Markets 3 (3): 152–60.
van Vugt, Mark, and Richard Ronay. 2014. “The Evolutionary Psy-chology of Leadership Theory, Review, and Roadmap.”Organiza-tional Psychology Review 4 (1): 74–95.
Wängnerud, Lena. 2009. “Women in Parliaments: Descriptive andSubstantive Representation.” Annual Review of Political Science12: 51–69.
Weaver, R. Kent. 1986. “The Politics of Blame Avoidance.” Journalof Public Policy 6 (04): 371–98.
Wiegele, Thomas C., and Kent Layne Oots. 1990. “Type A Behaviorand Local Government Elites.”Political Psychology, 721–37.
Zaller, John. 1992. The Nature and Origins of Mass Opinion. NewYork, NY: Cambridge University Press.
321
Dow
nloa
ded
from
htt
ps://
ww
w.c
ambr
idge
.org
/cor
e. U
nive
rsity
of A
ntw
erp,
on
16 N
ov 2
018
at 1
4:48
:12,
sub
ject
to th
e Ca
mbr
idge
Cor
e te
rms
of u
se, a
vaila
ble
at h
ttps
://w
ww
.cam
brid
ge.o
rg/c
ore/
term
s. h
ttps
://do
i.org
/10.
1017
/S00
0305
5417
0005
69