
NoN-Tariff Barriers iN The TraNspor T aNd LogisTics...
120
| RESEARCH REPORT | NON-TARIFF BARRIERS IN THE TRANSPORT AND LOGISTICS SECTORS: INDIA by Arpita Mukherjee & Smita Miglani August, 2010
Transcript of NoN-Tariff Barriers iN The TraNspor T aNd LogisTics...

| ReseaRch RepoRt |
NoN-Tariff Barriers iN The TraNsporT aNd LogisTics secTors: iNdia
by Arpita Mukherjee & Smita Miglani
August, 2010

contents
acknowledgements i
abbreviations ii
introduction 1
1. coverage of Transport and Logistics services 5
2. Transport and Logistics services in india: an overview 7
2.1 Road Transport 12
2.2 Railways 16
2.3 Air Transport 17
2.4 Maritime Transport 19
2.5 Auxiliary and Logistics Services 21
2.6 Express Delivery and Courier Services 22
3. india-eU Trade, investment and collaboration 25
3.1 Trade in Goods and Services and Investment Flows 26
3.1.1 Trade in Goods 26
3.1.2 Trade in Services 30
3.1.3 Bilateral Investment Flows between India and the EU 32
3.2 The Primary Survey 33
3.3 India-EU Collaboration: Implications for the Transport Sector 43
3.4 Scope for Enhancing Trade, Investment and Collaboration 46
4. Barriers faced by eU companies in india 49
5. addressing Barriers through international Negotiations 63
6. reform requirements in india 69
7. conclusion and the way forward 73
references 77
appendix a 84
appendix B 90
appendix c 108
Non-Tariff Barriers in the Transport and Logistics
sectors: india
List of Tables
Table 2.1: Cumulative FDI Inflows in the Transport Sector: April 2000 – April 2010 8
Table 2.2: FDI Policy in India: Transport and Logistics 11
Table 2.1.1: Automobile Production Trends (Number of Vehicles) 13
Table 3.1.1.1: Leading EU Countries Exporting to India and Products Exported 29
Table 3.1.2.1: Ranking of India and the EU in Global Services 30
Table 3.1.2.2: India’s Trade in Services with the EU in 2008 31
Table 3.1.3.1: FDI Inflows from the EU: January 2000 – November 2008 32
Table 3.2.1: Sampling Frame 34
Table 3.2.2: Perception Ranking of Factors Responsible for Growth in India 35
Table 3.2.3: Snapshot of European Automobile/Auto-component companies’ presence in Indian market 37
Table 3.2.4: Snapshot of European Construction and Consultancy (C&C) companies’ presence in the Indian market 39
Table 3.2.5: Snapshot of European Logistics Service Providers (freight forwarders, express delivery services providers, customs clearing agents, etc.) in India 42
Table 3.4.1: Technical Standards for Logistics Sector: India and the EU 47
Table 4.1: Ranking on World Bank’s Doing Business Report (2010) 50
Table 4.2: Rankings for BRIC countries, Germany and Poland on Selected Parameters 51
Table 4.3: World Bank’s Logistics Performance Index (LPI): Ranks of Selected EU Member Countries and India 51
Table 4.4: Barriers Faced by EU companies in India by Nature of Business 53
Table 4.5: Traffic Handled at Major Indian Ports versus Port of Rotterdam 57
Table 4.6: Setting up a Warehouse: Procedures and Days Required 59
Table 5.1: Commitments and Revised Offers in Transport and Logistics: India and the EU 67
List of figures
Figure 2.1: Investment Growth Rates (at constant 1999-00 prices) 10
Figure 3.1.1.1: India’s Major Supplier Countries and Export Destinations for Transportation Equipment (2007-08) 27
Figure 3.1.1.2: India-EU Trade in Transportation Equipment 28
Figure 3.1.1.3: Indian Exports to EU Member States and EU Exports to India in 2007-08 28
Figure 3.1.3.1: Total Technology Transfers Approved by Country and Sector 33
NON-TARIFF BARRIERS IN THE TRANSPORT AND LOGISTICS SECTORS: INDIA
HO
ME
| C
ON
TEN
TS |
SE
CTI
ON
- 1
| 2
| 3
| 4
| 5
| 6
| 7

acknowledgements
We are grateful to Dr. Kumar, Director and CE, ICRIER, for giving us the opportunity
to work on the relationship between India and European Union and to our colleague
Ramneet Goswami for her contribution to this paper. Thanks are due to Prasid
Chakraborty of SRG Consultancy Marketing Planning Services and his team for
conducting the survey and R.V. Anuradha for providing the legal input. We would also
like to thank the survey participants for their time and valuable inputs. Dr. Renu Gupta
for copyediting and Anil Kumar for formatting deserve special mention.
For any queries related to this paper, please contact Arpita Mukherjee, Professor,
ICRIER at [email protected] or Smita Miglani, Researcher, ICRIER at smiglani@icrier.
res.in. Tel: (91-11) 43112400, Fax: (91-11) 24620180.
JeL classification: F13, F14, F53, L74, L91, L92, L93, L98, N75
Keywords: Transport, Logistics, Trade, India, EU, Non-Tariff Barriers
NON-TARIFF BARRIERS IN THE TRANSPORT AND LOGISTICS SECTORS: INDIA
i
HO
ME
| C
ON
TEN
TS |
SE
CTI
ON
- 1
| 2
| 3
| 4
| 5
| 6
| 7

abbreviations
3pL Third Party Logistics
4pL Fourth Party Logistics
aai Airports Authority of India
aTf Aviation Turbine Fuel
BoT Build-Operate-Transfer
BTia Broad-based Trade and Investment Agreement
cfs Container Freight Stations
cha Custom House Agents
cii Confederation of Indian Industries
cNg Compressed Natural Gas
coNcor Container Corporation of India
cso Central Statistical Organisation
csT Central Sales Tax
cWc Central Warehousing Corporation
c&f Clearing and Forwarding
dfc Dedicated Freight Corridor
dgca Director General of Civil Aviation
dgfT Director General of Foreign Trade
dgs Director General of Shipping
dipp Department of Industrial Policy and Promotion
edi Electronic Data Interchange
eU European Union
fci Food Corporation of India
fdi Foreign Direct Investment
fipB Foreign Investment Promotion Board
fTa Free Trade Agreement
fTWZ Foreign Trade Warehousing Zones
gaTs General Agreement on Trade in Services
gdp Gross Domestic Product
NON-TARIFF BARRIERS IN THE TRANSPORT AND LOGISTICS SECTORS: INDIA
ii
HO
ME
| C
ON
TEN
TS |
SE
CTI
ON
- 1
| 2
| 3
| 4
| 5
| 6
| 7

gQ Golden Quadrilateral
grT Gross Registered Tonnage
gsT Gross Tonnage
gT Goods and Services Tax
iaTa International Air Transport Association
icd Inland Container Depots
iT Information Technology
JNpT Jawaharlal Nehru Port Trust
LcV Light Commercial Vehicles
MfN Most Favoured Nation
MMTa Million Metric Tonnes per Annum
MT Million Tonnes
MTg Multimodal Transport of Goods
MTo Multimodal Transport Operator
Nhai National Highways Authority of India
NhBf National Highways Builders Federation
Nhdp National Highway Development Programme
ppp Public-Private Partnership
psU Public Sector Undertaking
pWd Public Works Department
r&d Research and Development
rBi Reserve Bank of India
spV Special Purpose Vehicle
TaMp Tariff Authority of Major Ports
TeU Twenty-foot Equivalent Units
TciL Transport Corporation of India Limited
Usa United States of America
UsTr United States Trade Representative
WTo World Trade Organization
NON-TARIFF BARRIERS IN THE TRANSPORT AND LOGISTICS SECTORS: INDIA
iii
HO
ME
| C
ON
TEN
TS |
SE
CTI
ON
- 1
| 2
| 3
| 4
| 5
| 6
| 7

introduction
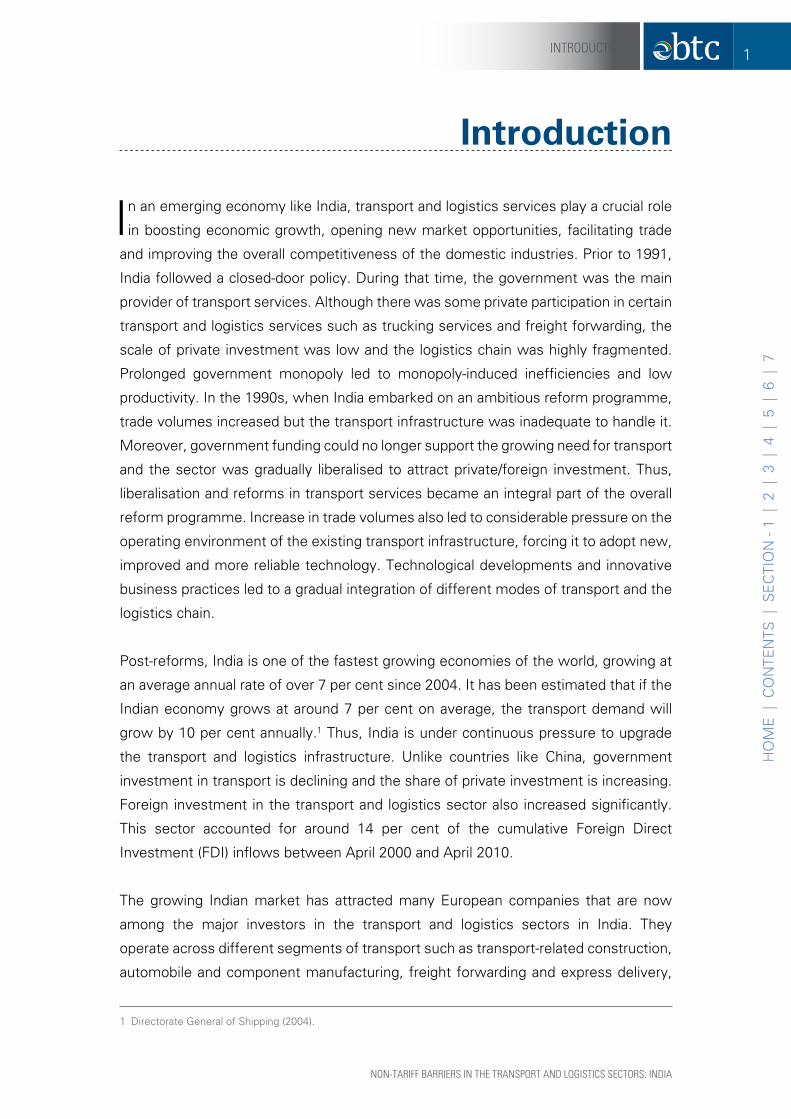
In an emerging economy like India, transport and logistics services play a crucial role
in boosting economic growth, opening new market opportunities, facilitating trade
and improving the overall competitiveness of the domestic industries. Prior to 1991,
India followed a closed-door policy. During that time, the government was the main
provider of transport services. Although there was some private participation in certain
transport and logistics services such as trucking services and freight forwarding, the
scale of private investment was low and the logistics chain was highly fragmented.
Prolonged government monopoly led to monopoly-induced inefficiencies and low
productivity. In the 1990s, when India embarked on an ambitious reform programme,
trade volumes increased but the transport infrastructure was inadequate to handle it.
Moreover, government funding could no longer support the growing need for transport
and the sector was gradually liberalised to attract private/foreign investment. Thus,
liberalisation and reforms in transport services became an integral part of the overall
reform programme. Increase in trade volumes also led to considerable pressure on the
operating environment of the existing transport infrastructure, forcing it to adopt new,
improved and more reliable technology. Technological developments and innovative
business practices led to a gradual integration of different modes of transport and the
logistics chain.
Post-reforms, India is one of the fastest growing economies of the world, growing at
an average annual rate of over 7 per cent since 2004. It has been estimated that if the
Indian economy grows at around 7 per cent on average, the transport demand will
grow by 10 per cent annually.1 Thus, India is under continuous pressure to upgrade
the transport and logistics infrastructure. Unlike countries like China, government
investment in transport is declining and the share of private investment is increasing.
Foreign investment in the transport and logistics sector also increased significantly.
This sector accounted for around 14 per cent of the cumulative Foreign Direct
Investment (FDI) inflows between April 2000 and April 2010.
The growing Indian market has attracted many European companies that are now
among the major investors in the transport and logistics sectors in India. They
operate across different segments of transport such as transport-related construction,
automobile and component manufacturing, freight forwarding and express delivery,
1 Directorate General of Shipping (2004).
NON-TARIFF BARRIERS IN THE TRANSPORT AND LOGISTICS SECTORS: INDIA
1INTRODuCTION
HO
ME
| C
ON
TEN
TS |
SE
CTI
ON
- 1
| 2
| 3
| 4
| 5
| 6
| 7

and maintenance and consultancy services, among others. The modes of operation
vary from wholly-owned subsidiaries to joint ventures and representative offices.
Many of them do projects for the Indian central, state and local governments.
India and the European Union (EU) are currently negotiating a Broad-based Trade
and Investment Agreement (BTIA) which is likely to be signed by the end of the
year 2010. This agreement will cover goods, services, investment, government
procurement, and subsidies, among others and is likely to enhance trade, investment
and collaboration between India and EU member states by removing tariff and non-
tariff barriers. The EU is a major proponent of liberalising transport and logistics
sectors in its multilateral and bilateral agreements and it will put pressure on India to
remove the trade barriers. At present, India’s commitments in transport and logistics
services in the WTO (World Trade Organization) and bilateral agreements (such as the
India-Singapore Comprehensive Economic Co-operation Agreement) is lower than the
level of autonomous liberalisation. This provides opportunities for the EU to secure
liberalisation commitments through the BTIA.
In the above context, this paper examines the non-tariff barriers faced by companies
from EU member states in the transport and logistics sectors of India. The barriers
include market access barriers (such as FDI restrictions), national treatment barriers
(or discriminatory barriers such as subsidies to local companies), regulatory barriers
(i.e., barriers relating to regulation, licensing, technical standards, etc.) and other
barriers (such as anti-competitive practices and pricing). The paper covers railway
transport, road transport, air transport, maritime transport, storage, warehousing
and other auxiliary services, and express delivery services. The paper does not cover
inland waterways since it is not an important mode of transportation in India and the
presence of European companies is limited.
NON-TARIFF BARRIERS IN THE TRANSPORT AND LOGISTICS SECTORS: INDIA
2 INTRODuCTION
HO
ME
| C
ON
TEN
TS |
SE
CTI
ON
- 1
| 2
| 3
| 4
| 5
| 6
| 7
The structure of the paper is as follows:
�� Section 1 provides the coverage of transport and logistics services.
�� Section 2 provides an overview of the transport and logistics sector in India,
emphasising recent trends and developments, the regulatory framework,
extent of liberalisation and growth prospects.
�� Section 3 analyses India-EU trade, investment and collaboration in transport and
logistics services.
�� Section 4 lists the barriers faced by European companies in India.
�� Section 5 examines how these barriers can be addressed through international
negotiations, specifically the India-EU BTIA.
�� Section 6 discusses the reforms that are required to improve productivity,
efficiency and global competitiveness of the transport and logistics sector in
India and enable the country to benefit from liberalisation under the BTIA.
�� Section 7 draws the main conclusions.
NON-TARIFF BARRIERS IN THE TRANSPORT AND LOGISTICS SECTORS: INDIA
3INTRODuCTION
HO
ME
| C
ON
TEN
TS |
SE
CTI
ON
- 1
| 2
| 3
| 4
| 5
| 6
| 7

1. coverage of Transport and Logistics services
NON-TARIFF BARRIERS IN THE TRANSPORT AND LOGISTICS SECTORS: INDIA
5COvERAGE OF TRANSPORT AND LOGISTICS SERvICES
HO
ME
| C
ON
TEN
TS |
SE
CTI
ON
- 1
| 2
| 3
| 4
| 5
| 6
| 7

The definition of transport and logistics services and its coverage has evolved over
the years. It broadly covers different forms of transport such as roads, railways,
air, and maritime; transport infrastructure like ports and airports; transport-related
construction like road construction; and services auxiliary to different modes of
transport like storage, warehousing and cargo handling. Logistics can be defined as
“the process of planning, implementing, and controlling the efficient, cost-effective
flow and storage of raw materials, in-process inventory, finished goods and related
information from point of origin to point of consumption so as to meet customer
requirements.”2 With technological developments, emergence of multimodal
transport facilities and development of global supply chains, transport and logistics
services have been integrated with other services such as information technology (IT)
and new transport and logistics services are evolving. For instance, Express Delivery
Services (EDS) have now evolved as a specialised form of logistics services which
include integrated door-to-door transport and quick delivery of time-definite shipments
of documents, samples, parcels, etc.
The EU follows a broad definition of logistics services which includes core logistics
services such as storage and warehousing, related freight logistics services like
maritime freight transport services, and non-core logistics services such as courier/
express delivery services and technical testing services. The EU seeks to get
commitments in a broad range of transport and logistics services from its trading
partners in the WTO and Free Trade Agreements (FTAs) so that companies from EU
member states have wider market access and are able to offer integrated services.
The EU also seeks non-discriminatory access3 to transport infrastructure and facilities
and regulatory certainty and transparency.
2 CII-KPMG (2007).
3 Non-discriminatory access means there should not be any preferential treatment to domestic service suppliers (for example, subsidies, lower port/airport charges, cargo reservations, etc.).
NON-TARIFF BARRIERS IN THE TRANSPORT AND LOGISTICS SECTORS: INDIA
6 COvERAGE OF TRANSPORT AND LOGISTICS SERvICES
HO
ME
| C
ON
TEN
TS |
SE
CTI
ON
- 1
| 2
| 3
| 4
| 5
| 6
| 7

2. Transport and Logistics services in india: an overview
NON-TARIFF BARRIERS IN THE TRANSPORT AND LOGISTICS SECTORS: INDIA
7TRANSPORT AND LOGISTICS SERvICES IN INDIA: AN OvERvIEw
HO
ME
| C
ON
TEN
TS |
SE
CTI
ON
- 1
| 2
| 3
| 4
| 5
| 6
| 7

The transport and logistics sector in India witnessed significant growth in the post-
liberalisation period. Since 1991, India’s international trade has increased almost
nine-fold, creating a huge demand for transport. This growth was further propelled
by the development of India as a manufacturing hub and the growth of services
sectors like retail. At present, the transport sector contributes significantly to India’s
Gross Domestic Product (GDP) (around 6.4 per cent in 2007-08), employment (about
40 million people in 2007-08)4 and FDI inflows (Table 2.1). The logistics industry is
valued at approximately $90 billion (€63.83 billion),5 employing 45 million people and
growing at the rate of 30-40 per cent per annum.6 It is expected that the demand for
transport and logistics will continue to grow as the Indian economy is on a high growth
trajectory, the domestic market is unsaturated and the country needs investment in
transport infrastructure. The overall logistics market is estimated to reach a size of
over $125 billion (€88.65 billion) by the end of 2010.7
Table 2.1: cumulative fdi inflows in the Transport sector: april 2000 – april 2010
s. No. sector
amount of fdi inflows (in billion) per cent share in
india’s Total fdi inflows(in €) (in $)
1. Construction Activities 5.77 8.14 7.19
2. Automobile Industry 3.27 4.61 4.16
3. Ports 1.15 1.62 1.33
4. Sea transport 0.49 0.69 0.63
5. Air transport (including Air Freight) 0.17 0.24 0.21
6. Earth-moving machinery 0.09 0.13 0.11
7. Railways-related components 0.08 0.11 0.10
Total inflows 11.03 15.55 13.73
india’s Total fdi inflows 79.77 112.47
Source: DIPP Fact Sheet on FDI - From August 1991 to April 2010. Government of India, http://dipp.nic.in/fdi_statistics/india_FDI_April2010.pdf
Note: Figures are calculated using the average exchange rate for fiscal year 2009-10: $1 = Є0.7092. Source: www.oanda.com
4 CSO Statistical Abstracts (2009); CII-KPMG (2007); ADB (2007).
5 This figure is calculated using the average exchange rate for the fiscal year 2009-10: $1 = €0.7092. Source: www.oanda.com
6 Colliers International (2009).
7 CII-KPMG (2007). This figure is calculated using the average exchange rate for fiscal year 2009-10: $1 = €0.7092. Source: www.oanda.com
NON-TARIFF BARRIERS IN THE TRANSPORT AND LOGISTICS SECTORS: INDIA
8 TRANSPORT AND LOGISTICS SERvICES IN INDIA: AN OvERvIEw
HO
ME
| C
ON
TEN
TS |
SE
CTI
ON
- 1
| 2
| 3
| 4
| 5
| 6
| 7

For domestic transportation, road transport is the dominant mode of transport accounting
for over two-third of the contribution of the transport sector to the GDP. Around 90 per
cent of India’s international trade is through maritime transport, most of the remainder
is through air transport, and less than one per cent is through roads and railways with
neighbouring South Asian Association for Regional Cooperation (SAARC) countries like
Bangladesh, Nepal, Bhutan and Pakistan with whom India shares land borders.
Over the years, the transport industry has been undergoing structural changes and
modernisation. Bulk cargo has been replaced by containerised cargo and multimodal
transportation has developed. Companies now provide integrated logistics services
and the use of Electronic Data Interchange (EDI) and Information Technology (IT)
has improved the operational efficiency of this sector. There has been a decline in
obsolete assets, and improvements in the self-financing capacity of the sector and
commercial management of transport assets and operations. Use of sophisticated
technology requires integrated service providers and skilled personnel, which can
provide services across the value chain. The fragmented market in certain segments
such as trucking is gradually becoming consolidated.
With the development of the logistics industry and just-in-time delivery, the share
of traffic by different modes of transport has changed. The share of road transport
for both passenger and freight traffic has increased, while that of the railways has
decreased.8
Liberalisation in the 1990s brought changes in the transport policy. From being a social
sector, transport is now treated as an economic sector which can facilitate growth
and alleviate poverty. The government’s role gradually changed from a direct provider
to a facilitator. The government has taken various measures to encourage private
participation, including innovative public-private partnership (PPP) models, and allowing
the private sector to charge users and avail of tax concessions. The government
is also taking measures to streamline customs and excise procedures, implement
EDI systems and liberalise the regulatory regime to facilitate private investment. As
a result of these measures, private/foreign participation in the Indian transport and
logistics sector has increased. However, the government is still a major investor in
this sector, especially in transport infrastructure. For instance, in the Eleventh Five-
Year Plan (2007-12), total investment in transport and logistics sectors9 is projected
8 The share of road transport increased from 50 per cent of freight traffic and 80 per cent of passenger traffic in 1990-91 to 65 per cent of freight traffic and 85 per cent of passenger traffic, respectively, by the end of 2006-07.
9 It includes roads and bridges, railways (including metro rail), ports, airports and storage.
NON-TARIFF BARRIERS IN THE TRANSPORT AND LOGISTICS SECTORS: INDIA
9TRANSPORT AND LOGISTICS SERvICES IN INDIA: AN OvERvIEw
HO
ME
| C
ON
TEN
TS |
SE
CTI
ON
- 1
| 2
| 3
| 4
| 5
| 6
| 7
to be 2.5 times than the anticipated investment in the Tenth Plan. The public-private
investment ratio under the current Plan is projected at 70:30, as against a ratio of 80:20
in the previous Plan period, amounting to approximately $54 billion (€38.3 billion)10
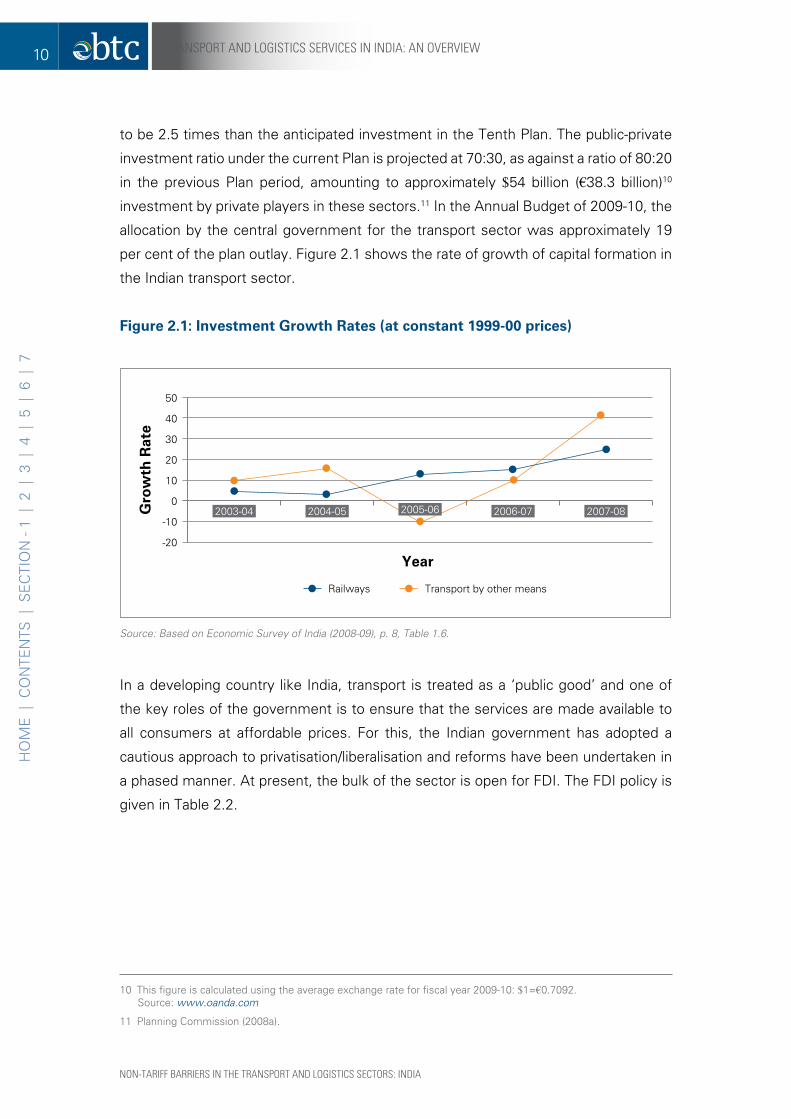
investment by private players in these sectors.11 In the Annual Budget of 2009-10, the
allocation by the central government for the transport sector was approximately 19
per cent of the plan outlay. Figure 2.1 shows the rate of growth of capital formation in
the Indian transport sector.
figure 2.1: investment growth rates (at constant 1999-00 prices)
2003-04 2004-05
Year
50
40
30
20
10
0
-10
-20
gro
wth
rat
e
2006-07 2007-082005-06
Railways Transport by other means
Source: Based on Economic Survey of India (2008-09), p. 8, Table 1.6.
In a developing country like India, transport is treated as a ‘public good’ and one of
the key roles of the government is to ensure that the services are made available to
all consumers at affordable prices. For this, the Indian government has adopted a
cautious approach to privatisation/liberalisation and reforms have been undertaken in
a phased manner. At present, the bulk of the sector is open for FDI. The FDI policy is
given in Table 2.2.
10 This figure is calculated using the average exchange rate for fiscal year 2009-10: $1=€0.7092. Source: www.oanda.com
11 Planning Commission (2008a).
NON-TARIFF BARRIERS IN THE TRANSPORT AND LOGISTICS SECTORS: INDIA
10 TRANSPORT AND LOGISTICS SERvICES IN INDIA: AN OvERvIEw
HO
ME
| C
ON
TEN
TS |
SE
CTI
ON
- 1
| 2
| 3
| 4
| 5
| 6
| 7

Table 2.2: fdi policy in india: Transport and Logistics
sector fdi policy
Road Transport 100 per cent FDI is allowed through the automatic route.
Air Transport (Airlines) �� 49 per cent FDI is allowed in domestic airlines through the automatic route, subject to no direct or indirect equity participation by foreign airlines.
�� Foreign airlines are not allowed to participate directly/ indirectly in the equity of an Air Service Undertaking engaged in operating scheduled, non-scheduled and chartered airlines.
�� FDI up to 74 per cent and investment by Non-Resident Indians (NRIs) up to 100 per cent is allowed in non-scheduled airlines, chartered and cargo airlines through the automatic route. Foreign airlines are allowed to participate in the equity of companies operating cargo airlines.
�� FDI up to 74 per cent and investment by NRIs up to 100 per cent is allowed through the automatic route in ground handling services.
�� 100 per cent FDI is allowed for maintenance and repair organisations.
�� Helicopter services/seaplane services requiring Director General of Civil Aviation (DGCA) approval- FDI up to 100 per cent is allowed through the automatic route.
�� FDI up to 74 per cent is permitted through automatic approvals in existing airports. FIPB approval is required for FDI beyond 74 per cent. 100 per cent FDI allowed for Greenfield projects.
Railways Public monopoly; FDI is not allowed in passenger and freight transportation and pushing and towing services. It is allowed in maintenance and repair of rail transport equipment and supporting services and railway-related components, warehousing, and freight corridors.
Services Auxiliary to all Modes of Transport
100 per cent FDI is allowed through the automatic route in cargo-handling services, storage and warehousing services and freight forwarding services.
Courier and express services (only for carrying packages, parcels and other items which do not come within the ambit of the Indian Post Office Act, 1898)
100 per cent FDI is allowed through the FIPB route subject to existing laws and exclusion of activity relating to distribution of letters, which is exclusively reserved for the state.
Source: Compiled by authors from Manual on FDI. http://dipp.nic.in/manual/FDI_Manual_text_Latest.pdf and http://www.investmentcommission.in/sector.htm
Note: (a) FDI through the automatic route implies that it does not require prior approval either by the Government of India or the Reserve Bank of India (RBI); (b) Foreign Investment Promotion Board (FIPB) is under the jurisdiction of the Indian Ministry of Finance.
NON-TARIFF BARRIERS IN THE TRANSPORT AND LOGISTICS SECTORS: INDIA
11TRANSPORT AND LOGISTICS SERvICES IN INDIA: AN OvERvIEw
HO
ME
| C
ON
TEN
TS |
SE
CTI
ON
- 1
| 2
| 3
| 4
| 5
| 6
| 7
India has a quasi-federal governance structure – the central, state and local
governments have distinct responsibilities and all of them regulate the transport and
logistics sector. The division of power and responsibilities is outlined in the Indian
Constitution and certain sectors are under the jurisdiction of the central government,
while others are under the jurisdiction of the state government. There are also certain
areas of joint jurisdiction. This has resulted in multi-layered administration systems
and multiple regulations. The central government is responsible for railways, national
highways, major ports, international shipping, civil aviation, and inland waterways.
State governments are responsible for state and rural roads, minor ports and coastal
shipping, inland water transport, urban transport and trucking, inter-city bus services,
etc. In areas such as rural roads, the state governments work closely with the local/
municipal bodies and the central government. Local municipal bodies are responsible
for urban planning and infrastructure. They also sometimes regulate traffic such as
truck entry timings within city limits. The key ministries and departments of the central,
state and local government and regulations relevant for the transport and logistics
sector are given in Table A.1 of Appendix A. The table shows that apart from transport
ministries and departments, a number of other ministries such as the Ministry of
Finance, the Ministry of Environment and Forests and the Ministry of Consumer
Affairs, Food and Public Distribution (which regulates inter-state movement of goods)
regulate this sector directly or indirectly.
Recent changes and developments in different segments of transport logistics are
discussed below:
2.1 road Transport
India has the second largest road network in the world (after the US). The network
increased from around 2 million kilometres in 1990-91 to over 3.3 million kilometres
in 2008-09. Traffic on Indian roads is growing at the rate of 7-10 per cent per annum,
while the vehicle population is growing at 12 per cent per annum.
India is a manufacturing hub for automobile and auto-component companies. The
figures for compound annual growth rate (CAGR) in different segments of automobile
production between 2002-03 and 2008-09 are given in Table 2.1.1.
NON-TARIFF BARRIERS IN THE TRANSPORT AND LOGISTICS SECTORS: INDIA
12 TRANSPORT AND LOGISTICS SERvICES IN INDIA: AN OvERvIEw
HO
ME
| C
ON
TEN
TS |
SE
CTI
ON
- 1
| 2
| 3
| 4
| 5
| 6
| 7

Table 2.1.1: automobile production Trends (Number of Vehicles)
category 2002-03 2003-04 2004-05 2005-06 2006-07 2007-08 2008-09cagr (in %)
Passenger Vehicles 723,330 989,560 1,209,876 1,309,300 1,545,223 1,777,583 1,838,697 16.82
Commercial Vehicles 203,697 275,040 353,703 391,083 519,982 549,006 417,126 12.69
Three- Wheelers 276,719 356,223 374,445 434,423 556,126 500,660 501,030 10.40
Two- Wheelers 5,076,221 5,622,741 6,529,829 7,608,697 8,466,666 8,026,681 8,418,626 8.80
Grand Total 6,279,967 7,243,564 8,467,853 9,743,503 11,087,997 10,853,930 11,175,479 10.08
Source: SIAM, http://www.siamindia.com/scripts/production-trend.aspx
Road is the main mode of domestic transport and carries about 65 per cent of freight
and 85 per cent of passenger traffic in India.12 However, road infrastructure is not well-
developed. The national highways/expressways which connect different states constitute
around 65,569 kilometres or 2 per cent of the road network and carry 40 per cent of the
road traffic; state highways have a network of 1,30,000 kilometres; and rural, district
and urban roads are 3.14 million kilometres in length.13 However, the national highways
are often congested. On average, a commercial vehicle in India runs at a speed of 32
kilometres (20 miles) per hour compared to over 97 kilometres (60 miles) per hour in
the mature logistics markets of Western Europe and the US.14 Moreover, many national
highways are two-lane and are not properly linked to major economic centres.
To enhance the capacity of the national highways, the National Highway Act, 1956
was amended in 1995 to encourage private participation. In 1998-99 the government
launched the National Highway Development Project (NHDP) which comprised 5,846
kilometres (3632.53 miles) of Golden Quadrilateral (GQ) connecting four metro cities,
7,300 kilometres of North-South and East-West corridors, 1,133 kilometres of port
connectivity and other projects at an investment of $12 billion (€8.51 billion).15 Innovative
methods of financing through Build, Operate and Transfer (BOT), annuity-based BOT and
Special Purpose Vehicles (SPV) were adopted to attract the private sector. The FDI regime
was liberalised to attract foreign investment and FDI up to 100 per cent is now allowed
through the automatic route in all road development projects including construction and
12 http://morth.nic.in/writereaddata/sublinkimages/overview_NH3244795788.htm
13 http://www.investmentcommission.in/roads.htm and the Department of Road Transport and Highways Annual Report (2007-08).
14 Data Monitor (2007).
15 This figure was calculated using the average exchange rate for fiscal year 2009-10: $1=€0.7092. Source: www.oanda.com
NON-TARIFF BARRIERS IN THE TRANSPORT AND LOGISTICS SECTORS: INDIA
13TRANSPORT AND LOGISTICS SERvICES IN INDIA: AN OvERvIEw
HO
ME
| C
ON
TEN
TS |
SE
CTI
ON
- 1
| 2
| 3
| 4
| 5
| 6
| 7

maintenance of roads, highways, bridges and tunnels; all sub-sectors of road transport,
namely, passenger, freight, rental of commercial vehicles with operators, maintenance
and repair of road transport equipment and supporting services; and all sub-sectors of
services auxiliary to all modes of transport, i.e., cargo handling services, storage and
warehousing, freight transport agency and other services. The private sector has been
allowed to collect user charges, and they have been given incentives in the form of
100 per cent income tax exemption for a period of 10 years, cheaper loans, duty-free
import of road building equipment and machinery, and permission to develop rest areas
along roads entrusted to them, among others. To meet the funding requirements for all
categories of roads, the government created a Central Road Fund and levied cess on
petrol and high-speed diesel. Fifty per cent of this duty is allocated to rural roads and the
remainder is given to national highways and other roads.
With private and foreign investments, the total length of national highways increased
from 16,200 kilometres in the early 1990s to 70,548 km in 2009-10. However, private
investment has been largely concentrated in national highways, while the government
has focused on rural road development. In the Eleventh Five-Year Plan (2007-12),
the government aims to consolidate the existing road network and integrate state
highways and district roads with rural roads. In more recent years, road development
projects have gained momentum; the Ministry of Road Transport and Highways
(MORTH) has announced plans to build 12-13 kilometres of road network each day
in the fiscal year 2010-11.16 Allocation for the road transport sector increased by over
13 per cent, from approximately Rs. 1,75,200 million (€2,628 million) in Union Budget
2009-10 to Rs. 1,98,940 million (€2,984 million) in the Budget of 2010-11.17
Road freight transport has seen significant growth in recent years, but this sector is still
highly fragmented – only 15 per cent of the logistics service providers operate in the
corporate sector. Transporters with fleets of fewer than five trucks account for over
two-third of the owned and operated trucks, and 80 per cent of the total revenue.18
Small truck operators have been mainly engaged in haulage and depend on a large
number of intermediaries (brokers, booking agents, etc.). With liberalisation, the sector
is becoming corporatised and the market is becoming consolidated. Individual truckers
are being replaced by integrated logistics providers. A number of foreign players
16 http://www.livemint.com/2010/04/26145432/India-long-way-off-from-20km.html
17 The Union Budget of India 2010-11, Speech by the Minister of Finance (February 26, 2010), http://indiabudget.nic.in/ub2010-11/bs/speecha.htm. This figure was calculated using the average exchange rate for fiscal year 2009-10: Re.1 = €0.015. Source: www.oanda.com
18 Data Monitor (2007).
NON-TARIFF BARRIERS IN THE TRANSPORT AND LOGISTICS SECTORS: INDIA
14 TRANSPORT AND LOGISTICS SERvICES IN INDIA: AN OvERvIEw
HO
ME
| C
ON
TEN
TS |
SE
CTI
ON
- 1
| 2
| 3
| 4
| 5
| 6
| 7

including DHL19 (Germany), Kühne & Nagel International AG (Switzerland) and Thomas
Nationwide Transport (TNT) N.V (Netherlands) operate in the road freight segment.
These integrated logistics providers have reduced the need for intermediaries and the
skills of the workforce are improving. Better road conditions have also facilitated the
use of multi-axle vehicles which are gradually replacing single-axle vehicles/trucks.
In India, public transport has not been able to keep pace with the growing population
and demand. The share of buses in total registered vehicles declined from 11.1 per
cent in 1951 to 1.1 per cent in 2004.20 In the past, the government was the main
provider of public transport, but with liberalisation, passenger transport is no longer
a government monopoly. Since public transport is not adequate, personal transport,
especially two-wheelers and small cars, have become an important mode of transport.
India is the second fastest growing automobile market after China. The contribution of
the automotive industry to GDP increased from 2.8 per cent in 1992-93 to 5 per cent in
2006-07. The Indian automobile market is dominated by small-sized cars. At present,
the market for luxury cars is small - only one per cent of the Indian population can afford
luxury cars. With sustained growth in GDP and rising incomes, the market for luxury
cars is expected to grow. Many Indian corporate companies and foreign players have
entered the automobile and auto-component manufacturing segment. FDI up to 100
per cent is allowed in the automobile and auto-component manufacturing sector and
India has emerged as a major exporting country for auto- components. International
companies such as Ford Motor Company (USA), General Motors Company (USA) and
Volkswagen AG (Germany) have established manufacturing bases in India because of
conducive policies and the availability of cheap labour.
Due to increases in energy prices and the shortage of fossil fuels, the Indian government
(both at the centre and state levels) is now focusing on environment-friendly public
transportation modes like metro rail and fuel-efficient vehicles.
Overall, road development has been recognised as a key infrastructure sector for
sustaining India’s economic growth. It is estimated that with the growth of the
population and economic development, both road freight and passenger volumes will
grow. The road freight industry will grow at a CAGR of 9.9 per cent from 2007-08 to
2011-12,21 while passenger traffic is projected to grow at 12-15 per cent per annum.22
19 DHL is named after its founders –Adrian Dalsey, Larry Hillblom and Robert Lynn of Germany.
20 National Highways Builders Federation (NHBF), http://nhbf.in/national_road_polocy.htm
21 Information provided by the Planning Commission.
22 http://www.investmentcommission.in/roads.htm
NON-TARIFF BARRIERS IN THE TRANSPORT AND LOGISTICS SECTORS: INDIA
15TRANSPORT AND LOGISTICS SERvICES IN INDIA: AN OvERvIEw
HO
ME
| C
ON
TEN
TS |
SE
CTI
ON
- 1
| 2
| 3
| 4
| 5
| 6
| 7

Investment in the road sector is expected to grow at 19 per cent per annum and
the government plans to spend about $10 billion (€7.09 billion) per annum on road
development over the next five years.23
2.2 railways
Indian Railways (spanning a length of 81,511 route kilometres) is the world’s fourth
largest rail network and the second largest in Asia. It is also the world’s fourth largest
freight carrier. It accounts for about 1.2 per cent of GDP and employed about 1.4
million people directly and 0.7 million indirectly (through support services) in 2006-07.
It is the principal mode of transport for inland bulk cargo and long-distance passenger
traffic. It carries more than 13 million passengers and 1.25 million tonnes of freight
every day.24 In 2008, there were over 7,000 railway stations in India.
The railways are one of the few sectors in India in which the government still has a
monopoly. With liberalisation, the demand for value-added transport services increased
and it was realised that the railways face capacity constraints in high-density corridors
and suffer from monopoly-induced inefficiencies and a maintenance backlog. Another
problem area identified was that the freight rates subsidise passenger transport. This
has led to a shift in freight traffic from rail to road transport over the years. There has
also been a shift in passenger traffic from the railways to airlines, especially to no-frill
private airlines. To reduce inefficiencies, the railways took various measures in the
1990s and in early 2000 to re-balance tariffs and involve the private sector in non-core
activities. However, the sector continued to be supported by budgetary grants and
suffered operational losses.
In 2005-06, the Ministry of Railways formulated an integrated modernisation plan
for 2005–2006 to 2009–2010, to upgrade operations (both passenger and freight
services) to global standards. The total expenditure was estimated to be $5.5 billion
(€3.9 billion).25 Private players were allowed to participate through the PPP route in
operating container trains on designated routes and developing rail-side warehouses,
logistics parks, budget hotels, etc. They can now participate in strengthening rail-port
connectivity, and developing dedicated freight corridors. Non-core activities such as
23 This was pointed out by the Investment Commission of India.
24 http://www.asiatradehub.com/India/railways.asp and http://www.indianrailways.gov.in/evolution/ rail-network.htm
25 This figure was calculated using the average exchange rate for fiscal year 2009-10: $1=€0.7092. Source: www.oanda.com
NON-TARIFF BARRIERS IN THE TRANSPORT AND LOGISTICS SECTORS: INDIA
16 TRANSPORT AND LOGISTICS SERvICES IN INDIA: AN OvERvIEw
HO
ME
| C
ON
TEN
TS |
SE
CTI
ON
- 1
| 2
| 3
| 4
| 5
| 6
| 7

product manufacturing have been opened up for FDI and corporate management
practices have been introduced. After the adoption of these measures, the Indian
Railways started recording impressive rates of growth. In the past four years, the
railways generated a cumulative cash surplus before dividend of approximately $16.94
billion (€12.01 billion).26 The operating ratio of the railways, which was 83.72 per cent
in 2005-06, came down to 75.94 per cent in 2007-0827 and is expected to drop further.
The Indian Railways is also a major equipment manufacturer. It meets most of the
requirements through domestic production in factories like Chittaranjan Locomotive
Works (Chittaranjan, West Bengal) and Diesel-Loco Modernisation Works (Patiala,
Punjab). The Ministry of Railways is focused on developing its industrial capacity to
meet most of the country’s locomotive, passenger-car and ancillary equipment needs
domestically and to export locomotives to other countries. The total value of exports
of rolling stock/ spares during 2008-09 was Rs. 1,501.5 million (€22.52 million).28
In recent years, there has been an increase in freight and passenger traffic due to
improved service quality and increases in route length. Also, unlike road transport,
the railways are not subjected to inter-state border checks that are time-consuming.
In 1990-91, freight traffic was around 3.3 billion tonnes which increased to 7.9 million
tonnes in 2007-08. In future, private investment in this sector is likely to increase due
to PPP initiatives. The government has already signed agreements with companies
from countries such as Japan, Russia, Germany and France for high-speed passenger
corridors, and manufacturing and consultancy services. The Indian Railways is also
setting up two Greenfield electric and diesel locomotive factories in joint ventures
with foreign manufacturers. Although private participation in the sector is increasing,
Indian Railways is unlikely to be privatised in the near future.
2.3 air Transport
Air transport is the fastest mode of transport for long-distance passengers and
high-value cargo. Post-liberalisation, with the development of services (financial,
telecommunications, IT, etc.) and growth in exports in sectors such as gems and
26 This figure was calculated using the average exchange rate for fiscal year 2009-10: $1 = €0.7092. Source: www.oanda.com
27 http://www.ibef.org/Archives/ViewArticles.aspx?art_id=17585&cat_id=808 and Indian Railways (2008)
28 This figure is calculated using the average exchange rate for fiscal year 2008-09: Re. 1 = €0.015. Source: www.oanda.com. Exports included new Cape Gauge diesel locomotives, lease-cum-maintenance of YDM4 diesel locomotives, new MG coaches/chair cars (non-AC), diesel loco spares, and MG diesel locomotive axles to developing countries such as Angola, Sudan, Mozambique, Senegal, Tanzania, Malaysia and Sri Lanka.
NON-TARIFF BARRIERS IN THE TRANSPORT AND LOGISTICS SECTORS: INDIA
17TRANSPORT AND LOGISTICS SERvICES IN INDIA: AN OvERvIEw
HO
ME
| C
ON
TEN
TS |
SE
CTI
ON
- 1
| 2
| 3
| 4
| 5
| 6
| 7

jewellery and pharmaceuticals, this sector has witnessed a rapid rate of growth.
According to the International Air Transport Association (IATA), India has one of the
fastest growing aviation industries and the country’s rank in the world’s aviation market
rose from 12 in 2006 to 9 in 2008. The market grew at a CAGR of 18 per cent and
was worth approximately $5.6 billion (€3.94 billion)29 in 2008. Indian carriers currently
have a fleet size of 310 aircraft.30 Passenger traffic (both domestic and international)
almost doubled between 2004 and 2007, while cargo traffic increased by 33.8 per
cent between 2004-05 and 2007-08.31
The air transport sector has been liberalised in a phased manner. In 1994, the
government monopoly in airline operations ended and private players were allowed
to enter the market. In 2007, private operators catered to nearly 82 per cent of the
market. In 2009, the proportion of passenger and freight carried by national and private
carriers was in the ratio of 1:4 and 1:2, respectively, for domestic operations and 4:1
and 2:1 for international operations.
Competition among private operators brought down prices and no-frill airlines have made
air travel affordable for a large number of people. The number of domestic passengers
using private air services (both scheduled and non-scheduled) increased from 15 million
in 1990 to 35.16 million in 2006-07.32 Important policy changes include an open sky
policy for cargo and Indian private airlines are allowed to fly on designated international
routes. There are still, however, some FDI restrictions on ownership by foreign airlines.
With the growth in demand, airports have started facing capacity constraints and the
government is now encouraging private investment in development and maintenance
of airports. For Greenfield airports, up to 100 per cent FDI is allowed through the
automatic route, while for other airports clearances are required for FDI beyond
74 per cent. FDI up to 100 per cent is allowed in ground handling services (74 per
cent through the automatic route), maintenance and repairs, and flying training and
technical training institutes. Private developers are allowed to set up captive airstrips
and general airports 150 kilometres away from an existing airport, and they can avail
100 per cent tax exemption for airport projects for a period of 10 years. There are no
caps on investment in maintenance and repairs, flying training institutes and technical
training institutes; and helicopter/seaplane services.
29 This figure was calculated using the average exchange rate for fiscal year 2008-09: $1 = €0.7042. Source: www.oanda.com
30 http://www.ibef.org/industry/aviation.aspx
31 Figures taken from the Airport Authority of India, http://www.airportsindia.org.in/AAI/main.jsp
32 http://indiabudget.nic.in/es2000-01/chap99.pdf; www.indiastat.com
NON-TARIFF BARRIERS IN THE TRANSPORT AND LOGISTICS SECTORS: INDIA
18 TRANSPORT AND LOGISTICS SERvICES IN INDIA: AN OvERvIEw
HO
ME
| C
ON
TEN
TS |
SE
CTI
ON
- 1
| 2
| 3
| 4
| 5
| 6
| 7

With the privatisation of airports, the need for regulatory changes has been felt. The
government enacted the Airports Economic Regulatory Authority of India Act, 2008 that
established a regulatory authority called the Airports Economic Regulatory Authority of
India (AERA) in May 2009.33 The objectives of AERA are to foster healthy competition
among all major airports (government-owned, PPP-based, and private);34 encourage
investment in the sector; regulate tariffs of aeronautical services; protect reasonable
interests of users; and operate efficient, economic and viable airports. As a transparent
entity, AERA published its “White Paper on Regulatory Objectives and Philosophy in
Economic Regulation of Airports and Air Navigation Services” in December 2009, listing
major issues that impact the formulation of its regulatory philosophy.
The Indian air transport sector will continue to grow at a rapid pace. The Vision
2020 statement announced by the Ministry of Civil Aviation projected investment
opportunities of approximately $110 billion (€78.01 billion)35 in the Indian civil aviation
sector ($80 billion or €56.5 billion in new aircraft and $30 billion or €21.5 billion in the
development of airport infrastructure); air cargo traffic will grow at over 11.4 per cent
per annum and exceed 2.8 million tonnes by end-2010.36
2.4 Maritime Transport
India is strategically located in the global shipping routes and has a long coastline
which makes it an important maritime nation. Maritime transport caters to over 90 per
cent of the country’s trade in terms of volume and 70 per cent in terms of value. India
has 13 major ports which are regulated by the central government and 187 minor ports
which are under the jurisdiction of state governments. Major ports handle over three-
fourth of the sea-borne traffic. The quantity of cargo handled and container traffic in the
major ports increased from 152.6 million tonnes and 7.9 million tonnes, respectively,
in 1990-91 to 519.1 million tonnes and 92.13 million tonnes, respectively, in 2007-08.37
India’s shipping industry is ranked 17th among the world’s maritime nations in terms
of Gross Tonnage (GT) and 15th in terms of Dead Weight Tonnage (DWT).38 It has the
33 Ministry of Civil Aviation (2009).
34 Major airports have been defined under the Act as follows: “Major airport means an airport which has, or is designated to have annual passenger throughput in excess of one and a half million or any other airport as the Central Government may, by notification, specify as such.”
35 This figure was calculated using the average exchange rate for the fiscal year 2009-10: $1 = €0.7092. Source: www.oanda.com
36 Mukherjee (2009) and http://www.ibef.org/artdispview.aspx?cat_id=503&art_id=21353&in=5
37 http://indiabudget.nic.in/es1990-91/4%20Infrastructure.pdf
38 http://pib.nic.in/archieve/image/2005/r2005111704.pdf and http://www.imaritime.com/knowledge-center/shipping.php
NON-TARIFF BARRIERS IN THE TRANSPORT AND LOGISTICS SECTORS: INDIA
19TRANSPORT AND LOGISTICS SERvICES IN INDIA: AN OvERvIEw
HO
ME
| C
ON
TEN
TS |
SE
CTI
ON
- 1
| 2
| 3
| 4
| 5
| 6
| 7
largest merchant shipping fleet among the developing countries; the fleet consisted
of 912 ships of 9.3 million GT in 2008.39 However, coastal shipping and inland water
transport is limited. Apart from ports and shipping, the maritime sector also consists
of other facilities such as shipbuilding, ship repair and maintenance, and training of
seafarers. India is a global supplier of seafarers and accounts for around 6 per cent of
the total seafarers in the world.40
With the increase in trade after liberalisation, it became necessary to enhance
port capacities. FDI up to 100 per cent is now allowed in port development projects
(construction and maintenance). The private sector has been offered other incentives such
as 100 per cent income tax exemption for port development for a period of 10 years. As a
result, several global port operators have established operations in India through BOT and
other modes. These include the Maersk Line Group in the Jawaharlal Nehru Port Trust
(JNPT), Mumbai; P & O Ports in JNPT, Mumbai and Chennai; Dubai Ports International
in Cochin and Visakhapatnam; and PSA Singapore in Tuticorin. In the shipping sector,
foreign ships calling at Indian ports no longer require a licence for overseas trade; the
cargo reservation policy has been relaxed to allow foreign vessels on a case-by-case
basis. This has increased the share of foreign shipping in total trade. Foreign shipping
companies now control most of the container traffic and the share of Indian shipping in
international trade declined from 36.7 per cent in 1991-92 to 13.7 per cent in 2005-06.41
Despite these developments, government policy is geared towards promoting national
shipping for strategic reasons and self-reliance. For instance, the government introduced
the Tonnage Tax42 in 2004, which boosted the growth of the Indian merchant fleet.
It has been estimated that the cargo-handling capacity of Indian ports will increase to
1,855 MT by 2012 with an investment of about $20.61 billion or €14.62 billion; over
60 per cent of this will be from the private sector.43 The Indian ship-building industry
accounts for 1.7 per cent of the global ship-building market. The share is expected to
increase to 15 per cent by 2020 and this industry is expected to grow at a CAGR of 30
per cent to reach $22 billion (€15.6 billion) in 2020.44
39 This comprises around 282 overseas vessels with 7.89 million GT and 13.55 million DWT and 590 coastal vessels with 0.5 million GT and 0.99 million DWT.
Source: http://www.thehindubusinessline.com/2009/01/27/stories/2009012750181000.htm
40 CII-KPMG (2007), Gaps in the Indian Logistics Sector: A White Paper, September 2007.
41 In fact, while the world cargo fleet grew from 464.99 million GT in 1995 to 687.98 million GT in 2006, India was still witnessing slow growth in its fleet size during this period. Source: Planning Commission (2008b).
42 Under this system, ship-owners can opt for tonnage tax, whereby income tax is levied on the basis of presumptive income of the Net Tonnage (NT) of each ship owned by Indian ship-owners determined according to a fixed scale.
43 This figure was calculated using the average exchange rate for fiscal year 2009-10: $1 = €0.7092. Source: www.oanda.com
44 http://www.thehindubusinessline.com/2008/03/24/stories/2008032450570600.htm. This figure was calculated using the average exchange rate for fiscal year 2009-10: $1 = €0.7092. Source: www.oanda.com
NON-TARIFF BARRIERS IN THE TRANSPORT AND LOGISTICS SECTORS: INDIA
20 TRANSPORT AND LOGISTICS SERvICES IN INDIA: AN OvERvIEw
HO
ME
| C
ON
TEN
TS |
SE
CTI
ON
- 1
| 2
| 3
| 4
| 5
| 6
| 7
2.5 auxiliary and Logistics services
The term ‘logistics services’ is defined as the management of goods and resources
between the ‘point of origin’ and the ‘point of consumption’, so as to meet customer
requirements. Thus, transportation is a key component of logistics services. Such
services help to integrate different modes of transport. It also includes other services
such as storage and warehousing, inventory management, and packaging. The logistics
sector started modernising and globalising after India began integrating into the global
value chain. Indian industries such as automobiles and auto-components, IT hardware,
electronics, textiles, Fast Moving Consumer Goods (FMCG) and retail are some
main users of logistics services. Most Indian companies now concentrate on their
core businesses and have outsourced the non-core business to specialised logistics
service providers. The Indian Third Party Logistics (3PL) service providers’ market was
estimated at about $890.3 million (€631.42 million) in 2005 and is expected to grow
at a CAGR of 21.9 per cent to reach around $3,557 million (€2523 million) in 2012.45
Although the current size of the Fourth Party Logistics (4PL) service providers’ market
is small, it is expected to grow at a rate of over 20 per cent in the next five years.
The total warehousing space in India was estimated to be 1,800 million sq ft in
2006.46 A large part of the warehousing business is in the unorganised sector and
organised players accounted for only 8 per cent of the segment in 2006.47 Among
the organised players, public sector enterprises such as the Central Warehousing
Corporation (CWC) and Food Corporation of India (FCI) have the majority share. The
government is encouraging foreign investment in warehousing and FDI up to 100 per
cent is allowed. In recent years, a large number of Indian companies such as the Tata
Group and foreign players such as the Maersk Logistics Group (Denmark), ProLogis
(USA) and Jebel Ali Free Zone (Jafza) International (Dubai) have entered the storage
and warehousing business. The need for warehousing and storage is likely to grow as
the Indian economy is growing and businesses are integrating into global value chains.
It is estimated that the Indian warehousing sector will grow from $20 billion (€14.18
billion) in 2007-08 to about $55 billion (€39.01 billion) by 2010-11, growing at a rate of
35-40 per cent every year.48
45 http://www.frost.com/prod/servlet/market-insight-top.pag?docid=74102578. This figure was calculated using the average exchange rate for fiscal year 2009-10: $1 = €0.7092. Source: www.oanda.com
46 CII-KPMG (2007).
47 The main reason is India’s indirect tax structure. Since taxes paid on cross-border sales are higher than local tax charges, most companies prefer to set up small warehouses across different states rather than large centralised set-ups.
48 Colliers International (2009). The figures were calculated using the average exchange rate for fiscal year 2009-10: $1 = €0.7092. Source: www.oanda.com
NON-TARIFF BARRIERS IN THE TRANSPORT AND LOGISTICS SECTORS: INDIA
21TRANSPORT AND LOGISTICS SERvICES IN INDIA: AN OvERvIEw
HO
ME
| C
ON
TEN
TS |
SE
CTI
ON
- 1
| 2
| 3
| 4
| 5
| 6
| 7

With increased containerisation, the demand for container-handling services in India is
growing. In 2009, India had 133 container freight stations and inland container depots, the
majority of which are privately owned. The Planning Commission of India has projected
that these facilities should double in the next two years to support the growth in container
traffic. The different transport ministries such as the Ministry of Railways have taken
initiatives to develop container-handling facilities through private partnerships. In 2007,
the Indian Railways allowed private players in rail container transportation. By 2009, 16
companies including many private players have acquired licences to run container trains.
Due to such incentives, although India’s present container handling capacity is low, it
will grow at a rapid pace in the near future. For instance, Frost & Sullivan in the report,
“Strategic Assessment of Containerization Trends in India”, pointed out that India’s
container handling capacity for international and domestic traffic is expected to reach 21
million Twenty-foot Equivalent Units (TEU) in 2014 from 9.1 million TEU in 2008.
Customs brokers, Clearing and Forwarding (C&F) agents and freight forwarders
are some important players in the logistics chain. Some of them have integrated
operations and offer a wide variety of services to customers, while others provide
specialised services. In the past, the logistics chain in India was highly fragmented
with a large number of intermediaries. With the integration of the logistics chain, the
need for a large number of intermediaries is decreasing. Automated systems, on-line
documentation filing, etc., have also reduced the need for multiple agents.
Since Indian companies cater to global clients who demand time-bound high quality
services in product consumption, the segment of reverse logistics49 is growing. About
7 per cent of an enterprise’s gross sales are captured by return costs. This is a new
area of operations in India and most reverse logistics contracts are customised to fit
the size and type of companies that contract them.
2.6 express delivery and courier services
Express Delivery Services (EDS) facilitate the transportation of documents, samples,
gifts and other high-value time-bound items. EDS companies also handle customs
clearances and reduce the need for multiple agents such as freight forwarders and
customs clearance agents. Courier companies offer similar services but generally
49 The term ‘Reverse Logistics’ stands for all operations related to the resources getting at least one step back in the supply chain for the purpose of value addition, proper disposal or re-manufacturing. Mostly, it is seen as the flow of goods from the point of consumption to the point of origin and also involves planning and managing (collection, disassembly and processing) the efficient flow of and/or reuse of surplus inventory.
NON-TARIFF BARRIERS IN THE TRANSPORT AND LOGISTICS SECTORS: INDIA
22 TRANSPORT AND LOGISTICS SERvICES IN INDIA: AN OvERvIEw
HO
ME
| C
ON
TEN
TS |
SE
CTI
ON
- 1
| 2
| 3
| 4
| 5
| 6
| 7

the EDS companies provide more value-added services. Since the logistics chain in
India is fragmented and delivery time is high, Indian companies often use EDS/courier
services instead of general logistics services to save time. The growth of this industry
has been propelled by the development of India as a business process outsourcing
hub, the growth of services such as telecommunications and financial services, and
exports of products like auto-components and textiles.
At present, the size of the EDS industry is estimated at around Rs. 90 billion (€1.33
billion)50 and this sector is growing at around 20-25 per cent per annum.51 According
to industry estimates, the courier/EDS industry is expected to grow at around 30 per
cent in the next five years. There are more than 2,500 EDS/courier companies in
India that employ close to 1 million people either directly or indirectly; of these, only
20 or 30 companies belong to the organised/ corporate sector but they account for
70 per cent of the total revenue. Global integrators, namely, Federal Express (FedEx)
and United Parcel Service Inc. (UPS) from the USA, DP-DHL (Germany), and TNT N.V
(Netherlands) have a presence in India. They have expanded their domestic operations
through local partnerships. For instance, DHL has partnered with the Indian company,
Blue Dart, and also entered into partnership with India Post (i.e., the Department of
Posts of the Government of India) for international mail services.
Up to 100 per cent FDI is allowed in the courier/EDS business, but according to the
present regulations (i.e., Indian Post Office Act, 1898), ‘letters’ are reserved for India
Post. However, this act does not define the term ‘letter’ and the Department of Posts
is in the process of designing new regulations for this sector.
Overall, the transport and logistics sector in India has undergone significant changes
in the past 15 years. Private participation has increased and there have been mergers
and acquisitions and consolidation. With growing GDP and trade, India is an important
market for transport and logistics service providers, and several EU companies have
already established a presence in India. The next section discusses India-EU trade,
investment and collaboration in this sector.
50 This figure is calculated using the average exchange rate for fiscal year 2009-10: Re. 1 = €0.015. Source: www.oanda.com
51 Express Industry Council of India (EICI), http://www.eiciindia.org/FrontSite/aboutus.aspx
NON-TARIFF BARRIERS IN THE TRANSPORT AND LOGISTICS SECTORS: INDIA
23TRANSPORT AND LOGISTICS SERvICES IN INDIA: AN OvERvIEw
HO
ME
| C
ON
TEN
TS |
SE
CTI
ON
- 1
| 2
| 3
| 4
| 5
| 6
| 7

3. india-eU Trade, investment and collaboration
NON-TARIFF BARRIERS IN THE TRANSPORT AND LOGISTICS SECTORS: INDIA
25INDIA-Eu TRADE, INvESTmENT AND COLLABORATION
HO
ME
| C
ON
TEN
TS |
SE
CTI
ON
- 1
| 2
| 3
| 4
| 5
| 6
| 7
India-EU trade, investment and collaboration in transport and logistics constitute trade
in goods, trade in services, investment by EU companies in India, joint ventures and
other forms of collaboration. This study does not address Indian investments in the
EU. Section 3.1 discusses trade in goods between India and the EU, using bilateral
trade flow data; it also shows the comparative positions of both India and the EU in
transport services. A primary survey was conducted to understand the pattern of trade
in goods and services, areas in which EU companies are investing in India, their views
on future growth potential, and factors determining their success in India. These are
discussed in Section 3.2.52 Section 3.3 discusses on-going and past collaborations
at the government-to-government level that have implications for enhancing trade
and collaboration between India and EU. Section 3.4 examines areas for future trade,
collaboration and investment.
3.1 Trade in goods and services and investment flows
3.1.1 Trade in goods
The EU is the largest player in global trade but more than half of this is intra-EU. In 2008,
the EU (extra-EU) contributed 15.9 per cent and 18.3 per cent in global merchandise
exports and imports, respectively. India’s ranking among WTO member countries has
also improved in the past few years, but its share remains low. In 2008, India ranked
19th among merchandise exporters (1.5 per cent share) and 10th among importers in
the world.53
The EU is India’s largest trading partner in goods. In the past few years, merchandise
trade between India and the EU has shown impressive growth. In 2008, the total trade
between India and the EU reached $79 billion (€55.63 billion) compared to only $19.7
billion (€17.43 billion) in 1998, and witnessed a CAGR of 14 per cent over the past 10
years. India has a negative trade balance with the EU.54
India’s trade in transport equipment includes import and export of different types of
vehicles, vehicle parts, aircraft and aircraft parts, cruise ships, and boats. Transport
52 The barriers faced by EU companies in India are discussed in Section 4.
53 WTO (2009)
54 Balance of Payments, IMF. This figure was calculated using the average exchange rate for fiscal year 2008–09 ($1 = €0.7042) and 1998–99 ($1 = €0.8849). (Source: http://www.oanda.com/)
NON-TARIFF BARRIERS IN THE TRANSPORT AND LOGISTICS SECTORS: INDIA
26 INDIA-Eu TRADE, INvESTmENT AND COLLABORATION
HO
ME
| C
ON
TEN
TS |
SE
CTI
ON
- 1
| 2
| 3
| 4
| 5
| 6
| 7

equipment holds an important place in India’s trade basket and India’s global trade in
this sector was €19 billion in 2007-08, of which exports accounted for €4.9 billion. India
is a major importer of transport equipment and the EU is one of the largest suppliers of
transport equipment to India (Figure 3.1.1.1). India also exports transport equipment
to the EU.
figure 3.1.1.1: india’s Major supplier countries and export destinations for
Transportation equipment (2007-08)
EU | 20.8%Others | 35.8%Singapore | 10.2%
UAE | 8%
USA | 9.7%Bangladesh | 2%
Egypt | 2.7%
Algeria | 2.1%
South Africa | 3.4%Sri Lanka | 5.3%
export destinations of indiasupplier countries to india
Japan | 3.1%
China | 3.7%
Others | 10.2% EU | 35.5%
Singapore | 4.2%
USA | 43.3%
Source: Authors’ calculations from Export-Import Databank, Director General of Foreign Trade (DGFT), Government of India.
Over time, India-EU trade in transportation equipment has increased. As in the
case of total merchandise trade, India has a negative trade balance with the EU in
transportation equipment. Figure 3.1.1.2 shows an increase in trade in 2005-06. This
is due to an increase in imports of aeroplane and other aircraft (the HS codes for
transportation equipment at the 6-digit level are given in Table B.1 of Appendix B). In
2007-08, transportation equipment was the 8th largest commodity in India’s export
basket to the EU, accounting for 4.2 per cent of total exports. It was the second
largest commodity in imports from the EU, with a share of 5.8 per cent. In 2008, India
was the 15th largest trading partner for the EU in this sector, accounting for 1.6 per
cent of the total EU trade in transportation equipment.55 This clearly shows that while
India is a major importer of transport equipment and imports from the EU are rising,
there is scope for further increase in trade between India and the EU.
55 http://exporthelp.europa.eu
NON-TARIFF BARRIERS IN THE TRANSPORT AND LOGISTICS SECTORS: INDIA
27INDIA-Eu TRADE, INvESTmENT AND COLLABORATION
HO
ME
| C
ON
TEN
TS |
SE
CTI
ON
- 1
| 2
| 3
| 4
| 5
| 6
| 7

figure 3.1.1.2: india-eU Trade in Transportation equipment
0
0.5
1
1.5
2
2.5
3
3.5
4
4.5
5
1997-98 2000-01 2001-02 2002-03 2003-04 2004-05 2005-06 2006-07 2007-08 2008-09 (Apr- Dec)
Valu
e in
€B
illio
ns
Years
0.390.56
0.27 0.33 0.250.42 0.29
0.55 0.60 0.63
1.01
3.13 3.04
4.29
1.25
0.79 0.761.02
1.61
0.68
Exports Imports
Source: Authors’ calculations from Export-Import Databank, DGFT, Government of India.
Note: Exchange rates are as follows: For 1997, Є1 = Rs.20.9613; for 2000, Rupee 1 = Є0.0241; for 2001, Rupee 1 = Є0.0237; for 2002, Rupee 1 = Є0.0207; for 2003, Rupee 1 = Є0.0185; for 2004, Rupee 1 = Є0.0176; for 2005, Rupee 1 = Є0.0185; for 2006, Rupee 1 = Є0.0172; for 2007, Rupee 1 = Є0.0175; for 2008 (Apr–Dec), Rupee 1 = Є0.0153. (Source: RBI and Foreign Exchange Dealers’ Association of India, http://www.fedai.org.in/)
The top 10 items of India’s exports and imports to and from the EU are given in Table
B.2 and Table B.3 in Appendix B. The two tables show that the major export items
constitute vehicles parts and accessories, while imports largely constitute aeroplanes
and other aircraft. There has been a change in both the import and export baskets over
time. India’s major export destinations and the major EU member countries exporting
to India in 2007-08 are given in Figure 3.1.1.3.
figure 3.1.1.3: indian exports to eU Member states and eU exports to india
in 2007-08
France | 65.3%
Germany | 12.7%
EU-19 | 5.7%
Italy | 1.6%
Czech Republic | 2.3%
Cyprus | 2.3%
Sweden | 2.9%
Netherlands | 3.1%
UK | 4.1%
eU’s exports to indiaindia’s exports to eU countries
Belgium | 4.3%EU-19 | 14.4% Italy | 23.6%
UK | 13.9%France | 12.1%
Germany | 14.3%
Spain | 6.2%
Greece | 4.5% Netherlands
| 6.7%
Source: Authors’ calculations from Export-Import Databank, DGFT, Government of India.
NON-TARIFF BARRIERS IN THE TRANSPORT AND LOGISTICS SECTORS: INDIA
28 INDIA-Eu TRADE, INvESTmENT AND COLLABORATION
HO
ME
| C
ON
TEN
TS |
SE
CTI
ON
- 1
| 2
| 3
| 4
| 5
| 6
| 7

The types of products exported by different EU member states are listed in Table 3.1.1.1.
Table 3.1.1.1: Leading eU countries exporting to india and products exported
eU countries Top 5 Transportation products
france
Aeroplanes & other aircraft, of an unladen weight >2000 kg but not excluding 15000 kg (880230)
Aeroplanes & other aircraft, of an unladen weight not exceeding 2000 kg (880220)
Aeroplanes & other aircraft, of an unladen weight exceeding 15000 kg (880240)
Other parts of aeroplanes/helicopters (880330)
Dredgers (890510)
germany
Aeroplanes & other aircraft, of an unladen weight >2000 kg but not excluding 15000 kg (880230)
Other parts & accessories of vehicles of heading 8701-8705 (870899)
Other parts of aeroplanes/helicopters (880330)
Other motor cars & motor vehicles principally for the transport of persons, including station wagon etc (870390)
Vehicle with spark ignition internal combustion reciprocating piston engine of cylinder capacity>3000 cc (870324)
UK
Other parts of aeroplanes/helicopters (880330)
Other vessels, fire floats etc (890590)
Other parts of goods of heading 8801 or 8802 (880390)
Other vessels for transport of goods & other vessels for transport of persons & goods (890190)
Cruise ships, excursion boats & similar vessels principally designed for transport of persons, ferry-boats of all kinds (890110)
Netherlands
Dredgers (890510)
Cruise ships, excursion boats & similar vessels principally designed for transport of persons, ferry-boats of all kinds (890110)
Other vessels for transport of goods & other vessels for transport of persons & goods (890190)
Tugs and pusher craft (890400)
Other vessels, fire floats etc (890590)
sweden
Other vessels, fire floats etc (890590)
Other parts & accessories of vehicles of heading 8701-8705 (870899)
Other vessels for transport of goods & other vessels for transport of persons & goods (890190)
Drive axles with differential w/n provided with other transmission components (870850)
Dumpers designed for off-highway use (870410)
Source: Compiled from Export-Import Databank, DGFT, Government of India. http://dgftcom.nic.in/
NON-TARIFF BARRIERS IN THE TRANSPORT AND LOGISTICS SECTORS: INDIA
29INDIA-Eu TRADE, INvESTmENT AND COLLABORATION
HO
ME
| C
ON
TEN
TS |
SE
CTI
ON
- 1
| 2
| 3
| 4
| 5
| 6
| 7

3.1.2 Trade in services
The global services trade has seen significant growth in the past decade from $2.7
trillion (€2.3 trillion) in 1998 to $7.3 trillion (€5 trillion) in 2008.56 In 2008, the world’s
exports of services grew by 12 per cent over 2007. In 2008, the EU was the largest
exporter of services and accounted for around 46 per cent of global exports of services,
whereas India was the 5th largest exporter (Table 3.1.2.1).
Although both India and EU trade in transportation services, the EU has a much larger
share in global trade than India as shown in Table 3.1.2.1. This table also highlights the
relative position for construction services since a large part of this includes transport-
related construction. However, it should be noted that a substantial part of the EU’s
trade in transport and construction services is within EU member states.
Table 3.1.2.1: ranking of india and the eU in global services
(in US $ billion)
india eU extra-eUWorld Total
ValueShare (%) Rank Value
Share (%) Rank Value
Share (%) Rank Value
exports
Commercial Services (2008)
102.6 (70) 2.7 5th 1754
(1199) 46.4 1st 743.2 (508) 19.7 1st 3778
(2582)
Transportation Services (2008) 11.1 (8) 0.6 11th 402.7
(275) 45.2 1st 0.2 (0.1) 21.9 1st 890
(608)
Construction Services (2007)
0.8 (0.6) 1.3 9th 38.4
(28.1) 58.4 1st 21.7 (15.9) 32.9 1st 65.8
(48.1)
imports
Commercial Services (2008)
83.6 (57) 2.4 7th 1512.6
(1034) 43.4 1st 620.7 (424.2) 17.8 1st 3489
(2384)
Transportation Services (2008)
41.4 (28) 4.0 5th 363.6
(248) 34.8 1st 162.1 (110.8) 15.5 1st 1045
(714)
Construction Services (2007)
691 (505) 1.1 11th 26.0
(19) 41.2 1st 10.6 (7.7) 16.6 1st 63.2
(46.2)
Source: Compiled by the authors from WTO (2009), Table III.4 (p.123), Table III.17 (p.139), Table A8 (p.189-191) and Table A9 (p.192-194).
Note: Figures in parentheses are Euro (€) equivalents. These were calculated using the average exchange rate for the year 2008 ($1 = €0.6834) and for 2007 ($1 = €0.7308). Source: http://www.oanda.com/.
56 WTO (2009). This figure is calculated using the average exchange rate for the year 2008 ($1 = €0.7042) and for 1998 ($1 = €0.8539). Source: http://www.oanda.com/
NON-TARIFF BARRIERS IN THE TRANSPORT AND LOGISTICS SECTORS: INDIA
30 INDIA-Eu TRADE, INvESTmENT AND COLLABORATION
HO
ME
| C
ON
TEN
TS |
SE
CTI
ON
- 1
| 2
| 3
| 4
| 5
| 6
| 7

Trade in services is a growing component of EU-India bilateral trade. The EU is India’s
second largest trading partner in services (after the US). India-EU services trade
increased more than 3.6 times between 2003 and 2008 and reached €15.6 billion in
2008. India is a net exporter of services to the rest of the world, but it is a net importer
from the EU. In 2008, India had a trade deficit of €2.4 billion with the EU.
Table 3.1.2.1 shows that in the transportation and construction services sector, India
has a negative trade balance with the EU. In 2006, India’s exports of transportation
and construction services stood at €1.4 billion and €0.1 billion, respectively, whereas
imports were valued at €2.3 billion and €0.2 billion, respectively.
Table 3.1.2.2: india’s Trade in services with the eU in 2008
(in € billion)
services exports imports Trade Balance
Transportation 2.8 1.5 -1.1
Travel 0.9 1.9 0.9
Other Services 5.2 3.3 -2.3
Computer & IT 0.4 0.9 0.5
Communications 0.2 0.2 0.1
Construction 0.3 0.1 -0.2
Financial 0.3 0.1 -0.2
Other government services 0.3 0.1 -0.2
Insurance 0.1 0.0 -0.1
Royalties & licence fees 0.3 0.1 -0.2
Cultural & recreational 0.0 0.0 0.0
Other business services 3.0 2.2 -0.8
Source: Extracted from 4th Table, News release no. 157/2009 dated November 4, 2009. http://epp.eurostat.ec.europa.eu/portal/page/portal/publications/collections/news_releases.
NON-TARIFF BARRIERS IN THE TRANSPORT AND LOGISTICS SECTORS: INDIA
31INDIA-Eu TRADE, INvESTmENT AND COLLABORATION
HO
ME
| C
ON
TEN
TS |
SE
CTI
ON
- 1
| 2
| 3
| 4
| 5
| 6
| 7
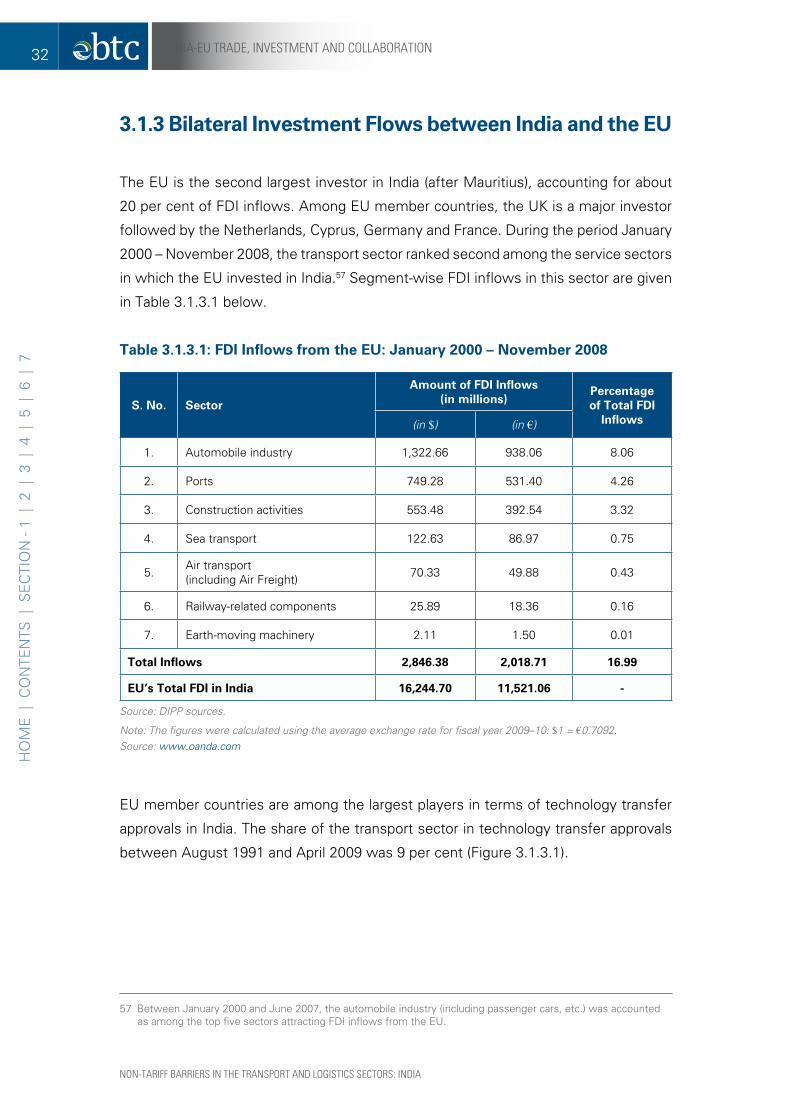
3.1.3 Bilateral investment flows between india and the eU
The EU is the second largest investor in India (after Mauritius), accounting for about
20 per cent of FDI inflows. Among EU member countries, the UK is a major investor
followed by the Netherlands, Cyprus, Germany and France. During the period January
2000 – November 2008, the transport sector ranked second among the service sectors
in which the EU invested in India.57 Segment-wise FDI inflows in this sector are given
in Table 3.1.3.1 below.
Table 3.1.3.1: fdi inflows from the eU: January 2000 – November 2008
s. No. sector
amount of fdi inflows(in millions)
percentage of Total fdi
inflows(in $) (in €)
1. Automobile industry 1,322.66 938.06 8.06
2. Ports 749.28 531.40 4.26
3. Construction activities 553.48 392.54 3.32
4. Sea transport 122.63 86.97 0.75
5. Air transport (including Air Freight) 70.33 49.88 0.43
6. Railway-related components 25.89 18.36 0.16
7. Earth-moving machinery 2.11 1.50 0.01
Total inflows 2,846.38 2,018.71 16.99
eU’s Total fdi in india 16,244.70 11,521.06 -
Source: DIPP sources.
Note: The figures were calculated using the average exchange rate for fiscal year 2009–10: $1 = €0.7092. Source: www.oanda.com
EU member countries are among the largest players in terms of technology transfer
approvals in India. The share of the transport sector in technology transfer approvals
between August 1991 and April 2009 was 9 per cent (Figure 3.1.3.1).
57 Between January 2000 and June 2007, the automobile industry (including passenger cars, etc.) was accounted as among the top five sectors attracting FDI inflows from the EU.
NON-TARIFF BARRIERS IN THE TRANSPORT AND LOGISTICS SECTORS: INDIA
32 INDIA-Eu TRADE, INvESTmENT AND COLLABORATION
HO
ME
| C
ON
TEN
TS |
SE
CTI
ON
- 1
| 2
| 3
| 4
| 5
| 6
| 7
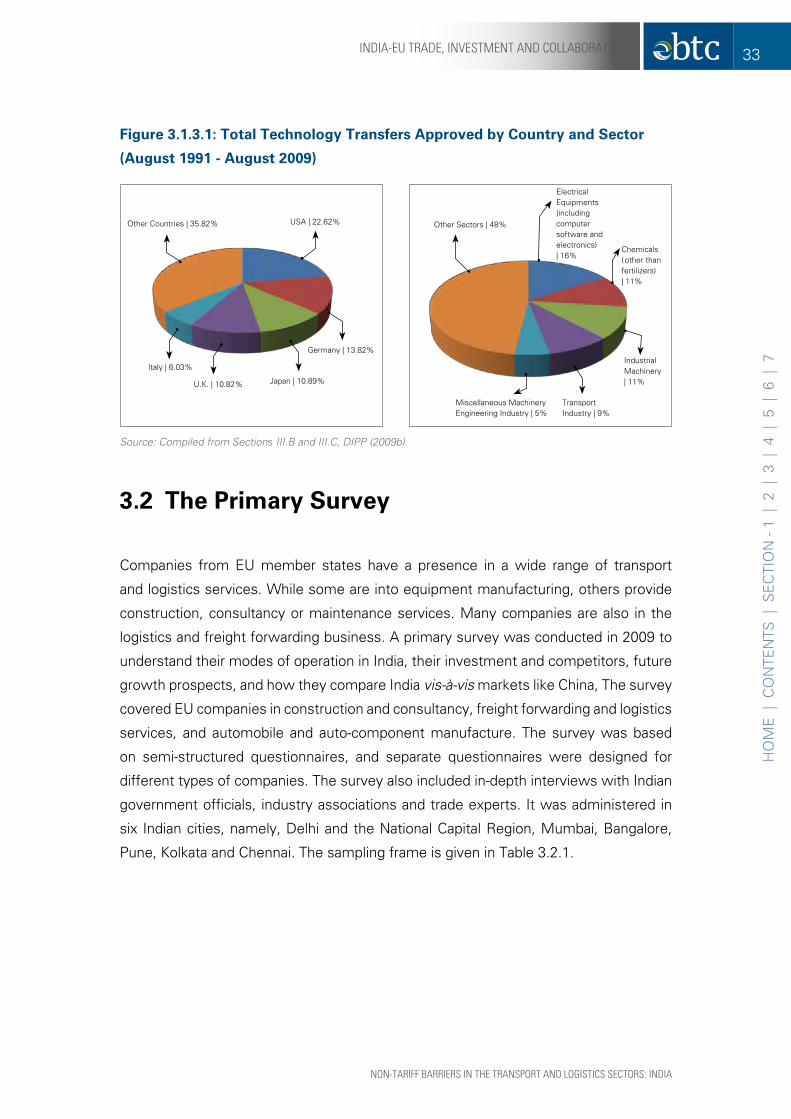
figure 3.1.3.1: Total Technology Transfers approved by country and sector
(august 1991 - august 2009)
Electrical Equipments (including computer software and electronics) | 16%
Chemicals ( other than fertilizers) | 11%
Industrial Machinery | 11%
Transport Industry | 9%
Miscellaneous Machinery Engineering Industry | 5%
Other Sectors | 48%Other Countries | 35.82% USA | 22.62%
Germany | 13.82%
Japan | 10.89%U.K. | 10.82%
Italy | 6.03%
Source: Compiled from Sections III.B and III.C, DIPP (2009b).
3.2 The primary survey
Companies from EU member states have a presence in a wide range of transport
and logistics services. While some are into equipment manufacturing, others provide
construction, consultancy or maintenance services. Many companies are also in the
logistics and freight forwarding business. A primary survey was conducted in 2009 to
understand their modes of operation in India, their investment and competitors, future
growth prospects, and how they compare India vis-à-vis markets like China, The survey
covered EU companies in construction and consultancy, freight forwarding and logistics
services, and automobile and auto-component manufacture. The survey was based
on semi-structured questionnaires, and separate questionnaires were designed for
different types of companies. The survey also included in-depth interviews with Indian
government officials, industry associations and trade experts. It was administered in
six Indian cities, namely, Delhi and the National Capital Region, Mumbai, Bangalore,
Pune, Kolkata and Chennai. The sampling frame is given in Table 3.2.1.
NON-TARIFF BARRIERS IN THE TRANSPORT AND LOGISTICS SECTORS: INDIA
33INDIA-Eu TRADE, INvESTmENT AND COLLABORATION
HO
ME
| C
ON
TEN
TS |
SE
CTI
ON
- 1
| 2
| 3
| 4
| 5
| 6
| 7
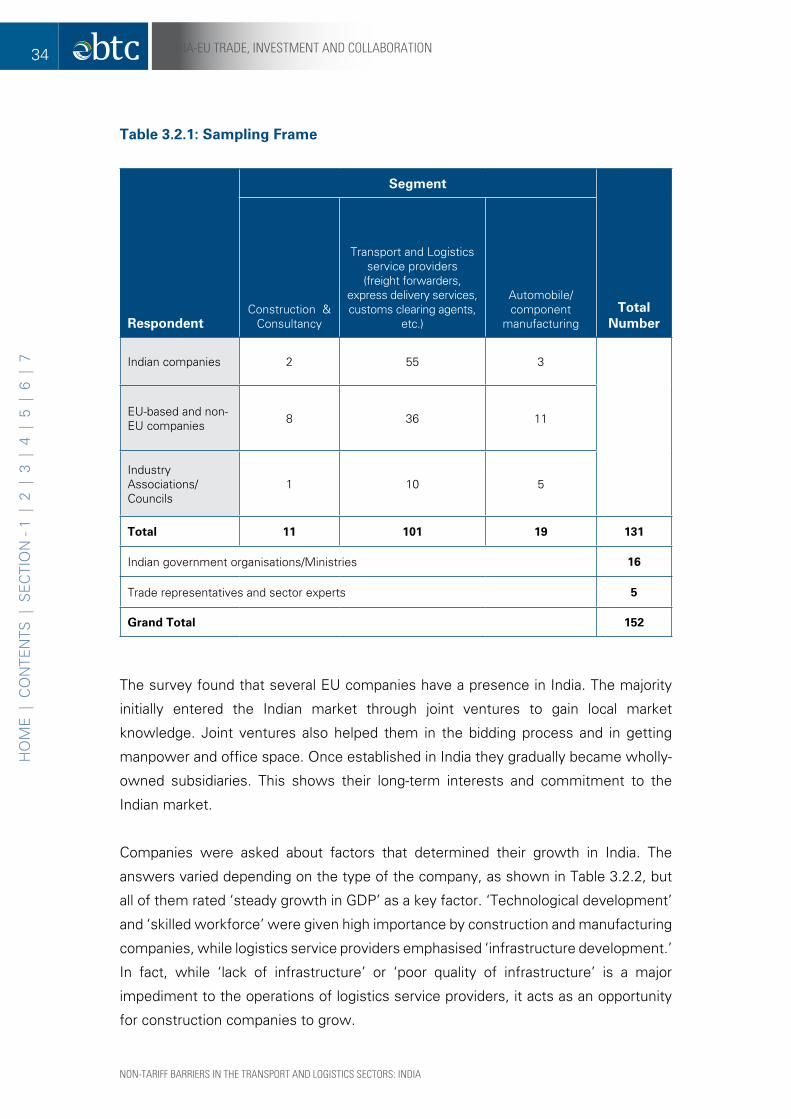
Table 3.2.1: sampling frame
respondent
segment
Total Number
Construction & Consultancy
Transport and Logistics service providers
(freight forwarders, express delivery services, customs clearing agents,
etc.)
Automobile/ component
manufacturing
Indian companies 2 55 3
EU-based and non-EU companies 8 36 11
Industry Associations/ Councils
1 10 5
Total 11 101 19 131
Indian government organisations/Ministries 16
Trade representatives and sector experts 5
grand Total 152
The survey found that several EU companies have a presence in India. The majority
initially entered the Indian market through joint ventures to gain local market
knowledge. Joint ventures also helped them in the bidding process and in getting
manpower and office space. Once established in India they gradually became wholly-
owned subsidiaries. This shows their long-term interests and commitment to the
Indian market.
Companies were asked about factors that determined their growth in India. The
answers varied depending on the type of the company, as shown in Table 3.2.2, but
all of them rated ‘steady growth in GDP’ as a key factor. ‘Technological development’
and ‘skilled workforce’ were given high importance by construction and manufacturing
companies, while logistics service providers emphasised ‘infrastructure development.’
In fact, while ‘lack of infrastructure’ or ‘poor quality of infrastructure’ is a major
impediment to the operations of logistics service providers, it acts as an opportunity
for construction companies to grow.
NON-TARIFF BARRIERS IN THE TRANSPORT AND LOGISTICS SECTORS: INDIA
34 INDIA-Eu TRADE, INvESTmENT AND COLLABORATION
HO
ME
| C
ON
TEN
TS |
SE
CTI
ON
- 1
| 2
| 3
| 4
| 5
| 6
| 7

Table 3.2.2: perception ranking of factors responsible for growth in india(in percentage)
factor
Logistics service providers
construction & consultancy
equipment/auto Manufacturers
Very Important Important
Very Important Important
Very Important Important
Globalisation 44 56 - - 70 20
FDI allowed in sector 44 56 - - - -
Steady growth in GDP 89 11 100 - 90 10
Infrastructure development 89 - 100 - 40 40
Central Govt. Policy 56 22 100 - 100 -
State Govt. Policy 22 22 33 33 60 40
Scope for upgrading to value-added services 11 56 - - - -
Transparency in bidding - - 66 33 - -
Technological development - - 100 - 100 -
Skilled workforce - - 100 - 90 10
Collaboration with Indian partner - - - 33 10 -
Machinery upgrading - - - - 100 -
Consumer demand - - - - 90 -
Source: Computed by the authors from the survey.
Note: Respondents were asked to rank the factors on a scale of 1–5, with 1 being “very important” and 2 “important”. If companies did not attach importance to a factor, the cell was left blank.
The survey found that Indian and EU companies have trade complementarities in the
transport and logistics sectors. The Indian companies have local market knowledge,
are more flexible in their operations and have lower costs. On the other hand, EU
companies have a wider global reach, better technology, higher standards, and can
invest more on R&D. However, the costs of operation of EU companies are high and
their knowledge of the local market is low. Due to high costs, they face competition
not only from Indian companies but from other countries like China. Partnerships with
Indian companies have helped them mitigate some of these disadvantages.
In the automobile and auto-component manufacturing segments, a large number of
EU companies have a presence in India, either to service the growing Indian market
or to export their products. Table 3.2.3 lists some EU automobile and auto-component
manufacturing companies and their presence in India. India is an automobile and auto-
NON-TARIFF BARRIERS IN THE TRANSPORT AND LOGISTICS SECTORS: INDIA
35INDIA-Eu TRADE, INvESTmENT AND COLLABORATION
HO
ME
| C
ON
TEN
TS |
SE
CTI
ON
- 1
| 2
| 3
| 4
| 5
| 6
| 7

component manufacturing hub for EU companies, and increasingly they are outsourcing
from India to reduce costs. Many companies such as BMW (Bayerische Motoren Werke
AG) (Germany), Bosch GmbH (Germany) and AB Volvo (Sweden) have international
purchase offices in India. Some EU auto-component manufacturing companies supply
parts to Indian automobile manufacturers like Tata Motors. The survey found that many
of their clients (30 to 60 per cent of the total) are fixed clients. Most of the companies
pointed out that the current size of the Indian market is small (around 2 per cent compared
to their global operations) but it is increasing at a rapid pace (30 per cent per annum).
There is intense competition in the small car segment. The Indian domestic market
is small for high-end luxury cars compared to countries like China. However, German
companies like Audi AG, BMW and Mercedes-Benz have rapid expansion plans in
India. In fact, during the survey, Audi pointed out that the growth in 2009 was likely to
be 70 per cent more than in the previous year.
In the heavy commercial vehicles segment, Indian companies like TELCO (Tata
Engineering and Locomotive Company Limited), Ashok Leyland Limited and the Eicher
Group have strong positions. Volvo has been successful in entering the Indian public
transport segment. It is working with state transport corporations like the Bangalore
Metropolitan Transport Corporation to supply buses. It also has a strong presence in
the inter-city transportation segment.
During the survey, EU companies pointed out that the average wage bill in India is
lower than that in Europe (25 per cent of the cost of operations against 40 per cent in
Europe) and that has helped them lower costs and maintain global competitiveness.
The companies also pointed out that they do not have problems in getting licences/
clearances to set up operations, in getting skilled labour and in importing machinery.
EU companies have also established a presence or shown interest in other
manufacturing segments. In railways, EU companies have shown an interest in rolling
stock and component manufacturing. For instance, Siemens Transportation System
(Germany) has tied up with the public sector enterprise, Rail India Technical and
Economic Services (RITES), to produce wagons. Indian companies also cater to a
number of EU clients. In ship building, Indian capacity is smaller than in countries like
Korea, Japan and China but it has a number of clients from EU member states such
as Denmark. For instance, in 2007, Larsen and Toubro (L&T) got a €67.04 million
contract for ship construction from the Netherlands-based company, BigLift Shipping
BV, which is part of the Spliethoff Group of the Netherlands.
NON-TARIFF BARRIERS IN THE TRANSPORT AND LOGISTICS SECTORS: INDIA
36 INDIA-Eu TRADE, INvESTmENT AND COLLABORATION
HO
ME
| C
ON
TEN
TS |
SE
CTI
ON
- 1
| 2
| 3
| 4
| 5
| 6
| 7
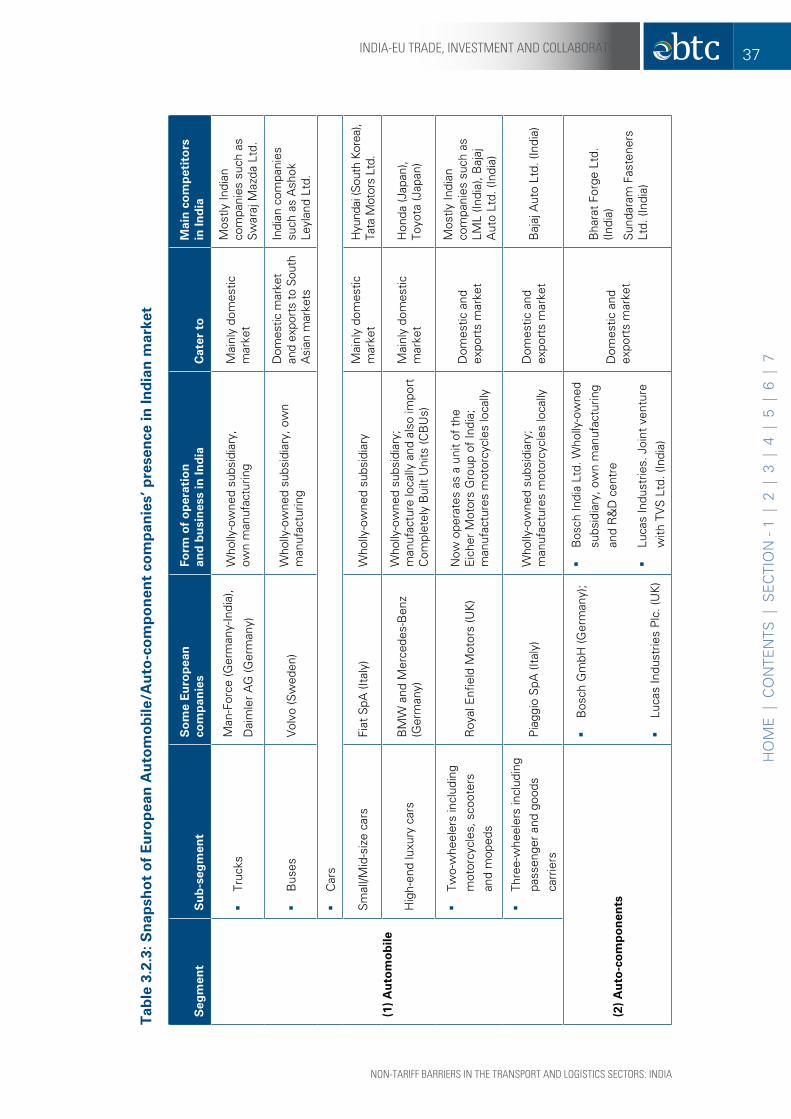
Tab
le 3
.2.3
: sn
apsh
ot
of
eu
rop
ean
au
tom
ob
ile/a
uto
-co
mp
on
ent
com
pan
ies’
pre
sen
ce in
ind
ian
mar
ket
seg
men
ts
ub
-seg
men
t s
om
e e
uro
pea
n
com
pan
ies
form
of
op
erat
ion
an
d b
usi
nes
s in
ind
iac
ater
to
Mai
n c
om
pet
ito
rs
in in
dia
(1)
au
tom
ob
ile
��Tr
ucks
Man
-For
ce (G
erm
any-
Indi
a),
Dai
mle
r A
G (G
erm
any)
Who
lly-o
wne
d su
bsid
iary
, ow
n m
anuf
actu
ring
Mai
nly
dom
estic
m
arke
t
Mos
tly In
dian
co
mpa
nies
suc
h as
S
war
aj M
azda
Ltd
.
��B
uses
Vol
vo (S
wed
en)
Who
lly-o
wne
d su
bsid
iary
, ow
n m
anuf
actu
ring
Dom
estic
mar
ket
and
expo
rts
to S
outh
A
sian
mar
kets
Indi
an c
ompa
nies
su
ch a
s A
shok
Le
ylan
d Lt
d.
��C
ars
Sm
all/M
id-s
ize
cars
Fiat
SpA
(Ita
ly)
Who
lly-o
wne
d su
bsid
iary
Mai
nly
dom
estic
m
arke
tH
yund
ai (S
outh
Kor
ea),
Tata
Mot
ors
Ltd.
Hig
h-en
d lu
xury
car
sB
MW
and
Mer
cede
s-B
enz
(Ger
man
y)
Who
lly-o
wne
d su
bsid
iary
; m
anuf
actu
re lo
cally
and
als
o im
port
C
ompl
etel
y B
uilt
Uni
ts (C
BU
s)
Mai
nly
dom
estic
m
arke
tH
onda
(Jap
an),
Toyo
ta (J
apan
)
��Tw
o-w
heel
ers
incl
udin
g m
otor
cycl
es, s
coot
ers
and
mop
eds
Roy
al E
nfiel
d M
otor
s (U
K)
Now
ope
rate
s as
a u
nit
of t
he
Eic
her
Mot
ors
Gro
up o
f In
dia;
m
anuf
actu
res
mot
orcy
cles
loca
lly
Dom
estic
and
ex
port
s m
arke
t
Mos
tly In
dian
co
mpa
nies
suc
h as
LM
L (In
dia)
, Baj
aj
Aut
o Lt
d. (I
ndia
)
��Th
ree-
whe
eler
s in
clud
ing
pass
enge
r an
d go
ods
carr
iers
Pia
ggio
SpA
(Ita
ly)
Who
lly-o
wne
d su
bsid
iary
; m
anuf
actu
res
mot
orcy
cles
loca
llyD
omes
tic a
nd
expo
rts
mar
ket
Baj
aj A
uto
Ltd.
(Ind
ia)
(2)
au
to-c
om
po
nen
ts
��B
osch
Gm
bH (G
erm
any)
;
��Lu
cas
Indu
strie
s P
lc. (
UK
)
��B
osch
Indi
a Lt
d. W
holly
-ow
ned
subs
idia
ry, o
wn
man
ufac
turin
g an
d R
&D
cen
tre
��Lu
cas
Indu
strie
s. J
oint
ven
ture
w
ith T
VS
Ltd
. (In
dia)
Dom
estic
and
ex
port
s m
arke
t
Bha
rat
Forg
e Lt
d.
(Indi
a)
Sun
dara
m F
aste
ners
Lt
d. (I
ndia
)
NON-TARIFF BARRIERS IN THE TRANSPORT AND LOGISTICS SECTORS: INDIA
37INDIA-Eu TRADE, INvESTmENT AND COLLABORATION
HO
ME
| C
ON
TEN
TS |
SE
CTI
ON
- 1
| 2
| 3
| 4
| 5
| 6
| 7

Construction and consultancy related to transport and logistics is also a prime area
of investment by EU companies in India. Some companies which originated in EU
member states, such as L&T, have had a presence in India for a number of years,
while others like Isolux Corsan (Spain) have recently entered the Indian market. During
the survey, it was pointed out that the recent focus of the Indian government on
infrastructure development offers huge opportunities for EU companies. Table 3.2.4
shows that EU companies have a presence across a wide range of infrastructure
projects. These include construction of highways, underground tunnelling for metro
rail, and sub-sea sewage tunnels and bridges. The modes of operations include BOT
and BOOT, and the services range from turnkey projects to specific constructions.
Many of them are involved in consultancy services and in maintenance, design,
feasibility studies, technical audit, planning, project management and engineering.
They are also involved in transport-related IT development (such as transport
management software), traffic projections and traffic control systems, development
and implementation of automation and safety systems, and toll management and
parking management. For infrastructure projects, EU companies prefer to operate in
joint ventures or a consortium where they provide technical expertise while the Indian
partner handles legal and other issues.
EU companies did not have a large presence in the early years of national highway
construction (which was dominated by companies from countries like Malaysia, Russia
and Turkey), but of late their presence in this area has increased. The survey found
that while EU companies face competition in general construction areas like road
construction due to their higher charges, they seem to do well in complex construction
projects like underground tunnels for metro rail or projects in which sophisticated
technologies are required. In ports, shipping companies such as the Maersk Group
have made significant investments in JNPT and Port Pipavav in India.
NON-TARIFF BARRIERS IN THE TRANSPORT AND LOGISTICS SECTORS: INDIA
38 INDIA-Eu TRADE, INvESTmENT AND COLLABORATION
HO
ME
| C
ON
TEN
TS |
SE
CTI
ON
- 1
| 2
| 3
| 4
| 5
| 6
| 7

Tab
le 3
.2.4
: sn
apsh
ot
of
eu
rop
ean
co
nst
ruct
ion
an
d c
on
sult
ancy
(c
&c
) co
mp
anie
s’ p
rese
nce
in t
he
ind
ian
mar
ket
seg
men
te
uro
pea
n c
om
pan
ies
form
of
op
erat
ion
an
d b
usi
nes
s in
ind
iaT
ype
of
pro
ject
s u
nd
erta
ken
Mai
n c
om
pet
ito
rs in
ind
ia
1. c
on
stru
ctio
n��
Som
a Is
olux
Ltd
. (In
dia-
Spa
in)
��D
YW
IDA
G In
tern
atio
nal
Gm
bH (D
YW
IDA
G)(G
erm
any)
��S
oma
Isol
ux is
a c
onso
rtiu
m o
f S
oma
Ent
erpr
ises
of
Indi
a an
d Is
olux
Cor
san
of S
pain
��D
YW
IDA
G In
dia
(P) L
td. –
w
holly
-ow
ned
subs
idia
ry
��S
oma
Isol
ux h
as u
nder
take
n ro
ad
and
high
way
con
stru
ctio
n pr
ojec
ts
��D
YW
IDA
G is
invo
lved
in
cons
truc
ting
unde
rgro
und
sect
ions
in
Del
hi M
etro
pro
ject
s.
Indi
an c
ompa
nies
suc
h as
La
rsen
& T
oubr
o Lt
d. (L
&T)
; G
amm
on In
dia
in r
oad
&
high
way
con
stru
ctio
n; IR
CO
N
in a
ll ty
pes
of in
fras
truc
ture
pr
ojec
ts.
2. c
on
sult
ancy
��H
alcr
ow G
roup
Ltd
(UK
)
��S
YS
TRA
S.A
. (S
ystè
mes
de
Tran
spor
t) (F
ranc
e)
��A
lsto
m T
rans
port
S.A
(Fra
nce)
��H
alcr
ow C
onsu
lting
Indi
a P
vt.
Ltd.
(HC
IPL)
– W
holly
-ow
ned
subs
idia
ry
��S
YS
TRA
MV
A C
onsu
lting
Indi
a P
vt. L
td. -
sub
sidi
ary
��A
LSTO
M P
roje
cts
Indi
a Lt
d.(A
PIL
) – m
ajor
ity-o
wne
d su
bsid
iary
��H
CIP
L pr
ovid
es c
onsu
ltanc
y an
d pl
anni
ng s
ervi
ces
in h
ighw
ays,
br
idge
s, r
ailw
ays,
civ
il en
gine
erin
g,
etc.
��S
YS
TRA
has
pro
vide
d co
nsul
tanc
y so
lutio
ns t
o In
dian
Rai
lway
s;
desi
gn d
evel
opm
ent
for
over
head
se
ctio
ns, s
tatio
n eq
uipm
ent
for
met
ro r
ail t
rans
port
pro
ject
s. A
PIL
ha
s un
dert
aken
dev
elop
men
t,
desi
gn a
nd m
anuf
actu
re o
f ch
air
cars
/ coa
ches
for
Indi
an R
ailw
ays;
de
sign
, man
ufac
ture
, ins
talla
tion,
&
com
mis
sion
ing
of a
utom
atic
tra
in
cont
rol a
nd s
igna
lling
sys
tem
s in
m
etro
rai
l pro
ject
s.
L&T-
Ram
boll
Con
sulti
ng
Eng
inee
rs L
td. (
Indi
a-D
enm
ark)
; R
elia
nce
Infr
astr
uctu
re L
td.
(Indi
a) f
or r
oad
and
airp
ort
proj
ects
.
RIT
ES
for
rai
lway
pro
ject
s.
NON-TARIFF BARRIERS IN THE TRANSPORT AND LOGISTICS SECTORS: INDIA
39INDIA-Eu TRADE, INvESTmENT AND COLLABORATION
HO
ME
| C
ON
TEN
TS |
SE
CTI
ON
- 1
| 2
| 3
| 4
| 5
| 6
| 7

Inter-government agreements play a key role in the case of the railways which is
still a government monopoly. For instance, in 2008 the Ministry of Railways signed
a Memorandum of Understanding (MoU) with French National Railways SNCF
International (Société Nationale des Chemins de Fer) to develop high-speed lines and
enhance the capacity of freight corridors. Similar agreements have been signed with
Germany, Italy and Austria for technical help and co-operation. French companies
such as Alstom Transport SA and Alcatel CGA Transport have been present in India
for a long time. They provide services such as automatic fare collection systems,
signalling and telecommunications systems, and electrification and maintenance of
railway tracks, among others.58
Many EU companies have PPP projects with the Indian government. When asked
about the size of the Indian market and future growth potential, they said that on
average, the revenue from their Indian operations accounted for less than 5 per cent
of their total global revenue. However, the Indian market is growing, whereas the
European market is becoming saturated. They projected the growth rate in India at
between 40 to 100 per cent – which is very high. The companies pointed out that they
did not have any major problems in importing machinery or getting labour. However,
the labour regulations are cumbersome.
With infrastructure development, liberalisation and the integration of the Indian
economy with the world, the scope for providing passenger and goods transportation
has increased. The EU airlines pointed out that they have gained from the open sky
policy of the Indian government. Airport infrastructure is improving but they raised
concerns about the ground-handling policy and high airport charges in India (which are
discussed in Section 4). The survey found that there is intense competition among
airline companies from EU member states.
In shipping, especially container shipping, EU companies have the dominant share.
Five companies, namely, A.P. Moller-Maersk Group (Denmark), Mediterranean
Shipping Company S.A (MSC) (USA), CMA CGM S.A (France),59 Evergreen Shipping
Line (Taiwan) and Hapag Lloyd AG (Germany), account for 45 per cent of the market.
The survey found that code-sharing and cargo-sharing agreements have helped the
companies expand their operations. In future, passenger and goods flow between
India and the EU is likely to increase with the signing of the BTIA and reduction in
58 http://www.delhimetrorail.com/corporates/tenders/major_contractors.html
59 Named after the merger of two companies – Compagnie Générale Maritime and Compagnie Maritime d'Affrètement.
NON-TARIFF BARRIERS IN THE TRANSPORT AND LOGISTICS SECTORS: INDIA
40 INDIA-Eu TRADE, INvESTmENT AND COLLABORATION
HO
ME
| C
ON
TEN
TS |
SE
CTI
ON
- 1
| 2
| 3
| 4
| 5
| 6
| 7

trade barriers. This provides opportunities for EU airline and shipping companies. With
the growth of bilateral trade and the development of shipping and air transport, allied
sectors such as maritime insurance have also benefited.
A large number of EU companies have a presence in freight transportation and
logistics. Table 3.2.5 lists some companies and their modes of operation in India.
Companies such as DHL have a wide network of operations in India and provide end-
to-end logistics services; it also offers express delivery services. The survey found
that the share of the Indian market in EU companies’ total logistics business is small
(around 3 per cent) but it is growing at a rapid pace (20-25 per cent). Around 90 per
cent of the survey respondents pointed out that they are expanding their operations
either in terms of covering more cities, offering additional services or increasing
investment in equipment and technology. EU companies are expanding their
operations through joint ventures, alliances and strategic partnerships. For instance,
France-based GeoPost Intercontinental has bought a 60 per cent share in the Delhi-
based Continental Air Express. The survey found that most EU companies begin their
operations in the western, southern or northern parts of India (where business and
trade are concentrated) and then gradually spread to the east. The survey also found
that while EU companies have a strong presence in logistics, their presence is limited
in certain sub-segments (such as cold chains) where India needs investment. The
EU companies want to invest in dedicated freight corridors for railway transport and
dedicated gateways in airports.
NON-TARIFF BARRIERS IN THE TRANSPORT AND LOGISTICS SECTORS: INDIA
41INDIA-Eu TRADE, INvESTmENT AND COLLABORATION
HO
ME
| C
ON
TEN
TS |
SE
CTI
ON
- 1
| 2
| 3
| 4
| 5
| 6
| 7

Tab
le 3
.2.5
: sn
apsh
ot
of
eu
rop
ean
Lo
gis
tics
ser
vice
pro
vid
ers
(fre
igh
t fo
rwar
der
s, e
xpre
ss d
eliv
ery
serv
ices
pro
vid
ers,
cu
sto
ms
clea
rin
g a
gen
ts, e
tc.)
in in
dia
so
me
eu
rop
ean
co
mp
anie
s fo
rm o
f o
per
atio
n/
bu
sin
ess
are
a o
f sp
ecia
lisat
ion
Mai
n c
om
pet
ito
rs in
ind
ia
��D
euts
che
Pos
t D
HL
(DP
DH
L)
(Ger
man
y)
��Th
omas
Nat
ionw
ide
Tran
spor
t N
.V (T
NT)
(N
ethe
rland
s)
��C
MA
CG
M G
loba
l (In
dia)
Pvt
. Li
mite
d (F
ranc
e)
��E
xper
t Lo
gist
ics
Pvt
. Lim
ited
(UK
)
��S
eaw
ays
Rhe
nus
Logi
stic
s Li
mite
d (G
erm
any)
��D
achs
er G
mbh
(Ger
man
y)
��D
SV
Air
& S
ea H
oldi
ng A
/S
(Den
mar
k)
��D
omes
tic s
ervi
ces
of D
PD
HL
are
offe
red
thro
ugh
Blu
e D
art
Exp
ress
Indi
a Lt
d. w
hich
is
ful
ly o
wne
d by
DP
DH
L
��TN
T In
dia
Ltd.
– w
holly
-ow
ned
subs
idia
ry
��C
MA
CG
M G
loba
l (In
dia)
Pvt
. Ltd
. -
subs
idia
ry
��E
xper
t Lo
gist
ics
Indi
a P
vt. L
td. -
sub
sidi
ary
of U
K-b
ased
DR
L H
oldi
ngs
Ltd.
��Jo
int
vent
ure
betw
een
Sea
way
s G
roup
of
Indi
a an
d R
henu
s A
G &
Co.
KG
of
Ger
man
y
��A
FL D
achs
er P
vt. L
imite
d is
a jo
int
vent
ure
betw
een
AFL
Car
go a
nd D
achs
er G
mbH
, of
Ger
man
y
��D
SV
Air
and
Sea
Indi
a P
vt. L
td. –
who
lly-
owne
d su
bsid
iary
��D
PD
HL,
TN
T - s
peci
alis
e in
exp
ress
del
iver
y se
rvic
es
��C
MA
CG
M -
spec
ialis
es in
con
tain
er
ship
ping
ser
vice
s
��E
xper
t Lo
gist
ics
Indi
a P
vt. L
td. p
rovi
des
inte
grat
ed lo
gist
ics
serv
ices
��S
eaw
ays
Rhe
nus
Logi
stic
s Lt
d pr
ovid
es
inte
grat
ed lo
gist
ics
serv
ices
incl
udin
g co
ld
stor
age
serv
ices
��A
FL D
asch
er p
rovi
des
ocea
n an
d ai
r fr
eigh
t se
rvic
es, c
usto
ms
clea
ranc
e an
d in
tegr
ated
m
anag
emen
t so
lutio
ns in
pro
ject
car
go
��D
SV
off
ers
air
and
sea
frei
ght
tran
spor
t,
dom
estic
dis
trib
utio
n, w
areh
ousi
ng,
cust
oms
clea
ranc
e se
rvic
es.
Des
k-to
-Des
k C
ourie
r (D
TDC
) (In
dia)
, Uni
ted
Par
cel S
ervi
ce (U
PS
) (U
SA
) in
expr
ess
deliv
ery
serv
ices
Shi
ppin
g C
orpo
ratio
n of
Indi
a Li
mite
d. (S
CI),
Med
iterr
anea
n S
hipp
ing
Com
pany
(MS
C) (
US
A) i
n co
ntai
ner
ship
ping
ser
vice
s
Pan
alpi
na G
roup
of
Sw
itzer
land
, B
roek
man
Log
istic
s Lt
d. o
f N
ethe
rland
s, a
nd A
PL
Logi
stic
s Lt
d. (S
inga
pore
) in
inte
grat
ed
logi
stic
s se
rvic
es.
NON-TARIFF BARRIERS IN THE TRANSPORT AND LOGISTICS SECTORS: INDIA
42 INDIA-Eu TRADE, INvESTmENT AND COLLABORATION
HO
ME
| C
ON
TEN
TS |
SE
CTI
ON
- 1
| 2
| 3
| 4
| 5
| 6
| 7
3.3 india-eU collaboration: implications for the Transport sector
India’s relations with the EU date back to 1962 when India was among the first countries
to set up diplomatic relations with the European Economic Community (EEC). This
relationship deepened over the years, but was primarily confined to economic co-
operation, trade and development issues. It took a new turn with the Lisbon Summit
of June 2000 and, in this and the following two summits, the focus was on building a
‘Strategic Partnership’. So far, the two economies have had 10 summits alternately in
India and in EU member states. At the 5th Summit at The Hague in November 2004,
the relationship was upgraded from an economic one to a Strategic Partnership. India
was the sixth country (after USA, Russia, China, Japan and Canada) to have a strategic
partnership with the EU. In the 6th Summit in Delhi in September 2005, a High-Level
Trade Group (HLTG) was established to explore ways to deepen and widen the bilateral
trade and investment relationship. This HLTG recommended a Broad-based Trade and
Investment Agreement or BTIA in the 7th Summit in Helsinki. In June 2007, the EU and
India began negotiations on the BTIA in Brussels. Several rounds of negotiations have
been completed and the BTIA is likely to be signed by the end of year 2010.
In the field of science and technology, India and the EU signed a Science and Technology
Agreement in 2001. The agreement covers sustainable development and also includes
a legal framework to safeguard intellectual property rights. Under this agreement,
both Indian and EU researchers can access each other’s research programmes. EU’s
Galileo project60 is an important example of India-EU strategic partnership. India and
the EU are also jointly working on clean technologies which have implications for the
transport sector.
In 2004, India and the EU signed a Customs Co-operation Agreement to make customs
procedures less complex and facilitate trade pertaining to customs in accordance with
international standards. The agreement also provides for the exchange of information
and mutual administrative assistance for countering fraud against respective customs
legislation.
Since 1984, the research and innovation activities of the EU have been grouped under
the Framework Programme (FP). The Sixth Framework Programme (FP6) (2002–2006)
had a budget of €17.5 billion. About 80 projects (out of 5,300) funded through FP6
60 The Galileo Project is a satellite-based navigation system based on a constellation of 30 satellites orbiting at 24,000 km similar to the Global Positioning System (GPS) of the US and Russia’s Glonass.
NON-TARIFF BARRIERS IN THE TRANSPORT AND LOGISTICS SECTORS: INDIA
43INDIA-Eu TRADE, INvESTmENT AND COLLABORATION
HO
ME
| C
ON
TEN
TS |
SE
CTI
ON
- 1
| 2
| 3
| 4
| 5
| 6
| 7
involved Indian researchers. The Seventh Framework Programme (FP7) (2007–2013)
is ongoing and the programme has a strong focus on India. Collaborative research
has been identified under nine priority areas in the FP7 programme, one of which is
transport (including aeronautics) with an allocation of €4.2 billion.
At the member country level, India has Bilateral Investment Protection Agreements
(BIPA)61 with 16 of the EU member states and Double Taxation Avoidance Agreements
(DTAA)62 with 18 of the EU member states. This benefits companies from India and
EU member states.
As mentioned earlier the India-EU BTIA will be a comprehensive agreement that
includes the transport and logistics sector. In addition, India and the EU are negotiating
a Horizontal Air Services Agreement and a Maritime Agreement (see below).
a. India-EU Horizontal Air Services Agreement
At the sixth India-EU summit held at New Delhi in September 2005, India and the
EU decided to launch a broad-based dialogue in the sector of civil aviation including
restoring legal certainty to bilateral air services agreements; closer co-operation in
air transport technology, regulation and infrastructure; and assessing the scope for
mutual benefits that could be derived from a more comprehensive co-operation. The
two economies have already had an India-EU Civil Aviation Project which is the largest
bilateral economic co-operation project in India. This project aimed to strengthen civil
air safety and to stimulate co-operation between Indian and EU civil aviation authorities
and aviation industries. Also, India has 26 bilateral air services agreements including
traffic rights with individual EU member states.
The India-EU Horizontal Civil Aviation Agreement was signed on September 29, 2008
at the 9th India-EU Summit in Marseille. This agreement aimed to provide legal certainty
to the 26 bilateral air services agreements that India has had with individual EU member
states by bringing these into conformity with Community law. The agreement does
not cover traffic rights which continue to be negotiated through bilateral arrangements.
Since traffic rights are bilaterally negotiated, the extent of air transport liberalisation
between the EU and India still depends on the bilateral negotiations. The European
61 BIPA encourages, promotes and protects bilateral investments by enforcing the legal rights of investors and by guaranteeing fair and equitable treatment to the investment of the bilateral partner.
62 Double taxation may arise when the jurisdictional connections used by different countries overlap or it may arise when the taxpayer has connections with more than one country. The DTAA protects tax-payers against double taxation. It also provides reduced tax rates on dividends, interest, royalties, technical service fees, etc. received by residents of one country from those in the other.
NON-TARIFF BARRIERS IN THE TRANSPORT AND LOGISTICS SECTORS: INDIA
44 INDIA-Eu TRADE, INvESTmENT AND COLLABORATION
HO
ME
| C
ON
TEN
TS |
SE
CTI
ON
- 1
| 2
| 3
| 4
| 5
| 6
| 7

Commission has proposed negotiating a comprehensive air services agreement
between the EU and India.
b. Bilateral Maritime Agreement between India and the EU
India and the EU are also currently negotiating a bilateral maritime agreement. After the
breakdown of the multilateral negotiations in the maritime sector in the Uruguay Round of
WTO negotiations, the European Council gave a mandate to the European Commission
to negotiate bilateral agreements in the maritime sector with India. Formal negotiations
started in the Seventh India-EU summit at Helsinki, held on October 13, 2006.
The EU side has two key objectives:
�� Legal consolidation and increased market access for EU shipping companies
in India to enable them to establish themselves and carry out door-to-door
business in the country.
�� Establish structured co-operation with India on all major maritime issues
affecting the sector, such as maritime safety and security.
The Indian side, on the other hand, seeks to support employment opportunities
in maritime auxiliary services and ensure the safety of seafarers (relating to the
protection of seafarers involved in alleged crimes on board ships) by facilitating the
participation of investigators as observers in the investigations and a general reference
to co-operation in the International Maritime Organisation (IMO), International Labour
Organization (ILO) and other international forums regarding the safety of seafarers.
During the survey, it was pointed out that the maritime agreement will consolidate the
present market access situation and thus not be a threat to the Indian fleet. On the
contrary, it will boost competition within the Indian shipping industry, increase quality
and reduce costs both for Indian exports and imports inter alia by favouring trans-
shipment in Indian hub-ports. At the same time it will create a framework for future
maritime co-operation and form the basis for exchanging views, best practices, etc. and
thus strengthen relations even further in areas such as maritime safety, security and
training. The agreement will also be a strong signal for investments in infrastructure,
logistics, etc., as experiences have shown in other parts of the world, thus benefiting
the Indian economy at large. However, the progress of the negotiations has been slow.
NON-TARIFF BARRIERS IN THE TRANSPORT AND LOGISTICS SECTORS: INDIA
45INDIA-Eu TRADE, INvESTmENT AND COLLABORATION
HO
ME
| C
ON
TEN
TS |
SE
CTI
ON
- 1
| 2
| 3
| 4
| 5
| 6
| 7

3.4 scope for enhancing Trade, investment and collaboration
The discussion in Section 3.2 shows that EU companies are optimistic about their future
growth prospects in India and most of them predict a very high growth rate. At present,
companies from EU member states are present across all segments of transport
and logistics services. Since the Indian government is focusing on infrastructure
development, there is further scope for investment in India. In the long run, as
infrastructure develops, there will be scope for new services such as toll management
and traffic and parking management. The investment can also shift from provision of
infrastructure to carriage, i.e., facilitating movement of cargoes and passenger using
the newly created infrastructure. For instance, there is scope for investment in inter-
city and intra-city bus transportation, running buses in high-capacity bus corridors and
running and maintaining mass rapid transportation. There is also scope for investment
in cold chains and integrated logistics services. Co-operation in environment-friendly
fuel technologies and lighter, safer and cost-competitive engines and battery-operated
cars can be mutually beneficial. Indian and European companies can have joint R&D
programmes for fuel-efficient technologies. Table 3.4.1 below shows that the present
technical standards differ in India and the EU. Thus, there is scope for collaboration
in streamlining the technical standards across transport equipment and environment-
friendly technologies. Sharing knowledge and information on technical standards
would benefit companies from both India and EU member states.
NON-TARIFF BARRIERS IN THE TRANSPORT AND LOGISTICS SECTORS: INDIA
46 INDIA-Eu TRADE, INvESTmENT AND COLLABORATION
HO
ME
| C
ON
TEN
TS |
SE
CTI
ON
- 1
| 2
| 3
| 4
| 5
| 6
| 7

Table 3.4.1: Technical standards for Logistics sector: india and the eU
s. No. relevant area india eU
1. Tyres for vehicles ‘BIS Certification Mark (BIS Standard Mark)’
The ‘e-mark’ issued by the EC
2. �� Transport Engineering
�� Basic and Production Engineering
�� Civil Engineering
�� Electro-Technical
�� Electronics and IT
�� Mechanical Engineering
�� Management and Systems
�� Metallurgical Engineering
‘BIS Certification Mark (BIS Standard Mark or the ‘ISI Mark’)63
i. Formal type approval and the ‘e-mark’: For automobiles and automotive components, and for in-vehicle electronic subassemblies (ESAs).64
ii. The ‘CE-Mark’ for machinery; electrical equipment; pressure equipment; simple pressure vessels; construction products.
3. Emission Standards ‘Bharat Stage’ fuel emission standards/ norms issued by the Govt. of India.
i. ‘Euro Norms’ for fuel standards, issued by the EC.
ii. Emission limits by car manufacturers are subject to voluntary commitments between auto manufacturers and the EC (the ACEA Agreement); other EC legislations.65
Source: Compiled by the authors.
However, EU companies pointed out that they face barriers in India. These are given
below. If these are addressed in the India-EU BTIA, it will enhance trade, investment
and collaboration.636465
63 Details of standards under each category are listed at the Bureau of Indian Standards (BIS) website, http://www.bis.org.in/sf/nrstd.htm. Standards for automobiles and automotive components are formulated by the Automotive Industry Standards Committee (AISC) under MORTH and BIS.
64 EC Directive 95/54/EC defined acceptable performance criteria for electromagnetic emissions and susceptibility of in-vehicle electronic subassemblies (ESAs). In this, ESAs are defined in two groups: (i) components and (ii) separate technical units (STUs). After-market electronic products fall into ‘components’ that may be fitted to differing makes and models of vehicles. STUs are specific to a given make of vehicle and are usually fitted by the vehicle manufacturer.
65 Emission standards are defined in a series of EU Directives staging the progressive introduction of increasingly stringent standards.
63
64
65 NON-TARIFF BARRIERS IN THE TRANSPORT AND LOGISTICS SECTORS: INDIA
47INDIA-Eu TRADE, INvESTmENT AND COLLABORATION
HO
ME
| C
ON
TEN
TS |
SE
CTI
ON
- 1
| 2
| 3
| 4
| 5
| 6
| 7


4. Barriers faced by eU companies in india
NON-TARIFF BARRIERS IN THE TRANSPORT AND LOGISTICS SECTORS: INDIA
49BARRIERS FACED By Eu COmPANIES IN INDIA
HO
ME
| C
ON
TEN
TS |
SE
CTI
ON
- 1
| 2
| 3
| 4
| 5
| 6
| 7

Although the transport and logistics sector in India has been significantly
liberalised, there are important areas of concern. These include lack of adequate
infrastructure, delays in processing documents, and lack of legal certainty due to the
evolving regulations. The World Bank’s ‘Doing Business Report 2010’,66 which ranks
183 countries in terms of ease of doing business based on 10 indicators, ranked
India 133rd. Table 4.1 shows India’s comparative position vis-à-vis other developing
countries. The indicator, trading across borders, reflects logistics and transportation
issues; on this indicator, India has a much lower rank than China.
Table 4.1: ranking on World Bank’s doing Business report (2010)
parameter india china Brazil
Doing business 133 89 129
Starting a business 169 151 126
Enforcing contracts 182 18 100
Dealing with construction permits 175 180 113
Employing workers 104 140 138
Registering property 93 32 120
Getting credit 30 61 87
Protecting investors 41 93 73
Trading across borders 94 44 100
Closing a business 138 85 131
Paying Taxes 169 125 150
Source: http://www.doingbusiness.org/
Leunig et al. (2009) compare the logistics performance of BRIC countries (Brazil,
Russia, India, and China) with that of a less developed EU member country (Poland)
and a developed EU member country (Germany), and found that air freight costs less
in China than in India. The time taken to clear customs is longer in India than in Russia
or China, and on physical inspection India is the worst among the BRIC countries;
in India, authorities inspect 25 per cent of shipment compared to only 2 per cent
in Germany and 3 per cent in Poland (Table 4.2). The study concluded that if India
adopts international best practices and lowers transportation costs, trade volumes will
increase by 10-20 per cent.
66 This report has been tracking reforms aimed at simplifying business regulations, strengthening property rights, opening up access to credit and enforcing contracts by measuring their impact on 10 indicators. It provides a quantitative measure of regulations for starting a business, dealing with construction permits, employing workers, registering property, getting credit, protecting investors, paying taxes, trading across borders, enforcing contracts and closing a business. Ranking on the ease of doing business is the average of the economy’s ranking on these 10 indicators. Two new economies - Cyprus and Kosovo - have been added to the list.
NON-TARIFF BARRIERS IN THE TRANSPORT AND LOGISTICS SECTORS: INDIA
50 BARRIERS FACED By Eu COmPANIES IN INDIA
HO
ME
| C
ON
TEN
TS |
SE
CTI
ON
- 1
| 2
| 3
| 4
| 5
| 6
| 7
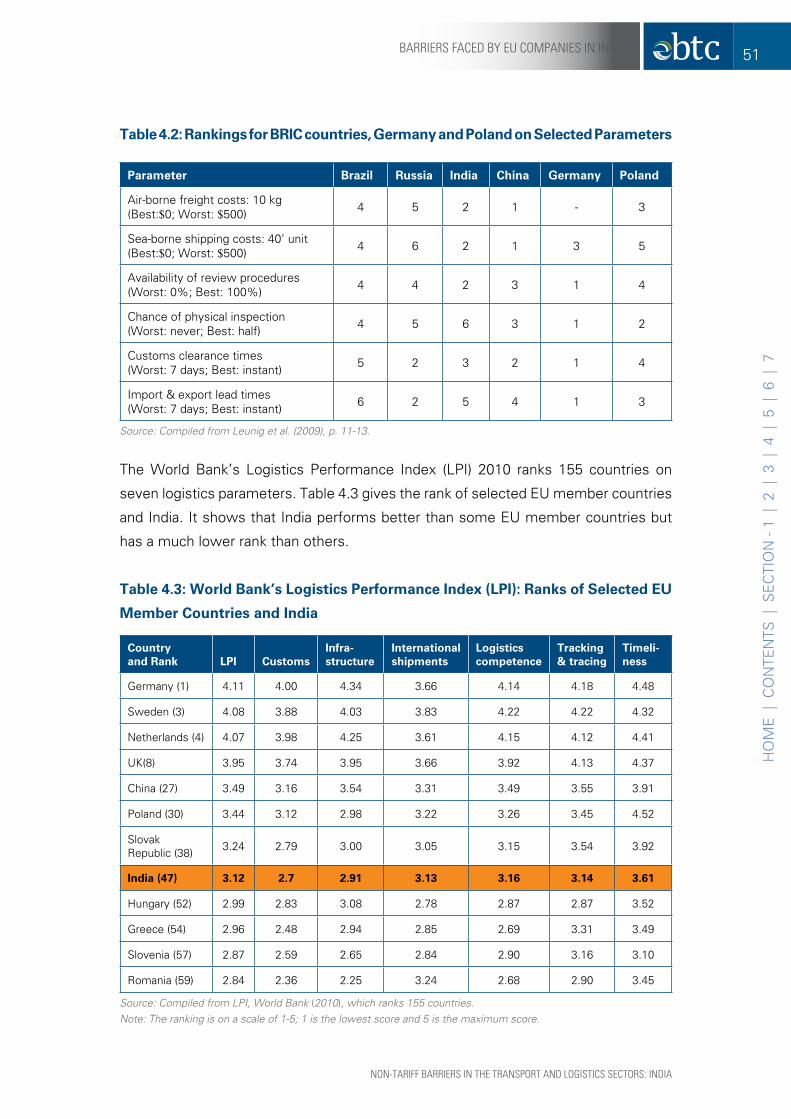
Table 4.2: rankings for Bric countries, germany and poland on selected parameters
parameter Brazil russia india china germany poland
Air-borne freight costs: 10 kg (Best:$0; Worst: $500) 4 5 2 1 - 3
Sea-borne shipping costs: 40’ unit (Best:$0; Worst: $500) 4 6 2 1 3 5
Availability of review procedures (Worst: 0%; Best: 100%) 4 4 2 3 1 4
Chance of physical inspection (Worst: never; Best: half) 4 5 6 3 1 2
Customs clearance times (Worst: 7 days; Best: instant) 5 2 3 2 1 4
Import & export lead times (Worst: 7 days; Best: instant) 6 2 5 4 1 3
Source: Compiled from Leunig et al. (2009), p. 11-13.
The World Bank’s Logistics Performance Index (LPI) 2010 ranks 155 countries on
seven logistics parameters. Table 4.3 gives the rank of selected EU member countries
and India. It shows that India performs better than some EU member countries but
has a much lower rank than others.
Table 4.3: World Bank’s Logistics performance index (Lpi): ranks of selected eU
Member countries and india
country and rank Lpi customs
infra- structure
international shipments
Logistics competence
Tracking & tracing
Timeli- ness
Germany (1) 4.11 4.00 4.34 3.66 4.14 4.18 4.48
Sweden (3) 4.08 3.88 4.03 3.83 4.22 4.22 4.32
Netherlands (4) 4.07 3.98 4.25 3.61 4.15 4.12 4.41
UK(8) 3.95 3.74 3.95 3.66 3.92 4.13 4.37
China (27) 3.49 3.16 3.54 3.31 3.49 3.55 3.91
Poland (30) 3.44 3.12 2.98 3.22 3.26 3.45 4.52
Slovak Republic (38) 3.24 2.79 3.00 3.05 3.15 3.54 3.92
india (47) 3.12 2.7 2.91 3.13 3.16 3.14 3.61
Hungary (52) 2.99 2.83 3.08 2.78 2.87 2.87 3.52
Greece (54) 2.96 2.48 2.94 2.85 2.69 3.31 3.49
Slovenia (57) 2.87 2.59 2.65 2.84 2.90 3.16 3.10
Romania (59) 2.84 2.36 2.25 3.24 2.68 2.90 3.45
Source: Compiled from LPI, World Bank (2010), which ranks 155 countries.Note: The ranking is on a scale of 1-5; 1 is the lowest score and 5 is the maximum score.
NON-TARIFF BARRIERS IN THE TRANSPORT AND LOGISTICS SECTORS: INDIA
51BARRIERS FACED By Eu COmPANIES IN INDIA
HO
ME
| C
ON
TEN
TS |
SE
CTI
ON
- 1
| 2
| 3
| 4
| 5
| 6
| 7
Not only are there barriers to international trade, but there are also several impediments
to intra-state movement of goods in the country because India is not a single market.
The World Bank estimates67 point out that there is significant divergence among
Indian cities. For example, it takes approximately $432 (€306) to export a container
from Kochi, but the figure is about three times higher for Jaipur ($1289 or €914).68 A
Planning Commission study on the logistics sector in India found that logistics costs in
India as a percentage of GDP increased from 13.41 per cent in 1999-00 to 14.97 per
cent in 2005-06. Thus, India incurs around 15 per cent of its GDP as cost in logistics
compared to around 9 per cent in the US and 11-12 per cent in European markets.69
The study found that transportation accounts for 62 per cent of the total logistics
costs. It pointed out that for inter-state transportation a typical goods carrier has to get
clearance from around seven different agencies, including the sales tax department
of respective states, regional transport officers, state excise departments, forest
departments, and civil supplies departments. A study by the Transport Corporation of
India (TCIL)70 found that there are on average 25 stops (15 for toll collection) on the
route between two major cities – Delhi and Bangalore – with average stoppage time
of five hours. The study tried to quantify the effect of check post delays by assuming
that there are 3 million vehicles. It found that check post delays cost the economy
approximately Rs. 30 billion per annum (€0.45 billion). The study also found that the
cost of the additional fuel consumption in India due to poor road conditions and check
post delays is about Rs 200-250 billion (€3-3.75 billion) per annum.71
During the survey EU companies were asked to list the barriers that they face in India on
a scale of 1 to 5, with 1 being the most restrictive barrier. Table 4.4 gives the percentage
of respondents who said “most restrictive” and “restrictive” barriers in each category
of service provision. This was a multiple-choice question and companies referred to
more than one barrier depending on the type of service that they provided. For logistics
companies, the adequacy and quality of the infrastructure were major barriers.
67 www.doingbusiness.org/subnational/exploreeconomies/ExploreEconomies.aspx?economyid=361 and www.doingbusiness.org/subnational/exploreeconomies/ExploreEconomies.aspx?economyid=360
68 These figures are calculated using the average exchange rate for fiscal year 2009-10: $1 = €0.7092. Source: www.oanda.com
69 Planning Commission (2009b).
70 http://www.tcil.com/pdfs/TCI-IIMC%20report.pdf
71 Phis figure is calculated using the average exchange rate for fiscal year 2009-10: Rupee 1 = €0.015. Source: www.oanda.com
NON-TARIFF BARRIERS IN THE TRANSPORT AND LOGISTICS SECTORS: INDIA
52 BARRIERS FACED By Eu COmPANIES IN INDIA
HO
ME
| C
ON
TEN
TS |
SE
CTI
ON
- 1
| 2
| 3
| 4
| 5
| 6
| 7

Tab
le 4
.4: B
arri
ers
face
d b
y e
U c
om
pan
ies
in in
dia
by
Nat
ure
of
Bu
sin
ess
in p
erce
ntag
e
Log
isti
cs s
ervi
ce
pro
vid
ers
co
nst
ruct
ion
&
co
nsu
ltan
cye
qu
ipm
ent/
au
to
Man
ufa
ctu
rin
gc
on
tain
eris
ed c
arg
o c
arri
ers/
s
hip
pin
g c
om
pan
ies
Tra
nsp
ort
/ c
ha
a
sso
ciat
ion
s
Inad
equa
te p
ower
3340
-
Inad
equa
te r
oad
netw
ork,
pot
hole
s/ot
her
road
pro
blem
s89
-10
-63
Inad
equa
te u
se o
f IT
--
--
13
Inad
equa
te r
ail i
nfra
stru
ctur
e, la
ck o
f fr
eigh
t co
rrid
ors
100
--
-13
Lack
of
faci
litie
s at
airp
orts
56-
--
Lack
of
faci
litie
s at
por
ts56
--
8038
Mul
tiple
lice
nsin
g re
quire
men
ts-
--
-13
Tax-
rela
ted
prob
lem
s33
--
-13
Bur
eauc
racy
/cor
rupt
ion/
brib
es78
5020
-
Lack
of
skill
ed m
anpo
wer
4417
40-
13
Leng
thy/
cum
bers
ome
proc
edur
es89
-20
--
Pro
blem
s w
ith E
DI f
acili
ty78
--
--
Inte
r-m
odal
tra
nspo
rt p
robl
ems
22-
--
-
Hig
h co
st o
f op
erat
ions
or
fuel
/ low
mar
gins
22-
--
-
Pro
blem
s w
ith In
dian
lega
l sys
tem
-33
10-
-
Non
-tra
nspa
rent
bid
ding
-17
--
-
Pro
blem
s in
get
ting
data
/info
rmat
ion
-17
--
-
Labo
ur r
egul
atio
ns-
17-
--
Diffi
culti
es in
impo
rtin
g eq
uipm
ent
-17
--
-
Cum
bers
ome
envi
ronm
enta
l cle
aran
ces
-17
--
-
Crim
e, t
heft
, dis
orde
r-
33-
--
Del
ays
in r
ecei
pt o
f pa
ymen
t-
50-
--
Cus
tom
s cl
eara
nce-
rela
ted
prob
lem
s-
--
-25
Res
tric
tions
& d
elay
s in
inte
r-st
ate
good
s m
ovem
ent
--
--
13
Diff
eren
ces
in s
tate
reg
ulat
ions
--
--
13
Sou
rce:
Com
pute
d by
the
aut
hors
fro
m in
dust
ry s
urve
y re
sults
.
Not
e: R
espo
nden
ts w
ere
aske
d to
ran
k th
ese
fact
ors
in o
rder
of
thei
r im
port
ance
; cel
ls le
ft b
lank
indi
cate
fac
tors
tha
t th
e co
mpa
nies
did
not
find
impo
rtan
t.
NON-TARIFF BARRIERS IN THE TRANSPORT AND LOGISTICS SECTORS: INDIA
53BARRIERS FACED By Eu COmPANIES IN INDIA
HO
ME
| C
ON
TEN
TS |
SE
CTI
ON
- 1
| 2
| 3
| 4
| 5
| 6
| 7

The survey found that there are FDI restrictions in certain sectors such as air transport
and railways. Companies did not find this a major barrier in the case of airlines, because
several countries, including EU member states, have FDI restrictions on airlines.
However, the monopoly position of the Indian Railways sometimes makes it difficult to
do business despite the fact that the Indian Railways is trying to attract the private sector
through PPP projects. This is because even for PPP projects there are delays in award of
contracts due to monopoly-related efficiencies and bureaucracy. The survey found that
although the private sector has shown an interest in investing in multi-modal logistics
parks proposed by the Indian Railways, tender approval processes and addressal of land
acquisition problems remain slow. Due to the government monopoly, private players are
not allowed in passenger train movement, except in the case of mass rapid transport.
In many areas, regulations are still evolving, so there is uncertainty about the rules. For
instance, India is in the process of initiating a postal bill which is likely to impact the
operations of courier and express companies. After airport privatisation, there is a new
regulator, AERA, which will set up a new regulatory framework. Some EU companies
have made substantial investments in ground handling and now they are not sure whether
India will impose restrictions on the number of ground handling agents. They are also
doubtful about the future pricing model in privatised airports. The Planning Commission
(2009a) in its ‘Draft Regulatory Reform Bill 20**’ has proposed regulators in 12 sectors
including postal, airports, ports, railways, mass rapid transit system (MRTS), highways,
and waterways.72 The regulatory framework for these sectors is likely to change and
this has resulted in operational uncertainties. At the same time, some recent regulations
are incomplete. For instance, the Warehousing (Development and Regulation) Act,
2007 regulates only warehouses that propose to issue negotiable warehouse receipts.
The 1993 Multimodal Transport of Goods (MTG) Act is outdated in terms of recent
developments in integrated logistics. It suffers from several shortcomings such as
exclusion of air freight operators, exclusion of imports, requirements of annual renewal
of the multimodal transport operator (MTO) licence and higher liabilities for the operator.
Since the transport and logistics sectors are regulated by multiple ministries/ departments
at the centre, state and local levels (see Table A.1 in Appendix A), this has resulted in
cumbersome and multiple regulations. Over 40 acts and more than 20 government
bodies govern this sector, which results in high administration and compliance costs.
The presence of a large number of ministries results in a fragmented approach towards
the development of transport and there is a lack of inter-ministerial co-ordination.
72 Other sectors include electricity, telecommunications and Internet, broadcasting and cable television, oil and gas, coal, water supply and sanitation.
NON-TARIFF BARRIERS IN THE TRANSPORT AND LOGISTICS SECTORS: INDIA
54 BARRIERS FACED By Eu COmPANIES IN INDIA
HO
ME
| C
ON
TEN
TS |
SE
CTI
ON
- 1
| 2
| 3
| 4
| 5
| 6
| 7

Logistics service providers pointed out that the lack of physical infrastructure is a major
barrier. Although the government has focused on investment in improving highways,
there are still capacity shortages and the quality of state highways and local roads
needs to be improved; the poor road conditions affect the longevity of vehicles. The
congestion at ports and lack of hinterland connectivity cause delays. Although airports
are being privatised, there are hardly any cold chain facilities. Domestic airports do
not have proper road connections to international airports in some cities and there is
no system of internal movement of cargo between the two airports. Many domestic
airports do not have covered cargo storage facilities.
Several procedures cause inordinate delays. In many states it is not easy to obtain a
transport permit; it takes 15 days to get a transport permit in West Bengal compared to
1-2 days in Maharashtra. Significant amounts of time are spent at toll booths, because
they are not open round the clock; in Orissa toll booths are closed from 7 pm till 8 am
and in West Bengal, the delays can last as long as 4-5 hours. Since many toll booths are
not computerised, electronic documentation is not possible; for instance, in Tamil Nadu,
only 8 of the 19 state-level check posts are computerised. In addition, delays are caused
by procedures, such as payment of octroi charges for certain cities in Maharashtra,
submission of a way bill73 in West Bengal, submission of multiple forms for various
government departments, the checking of documents and physical check of the vehicle,
driver and consignment by the RTO (Road Transport Office) and traffic police, and paying
highway tolls and taxes. It is reported that expenses due to delays at check posts, sales
tax-related documentation, consignment checking and unofficial payments amount to
as much as 15 per cent of the total expense. This is borne out by a study by the logistics
major, Transport Corporation of India Limited (TCIL), and IIM-Calcutta which asserted
that stoppage delays as a percentage of journey time was between 5-25 per cent.74
The companies reported a series of other problems. Bribes and corruption are
common. The passage corridors in almost 80 per cent of the check posts are very
narrow. Within city limits, there are zoning restrictions which do not allow movement
of heavy vehicles during peak hours. Warehouses are often located inside cities and
zoning restrictions impact access to warehouses. Getting a transport permit is also
not easy in many states. For instance, it takes around 15 days to get a transport permit
in West Bengal compared to 1-2 days in the state of Maharashtra. Often there are
illegal encroachments into the highways and slow-moving vehicles like bullock carts
73 A waybill is an official shipping document used to describe a shipment’s consignor, consignee, origin and destination, and the goods with their weight and freight.
74 http://www.tcil.com/pdfs/TCI-IIMC%20report.pdf
NON-TARIFF BARRIERS IN THE TRANSPORT AND LOGISTICS SECTORS: INDIA
55BARRIERS FACED By Eu COmPANIES IN INDIA
HO
ME
| C
ON
TEN
TS |
SE
CTI
ON
- 1
| 2
| 3
| 4
| 5
| 6
| 7

reduce the highway speed. Some companies mentioned the lack of safety in areas
like the Naxalite-affected areas of West Bengal, Andhra Pradesh and Orissa.
Several participants mentioned the poor skill levels of staff. Many drivers do not
have the correct training or the ability to read road signs, and states use different
criteria to evaluate skill levels. Lack of highway driving skills causes delays and result
in accidents. In addition, cashiers at toll booths lack the training and computer skills
required for the job. The number of staff required is also inadequate at many booths.
In the absence of competent skills to manage traffic, there are traffic jams and delays.
In the case of the railways, the lack of dedicated freight corridors leads to capacity
constraints and delays. During the survey, it was found that cargo may take up to 5-6
days to reach Delhi from Mumbai by rail (a distance of only 1,384 kilometres) due to
capacity constraints.
Although many dedicated freight corridors have been commissioned, the date of
completion is not clear. Connectivity to ports and dry ports remains inadequate. IT
infrastructure and tracking facilities are also inadequate. The reliability, quality of
service and customer orientation is poor. Due to this, freight forwarders and shippers
prefer to use the more expensive road transport. The Indian Railways policy of cross-
subsidising passenger charges through freight charges leads to higher freight costs.
The average passenger tariff of Indian Railways is 55 per cent lower than in China,
while the average freight tariff is 66 per cent higher.75 Express companies pointed out
that although the railways are an environment-friendly mode of transport, they cannot
use it because loads have to be booked six hours in advance, and companies often
do not have such long lead times. There is no dedicated courier space in railway vans.
Many airports suffer from capacity constraints that cause delays in flight landing,
leading to congestion, fuel wastage due to delays in aircraft landing, etc. Even in
the new airports of Mumbai and Delhi, cold storage facilities are inadequate. Lack of
gateway and hinterland connectivity hinders the smooth movement of cargo. There
are delays in transfer of cargo between domestic and international airports. Many
domestic airports do not have proper cargo sheds which results in loss and damage
of cargo. Some of the barriers mentioned by airlines include high aviation turbine fuel
(ATF) prices, rising labour costs, shortage of skilled labour and sudden increases in
tariffs by privatised airports for equipment use.
75 http://www.indianexpress.com/news/on-track/1825/0
NON-TARIFF BARRIERS IN THE TRANSPORT AND LOGISTICS SECTORS: INDIA
56 BARRIERS FACED By Eu COmPANIES IN INDIA
HO
ME
| C
ON
TEN
TS |
SE
CTI
ON
- 1
| 2
| 3
| 4
| 5
| 6
| 7

The survey found that ships have long waits for berthing, loading and unloading. The
vessel turnaround time and waiting time in India are much higher than in international
ports.76 Most ports do not have the capacity to accommodate large ships and can
only accommodate feeder vessels; this results in delays during trans-shipment. The
equipment for cargo handling in ports is outdated, with frequent breakdowns. The
process of mechanisation is slow. The labour unions are strong, there is a lack of
skilled labour for activities like pilotage and workers do not work round-the-clock as in
other international ports.77 Due to this, despite cheap labour rates, Indian container-
handling costs are considerably higher than in other ports in the region. Port costs at
Dubai are almost 25 per cent and at Colombo and Singapore just 40 per cent of those
at the JNPT.78
Overall, cargo movement through Indian ports is low. For instance, a single port in
Europe – the Port of Rotterdam– handles more cargo than all major Indian ports taken
together (Table 4.5).
Table 4.5: Traffic handled at Major indian ports versus port of rotterdam
(in’000 tonnes)
port periodcontainer
Total cargoTonnage TEUs
JNpT (india)2007-08 51,840 4,059 55,756
2000-01 14,277 1,190 18,575
CAGR in % (2007-08 over 2000-01) 20.22 19.16 17.00
all Major indian ports2007-08 92,051 6,596 5,19,159
2000-01 32,222 2,470 2,81,104
CAGR in % (2007-08 over 2000-01) 16.18 15.06 9.16
port of rotterdam (eU)2007-08 1,07,000 10,800 4,21,100
2000-01 65,192 6,275 3,22,348
CAGR in % (2007-08 over 2000-01) 7.33 8.06 3.89
Source: Compiled by the authors from http://www.portofrotterdam.com/ and http://www.ipa.nic.in
76 Ships on Indian ports generally have to wait long in the channel for berthing, and productivity in loading and unloading is low. The national average turn-around time of vessels for dry bulk, and containers is 5.7 days and 1.9 days respectively. This is much more than major international ports like Hong Kong, Rotterdam or Singapore where vessel turnaround time is less than a day.
77 The Dock Workers Act provides protection to dock workers and in some ports there is little control over the labour force by either the stevedoring company or the port authority. This has resulted in malpractices, such as demanding “speed money” at the commencement of each shift prior to starting work, over-manning of all cargo handling operations, and disregard for safety rules.
78 For details see Planning Commission (2009b).
NON-TARIFF BARRIERS IN THE TRANSPORT AND LOGISTICS SECTORS: INDIA
57BARRIERS FACED By Eu COmPANIES IN INDIA
HO
ME
| C
ON
TEN
TS |
SE
CTI
ON
- 1
| 2
| 3
| 4
| 5
| 6
| 7

In liner shipping, at least 40 per cent of the cargo is reserved for national flag ships.
Preference is given to Indian flag vessels for carrying government cargoes and
government owned/ controlled cargoes. Indian flag vessels have the first right of
refusal for carrying such cargo, and only then are foreign flag ships allowed to be in-
chartered/taken on an international basis. This restriction is sometimes relaxed on a
case-by-case basis, but it nevertheless is a constraint. In December 2009, the Ministry
of Shipping proposed rigidly imposing the cabotage condition which had been relaxed.
Public transport in many states is controlled by the government through allocation
of routes, etc. State transport departments often prefer private operators with a few
fleets rather than a single company with a large fleet. This makes it difficult to operate
in this sector although there are no apparent entry and exit barriers.
The logistics service providers argued that although India is a large country, its
logistics market is highly fragmented and comprises a number of intermediaries which
increases operational costs. For instance, the road transport sector is dominated
by small trucking companies and individual truckers. Only a few service providers
specialise in providing 3PL and 4PL services. The small operators can operate at
low margins and, therefore, larger players face tough price competition. Moreover,
a large number of Indian manufacturers are SMEs that cannot afford the services of
specialised logistics service providers; instead, they operate with multiple agents to
save costs. In the absence of a single goods and services tax, the tax structure differs
across states and there are restrictions on inter-state movements of certain goods like
agricultural products. This makes it difficult for companies to operate on a hub-and-
spoke model and set up a pan-India logistics network. For instance, to save on central
sales tax, many companies operate through C&F agents instead of setting up an
integrated logistics network. A large Indian company generally operates with as many
as 20 warehouses all over India, compared to less than 5 (on average) in developed
economies. These problems could be solved with a single goods and services tax,
which the Indian government has proposed; however, its implementation has been
postponed.
Most warehouses in India are manual, and lack bar-coding and scanning facilities.
A Planning Commission (2009b) study shows that there are as many as 20 procedures
to be complied with in setting up a warehouse in India, making it a very time-
consuming process (taking up to 270 days) compared to other developed countries
as shown in Table 4.6 below. There are others barriers such as difficulties in acquiring
land for warehousing, lack of prescribed standards of service and trading conditions
NON-TARIFF BARRIERS IN THE TRANSPORT AND LOGISTICS SECTORS: INDIA
58 BARRIERS FACED By Eu COmPANIES IN INDIA
HO
ME
| C
ON
TEN
TS |
SE
CTI
ON
- 1
| 2
| 3
| 4
| 5
| 6
| 7

for operators in warehouses (other than those governed by the Customs Act) and no
uniformity in warehousing standards across states.
Table 4.6: setting up a Warehouse: procedures and days required
india Korea Usa finland denmark
No. of procedures required 20 11 19 N.A 7
No. of days required 270 days 56-60 days 65-70 days 56-60 days 65-70 days
Source: Compiled from Planning Commission (2009b), p. 31.
Physical inspections by customs, multiple documentation requirements and bribes
have been cited as common barriers. Although Customs has implemented EDI, the
technology is outdated. The process is slow because it requires physical images of
invoices, consignee authorisation, import-export codes and airway bills that are not
required in EU member states. There is a lack of integration between Customs EDI
and other agencies. For certain products a ‘no-objection certificate’ is needed from
agencies such as the Drug Controllers and Wild Life Departments that do not operate
round the clock at airports. The survey found that the entire consignment gets cleared
faster in the EU than express cargo in India; it takes one day for clearance in Germany
compared to three days in India. Some custom officers, especially promoted officers,
are not well-trained. To speed up the process, 70-80 per cent of the cargo is cleared
by bribing the officers. In addition, the facilities for paying customs duties at airports
like Delhi are inadequate, with few bank counters and no on-line payment facilities.
The duty refund for short land shipments takes time (sometimes around six months).
Basic infrastructure such as power is a major barrier for manufacturers. Power is
expensive and the supply is erratic. Although manpower is cheap, companies often
do not get the right skills and have to invest in training. There are also differences
in technical standards between India and the EU. EU tyre manufacturers, railway
wagon manufacturers, and trailer manufacturers pointed out that due to differences
in technical standards, they have to re-orient or customise their products for India.
There are even state-level variations in standards; for example, each state has its own
specifications for the trailer length it will allow. In the case of the railways, even if the
company complies with Indian standards, getting approvals takes time; it takes at
least six months to get the approval after setting up the manufacturing unit for rolling
stock. Multiple and different taxes across states make it difficult to establish a uniform
pricing model across India. The existing systems of sales tax administration, vehicle
registration, issuance of driving licences and its records system are predominantly
NON-TARIFF BARRIERS IN THE TRANSPORT AND LOGISTICS SECTORS: INDIA
59BARRIERS FACED By Eu COmPANIES IN INDIA
HO
ME
| C
ON
TEN
TS |
SE
CTI
ON
- 1
| 2
| 3
| 4
| 5
| 6
| 7
manual and vary from state to state. The motor vehicle tax is levied on the basis of
gross vehicle weight rather than on potential axle loads. This results in under-taxation
of 2-axle trucks compared to multi-axle vehicles (MAVs). Manufacturers pointed out
that the import duty (customs duty)79 is higher for cars than for auto-components and/
or aeroplanes. For instance, the import duty is 10 per cent for chassis fitting with
engine (HS code 8606), 3 per cent for aeroplanes and aircraft and 100 per cent for
motor cars (for details see Table B.4 in Appendix B).
Eco-friendly vehicles like battery-operated cars do not have a mass market in India for
several reasons: insufficient re-charging stations, power shortages, the high cost of
power, and insufficient refuelling facilities for Compressed Natural Gas (CNG) across
cities. There is lack of clarity in the bio-ethanol/bio-fuel policy and there are policy
inconsistencies at the centre and state level. According to the Indian Constitution,
potable alcohol is regulated by states, whereas alcohol for industrial units and for fuel
purposes is a central subject. As a result, each state has its own tax structure, rules
and regulations. This has affected free movement and uniform and rational pricing of
ethanol for blending purposes. India is also yet to have a safety standard for hydrogen
gas fuel.
Barriers in the construction sector include delays in receipt of payments after project
completion partly due to the need for multiple clearances. Such delays in the case
of road construction result in contractual complications,80 escalation of costs due
to price rise, idling of contractors’ resources, designs becoming outdated and the
possibility of road conditions deteriorating over time and requiring more maintenance.
Long gestation periods increase the risk especially if there is political instability. Many
construction projects are offered only on a non-convertible rupee payment basis. Only
government projects financed by international development agencies allow payment
in foreign currency.81 Difficulties in land acquisition have also been cited by some
companies. Foreign consultants pointed out that they have to pay taxes even if they
stay for a short duration.
When asked about the problems they face in government procurement, companies
said that the process has improved in the past decade, but there are some areas of
concern. For instance, MORTH recently changed the Model Concession Agreement
79 Basic customs duty represents the external tariff of the country applicable to goods on entry into India.
80 Under the BOT-toll system, the contractor recovers the investment through toll collection, while in BOT-annuity projects, the developer takes payments in instalments from the government.
81 http://www.ustr.gov/sites/default/files/uploads/reports/2009/NTE/asset_upload_file131_15478.pdf
NON-TARIFF BARRIERS IN THE TRANSPORT AND LOGISTICS SECTORS: INDIA
60 BARRIERS FACED By Eu COmPANIES IN INDIA
HO
ME
| C
ON
TEN
TS |
SE
CTI
ON
- 1
| 2
| 3
| 4
| 5
| 6
| 7

(MCA) and now five companies instead of eight have been short-listed. They further
pointed out that a minimum turnover of Rs. 500 million (€7.5 million)82 in the past year
is required for an RFQ (Request for Qualification),83 the company’s past history is
checked, and there is a scoring system for each criteria. Manpower and raw materials
have to be domestically sourced and there is a specific list for imported machinery that
has zero duty. In the case of the railways, steel and cement have to be sourced from
companies short-listed by the Indian Railways. Often there are project delays as over-
engineering, design modifications and other changes can happen after the concession
is awarded. The survey participants also pointed out that the revenue-sharing model
has not worked well in India.
In ship-building, the government gives subsides to domestic players but Indian ship-
yards are still uncompetitive due to multiple taxes, the high cost of financing and
outdated technology.
82 This figure is calculated using the average exchange rate for fiscal year 2009-10: Rupee 1 = €0.015. Source: www.oanda.com
83 The bidding process for PPP projects in India is typically divided into two stages. In the first stage, eligible and prospective bidders are shortlisted. This stage is referred to as Request for Qualification (RFQ) or Expression of Interest (EoI). The objective is to short-list eligible bidders for Stage 2 of the process. In the second and final stage, generally called the Request for Proposal (RFP) or invitation of financial bids, the bidders engage in a comprehensive scrutiny of the project before submitting their financial offers.
NON-TARIFF BARRIERS IN THE TRANSPORT AND LOGISTICS SECTORS: INDIA
61BARRIERS FACED By Eu COmPANIES IN INDIA
HO
ME
| C
ON
TEN
TS |
SE
CTI
ON
- 1
| 2
| 3
| 4
| 5
| 6
| 7


5. addressing Barriers through international Negotiations
NON-TARIFF BARRIERS IN THE TRANSPORT AND LOGISTICS SECTORS: INDIA
63ADDRESSING BARRIERS THROuGH INTERNATIONAL NEGOTIATIONS
HO
ME
| C
ON
TEN
TS |
SE
CTI
ON
- 1
| 2
| 3
| 4
| 5
| 6
| 7

Section 3 showed that EU companies have a strong interest in the transport and
logistics sector of India and Section 4 highlighted the numerous barriers they face in
India. Since both India and EU are members of the WTO and are actively participating in
the on-going Doha Round of WTO negotiations, this section examines the possibilities
of multilateral liberalisation in the transport and logistics sector. It also discusses how
the barriers can be addressed in the India-EU BTIA. Specifically, it focuses on the EU’s
likely demands and India’s likely negotiating strategies and options.
In goods, India’s overall tariffs are higher than that of the EU. Since 2005 most of the
items in the transport sector that are imported from the EU (i.e., aeroplane and aircraft)
face low tariffs of only 3 per cent; however, the tariff for motor cars and motor vehicles
for personal use (including luxury cars) have a high tariff of 100 per cent. During the
survey, EU companies exporting to India pointed out that they are likely to benefit if
this is reduced either multilaterally or through the BTIA. As discussed in Section 3.4,
there are differences in technical standards between the two economies which affect
trade. The EU companies pointed out that if there is scope for enhancing co-operation
in technical standards under the BTIA, it will facilitate trade and investment.
In services, both India and the EU offered limited commitments in the transport and
logistics sector during the Uruguay Round of General Agreement on Trade in Services
(GATS) or WTO84 negotiations. During the Uruguay Round as well as in the present
Doha Round, the EU (along with countries such as Japan and China) has been a major
proponent of liberalising transport and logistics services. In 2000, the EU submitted
a proposal85 to the WTO which covered liberalisation of all modes of transport. This
proposal highlighted the need to reduce unnecessary distortive trade barriers while
preserving the quality of service, public safety and regulation. The EU also proposed
that commitments should facilitate multi-modal transportation through broad-based
commitments in auxiliary services and transport. The EU proposed that although
hard rights like traffic rights are excluded from GATS, commitments can be sought
in services such as ground-handling services, freight and mail handling, and ramp-
handling services, subject to safety, security and employment conditions. Where self-
handling by airlines is permitted, this possibility should be available to all individual
airlines on a neutral, transparent and non-discriminatory basis. This has led to a debate
on whether ground handling (which was until then treated outside the scope of the
GATS negotiations) should be covered under multilateral liberalisation. In 2005, the
84 A brief overview of GATS is given in Appendix C.
85 WTO Document S/CSS/W/41 dated 22 December 2000.
NON-TARIFF BARRIERS IN THE TRANSPORT AND LOGISTICS SECTORS: INDIA
64 ADDRESSING BARRIERS THROuGH INTERNATIONAL NEGOTIATIONS
HO
ME
| C
ON
TEN
TS |
SE
CTI
ON
- 1
| 2
| 3
| 4
| 5
| 6
| 7
EU together with 20 countries86 submitted a statement agreeing in principle on the
importance of taking commitments in logistics services. The logistics sector has a
wider coverage than the transport sector since it also covers services like courier
services and management consulting. The EU is also a major proponent of liberalising
allied sectors like postal and courier services in the WTO.
The EU has been an active participant in the plurilateral87 negotiations which commenced
after the Hong Kong Ministerial (December 2005). The EU along with countries such as
Australia, Chile, New Zealand, Norway and Switzerland made a request to over 22 member
countries (including India) in air transport services. The plurilateral request in air transport
services covered not only the three areas in which the Uruguay Round negotiations
concentrated (i.e., aircraft repair and maintenance services, selling and marketing of
air transport services and computer reservation systems services) but also ground-
handling services and airport operation services. This shows the EU’s strong interest in
liberalising air transport services. The EU along with countries like Japan, Mexico and
New Zealand made a plurilateral request to countries like India and the US in maritime
transport services. This request focused on securing liberalisation commitments in
international maritime freight transport, eliminating cargo reservations, FDI restrictions,
preferential treatment and nationality requirements for board members for international
freight transport, and obtaining commitments on a range of auxiliary services in
maritime transport. The request furthermore focused on additional commitments for
non-discriminatory access to port facilities and the use of multimodal transport. The
group also called for the removal of Most Favoured Nation (MFN) exemptions.
The transport sector of India witnessed significant liberalisation since the conclusion
of the Uruguay Round. Although India’s revised offer in the Doha Round dated August
24, 2005 (see Table 5.1) shows significant improvements over the Uruguay Round
commitments across a wide range of service sectors, in the transport and logistics
sector the offer shows limited improvements. It does not bind unilateral liberalisation. For
instance, in road transport there are currently no FDI restrictions, but India had not made
any offers. The gap between unilateral liberalisation and India’s revised offer in the Doha
Round shows that there is significant scope for India to broaden its commitments both
86 Australia, Canada, Chile, Djibouti, the EC, Hong Kong, China, Iceland, Japan, Korea, Liechtenstein, Mauritius, New Zealand, Nicaragua, Norway, Panama, Peru, Singapore, Switzerland, the Separate Customs Territory of Taiwan, Penghu, Kinmen, and Matsu and the US (Document TN/S/W/34 dated 18 February 2005).
87 GATS negotiations are generally based on request-offer process where a country makes bilateral request to its trading partners, who after taking into account the requests from all countries make an offer. The offer is multilateral, that is, all WTO members whether the country has made a request or not benefits from it. Plurilateral negotiations began after the Hong Kong Ministerial in 2005. In this, a group of countries – the demanders make a request to another group – the target countries. While offers do not have legal binding, they nevertheless show a country’s interest to liberalise. After negotiations, the offers are sealed and they are known as commitments. Commitments have legal binding.
NON-TARIFF BARRIERS IN THE TRANSPORT AND LOGISTICS SECTORS: INDIA
65ADDRESSING BARRIERS THROuGH INTERNATIONAL NEGOTIATIONS
HO
ME
| C
ON
TEN
TS |
SE
CTI
ON
- 1
| 2
| 3
| 4
| 5
| 6
| 7
in the WTO and in its bilateral agreements with the EU. The survey found that India can
offer more liberal commitments in road transport services and auxiliary services. Since
the railways is still a public monopoly, India may not liberalise this sector. EU companies
have an interest in dedicated freight corridors and containerised cargo movements in
which India has allowed private players; this segment can be liberalised under the BTIA.
The survey found that in maritime transport, India is likely to continue with the policy of
cargo reservations. Both India and EU are likely to continue with cabotage restrictions. In
allied sectors like courier services, India can undertake commitments which will ensure
that in future India will not impose FDI restrictions. However, India can adhere to other
EU demands like non-discriminatory port access and removal of FDI restrictions.
There are, however, some areas of concern. India has not liberalised the transport
sector beyond its WTO revised offers in its existing bilateral agreements, namely, the
India-Singapore Comprehensive Economic Co-operation Agreement (CECA) and India-
Korea Comprehensive Economic Partnership Agreement (CEPA). The logistics sector in
India is undergoing regulatory changes, which has created regulatory uncertainty. Indian
policymakers are not keen to undertake commitments unless the regulatory regime is in
place. India has a keen interest in supplying manpower like seafarers and port workers.
The EU offers in Mode 4 (movement88of natural persons) are limited. India would like to
use its commitments in Mode 3 (commercial presence) to gain greater market access
in Mode 4. India would also like to have better offers in Mode 1 (cross-border supply of
services) which will help the country develop as an outsourcing hub for EU companies.
The requirements for a foreign company to become a road transport operator within
the EU vary across member states; driving licence requirements and examinations also
vary. India is likely to raise this issue in the negotiations. Both Indian and EU companies
pointed out that India and the EU are not harmonised markets, and companies would
benefit from harmonisation of technical standards. Harmonisation and simplification of
customs procedures and standards will facilitate trade. The BTIA can facilitate greater
co-operation in areas like clean technologies in transport. Companies pointed out that
the government procurement agreement will increase access to each other’s market.
However, the extent of benefits will depend on the coverage of the agreement.
Overall, both Indian and European companies pointed out that increased trade due
to the BTIA will provide increased business opportunities for transport and logistics
service providers, aid the development of logistics domain knowledge and facilitate
the adoption and use of new technologies.
88 See Appendix C for the definition of different modes of services.
NON-TARIFF BARRIERS IN THE TRANSPORT AND LOGISTICS SECTORS: INDIA
66 ADDRESSING BARRIERS THROuGH INTERNATIONAL NEGOTIATIONS
HO
ME
| C
ON
TEN
TS |
SE
CTI
ON
- 1
| 2
| 3
| 4
| 5
| 6
| 7

Table 5.1: commitments and revised offers in Transport and Logistics:
india and the eU
courier services
india eU
MA NT MA NT
× × � �Maritime
Freight and Passenger � � � �Rental of vessels with crew � � � �Maintenance and repair of vessels � � � �Pushing and towing services × × � �Supporting services for maritime transport 89 � � � �Rental/ leasing services without operators relating to ships (excluding the services of actual international transport of cargo) � � ◊ ◊
Maritime auxiliary services
Cargo handling � � � �Storage and warehouse services � � � �Customs clearance services � � � �Container station and depot services � � � �Maritime agency services � � � �Maritime freight forwarding services � � � �air
Freight and passenger × × × ×
Rental of aircraft with crew × × � �Maintenance & Repair of aircraft � � ◊ ◊
Supporting services for air × × × ×Sales and Marketing × × ◊ ◊Computer Reservation System × × ◊ ◊
Ground handling × × � �Airport management × × � �Rental/leasing services without operators relating to aircraft × × ◊ ◊rail
Freight and passenger × × � �Pushing & Towing × × × ×Maintenance & Repair of rail transport × × ◊ ◊
Supporting services for rail × × � �road
Freight and passenger × × ◊ ◊
Rental of commercial vehicles × × � �Maintenance & Repair of road × × ◊ ◊
Supporting services for road × × � �auxiliary services for all modes
Cargo handling × × � �Storage & Warehouse × × ◊ ◊Freight transport × × ◊ ◊Pre-shipment inspection × × ◊ ◊Others × × × ×
Management consulting services � � ◊ ◊
services related to Management consulting services � � ◊ ◊
Technical testing and analysis services ◊ ◊
Source: WTO document GATS/SC/31, dated April 15, 1994; GATS/SC/42 dated April 15, 1994; WTO document TN/S/O/EEC/Rev.1, dated June 29, 2005; and WTO document TN/S/O/IND/Rev.1, dated August 24, 2005. 89
Notes: ×: No commitment; : Improvement in revised offer; ◊: No improvement in revised offer; �: No commitment in Uruguay Round but in revised offer. MA: Market Access; NT: National Treatment
89 The EU only committed in the sub-category of ‘ship agency services’, while India only committed in ‘ship broking services’.
NON-TARIFF BARRIERS IN THE TRANSPORT AND LOGISTICS SECTORS: INDIA
67ADDRESSING BARRIERS THROuGH INTERNATIONAL NEGOTIATIONS
HO
ME
| C
ON
TEN
TS |
SE
CTI
ON
- 1
| 2
| 3
| 4
| 5
| 6
| 7

6. reform requirements in india
NON-TARIFF BARRIERS IN THE TRANSPORT AND LOGISTICS SECTORS: INDIA
69REFORm REquIREmENTS IN INDIA
HO
ME
| C
ON
TEN
TS |
SE
CTI
ON
- 1
| 2
| 3
| 4
| 5
| 6
| 7
To compete with other low-cost developing countries like China and sustain its high
growth rate, India needs to create new infrastructure and upgrade the existing
transport and logistics infrastructure. The Indian government would like a substantial
part of this investment to come from the private sector. However, the transport sector
in India suffers from a large number of barriers; unless these are addressed, India may
not get the requisite investment or the pace of investment will be slow. This section
discusses the reforms that are required to enhance the global competitiveness of the
Indian transport and logistics sector.
Transparency, good governance and a predictable operating environment are
prerequisites for investment in sectors like transport and logistics which have a long
gestation period. The approval procedures have to be simple. The transport sector is
governed by a large number of ministries, resulting in multiple clearance requirements
and regulations. There should be greater co-ordination among ministries so that there is
single-widow clearance. Instead of a piece-meal approach towards the development of
this sector by different ministries, they should work together towards development of
an integrated transport sector. The central government should also work closely with the
state governments to remove bottlenecks such as availability of land and delays in getting
state-level clearances. The government policy should encourage healthy competition.
Proper pricing of infrastructure is also essential to attract private investment.
The development of a seamless logistics chain depends on connectivity, automation,
computerisation and technological upgrading in the sector. An efficient EDI system
connecting different modes of transportation will facilitate the rapid movement of
goods. Seaports, airports, the hinterland, warehouses, etc. should be linked through
proper access roads and railways. In airports, there should be facilities for 24x7
movement of cargo between domestic and international terminals. Warehouses
should be built in areas where there are no access restrictions, and they should be
well-connected to airports, ports, etc. There should be no restrictions on movement
of cargo between Inland Container Depots (ICDs) and ports/airports.
The customs clearance process needs to be streamlined and simplified. The system
of physical checking of cargo by customs causes delays. This should be replaced by
a clearance process based on proper risk management, EDI, e-payment of duties,
single-window clearance by other agencies, etc., which will significantly reduce the
dwell time of cargo. The Customs EDI should be integrated with other agencies such
as the Drug Controllers and Wild Life Agencies so that delays are minimised.
NON-TARIFF BARRIERS IN THE TRANSPORT AND LOGISTICS SECTORS: INDIA
70 REFORm REquIREmENTS IN INDIA
HO
ME
| C
ON
TEN
TS |
SE
CTI
ON
- 1
| 2
| 3
| 4
| 5
| 6
| 7

With liberalisation, there is a need for proper regulation to support the growth of this
sector. In this respect, India can learn from global best practices. Outdated regulations
should be replaced and new regulations initiated faster. This will reduce operational
uncertainty and enable the country to undertake commitments in the WTO and FTAs.
Although India has a large, skilled workforce, this study found a shortage of appropriate
skills in transport and logistics services. There is a need to identify areas in which there
are skill shortages and training requirements. The different transport departments of
the government should work with educational institutes and the industry on a PPP
model to identify skill requirements and provide training.
In the case of road transport, priority should be given not only to construction but
also to maintenance. Frequent changes in concession agreements can act as a
disincentive. Taxation of commercial vehicles should be related to the potential damage
by movement on bad roads. The tax structure should be rationalised in favour of multi-
axle vehicles to encourage their use. The focus should be on use of environment-
friendly technologies and fuel conservation. The government should also emphasise
the development of proper traffic management technology, road safety measures,
parking and road-side facilities, among others. There is also a need to improve security
along highways.
Delays in inter-state movement due to multiple taxes, different state-level regulations
and product-related restrictions (such as restrictions on the movement of agricultural
commodities) reduce the benefits of creating expressways and lead to loss of fuel.
Since freight movement by trains does not face these restrictions, many of them
are unnecessary. There is a need for a process of fully computerised green channels
along highways/expressways, whereby a vehicle once cleared can pass through other
check posts without multiple checking of documents. The single Goods and Services
Tax (GST) proposed by the government will streamline the tax structure but will not
reduce the wait time, since there are other regulations such as octroi in certain cities
of Maharashtra which will continue to exist. Replacement of manual inspection,
computerisation and 24x7 manning of check posts will reduce some of the delays.
The government should remove multiple entry forms or road permits for different
states as these are irrelevant with the implementation of GST. Different taxes such as
road tax and goods tax on vehicles should be amalgamated into a single tax to reduce
time and costs of tax collection. Red tape, corruption and bribes at inter-state borders
should be eliminated.
NON-TARIFF BARRIERS IN THE TRANSPORT AND LOGISTICS SECTORS: INDIA
71REFORm REquIREmENTS IN INDIA
HO
ME
| C
ON
TEN
TS |
SE
CTI
ON
- 1
| 2
| 3
| 4
| 5
| 6
| 7

The monopoly position of the government in railways restricts investment. It leads
to delays in awarding contracts, a non-competitive operating environment for private
players and price distortions, among others. The railways need to separate commercial
and social activities, and then privatise its commercial services. The government
should expedite the construction of dedicated freight corridors and private players
should be given autonomy in their respective dedicated freight corridors.
In many cities, airports have a monopoly, i.e., there is a single airport. Therefore, there
is a need for a regulator once the sector is privatised. The privatisation experience
in India has been mixed. Airport user charges have risen, and often private players
do not provide sufficient storage for freight in their master plans. The master plans
should be carefully evaluated before the project is sanctioned. Separate land should
be demarcated for cargo movement and storage facilities.
The infrastructure, technology and machinery used in Indian ports should be upgraded.
There is a need to increase the depth and the number of berths depending on cargo
flows. The equipment has to be modernised and labour has to be trained to handle
it. There is also a need for labour reforms in Indian ports. In the case of shipping,
the policy of cargo reservation needs to be evaluated. The focus should be on a
competitive shipping sector rather than the promotion of national flag ships. For this
the government should also ensure there are no cartels, conferences or other forms
of anti-competitive practices.
The construction sector will benefit from a transparent procurement process where
the concession agreements are strictly adhered to and the process of collection of
tariffs etc. are clearly defined. Simplification of the labour laws and availability of power
will benefit the auto-component and automobile industry.
NON-TARIFF BARRIERS IN THE TRANSPORT AND LOGISTICS SECTORS: INDIA
72 REFORm REquIREmENTS IN INDIA
HO
ME
| C
ON
TEN
TS |
SE
CTI
ON
- 1
| 2
| 3
| 4
| 5
| 6
| 7
7. conclusion and the way forward
NON-TARIFF BARRIERS IN THE TRANSPORT AND LOGISTICS SECTORS: INDIA
73CONCLuSION AND THE wAy FORwARD
HO
ME
| C
ON
TEN
TS |
SE
CTI
ON
- 1
| 2
| 3
| 4
| 5
| 6
| 7

The Indian transport and logistics sector is growing at a rapid pace. Following
liberalisation measures since the 1990s, the sector has been opened up, allowing
enhanced participation by private players from within and outside the country.
Increased economic activity, trade flows and collaboration have over the years resulted
in various structural changes in the sector which continues to evolve and modernise.
The EU, on the other hand, has a well-developed transport and logistics sector, and
is home to some of the largest and most established companies in the world. With
increased growth prospects in India in the past two decades, EU companies have also
shown a keen interest in establishing a presence in the country. This paper attempts
to provide an overview of the Indian transport and logistics market and focuses on the
growth and prospects for trade, investment and collaboration between India and the
EU in this sector. However, various barriers affect the operations of EU companies in
India, which have been identified in the paper based on a primary survey.
The study found that companies of EU origin are significant providers of FDI and
technology transfers to India. They have established a presence in India in almost
all the segments through various modes of operation. Most companies operate in
areas such as freight forwarding, construction and consultancy and automobile/auto-
component manufacturing and foresee significant future growth prospects. The major
strengths of EU companies lie in their wide networks, global reach and access to
information. They have well-defined standards and processes in place, but lack an
understanding of the Indian market.
It was found that there is scope for increased India-EU collaboration in maritime
auxiliary services, cold storage, cargo management, construction and maintenance,
automobile manufacturing, and clean-fuel technology transfers. In the long run,
as infrastructure develops, greater opportunities for tie-ups are likely to emerge in
3PL/ 4PL services, toll and traffic management, parking management, and signalling
services, among others.
The barriers identified in the study were found to be linked to the sectors and forms
of operation of the companies. Broadly, infrastructure-related hurdles, shortage of
skilled manpower, a cumbersome regulatory structure and corruption in government
agencies were the most commonly identified constraints to trade between India and
EU. In some cases, however, barriers for one type of company could be opportunities
for others.
NON-TARIFF BARRIERS IN THE TRANSPORT AND LOGISTICS SECTORS: INDIA
74 CONCLuSION AND THE wAy FORwARD
HO
ME
| C
ON
TEN
TS |
SE
CTI
ON
- 1
| 2
| 3
| 4
| 5
| 6
| 7

The EC has been a demandeur in GATS to liberalise the transport and logistics services
sector in emerging economies and its bilateral trade-investment agreements. It had
also made significant commitments in its WTO Revised Offer in the year 2005. In
comparison, India did not take substantial commitments in its WTO Revised Offer
in the same year. However, India’s FDI regime is currently far more liberal and it is
in a position to undertake greater commitments in segments such as port access,
containerised cargo movement, road transport and auxiliary services. These can
be offered under the proposed BTIA which is currently being negotiated between
India and the EU. Market access restrictions in rail transport and cargo reservations
in maritime transport are likely to stay. However, for most barriers faced by EU
companies in the sector, India needs to initiate domestic reforms. These should
involve streamlining approval processes and customs procedures and transparency in
government procedures, regulatory reforms, fiscal and labour reforms, among others.
NON-TARIFF BARRIERS IN THE TRANSPORT AND LOGISTICS SECTORS: INDIA
75CONCLuSION AND THE wAy FORwARD
HO
ME
| C
ON
TEN
TS |
SE
CTI
ON
- 1
| 2
| 3
| 4
| 5
| 6
| 7

references
ADB (2007). ‘Profile of the Indian Transport Sector’, Operations Evaluation Department,
http://www.adb.org/Documents/Evaluation/Case-Studies/SAPE-Transport-
Sector-IND/Indian-Transport-Profile.pdf
Aschauer, D.A (1989). ‘Is public expenditure productive?’ Journal of Monetary
Economics, 23(2): 177-200.
Central Statistical Organisation (2009). Statistical Abstracts – India,
http://www.mospi.gov.in/mospi_cso_rept_pubn.htm
Chandra, P. and Jain, N. (2007). ‘The Logistics Sector in India: Overview and
Challenges’, W.P. No. 2007-03-07, Indian Institute of Management Ahmedabad.
CII-KPMG (2007). ‘Skill gaps in the Indian Logistics Sector: A White Paper’,
September 2007, http://www.kpmg.ie/DestinationIndia/pubs/Logistics.pdf
Colliers International (2009). ‘Logic of Logistics’. http://www.colliers.com/ Content/
Attachments/India/2009_Logic_Of_Logistics.pdf
Data Monitor (2007). ‘Indian Logistics Outlook 2007: An analysis of India and its
rapidly growing logistics industry’. March 2007.
http://www.datamonitor.com/Products/Free/Brief/BFAU0159/010BFAU0159.pdf
Deloitte (2009). ‘The Pre-GST Survey 2009: Before Change Happens’.
http://www.amchamindia.com/Deloitte-Pre%20GST%20Survey%202009.pdf
Department of Road Transport and Highways, Annual Report (2007-08). Ministry of
Shipping, Road Transport and Highways, Government of India,
http://morth.nic.in/writereaddata/sublink2images/
AnnualReport2007_083953330780.pdf
DIPP (2009a). Draft Press Note No. 2010
http://dipp.nic.in/FDI_Manuals/ FDIRegulatory_Framework_24December2009.pdf
DIPP (2009b). Fact Sheet on Foreign Direct Investment - From August 1991 to
September 2009, http://dipp.nic.in/fdi_statistics/india_FDI_September2009. pdf
NON-TARIFF BARRIERS IN THE TRANSPORT AND LOGISTICS SECTORS: INDIA
77REFERENCES
HO
ME
| C
ON
TEN
TS |
SE
CTI
ON
- 1
| 2
| 3
| 4
| 5
| 6
| 7
Directorate General of Shipping (2004). ‘Development of Coastal Shipping,’ TCS
Report, http://www.dgshipping.com/dgship/final/tcsrep/chapter_1.htm
Economic Survey (2008-09). Government of India,
http://indiabudget.nic.in/es2008-09/esmain.htm
Ganguli, D. (2008). ‘Logistics Services under India-EU TIA’, Report submitted to
Department of Commerce, Ministry of Commerce, Government of India,
September 2008, ICRIER.
GATS (2000). ‘GATS 2000: Transport Services, Communication from the European
Communities and their Member States’, S/CSS/W/41.
Indian Railways (2008). ‘Year Book 2007-08’ http://www.indianrailways.gov.in/
deptts/yearbook/YearBook_07_08.htm
Investment Commission of India (2008). ‘India – Opportunities in the World’s
Largest Democracy,’ April 2008. www.investmentcommission.in/ pdfs/
investmentcommissionofindia-english.pdf
Leunig, T., Minns, C. and Weinhold, D. (2009). ‘International trade, express logistics
and globalization: Part and parcel of the solution to current economic
problems’. DHL-LSE White Paper. September 2009.
http://www.dp-dhl.com/en/media_relations/press_releases/2009/lse_
study_prospect_for_global_trade/_jcr_content/mainpar/cols2_1/rightcolpar/
downloadarticle/daitems/downloadarticleitem.download.html
Lynde, C. and Richmond, J. (1993). ‘Public Capital and Long-Run Costs in U.K.
Manufacturing’, Economic Journal, 103(419): 880-93.
Mackie, P.J. and Tweddle, G. (1993). ‘Measuring the Benefits Gained by Industry
from Road Network Improvements’. Working Paper 391, Institute of
Transport Studies, University of Leeds, UK, February 1993,
http://eprints.whiterose.ac.uk/2182/1/ITS287_WP391_uploadable.pdf
Ministry of Civil Aviation (2008). Annual Report 2007-08, Government of India
http://civilaviation.nic.in/reports/eng%20annual%20report%202007-08.pdf
NON-TARIFF BARRIERS IN THE TRANSPORT AND LOGISTICS SECTORS: INDIA
78 REFERENCES
HO
ME
| C
ON
TEN
TS |
SE
CTI
ON
- 1
| 2
| 3
| 4
| 5
| 6
| 7

Ministry of Civil Aviation (2009). ‘Structuring and Operationalizing of the Airports
Economic Regulatory Authority of India’, Request for Proposal No. 02/2009-10,
http://civilaviation.nic.in/aera/AERA-RFP-09102009.pdf
Morrison, C.J and Schwartz, A.E (1996). ‘State Infrastructure and Productive
Performance’, The American Economic Review, 86(5):1095-1111.
Mukherjee, A. (2009). ‘Social Impact of Globalising Transport Services: The Case of
India’, International Transport Forum, Forum Paper 2009-9, OECD/ITF, Paris.
http://www.internationaltransportforum.org/Pub/pdf/09FP09.pdf
Mukherjee, A. and Bhaskaran, D. (2007). ‘Globalisation of Transport Services: India’s
Trade and Investment Prospects’, ICRIER Report for Sir Ratan Tata Trust.
Planning Commission (2008a). ‘Projections of Investment in Infrastructure during
the Eleventh Plan’, 14 August 2008. http://infrastructure.gov.in/ pdf/Inv_
Projection2.pdf
Planning Commission (2008b). ‘Report of the high-level group on Services Sector’,
Planning Commission, March 2008. http://planningcommission.gov.in/
reports/genrep/rep_ser.pdf
Planning Commission (2009a). Draft Regulatory Reform Bill, 20**, ‘Published by
The Secretariat for the Committee on Infrastructure’, Planning Commission,
Government of India (April 2003)
Planning Commission (2009b). ‘Report of the Working Group on Logistics,’
May 2009, Government of India.
Quarmby, D.A. (1989). ‘Developments in the Retail Market and their effect
on Freight Distribution’, Journal of Transport Economics and
Policy, 23(1):75-89.
Swaminathan A.K, Bandyopadhyay, A. and Rohatgi, R. (2007). ‘Indian Road
Construction Industry: Ready for growth?’ Draft Report (October 2007)
http://siteresources.worldbank.org/INTSARREGTOPTRANSPORT/Resources/
Policy_note_Oct30.pdf
NON-TARIFF BARRIERS IN THE TRANSPORT AND LOGISTICS SECTORS: INDIA
79REFERENCES
HO
ME
| C
ON
TEN
TS |
SE
CTI
ON
- 1
| 2
| 3
| 4
| 5
| 6
| 7

USTR (2009). ‘National Trade Estimate Report on Foreign Trade Barriers’, USA
http://www.ustr.gov/sites/default/files/uploads/reports/2009/NTE/asset_
upload_file131_15478.pdf
World Bank (2007). ‘Trade Logistics in the Global Economy: The Logistics
Performance Index and its Indicators’, http://siteresources.worldbank.org/
INTTLF/Resources/lpireport.pdf
WTO (1991). Services Sectoral Classification List (July 10, 1991) MTN.GNS/W/120
WTO (2005a). ‘EC’s Conditional Revised Offer’, TN/S/O/EEC/Rev.1 (June 29, 2005)
WTO (2005b). ‘India’s Revised Offer’, TN/S/O/IND/Rev.1 (August 24, 2005)
WTO (2004). ‘Freight Logistics Checklist’ (June 25, 2004) TN/S/W/20
WTO (2009). International Trade Statistics 2009. http://www.wto.org/english/res_e/
statis_e/its2009_e/its2009_e.pdf
NON-TARIFF BARRIERS IN THE TRANSPORT AND LOGISTICS SECTORS: INDIA
80 REFERENCES
HO
ME
| C
ON
TEN
TS |
SE
CTI
ON
- 1
| 2
| 3
| 4
| 5
| 6
| 7
Websites
http://www.acmainfo.com/
http://www.airportsindia.org.in/
http://www.asiatradehub.com/India/railways.asp
http://www.bis.org.in/
http://www.cchaakolkata.org/affiliation.html
http://cewacor.nic.in/
http://commerce.nic.in/PressRelease/pressrelease_detail.asp?id = 2389
http://commerce.nic.in/trade/pluriateral/plurilateral_16.pdf
http://www.delhimetrorail.com/corporates/tenders/major_contractors.html
http://dipp.nic.in/
http://dgftcom.nic.in/
http://www.doingbusiness.org/
http://www.dsir.gov.in/reports/
http://www.eiciindia.org/FrontSite/aboutus.aspx
http://epp.eurostat.ec.europa.eu/portal/page/portal/publications/collections/news_releases
http://exporthelp.europa.eu
http://www.fedai.org.in/
http://www.frost.com/prod/servlet/market-insight-top.pag?docid = 74102578
http://www.ibef.org/Archives/ViewArticles.aspx?art_id = 17585&cat_id = 808
http://www.ibef.org/artdisplay.aspx?tdy = 1&art_id = 20099&cat_id = 60
http://www.ibef.org/industry/aviation.aspx
http://www.icra.in/Files/PDF/SpecialComments/2009-December-Shipping.pdf
http://ideas.repec.org/a/aea/aecrev/v86y1996i5p1095-1111.html
http://www.ilfsindia.com/downloads/bus_concept/Logistics.pdf
http://www.imaritime.com
https://www.imf.org/external/pubs/ft/weo/2009/update/02/index.htm
http://indiabudget.nic.in/
http://www.indiainbusiness.nic.in/industry-infrastructure/industrial-sectors/automobile.htm
NON-TARIFF BARRIERS IN THE TRANSPORT AND LOGISTICS SECTORS: INDIA
81REFERENCES
HO
ME
| C
ON
TEN
TS |
SE
CTI
ON
- 1
| 2
| 3
| 4
| 5
| 6
| 7

http://indiacode.nic.in/coiweb/fullact1.asp?tfnm = 00%20511
http://www.india.gaports.com/LinkClick.aspx?fileticket = gztAos5zxkw%3D&tabid = 63&mid = 424&forcedownload = true
http://india.gov.in/sectors/transport/shipping.php
http://www.indianairports.com/php/showNews.php?newsid = 43&linkid = 51
http://www.indianrailways.gov.in/Budget_2009-10/Speech_English_2009-10.pdf
http://www.indiastat.com
http://investmentcommission.in
http://info.worldbank.org/etools/tradesurvey/mode1b.asp
http://www.investmentcommission.in
http://www.ipa.nic.in
http://morth.nic.in/
http://nhbf.in/national_road_polocy.htm
http://www.oanda.com
http://pib.nic.in/
http://planningcommission.nic.in/plans/planrel/11thf.htm
http://www.portofrotterdam.com/
http://www.pppinindia.com/
http://www.siamindia.com/
http://www.supplychainasia.com/downloads/enewsletters/issue-55-2-march-2007/download.html
http://www.tcil.com/
http://www.unescap.org/tid/projects/egmtf_s2Shintaro.pdf
http://www.ustr.gov/sites/default/files/uploads/reports/2009/NTE/asset_upload_file131_15478.pdf
http://www.wto.org/
NON-TARIFF BARRIERS IN THE TRANSPORT AND LOGISTICS SECTORS: INDIA
82 REFERENCES
HO
ME
| C
ON
TEN
TS |
SE
CTI
ON
- 1
| 2
| 3
| 4
| 5
| 6
| 7
News reports/press releases
http://www.business-standard.com/india/news/foreign-ships-may-be-barredcoastal-trade/81377/on
http://commerce.nic.in/PressRelease/pressrelease_detail.asp?id = 2389
http://dgca.nic.in/reports/rep-ind.htm
http://dipp.nic.in/FDI_Manuals/FDIRegulatory_Framework_24December2009.pdf
http://www.financialexpress.com/printer/news/427127/
http://indiabudget.nic.in/ub2010-11/bs/speecha.htm
http://www.indianexpress.com/news/on-track/1825/0
http://www.indianexpress.com/news/plan-panel-calls-for-railways-authority-to-adjust-tariffs-improve-fiscal-health/538317/0
http://www.livemint.com/2008/10/03004741/Cargo-transport-moving-towards.html
http://www.livemint.com/2009/10/12222249/Shipping-companies-to-charge-c.html
http://www.livemint.com/2010/04/26145432/India-long-way-off-from-20km.html
http://morth.nic.in/writereaddata/sublinkimages/overview_NH3244795788.htm
http://nhbf.in
http://pib.nic.in/archieve/image/2005/r2005111704.pdf
http://www.thehindubusinessline.com/2008/03/24/stories/2008032450570600.htm
http://www.thehindubusinessline.com/2009/01/27/stories/2009012750181000.htm
NON-TARIFF BARRIERS IN THE TRANSPORT AND LOGISTICS SECTORS: INDIA
83REFERENCES
HO
ME
| C
ON
TEN
TS |
SE
CTI
ON
- 1
| 2
| 3
| 4
| 5
| 6
| 7
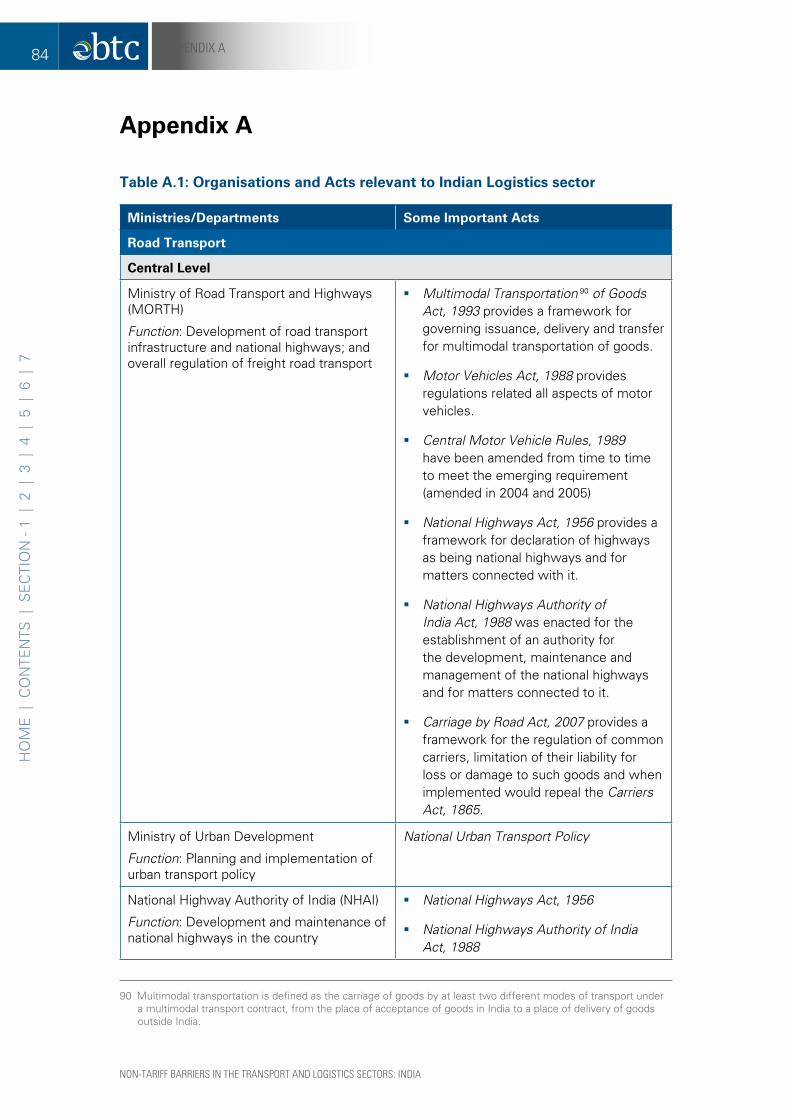
appendix a
Table a.1: organisations and acts relevant to indian Logistics sector 90
Ministries/departments some important acts
road Transport
central Level
Ministry of Road Transport and Highways (MORTH)
Function: Development of road transport infrastructure and national highways; and overall regulation of freight road transport
�� Multimodal Transportation 90 of Goods Act, 1993 provides a framework for governing issuance, delivery and transfer for multimodal transportation of goods.
�� Motor Vehicles Act, 1988 provides regulations related all aspects of motor vehicles.
�� Central Motor Vehicle Rules, 1989 have been amended from time to time to meet the emerging requirement (amended in 2004 and 2005)
�� National Highways Act, 1956 provides a framework for declaration of highways as being national highways and for matters connected with it.
�� National Highways Authority of India Act, 1988 was enacted for the establishment of an authority for the development, maintenance and management of the national highways and for matters connected to it.
�� Carriage by Road Act, 2007 provides a framework for the regulation of common carriers, limitation of their liability for loss or damage to such goods and when implemented would repeal the Carriers Act, 1865.
Ministry of Urban Development
Function: Planning and implementation of urban transport policy
National Urban Transport Policy
National Highway Authority of India (NHAI)
Function: Development and maintenance of national highways in the country
�� National Highways Act, 1956
�� National Highways Authority of India Act, 1988
90 Multimodal transportation is defined as the carriage of goods by at least two different modes of transport under a multimodal transport contract, from the place of acceptance of goods in India to a place of delivery of goods outside India.
NON-TARIFF BARRIERS IN THE TRANSPORT AND LOGISTICS SECTORS: INDIA
84 APPENDIx A
HO
ME
| C
ON
TEN
TS |
SE
CTI
ON
- 1
| 2
| 3
| 4
| 5
| 6
| 7

Ministries/departments some important acts
state Level
State Transport Departments
Function: Development and maintenance of state highways in the country. Licences and controls all road vehicles, inspection of vehicles, fixes motor vehicle tax rates.
�� Carriers Act, 1865 enabled common carriers to limit the liability for the loss of or damage to property delivered to them to be carried but also to declare their liability for loss of or damage to such property occasioned by the negligence or criminal acts of themselves, their servants or agents.
�� Motor Vehicles Act, 1988
�� Carriage by Road Act, 2007
State Road Transport Undertaking
Function: Operation of bus services.
Road Transport Corporations Act, 1950 provides a framework for the incorporation and regulation of Road Transport Corporations.
Urban Development Authority State Development Acts
Public Works Department (PWD) is responsible for construction and repair of state roads.
Municipal Corporation of India (MCD) is responsible for construction and repair of smaller roads, road signage, traffic lights, licensing and control of non-motorised vehicles, clearing of encroachments and land-use planning.
Local Level
Traffic Police
Function: Enforcement of traffic laws and prosecuting violators
State Police Acts
ports, shipping and inland Water Transport
central Level
Ministry of Shipping
Function: Co-ordination of various activities related to ports, shipping and inland water transport
�� Indian Ports Act, 1908 lays down rules related to safety of shipping and conservation of ports for the entire port sector; and regulates matters related to administration of port duties, pilotage and other charges.
�� Major Port Trusts Act, 1963 enacted for the establishment of port authorities for major ports.
�� Merchant Shipping Act, 1958 enacted for the establishment of a National Shipping
NON-TARIFF BARRIERS IN THE TRANSPORT AND LOGISTICS SECTORS: INDIA
85APPENDIx A
HO
ME
| C
ON
TEN
TS |
SE
CTI
ON
- 1
| 2
| 3
| 4
| 5
| 6
| 7
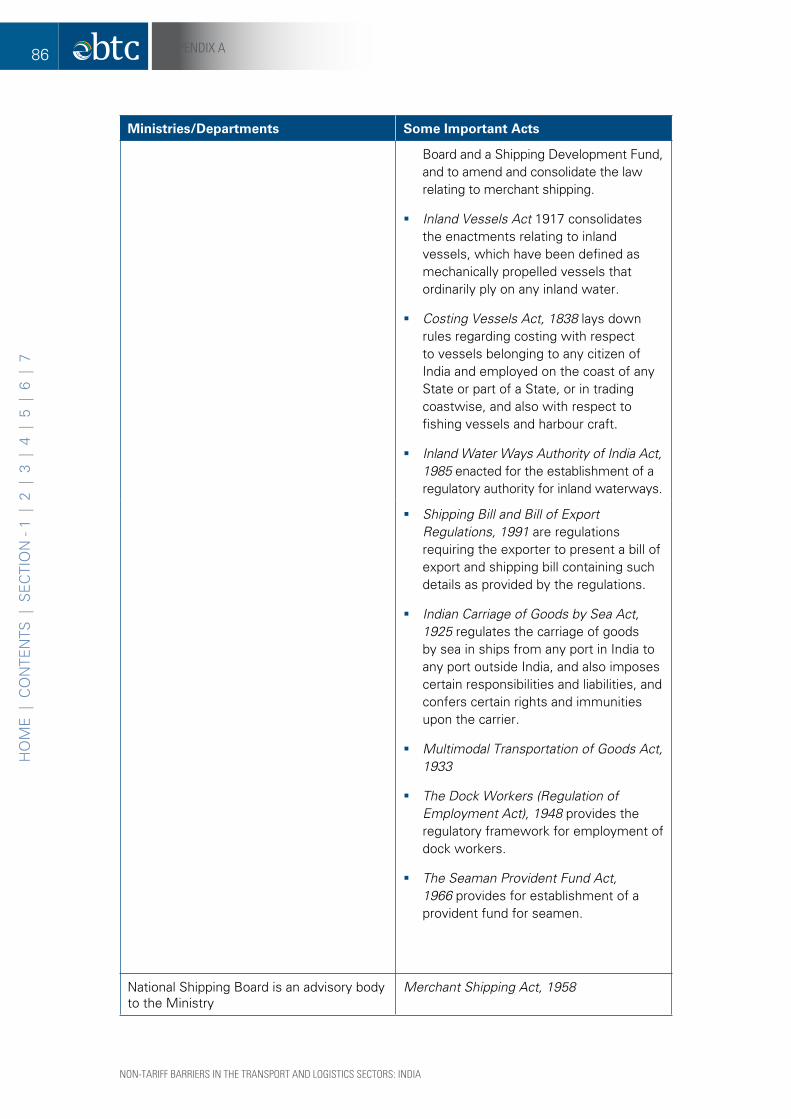
Ministries/departments some important acts
Board and a Shipping Development Fund, and to amend and consolidate the law relating to merchant shipping.
�� Inland Vessels Act 1917 consolidates the enactments relating to inland vessels, which have been defined as mechanically propelled vessels that ordinarily ply on any inland water.
�� Costing Vessels Act, 1838 lays down rules regarding costing with respect to vessels belonging to any citizen of India and employed on the coast of any State or part of a State, or in trading coastwise, and also with respect to fishing vessels and harbour craft.
�� Inland Water Ways Authority of India Act, 1985 enacted for the establishment of a regulatory authority for inland waterways.
�� Shipping Bill and Bill of Export Regulations, 1991 are regulations requiring the exporter to present a bill of export and shipping bill containing such details as provided by the regulations.
�� Indian Carriage of Goods by Sea Act, 1925 regulates the carriage of goods by sea in ships from any port in India to any port outside India, and also imposes certain responsibilities and liabilities, and confers certain rights and immunities upon the carrier.
�� Multimodal Transportation of Goods Act, 1933
�� The Dock Workers (Regulation of Employment Act), 1948 provides the regulatory framework for employment of dock workers.
�� The Seaman Provident Fund Act, 1966 provides for establishment of a provident fund for seamen.
National Shipping Board is an advisory body to the Ministry
Merchant Shipping Act, 1958
NON-TARIFF BARRIERS IN THE TRANSPORT AND LOGISTICS SECTORS: INDIA
86 APPENDIx A
HO
ME
| C
ON
TEN
TS |
SE
CTI
ON
- 1
| 2
| 3
| 4
| 5
| 6
| 7

Ministries/departments some important acts
Director General, Shipping (DGS)
Function: Implementation of provisions of the Merchant Shipping Act (1958), of various international conventions relating to safety, and mandatory requirements under the International Maritime Organisation
Merchant Shipping Act, 1958
Function: Provides general aid to Mariner Navigation along the Indian coast.
Lighthouse Act, 1927 lays down the regulations for maintenance and control of lighthouses.
Inland Water Way Authority of India
Function: A regulatory authority responsible for development of national waterways for the purposes of shipping and navigation.
Inland Waterways Authority of India Act, 1985
Tariff Authority for Major Ports (TAMP)
Function: A regulatory authority responsible for setting up tariffs for major ports; lays down the institutional framework for the major ports in India.
Major Ports Trust Act, 1963
state Level
Port Trusts
Function: Managing daily activities of the major individual ports in the country
�� The Indian Ports Act, 1908
�� Major Ports Trusts Act, 1963
Maritime States Development Council (MSDC)
Function: Development of all ports – major and minor
State Maritime Development Corporation Ltd.
Function: Development of waterways other than national waterways for the purposes of shipping and navigation
civil aviation
central Level
Ministry of Civil Aviation
Function: Planning and development of infrastructure for regulating air traffic
�� Aircraft Act, 1934 lays down provisions to control the manufacture, possession, use, operation, sale, import and export of aircraft.
�� Air Corporation Act, 1953 enacted to the establishment of Air Corporations for the operation of air transport services.
�� Aircraft Rules, 1937 have been amended from time to time to meet emerging requirements (10th amendment in 2009)
NON-TARIFF BARRIERS IN THE TRANSPORT AND LOGISTICS SECTORS: INDIA
87APPENDIx A
HO
ME
| C
ON
TEN
TS |
SE
CTI
ON
- 1
| 2
| 3
| 4
| 5
| 6
| 7
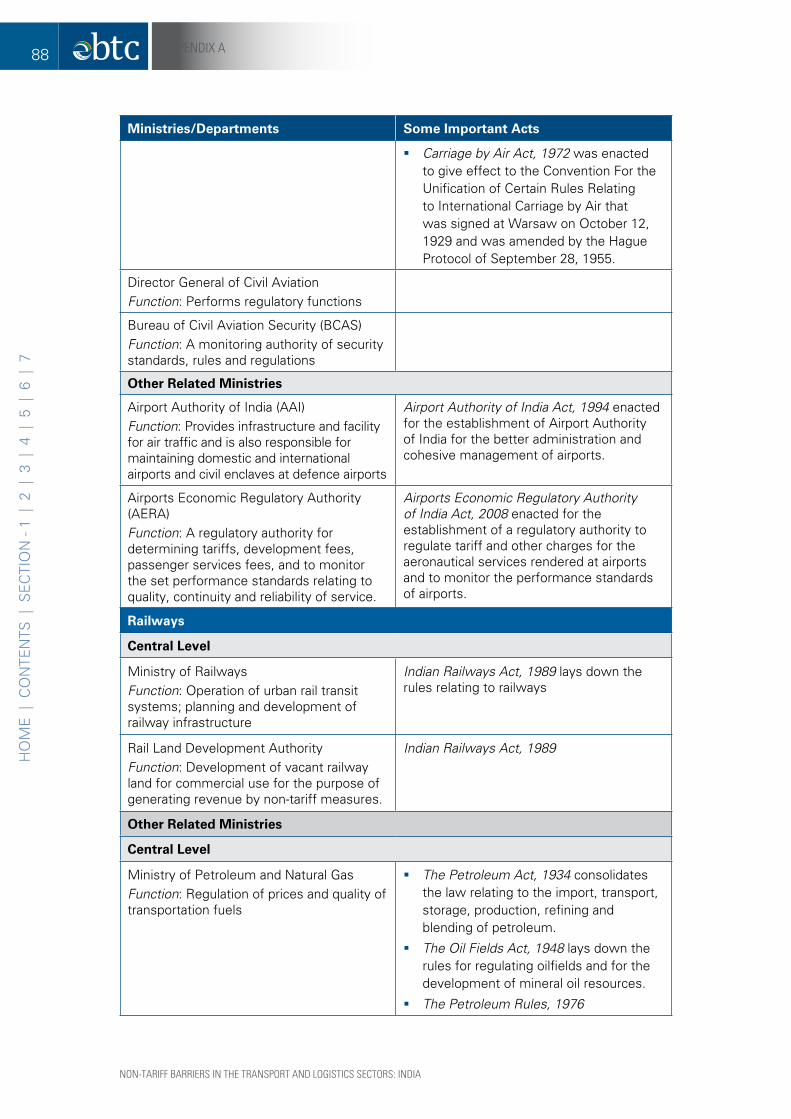
Ministries/departments some important acts
�� Carriage by Air Act, 1972 was enacted to give effect to the Convention For the Unification of Certain Rules Relating to International Carriage by Air that was signed at Warsaw on October 12, 1929 and was amended by the Hague Protocol of September 28, 1955.
Director General of Civil AviationFunction: Performs regulatory functions
Bureau of Civil Aviation Security (BCAS)Function: A monitoring authority of security standards, rules and regulations
other related Ministries
Airport Authority of India (AAI)Function: Provides infrastructure and facility for air traffic and is also responsible for maintaining domestic and international airports and civil enclaves at defence airports
Airport Authority of India Act, 1994 enacted for the establishment of Airport Authority of India for the better administration and cohesive management of airports.
Airports Economic Regulatory Authority (AERA)Function: A regulatory authority for determining tariffs, development fees, passenger services fees, and to monitor the set performance standards relating to quality, continuity and reliability of service.
Airports Economic Regulatory Authority of India Act, 2008 enacted for the establishment of a regulatory authority to regulate tariff and other charges for the aeronautical services rendered at airports and to monitor the performance standards of airports.
railways
central Level
Ministry of RailwaysFunction: Operation of urban rail transit systems; planning and development of railway infrastructure
Indian Railways Act, 1989 lays down the rules relating to railways
Rail Land Development AuthorityFunction: Development of vacant railway land for commercial use for the purpose of generating revenue by non-tariff measures.
Indian Railways Act, 1989
other related Ministries
central Level
Ministry of Petroleum and Natural GasFunction: Regulation of prices and quality of transportation fuels
�� The Petroleum Act, 1934 consolidates the law relating to the import, transport, storage, production, refining and blending of petroleum.
�� The Oil Fields Act, 1948 lays down the rules for regulating oilfields and for the development of mineral oil resources.
�� The Petroleum Rules, 1976
NON-TARIFF BARRIERS IN THE TRANSPORT AND LOGISTICS SECTORS: INDIA
88 APPENDIx A
HO
ME
| C
ON
TEN
TS |
SE
CTI
ON
- 1
| 2
| 3
| 4
| 5
| 6
| 7
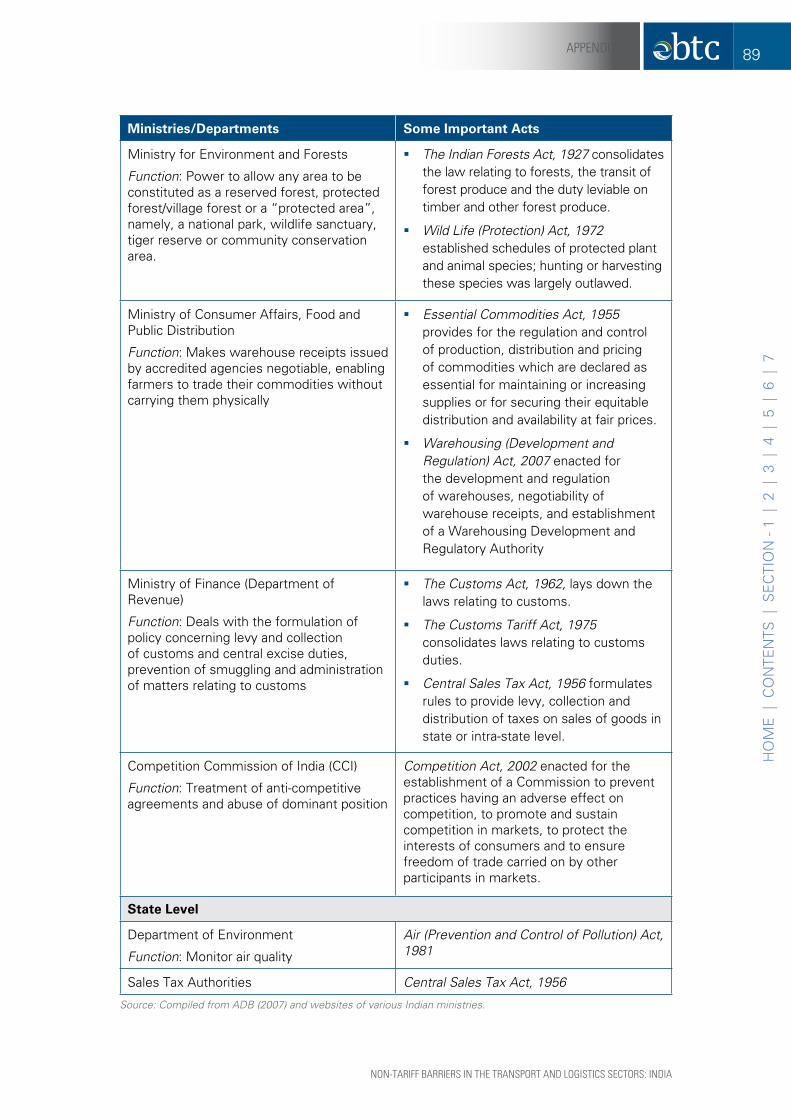
Ministries/departments some important acts
Ministry for Environment and Forests
Function: Power to allow any area to be constituted as a reserved forest, protected forest/village forest or a “protected area”, namely, a national park, wildlife sanctuary, tiger reserve or community conservation area.
�� The Indian Forests Act, 1927 consolidates the law relating to forests, the transit of forest produce and the duty leviable on timber and other forest produce.
�� Wild Life (Protection) Act, 1972 established schedules of protected plant and animal species; hunting or harvesting these species was largely outlawed.
Ministry of Consumer Affairs, Food and Public Distribution
Function: Makes warehouse receipts issued by accredited agencies negotiable, enabling farmers to trade their commodities without carrying them physically
�� Essential Commodities Act, 1955 provides for the regulation and control of production, distribution and pricing of commodities which are declared as essential for maintaining or increasing supplies or for securing their equitable distribution and availability at fair prices.
�� Warehousing (Development and Regulation) Act, 2007 enacted for the development and regulation of warehouses, negotiability of warehouse receipts, and establishment of a Warehousing Development and Regulatory Authority
Ministry of Finance (Department of Revenue)
Function: Deals with the formulation of policy concerning levy and collection of customs and central excise duties, prevention of smuggling and administration of matters relating to customs
�� The Customs Act, 1962, lays down the laws relating to customs.
�� The Customs Tariff Act, 1975 consolidates laws relating to customs duties.
�� Central Sales Tax Act, 1956 formulates rules to provide levy, collection and distribution of taxes on sales of goods in state or intra-state level.
Competition Commission of India (CCI)
Function: Treatment of anti-competitive agreements and abuse of dominant position
Competition Act, 2002 enacted for the establishment of a Commission to prevent practices having an adverse effect on competition, to promote and sustain competition in markets, to protect the interests of consumers and to ensure freedom of trade carried on by other participants in markets.
state Level
Department of Environment
Function: Monitor air quality
Air (Prevention and Control of Pollution) Act, 1981
Sales Tax Authorities Central Sales Tax Act, 1956
Source: Compiled from ADB (2007) and websites of various Indian ministries.
NON-TARIFF BARRIERS IN THE TRANSPORT AND LOGISTICS SECTORS: INDIA
89APPENDIx A
HO
ME
| C
ON
TEN
TS |
SE
CTI
ON
- 1
| 2
| 3
| 4
| 5
| 6
| 7

appendix B
Table B.1: hs code for Transportation equipment
86raiLWaY or TraMWaY LocoMoTiVes, roLLiNg-sTocK aNd parTs Thereof; raiLWaY or TraMWaY TracK fiXTUres aNd fiTTiNgs aNd parTs Thereof; MechaNicaL
8601rail locomotives powered from external source of electricity/by electric accumulators
860110 Rail locomotives powered from an external source of electricity
86011000 Rail locomotives powered from an external source of electricity
860120 Rail locomotives powered by electric accumulators
86012000 Rail locomotives powered by electric accumulators
8602 other rail locomotives; locomotive tenders
860210 Diesel-electric locomotives
86021000 Diesel-electric locomotives
860290 Rail locomotives excl those of 8601&860210
86029010 Railway locomotives; steam & tenders thereof
86029090 Other locomotive tenders
8603self-propelled railway/tramway coaches, vans & trucks, excluding those of heading no. 8604
860310 Coaches propelled from external source of electricity
86031000 Coaches propelled from external source of electricity
860390 Other railway/tramway coaches etc, self-propelled
86039000 Other railway/tramway coaches etc, self-propelled
8604railway or tramway maintenance or service vehicles, whether or not self-propelled (for example, workshops, cranes, ballast tampers, track liners, testing coaches and track inspection vehicles)
860400Railway or tramway maintenance or service vehicles, whether or not self-propelled (for example, workshops, cranes, ballast tampers, track liners, testing coaches and track inspection vehicles)
86040000Railway or tramway maintenance or service vehicles, whether or not self-propelled (for example, workshops, cranes, ballast tampers, track liners, testing coaches and track inspection vehicles)
8605railway or tramway passenger coaches, luggage vans, post office coaches & other special railways or tramways not self-propelled (excluding items of 8604)
860500Railway or tramway passenger coaches, luggage vans, post office coaches & other special railways or tramways not self-propelled (excluding items of 8604)
NON-TARIFF BARRIERS IN THE TRANSPORT AND LOGISTICS SECTORS: INDIA
90 APPENDIx B
HO
ME
| C
ON
TEN
TS |
SE
CTI
ON
- 1
| 2
| 3
| 4
| 5
| 6
| 7

86050000Railway or tramway passenger coaches, luggage vans, post office coaches & other special railways or tramways not self-propelled (excluding items of 8604)
8606 railway or tramway goods vans & wagons, not self-propelled
860610 Tank wagons & the like
86061010 4-wheeler tank wagons pay-load > 23 tonnes
86061020 8-wheeler tank wagons pay-load < = 60 tonnes
86061090 Other tank wagons & the like
860620 Insulated or refrigerated vans and wagons, other than those of sub-heading no. 860610
86062000 Insulated or refrigerated vans and wagons, other than those of sub-heading no. 860610
860630 Self-discharging vans and wagons, other than those of sub-heading no. 860610/860620
86063000 Self-discharging vans and wagons, other than those of sub-heading no. 860610/860620
860691 Other vans & wagons, covered & closed
86069110 Meter gauge 8-wheeler covered wagons of pay-load < = 38 tonnes
86069120 Broad gauge 8-wheeler covered wagons of pay-load < = 60 tonnes
86069190 Other vans & wagons, covered & closed
860692 Other railway/tramway goods vans, open, with non-removable sides of a height>60cm,nt self-propelled
86069210 Bogie eight wheeler wagons of pay-load < = 60 tonnes
86069220 Broad gauges bogie eight wheeler wagons of pay-load > 60 tonnes but < = 67 tonnes
86069290 Other railway/tramway goods vans, open
860699 Other railway/tramway goods vans, not self-propelled
86069900 Other railway/tramway goods vans, not self-propelled
8607 parts of railway/tramway locomotives/rolling-stock
860711 Driving bogies & bissel-bogies
86071100 Driving bogies & bissel-bogies
860712 Other bogies & bissel-bogies
86071200 Other bogies & bissel-bogies
860719 Other(axles, wheels etc.),including parts
86071910 Axles, wheels etc. for railway wagons & carriages
86071920 Axle boxes (lubricating/gears box) for railways
86071930 Axles, wheels etc. for locomotives
86071990 Other parts of axles and wheels for railway wagons and carriages
NON-TARIFF BARRIERS IN THE TRANSPORT AND LOGISTICS SECTORS: INDIA
91APPENDIx B
HO
ME
| C
ON
TEN
TS |
SE
CTI
ON
- 1
| 2
| 3
| 4
| 5
| 6
| 7

860721 Air brakes & parts thereof
86072100 Air brakes & parts thereof
860729 Other brakes & parts thereof
86072900 Other brakes & parts thereof
860730 Hooks & other coupling devices, Buffers & parts
86073010 Buffers for rolling stock, devices for railway
86073090 Others
860791 Parts of locomotives
86079100 Parts of locomotives
860799 Other parts of other coaches/carriages
86079910 Parts of coach for railway
86079920 Parts of tramway
86079930 Hydraulic shock absorbers for bogies
86079990 Parts of railway, n.e.s.
8608railway or tramway track fixtures & fittings; mechanical signalling, safety or traffic control equipment for roads, inland waterways etc. parts of the above
860800 Railway or tramway track fixtures & fittings; mechanical signalling, safety or traffic control equipment for roads, inland waterways etc. parts of the above
86080010 Railway & tramway track fixtures & fittings
86080020 Mechanical equipment, not electricity powered for signalling/controlling road rail/other vehicles, ships/aircraft
86080030 Other traffic control equipment for railways
86080040 Other traffic control equipment for roads, inland waterways, ports, airports
86080090 Other
8609containers specially designed &equipped for carriage by one/more modes of transport
860900 Containers specially designed &equipped for carriage by one/more modes of transport
86090000 Containers specially designed &equipped for carriage by one/more modes of transport
87VehicLes oTher ThaN raiLWaY or TraMWaY roLLiNg sTocK, aNd parTs aNd accessories Thereof
8701 Tractors(excl tractors of heading no. 8709)
870110 Pedestrian controlled tractors
87011000 Pedestrian controlled tractors
870120 Road tractors for semi-trailers
87012010 Road tractors for semi-trailers of engine capacity < = 1800 cc
NON-TARIFF BARRIERS IN THE TRANSPORT AND LOGISTICS SECTORS: INDIA
92 APPENDIx B
HO
ME
| C
ON
TEN
TS |
SE
CTI
ON
- 1
| 2
| 3
| 4
| 5
| 6
| 7

87012090 Other road tractors for semi-trailers
870130 Track-laying tractors
87013011 Garden tractors of engine capacity < = 1800 cc
87013019 Other garden tractors
87013091 Other track-laying tractors of engine capacity < = 1800 cc
87013099 Other track-laying tractors
870190 Other tractors
87019010 Other tractors of engine capacity < = 1800 cc
87019090 Other tractor
8702 public-transport type passenger motor vehicles
870210 Motor vehicles with compression-ignition internal combustion piston engine (diesel or semi-diesel)
87021011 Integrated monologue vehicles (< = 13 persons) with combustion-ignition internal combustion piston engine
87021012 AC vehicles (< = 13 persons) with combustion-ignition internal combustion piston engine
87021019 Other vehicles(< = 13 persons) with combustion-ignition internal combustion piston engine
87021091 Integrate monologue vehicles(>13 persons) with combustion-ignition internal combustion piston engine
87021092 AC vehicles(>13 persons) with combustion-ignition internal combustion piston engine
87021099 Other vehicles(>13 persons) with combustion-ignition internal combustion piston engine
870290 Other motor vehicles pub-transport type
87029011 Other integrated monocoque vehicles (< = 13 persons)
87029012 Other AC vehicles(< = 13 persons)
87029013 Other electrically operated vehicles(< = 13 persons)
87029019 Other vehicles public transport type(< = 13 persons)
87029020 Electrically operated vehicles n.e.s.
87029091 Other integrated monocoque vehicles(>13 persons)
87029092 Other AC vehicles (>13 persons)
87029099 Other vehicles pub-transport type(>13 persons)
8703Motor cars and other motor vehicles principally designed for the transport of persons (other than those of heading 8702), including racing cars etc.
870310 Vehicles for travelling on snow; golf car & the like
87031010 Electrically operated vehicle for travelling on snow; golf car & the like
NON-TARIFF BARRIERS IN THE TRANSPORT AND LOGISTICS SECTORS: INDIA
93APPENDIx B
HO
ME
| C
ON
TEN
TS |
SE
CTI
ON
- 1
| 2
| 3
| 4
| 5
| 6
| 7

87031090 Other vehicle for travelling on snow; golf car & the like
870321 Vehicles with spark-ignition internal combustion reciprocating piston engine of cylinder capacity< = 1000 cc
87032110 Vehicle with cylinder capacity< = 1000 principally designed for the transport of >7 persons including driver, with spark-ignition
87032120 Three-wheeled vehicles with cylinder capacity< = 1000 with spark-ignition
87032191 Motor car with cylinder capacity< = 1000 with spark-ignition
87032192 Specialised transport vehicles(e.g. ambulances, prison vans, hearses) with cylinder capacity< = 1000 with spark-ignition
87032199 Other vehicle with spark-ignition internal combustion reciprocating piston engine of cylinder capacity<1000 cc
870322 Vehicles with spark-ignition internal combustion reciprocating piston engine of cylinder capacity>1000 cc but not>1500 cc
87032210 Vehicle with cylinder capacity> = 1000 cc but < 1500 cc principally designed for the transport of >7 persons including driver; with spark-ignition
87032220 Specialised transport vehicles(e.g. ambulances, prison vans, hearses) with cylinder capacity> = 1000 cc but < 1500 cc
87032230 Three-wheeled vehicles with spark-ignition with cylinder capacity> = 1000 cc but < 1500 cc
87032291 Motor car with cylinder capacity> = 1000 cc but < 1500 cc with spark-ignition
87032299 Other vehicle with cylinder capacity> = 1000 cc but <1500 cc with spark-ignition
870323 Vehicles with spark-ignition internal combustion reciprocating engine of a cylinder capacity>1500 cc but< = 3000 cc
87032310 Vehicle with cylinder capacity> = 1500 cc but < 3000 cc principally designed for the transport of >7 persons including driver; with spark-ignition
87032320 Three-wheeled vehicles with spark-ignition with cylinder capacity> = 1500 cc but < 3000 cc
87032391 Motor car with cylinder capacity> = 1500 cc but <3000 cc with spark-ignition
87032392 Specialised transport vehicles(e.g. ambulances, prison vans, hearses a cylinder capacity>1500 cc but< = 3000 cc
87032399 Other vehicle with cylinder capacity> = 1500 cc but <3000 cc with spark-ignition
870324 Vehicles with spark-ignition internal combustion reciprocating piston engine of cylinder capacity>3000 cc
87032410 Vehicle with cylinder capacity> = 3000 principally designed for the transport of >7 persons including driver; with spark-ignition
87032420 Three-wheeled vehicles with spark-ignition with cylinder capacity> = 3000
87032491 Motor car with cylinder capacity> = 3000 cc with spark-ignition
87032492 Specialised transport vehicles(e.g. ambulances, prison vans, hearses with cylinder capacity> = 3000
NON-TARIFF BARRIERS IN THE TRANSPORT AND LOGISTICS SECTORS: INDIA
94 APPENDIx B
HO
ME
| C
ON
TEN
TS |
SE
CTI
ON
- 1
| 2
| 3
| 4
| 5
| 6
| 7
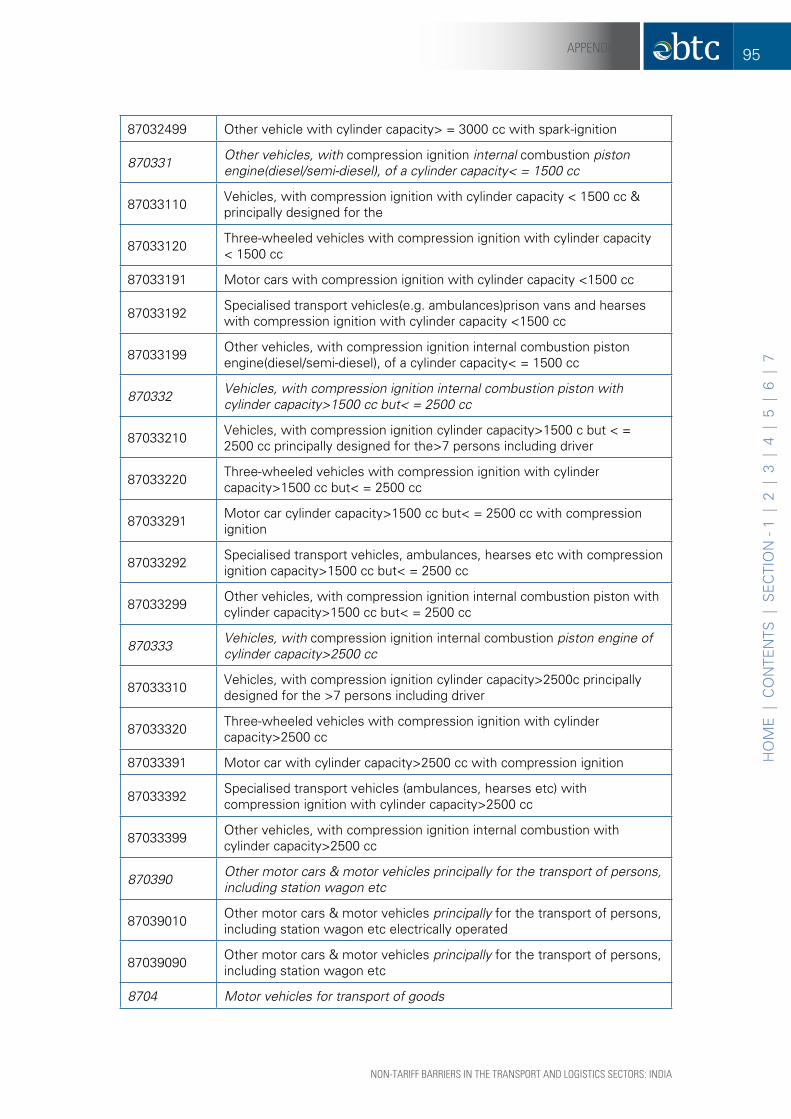
87032499 Other vehicle with cylinder capacity> = 3000 cc with spark-ignition
870331 Other vehicles, with compression ignition internal combustion piston engine(diesel/semi-diesel), of a cylinder capacity< = 1500 cc
87033110 Vehicles, with compression ignition with cylinder capacity < 1500 cc & principally designed for the
87033120 Three-wheeled vehicles with compression ignition with cylinder capacity < 1500 cc
87033191 Motor cars with compression ignition with cylinder capacity <1500 cc
87033192 Specialised transport vehicles(e.g. ambulances)prison vans and hearses with compression ignition with cylinder capacity <1500 cc
87033199 Other vehicles, with compression ignition internal combustion piston engine(diesel/semi-diesel), of a cylinder capacity< = 1500 cc
870332 Vehicles, with compression ignition internal combustion piston with cylinder capacity>1500 cc but< = 2500 cc
87033210 Vehicles, with compression ignition cylinder capacity>1500 c but < = 2500 cc principally designed for the>7 persons including driver
87033220 Three-wheeled vehicles with compression ignition with cylinder capacity>1500 cc but< = 2500 cc
87033291 Motor car cylinder capacity>1500 cc but< = 2500 cc with compression ignition
87033292 Specialised transport vehicles, ambulances, hearses etc with compression ignition capacity>1500 cc but< = 2500 cc
87033299 Other vehicles, with compression ignition internal combustion piston with cylinder capacity>1500 cc but< = 2500 cc
870333 Vehicles, with compression ignition internal combustion piston engine of cylinder capacity>2500 cc
87033310 Vehicles, with compression ignition cylinder capacity>2500c principally designed for the >7 persons including driver
87033320 Three-wheeled vehicles with compression ignition with cylinder capacity>2500 cc
87033391 Motor car with cylinder capacity>2500 cc with compression ignition
87033392 Specialised transport vehicles (ambulances, hearses etc) with compression ignition with cylinder capacity>2500 cc
87033399 Other vehicles, with compression ignition internal combustion with cylinder capacity>2500 cc
870390 Other motor cars & motor vehicles principally for the transport of persons, including station wagon etc
87039010 Other motor cars & motor vehicles principally for the transport of persons, including station wagon etc electrically operated
87039090 Other motor cars & motor vehicles principally for the transport of persons, including station wagon etc
8704 Motor vehicles for transport of goods
NON-TARIFF BARRIERS IN THE TRANSPORT AND LOGISTICS SECTORS: INDIA
95APPENDIx B
HO
ME
| C
ON
TEN
TS |
SE
CTI
ON
- 1
| 2
| 3
| 4
| 5
| 6
| 7

870410 Dumpers designed for off-highway use
87041010 Dumpers designed for off-highway use with net wt >8 tons & maximum pay-load > = 10 tons
87041090 Other dumpers designed for off-highway use
870421 Goods vehicles, with combustion-ignition internal combustion engine(diesel/semi diesel), g.v.w.< = 5 ton
87042110 Refrigerated goods vehicles, with combustion-ignition internal combustion piston engine with g.v.w. < = 5 ton
87042120 3-wheeler goods vehicles, with combustion-ignition internal combustion piston engine with g.v.w. < = 5 ton
87042190 Other goods vehicles, with combustion-ignition internal combustion piston engine with g.v.w. < = 5 ton
870422 Goods vehicles, with combustion-ignition internal combustion g.v.w.>5 tons but < = 20 tons
87042211 Refrigerated goods vehicles, with combustion-ignition internal combustion piston engine with g.v.w.>5 tons but < = 20 tons:lorry & truck
87042219 3-wheeler goods vehicles, with combustion-ignition internal combustion piston engine with g.v.w.>5 tons but < = 20 tons: lorry & truck
87042290 Other goods vehicles, with combustion-ignition internal combustion piston engine with g.v.w.>5 tons but < = 20 tons: other vehicles
870423 Motor vehicles with combustion-ignition internal combustion piston engine (diesel etc), g.v.w.>20 tons
87042311 Refrigerated goods vehicles, with combustion-ignition internal combustion piston engine with g.v.w.>20 tons: lorry & truck
87042319 3-wheeler goods vehicles, with combustion-ignition internal combustion piston engine with g.v.w.>20 tons: lorry & truck
87042390 Other goods vehicles, with combustion-ignition internal combustion piston engine with g.v.w.>20 tons: other vehicles
870431 Motor vehicles, with spark-ignition internal combustion piston engine with g.v.w. not exceeding 5 tons
87043110 Refrigerated goods vehicles, with spark-ignition internal combustion piston engine with g.v.w. < = 5 ton: lorry & truck
87043120 3-wheeler goods vehicles, with spark-ignition internal combustion piston engine with g.v.w. < = 5 ton: lorry & truck
87043190 Other goods vehicles, with spark-ignition internal combustion piston engine with g.v.w. < = 5 ton: other vehicles
870432 Motor vehicles, with spark-ignition internal combustion piston engine, g.v.w.>5 tons
87043211 Refrigerated goods vehicles, with spark-ignition internal combustion piston engine with g.v.w. < = 5 ton: lorry & truck
87043219 Other goods vehicles, with spark-ignition internal combustion piston engine with g.v.w. < = 5 ton: lorry & truck
NON-TARIFF BARRIERS IN THE TRANSPORT AND LOGISTICS SECTORS: INDIA
96 APPENDIx B
HO
ME
| C
ON
TEN
TS |
SE
CTI
ON
- 1
| 2
| 3
| 4
| 5
| 6
| 7

87043290 Other goods vehicles, with spark-ignition internal combustion piston engine with g.v.w. < = 5 ton: other vehicles
870490 Other motor vehicles for transport of goods
87049011 Other refrigerated motor vehicles for transport of goods: lorry & truck
87049012 Other electrically operated motor vehicles for transported goods: lorry & truck
87049019 Other type of other motor vehicles for transport of goods: lorry & truck
87049090 Other motor vehicles for transport of goods n.e.s.
8705special purpose motor vehicles (e.g. breakdown lorries, crane lorries, fire-fighting vehicles, concrete mixture lorries, road sweeper etc)
870510 Crane lorries
87051000 Crane lorries
870520 Mobile drilling derricks
87052000 Mobile drilling derricks
870530 Fire fighting vehicles
87053000 Fire fighting vehicles
870540 Concrete-mixer lorries
87054000 Concrete-mixer lorries
870590 Other special purpose motor vehicles
87059000 Other special purpose motor vehicles
8706 Chassis fitted with engines, for motor vehicles of headings nos 8701 to 8705
870600 Chassis fitted with engines, for motor vehicles of headings nos 8701 to 8705
87060011 Chassis for tractors with engine capacity < = 1800 cc
87060019 Chassis for other tractors
87060021 Chassis for vehicles heading 8702 (< = 13 persons)
87060029 Chassis for vehicles heading 8702 (>13 persons)
87060031 Chassis for 3-wheeled vehicles heading 8703
87060039 Chassis for vehicles heading 8703 except 3- wheeled
87060041 Chassis for 3-wheeled vehicles heading 8704
87060042 Chassis for vehicles heading 8704 except petrol driven
87060043 Chassis for dumpers heading 8704
87060049 Chassis for other vehicles heading 8704
87060050 Chassis for motor vehicles heading 8705
8707Bodies(including cabs), for the motor vehicles of headings nos 8701 to 8705
870710 Bodies for vehicles of hdg no 8703
87071000 Bodies for vehicles of hdg no 8703
NON-TARIFF BARRIERS IN THE TRANSPORT AND LOGISTICS SECTORS: INDIA
97APPENDIx B
HO
ME
| C
ON
TEN
TS |
SE
CTI
ON
- 1
| 2
| 3
| 4
| 5
| 6
| 7

870790 Other bodies
87079000 Other bodies
8708parts and accessories of the motor vehicles of headings nos 8701 to 8705
870810 Bumpers & parts thereof
87081010 Bumpers etc for tractors
87081090 Bumpers etc for other vehicles
870821 Safety seat belts
87082100 Safety seat belts
870829 Other parts & accessories of bodies (incl cabs)
87082900 Other parts & accessories of bodies (incl cabs)
870831 Mounted brake linings
87083100 Mounted brake linings
870839 Other brakes & servo-brakes & parts thereof
87083900 Other brakes & servo-brakes & parts thereof
870840 Gear boxes
87084000 Gear boxes
870850 Drive axles with differential w/n provided with other transmission components
87085000 Drive axles with differential w/n provided with other transmission components
870860 Non-driving axles & parts thereof
87086000 Non-driving axles & parts thereof
870870 Road wheels & parts & accessories thereof
87087000 Road wheels & parts & accessories thereof
870880 Suspension shock absorbers
87088000 Suspension shock absorbers
870891 Radiators
87089100 Radiators
870892 Silencers & exhaust pipes
87089200 Silencers & exhaust pipes
870893 Clutches & parts thereof
87089300 Clutches & parts thereof
870894 Steering wheels, steering columns and steering boxes
87089400 Steering wheels, steering columns and steering boxes
870899 Other parts & accessories of vehicles of hdg 8701-8705
NON-TARIFF BARRIERS IN THE TRANSPORT AND LOGISTICS SECTORS: INDIA
98 APPENDIx B
HO
ME
| C
ON
TEN
TS |
SE
CTI
ON
- 1
| 2
| 3
| 4
| 5
| 6
| 7
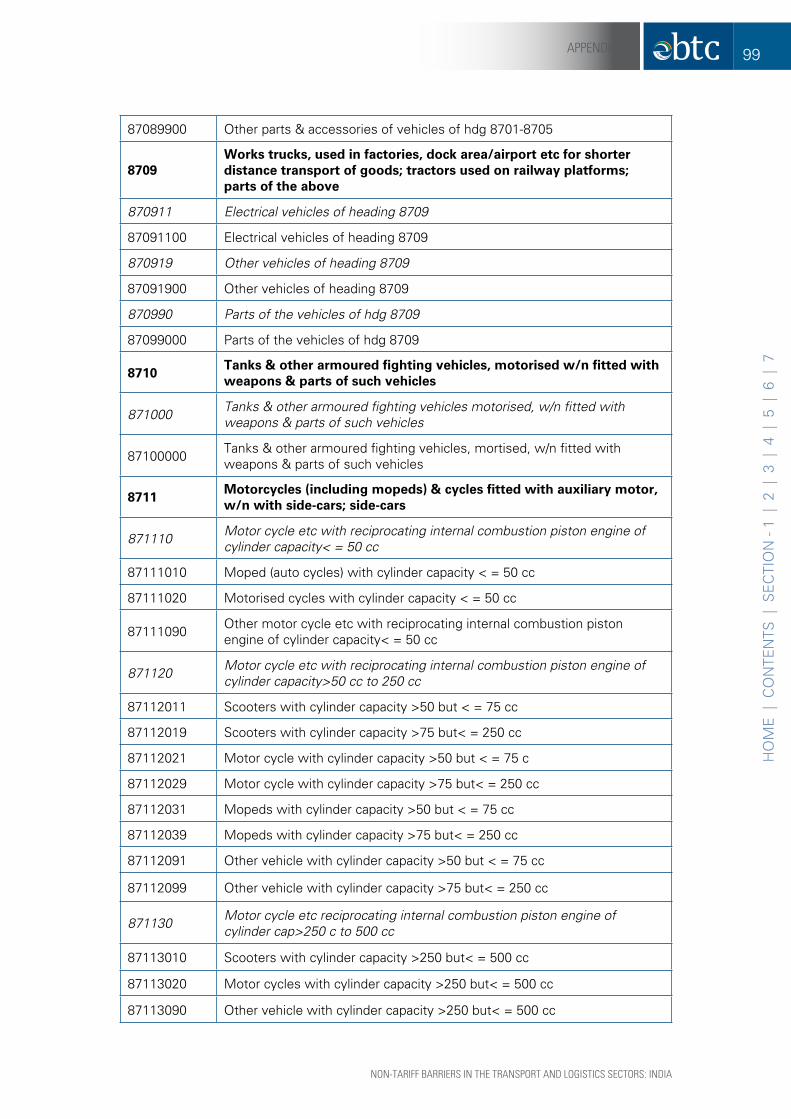
87089900 Other parts & accessories of vehicles of hdg 8701-8705
8709Works trucks, used in factories, dock area/airport etc for shorter distance transport of goods; tractors used on railway platforms; parts of the above
870911 Electrical vehicles of heading 8709
87091100 Electrical vehicles of heading 8709
870919 Other vehicles of heading 8709
87091900 Other vehicles of heading 8709
870990 Parts of the vehicles of hdg 8709
87099000 Parts of the vehicles of hdg 8709
8710Tanks & other armoured fighting vehicles, motorised w/n fitted with weapons & parts of such vehicles
871000 Tanks & other armoured fighting vehicles motorised, w/n fitted with weapons & parts of such vehicles
87100000 Tanks & other armoured fighting vehicles, mortised, w/n fitted with weapons & parts of such vehicles
8711Motorcycles (including mopeds) & cycles fitted with auxiliary motor, w/n with side-cars; side-cars
871110 Motor cycle etc with reciprocating internal combustion piston engine of cylinder capacity< = 50 cc
87111010 Moped (auto cycles) with cylinder capacity < = 50 cc
87111020 Motorised cycles with cylinder capacity < = 50 cc
87111090 Other motor cycle etc with reciprocating internal combustion piston engine of cylinder capacity< = 50 cc
871120 Motor cycle etc with reciprocating internal combustion piston engine of cylinder capacity>50 cc to 250 cc
87112011 Scooters with cylinder capacity >50 but < = 75 cc
87112019 Scooters with cylinder capacity >75 but< = 250 cc
87112021 Motor cycle with cylinder capacity >50 but < = 75 c
87112029 Motor cycle with cylinder capacity >75 but< = 250 cc
87112031 Mopeds with cylinder capacity >50 but < = 75 cc
87112039 Mopeds with cylinder capacity >75 but< = 250 cc
87112091 Other vehicle with cylinder capacity >50 but < = 75 cc
87112099 Other vehicle with cylinder capacity >75 but< = 250 cc
871130 Motor cycle etc reciprocating internal combustion piston engine of cylinder cap>250 c to 500 cc
87113010 Scooters with cylinder capacity >250 but< = 500 cc
87113020 Motor cycles with cylinder capacity >250 but< = 500 cc
87113090 Other vehicle with cylinder capacity >250 but< = 500 cc
NON-TARIFF BARRIERS IN THE TRANSPORT AND LOGISTICS SECTORS: INDIA
99APPENDIx B
HO
ME
| C
ON
TEN
TS |
SE
CTI
ON
- 1
| 2
| 3
| 4
| 5
| 6
| 7
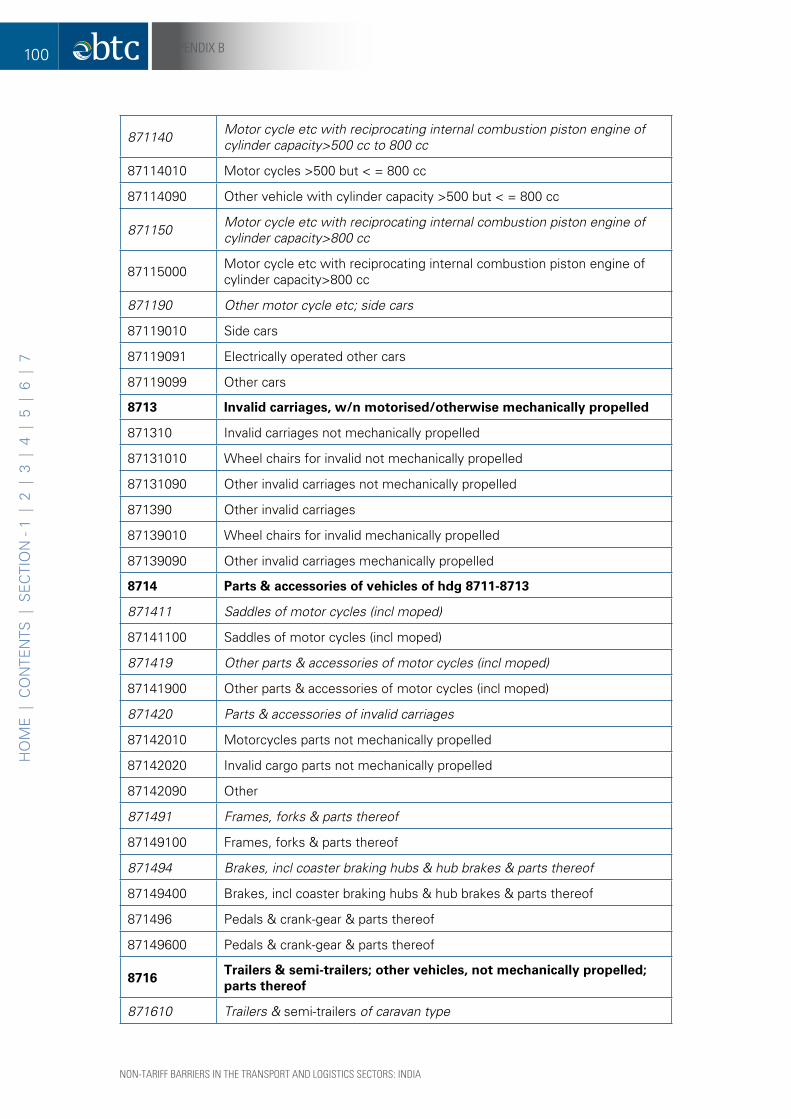
871140 Motor cycle etc with reciprocating internal combustion piston engine of cylinder capacity>500 cc to 800 cc
87114010 Motor cycles >500 but < = 800 cc
87114090 Other vehicle with cylinder capacity >500 but < = 800 cc
871150 Motor cycle etc with reciprocating internal combustion piston engine of cylinder capacity>800 cc
87115000 Motor cycle etc with reciprocating internal combustion piston engine of cylinder capacity>800 cc
871190 Other motor cycle etc; side cars
87119010 Side cars
87119091 Electrically operated other cars
87119099 Other cars
8713 invalid carriages, w/n motorised/otherwise mechanically propelled
871310 Invalid carriages not mechanically propelled
87131010 Wheel chairs for invalid not mechanically propelled
87131090 Other invalid carriages not mechanically propelled
871390 Other invalid carriages
87139010 Wheel chairs for invalid mechanically propelled
87139090 Other invalid carriages mechanically propelled
8714 parts & accessories of vehicles of hdg 8711-8713
871411 Saddles of motor cycles (incl moped)
87141100 Saddles of motor cycles (incl moped)
871419 Other parts & accessories of motor cycles (incl moped)
87141900 Other parts & accessories of motor cycles (incl moped)
871420 Parts & accessories of invalid carriages
87142010 Motorcycles parts not mechanically propelled
87142020 Invalid cargo parts not mechanically propelled
87142090 Other
871491 Frames, forks & parts thereof
87149100 Frames, forks & parts thereof
871494 Brakes, incl coaster braking hubs & hub brakes & parts thereof
87149400 Brakes, incl coaster braking hubs & hub brakes & parts thereof
871496 Pedals & crank-gear & parts thereof
87149600 Pedals & crank-gear & parts thereof
8716Trailers & semi-trailers; other vehicles, not mechanically propelled; parts thereof
871610 Trailers & semi-trailers of caravan type
NON-TARIFF BARRIERS IN THE TRANSPORT AND LOGISTICS SECTORS: INDIA
100 APPENDIx B
HO
ME
| C
ON
TEN
TS |
SE
CTI
ON
- 1
| 2
| 3
| 4
| 5
| 6
| 7

87161000 Trailers & semi-trailers of caravan type
871620 Self-loading or self-unloading trailers & semi-trailers for agricultural purposes
87162000 Self-loading or self-unloading trailers & semi-trailers for agricultural purposes
871631 Tanker trailers & tanker semi-trailers
87163100 Tanker trailers & tanker semi-trailers
871639 Other trailers & semi-trailers for transport of goods
87163900 Other trailers & semi-trailers for transport of goods
871640 Other trailers & semi-trailers
87164000 Other trailers & semi-trailers
871680 Other vehicles of chapter 87, n.e.s.
87168010 Hand propelled vehicles (e.g. hand carts, rickshaws etc)
87168020 Animal drawn vehicles
87168090 Other vehicles of chapter 87, n.e.s.
871690 Parts & accessories of vehicles of hdg 8716
87169010 Parts & accessories of trailers
87169090 Parts & accessories of other vehicle not mechanically propelled
88 aircrafT, spacecrafT, aNd parTs Thereof
8801 Balloons & dirigibles; gliders, hang gliders & other non-powered aircraft
880110 Gliders & hang gliders
88011000 Gliders & hang gliders
880190 Other(balloons, dirigibles, aircraft etc)
88019010 Balloons
88019090 Others
8802other aircraft (e.g. helicopters, aeroplanes); spacecraft (including satellites & suborbital) & spacecraft launch vehicles
880211 Helicopters of an unladen wt< = 2000 kg
88021100 Helicopters of an unladen wt< = 2000 kg
880212 Helicopters of an unladen wt> 2000 kg
88021200 Helicopters of an unladen wt> 2000 kg
880220 Aeroplanes & other aircraft, of an unlade weight not exceeding 2000 kg
88022000 Aeroplanes & other aircraft, of an unlade weight not exceeding 2000 kg
880230 Aeroplanes & other aircraft, of an unladen weight >2000 kg but not exceeding 15000 kg
88023000 Aeroplanes & other aircraft, of an unladen weight >2000 kg but not exceeding 15000 kg
880240 Aeroplanes & other aircraft, of an unladen weight exceeding 15000 kg
NON-TARIFF BARRIERS IN THE TRANSPORT AND LOGISTICS SECTORS: INDIA
101APPENDIx B
HO
ME
| C
ON
TEN
TS |
SE
CTI
ON
- 1
| 2
| 3
| 4
| 5
| 6
| 7

88024000 Aeroplanes & other aircraft, of an unladen weight exceeding 15000 kg
880260 Spacecraft (including salts & suborbital) spacecraft launch vehicles
88026000 Spacecraft (including salts & suborbital) spacecraft launch vehicles
8803 parts of goods of hdg no. 8801 or 8802
880310 Propellers & rotors & parts thereof
88031000 Propellers & rotors & parts thereof
880320 Under carriages & parts thereof
88032000 Under carriages & parts thereof
880330 Other parts of aero planes/helicopters
88033000 Other parts of aero planes/helicopters
880390 Other parts of goods of hdg 8801 or 8802
88039000 Other parts of goods of hdg 8801 or 8802
8804parachutes(including dirigible parachutes & paragliders) rotochutes; parts thereof & accessories thereto
880400 Parachutes(including dirigible parachutes & paraglide) rotochutes; parts thereof & accessories thereto
88040010 Parachutes & parts thereof & accessories thereto
88040020 Rotochutes & parts thereof & accessories thereto
8805aircraft launching gear; deck arrestor/similar gear; ground flying trainers; parts flying trainers and parts of these articles
880510 Aircraft launching gear & parts thereof deck-arrestor/similar gear & parts thereof
88051010 Aircraft launching gear
88051020 Deck arrestor or similar gear
88051030 Parts of aircraft lunching/deck arrestor gear
880521 Air combat simulators and parts thereof
88052100 Air combat simulators and parts thereof
880529 Other parts
88052900 Other parts
89 ships, BoaTs aNd fLoaTiNg sTrUcTUres
8901cruise ships, excursion boats, ferry-boats, cargo ships, barges and similar vessels for the transport of persons or goods
890110 Cruise ships, excursion boats & similar vessels principally designed for transport of persons, ferry-boats of all kinds
89011010 Ships
89011020 Launches
89011030 Boats
NON-TARIFF BARRIERS IN THE TRANSPORT AND LOGISTICS SECTORS: INDIA
102 APPENDIx B
HO
ME
| C
ON
TEN
TS |
SE
CTI
ON
- 1
| 2
| 3
| 4
| 5
| 6
| 7
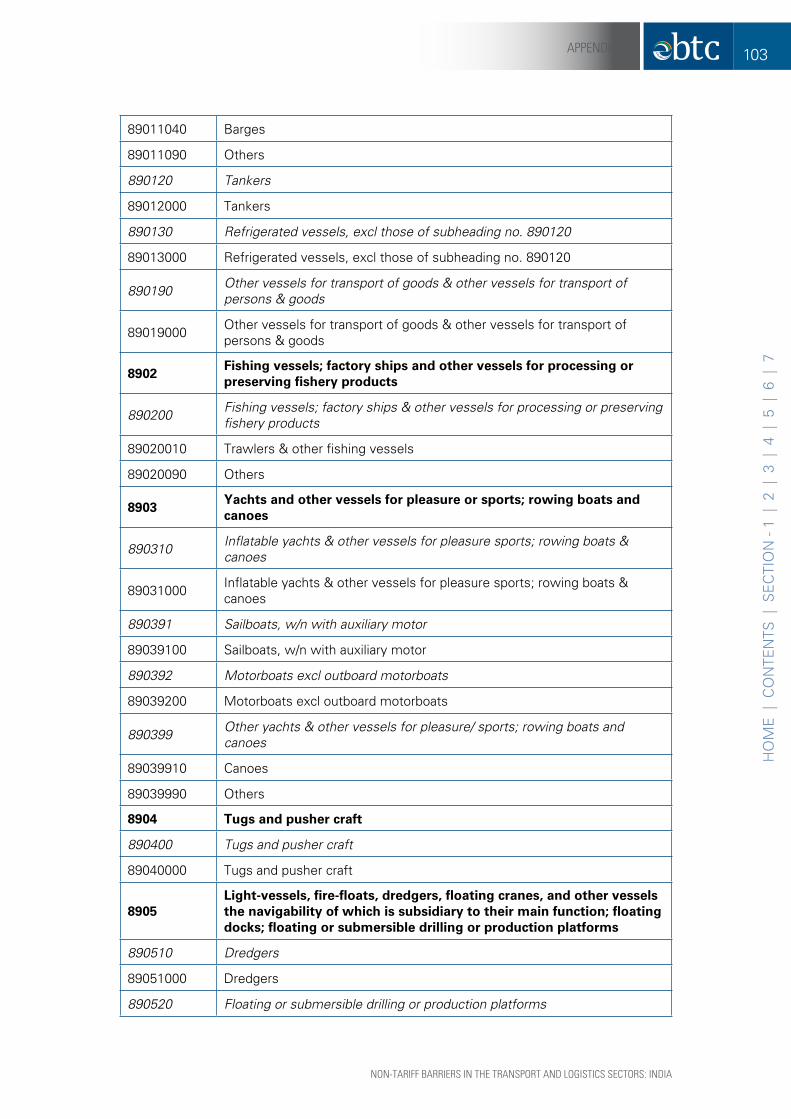
89011040 Barges
89011090 Others
890120 Tankers
89012000 Tankers
890130 Refrigerated vessels, excl those of subheading no. 890120
89013000 Refrigerated vessels, excl those of subheading no. 890120
890190 Other vessels for transport of goods & other vessels for transport of persons & goods
89019000 Other vessels for transport of goods & other vessels for transport of persons & goods
8902fishing vessels; factory ships and other vessels for processing or preserving fishery products
890200 Fishing vessels; factory ships & other vessels for processing or preserving fishery products
89020010 Trawlers & other fishing vessels
89020090 Others
8903Yachts and other vessels for pleasure or sports; rowing boats and canoes
890310 Inflatable yachts & other vessels for pleasure sports; rowing boats & canoes
89031000 Inflatable yachts & other vessels for pleasure sports; rowing boats & canoes
890391 Sailboats, w/n with auxiliary motor
89039100 Sailboats, w/n with auxiliary motor
890392 Motorboats excl outboard motorboats
89039200 Motorboats excl outboard motorboats
890399 Other yachts & other vessels for pleasure/ sports; rowing boats and canoes
89039910 Canoes
89039990 Others
8904 Tugs and pusher craft
890400 Tugs and pusher craft
89040000 Tugs and pusher craft
8905Light-vessels, fire-floats, dredgers, floating cranes, and other vessels the navigability of which is subsidiary to their main function; floating docks; floating or submersible drilling or production platforms
890510 Dredgers
89051000 Dredgers
890520 Floating or submersible drilling or production platforms
NON-TARIFF BARRIERS IN THE TRANSPORT AND LOGISTICS SECTORS: INDIA
103APPENDIx B
HO
ME
| C
ON
TEN
TS |
SE
CTI
ON
- 1
| 2
| 3
| 4
| 5
| 6
| 7
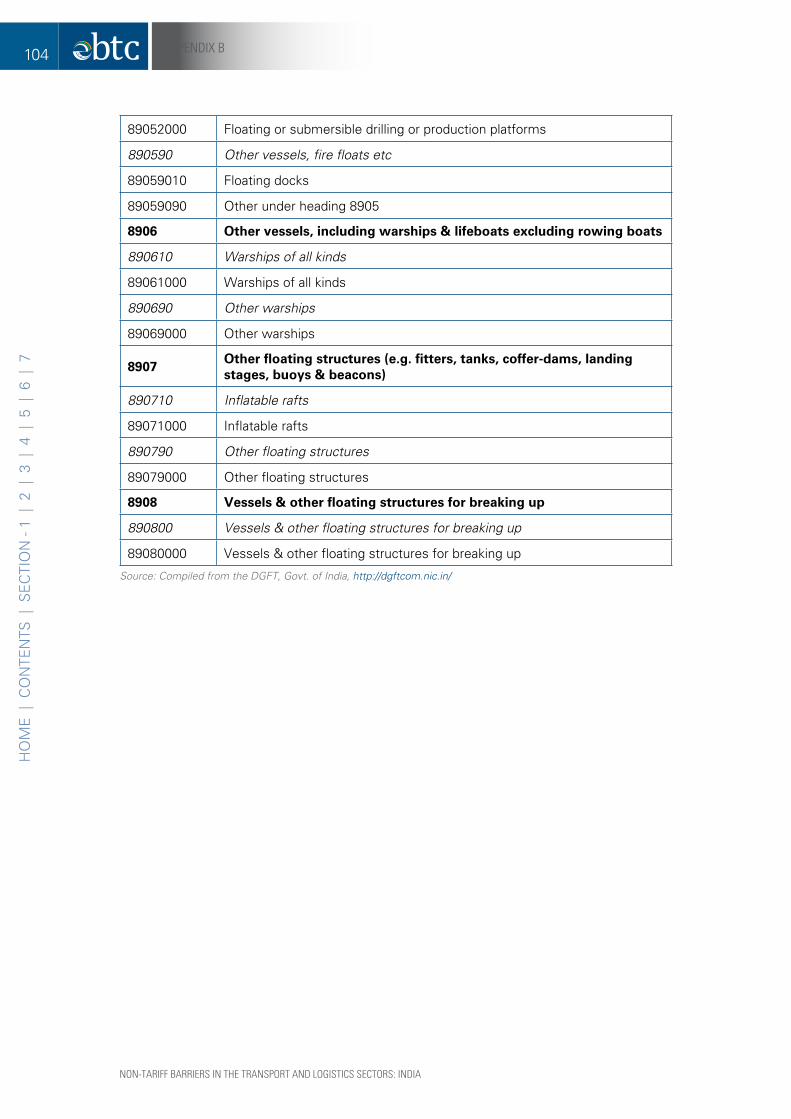
89052000 Floating or submersible drilling or production platforms
890590 Other vessels, fire floats etc
89059010 Floating docks
89059090 Other under heading 8905
8906 other vessels, including warships & lifeboats excluding rowing boats
890610 Warships of all kinds
89061000 Warships of all kinds
890690 Other warships
89069000 Other warships
8907other floating structures (e.g. fitters, tanks, coffer-dams, landing stages, buoys & beacons)
890710 Inflatable rafts
89071000 Inflatable rafts
890790 Other floating structures
89079000 Other floating structures
8908 Vessels & other floating structures for breaking up
890800 Vessels & other floating structures for breaking up
89080000 Vessels & other floating structures for breaking up
Source: Compiled from the DGFT, Govt. of India, http://dgftcom.nic.in/
NON-TARIFF BARRIERS IN THE TRANSPORT AND LOGISTICS SECTORS: INDIA
104 APPENDIx B
HO
ME
| C
ON
TEN
TS |
SE
CTI
ON
- 1
| 2
| 3
| 4
| 5
| 6
| 7

Tab
le B
.2: T
op
10
Tra
nsp
ort
atio
n p
rod
uct
s e
xpo
rted
by
ind
ia t
o t
he
eU
(val
ue in
€ m
illio
n)
ran
k (2
007)
co
mm
od
ity
(hs
co
de)
1997
-98
2000
-01
2001
-02
2002
-03
2003
-04
2004
-05
2005
-06
2006
-07
2007
-08
2008
(A
pr -
Dec
)
% s
har
e in
tr
ansp
ort
ex
po
rts
to
eU
(20
07)
1V
ehic
les
with
spa
rk-ig
nitio
n in
tern
al c
ombu
stio
n re
cipr
ocat
ing
pist
on
engi
ne o
f cy
linde
r ca
paci
ty>
1000
cc
but
not>
1500
cc
(870
322)
0.9
0.4
0.5
0.1
76.7
92.2
162
241.
833
4.8
598.
938
.2
2O
ther
par
ts &
acc
esso
ries
of v
ehic
les
of h
eadi
ng 8
701-
8705
(870
899)
56.9
58.8
63.6
61.9
84.7
120.
515
2.2
185.
121
6.5
170.
624
.7
3O
ther
par
ts o
f ae
ropl
anes
/hel
icop
ters
(880
330)
14.4
26.9
4432
.137
.619
.222
.530
.514
0.6
246.
316
.1
4V
ehic
les
with
spa
rk-ig
nitio
n in
tern
al c
ombu
stio
n re
cipr
ocat
ing
engi
ne
of a
cyl
inde
r ca
paci
ty>
1500
cc
but<
= 3
000
cc (8
7032
3)34
.93.
114
.03.
368
.529
.336
.525
.742
.012
.54.
8
5O
ther
par
ts o
f go
ods
of h
eadi
ng 8
801
or 8
802
(880
390)
0.6
0.5
3.1
0.6
2.6
4.8
2.8
1.3
34.0
46.9
3.9
6D
rive
axle
s w
ith d
iffer
entia
l w/n
pro
vide
d w
ith o
ther
tra
nsm
issi
on
com
pone
nts
(870
850)
0.1
2.7
0.3
0.6
0.4
0.4
2.0
18.4
28.4
18.8
3.2
7O
ther
bra
kes
& s
ervo
-bra
kes
& p
arts
the
reof
870
839
1.4
9.3
7.5
4.1
6.2
6.4
10.8
18.8
26.5
0.0
3.0
8B
umpe
rs &
par
ts t
here
of (8
7081
0)5.
24.
94.
28.
57.
117
.223
.834
.425
.921
.33.
0
9G
oods
veh
icle
s, w
ith c
ombu
stio
n-ig
nitio
n in
tern
al c
ombu
stio
n st
atio
n en
gine
(die
sel/s
emi-d
iese
l), g
.v.w
.< =
5 t
on (8
7042
1)32
.422
.714
.74.
26.
610
.99.
711
.914
.213
.81.
6
10O
ther
par
ts &
acc
esso
ries
of m
otor
cyc
les
(incl
udin
g m
oped
(871
419)
1.9
3.0
2.6
2.5
4.6
5.6
10.8
9.8
13.2
9.9
1.5
exp
ort
Val
ue
(To
p 1
0 p
rod
uct
s)14
913
715
411
829
530
643
357
887
611
39
per
cen
tag
e sh
are
(To
p 1
0 p
rod
uct
s)38
.150
.562
.040
.353
.848
.454
.675
.585
.6
Sou
rce:
Aut
hors
’ cal
cula
tions
fro
m E
xpor
t-Im
port
Dat
aban
k, D
GFT
, Gov
t. o
f In
dia.
Not
e: E
xcha
nge
rate
s ar
e as
fol
low
s:
For
2000
, Re.
1 =
Є0.
0241
; for
200
1, R
e.1
= Є
0.02
37; f
or 2
002,
Re.
1 =
Є0.
0208
; for
200
3, R
e. 1
= Є
0.01
85; f
or 2
004,
Re.
1 =
Є0.
0177
; for
200
5, R
e. 1
= Є
0.01
85; f
or 2
006,
Re.
1 =
Є0.
0172
1;
for
2007
, Re.
1 =
Є0.
0175
; for
200
8 (A
pr–D
ec),
Re.
1 =
Є0.
0153
. (S
ourc
e: R
BI a
nd F
orei
gn E
xcha
nge
Dea
lers
’ Ass
ocia
tion
of In
dia,
htt
p://w
ww
.fed
ai.o
rg.in
/)
NON-TARIFF BARRIERS IN THE TRANSPORT AND LOGISTICS SECTORS: INDIA
105APPENDIx B
HO
ME
| C
ON
TEN
TS |
SE
CTI
ON
- 1
| 2
| 3
| 4
| 5
| 6
| 7

Tab
le B
.3: T
op
10
Tra
nsp
ort
atio
n p
rod
uct
s im
po
rted
by
ind
ia f
rom
th
e e
U
(val
ue in
€ m
illio
n)
ran
k (2
007)
co
mm
od
ity
(hs
co
de)
1997
-98
2000
-01
2001
-02
2002
-03
2003
-04
2004
-05
2005
-06
2006
-07
2007
-08
2008
(A
pr-
Dec
)
% s
hare
in
tota
l tra
nsp
im
port
from
eU
(200
7)
1A
erop
lane
s &
oth
er a
ircra
ft, o
f an
unl
aden
wei
ght
>20
00 k
g bu
t no
t ex
clud
ing
1500
0 kg
(880
230)
0.0
0.0
0.0
242.
80.
031
.720
95.2
265.
723
81.6
0.0
55.5
2A
erop
lane
s &
oth
er a
ircra
ft, o
f an
unl
ade
wei
ght
not
exce
edin
g 20
00 k
g (8
8022
0)0.
60.
00.
030
.80.
00.
00.
459
.128
4.6
0.1
6.6
3O
ther
par
ts &
acc
esso
ries
of v
ehic
les
of h
eadi
ng 8
701-
8705
(870
899)
112
55.6
79.0
44.1
88.2
135.
417
9.6
227.
423
0.0
264.
75.
4
4O
ther
par
ts o
f ae
ropl
anes
/hel
icop
ters
(880
330)
53.9
39.1
75.2
129.
913
5.1
121.
717
5.4
256.
321
0.9
117.
74.
9
5C
ruis
e sh
ips,
exc
ursi
on b
oats
& s
imila
r ve
ssel
s pr
inci
pally
de
sign
ed f
or t
rans
port
of
pers
ons,
fer
ry-b
oats
of
all k
inds
(890
110)
7.9
1.1
3.0
0.4
11.1
8.2
15.2
124.
320
4.1
71.7
4.8
6A
erop
lane
s &
oth
er a
ircra
ft, o
f an
unl
aden
wei
ght
exce
edin
g 15
000
kg (8
8024
0)10
2.9
0.0
86.7
0.0
27.9
429.
60.
013
97.7
150.
70.
03.
5
7O
ther
ves
sels
for
tra
nspo
rt o
f go
ods
& o
ther
ves
sels
for
tra
nspo
rt
of p
erso
ns &
goo
ds (8
9019
0)73
.733
.96.
931
.735
.12.
010
0.1
36.9
136.
020
7.8
3.2
8D
redg
ers
(890
510)
0.0
105.
679
.21.
112
.231
.684
.517
.912
9.4
51.1
3.0
9O
ther
ves
sels
, fire
floa
ts e
tc (8
9059
0)0.
19.
810
.41.
92.
318
.412
9.2
56.0
98.5
166.
92.
3
10V
ehic
le w
ith s
park
-igni
tion
inte
rnal
com
bust
ion
reci
proc
atin
g st
atio
n en
gine
of
cylin
der
capa
city
>30
00 c
c (8
7032
4)0.
80.
20.
80.
60.
76.
416
.622
.944
.949
.81.
0
imp
ort
Val
ue
(To
p 1
0 p
rod
uct
s)35
224
534
148
331
378
527
9624
6438
7993
0
per
cen
t sh
are
(To
p 1
0 p
rod
uct
s)62
.574
.182
.071
.352
.378
.089
.281
.190
.3
Sou
rce:
Aut
hors
’ cal
cula
tions
fro
m E
xpor
t-Im
port
Dat
aban
k, D
GFT
, Gov
t. o
f In
dia.
Not
e: E
xcha
nge
rate
s ar
e as
fol
low
s:
For
2000
, Re.
1 =
Є0.
0241
; for
200
1, R
e.1
= Є
0.02
37; f
or 2
002,
Re.
1 =
Є0.
0208
; for
200
3, R
e. 1
= Є
0.01
85; f
or 2
004,
Re.
1 =
Є0.
0177
; for
200
5, R
e. 1
= Є
0.01
85; f
or 2
006,
Re.
1 =
Є0.
0172
1;
for
2007
, Re.
1 =
Є0.
0175
; for
200
8 (A
pr–D
ec),
Re.
1 =
Є0.
0153
. (S
ourc
e: R
BI a
nd F
orei
gn E
xcha
nge
Dea
lers
’ Ass
ocia
tion
of In
dia,
htt
p://w
ww
.fed
ai.o
rg.in
/)
NON-TARIFF BARRIERS IN THE TRANSPORT AND LOGISTICS SECTORS: INDIA
106 APPENDIx B
HO
ME
| C
ON
TEN
TS |
SE
CTI
ON
- 1
| 2
| 3
| 4
| 5
| 6
| 7

Tab
le B
.4: c
ust
om
s T
arif
f fo
r T
ran
spo
rtat
ion
eq
uip
men
t fo
r 20
09-1
0
s. N
oB
asic
cu
sto
m d
uty
ap
plic
able
eq
uip
men
ts
110
per
cen
t
Rai
lway
and
rel
ated
equ
ipm
ent
(HS
Cod
e 86
);
trac
tors
(exc
l tra
ctor
s of
hea
ding
no.
870
9) (8
701)
,
mot
or v
ehic
les
for
the
tran
spor
t of
ten
or
mor
e pe
rson
s, in
clud
ing
the
driv
er (8
702)
, Mot
or v
ehic
les
for
the
tran
spor
t of
goo
ds (8
704)
,
spec
ial p
urpo
se, R
ailw
ay o
r tr
amw
ay p
asse
nger
coa
ches
, lug
gage
van
s, p
ost-
offic
e co
ache
s &
oth
er s
peci
al r
ailw
ays
or t
ram
way
s no
t se
lf-pr
opel
led
(exc
ludi
ng it
ems
of 8
604)
(870
5),
Cha
ssis
fitt
ed w
ith e
ngin
es, f
or t
he m
otor
veh
icle
s (8
606)
,
Bod
ies
(incl
udin
g ca
bs),
for t
he m
otor
veh
icle
s of
hea
ding
870
1 to
870
5 (8
707)
, par
ts a
nd a
cces
sorie
s of
the
mot
or v
ehic
les
of h
eadi
ngs
8701
to 8
705
(870
8),
Wor
ks tr
ucks
, use
d in
fact
orie
s, d
ock
area
/airp
ort,
etc
for s
hort
er d
ista
nce
tran
spor
t of g
oods
; tra
ctor
s us
ed o
n ra
ilway
pla
tfor
ms;
par
ts o
f the
abo
ve (8
709)
,
Inva
lid c
arria
ges,
w/n
mot
oris
ed/o
ther
wis
e m
echa
nica
lly p
rope
lled
(871
3),
Par
ts &
acc
esso
ries
of v
ehic
les
of h
dg 8
711-
8713
(871
4),
Trai
lers
& s
emi-t
raile
rs; o
ther
veh
icle
s, n
ot m
echa
nica
lly p
rope
lled;
par
ts t
here
of (8
716)
, and
bal
loon
s an
d di
rigib
les,
glid
ers,
han
d gi
rder
s (H
S c
ode
8801
), H
elic
opte
rs o
f an
unl
aden
wei
ght<
= 2
000
kg (8
8021
1),
Hel
icop
ters
of
an u
nlad
en w
eigh
t >
200
0 kg
(880
212)
, Oth
er p
arts
of
good
s of
hdg
880
1 or
880
2 (8
8039
0),
para
chut
es (i
nclu
ding
diri
gibl
e pa
rach
utes
& p
arag
lider
s) r
otoc
hute
s; p
arts
the
reof
& a
cces
sorie
s th
eret
o (8
804)
,
and
airc
raft
laun
chin
g ge
ar; d
eck
arre
stor
/sim
ilar
gear
; gro
und
flyin
g tr
aine
rs; p
arts
flyi
ng t
rain
ers
and
part
s of
the
se a
rtic
les,
and
shi
ps, b
oats
and
floa
ting
stru
ctur
es (H
S c
ode
89).
23
per
cent
App
licab
le o
n A
erop
lane
s &
oth
er a
ircra
ft, o
f an
unl
ade
wei
ght
not
exce
edin
g 20
00 k
g (8
8022
0),
Aer
opla
nes
& o
ther
airc
raft
, of
an u
nlad
en w
eigh
t >
2000
kg
but
not
exce
edin
g 15
000
kg (8
8023
0),
aero
plan
es &
oth
er a
ircra
ft, o
f an
unl
aden
wei
ght
exce
edin
g 15
000
kg (8
8024
0), p
rope
llers
& r
otor
s &
par
ts t
here
of (8
8031
0),
Und
er-c
arria
ges
& p
arts
the
reof
(880
320)
and
othe
r pa
rts
of a
ero
plan
es/h
elic
opte
rs (8
8033
0).
310
0 pe
r ce
ntA
pplic
able
on
mot
or c
ars
and
othe
r mot
or v
ehic
les
prin
cipa
lly d
esig
ned
for t
he tr
ansp
ort o
f per
sons
(oth
er th
an th
ose
of h
eadi
ng 8
702)
, inc
ludi
ng ra
cing
car
s,
etc.
, Mot
orcy
cles
(inc
ludi
ng m
oped
s) &
cyc
les
fitte
d w
ith a
uxili
ary
mot
or, w
/n w
ith s
ide-
cars
; sid
e-ca
rs (8
711)
.
NON-TARIFF BARRIERS IN THE TRANSPORT AND LOGISTICS SECTORS: INDIA
107APPENDIx B
HO
ME
| C
ON
TEN
TS |
SE
CTI
ON
- 1
| 2
| 3
| 4
| 5
| 6
| 7

appendix c
overview of gaTs
The General Agreement on Trade in Services (GATS), established in the Uruguay
Round, is the first-ever set of multilateral, legally enforceable rules governing trade in
services. The main aim of GATS is to progressively liberalise trade and investment in
services through periodic rounds of negotiations.
Under GATS, services are traded in four different modes:
Mode 1: “Cross-Border Supply of Services” refers to the delivery of services across
countries such as the cross-country movement of passengers and freight, electronic
delivery of information and data among others.
Mode 2: “Consumption Abroad” refers to the physical movement of the consumer of
the service to the location where the service is provided and consumed.
Mode 3: “Commercial Presence” refers to the establishment of foreign affiliates and
subsidiaries of foreign service companies, joint ventures, partnerships, representative
offices and branches. It is analogous to FDI in services.
Mode 4: “Presence of Natural Persons” refers to natural persons who are themselves
service suppliers, as well as natural persons who are employees of service suppliers
temporarily present in the other member’s market to provide services.
In Modes 1 and 2 the service supplier is not present within the territory of the member,
while in Modes 3 and 4 the service supplier is present within the territory of the member.
GATS contains two kinds of provisions. The first are general obligations, some of
which apply to all service sectors [for example, Most Favoured Nation (MFN) and
Transparency] and some only to scheduled specific commitments (for example,
Article XI: Payments and Transfers). The second are specific commitments, which are
negotiated undertakings particular to each GATS signatory.
Under the MFN Treatment (Article II), a Member is obliged to provide to another
Member treatment which is no less favourable than that which it provides to any
other country, whether a Member or not (that is, if a WTO Member Country offers a
NON-TARIFF BARRIERS IN THE TRANSPORT AND LOGISTICS SECTORS: INDIA
108 APPENDIx C
HO
ME
| C
ON
TEN
TS |
SE
CTI
ON
- 1
| 2
| 3
| 4
| 5
| 6
| 7

certain privilege to any other country, whether it be a Member or not, it has to extend
the same treatment to all WTO member countries). However, GATS allowed member
countries to undertake exemptions to this clause, in their initial commitments in the
Uruguay Round, subject to review.
The clause on Transparency (Article III) requires each Member country to publish
all measures of general applications which pertain to or affect the operation of the
Agreement. Countries are also required to publish international agreements pertaining
to or affecting trade in services. In other words, the Council of Trade in Services will
have to be informed – at least annually – of the introduction of any new laws or any
changes to existing laws, regulations and administrative guidelines. WTO member
countries can make requests regarding specific information which the concerned
country will have to provide promptly.
GATS aims to progressively liberalise service trade under the four modes of service
supply. For each mode a country can impose two types of restrictions (limitations):
Market Access and/or National Treatment. A country is said to have imposed a Market
Access restriction if it does not allow (or partially allows with some restrictions) foreign
service providers to enter and operate in domestic market. A National Treatment
restriction exists when foreign services or service providers are allowed to enter
the market but are treated less favourably than domestic service providers. During
the successive rounds of negotiations, member countries negotiate and undertake
commitments to liberalise market access and/or national treatment in specific
sectors in what is known as the Sectoral Schedule of Commitments and across all
or several sectors in the Horizontal Schedule of Commitments. Both the sectoral and
horizontal schedules have to be read together to understand the extent and nature
of commitments undertaken in a particular sector. Thus, market access and national
treatment are negotiated obligations. It is possible for countries not to grant full
market access and deny national treatment by putting limitations and conditions on
market access and conditions and qualifications on national treatment in particular
sectors/sub-sectors. This is done by recording such limitations and qualifications in
the commitment schedules under the market access and national treatment columns.
In its schedule a country is said to have made a “Full” commitment in a particular
mode/sector if there are no restrictions on market access or national treatment. A
country is said to have made “Partial” commitment if the commitment is subject
to some restrictions on market access or national treatment. If a country does not
make any commitment to liberalise a particular sector or mode of supply and retains
the right to impose restrictions in the future, it is said to have kept the sector/mode
NON-TARIFF BARRIERS IN THE TRANSPORT AND LOGISTICS SECTORS: INDIA
109APPENDIx C
HO
ME
| C
ON
TEN
TS |
SE
CTI
ON
- 1
| 2
| 3
| 4
| 5
| 6
| 7

“Unbound”. It is expected that successive rounds of negotiations will secure further
liberalisation by adding more sectors to a country’s schedule and removing limitations
and qualifications, if any, in sectors/sub-sectors already in the schedule. This is
done mode-wise for each sector/sub-sector. It is also possible for countries to make
commitments which are outside the scope of market access and national treatment
as defined in GATS. These are called Additional Commitments (Article XVIII). This
provides scope for making commitments in such regulatory areas as licensing,
qualifications and standards applicable to services.
GATS covers all services except those supplied in the exercise of government authority.
It follows a positive list approach which indicates that there is no a priori exclusion
of any service sector and that countries are free to choose the service sectors/sub-
sectors and modes within those sectors/sub-sectors for scheduling commitments.
NON-TARIFF BARRIERS IN THE TRANSPORT AND LOGISTICS SECTORS: INDIA
110 APPENDIx C
HO
ME
| C
ON
TEN
TS |
SE
CTI
ON
- 1
| 2
| 3
| 4
| 5
| 6
| 7

IBC Building, m-38/1, middle Circle, Connaught Place, New Delhi - 110 001, India E-mail: [email protected] Tel: +91 - (0) 11 4517 2200 Fax: +91 - (0) 11 4517 2209 Web: www.ebtc.eu
© 2010 ebtc
This publication has been produced with the assistance of the European Union. The contents of this publication are the sole responsibility of the European Business and Technology Centre and can in no way be taken to reflect the views of the European Union.