Chapter 10 Tariff and Non-tariff Barriers€¦ · Chapter 10 Tariff and Non-tariff Barriers 10.1...
37
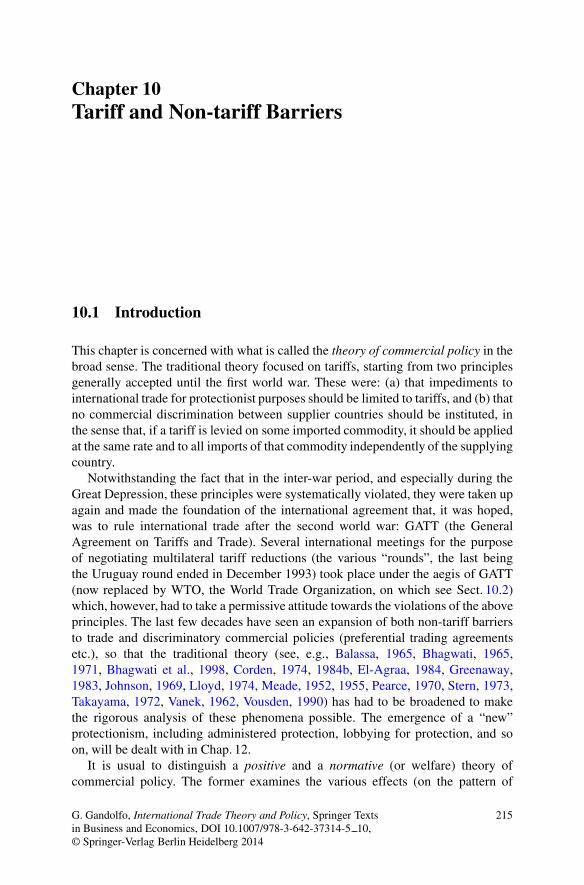
Chapter 10 Tariff and Non-tariff Barriers 10.1 Introduction This chapter is concerned with what is called the theory of commercial policy in the broad sense. The traditional theory focused on tariffs, starting from two principles generally accepted until the first world war. These were: (a) that impediments to international trade for protectionist purposes should be limited to tariffs, and (b) that no commercial discrimination between supplier countries should be instituted, in the sense that, if a tariff is levied on some imported commodity, it should be applied at the same rate and to all imports of that commodity independently of the supplying country. Notwithstanding the fact that in the inter-war period, and especially during the Great Depression, these principles were systematically violated, they were taken up again and made the foundation of the international agreement that, it was hoped, was to rule international trade after the second world war: GATT (the General Agreement on Tariffs and Trade). Several international meetings for the purpose of negotiating multilateral tariff reductions (the various “rounds”, the last being the Uruguay round ended in December 1993) took place under the aegis of GATT (now replaced by WTO, the World Trade Organization, on which see Sect. 10.2) which, however, had to take a permissive attitude towards the violations of the above principles. The last few decades have seen an expansion of both non-tariff barriers to trade and discriminatory commercial policies (preferential trading agreements etc.), so that the traditional theory (see, e.g., Balassa, 1965, Bhagwati, 1965, 1971, Bhagwati et al., 1998, Corden, 1974, 1984b, El-Agraa, 1984, Greenaway, 1983, Johnson, 1969, Lloyd, 1974, Meade, 1952, 1955, Pearce, 1970, Stern, 1973, Takayama, 1972, Vanek, 1962, Vousden, 1990) has had to be broadened to make the rigorous analysis of these phenomena possible. The emergence of a “new” protectionism, including administered protection, lobbying for protection, and so on, will be dealt with in Chap. 12. It is usual to distinguish a positive and a normative (or welfare) theory of commercial policy. The former examines the various effects (on the pattern of G. Gandolfo, International Trade Theory and Policy, Springer Texts in Business and Economics, DOI 10.1007/978-3-642-37314-5 10, © Springer-Verlag Berlin Heidelberg 2014 215
Transcript of Chapter 10 Tariff and Non-tariff Barriers€¦ · Chapter 10 Tariff and Non-tariff Barriers 10.1...
Chapter 10Tariff and Non-tariff Barriers
10.1 Introduction
This chapter is concerned with what is called the theory of commercial policy in thebroad sense. The traditional theory focused on tariffs, starting from two principlesgenerally accepted until the first world war. These were: (a) that impediments tointernational trade for protectionist purposes should be limited to tariffs, and (b) thatno commercial discrimination between supplier countries should be instituted, inthe sense that, if a tariff is levied on some imported commodity, it should be appliedat the same rate and to all imports of that commodity independently of the supplyingcountry.
Notwithstanding the fact that in the inter-war period, and especially during theGreat Depression, these principles were systematically violated, they were taken upagain and made the foundation of the international agreement that, it was hoped,was to rule international trade after the second world war: GATT (the GeneralAgreement on Tariffs and Trade). Several international meetings for the purposeof negotiating multilateral tariff reductions (the various “rounds”, the last beingthe Uruguay round ended in December 1993) took place under the aegis of GATT(now replaced by WTO, the World Trade Organization, on which see Sect. 10.2)which, however, had to take a permissive attitude towards the violations of the aboveprinciples. The last few decades have seen an expansion of both non-tariff barriersto trade and discriminatory commercial policies (preferential trading agreementsetc.), so that the traditional theory (see, e.g., Balassa, 1965, Bhagwati, 1965,1971, Bhagwati et al., 1998, Corden, 1974, 1984b, El-Agraa, 1984, Greenaway,1983, Johnson, 1969, Lloyd, 1974, Meade, 1952, 1955, Pearce, 1970, Stern, 1973,Takayama, 1972, Vanek, 1962, Vousden, 1990) has had to be broadened to makethe rigorous analysis of these phenomena possible. The emergence of a “new”protectionism, including administered protection, lobbying for protection, and soon, will be dealt with in Chap. 12.
It is usual to distinguish a positive and a normative (or welfare) theory ofcommercial policy. The former examines the various effects (on the pattern of
G. Gandolfo, International Trade Theory and Policy, Springer Textsin Business and Economics, DOI 10.1007/978-3-642-37314-5 10,© Springer-Verlag Berlin Heidelberg 2014
215

216 10 Tariff and Non-tariff Barriers
consumption, on the allocation of resources etc.) of the imposition of tariffs andof other measures of intervention on trade, but is not concerned with evaluatingtheir desirability and even less with defining the properties of a set of optimalmeasures: these are the concern of the normative theory. Naturally, in practice itis difficult to separate the positive from the welfare aspects, so that—though thepresent chapter concentrates on the former and Chap. 11 on the latter—both aspectswill be present throughout our treatment.
Before going on, it is advisable to say a few words on the institutional setting.
10.2 GATT and WTO
GATT (General Agreement on Tariffs and Trade) was established in 1947 on aprovisional basis with the aim of providing an international forum for negotiatingtariff reductions, agreeing on world trade disciplines, solving trade disputes.Provisional because GATT was meant to pave the way for a specialized agencyof the United Nations, the ITO (International Trade Organization), to be establishedshortly afterwards. This did not take place because the national ratification of theITO charter proved impossible in some countries (amongst which the United States).Thus provisionality lasted for 47 years, until WTO (World Trade Organization) wasestablished.
GATT has promoted international trade liberalization in several ways. It hasoutlawed the use in general of import quotas, and established the extension toall members of the MFN (Most Favoured Nation) treatment. Under Article Iof GATT (also called the MFN clause), members have committed themselvesto give to the products of other members a treatment no less favourable thanthat granted to the products of any other country. Thus, no country can givespecial advantages to another country or discriminate against it. GATT has alsoprovided a negotiating framework for tariff reductions through multilateral tradenegotiations or “trade rounds”, the last and most extensive being the Uruguay round(1986–1993). These negotiations have involved not only tariffs, but also subsidiesand countervailing measures, anti-dumping, technical barriers to trade, governmentprocurement, and so on.
The original agreement (called GATT 1947) was amended and updated in 1994(GATT 1994). GATT 1994 is an integral part of WTO, which was established on 1stJanuary 1995.
As the names say, WTO is an organization (see WTO, 1995), while GATT 1947was an agreement. This is not only a semantic difference or a juridical subtlety:an agreement is simply a set of rules with no legal institutional foundation; a (per-manent) organization is an institution with legal personality and its own secretariatand powers. This implies, amongst other, that the WTO dispute settlement systemis faster and more automatic, and the implementation of its decisions on disputes ismore easily assured.

10.2 GATT and WTO 217
Box 10.1 Multilateral Trade Rounds
Since GATT’s creation in 1947–1948, there have been eight rounds of trade negotiations,whilst a ninth round, under the Doha Development Agenda, is now underway and expectedto end by 1 January 2005 (see table below). The first GATT trade rounds concentratedon further reducing tariffs. With the Kennedy Round, over the 1960s, an Anti-DumpingAgreement and a section on development were brought into the GATT, while the TokyoRound was the first major attempt to tackle also non-tariff trade barriers. The eighth Round,the Uruguay Round lasted for 8 years and led to the creation of the WTO and to a new setof agreements, such as the General Agreement on Trade in Services (GATS) and on Trade-Related aspects of Intellectual Property (TRIPS).
No. ofYear Place/name Subjects covered parties
1947 Geneva Tariffs 231949 Annecy Tariffs 131951 Torquay Tariffs 381956 Geneva Tariffs 261960–1961 Geneva (Dillon Round) Tariffs 261964–1967 Geneva (Kennedy Round) Tariffs and anti-dumping 621973–1979 Geneva (Tokyo Round) Tariffs, non tariff measures, 102
framework agreements”1986–1994 Geneva (Uruguay Round) Tariffs, non-tariff measures, 123
rules, services, intellectualproperty, dispute settlement,textiles, agriculture,creation of WTO
While the Singapore ministerial conference (1996) defined the WTO work plan, theGeneva ministerial meeting, held in 1998, provided the mandate to launch a new round ofnegotiations at its next summit, in Seattle (1999). As the Seattle ministerial meeting turnedout to be a complete failure, with critical issues separating industrialised and developingcountries, the next negotiating round was launched in Doha, in 2001. The Doha Rounddelivered the Doha Development Agenda, which, recognising the major role that interna-tional trade plays in promoting economic development and poverty alleviation, comprisesfurther market opening and additional rule making, strengthened by commitments toincrease assistance to build capacity in developing countries. It also added negotiationsand other work on, among others, non-agricultural tariffs, trade and environment andWTO rules such as anti-dumping and subsidies. With the end of the Cancun ministerialconference (September 2003) without consensus, decisions related to the implementation ofthe Doha agreement were further postponed. In August 2004 the so-called July Package wasapproved. which established a number of objectives concerning principally the three mainthemes of the confrontation on the agricultural sector (internal support, export subsidies,access to markets) and fixed the conclusion of the negotiations at the ministerial conferenceto be held in Hong Kong the following year. However, at the Hong Kong meeting no stepforward was done and since then the negotiations are at a deadlock. However, it has beenfixed the date of 2013 for the dismantling of agricultural export subsidies by developedountries, and measures have been taken to favour the access of developing countriesto advanced international markets. The irreconcilability of the various positions of theparticipants in the negotiations led the director-general of WTO to suspend the Doha roundin July 2006. The negotiations were taken up again in 2007, but without much success:the deadlock remains, and the prospects of the Doha round remain very uncertain.

218 10 Tariff and Non-tariff Barriers
From the economic point of view, WTO has a greater scope than GATT, forGATT rules applied solely to trade in merchandise, while WTO in addition to goodsalso covers trade in services as well as trade-related aspects of intellectual property.
GATT, and now WTO, are sometimes described as free-trade institutions.This is not entirely correct, if only because tariffs (and, in limited circumstances,other forms of protection) are permitted. The basic aim of GATT and WTO rulesis to secure open, fair and undistorted competition in international trade. Ruleson non-discrimination, as well as those on dumping and subsidies (governmentsare allowed to impose compensating duties on these forms of unfair competition),are designed to bring about fair conditions of trade.
10.3 Partial Equilibrium Effects of a Tariff
We begin with the traditional study of the effects of a tariff; henceforth the tariffis assumed to have the form of an ad valorem tax on imports (so that, if p is thepre-tariff price, the cum-tariff price will be .1Cd/p, where d 1 is the tariff rate) andnot of a specific tariff (so many dollars per unit of the commodity).
The effects of a tariff can be examined either in a partial or a general equilibriumcontext. In the former case one considers solely the market for the commodity onwhich the tariff is imposed and neglects—by a ceteris paribus clause—the reper-cussions on and from the rest of the system; these, on the contrary, are explicitlybrought into the analysis in the latter case (see Sect. 10.5).
In Fig. 10.1a we have drawn the domestic demand and supply curves—forsimplicity’s sake they are assumed linear and normal—for the commodity beingexamined. If we assume that its world price is p, this will also be its domestic pricegiven the usual assumptions (perfect competition, no transport costs, no tariffs).At this price the imports of the commodity are FH, equal to the domestic excessdemand. If a tariff is now levied, say d1, the domestic price will increase to p.1Cd1/
at the same world price p: This implies the assumption that the country levyingthe tariff is small, so that the variation in its import demand due to the tariffhas negligible effects on the world market of the commodity, and the world priceremains constant. This assumption will subsequently be dropped.
The consequence is that demand decreases, domestic output (supply) increasesand imports decrease from FH to F1H1. As an extreme case, it is possible toconceive a tariff—d2 in Fig. 10.1a—so high that the increase in the domestic pricebrings this to the level at which domestic demand and supply are equal and importscease: such a tariff is called a prohibitive tariff.
In these brief considerations all the effects of the tariff are included, and can bemade explicit as follows:
1The symbol generally used for the tariff rate is t . However, since in this book we have used thesymbol t to denote time, another symbol (d , from duty) has been used to indicate the tariff rate.

10.3 Partial Equilibrium Effects of a Tariff 219
Fig. 10.1 Partial equilibrium effects of a tariff
1. Consumption effect. Domestic consumption of the commodity decreases byq3q4 D HH0
1.2. Production (or protective) effect. Domestic output increases by q1q2 D FF0
1.3. Import effect. Imports decrease by an amount equal to the sum of the two previous
effects, as q2q3 D q1q4 � .q3q4 C q1q2/.4. Fiscal revenue effect. The tariff represents a fiscal revenue for the government of
the levying country. To calculate total tariff revenue, note that it is given by theabsolute value of the tariff per unit of the commodity multiplied by the quantityimported. The former is p .1 C d1/ � p D d1p D MN D F1F 0
1, the latter isq2q3 D F1H1. Therefore total tariff revenue is F1F 0
1 � F1H1, that is, the area ofthe rectangle F1F
01H 0
1H1:
5. Redistribution effect. Since the price has increased, there is a redistribution ofincome from consumers to producers. This point needs to be gone into a littlefurther.
Actually, it can be said that consumers subsidize the domestic production of thecommodity by an amount MN per unit, so that the total subsidy is MNF0
1F1: Thisis also called the subsidy-equivalent of the tariff; in other words, if the governmentdirectly subsidized the domestic production, instead of imposing a tariff, the totalcost of the subsidy to obtain the same amount of protection would be exactly equalto the subsidy-equivalent. In fact, to induce domestic firms to produce the quantityOq2 and sell it at unit price ON instead of OM (in the absence of the tariff the pricewould remain at ON), it is necessary to give them a subsidy equal to the revenueloss, which is exactly MNF0
1F1.But consumers do not only pay out the subsidy-equivalent: they are also taxed
by an amount equal to the tariff revenue which accrues to the government, becausethis amount ultimately comes out of their own pockets. We can therefore define aconsumer tax equivalent to the tariff as the sum of the subsidy-equivalent and thetariff revenue. In other words, if—instead of the tariff—a consumption tax wereimposed, with the aim of reducing consumption by the same amount as wouldbe reduced in consequence of the tariff, then the unit rate of this tax would haveto be MN, which would give rise to a fiscal revenue equal to MNH0
1H1, in turn

220 10 Tariff and Non-tariff Barriers
equal to MNF01F1 (subsidy-equivalent) CF1F
01H 0
1H1 (tariff revenue). As a matterof fact, the tariff has the same effect as a consumption tax (with the same rate as thetariff), the revenue of which is used by the government partly to subsidize domesticproducers and partly to increase its fiscal revenue.
10.4 The Social Costs of a Tariff
We must now investigate whether, account being taken of the various effects,the imposition of a tariff is beneficial or not. The traditional theory proposed toshow that a tariff involves a cost for society (economic cost of the tariff or cost ofprotection, as it is also called).
The basis for this demonstration is the concept of consumers’ surplus,2 whichcan be measured as the area under the demand curve included between the line ofthe price, the price axis and the demand curve itself. For example, in Fig. 10.1a,consumers’ surplus is measured—when the price is p and the quantity q4—by thearea of triangle NHR.
Now, with the increase in price from p to p.1 C d1/, consumers’ surplusdecreases by NHH1M . This is a cost; to compute the net cost, if any, we mustcalculate the benefits. These are the tariff revenue accruing to the government,F1F
01H 0
1H1, and the increase in producers’ surplus3 MNFF1. It is important to stressthat, in order to be able to net out benefits from costs (both are expressed in money,and so are dimensionally comparable) we must assume that each dollar of gain orloss has the same importance independently of who is gaining or losing. Withoutthis assumption, in fact, it would not be possible to compare the consumers’ losswith the producers’ and the government’s gain.4
Given this assumption, it can readily be seen from the diagram that the reductionin consumers’ surplus is only partly offset by the tariff revenue and the increase
2It is as well to point out that consumers’ surplus—defined by Alfred Marshall as the excess ofthe total price that consumers would be willing to pay rather than go without the commodity, overthat which they actually pay—is a much debated concept and a source of much confusion (it hasbeen humorously renamed “confuser surplus” by Morey (1984)). The graphic measure used in thetext is only one of the measures possible and hinges on several simplifying assumptions, amongstwhich the constancy of the marginal utility of money (see, for example, Hicks, 1981). It shouldalso be stressed that consumption and consumer should be interpreted in the broad sense to meanpurchase and purchaser respectively, for whatever purpose the product is bought.3Unlike consumers’ surplus, this is a well-defined concept, as it is a synonym for the firms’profit (difference between total revenue and total cost). If we neglect the fixed cost (which hasno consequence on the variations), the total cost of any given quantity, say q1, is the area underthe marginal cost (i.e. the supply) curve from the origin to the ordinate drawn from that quantity.OVFq1/. As total revenue is ONFq1, producers’ surplus is VNF. If we consider an increase inoutput from q1 to q2, the increase in producers’ surplus is VMF1 � VNF D MNFF1.4It should be further noted that without this assumption it would not even be possible to sum thesurpluses of the single consumers to obtain the aggregate consumers’ surplus, etcetera.

10.4 The Social Costs of a Tariff 221
in producers’ surplus: we are left with the areas of the two triangles FF01F1 and
H 01HH1, which represent the social costs of the tariff.The first one, FF0
1F1, measures the production cost of protection. If the countryhad imported an additional amount q1q2 at the price p, its cost would have beenq1q2F
01F . Instead the country produces this amount domestically, with an additional
cost measured by the increase in the area below the supply curve, q1q2F1F .The difference FF0
1F1 represents the cost of the misallocation of resources causedby the tariff: in fact, if the country had used an amount of resources equal in valueto q1q2F
01F to increase the output of its export industry (not shown in the diagram),
with the consequent increase in exports it could have obtained q1q2 more of theimported commodity. When instead it increases the domestic production of thiscommodity, the country must use a greater amount of resources (equal in valueto q1q2F1F ) to obtain the same additional amount .q1q2/ of the commodity.
The second one, H 01HH1, measures the consumption cost of protection, due to
the fact that the tariff brings about an increase in the domestic price of the importedcommodity relative to the price of the other commodities and so causes a distortionin consumption.
An alternative graphical representation of the cost of protection is contained inFig. 10.1b, in which the excess demand curve—derived from the D and S curvesof Fig. 10.1a—is drawn. This curve, therefore, represents the demand for importsof the commodity by domestic consumers: for example, NN0 in Fig. 10.1b is equalto FH in Fig. 10.1a and, similarly, MM0 D F1H1. It follows by construction thatthe area MNN 0M 0 is equal to the area F1FHH1. Now, the area MNM00M 0 representsthe tariff revenue, as it is equal to the absolute unit tariff MN times the quantityimported MM0 and is therefore equal to the area F1F
01H 0
1H1. We thus can see thecost of protection as the area of the triangle M 0M 00N 0.
The results obtained above enable us to understand the reason behind thetraditional statement that free trade is better than tariff-ridden trade: if, in fact,the imposition of a tariff involves a social cost, the statement is immediately proved.This problem will be taken up again in Sect. 11.6.
According to some writers, the cost of protection is actually greater than thatfound above. Among the arguments for this opinion we can mention the adminis-trative cost and the resource displacement cost of tariffs. To impose tariffs, a countrymust maintain a special administrative structure (customs, border patrols, etc.)and so bear the relative cost. This cost will have to be deducted from the tariffrevenue, so that the net benefit for the government is less than the area F1F
01H 0
1H1.Besides, as we have seen, a tariff causes an increase in the domestic output ofthe protected commodity and so a greater use of resources which—assuming fullemployment—will have to be shifted from other sectors; this shift involves a cost(displacement of the resources).
It goes without saying that the latter cost will not be present if there isunderemployment of resources (a case, however, not contemplated by the traditionaltheory, where full employment is assumed): in such a case, on the contrary, a tariffwill have beneficial effects. These are the employment effects of the tariff: with less
222 10 Tariff and Non-tariff Barriers
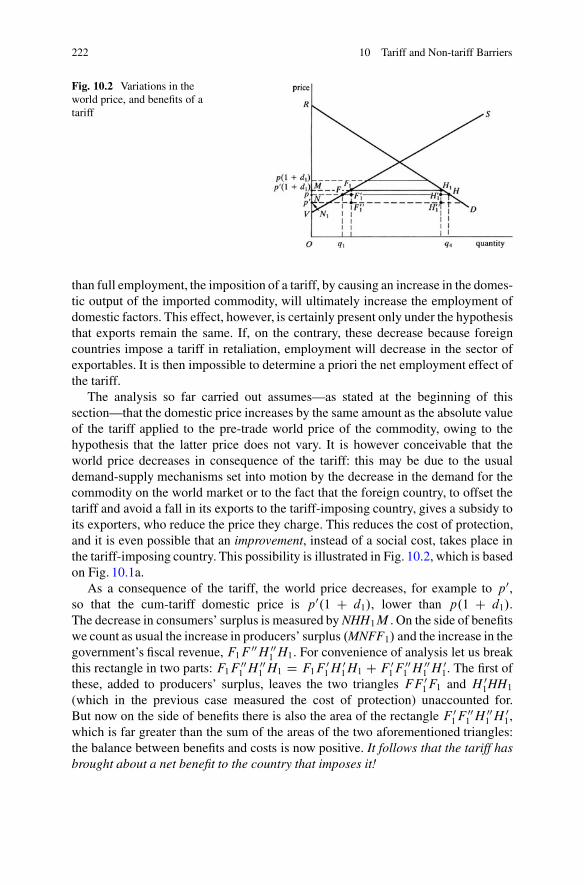
Fig. 10.2 Variations in theworld price, and benefits of atariff
than full employment, the imposition of a tariff, by causing an increase in the domes-tic output of the imported commodity, will ultimately increase the employment ofdomestic factors. This effect, however, is certainly present only under the hypothesisthat exports remain the same. If, on the contrary, these decrease because foreigncountries impose a tariff in retaliation, employment will decrease in the sector ofexportables. It is then impossible to determine a priori the net employment effect ofthe tariff.
The analysis so far carried out assumes—as stated at the beginning of thissection—that the domestic price increases by the same amount as the absolute valueof the tariff applied to the pre-trade world price of the commodity, owing to thehypothesis that the latter price does not vary. It is however conceivable that theworld price decreases in consequence of the tariff: this may be due to the usualdemand-supply mechanisms set into motion by the decrease in the demand for thecommodity on the world market or to the fact that the foreign country, to offset thetariff and avoid a fall in its exports to the tariff-imposing country, gives a subsidy toits exporters, who reduce the price they charge. This reduces the cost of protection,and it is even possible that an improvement, instead of a social cost, takes place inthe tariff-imposing country. This possibility is illustrated in Fig. 10.2, which is basedon Fig. 10.1a.
As a consequence of the tariff, the world price decreases, for example to p0,so that the cum-tariff domestic price is p0.1 C d1/, lower than p.1 C d1/.The decrease in consumers’ surplus is measured by NHH1M . On the side of benefitswe count as usual the increase in producers’ surplus .MNFF1/ and the increase in thegovernment’s fiscal revenue, F1F 00H 00
1 H1. For convenience of analysis let us breakthis rectangle in two parts: F1F
001 H 00
1 H1 D F1F01H 0
1H1 C F 01F 00
1 H 001 H 0
1. The first ofthese, added to producers’ surplus, leaves the two triangles FF 0
1F1 and H 01HH1
(which in the previous case measured the cost of protection) unaccounted for.But now on the side of benefits there is also the area of the rectangle F 0
1F 001 H 00
1 H 01,
which is far greater than the sum of the areas of the two aforementioned triangles:the balance between benefits and costs is now positive. It follows that the tariff hasbrought about a net benefit to the country that imposes it!

10.5 General Equilibrium Effects of a Tariff 223
It can be readily seen that the reason for this benefit lies in the decrease in theworld price, which means that foreign exporters have eventually taken part of theburden of the tariff upon themselves. In fact, with respect to the pre-tariff situation,domestic consumers are subjected to an increase in the price of the commodityequal to MN only: the remaining part of the absolute amount of the tariff .NN1/ isindirectly paid for by foreign exporters in the form of a price decrease, so that it isas if the amount F 0
1F 001 H 00
1 H 01 had been paid out by these exporters.
If, as has just been shown, it is possible for the tariff-imposing country to improveits welfare, obviously the next question to ask is how to get the maximum possibleimprovement: this leads us to a study of the so-called optimum tariff (optimum inthe sense that it maximizes the welfare of the country which levies it). However,since this problem can be more rigorously dealt with in the context of a generalequilibrium analysis, we shall examine it later (see Sect. 11.1).
We conclude this section by pointing out that the imposition of a tariff has preciseeffects on factor rewards (Stolper-Samuelson theorem). However, these effects canbe analysed only in the context of a general equilibrium model. This will be thesubject of Sect. 10.5.
10.5 General Equilibrium Effects of a Tariff
10.5.1 The Production-Possibility Frontier and Tariffs
To examine the general equilibrium effects of a tariff we first consider the “small”country case. The “small” country assumption implies that variations in its demandfor imports and supply of exports have negligible effects on the world market,so that the terms of trade do not vary. This assumption will be dropped later:see Sect. 10.5.2.
For our study it is convenient to employ the diagram showing the transformationcurve and the social indifference curves explained in Chap. 3—see in particularFig. 3.14b—and taken up again in Fig. 10.3. In the initial pre-tariff situation, giventhe terms of trade .p D pB=pA/ represented by the absolute value of the slopeof the straight-line segment RR, tan ˛, the country’s production and consumptionpoints are E and EC respectively; imports (of A) are ECAEA and exports (of B) areECBEB .
When the country levies a tariff on commodity A, the domestic relative pricepB=pA is no longer equal to the terms of trade, but lower, equal say to tan ˇ
(slope of PhPh). Since domestic producers respond to the domestic relative price,the production point shifts from E to H . International exchange, of course, takesplace at the given terms of trade (in this context they are assumed to be the same),and so the country can trade by moving from H (where it produces) along thestraight line R0R0, parallel to RR, but, it should be noted, the country will not end upat the consumption point HC (determined by the tangency of an indifference curve,I 00, to R0R0), because consumers will also respond to the domestic relative price and
224 10 Tariff and Non-tariff Barriers
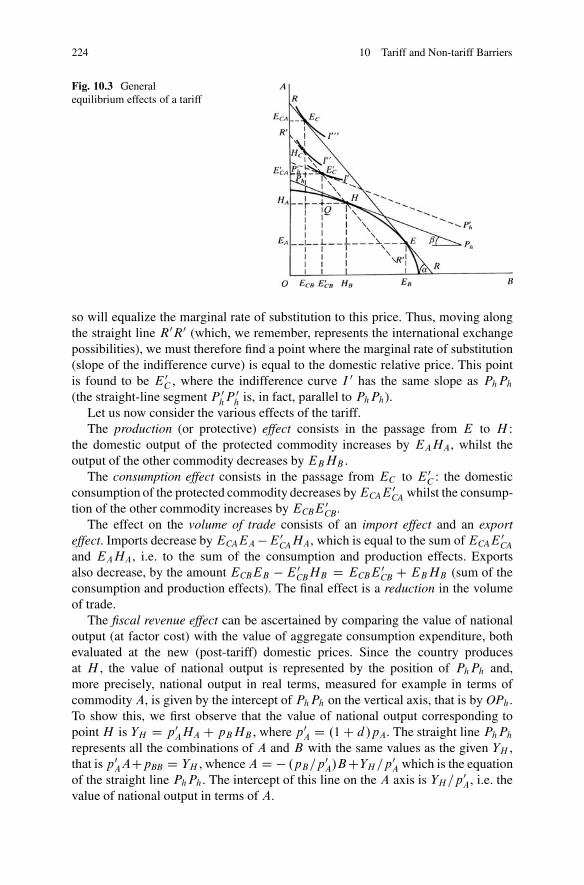
Fig. 10.3 Generalequilibrium effects of a tariff
so will equalize the marginal rate of substitution to this price. Thus, moving alongthe straight line R0R0 (which, we remember, represents the international exchangepossibilities), we must therefore find a point where the marginal rate of substitution(slope of the indifference curve) is equal to the domestic relative price. This pointis found to be E 0
C , where the indifference curve I 0 has the same slope as PhPh
(the straight-line segment P 0hP 0
h is, in fact, parallel to PhPh).Let us now consider the various effects of the tariff.The production (or protective) effect consists in the passage from E to H :
the domestic output of the protected commodity increases by EAHA, whilst theoutput of the other commodity decreases by EBHB .
The consumption effect consists in the passage from EC to E 0C : the domestic
consumption of the protected commodity decreases by ECAE 0CA whilst the consump-
tion of the other commodity increases by ECBE 0CB.
The effect on the volume of trade consists of an import effect and an exporteffect. Imports decrease by ECAEA � E 0
CAHA, which is equal to the sum of ECAE 0CA
and EAHA, i.e. to the sum of the consumption and production effects. Exportsalso decrease, by the amount ECBEB � E 0
CBHB D ECBE 0CB C EBHB (sum of the
consumption and production effects). The final effect is a reduction in the volumeof trade.
The fiscal revenue effect can be ascertained by comparing the value of nationaloutput (at factor cost) with the value of aggregate consumption expenditure, bothevaluated at the new (post-tariff) domestic prices. Since the country producesat H , the value of national output is represented by the position of PhPh and,more precisely, national output in real terms, measured for example in terms ofcommodity A, is given by the intercept of PhPh on the vertical axis, that is by OPh.To show this, we first observe that the value of national output corresponding topoint H is YH D p0
AHA C pBHB , where p0A D .1 C d/pA. The straight line PhPh
represents all the combinations of A and B with the same values as the given YH ,that is p0
AACpBB D YH , whence A D � .pB=p0A/BCYH =p0
A which is the equationof the straight line PhPh. The intercept of this line on the A axis is YH =p0
A, i.e. thevalue of national output in terms of A.

10.5 General Equilibrium Effects of a Tariff 225
Similar reasoning can be made for aggregate consumption expenditure: the valueof aggregate consumption expenditure is represented by the position of P 0
hP 0h and,
measured in terms of A, by the intercept OP0h. The difference between the value of
aggregate consumption expenditure and the value of national output is exactly thetariff revenue, because, in the presence of a tariff, aggregate expenditure exceedsnational output by an amount exactly equal to consumers’ outlay by way of thetariff.5 In fact, if we consider the value of aggregate expenditure D (remember thatthe tariff is ad valorem and applied to commodity A) and the value of national outputY and subtract the latter from the former we get
D D .1 C d/ pADA C pBDB;
Y D .1 C d/ pASA C pBSB;
D � Y D ŒpA .DA � SA/ C pB .DB � SB/� C dpA .DA � SA/ ;
(10.1)
where D (with subscript) and S denote the quantities demanded (consumed) anddomestically supplied (produced) respectively, and the subscripts A and B referto the commodities. Now, the expression in square brackets is the trade balanceevaluated at international prices, which is always zero as shown in Sect. 3.3. Thiscan be checked in the diagram by considering the triangle E 0
C QH; where E 0C Q D
QH � tan Q OHE0C ; and noting that: imports D E 0
C Q D .DA � SA/ ; exportsD QH D.SB �DB/; international price ratio pB=pA D tan ˛ D slope of R0R0 D tan QHE0
C :
Hence
D � Y D dpA .DA � SA/ ; (10.2)
which is the total tariff revenue.
10.5.1.1 The Redistributive and Welfare Effects of a Tariff
A tariff also affects income distribution to the factors of production. The impositionof a tariff favours (in the sense that it raises the unit real reward of) the factor usedintensively in the production of the imported commodity. In fact, a tariff raises thedomestic price of the imported commodity, and hence we can immediately applythe Stolper-Samuelson theorem (see Stolper and Samuelson, 1941, and Sect. 5.3).
It should however be pointed out that, in the anomalous (but theoreticallypossible) cases in which the imposition of a tariff leads to a decrease, instead of anincrease, in the domestic price of the imported commodity, then the domestic outputof this commodity will decrease and the factor which it uses relatively intensivelywill suffer a loss (the so-called Metzler case): in fact, with the same reasoning
5This is true independently of the use that the government will make of the tariff revenue:for example it may use it for public expenditure or redistribute it to consumers in various ways.

226 10 Tariff and Non-tariff Barriers
followed in the Stolper-Samuelson theorem, if pB=pA decreases, pL=pK decreasesas well, and so on.
Metzler’s case will be taken up again in Sect. 10.5.2.1; here we observe that allpossible cases (including the anomalous ones) are accounted for by a more generalformulation of the Stolper-Samuelson theorem, i.e. that the imposition of a tariffraises the unit real reward of the factor used intensively in the sector producingthe commodity whose relative price increases, which can be either the importablecommodity (in the normal case) or the other one (in Metzler’s case).
We shall now examine the effects of a tariff on the welfare of the country thatimposes it. In our framework the imposition of a tariff has a social cost: it can in factbe seen from Fig. 10.3 that the new consumption point E 0
C lies on an indifferencecurve (I 0) lower than I 000 where EC was found. An alternative way of showing thecost of protection without having recourse to social indifference curves is to observethat the value of real national output (in terms of A) was OR in the initial free tradesituation whilst after the tariff it is OPh < OR (even if we added, on the side ofbenefits, the tariff revenue, we would reach OP0
h, still lower than OR). Note alsothat the value of real national output at world prices is lower, for OR0 < OR. Thedecrease in the value of real national output gives a quantitative measure of thesocial cost of protection.
10.5.2 Tariffs and Reciprocal Demand Curves
In this section we shall examine the effects of the imposition of a tariff when theassumption of constant terms of trade is dropped. For this purpose it is convenientto use the graphic apparatus of the reciprocal demand (or offer) curves explained inSect. 3.4.
In Fig. 10.4 we have drawn the offer curves of the two countries, assumed tohave a normal shape. Let us now assume that country 2 (importer, by assumption,of commodity B) imposes a tariff: the consequence—leaving aside the effects ofthe disposal of the tariff revenue by the government—is a downward shift of thiscountry’s offer curve from OG2 to OG0
2.In fact, since (by the definition of offer curve) country 2’s economic agents are
willing, when trade is free, to give up a global amount OEA of A in exchange forOEB of B , the consequence of the introduction of a tariff is that the quantity of A
that they are now willing to supply as exports in exchange for the same quantityof imports is equal to the difference between the quantity of this commodity thatthey are willing to give up globally and the amount that they have to pay out tothe government by way of duty,6 for example, EAE 00
A D ES: this difference isOE00
A D SEB .
6This implicitly assumes that the duty is paid out in terms of commodity A (the numeraire).The results would not change if it were paid out in terms of B .

10.5 General Equilibrium Effects of a Tariff 227
Fig. 10.4 Tariffs and termsof trade
In other words, country 2’s agents will now be willing to export OE00A of A in
exchange for OEB of B (imports) as they must pay out the amount EAE 00A D ES to
the government by way of duty. In the diagram we have assumed a tariff rate of 25 %,so that ES is 25 % of SEB and 20 % of EEB . In fact, letting ES D 0:25SEB , we haveSEB D 4ES. Since ES C SEB D EEB , by substituting we get ES C 4ES D EEB ,whence ES D 0:20EEB .
Since the above reasoning can be applied to any other point of the offercurve OG2, we conclude that this curve will shift downwards by the same percentage(in our example by 20 %) to position OG0
2.An alternative way of looking at this shift is to observe that, at the same world
prices (terms of trade), the domestic price of imports increases as a consequence ofthe tariff and this—as we saw in Sect. 10.5.1—reduces both the demand forimportsand the supply of exports. Therefore, when the value of the terms of trade is, say,the slope of ray OE, the demand for imports by country 2 will no longer be OEB
but smaller, for example OHB , and the supply of exports will no longer be OEA butlower (OHA). The cum-tariff (or tariff-distorted) offer curve of country 2 must, then,pass through point H . If we repeat this reasoning for all possible terms for trade,we see that the offer curve of country 2 shifts downwards as a consequence of theimposition of a tariff by that country.
The new equilibrium point will be found at the intersection of the OG1 and OG02
curves. It is E 0, where the quantities traded are lower and the terms of trade haveshifted in favour of country 2, as can be seen from the fact that ray OE0 has a lesssteep slope than ray OE: in other words, country 2 now gives a smaller amount ofcommodity A (exports) per unit of B (imports).
To see how the tariff influences country 2’s economy we must consider thedomestic rather than the world price ratio. To determine the former we must addthe absolute value of the unit tariff to the latter. With reference to point E 0 the totalamount of the tariff is E1E
0 as explained above; it follows that consumers’ outlay to

228 10 Tariff and Non-tariff Barriers
obtain OE0B of imports is OE0
1 D E 0BE1 and not OE0
A. Thus the domestic exchangeratio (relative price) will be E 0
BE1=OE0B , equal to the slope of ray OE1.
The domestic relative price has increased, but by a smaller amount than wouldresult from the application of the tariff to the pre-tariff terms of trade: in fact,the terms of trade have decreased as a consequence of the tariff. The percentage rateof increase of the cum-tariff domestic relative price with respect to the pre-tariffterms of trade can be computed by taking the ratio E1E
001 =E 0
BE 001 , clearly smaller
than the tariff rate E1E0=E 0
BE 0.The increase in the domestic relative price pB=pA will make industry B
more profitable, so that resources will shift from industry A to industry B and,consequently, the real unit reward of the factor used relatively intensively in industryB will increase (the Stolper-Samuelson theorem).
To sum up, if the offer curves have a normal shape and if we ignore the manner inwhich the government disposes of the tariff revenue (this will be examined below;see also Sect. 24.1), then:
(a) The imposition of a tariff causes a decrease in the international relative price ofthe commodity imported, that is, an improvement in the terms of trade of thecountry that imposes it;
(b) The domestic relative price of imports increases with respect to their after-tariffworld relative price;
(c) The improvement in the terms of trade is not such as to offset the tariff, so thatthe domestic relative price of imports increases with respect to their pre-tariffworld relative price, though by a percentage smaller than the tariff rate;
(d) The protected sector becomes more profitable with respect to the sectorproducing exportables;
(e) Resources will shift towards the protected sector;(f) The Stolper-Samuelson theorem holds.
This list does not include the effects of a tariff on social welfare: that we can examineby using social indifference curves; before that (see Sect. 11.1), however, we mustcomplete the foregoing analysis by examining two anomalous cases: Metzler’s case(already mentioned in Sect. 10.5.1) and Lerner’s case.
10.5.2.1 The Metzler and Lerner Cases
The Metzler case (Metzler, 1949)7 occurs when the tariff-imposing country’s offercurve is normal, whilst that of the other country is anomalous, having a negative(instead of positive) slope in the relevant stretch (as depicted in Fig. 10.5). Thismeans that country 1 is willing to give up decreasing (instead of increasing) amountsof exports in exchange for increasing amounts of imports. It is an anomalous but notimpossible case: see Sect. 19.3.1.
7Actually, this case is implicitly contained in Lerner (1936).
10.5 General Equilibrium Effects of a Tariff 229
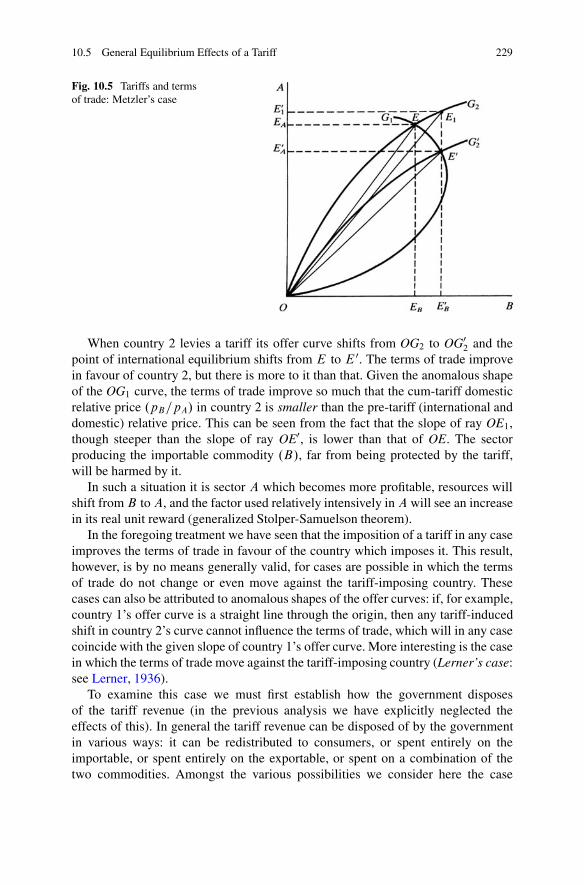
Fig. 10.5 Tariffs and termsof trade: Metzler’s case
When country 2 levies a tariff its offer curve shifts from OG2 to OG02 and the
point of international equilibrium shifts from E to E 0. The terms of trade improvein favour of country 2, but there is more to it than that. Given the anomalous shapeof the OG1 curve, the terms of trade improve so much that the cum-tariff domesticrelative price .pB=pA/ in country 2 is smaller than the pre-tariff (international anddomestic) relative price. This can be seen from the fact that the slope of ray OE1,though steeper than the slope of ray OE0, is lower than that of OE. The sectorproducing the importable commodity .B/, far from being protected by the tariff,will be harmed by it.
In such a situation it is sector A which becomes more profitable, resources willshift from B to A, and the factor used relatively intensively in A will see an increasein its real unit reward (generalized Stolper-Samuelson theorem).
In the foregoing treatment we have seen that the imposition of a tariff in any caseimproves the terms of trade in favour of the country which imposes it. This result,however, is by no means generally valid, for cases are possible in which the termsof trade do not change or even move against the tariff-imposing country. Thesecases can also be attributed to anomalous shapes of the offer curves: if, for example,country 1’s offer curve is a straight line through the origin, then any tariff-inducedshift in country 2’s curve cannot influence the terms of trade, which will in any casecoincide with the given slope of country 1’s offer curve. More interesting is the casein which the terms of trade move against the tariff-imposing country (Lerner’s case:see Lerner, 1936).
To examine this case we must first establish how the government disposesof the tariff revenue (in the previous analysis we have explicitly neglected theeffects of this). In general the tariff revenue can be disposed of by the governmentin various ways: it can be redistributed to consumers, or spent entirely on theimportable, or spent entirely on the exportable, or spent on a combination of thetwo commodities. Amongst the various possibilities we consider here the case

230 10 Tariff and Non-tariff Barriers
Fig. 10.6 Tariffs and termsof trade: Lerner’s case
in which this revenue is spent entirely on imports (the reader interested in thetaxonomy of the effects of all possible cases can consult Lerner (1936), Metzler(1949), and Chacholiades (1978, chap. 18); see also Sect. 24.1).
It can be seen intuitively that, if the domestic demand for this commodity is rigid(so that price changes affect it very little or not at all), the additional demand onthe international market for the importable will cause an increase in the world priceof this commodity, that is a worsening of the terms of trade of the tariff-imposingcountry.
This is shown in Fig. 10.6, where the offer curve of country 2 is anomalous (thisshape is a possible occurrence, as was shown in Sect. 19.3.1), and the initial inter-national equilibrium (point E) lies in its downwards sloping part. The imposition ofa tariff causes OG2 to shift to OG0
2. Observe that, unlike in the previous diagrams,OG0
2 cuts OG2 at a point to the left of E so as to lie to the right of OG2 itselfalong the ray whose slope represents the pre-tariff terms of trade (ray OEP). Thisfollows from the two assumptions made above (rigidity of the domestic demand forthe importable and expenditure of the whole tariff revenue on the importable itself),which imply that at the given pre-tariff terms of trade there is a world excess demandfor commodity B , so that point P must lie to the right of E along the terms-of-traderay. Only in this case, in fact, at the given terms of trade, is the demand forcommodity B by country 2 greater than the supply of the same commodity bycountry 1, as OPB > OEB . After these preliminaries, it can immediately be seenthat at the new international equilibrium point E 0 the world relative price pB=pA
obtaining after the tariff, has increased (slope of OE0 > slope of OE): the cum-tariffterms of trade have moved against (the tariff-imposing) country 2.
10.6 Quotas and Other Non-tariff Barriers
From the theoretical point of view there are numerous impediments to free tradeother than tariffs; as stated in Sect. 10.1, these impediments are taking on an everincreasing practical importance, so that they deserve something more than a cursorymention. Some of these impediments have a consolidated theory and practice behind

10.6 Quotas and Other Non-tariff Barriers 231
Fig. 10.7 Effects of a quota
them, but new types, not previously envisaged, are being introduced in practice,so that an exhaustive list would contain dozens. Therefore we shall concentrateon the main traditional types (quotas, export duties, etc.) and give a necessarilybrief treatment of some of the others, referring the reader to Baldwin (1971).The relevance of the “new” protectionism, based on non-tariff barriers, will beassessed in Chap. 12.
10.6.1 Quotas
An (import) quota is a quantitative restriction (so many cars of a certain type perunit of time) imposed by the government on the imports of a certain commodity and,therefore, belongs to the category of direct controls on international trade. For thispurpose the government usually issues import licences (which it can distribute toimporters according to various criteria) but other forms are possible.
The effects of a quota8 can be analysed by means of a diagram similar to thatused in Sect. 10.3 (see Fig. 10.1) to analyse the effects of a tariff. In Fig. 10.7, p is theworld price of the commodity, of which a quantity q1q4 is imported under free trade.The government now decides that imports have to be reduced, for example fromq1q4 to q2q3 and, accordingly, decrees a quota. The domestic price of the commoditywill rise to p0, since the (unsatisfied) excess demand by domestic consumers willdrive it up from p to the level at which the actual excess demand is exactly equal tothe given quota, F1H1 D q2q3.
The effects of a quota on domestic price, output, consumption, and on imports,are the same as those which would occur if a tariff were imposed such as tocause an increase in the domestic price from p to p0: this can be readily seen bycomparing Fig. 10.7 with Fig. 10.1. The equivalent tariff rate can be computed from
8For brevity’s sake we shall examine the effects of a quota exclusively in a partial equilibriumcontext and under the assumption that the world price does not change.

232 10 Tariff and Non-tariff Barriers
the equation p0 D .1 C d1/p. Some authors (for instance Corden, 1971a, p. 213)call this the implicit tariff rate. However, since this term is also used in the sense ofeffective rate of protection (see below, Sect. 10.7), to avoid confusion we do not useit here.
There is, however, a difference between a quota and an equivalent tariff: whilst inthe case of a tariff the government collects a fiscal revenue (F1F
01H 0
1H1 in Fig. 10.1),it now collects nothing and the quota gives rise to a gain of equal size (F1F
01H 0
1H1
in Fig. 10.7) accruing to the quota holders (this is true under assumption that thecountry is small and that there is perfect competition among the foreign exporters.In the opposite case, these could avail themselves of the occasion of the quota toraise the price charged to domestic importers, thus depriving them of part of thegain under consideration). Now, why should the government deprive itself of a fiscalrevenue if the same quantitative restriction and the same effects of a quota can beobtained by a tariff?
Let us first observe that, in principle, the government could sell the importlicences by auction9: with a perfect auction in a perfectly competitive market,the revenue of the auction would be exactly the same as that of the equivalent tariff.This is so because competition between importers to get hold of the licences willinduce them to make higher and higher bids until extra profits (which are equalto F1F
01H 0
1H1) disappear in favour of the government. But this is a theoreticalpossibility difficult to realize in practice.
The answer to the above question can be found in the fact that only a quota givesthe certainty of the desired quantitative restriction on imports, which is lacking inthe case of a tariff for various theoretical and practical reasons, among which (for acomplete treatment see Takacs, 1978):
1. The equivalence of the effects on imports depends on the existence of perfectlycompetitive conditions at home and abroad: in the opposite case, in fact,the effects of a tariff and of a quota can be very different. For example, if foreignexporters do not operate under perfect competition, they may reduce the price inorder not to lose market shares when the home country imposes a tariff, so thatthe increase in the domestic price will be smaller than that required to achievethe desired reduction in imports.
2. A quota, unlike a tariff, can have important effects on the market structure of thecountry which imposes it, for it can convert a potential into an actual monopoly,that is, enable the domestic industry, fully protected from foreign competition bythe quota, to establish a monopoly. In fact, let us assume that in the country thereis a potentially monopolistic industry. In the presence of a tariff, this industrycannot raise the price above the world price plus tariff, for its sales would dropto zero (domestic consumers will buy solely imported goods if the domestic
9The auction is only one method of issuing licences to importers. Another is the first-come,first-served basis, still another is the subdivision of the licences among importers in proportionto the quantities imported by each before the introduction of the quota. But it is clear that only bya perfect auction the government’s revenue will be the same as that of an equivalent tariff.

10.6 Quotas and Other Non-tariff Barriers 233
importable has a price higher than the world price plus tariff). If instead of thetariff the country decrees a quota, the potential monopoly can become an actualone, because the domestic industry can now raise the price without danger of itssales dropping to zero, as imports cannot exceed the quota.
3. The computation of the tariff (d1 in our example) which brings about exactlythe desired reduction in imports can be made only if the curves D and S areknown exactly and do not shift unpredictably. Notwithstanding the advancesin econometrics, these curves can be determined only within a (usually large)confidence interval. Furthermore, the possibility of (large though predictable)shifts in these curves (because the underlying exogenous factors change in aknown way) compels the government to compute, levy and enforce changingtariff rates.
10.6.2 Export Duties
In addition to taxing imports, it is also possible to tax exports (customs duties onexports). For brevity’s sake we limit the analysis to the partial equilibrium contextand assume that the export duty has no consequence at all on the world price of thecommodity.
In Fig. 10.8 the usual partial equilibrium demand and supply curves are drawn.As we are dealing with an exportable commodity, we must consider the part ofthe diagram above the autarky equilibrium point, where excess supply is present.Let us assume that the initial free trade price is OM: the supply of exports (domesticexcess supply of the commodity) is FH D q1q4. The levying of an export duty,say MN, causes a decrease in the domestic price from OM to ON. Domesticproducers, in fact, by selling the commodity abroad at the given world price OM,eventually receive only ON per unit of the commodity, as they must pay out MN tothe government by way of duty. Therefore the price on which domestic firms basetheir output calculations is ON. From the dynamic point of view the impositionof an export duty induces domestic firms to shift their supply from the foreign tothe domestic market, where in the moments immediately after the levying of theduty, the price is the same as before. But this greater supply on the domestic marketcauses a decrease in the domestic price; the decrease will continue until the price hasfallen to ON. When the domestic price is ON, the domestic supply is lower whilstdemand is higher with respect to OM: the result is a contraction of exports from FHto F1H1 D q2q3.
Since the domestic price is lower, domestic consumers will benefit, whilstdomestic producers will lose. Benefits and costs can be calculated by using theconcepts explained in Sect. 10.3 in the case of an import duty.
Consumers’ surplus here increases by the area MNF1F and producers’ surplusdecreases by the area MNH1H ; the government collects a fiscal revenue (by way ofexport duty) measured by the area F 0
1F1H1H 01. Therefore the area of the triangles
FF1F01 and H 0
1H1H remains unaccounted for, and represents the social cost of the

234 10 Tariff and Non-tariff Barriers
Fig. 10.8 Effects of anexport duty
duty. A further symmetry can be found in the relation between the pre-duty andpost-duty relative price at home and abroad.
Let pm; px denote the domestic price of importables and exportables,and pmw; pxw the respective world prices. In the absence of duties, pm D pmw;
px D pxw. Suppose now that an import duty is imposed at the rate d : the domesticprice of importables becomes pm D .1 C d/pmw whilst the domestic price ofexportables remains equal to the world price; therefore the domestic relativeprice becomes px=pm D pxw=.1 C d/pmw. In the case of an export duty at thesame rate d , the relation between the domestic and world price of exportables ispxw D .1 C d/px, whilst the domestic price of importables remains equal to theworld price; the domestic relative price becomes px=pm D Œpxw=.1 C d/�=pmw,which is algebraically equal to that found in the case of an import duty.
The analogy of the results concerning the social cost of an import and an exportduty induced some authors (for example Lerner, 1936) to talk of a “symmetry”between these two types of duty.
The analysis has so far been based on the assumption that the country underconsideration has no monopolistic power (in a broad sense) on the internationalmarket. In the opposite case it would be possible to use the export duty to exploitthis power to the national advantage, as part of the duty would be charged to the restof the world by way of an increase in the world price. It is important to note that themonopolistic power can be increased by an agreement among exporting countrieswhich form an international cartel. This is the subject of Sect. 10.6.3.
10.6.3 International Cartels
An international cartel (Caves, 1979) consists of a group of producers of a certaincommodity located in various countries who agree to restrict competition amongthemselves (in matters of markets, price, terms of sale etc.).

10.6 Quotas and Other Non-tariff Barriers 235
Fig. 10.9 The monopolisticcartel
We shall be mainly concerned with cartels aimed at the control of the world priceof the commodity by fixing a common price. The agreement is often at the level ofgovernments (the typical example is OPEC, for which see below), but agreementsamong private producers are also possible (examples are the agreement among themain international firms trading in tobacco in the 1880s and, in the same period,the cartel concerning the level of railway fares).
If the cartel includes the total number of producers, a full monopoly comes intobeing, to which the well-known principles of monopoly theory can be applied.In such a situation, given the world demand curve for the cartelized commodity,the price which maximizes the cartel’s profits is obtained by reading off the demandcurve the price corresponding to the quantity determined by the intersection of themarginal cost curve MC and the marginal revenue curve MR. In Fig. 10.9, the priceis pE and the quantity sold qE (in a competitive market, on the contrary, in theshort run, price and quantity would be determined in correspondence to point L);given the average total cost curve ATC, the profit will be H 0
1H1HpE . We also recallfrom microeconomic theory that the monopolist’s markup, namely the proportionalexcess of price over marginal cost, is given by the reciprocal of the price elasticityof demand (�w):
pE � MC
pE
D 1
�w; (10.3)
so that the more rigid the world demand, the higher the cartel’s markup. So farwe have implicitly assumed that the cartel behaves as a single entity, but evenin this case the problem arises of apportioning the production of the commodityamong the members. In an ideal cartel the various members can be considered asthe various plants of a single monopolist, so that we can apply the theory of themultiple-plant monopolist. This tells us that the optimum allocation is that in whichthe marginal cost in each plant is the same and equal to the marginal revenue ofoutput as a whole. To see this, assume that MC of member i is greater than that ofmember j . It is then possible to decrease the cartel’s total cost of producing the sametotal output by marginally decreasing member i ’s output and marginally increasing

236 10 Tariff and Non-tariff Barriers
Fig. 10.10 Aquasi-monopolistic cartel
(by the same amount) member j ’s output: in fact, the decrease in total cost (MCi )is greater than the increase (MCj ). This process continues up to the point whereMCi D MCj . Once the marginal cost has been equalized everywhere for any givenoutput, thus determining the minimum total cost of the cartel, the maximum profitwill be as usual determined by equating marginal revenue of output as a whole tothe (common) marginal cost of the various producers.
This ideal allocation is not, however, easily realized in practice. In the real worldthe production is apportioned on the basis of negotiations among the members of thecartel, each of whom has its own interests and different contractual force. The moreinfluential and skilful negotiators will probably get a greater quota than the optimumcorresponding to the application of the principle of equalization of marginal costs,even if this will raise the cartel’s total cost of production.
We must now consider the more realistic case in which the cartel does not includeall but only part of the producers, so that besides the cartel, also independent(i.e., not belonging to the cartel) competitive producers are present in the worldmarket for the commodity. These latter will have to accept the price fixed by thecartel, but the cartel will have to take their supply into account when fixing the price.The market form obtaining here is quasi-monopoly (see Henderson and Quandt,1980). In Fig. 10.10, in addition to the world demand curve D, we have drawn theaggregate supply curve S of the independent producers. If we subtract, for any givenprice, S from D laterally, we obtain D0, which is the demand curve for the cartel’soutput. For example, at price ON, the supply of the independent producers is NN 0:if we subtract MM0 (equal, by construction, to NN 0) from world demand NM0, weobtain segment NM, that is the quantity that the cartel can sell at price ON.
Once the D0 curve has been derived, the cartel can behave along it as amonopolist and will maximize profits by the usual rule, that is, by equating marginalcost to marginal revenue (the latter will, of course, be that concerning curve D0).The cartel, therefore, will fix the price at OpE and sell a quantity pEH D OqE ,whilst the independent producers will sell a quantity HH0 D q0
Eq:
One can easily check, by drawing the marginal revenue curve concerning curveD (which we leave as an exercise for the reader), that the price is lower and thequantity sold greater than in the case of a monopolistic cartel. It is also possible to
10.6 Quotas and Other Non-tariff Barriers 237
check graphically that the greater the elasticity of the supply curve of independentproducers S , the smaller the cartel’s markup. More precisely, as shown in Sect. 24.2,the (price) elasticity of the D0 curve (denoted by �c) depends on the elasticity of theD curve (�w), the elasticity of the S curve (�s), and on the cartel’s share in the totalconsumption of the commodity (k), according to the formula
�c D �w C .1 � k/ �s
k: (10.4)
Consequently, the cartel’s markup is
1
�c
D k
�w C .1 � k/ �s
: (10.5)
From Eq. (10.5) we can readily derive the conditions for the success of a cartel,as measured by the capability of imposing a substantial markup and so reaping highmonopolistic profits. These are:
(a) A low elasticity of total world demand (a small �w);(b) A low elasticity of independent producers’ supply (a small �s);(c) A high cartel share in the world market for the commodity (a high k: for k D 1,
Eq. (10.5) reduces to (10.3)).
These are the purely economic conditions, to which a further condition must beadded, namely
(d) The members of the cartel must accept and adhere to the official decisions takenby the cartel (by means of majority voting or some other way) as regards priceand output.
Condition (d) is essential for the life itself of the cartel. If, in fact, the membersbegin to decartelize by selling greater amounts (than those allotted to each) at lowerprices, the cartel will soon break up. But why should there be any incentive to behavein this manner? The answer is that, though the profits of the cartel as a whole aremaximized by respecting the official decisions, the single member can obtain vastlygreater profits by slightly lowering the price below the official one, provided thatthe other members adhere to the official price. In fact, buyers will be willing tobuy all the quantity demanded—previously bought from the cartel—from the singleproducer who charges a slightly lower price, so that the demand curve facing thissingle producer is in practice almost perfectly elastic. This producer will thereforerealize increasing profits by increasing output, because his selling price is greaterthan his marginal cost,10 and he can sell increasing amounts without further reducing
10We must remember that in the initial situation the official price fixed by the cartel is higherthan the marginal cost (this is true in both the monopolistic and quasi-monopolistic cartel). Fromthe point of view of the cartel as a whole, it is not profitable to reduce the price (this, in fact,would lead to lower profits), whilst the single member can—for the motives explained in the

238 10 Tariff and Non-tariff Barriers
the price. He will therefore profit from increasing output up to the point where hismarginal cost has increased to the level of the selling price charged by him.
Naturally, greater profits for the single producer who does not adhere to theofficial price mean lower profits for the other cartel-abiding members, but the singleproducer, especially if relatively small, can always hope that the other members willnot become aware of his infringement or will not react. If, for example, his share inthe cartel’s output is 1 %, he may think that a 50 % increase in his output (this meansthat his share goes up to 1.5 %) will cause so small a loss (spread out through allthe other members) as to be negligible. This is undoubtedly true, but if the sameidea occurs to a sufficient number of members and is put into practice by them,the cartel dissolves. Therefore the cartel, to persist, must be able to put pressure(of an economic or political or some other nature) on the single members to makethem adhere to the official decisions.
But unfaithful members are not the only cause of the dissolution of a cartel.There are at least three other motives leading to a progressive erosion of the markup(and so of the profits) of the cartel. They can be analysed with reference to formula(10.5) and are:
1. The increase in �w: Even if world demand is sufficiently rigid when the cartelis set up, the very success of the cartel, paradoxically, helps to make thisdemand more elastic. As a consequence of the (usually very large) price increase,buyers will put their every effort into the search for substitutes for the cartelizedcommodity (it suffices to mention the search for energy sources alternative tooil and the research into energy-saving production processes and commoditiesthat were set into motion as a consequence of the Organization of PetroleumExporting Countries—OPEC—cartel) and so �w increases.
2. The increase in �s: Even if independent producers’ supply is rigid when thecartel is set up, the success itself of the cartel, again, helps to make thissupply more elastic, since these producers will multiply their efforts to increaseoutput. If the cartel concerns an agricultural commodity, such as sugar or coffee,the price increase will induce independent producers to shift increasing amountsof resources (land, labour, capital) to the production of the cartelized commodity.If an exhaustible natural resource is concerned, such as oil or copper, independentproducers will multiply their efforts to find new fields. Similar efforts willalso come from countries previously not exploiting the resource, these efforts,if successful, will increase not only the output but also the number of independentproducers (think of the oil fields found by England under the North-Sea). All thiscauses an increase in �s .
3. The decrease in k. In order to increase the price without building up excessiveinventories of the commodity, the cartel must restrict output and sales relative tothe pre-cartel situation. This, coupled with the efforts of independent producers(point 2), leads to a decrease in k.
text—obtain higher profits by slightly lowering his selling price below the official one; this lowerprice is nevertheless higher than his marginal cost.

10.6 Quotas and Other Non-tariff Barriers 239
These three forces jointly operate to erode the cartel’s monopolistic power. Also,note that as the markup is wearing away, the incentive for the single members todecartelize (see above) becomes greater and greater.
Economic theory, therefore, predicts that, in the long run, any cartel is boundto dissolve, even if new cartels are always being set up, so that at any moment acertain number of cartels is in existence. Historical experience seems to confirm thisconclusion, even in the most dramatic cases. Among these one must undoubtedlycount the cartel which gathers the main oil producing countries into OPEC.Conditions (a), (b) and (c) above certainly held in 1973: very rigid world demand foroil, low elasticity of the supply of independent producers, high share (above 50 %)in world production controlled by the cartel. Furthermore, for various politicalmotives, the degree of cohesion of the cartel was high.
The great initial success of OPEC is, therefore, not surprising. However,forces (1), (2) and (3), slowly but steadily got down to work.
The high price of oil set into motion or intensified the search for alternativeenergy sources, for productive processes less intensive in energy, for lessenergy-consuming commodities and ways of life (energy-saving cars, limits todomestic heating, better insulation of new buildings, etc.) began or was intensified.As a consequence, the share of oil in world energy consumption decreased, andenergy consumption per unit of real GDP fell in industrial countries as a whole.
Another element that reinforced the drop in demand for oil was the worlddepression which, by slowing down (and sometimes by causing a decrease in) thelevel of activity in the various industrialized countries, reduced their energy needs.The supply of independent producers steadily increased (the case of England, whichbecame a net exporter of oil, is sensational). The cartel’s share in the world marketdecreased well below 50 %.
As a consequence of all this, cases of members not adhering to the cartel’s officialdecisions were not lacking, often not because of greed, but out of sheer necessity(many OPEC countries had set up development programs based on estimates of anincreasing—or at least not decreasing—flow of oil revenues in real terms, and foundthemselves in trouble when this flow started to decrease).
Alternative explanation of OPEC’s behaviour (based on game theory or oncoalition-formation theory) also exist. See, for example, Razawi (1984) andMcMillan (1989, chap. 6).
10.6.4 Other Impediments to Free Trade
We give here a (by no means exhaustive) list of other impediments to free trade witha brief description of each. A more in-depth treatment will be given in Chap. 12.
(a) Export Subsidies. In general, they may take various covert forms besides theovert one of a direct payment by the government to the exporter (usually inproportion to the volume of exports). Examples of covert subsidies are: more

240 10 Tariff and Non-tariff Barriers
favourable credit conditions (the difference between these and the normalconditions applied to producers for the home market is paid by the government);insurance of certain risks (for example, that the foreign importer defaults) paidby the government; promotional activities (such as trade fairs, advertising, etc.)organized by public agencies. Export subsidies are usually considered legiti-mate when they are a rebate of the tariff paid by the exporting industry onimported inputs.
(b) “Voluntary” Export Restraints (VER) and Import Expansion (VIE). In the caseof a VER, the exporting country “voluntarily” curtails exports to the importingcountry. In the case of a VIE, the importing country “voluntarily” increases itsimports from the exporting country. It is, of course, a relative “voluntarity”,for it is negotiated between the importing and the exporting country as analternative to traditional measures such as tariffs or quotas.
(c) Production Subsidies. If the government subsidizes the domestic production ofa commodity, this subsidy automatically becomes an export subsidy as regardsthe exported part of the output, or a subsidy to the importables sector if thecommodity is an importable.
Box 10.2 Regulatory Protectionism
As conventional trade barriers decline, there is growing concern that countries are resortingto technical regulations to protect domestic producers (Technical Barriers to Trade-TBTs).These barriers, resulting from national regulations and standards on product safety, testing,labelling, packaging, certification, labour and environmental standards, have proliferated inrecent years. Since these regulations can be wielded for protectionist ends, their prolifera-tion has led to widespread complaints of regulatory protectionism. TBTs result from normsthat control the sale of goods in a particular market. There are two distinct aspects of thiscontrol: contents of the norm and testing procedures necessary to demonstrate that a productcomplies with the norm. Content-of-norm or, generally speaking, regulatory differencesbetween countries, can be broadly classified as horizontal or vertical. Horizontal norminvolve, for example, imposing different technologies as certain plug forms for appliances.With vertical standards a regulator insists that goods achieve at least certain minimumstandard of safety or performance (for example, that cars do not exceed certain maximumlevels of emissions). Product norms and testing procedures can distort trade when theyincrease foreign firm’s costs relative to those of domestic firms. Of course, the majorproblem with the economic assessment of TBTs is that they are potentially much morecomplicated to analyse than tariffs or quotas: the main problem with TBTs is that it isdifficult to ascertain whether a certain norm serves the citizens’ interests or protectionistinterests. The problem that different setting of regulations by EU governments might behampering trade and competition has been a major reason for the institution of the SingleMarket program, and mutual recognition agreements have been agreed between the EU andseveral other countries. A similar rationale underlies the articles on Technical Barriers toTrade and Sanitary and Phytosanitary Standards in the WTO Agreement from the UruguayRound.For example, the Technical Barriers to Trade Agreement tries to ensure that regulationsstandards and testing and certification procedures do not create unnecessary obstacles.The agreement recognizes the countries’ right to adopt the standards they considerappropriate (for human, animal or plant life or health, for the protection of the environment)

10.6 Quotas and Other Non-tariff Barriers 241
but discourages any methods that would give domestically produced goods an unfairadvantage.A separate agreement on food safety and animal and plant health standard (the Sanitaryand Phitosanitary Measures Agreement) sets out the basic rules. It allows countries to settheir own standards. But it also says that regulations must be based on science and shouldbe applied only to the extent necessary to protect human, animal or plant life or health,but should not arbitrarily or unjustifiably discriminate between countries where identical orsimilar conditions prevail.Notwithstanding these agreements there is of course considerable resistance by manycountries to conform their policies to trade treaties and to recognize each other’s rulesand procedures. Liberalization of TBTs often entails preferential arrangements betweenrich countries, creating a two-tier system of market access with developing countries in thesecond tier.
(d) Tied Aid. Developed countries often grant financial assistance to developingcountries with the constraint that the recipient spends the sum received topurchase commodities from the donor. This causes distortions, which are allthe greater when the price (and/or other conditions) in the donor country is notthe cheapest.
(e) Advance-Deposit Requirements. Importers are required to deposit funds (in thecentral bank, in a commercial bank, etc.) in an amount proportional to the valueof the imported commodities, with no interest and for a given period of time(usually prior to the receipt of the commodities). Thus importers are burdenedwith an additional cost, which depends on the percentage of the value ofimports, on the length of the period and on the rate of interest (which measures adirect cost, if the importer has to borrow the funds, or an opportunity cost, if heowns them). The advance deposit is equivalent to a tariff with a rate that canbe easily computed: if, for example, the rate of interest is 10 % per annum, theperiod of time is 3 months and the percentage of the value of imports is 80 %,then the equivalent tariff rate is 2 %. In fact, the rate of interest per quarter is2:5 % (10 % W 4), and since the importer must deposit 0:8 dollars per dollar ofimports, the additional cost is 0:8 � 2:5 % D 0:02 dollars per dollar of imports,which is equivalent to an ad valorem tariff with a 2 % rate.
(f) Government Procurement. Governments buy a large amount of goods andservices, and usually prefer to buy domestic rather than equivalent foreigngoods of the same price (in some cases they are allowed by domestic legislationto buy domestic goods even if equivalent foreign goods have a lower price,not below a certain percentage); besides, governments may have recourse toa series of techniques aimed at limiting the opportunity for foreign producersto tender for the supply of goods to the public sector. All this amounts to adiscrimination in favour of domestic producers, which restricts imports.
(g) Formalities of Customs Clearance. These are connected with the imposition oftariffs, such as the classification and evaluation of the commodities in transitat the customs and other bureaucratic formalities. A more rigid application ofthese formalities hinders trade and involves a cost for importers.
242 10 Tariff and Non-tariff Barriers
(h) Technical, Safety, Health and Other Regulations (so-called regulatoryprotectionism, see box). Countries often have different regulations, and this is initself an impediment to international trade, for producers have to bear additionalcosts to make the commodities conform to the different regulations, accordingto the country of destination. Besides, a country may use these regulations toreduce or even stop the imports of certain commodities from certain countries,for example, by checking with particular meticulousness and slowness theirconformity to the regulations, or even by issuing regulations which actuallyprevent the acceptance of certain foreign commodities (an example is the caseof the United States, which in the past sometimes drew up health regulations insuch a way that Argentinian beef could not possibly comply with them).
(i) Border Tax Adjustments. Governments usually levy an “import equalizationtax” on imported goods equal to the indirect tax levied at home on similar goodsdomestically produced and, vice versa, they give back to exporters the nationalindirect tax. This may cause distortions if the import equalization tax is higherthan the national indirect tax (the difference is a covert import duty) or if thesum returned to exporters is greater than the amount of the national indirect tax(the difference is a covert export subsidy).
(j) Embargo. The government of a country decrees that certain commodities mustnot be exported to certain countries. This is usually done for motives concerningforeign policy, for instance to prevent (actual or potential) enemy countries fromhaving access to advanced technologies or to put political pressure on them byeconomic means.
(k) State Trading. The government of a country takes all of the country’sinternational trade upon itself. This is by itself a non-tariff barrier, for thegovernment (directly or indirectly) has a monopolistic-monopsonistic power asthe one and only supplier of domestic goods to foreign markets and the oneand only buyer of foreign goods for the domestic market. If, in addition, thecountry has a planned economy, the determination itself of the commoditiesto be exported and imported, of the relative amounts, of their prices, etc.,is outside the scope of the pure theory of international trade dealt with in thisbook, but falls within the field of the theory of planning, which is not treated inthe present work.
10.7 Intermediate Goods and Effective Rate of Protection
So far, the models used consider solely tariffs on final goods, given the assumptionthat production takes place by making exclusive use of internationally immobileprimary factors (capital and labour). Actually, however, production also requiresintermediate inputs (raw materials, semi-finished goods, etc.) which can be,and normally are, internationally traded. This has led to the elaboration of theconcept of effective rate of protection (or implicit tariff), defined as the percentageincrease in the value added per unit in a specific economic activity, made possible

10.7 Intermediate Goods and Effective Rate of Protection 243
by the tariff structure (but other things—including the exchange rate—being equal)with respect to the situation without tariffs.
The basic idea is that, when intermediate goods are brought into the picture,the nominal tariff on a certain commodity (which is applied to the price of thecommodity) may be quite different from the implicit tariff or effective rate ofprotection provided for the economic activity which produces the commodity inquestion, namely for the value added (which is distributed to the primary factorsof production) in the production of the commodity. Nominal tariffs are applied tocommodities, but factors move between economic activities; thus, in order to findthe effects on resource allocation of a tariff structure, one must calculate the rateof protection given to each activity, that is the effective rate of protection. Besides,if the aim is to protect a certain sector, and since what is relevant for an industryis—ceteris paribus—its value added, the true or effective protection is that whichgives rise to an increase in value added.
Given the definition, it is intuitive that the effective rate of protection dependsnot only on the tariff on the commodity under consideration, but also on the inputsof intermediate goods and on the tariffs on these. The usual way of incorporatingintermediate goods in the analysis of tariffs is to use an input-output model, in whichthese goods are input according to fixed (given and constant) technical coefficients.It is also assumed that the world price of imports remains the same.
Here we examine the simplified case of a single intermediate good; the generalcase will be examined in Sect. 24.3. Suppose, for example, that to produce one unitof cloth 1:5 units of yarn are required, that the unit prices in the absence of tariffs are100 and 50 for cloth and yarn respectively, that both goods are importables. Giventhe assumption of constant fixed technical coefficients, we can consider the unitvalue added, which is 25, that is, the difference between 100 (value of a unit of thefinal good, cloth) and 75 (value of 1:5 units of the intermediate good, yarn). Let usnow introduce a tariff on both cloth and yarn, with rates of 40 and 20 % respectively:the domestic prices go up to 140 and 60 respectively and the cum-tariff value addedis 50 D 140 � 90. This represents a 100 % increase in the pre-tariff value addedŒ.50 � 25/=25�. Thus the tariff structure has provided an effective protection with arate of 100 % to the domestic industry producing cloth.
This numerical example can be transformed into a general formula by usingsimple algebra. Let us define the following symbols:
vj D unit value added in activity j without tariffs,v0
j D unit value added in activity j with tariffs,qij D technical coefficient in physical terms (quantity of the
intermediate good i input in one unit of the final good j ),assumed fixed and constant,
aij D share of i in the value of j at free trade prices,dj D nominal tariff rate on goods j ,di D nominal tariff rate on good i ,
pj ; pi D prices.
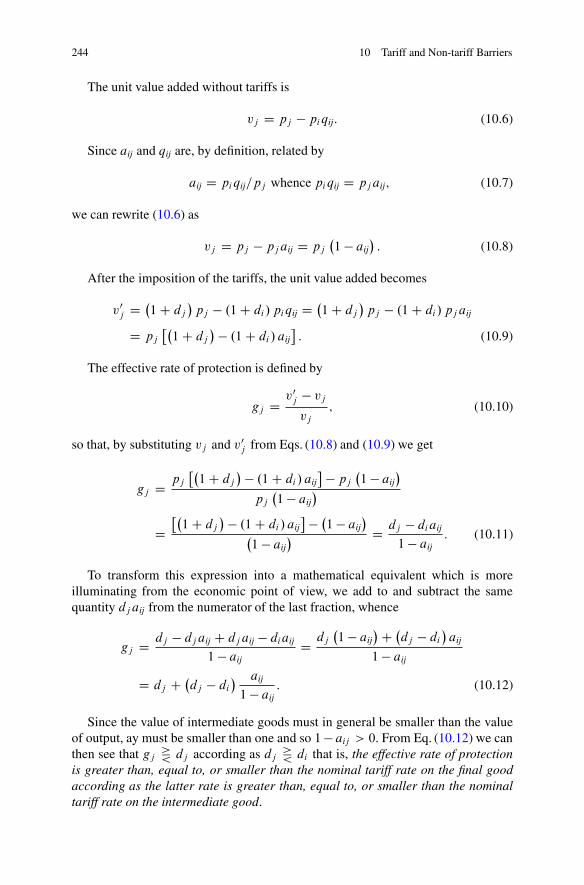
244 10 Tariff and Non-tariff Barriers
The unit value added without tariffs is
vj D pj � pi qij: (10.6)
Since aij and qij are, by definition, related by
aij D pi qij=pj whence pi qij D pj aij; (10.7)
we can rewrite (10.6) as
vj D pj � pj aij D pj
�1 � aij
�: (10.8)
After the imposition of the tariffs, the unit value added becomes
v0j D �
1 C dj
�pj � .1 C di/ pi qij D �
1 C dj
�pj � .1 C di/ pj aij
D pj
��1 C dj
� � .1 C di / aij�: (10.9)
The effective rate of protection is defined by
gj D v0j � vj
vj
; (10.10)
so that, by substituting vj and v0j from Eqs. (10.8) and (10.9) we get
gj D pj
��1 C dj
� � .1 C di / aij� � pj
�1 � aij
�
pj
�1 � aij
�
D��
1 C dj
� � .1 C di / aij� � �
1 � aij�
�1 � aij
� D dj � di aij
1 � aij: (10.11)
To transform this expression into a mathematical equivalent which is moreilluminating from the economic point of view, we add to and subtract the samequantity dj aij from the numerator of the last fraction, whence
gj D dj � dj aij C dj aij � diaij
1 � aijD dj
�1 � aij
� C �dj � di
�aij
1 � aij
D dj C �dj � di
� aij
1 � aij: (10.12)
Since the value of intermediate goods must in general be smaller than the valueof output, ay must be smaller than one and so 1 � aij > 0. From Eq. (10.12) we canthen see that gj R dj according as dj R di that is, the effective rate of protectionis greater than, equal to, or smaller than the nominal tariff rate on the final goodaccording as the latter rate is greater than, equal to, or smaller than the nominaltariff rate on the intermediate good.

10.8 Imperfect Competition and Trade Policy 245
Table 10.1 Nominal and effective rates of protection (per cent)
United States Japan Korea
SECTOR NRP ERP NRP ERP NRP ERP
Agriculture 1.80 1.91 18.40 21.40 72.3 85.7Food products 4.70 10.16 25.40 50.31 11.7 �27.6Wearing apparel 22.70 43.30 13.80 42.20 29.0 93.8Wood products 1.70 1.72 0.30 �30.59 8.6 6.5Chemicals 2.40 3.66 4.80 6.39 28.5 50.9Iron and steel 3.60 6.18 2.80 4.34 12.9 31.5Electrical machinery 4.40 6.34 4.30 6.73 26.2 44.8Transport equipment 2.50 1.94 1.50 0.03 31.9 12.4
In the numerical example, we have illustrated the case in which gj > dj . Let usnow assume that, other things being equal, the tariff rate on the intermediate goodis 50 % instead of 20 %. The new value added is 27:5 (in terms of the symbolsdefined above we have pj D 100; qij D 1:5; pi D 50; aij D 0:75; vj D 25;dj D 0:40; di D 0:50; v0
j D 27:5) and so the effective rate of protection is 10 %,Œ.27:5 � 25/=25�, smaller than the nominal tariff rate on the final good.
In the case in which the conditions are fulfilled which make the effective ratelower than the nominal rate, the effective rate may even be negative. In the lastexample, change the nominal rate on yarn to 60 %: the new value added is now140 � 120 D 20 and the effective rate of protection is negative. What happenedis that the tariff structure caused an increase in the price of the intermediate good(which, it should be remembered, represents a cost for the firm) so much greaterthan the increase in the price of the final good, that the industry producing this is ina worse situation than before the tariff was imposed.
Several empirical studies (see, for example, Yeats, 1974. More recent studiesare reported in Table 10.1) have been carried out to calculate effective rates ofprotection.11 In Table 10.1 we give the results obtained by Deardoff and Stern (1984)for the United States and Japan, and by Yoo (1993) for the Republic of Korea. Fromthis table we see that the effective tariff rate (ERP) was greater than the nominalone (NRP) in most sectors; in a few cases, however, it was smaller or even negative.Negative effective rates are not a mere theoretical curiosity.
10.8 Imperfect Competition and Trade Policy
The new explanations for international trade introduce new arguments in the olddebate on free trade versus protectionism (see Chap. 11). These new arguments,however, instead of leading the debate towards a conclusion, have complicated it
11To perform those calculations, the general formula derived in the appendix has to be used,and adjustments have to be made for the fact that prices of commodities include other taxes besidestariffs.

246 10 Tariff and Non-tariff Barriers
further. The traditional theory had a set of precise results on the preferability oftrade to autarky and, if we exclude second-best situations, on the preferability offree trade to restricted trade. The new theories, conversely, give rise to contradictoryresults: the reason is due to competing assumptions (Markusen & Venables, 1988).We shall touch on these arguments below; for extensive surveys see Baldwin (1992)and Pomfret (1989). See also Puga and Venables (1997) for a study of preferentialtrading arrangements in the context of an imperfectly competitive environment.
We now come to strategic trade policies. The adjective strategic hints to thepresence of some form of interaction between the firms involved in internationaltrade, when the action taken by any one firm may have significant effects on otherfirms. This interaction is certainly absent in perfect competition, and is certainlypresent in oligopoly, so much so that strategic trade policies and oligopolistic modelsof international trade go hand in hand. This is why the theory of strategic trade policyhas been developed in the context of the new theories of international trade, as bydefinition no strategic trade policy may arise in the context of the traditional theory.
Sometimes the meaning of strategic trade policies is extended to include the casein which the interaction arises between governments pursuing optimal (for each)trade policies rather than between the firms involved in international trade. Underthis extension strategic trade policies may also arise in the context of the traditionaltheory: the optimum tariff (see Sect. 11.1) would be a typical example.
Since the results of the theory of strategic trade policy are contradictory, it isno surprise that this literature is not a useful guide to government policy at thistime (Guerrieri & Padoan, 1996; Haberler, 1990; Markusen, Melvin, Kaempfer, &Maskus, 1995, p. 293). It is however important to examine it better to understandwhy and how these results are heavily model-dependent.
10.8.1 A Tariff Under Vertical Product Differentiation
It is possible to introduce the presence of impediments to trade in Falvey’s model(see Sect. 9.1), with interesting results. Suppose that a country, say country 1,introduces a tariff d . This means that the prices of country 2’s commodities incountry 1 will rise from p2.˛/ to
p02.˛/ D .1 C d/p2.˛/ D .1 C d/W2 C .1 C d/R2˛:
In terms of Fig. 9.1 this implies an upward shift (accompanied by an increase in theslope) of the relevant straight line (see Fig. 10.11).
Country 1 will now only import products of quality lower than ˛00. On the
other hand, country 2—for which the relevant comparison is still between p1.˛/
and p2.˛/—will continue importing solely products of quality higher than ˛0.The qualities between ˛0
0 and ˛0 will no longer be traded.Thus we see that the introduction of a tariff gives rise to a range of non-traded
qualities, and decreases intra-industry trade. This trade-reduction effect is an

10.8 Imperfect Competition and Trade Policy 247
Fig. 10.11 Trade policy withvertical differentiation
increasing function of the tariff rate. Consequently, the elimination or the reductionof the tariff (for example because a customs union is created) will certainly havea trade creation effect, since it will increase international (intra-industrial) trade bycausing an increase in the range of exported and imported qualities. This, accordingto Falvey, is consistent with the empirical evidence, for example that of the Europeancommon market.
For further study of the effects of a tariff in this model, see the Appendix,Sect. 24.4.1.
10.8.2 Monopolistic Competition and Welfare-Improving Tariff
It is on the study of the effects of a tariff (or other protective measures) on thenumber of varieties produced and on the unit cost of production that the free tradeversus protectionism debate has concentrated its attention. Protectionist measurescould indeed allow domestic firms to increase the scale of production and so bringabout a price decrease thanks to internal economies. This can be seen as a newargument in favour of the protection of the infant industry, a problem examinedin Sect. 11.2 in the context of the traditional theory. The effect on the number ofvarieties produced is not so clear. In addition, the use of protectionist measures cangive rise to retaliation, in which case the result is probably a reduction in socialwelfare even when the effect of protectionism would have been positive in theabsence of retaliation. For details see Baldwin (1992, sect.IV) and Pomfret (1992,chap. 6), and the Appendix, Sect. 24.4.2.
10.8.3 Strategic Trade Policy Under Oligopolywith Homogeneous Good
In this model (see Sect. 9.3.2), we obtain conventional results as regards the effectsof tariffs. The imposition of a tariff on imports causes a decrease in the foreign
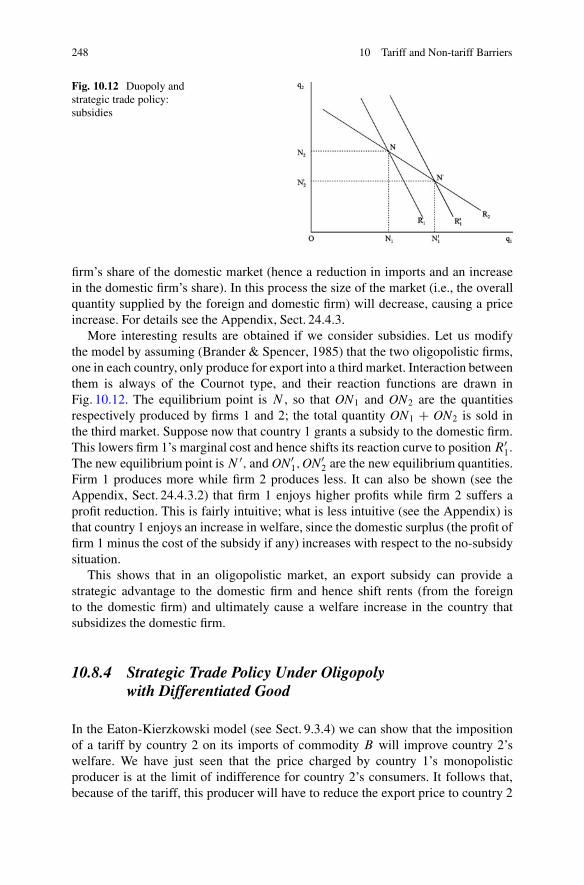
248 10 Tariff and Non-tariff Barriers
Fig. 10.12 Duopoly andstrategic trade policy:subsidies
firm’s share of the domestic market (hence a reduction in imports and an increasein the domestic firm’s share). In this process the size of the market (i.e., the overallquantity supplied by the foreign and domestic firm) will decrease, causing a priceincrease. For details see the Appendix, Sect. 24.4.3.
More interesting results are obtained if we consider subsidies. Let us modifythe model by assuming (Brander & Spencer, 1985) that the two oligopolistic firms,one in each country, only produce for export into a third market. Interaction betweenthem is always of the Cournot type, and their reaction functions are drawn inFig. 10.12. The equilibrium point is N , so that ON1 and ON2 are the quantitiesrespectively produced by firms 1 and 2; the total quantity ON1 C ON2 is sold inthe third market. Suppose now that country 1 grants a subsidy to the domestic firm.This lowers firm 1’s marginal cost and hence shifts its reaction curve to position R0
1:
The new equilibrium point is N 0; and ON 01; ON0
2 are the new equilibrium quantities.Firm 1 produces more while firm 2 produces less. It can also be shown (see theAppendix, Sect. 24.4.3.2) that firm 1 enjoys higher profits while firm 2 suffers aprofit reduction. This is fairly intuitive; what is less intuitive (see the Appendix) isthat country 1 enjoys an increase in welfare, since the domestic surplus (the profit offirm 1 minus the cost of the subsidy if any) increases with respect to the no-subsidysituation.
This shows that in an oligopolistic market, an export subsidy can provide astrategic advantage to the domestic firm and hence shift rents (from the foreignto the domestic firm) and ultimately cause a welfare increase in the country thatsubsidizes the domestic firm.
10.8.4 Strategic Trade Policy Under Oligopolywith Differentiated Good
In the Eaton-Kierzkowski model (see Sect. 9.3.4) we can show that the impositionof a tariff by country 2 on its imports of commodity B will improve country 2’swelfare. We have just seen that the price charged by country 1’s monopolisticproducer is at the limit of indifference for country 2’s consumers. It follows that,because of the tariff, this producer will have to reduce the export price to country 2

10.8 Imperfect Competition and Trade Policy 249
in such a way that the final price (export priceCtariff) to country 2’s consumers doesnot increase; otherwise there can be no export. The firm under consideration will bewilling to accept such a reduction insofar as its profits, though lower than before,are still greater than those that it would obtain giving up any export to country 2 andonly producing for its domestic market like in the pre-trade situation.
In such a situation the government of country 2, being aware of the strategicinteraction, may even calculate (and impose) a tariff that takes away from the foreignfirm all profits in excess of profits this firm earns by selling only to consumers incountry 1. In such a case this firm is indifferent between selling only in the domesticmarket or exporting as well.
Be it as it may, country 2 will be better off because—although there is no welfareincrease for the consumers, who pay the same price as before—there is the benefit ofthe increase in the fiscal revenue (the revenue of the tariff) of country 2’s governmentat no cost. This, again, is contrary to the traditional theory, according to which theimposition of a tariff does in general cause social costs. The difference in results isclearly due to the different market form assumed as well as to the particular natureof demand.
Box 10.3 Strategic Trade Policy: Boeing vs. Airbus
The aircraft sector provides a textbook example of governmental startegic trade policy,namely an industry in which trade policy could affect the strategic interaction between adomestic and an international rival: by subsidizing production, the government can affectthe outcome of the competitive game in such a way as to shift rents in favour of the domesticfirms as argued by Brander and Spencer (1985). In the commercial aerospace industrythe production has been directly and indirectly supported by using the market failureargument. The aerospace industry is surely subject to market failure, notably because oflarge scale economies in production and the importance of research and development. Giventhis industry’s market structure it is difficult for individual countries to face internationalcompetition, so aircraft industry has given rise to significant international cooperation.One of the most famous case of such cooperation is the European Airbus Consortium whichwas formed in the late 1960s to challenge the dominance of the Boeing Corporation ininternational world markets. The public support to Airbus has mostly taken the form of areduction in fixed development cost.Although not recent, the case of Boeing vs. Airbus contains useful background informationon the subsidy issue. Boeing has long been the leader in the world aviation industry andwhen Airbus was created the commercial aircraft was almost controlled by US firms. Airbusslowly but steadily expanded its market share during the first two decades of its existenceand with other competitors out of the picture (Lockheed and McDonnel Douglas) the battlefor market share in the 1990s and beyond is being waged directly at Boeing’s expense.Boeing and McDonnell Douglas accused Airbus to be state-supported with virtually unlim-ited (hence unfair) financial resources in the form of cheap loans, the repayment of whichwas contingent on Airbus’s profits. On the other side the Europeans argued that Americanaircraft manufactures received indirect government subsidies—from the Department ofDefense and NASA—of comparable magnitude. The battle over the appropriateness ofsubsidies raged for the first 22 years of Airbus’ presence. The US government lodged acomplaint against Airbus under the GATT and in 1992, an “Airbus Agreement” was signedbetween the United States and the European Community. This agreement contained threemain points:
250 10 Tariff and Non-tariff Barriers
– Direct government subsidies for aircraft were capped at 33 % of developments costs.Loans made to the consortium were to be repaid according to strict scheduling andinterest-rate requirements.
– Indirect subsidies were limited to 3 % of the turnover of civil aircraft manufacturers;– A bilateral panel would monitor compliance of the previous two points, and increase the
“transparency” of the commercial aircraft industry.
Strategic trade policy emphasizes its results in the presence of oligopoly: any externalintervention alters the strategic interaction between players on the market. If a domestic firmis a part of an international oligopoly and receives any kind of support from its government,it competes successfully. There seems to be little doubt that the Airbus project would notbe in a position of such prominence without government support.
References
Balassa, B. (1965). Tariff protection in industrial countries: An evaluation.Baldwin, Robert E. (1971). Non-tariff distortions of international trade.Bhagwati, J. N. (1965). On the equivalence of tariffs and quotas.Bhagwati, J. N. (1971). The generalized theory of distortions and welfare.Bhagwati, J. N., Panagariya, A., & Srinivasan, T. N. (1998). Lectures on international trade
(2nd ed., Pt. II).Caves, R. E. (1979). International cartels and monopolies in international trade.Chacholiades, M. (1978). International trade theory and policy (Pt. VII).Corden, W. M. (1971a). The theory of protection.Corden, W. M. (1974). Trade policy and economic welfare.Corden, W. M. (1984b) The normative theory of international trade.Deardoff, A., & Stern, R. M. (1984). The effects of the Tokyo round on the structure of protection.El-Agraa, A. M. (1984). Trade theory and policy.Greenaway, D. (1983). International trade policy: From tariffs to the new protectionism.Henderson, J. M., & Quandt, R. E. (1980). Microeconomic theory: A mathematical approach
(Sects. 3.7, 7.1–7.3, 11.7).Hicks, J. R. (1981). Wealth and welfare (pp. 100–132).Johnson, H. G. (1969). The standard theory of tariffs.Laird, S. & Yeats, A. (1990). Trends in non-tariff barriers of developed countries.Lerner, A. P. (1936). The symmetry between import and export taxes.Lloyd, P. J. (1974). A more general theory of price distortions in open economies.Markusen, J. R., Melvin, J. R., Kaempfer, W. H., & Maskus, K. E. (1995). International trade:
Theory and evidence (chaps. 15–16).McMillan, J. (1989). Game theory in international economics.Meade, J. E. (1952). A geometry of international trade (chap. VI).Meade, J. E. (1955). The theory of international economic policy (Vol. 2).Metzler, L. A. (1949). Tariffs, the terms of trade, and the distribution of national income.Morey, E. S. (1984). Confuser surplus.Pearce, I. F. (1970). International trade (Book I, chaps. 7 and 9).Razawi, H. (1984). An economic model of OPEC coalition.Stern, R. M. (1973). Tariffs and other measures of trade control: A survey of recent developments.Stolper, W. F. & Samuelson, P. A. (1941). Protection and real wage.Takacs, W. E. (1978). The nonequivalence of tariffs, import quotas, and voluntary export restraints.

References 251
Takayama, A. (1972). International trade: An approach to the theory (Pt. V).Vanek, J. (1962). International trade: Theory and economic policy (chaps. 16–18).Vousden, N. (1990). The economics of trade protection.WTO (1995). Trading into the future: WTO-The World Trade Organization.Yeats, A. J. (1974). Effective tariff protection in the United States, the European Economic
Community, and Japan.Yoo, J.-H. (1993). The political economy of protection structure in Korea.